Article

Effects of Coffee Bean Thermal Treatments on Particle Size Distribution and Espresso Bioactive Compounds

1
DAGRI, Department of Agriculture, Food, Environment and Forestry, University of Florence, Piazzale delle Cascine, 16, 50144 Firenze, Italy
2
Department of Neurofarba, Division of Pharmaceutical and Nutraceutical Sciences, University of Florence, Via Ugo Schiff, 6, 50137 Sesto Fiorentino, Italy
*
Author to whom correspondence should be addressed.
Appl. Sci. 2026, 16(10), 4886; https://doi.org/10.3390/app16104886
Submission received: 30 March 2026 / Revised: 11 May 2026 / Accepted: 12 May 2026 / Published: 14 May 2026

Abstract

(1) Background: Variations in bean temperature before grinding are a little-studied factor, but they can potentially influence the characteristics of the resulting powder and the chemical and physical properties of the espresso beverage. This study investigated the effect of two heat treatments, heating and cooling, applied to coffee beans immediately before grinding. (2) Methods: The analyses focused on powder particle size distribution (laser diffraction), impact on the operation of the coffee grinder (noise and electrical absorption), chemical-physical properties of the beverage, caffeine and chlorogenic acid content (HPLC-DAD) and profile of volatile organic compounds (HS-SPME-GC-MS). (3) Results: Heating induced a decrease in the content of caffeine and chlorogenic acids and a change in the aromatic profile consistent with phenomena like accelerated aging (increase in hexanal). Cooling treatment had similar, but less pronounced, effects, although it reduced caffeine extraction and some aromatic compounds. (4) Conclusions: The study demonstrated that the temperature of the coffee beans prior to grinding is a key factor to consider in terms of the particle size distribution of the resulting coffee grounds, as well as the content of bioactive compounds and volatile organic compounds, which can significantly influence various aspects of the final espresso’s quality.

1. Introduction

Roasted coffee bean is a complex organic matrix, making it difficult to explain how and why its behavior varies during grinding based on temperature. The temperature of the bean increases during roasting above its glass transition temperature (Tg), resulting in a rubbery structure. Combined with the increase in internal pressure within the bean, the heating process causes its volumetric expansion. As the beans cool, the temperature drops below the Tg, making them brittle and easy to grind, characterized by a porous structure with large surface areas [1]. In crystalline materials, decreasing temperature results in a faster rate of fragmentation, resulting in a greater formation of fine particles. The complex structure of the coffee bean makes it unlikely that the glass transition or fragmentation points will be constant across the macroscopic regions of the bean.
Grinding coffee beans reduces particle size and allows for better extraction of the components present in the roasted bean. This involves applying mechanical forces, which transform roasted coffee into ground coffee powder. The small particles formed have a porous structure and consequently a large contact surface between solute and solvent, allowing the soluble substances in the bean to dissolve [2]. The product obtained at the end of the milling process is a powder whose size is described by a profile, the particle size curve, which is often represented by a bimodal distribution. Particle diameters can vary from a few micrometers to 1000 μm [3].
During grinding, coffee beans will tend to reach the temperature of the grinder components, so only a portion of the final particles are produced by the bean’s fragmentation at the set temperature. Furthermore, the literature shows that such transitions, if present, are reversible [4].
The stage following grinding, extraction, can be carried out in various ways. In general, coffee preparation consists of a solid–liquid extraction process comprising three stages: (1) imbibition of the ground coffee; (2) transfer of soluble solids from the ground coffee to the water; (3) separation of the liquid extract from the spent solid residue. This extraction process is in turn regulated by several variables that can affect the quality of the coffee in the cup, including the size of the coffee powder particles [5]. Different coffee brewing methods (e.g., espresso, French press, and other filter methods) require a specific particle size distribution, as reported in several extraction studies [6,7,8].
Espresso is one of the most widely consumed beverages in the world, particularly in Southern Europe and Central America [9]. A typical definition of espresso is a concentrated polyphasic beverage with a characteristic layer of foam (crema) on the surface, prepared by passing hot water (90 ± 5 °C) under pressure (9 ± 2 bar) through a cake of coffee powder for a short period of time (30 ± 5 s), assuming an optimal flow rate of about 1 mL s−1 [10].
Initially, the flow rate is low due to the coffee cake’s resistance to the water flow, but it increases as extraction progresses. The particle size of ground coffee is fundamental because it influences the flow rate, which in turn affects the contact time between water and coffee, thereby modifying the overall extraction kinetics [11]. Furthermore, several studies have shown that the grinding process not only affects the bean size of the coffee powder and, consequently, the flow rate, but also the chemical composition and sensory properties of the beverage [12]. For the same extraction time, a beverage produced with a higher proportion of fine particles will exhibit a slower flow rate and, therefore, a lower final volume than a beverage prepared from a powder containing a greater proportion of coarse particles [4,13].
The final composition of espresso coffee is characterized by its content of bioactive compounds, such as caffeine and chlorogenic acids (CGAs), and by its aromatic component, which depends on the concentration of volatile aromatic compounds (VOCs) present in the beverage. Caffeine is an alkaloid with stimulating effects on the central nervous system [14]. CGAs are hydroxycinnamic esters of caffeic acid and are the main antioxidants in coffee [15]. Regarding the aromatic compounds, over 1000 VOCs belonging to various chemical classes, such as alcohols, aldehydes, esters, furans, ketones, phenols, pyrazines, pyridines, pyrroles, and sulfur compounds, have been identified in roasted coffee [16]. Grinding roasted beans is a fundamental step in releasing volatile compounds during coffee preparation. When the cells are broken down during grinding, an additional surface area is created that increases contact with the extraction water, facilitating the solubilization of the coffee compounds. At the same time, crushing disrupts the cell structure, releasing the pyrolytic gases formed during roasting, mainly CO2 and volatile compounds, and facilitating the extraction of the remaining aromatic compounds [2].
Despite the extensive literature on roasting conditions, grinding parameters, and extraction variables, the temperature of coffee beans immediately prior to grinding has received limited attention. Roasted coffee beans are porous, viscoelastic materials whose mechanical behavior is strongly temperature-dependent [4]. Variations in bean temperature may influence fracture mechanisms during grinding, particle size distribution, and powder permeability, ultimately affecting espresso extraction kinetics. In addition, short-term thermal exposure before grinding may promote degassing and oxidative phenomena, potentially altering the availability of bioactive and volatile compounds at the moment of extraction.
Understanding the factors influencing espresso extraction is of great importance for both scientific and industrial applications. While parameters such as grinding size and extraction pressure have been extensively studied, the role of coffee bean temperature prior to grinding remains poorly explored. Investigating this aspect may provide new insights into particle formation, extraction dynamics, and beverage composition, with potential implications for process optimization, product consistency, and sustainability in the coffee industry.
The objective of this study is to investigate whether short-term variations in coffee bean temperature immediately prior to grinding can modify grinding behavior, extraction dynamics, and the chemical–physical composition of espresso coffee.

2. Materials and Methods

2.1. Raw Materials Used, Heat Treatments Applied, and Sample Preparation

Samples were made using the same batch of coffee (Illy Rosso 100% Arabica). Each pack of coffee beans (250 g) was opened immediately before use to avoid any oxidative damage. This product is made from a 100% Arabica blend from multiple origins, with a medium roast.

2.1.1. Thermal Treatment

Heating and cooling temperatures were selected to induce marked but short-term thermal stresses on coffee beans while avoiding additional roasting or freezing-related structural damage. The temperatures used in the thermal treatments were selected to evaluate a wide range of potential effects, as few studies have examined the impact of coffee bean temperature prior to grinding. Only the treatment set temperature and the final bean temperature after treatment were experimentally measured. Detailed thermal profiles of the beans during heating/cooling were not monitored in the present study.
Controlled heating heat treatment applied to the coffee beans was carried out with an oven (Heraeus UT 6, Thermo Electron Corporation, Waltham, MA, USA) through the following operating conditions: lying beans, temperature 105 °C for 30 min. The temperature of the beans at the end of the process was 86.6 °C.
Controlled cooling was applied to the coffee beans using a professional blast chiller with a grid (MULTIFRESH®: MF 25.1, IRONIX, S.p.A., Conegliano (TV), Italy). Treatment exposed the beans to −34 °C for a duration of 30 min. The temperature of the beans at the end of the process was −16.95 °C.

2.1.2. Espresso Coffee Preparation

The grinding phase was carried out with a professional coffee grinder (E65S, Mahlkönig, Hamburg, Germany).
A conventional bar machine (GS3, LaMarzocco, Scarperia, Florence, Italy) was used. Operating parameters of the machine that did not vary during the tests were water temperature 92 °C, water pressure 9 bar and 30 s of percolation time, assuming an optimal flow rate of about 1 mL s−1 [10].
All coffees were made with the same batch of mineral water (Acqua Panna, Sanpellegrino S.p.A., Scarperia, Florence, Italy).

2.1.3. Samples Ground to the Same Degree as the Control

The first set of coffee beans to be ground was the control sample, designated C. The optimal grind setting for a flow rate of approximately 1 mL/s is 2.7, a value that corresponds to the grind setting on the coffee grinder used (Mahlkönig E65S) and indicates the distance between the burrs. Subsequently, the cooled and heated beans were subjected to the same grind setting and coded ColdC and WarmC, respectively, as shown in Table 1.

2.1.4. Samples Ground to a Degree of Grinding That Yields a Flow Rate of Approximately 1 mL s−1

Based on preliminary flow rate measurements, specific grinder settings were identified for each sample to obtain a target espresso flow rate of approximately 1 mL s−1. The resulting grind settings, used to prepare the samples analyzed in this study, are reported in Table 2. For both samples, it was necessary to adjust the grind setting by reducing the gap between the coffee grinder’s burrs.

2.2. Analyses

2.2.1. Analyses on the Grinder

TP-Link Tapo P115 (TP-Link Technologies Co., Ltd., Düsseldorf, Germany) was used as a Wi-Fi smart plug to monitor the energy consumption of connected devices. The P115 was configured via the dedicated Tapo mobile app, operating on a 2.4 GHz Wi-Fi network, without the need for external hubs. Once installed between the electrical grid and the device under test, the smart plug automatically recorded consumption data, making it accessible in digital format through the app interface. Measurements were taken under standardized operating conditions, maintaining a constant electrical load throughout the tests. The device was primarily used to quantify energy consumption and to conduct a comparative analysis of energy efficiency across different experimental scenarios.
Sound pressure levels were measured using the NIOSH Sound Level Meter mobile app (National Institute for Occupational Safety and Health, Cincinnati, OH, USA) installed on an iOS device. The app uses the smartphone’s built-in microphone to capture ambient sound and convert it into sound pressure levels expressed in decibels (dB). Measurements were conducted under controlled environmental conditions, keeping the device’s position relative to the sound source constant and minimizing external interference. The app was used to assess noise exposure and to compare different experimental conditions, providing a quantitative estimate of sound intensity in accordance with standard practices in industrial hygiene and applied acoustics.

2.2.2. Analyses of Whole and Ground Coffee Beans

The PCE RGB-1002 (PCE Instruments, Meschede, Germany) was used as a portable colorimeter for the objective characterization of the color of the analyzed samples. The instrument operates by directing controlled illumination onto the sample surface and capturing the reflected radiation using an internal photoelectric sensor. The optical signal is converted into numerical color coordinates according to standardized models, typically in the RGB (Red, Green, Blue) color space. Measurements were performed by placing the instrument in near-direct contact with the coffee beans and coffee grounds, ensuring constant measurement conditions and minimizing interference from ambient light.
Particle size distribution (bimodal profile) was measured with a dry dispersion instrument (Mastersizer 3000, Malvern Panalytical Ltd., Malvern, Worcestershire, UK), which uses laser diffraction to measure particle size (0.01 to 3500 µm). The instrument operates with a continuous flow of air, generated by an industrial compressor at 6.5 bar, which enters the dry dispersion units and transfers the particles to the laser diffraction unit at a pressure of 2–3 bar. This causes the particles to move in a laminar flow, and the vacuum extraction unit removes the samples [17].

2.2.3. Analyses of the Beverage

The mass of espresso coffee dispensed by the machine over 30 s was measured using a digital scale (Proster, Kitchen Scale PST021 PST051). The espresso was collected directly into a calibrated container and then weighed to determine the total mass of the extracted liquid. The measurements were taken immediately after extraction to minimize variations caused by evaporation or liquid loss. The corresponding beverage flow rate was calculated assuming a density of approximately 1 g mL−1.
The height of the foam was measured 30 s after the beverage was prepared using a ruler graduated in millimeters (mm). The measurement was taken by placing the ruler vertically along the edge of the container, using the distance between the liquid surface and the highest point reached by the foam as a reference. This procedure was adopted to ensure reproducible measurement conditions and reduce variability due to the temporal decay of the foam. The values obtained were recorded in millimeters.
The pH of the espresso was measured using a portable pH meter from the HD 2105 series (Delta OHM/Senseca, Caselle di Selvazzano Dentro (PD), Italy) equipped with a pH electrode. The instrument was calibrated prior to analysis using standard buffer solutions at pH 4.01 and 7.00, following the manufacturer’s instructions. Measurements were taken on samples that had been allowed to cool to room temperature prior to analysis. The electrode was immersed directly into the sample, avoiding prolonged contact with the surface foam, and the reading was recorded once the signal had stabilized.
Total dissolved solids (TDS) were determined using a refractometer (VST LAB Coffee Refractometer, VST, Inc., Sunnyvale, CA, USA).

2.2.4. Analysis of Caffeine and Chlorogenic Acid

HPLC-DAD analyses were performed to evaluate CGAs and caffeine content. Coffee samples were diluted 1:10 with water and centrifuged at 12,000 rpm for 5 min and then subjected to analyses. The chromatographic analyses were conducted using an HP 1260 Infinity II liquid chromatograph equipped with a DAD detector. A Poroshell 120 EC-C18 column (150 mm × 3.0 mm i.d., 2.7 μm particle size; Agilent Technologies, Santa Clara, California, United States) was used for chromatographic separation. The analysis conditions were the same as those reported in our previous works. The elution was performed at a flow rate of 0.4 mL/min using water acidified to pH 3.2 with formic acid (solvent A) and acetonitrile (solvent B), applying a multistep linear gradient (from 95% to 10% A over 24 min). UV–vis spectra were recorded in the range 220–600 nm, and chromatograms were acquired at 330 nm for CGAs and 278 nm for caffeine. All solvents used were Chromasolv for HPLC grade (Sigma Aldrich S.R.L., Milano, Italy). Caffeine and CGAs were identified by comparing their retention times and UV-vis spectra with those of the respective standard, where possible, or with published data. CGAs were evaluated by HPLC-DAD at 330 nm using a five-point calibration curve of 5-O-caffeoylquinic acid (Extrasynthèse, Z.I. Lyon Nord, Impasse Jacquard, 69730 Genay, France; purity 99%) in the range 0–0.892 μg (r2 = 0.9988), corresponding to a standard solution concentration of 0.0892 mg/mL. The total CGA content was calculated as the sum of the individual identified peaks. Caffeine content was determined at 278 nm using a six-point calibration curve (0–2.870 μg; r2 = 0.9988) prepared from a caffeine standard (Extrasynthèse; purity 95%) at concentrations of 0.287 and 0.0287 mg/mL. Quantitative data for bioactive compounds were expressed as concentrations (mg/mL of beverage).

2.2.5. Volatile Compound Determination

Concentration of VOCs was determined using HS-SPME-GC-MS. An Agilent 7820 gas chromatograph equipped with an MSD 5977 electron ionization detector (Agilent, Santa Clara, CA, USA) was used for the determination. For headspace sampling, a 50/30 μm–2 cm DVB/CAR/PDMS fiber (Supelco, Sigma, Darmstadt, Germany, A 50/30 μm–2 cm DVB/CAR/PDMS fiber (Supelco, Sigma, Darmstadt, Germany) was used for headspace sampling. The system was equipped with a Gerstel MPS2 XT autosampler (Gerstel GmbH & Co. KG, Mülheim an der Ruhr, Germany) for SPME analyses. Analyses were performed by pipetting 5 mL of each sample, 50 μL of an internal standard mixture (ISTD MIX), and 2 g of sodium chloride into 20 mL screw-cap vials equipped with PTFE/silicone septa. ISTD MIX contained: ethyl acetate d5; 2 butanol d10; 4 o-xylene d10; 3 ethyl caproate d11; 5 methylhexanol; 7 naphthalene d8; 6 acetic acid d3; 8 dimethylphenol. VOCs were determined by comparing retention times and mass spectra with those of the standard added for calibration. To create the calibration curves, a standard solution containing the 21 selected analytes was prepared. Each compound was diluted in a 50/50 water/acetone solution to a concentration of 10.000 mg/L (1:100 dilution); parts of this solution were added to a 50 mL calibrated flask and brought to volume with distilled water to obtain the maximum concentration level on the calibration scale. All other calibration levels were obtained by diluting (2, 4, 8, 16, and 32 times) this STD MIX solution. Finally, 5 mL of each calibration level was pipetted into 20 mL headspace vials and analyzed [12].

2.3. Data Analyses

One-way analysis of variance (ANOVA) was applied to compare the different samples, as it allows the assessment of statistically significant differences among multiple groups. The means were considered significantly different at p < 0.05. Tukey’s post hoc test (HSD) was applied to evaluate pairwise differences between mean values while controlling for multiple comparisons, where appropriate. All analyses were performed on n = 3 independent experiments, each measured with five replicates. Statistical analyses were conducted using R software (R Foundation for Statistical Computing, Vienna, Austria) and XLSTAT (Addinsoft, Paris, France).

3. Results

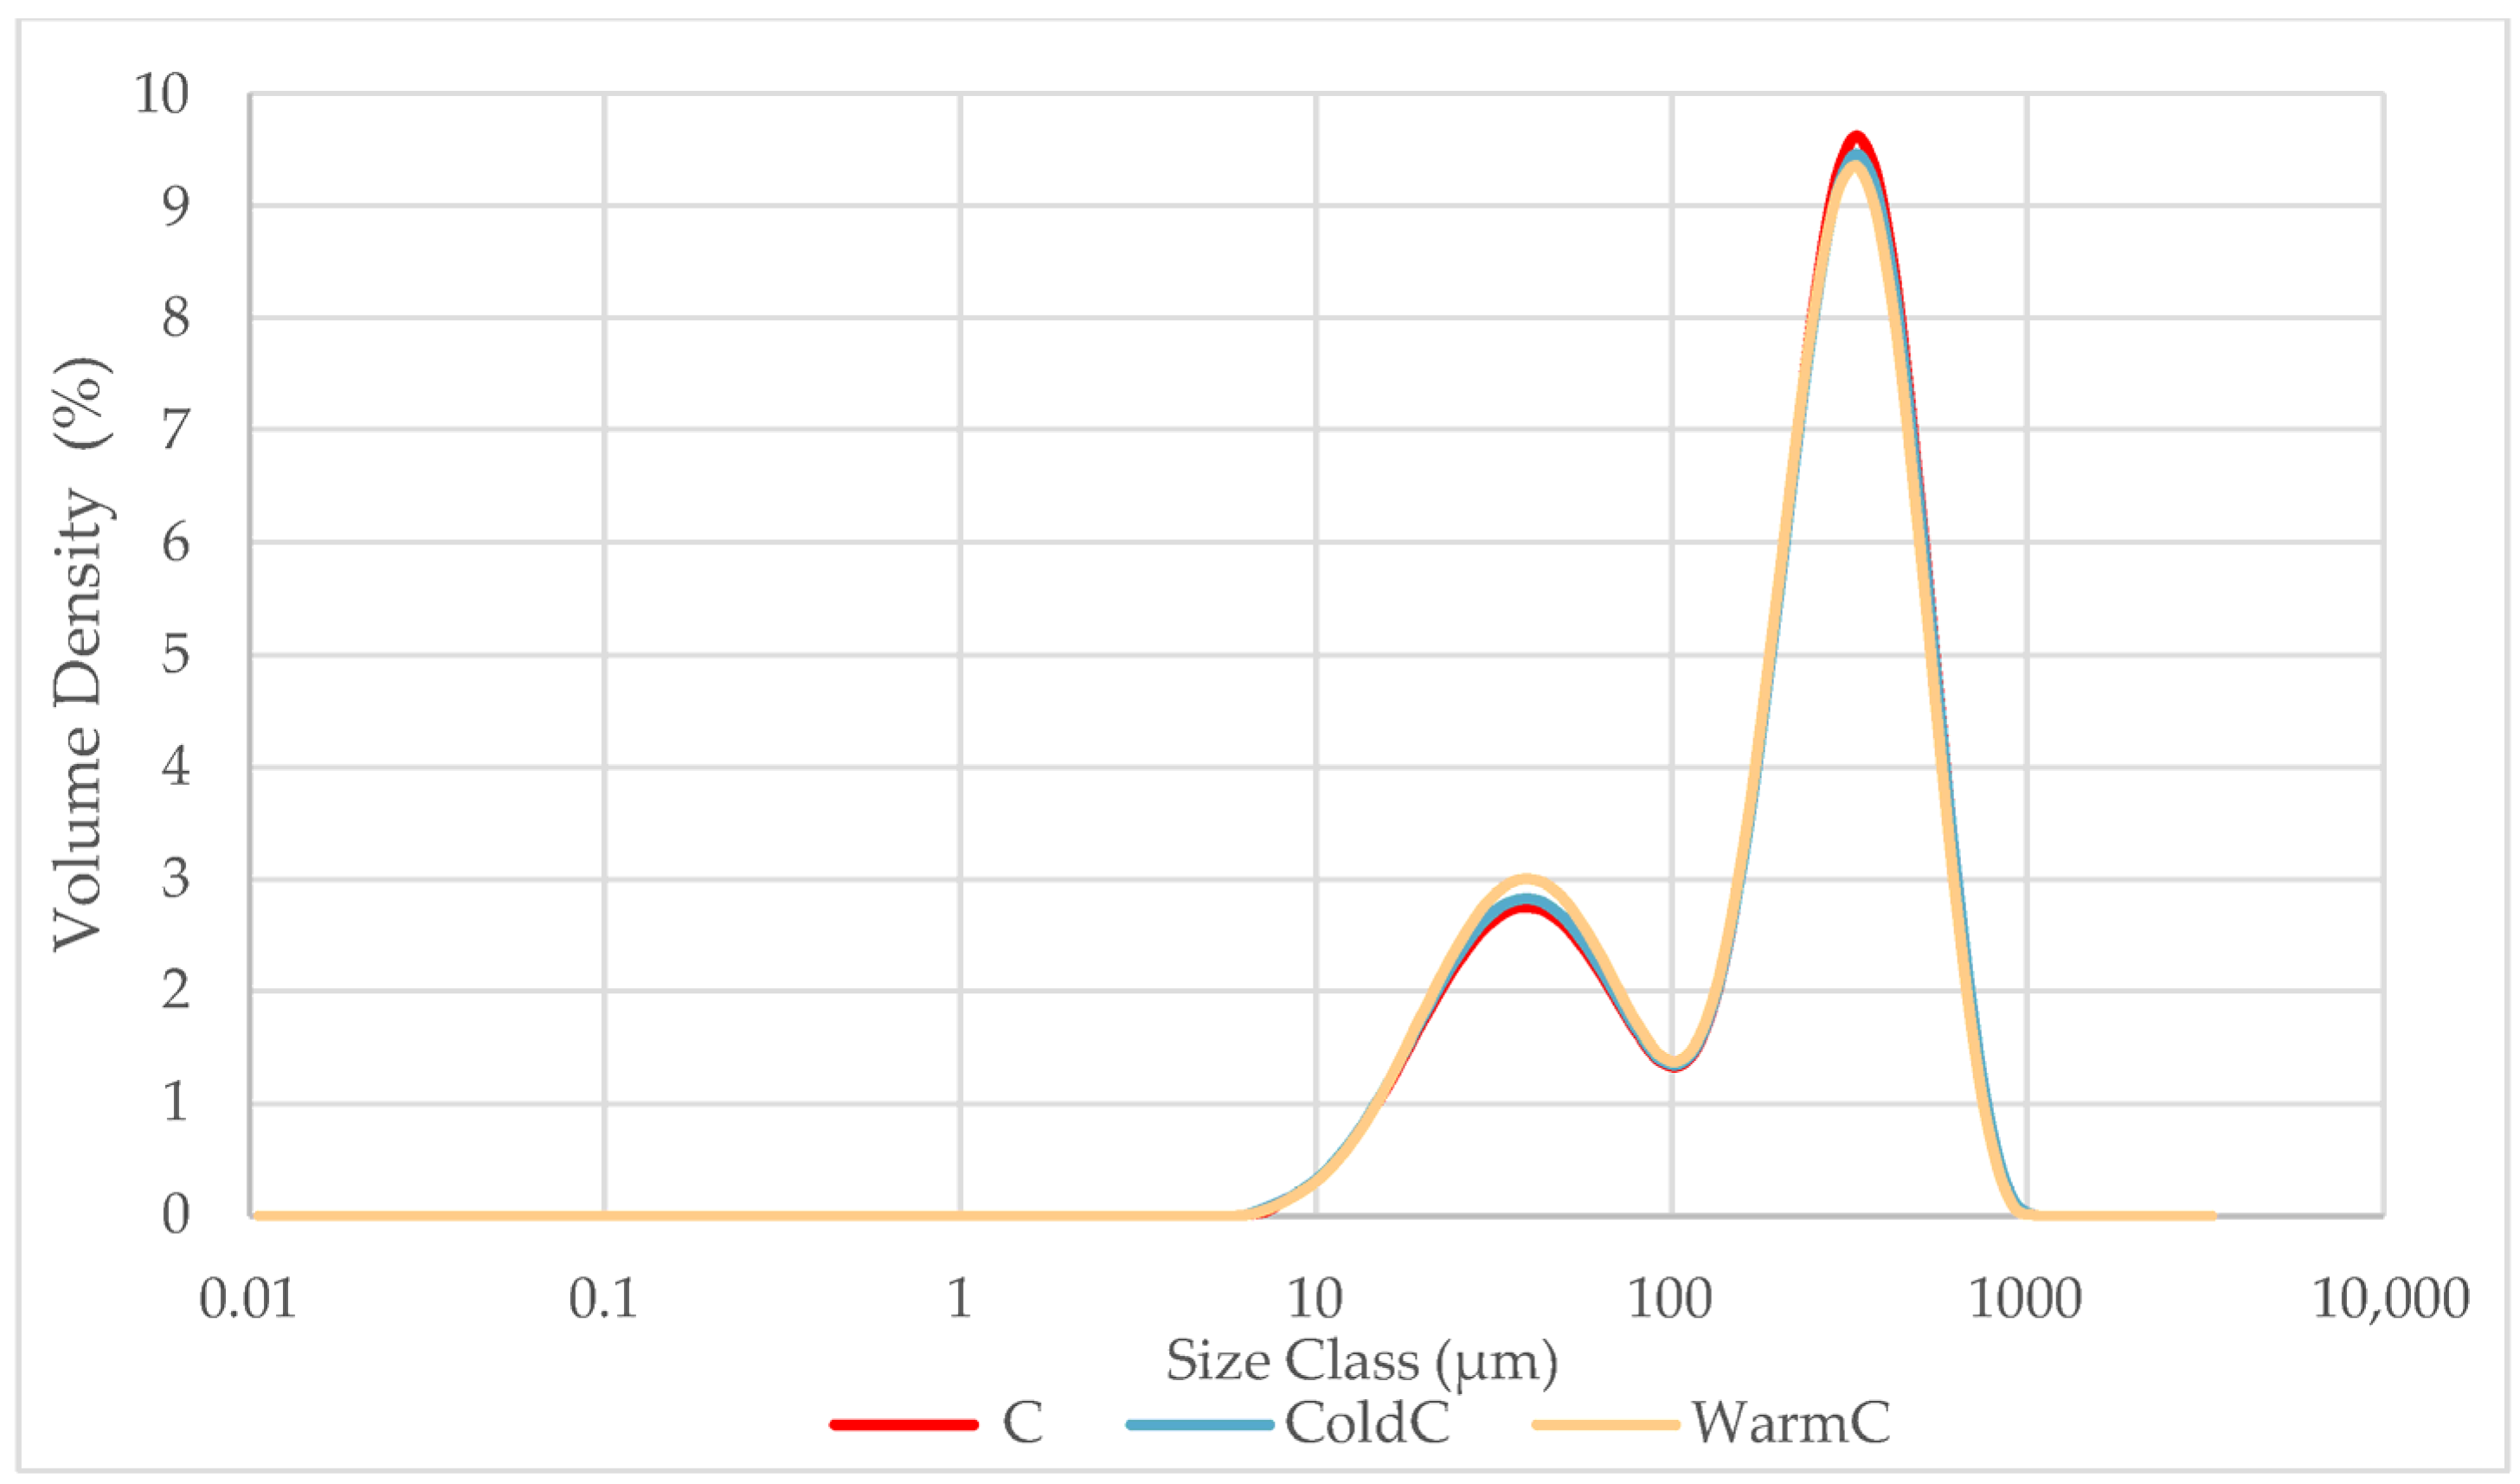
The grinding of heat-treated coffee beans at the same grind setting as the control sample resulted in different extraction behaviors. Figure 1 shows the particle size distributions of the C, ColdC, and WarmC samples, which exhibited comparable bimodal profiles with no substantial differences in overall particle size distribution. Despite this apparent similarity in granulometric profiles, the samples displayed markedly different extraction flow rates. As shown in Table 3, ColdC and WarmC exhibited significantly higher flow rates compared to C when ground at the same setting. This behavior can be explained by the fact that, at that grind size, the varying temperatures of the beans prevented the grind from achieving a particle size suitable for percolation similar to that of a standard espresso. Both heat treatments may have affected the permeability of the coffee bed, causing it to decrease and resulting in an increase in flow rate [18]. However, a limitation of the present study is that only the applied treatment temperature and the final bean temperature after treatment were measured, whereas the complete thermal profile of the beans during heating and cooling was not monitored. Therefore, the exact thermal history experienced by the beans and its contribution to the observed extraction behaviors could not be fully characterized.
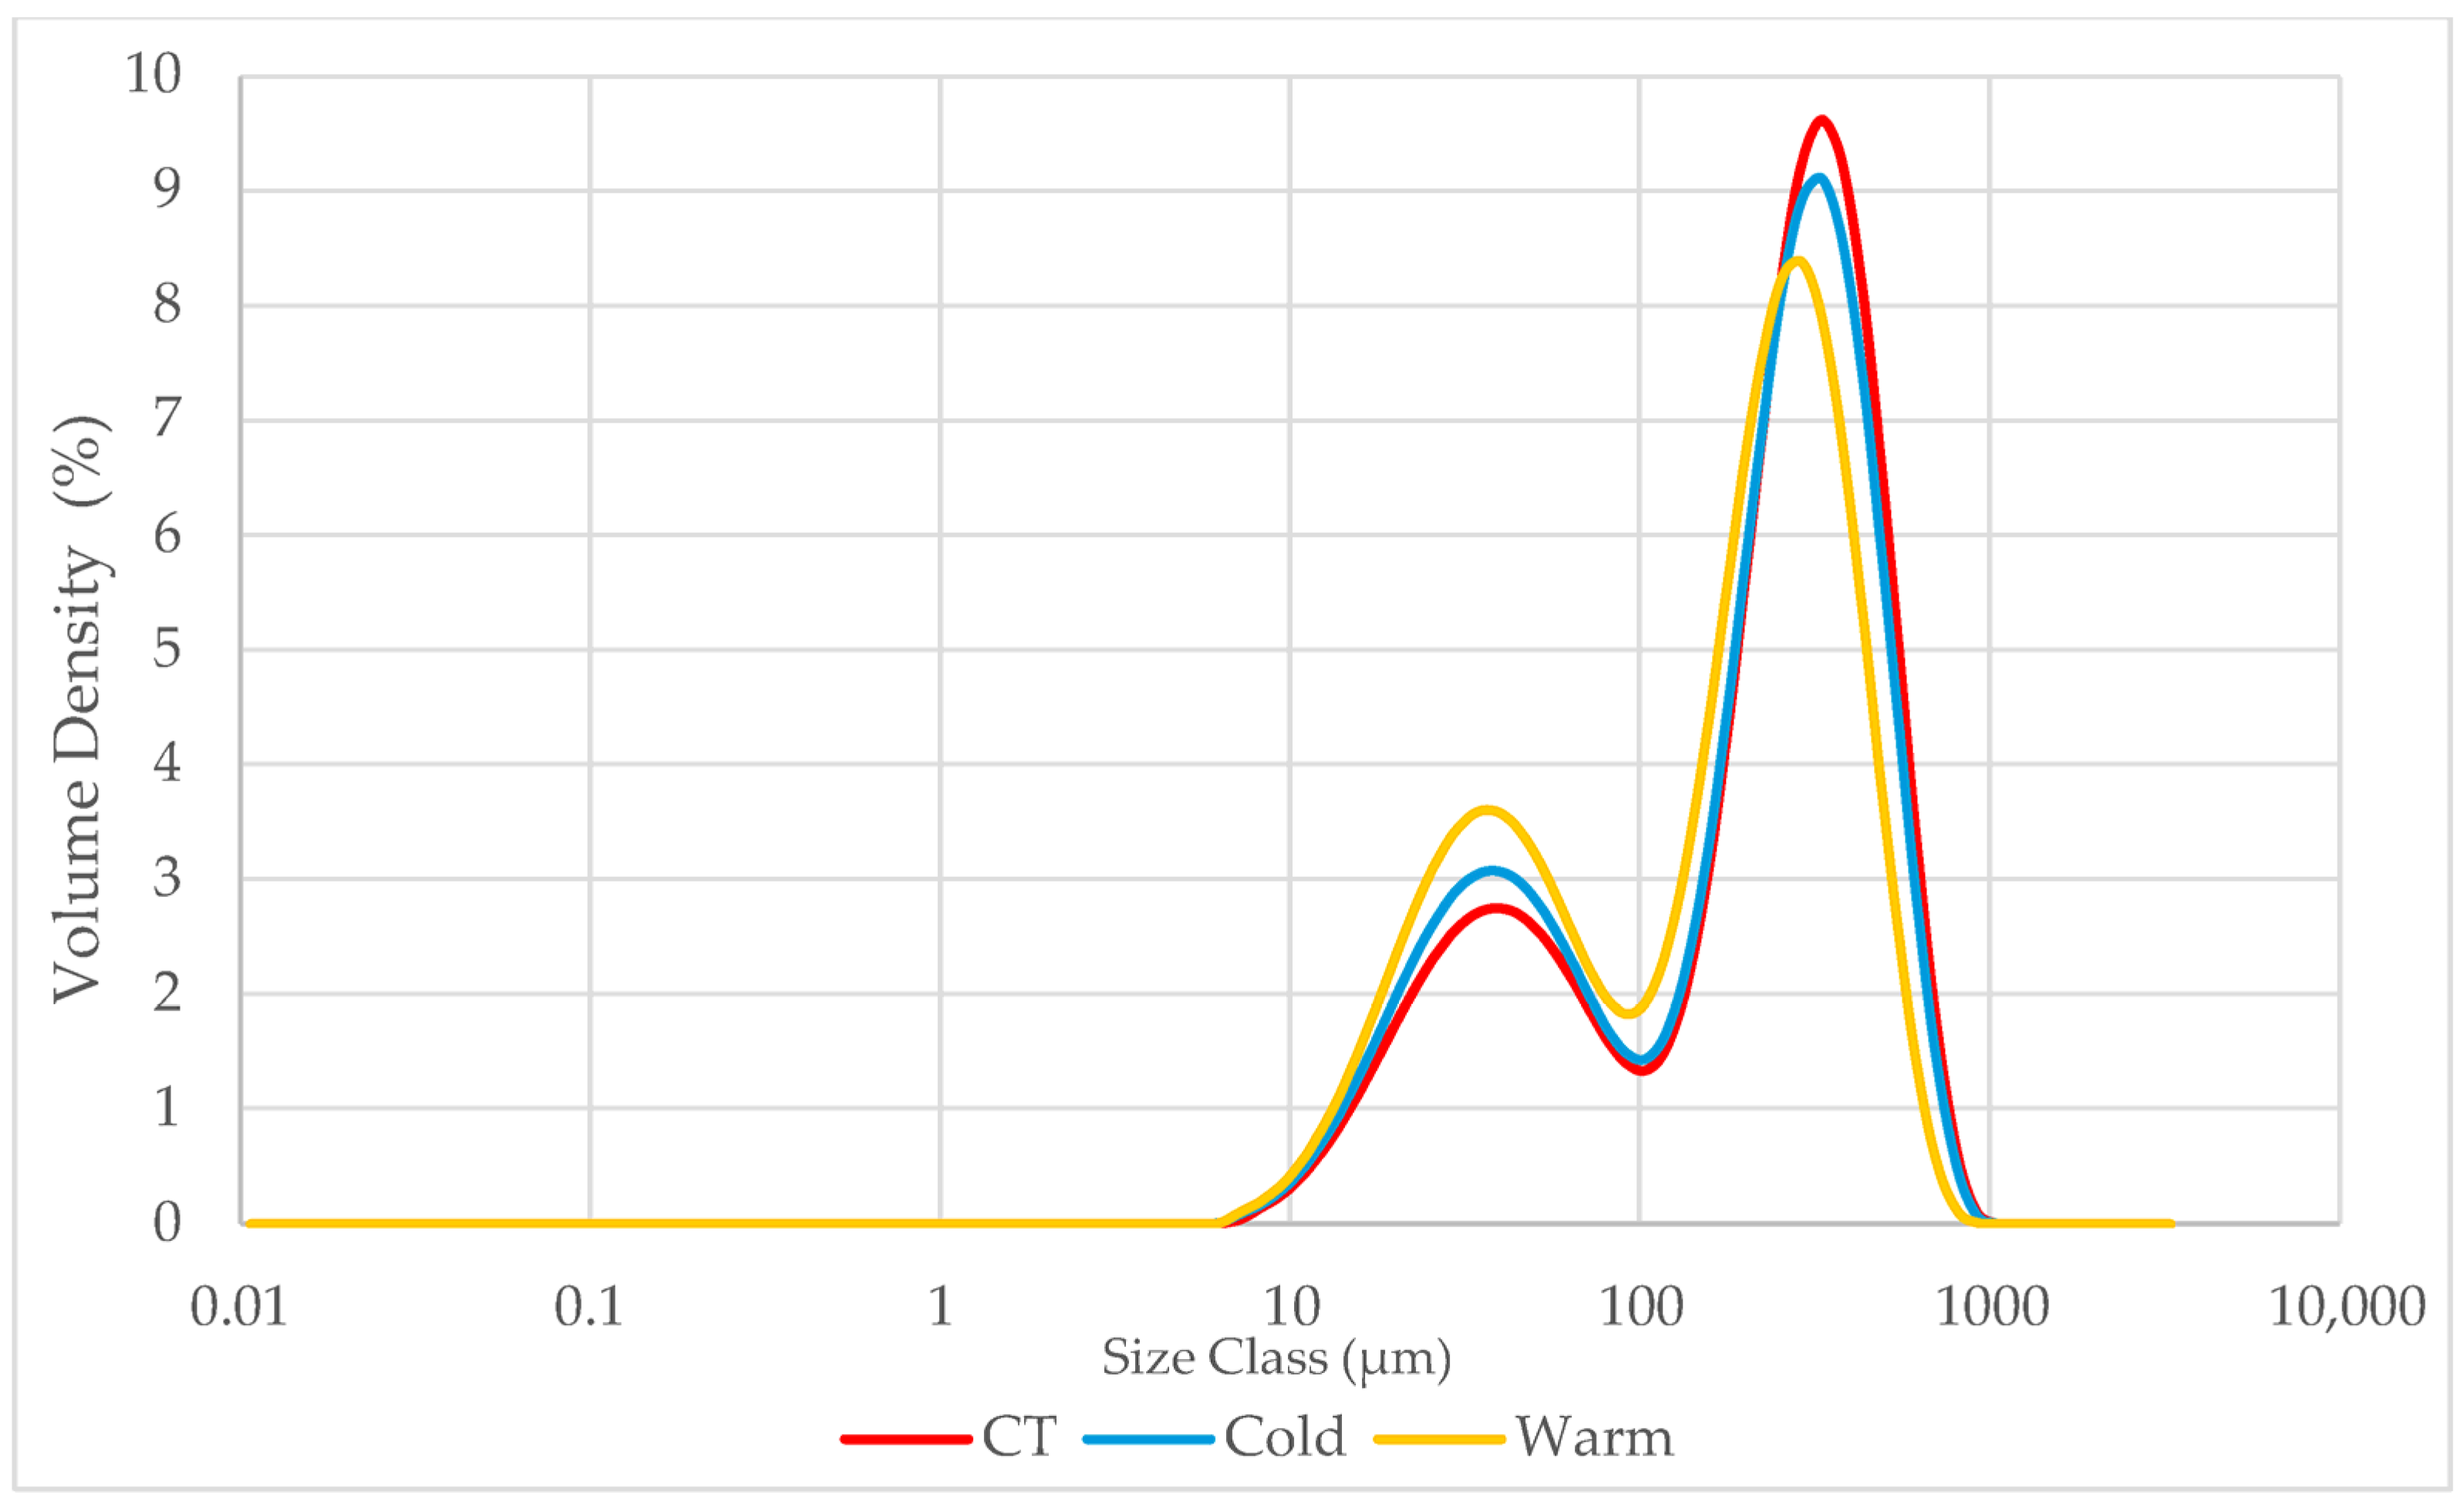
Given that an espresso beverage is defined by a target flow rate of approximately 1 mL s−1, the results presented in the following sections refer exclusively to the set of samples consisting of C and heat-treated beans ground to specific settings to achieve the standard espresso flow rate. To obtain samples with comparable flow rates consistent with typical espresso extraction, specific grinder settings were identified for each sample in order to achieve a target flow rate of approximately 1 mL s−1. Cold (1.06 ± 0.08 mL s−1) had a limited reduction in grind size. Warm (0.97 ± 0.07 mL s−1) required a significant reduction in grind size to obtain a flow rate like a standard espresso. The particle size distribution of these three samples (Figure 2) showed marked differences in the dimensional profiles of the coffee powders obtained from the three samples. All samples show the typical bimodal curve. characterized by a first lower peak with finer particles and a second more abundant peak with larger particles. The Warm sample had the most abundant first peak, while the second peak is less intense and left-shifted compared to C and Cold. In contrast, dimensional profiles of C and Cold were more similar to each other.
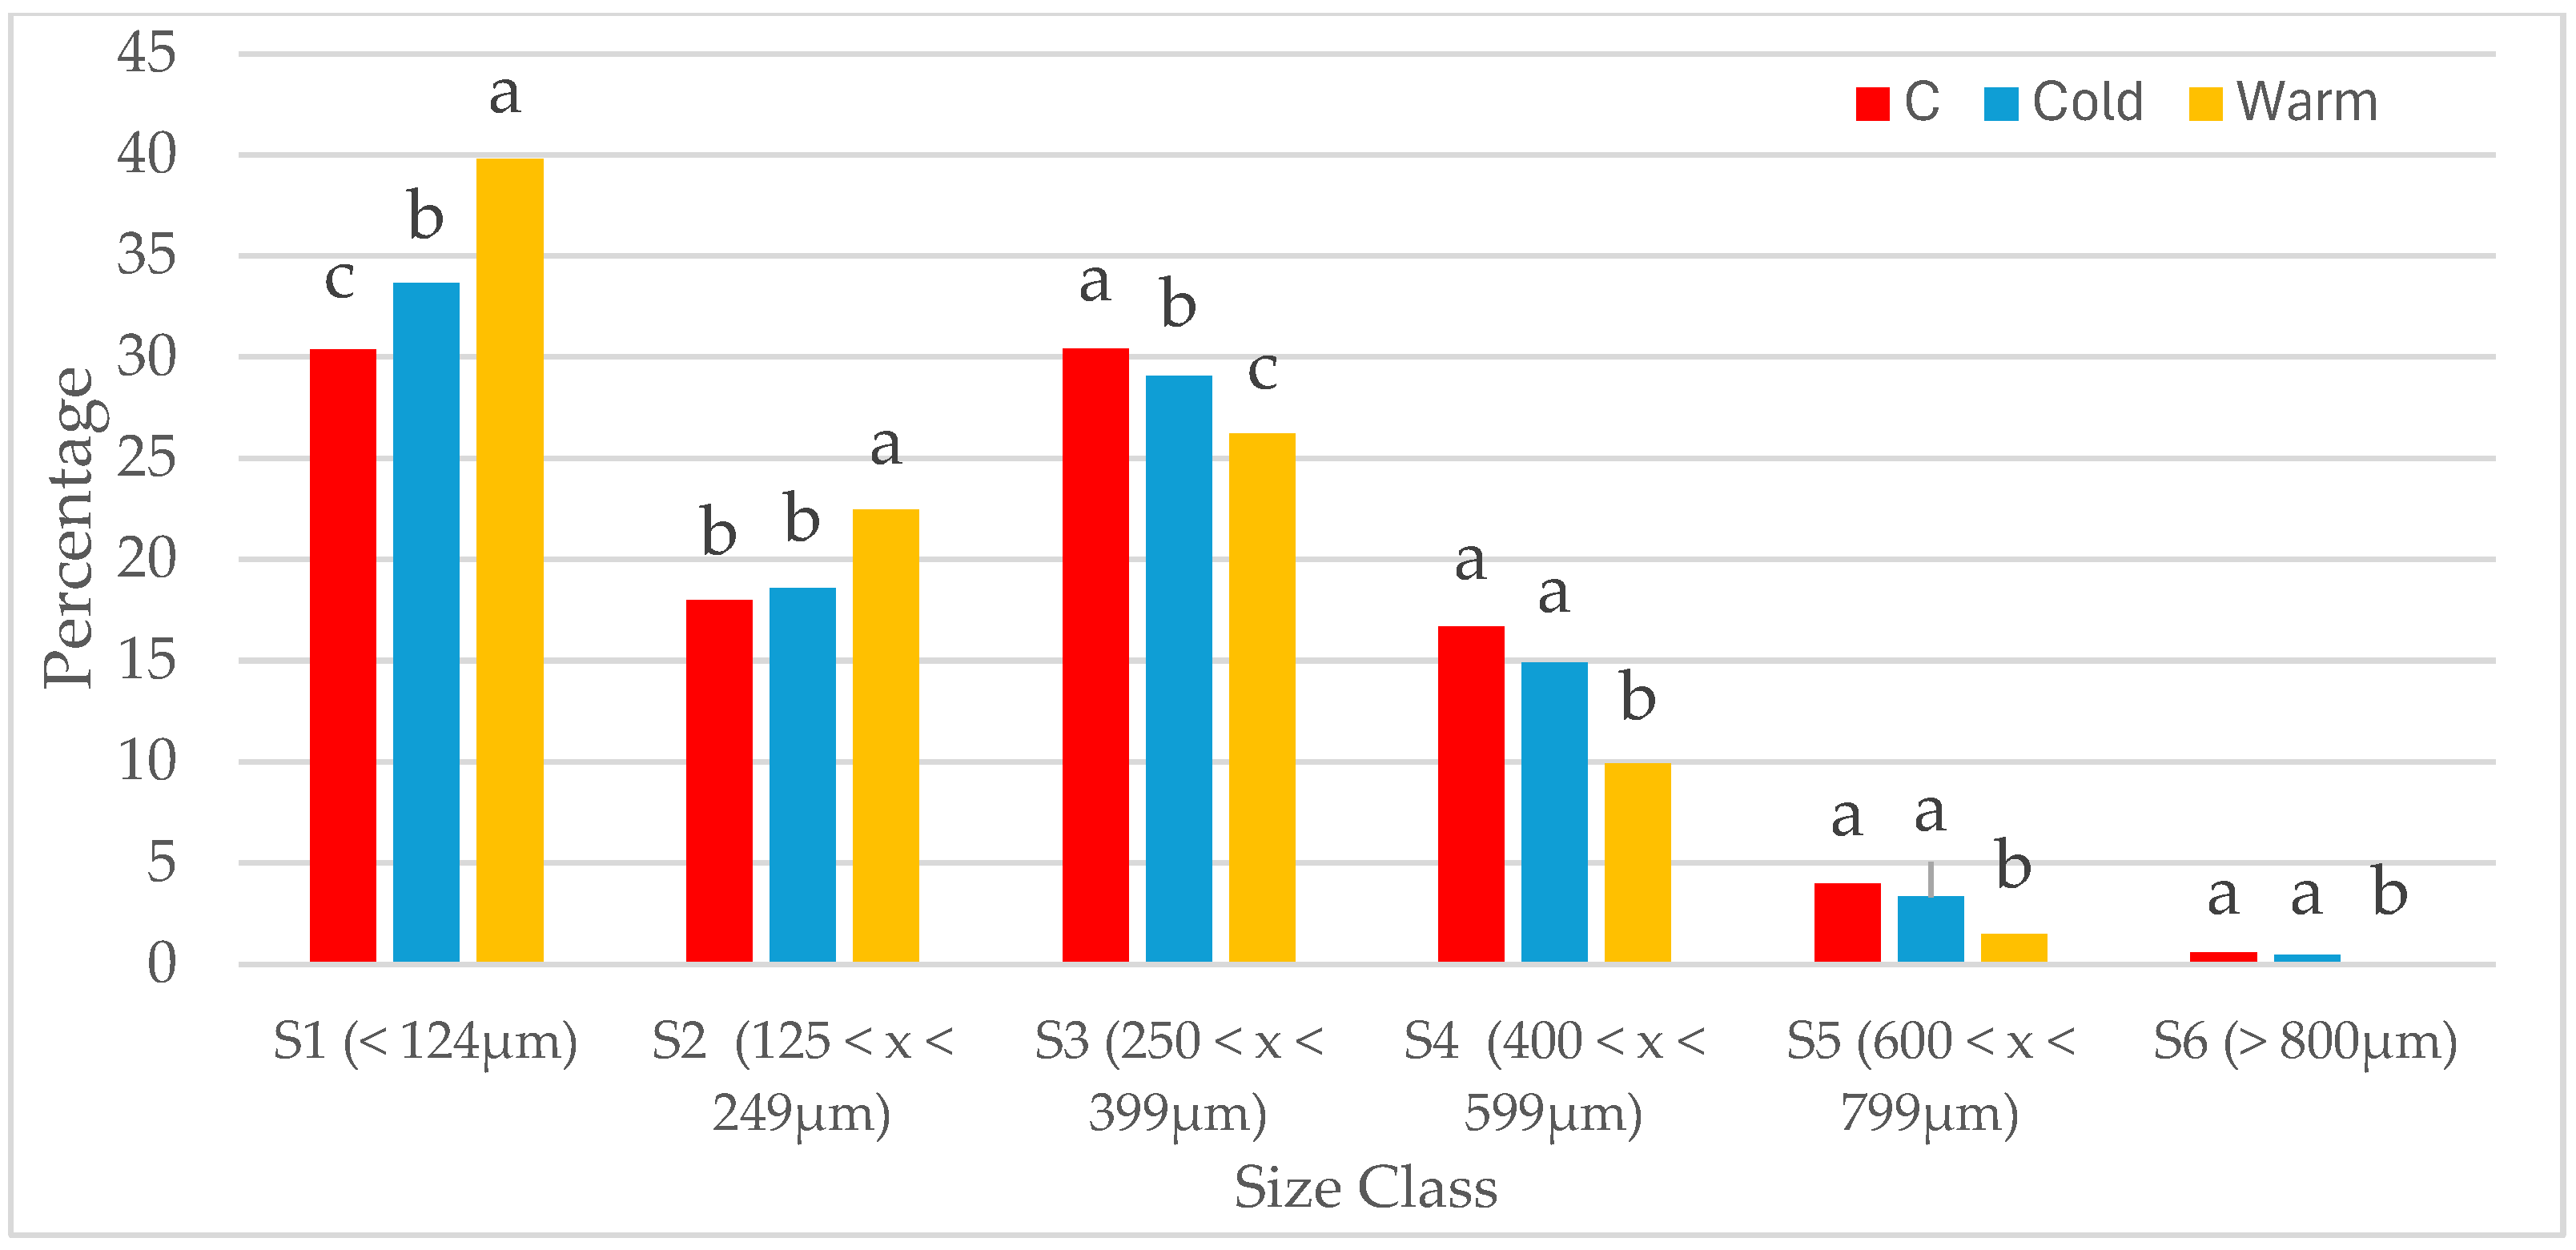
Figure 3 shows the quantitative abundance of each coffee powder within the six particle distribution classes, divided as follows: S1 < 124 µm; S2 125 < x < 259 µm; S3 250 < x < 399 µm; S4 400 < x < 599 µm; S5 600 < x < 799 µm; S6 > 800 µm. The Warm sample exhibited a significantly higher proportion of fine particles (S1) compared to both C and Cold samples. This marked abundance of fine particles is balanced by a significantly lower proportion of particles in the intermediate and coarse particle size classes, particularly in S3 and S4. In contrast, C and Cold samples showed more balanced distributions across the intermediate size ranges.
The results of the colorimetric analyses (Table 4) performed on coffee beans and coffee powder showed a significant difference in RGB values were observed in the Cold sample at the bean level, with all three color indices differing from those of the control sample (C). In contrast, the Warm sample differed from C only in terms of red color values, while no significant differences were observed for the blue and green indices. No differences emerged between the samples in the colorimetric analysis of the coffee powders. The colorimetric analysis results reported in this study are slightly lower than those reported in other studies that evaluated the color of powders produced at various roasting levels [19].
Table 5 shows the operational parameters of the coffee grinder measured during sample preparation and the results of the chemical and physical analyses performed on the espresso beverages. No significant differences in electrical absorption were found, while a higher noise level of the coffee grinder was recorded in the Cold sample. Significant differences among samples were observed for several parameters. Foam height differed significantly among samples, with C exhibiting higher values compared to both Cold and Warm samples. The height of the crema in the three samples, especially for C and Cold, is greater than the 2–3 mm typically found in an espresso [20]. No significant differences were observed in total dissolved solids (TDS), indicating comparable extraction yields among all samples. The TDS values observed are consistent with those reported in previous studies. In contrast, the C sample showed significantly higher pH values compared to both Cold and Warm samples. However, the values recorded fall within the typical pH range for espresso coffees. The results of the analyses of bioactive compound content indicated that C is the sample with the highest content of caffeine and CGAs. The C sample showed a significantly higher caffeine content compared to both heat-treated samples. A similar trend was observed for CGAs, with C exhibiting significantly higher values than the Cold sample, while the Warm sample showed intermediate values. The caffeine content in the three samples is comparable to the average caffeine content of a standard espresso [10]; however, the CGA content is higher than what is reported in the literature [21].
The results of VOC analysis are reported in Table 6. A total of 21 compounds belonging to the classes of chemical compounds of furans, aldehydes, ketones, pyrazines, pyrroles, and sulfur-containing compounds were identified. Among the quantified compounds, six showed statistically significant differences among samples. The Warm sample had a significantly lower content of the compound 2-butanone; however, for all three samples, their content is below the odor threshold of 50 mg/kg [22]. Furan, 2,5-dimethyl- had a significantly lower content in C, while it was more abundant in the Warm sample [19]. Hexanal is an aldehyde found in greater quantities in the Warm sample. Aldehydes, including hexanal, increase during coffee storage, and the stale notes that develop are linked to the formation of hexanal during storage [23]. The Warm treatment therefore has an effect on coffee beans comparable to accelerated aging. 1H-Pyrrole, 1-methyl- has woody, green, and smoky notes [24] and is quantitatively more abundant in the C sample. The same trend was also seen for furfuryl methyl sulfide, a key compound in coffee [21]. There is no value for the odor threshold in coffee in the literature, but it is reported that in water, it has a very low value of approximately 5 × 10⁻⁶ mg/kg.
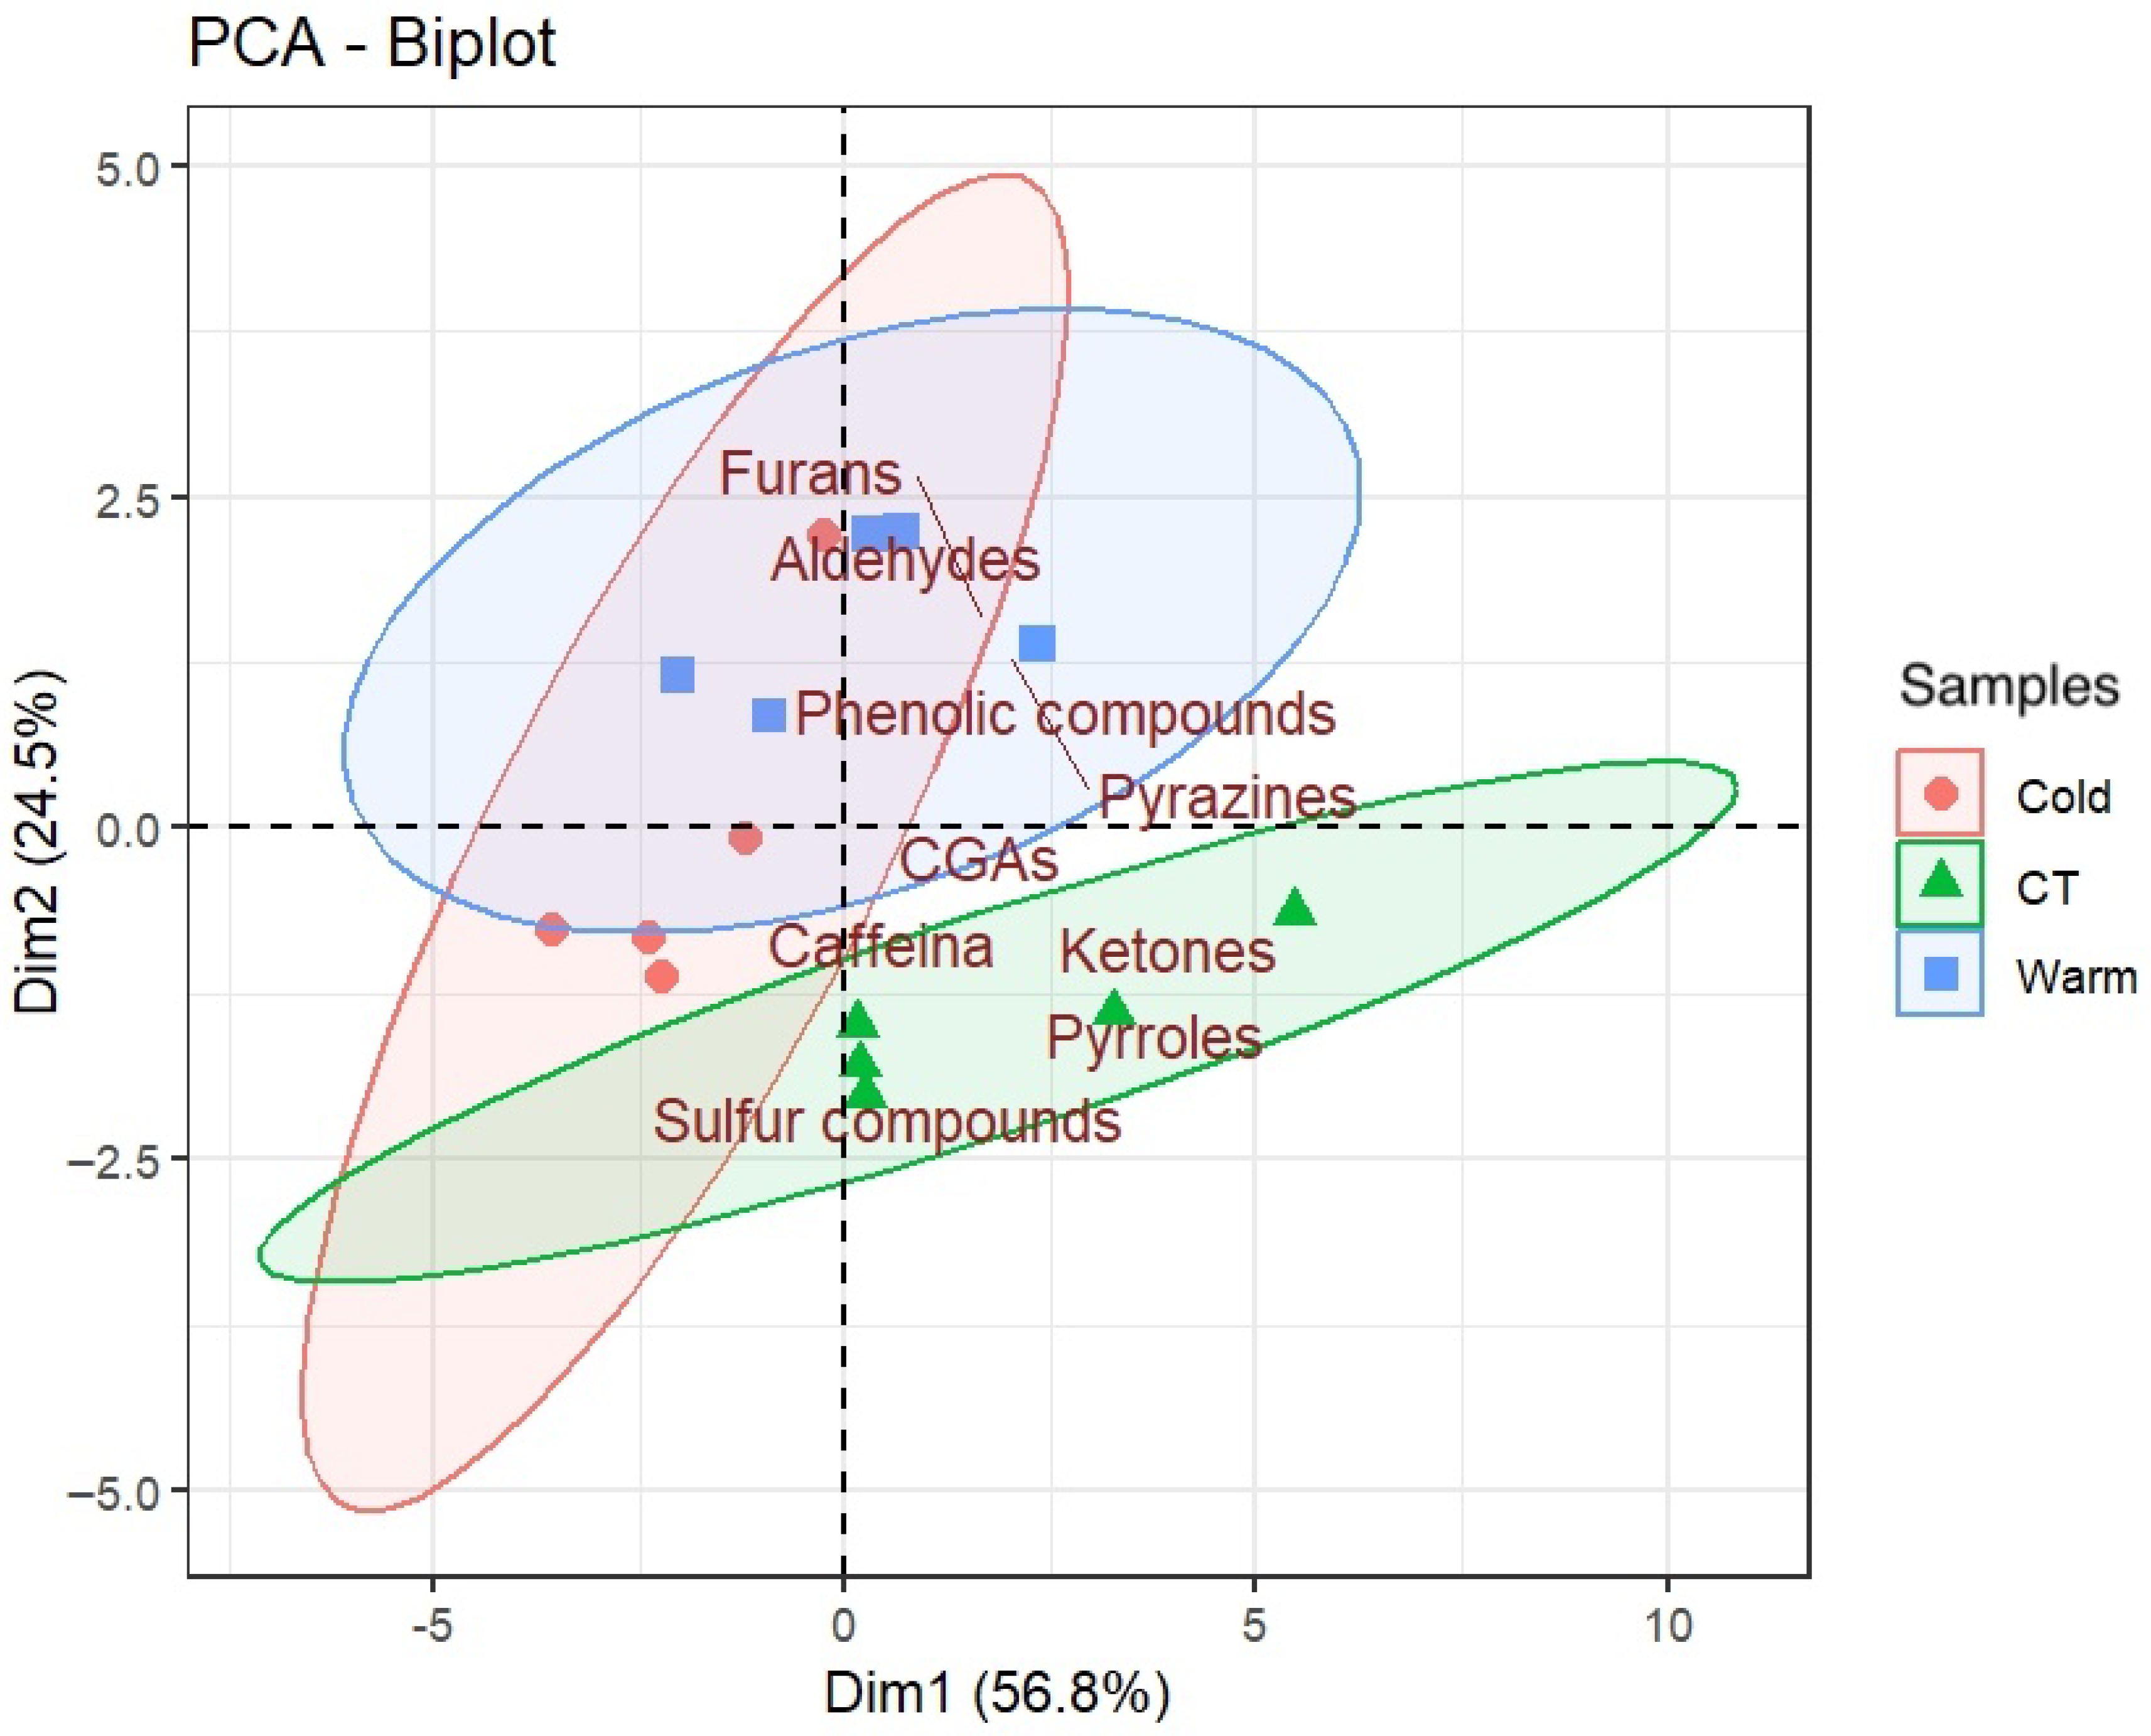
The PCA-Biplot (Figure 4) shows the distribution of samples based on caffeine, CGAs and VOCs. The first principal component (PC1) explained 56.8% of the total variance, while the second principal component (PC2) accounted for 24.5%, resulting in a cumulative explained variance of 81.3%. Samples were mainly separated along PC1. C samples were located on the positive side of PC1, whereas Cold samples were distributed on the negative side. The Warm samples were mainly positioned at intermediate PC1 values and showed higher scores along PC2. With respect to variable loadings, pyrazines, ketones, and pyrroles were positively associated with PC1, while caffeine and sulfur compounds loaded negatively on this component. Aldehydes, furans, and phenolic compounds were primarily associated with positive PC2 values. The confidence ellipses further supported these observations. The Warm group exhibited a relatively compact ellipse, suggesting high internal consistency. The C group showed an elongated ellipse along PC1, indicating variability primarily along this axis. In contrast, the Cold group displayed a larger and more tilted ellipse, reflecting greater heterogeneity among samples.

4. Discussion

In this study, two thermal treatments were evaluated: one involving heating at 105 °C for 30 min and the other involving cooling at −34 °C for 30 min. The choice of these two treatments was dictated by the scarcity of similar studies in the literature; therefore, it was decided to select two very different temperatures that would allow for the examination of a broad spectrum of potential effects. The study focused on the effects of target treatment temperatures on coffee properties; however, detailed thermal kinetics of the beans during treatment were not investigated. Future studies should include continuous bean temperature monitoring to improve process reproducibility and scale-up assessment.
The results of this study demonstrate that short-term thermal treatments applied immediately before grinding significantly affect the mechanical behavior of coffee beans, requiring substantial adjustments of the grinding conditions to maintain a standard espresso flow rate. A significant reduction in the grind setting required by the Warm sample was probably due to the increased plasticity of the heated beans and their reduced fragility. It is plausible to assume that a more intense heating treatment would have caused greater water loss, resulting in increased fragility and significantly limiting the reduction in the grind setting observed in this study. For the Cold sample, given that lower temperatures increase fragility, it was reasonable to expect that the required grind setting would be higher than C, since grinding would be more effective. The limited difference observed suggests that the effect of low-temperature pre-treatment may have been partially canceled out or mitigated by the rapid heat exchange that occurs between the cold beans and the grinding wheels at room temperature [4].
In Warm and Cold samples, there was a uniform decrease in foam, suggesting the activation of a common mechanism linked to the loss or reduced retention of carbon dioxide, the gas essential for the formation and stabilization of foam in the cup [25]. Application of heat treatments may have compromised the bean matrix, accelerating the degassing of endogenous CO2 prior to the extraction and degradation of surfactant and protein compounds that stabilize the air bubbles in the crema, reducing the cohesion of the liquid film [26]. Since carbon dioxide is the main component of the gas phase of the crema, let us assume that the reduction in its quantity in the beans from the Cold and Warm samples leads to a significant decrease in the volume and/or stability of the foam in the final beverage.
Importantly, these adjustments in grinding conditions allowed comparable extraction yields to be achieved, as indicated by similar TDS values among samples, enabling a meaningful comparison of chemical composition. The samples were extracted at the same flow rate, which is known to influence extraction kinetics and component concentrations during espresso brewing. However, similar TDS values cannot be attributed to flow rate alone, as multiple parameters (e.g., extraction yield, grind size, and beverage mass) also play a significant role [27].
Reduction in CGA content during the roasting phase is widely documented in the literature [28], while other variables that can negatively affect the content of these compounds, such as cooling treatment, remain poorly understood. This study found that, in samples that underwent a cooling treatment, there was a greater decrease in CGAs than in beans that underwent a temperature increase treatment. Since both treatments involved exposure to the external environment and, consequently, to atmospheric oxygen, the observed decrease in CGAs may be attributed, at least in part, to oxidative degradation processes reported to occur during storage [29]. Like chlorogenic acids, both heat treatments applied to the beans resulted in a reduction in caffeine extraction compared to the C reference sample. Caffeine is a relatively thermally stable alkaloid and does not undergo significant degradation at temperatures used in the treatments [30]. However, its availability for extraction depends heavily on how it is distributed and retained in the porous matrix of the bean. The literature indicates that smaller particles, which are present in greater quantities in the treated samples compared to C (Figure 3), lead to an increase in caffeine extraction [31]; however, the study shows a decrease in the extraction of this alkaloid. The decrease in caffeine content could be explained by the fact that any microfractures, changes in porosity, or partial collapse of cellular structures can affect internal diffusion, limiting the transfer of caffeine to the surface during extraction.
Heat treatments caused alterations in the aromatic profile of the espresso coffees. The Warm sample showed an increase in thermal degradation compounds. The increase in hexanal observed in this sample may be due either to exposure to an aerobic atmosphere or to the high treatment temperature; as noted in the literature, these are factors that influence hexanal levels [32]. The cooling treatment undergone by the Cold sample generated more limited changes than the previous one, but even in this case, there was a decrease in volatile compounds typical of espresso, probably due to their susceptibility to oxidation and rapid degradation in air [33].
The PCA results highlight treatment-related differences in the chemical composition of the samples. C was mainly associated with pyrazines, ketones, and pyrroles, whereas the Cold sample showed a closer association with caffeine and sulfur-containing compounds, indicating distinct chemical profiles among treatments. The variability described by PC2 was related to aldehydes, furans, and phenolic compounds, which contributed to additional sample differentiation, particularly in the Warm sample. Overall, the PCA provided a concise multivariate overview of the relationships between treatments and key chemical components. Overall, these results indicate that heating induces more pronounced alterations in the aromatic profile, consistent with oxidative and thermal stress phenomena, whereas cooling results in milder but still detectable losses of key espresso-related volatiles.
From an applied perspective, the reduced caffeine extraction observed after cooling treatment suggests a potential industrial application. Controlled cooling prior to grinding could represent a simple and non-chemical strategy for producing coffee-based products with a lower caffeine content while inducing less pronounced changes in other chemical and sensory-related characteristics compared to heating treatment. These findings suggest that both heating and cooling can influence espresso characteristics, albeit through partially different mechanisms and with different magnitudes. Overall, the study highlights the temperature of coffee beans prior to grinding as a critical yet often overlooked parameter in espresso preparation.
Future research should focus on extending the investigation to different coffee origins, roast levels, and grinding systems, as well as on exploring the sensory implications of the observed chemical and physical changes.

5. Conclusions

This study investigated the effect of coffee bean temperature immediately prior to grinding on grinder performance, powder characteristics, and espresso beverage properties. By applying controlled heating and cooling treatments before grinding, it was possible to evaluate how thermal conditions influence both the physical behavior of the beans and the chemical composition of the extracted beverage. The results demonstrated that pre-grinding temperature significantly affects the grinding process and the final espresso quality. Heating and cooling treatments altered the mechanical behavior of the coffee beans and grinder behavior, influencing flow rate and extraction dynamics. These physical changes were reflected in the chemical profile of the beverage, with variations observed in total dissolved solids, caffeine and CGA content, as well as in the volatile organic compound composition. In particular, heating treatment led to a reduction in bioactive compound extraction and to modifications of the aromatic profile consistent with accelerated aging phenomena, such as an increased presence of oxidation-related compounds. Cooling treatment produced similar but generally less pronounced effects, although a reduction in caffeine extraction and in the abundance of specific volatile compounds was observed. Controlling this variable may represent a practical strategy to modulate extraction behavior and beverage quality.

Supplementary Materials

The following supporting information can be downloaded at: https://www.mdpi.com/article/10.3390/app16104886/s1, Figure S1: HPLC profiles of the untreated sample, which was ground to a consistency that would yield the typical flow rate of an espresso, C, chosen as reference, at 278 nm for caffeine and 330 nm for CGAs. Peaks: 1, 3-CQA; 2–3, CeQA; 4, 5-CQA; 5, 4-CQA; 6, 5-FQA; 7, CQL; 8, 4-CQL; 9–10, CQL; 11, 4,5-diCQA. Abbreviations: CQA, caffeoylquinic acid; CeQA, caffeoyl epiquinic acid; FQA, feruloylquinic acid; CQL, caffeoylquinic acid lactone; diCQA, dicaffeoylquinic acid; Figure S2: HS-SPME-GC-MS raw chromatograms of the untreated sample, which was ground to a consistency that would yield the typical flow rate of an espresso, C; Figure S3: HS-SPME-GC-MS raw chromatograms of the sample that was thermally cooled and ground to a grind size suitable for producing the typical flow rate of an espresso, Cold; Figure S4: HS-SPME-GC-MS raw chromatograms of the sample that was heat-treated and ground to a grind size suitable for producing the typical flow rate of an espresso, Warm.

Author Contributions

Conceptualization, G.A. and A.P.; methodology, G.A. and P.M.; software, A.S. and F.C.; validation, G.A. and P.M.; formal analyses, L.C., M.B., M.I. and M.P.; investigation, A.S. and M.P.; resources, A.P.; data curation, A.S., F.C. and M.P.; writing—original draft preparation, M.P.; writing—review and editing, G.A.; visualization, L.C., M.I. and P.M. All authors have read and agreed to the published version of the manuscript.

Funding

This research received no external funding.

Data Availability Statement

The original contributions presented in this study are included in the article/Supplementary Materials. Further inquiries can be directed to the corresponding author(s).

Conflicts of Interest

The authors declare no conflict of interest.

References

  1. Iaccheri, E.; Ragni, L.; Cevoli, C.; Romani, S.; Dalla Rosa, M.; Rocculi, P. Glass Transition of Green and Roasted Coffee Investigated by Calorimetric and Dielectric Techniques. Food Chem. 2019, 301, 125187. [Google Scholar] [CrossRef] [PubMed]
  2. Andueza, S.; De Peña, M.P.; Cid, C. Chemical and Sensorial Characteristics of Espresso Coffee as Affected by Grinding and Torrefacto Roast. J. Agric. Food Chem. 2003, 51, 7034–7039. [Google Scholar] [CrossRef]
  3. Wang, X.; Lim, L.T. Effect of Roasting Conditions on Carbon Dioxide Degassing Behavior in Coffee. Food Res. Int. 2014, 61, 144–151. [Google Scholar] [CrossRef]
  4. Uman, E.; Colonna-Dashwood, M.; Colonna-Dashwood, L.; Perger, M.; Klatt, C.; Leighton, S.; Miller, B.; Butler, K.T.; Melot, B.C.; Speirs, R.W.; et al. The Effect of Bean Origin and Temperature on Grinding Roasted Coffee. Sci. Rep. 2016, 6, 24483. [Google Scholar] [CrossRef] [PubMed]
  5. Cordoba, N.; Fernandez-Alduenda, M.; Moreno, F.L.; Ruiz, Y. Coffee Extraction: A Review of Parameters and Their Influence on the Physicochemical Characteristics and Flavour of Coffee Brews. Trends Food Sci. Technol. 2020, 96, 45–60. [Google Scholar] [CrossRef]
  6. Gloess, A.N.; Schönbächler, B.; Klopprogge, B.; D’Ambrosio, L.; Chatelain, K.; Bongartz, A.; Strittmatter, A.; Rast, M.; Yeretzian, C. Comparison of Nine Common Coffee Extraction Methods: Instrumental and Sensory Analysis. Eur. Food Res. Technol. 2013, 236, 607–627. [Google Scholar] [CrossRef]
  7. Severini, C.; Ricci, I.; Marone, M.; Derossi, A.; De Pilli, T. Changes in the Aromatic Profile of Espresso Coffee as a Function of the Grinding Grade and Extraction Time: A Study by the Electronic Nose System. J. Agric. Food Chem. 2015, 63, 2321–2327. [Google Scholar] [CrossRef]
  8. Angeloni, G.; Guerrini, L.; Masella, P.; Innocenti, M.; Bellumori, M.; Parenti, A. Characterization and Comparison of Cold Brew and Cold Drip Coffee Extraction Methods. J. Sci. Food Agric. 2019, 99, 391–399. [Google Scholar] [CrossRef]
  9. Caprioli, G.; Cortese, M.; Sagratini, G.; Vittori, S. The Influence of Different Types of Preparation (Espresso and Brew) on Coffee Aroma and Main Bioactive Constituents. Int. J. Food Sci. Nutr. 2015, 66, 505–513. [Google Scholar] [CrossRef]
  10. Illy, A.; Viani, R. Espresso Coffee: The Science of Quality, 2nd ed.; Academic Press: Amsterdam, The Netherlands, 2005. [Google Scholar]
  11. Moroney, K.M.; Lee, W.T.; O’Brien, S.B.G.; Suijver, F.; Marra, J. Modelling of Coffee Extraction during Brewing Using Multiscale Methods: An Experimentally Validated Model. Chem. Eng. Sci. 2015, 137, 216–234. [Google Scholar] [CrossRef]
  12. Angeloni, G.; Masella, P.; Spadi, A.; Guerrini, L.; Corti, F.; Bellumori, M.; Calamai, L.; Innocenti, M.; Parenti, A. Using Ground Coffee Particle Size and Distribution to Remodel Beverage Properties. Eur. Food Res. Technol. 2023, 249, 1247–1256. [Google Scholar] [CrossRef]
  13. Kuhn, M.; Lang, S.; Bezold, F.; Minceva, M.; Briesen, H. Time-Resolved Extraction of Caffeine and Trigonelline from Finely-Ground Espresso Coffee with Varying Particle Sizes and Tamping Pressures. J. Food Eng. 2017, 206, 37–47. [Google Scholar] [CrossRef]
  14. Fredholm, B.B.; Yang, J.; Wang, Y. Low, but Not High, Dose Caffeine Is a Readily Available Probe for Adenosine Actions. Mol. Asp. Med. 2017, 55, 20–25. [Google Scholar] [CrossRef]
  15. Tajik, N.; Tajik, M.; Mack, I.; Enck, P. The Potential Effects of Chlorogenic Acid, the Main Phenolic Components in Coffee, on Health: A Comprehensive Review of the Literature. Eur. J. Nutr. 2017, 56, 2215–2244. [Google Scholar] [CrossRef]
  16. Caporaso, N.; Whitworth, M.B.; Cui, C.; Fisk, I.D. Variability of Single Bean Coffee Volatile Compounds of Arabica and Robusta Roasted Coffees Analysed by SPME-GC-MS. Food Res. Int. 2018, 108, 628–640. [Google Scholar] [CrossRef]
  17. Angeloni, G.; Guerrini, L.; Masella, P.; Dionisio, A.; Gatti, R.; Parenti, A. Test of an Innovative Method to Prepare Coffee Powder Puck, Improving Espresso Extraction Reliability. Eur. Food Res. Technol. 2022, 248, 163–170. [Google Scholar] [CrossRef]
  18. Smrke, S.; Eiermann, A.; Yeretzian, C. The Role of Fines in Espresso Extraction Dynamics. Sci. Rep. 2024, 14, 5612. [Google Scholar] [CrossRef]
  19. Vanegas-Ayala, S.C.; Leal-Lara, D.D.; Barón-Velandia, J. Roasted Coffee Beans Characterization through Optoelectronic Color Sensing. Coffee Sci. 2023, 18, e182156. [Google Scholar] [CrossRef]
  20. Lomolino, G.; Dal Zotto, V.; Zannoni, S.; De Iseppi, A. Foam Characteristics and Sensory Analysis of Arabica Coffee, Extracted by Espresso Capsule and Moka Methods. Beverages 2022, 8, 28. [Google Scholar] [CrossRef]
  21. Crozier, T.W.M.; Stalmach, A.; Lean, M.E.J.; Crozier, A. Espresso Coffees, Caffeine and Chlorogenic Acid Intake: Potential Health Implications. Food Funct. 2012, 3, 30–33. [Google Scholar] [CrossRef] [PubMed]
  22. Bellumori, M.; Angeloni, G.; Guerrini, L.; Masella, P.; Calamai, L.; Mulinacci, N.; Parenti, A.; Innocenti, M. Effects of Different Stabilization Techniques on the Shelf Life of Cold Brew Coffee: Chemical Composition, Flavor Profile and Microbiological Analysis. LWT 2021, 142, 111043. [Google Scholar] [CrossRef]
  23. Ochiai, N.; Tsunokawa, J.; Sasamoto, K.; Hoffmann, A. Multi-Volatile Method for Aroma Analysis Using Sequential Dynamic Headspace Sampling with an Application to Brewed Coffee. J. Chromatogr. A 2014, 1371, 65–73. [Google Scholar] [CrossRef]
  24. Zakidou, P.; Plati, F.; Matsakidou, A.; Varka, E.M.; Blekas, G.; Paraskevopoulou, A. Single Origin Coffee Aroma: From Optimized Flavor Protocols and Coffee Customization to Instrumental Volatile Characterization and Chemometrics. Molecules 2021, 26, 4609. [Google Scholar] [CrossRef]
  25. Angeloni, G.; Masella, P.; Guerrini, L.; Spadi, A.; Bellumori, M.; Innocenti, M.; Parenti, A. Physical and Chemical Effects of Different Working Gases in Coffee Brewing: A Case Study of Caffè Firenze. Foods 2020, 9, 1825. [Google Scholar] [CrossRef] [PubMed]
  26. Budryn, G.; Nebesny, E.; Zyzelewicz, D.; Oracz, J.; Miśkiewicz, K.; Rosicka-Kaczmarek, J. Influence of Roasting Conditions on Fatty Acids and Oxidative Changes of Robusta Coffee Oil. Eur. J. Lipid Sci. Technol. 2012, 114, 1052–1061. [Google Scholar] [CrossRef]
  27. Schmieder, B.K.L.; Pannusch, V.B.; Vannieuwenhuyse, L.; Briesen, H.; Minceva, M. Influence of Flow Rate, Particle Size, and Temperature on Espresso Extraction Kinetics. Foods 2023, 12, 2871. [Google Scholar] [CrossRef]
  28. Somporn, C.; Kamtuo, A.; Theerakulpisut, P.; Siriamornpun, S. Effects of Roasting Degree on Radical Scavenging Activity, Phenolics and Volatile Compounds of Arabica Coffee Beans (Coffea arabica L. Cv. Catimor). Int. J. Food Sci. Technol. 2011, 46, 2287–2296. [Google Scholar] [CrossRef]
  29. Badmos, S.; Kuhnert, N. Stability and Degradation of Chlorogenic Acids in Green and Roasted Coffee Beans during Long-Term Storage. Food Res. Int. 2025, 220, 117031. [Google Scholar] [CrossRef]
  30. Mehaya, F.M.; Mohammad, A.A. Thermostability of Bioactive Compounds during Roasting Process of Coffee Beans. Heliyon 2020, 6, e05508. [Google Scholar] [CrossRef]
  31. Khamitova, G.; Angeloni, S.; Borsetta, G.; Xiao, J.; Maggi, F.; Sagratini, G.; Vittori, S.; Caprioli, G. Optimization of Espresso Coffee Extraction through Variation of Particle Sizes, Perforated Disk Height and Filter Basket Aimed at Lowering the Amount of Ground Coffee Used. Food Chem. 2020, 314, 126220. [Google Scholar] [CrossRef]
  32. Dippong, T.; Dan, M.; Kovacs, M.H.; Kovacs, E.D.; Levei, E.A.; Cadar, O. Analysis of Volatile Compounds, Composition, and Thermal Behavior of Coffee Beans According to Variety and Roasting Intensity. Foods 2022, 11, 3146. [Google Scholar] [CrossRef] [PubMed]
  33. Gloess, A.N.; Vietri, A.; Wieland, F.; Smrke, S.; Schönbächler, B.; López, J.A.S.; Petrozzi, S.; Bongers, S.; Koziorowski, T.; Yeretzian, C. Evidence of Different Flavour Formation Dynamics by Roasting Coffee from Different Origins: On-Line Analysis with PTR-ToF-MS. Int. J. Mass Spectrom. 2014, 365, 324–337. [Google Scholar] [CrossRef]
Figure 1. Volumetric density of particle size distributions of coffee powders obtained from untreated control (C), thermally cooled (ColdC), and thermally heated (WarmC) samples ground to the same fineness as the control.
Applsci 16 04886 g001
Figure 2. Volumetric density of particle size distributions of untreated control coffee beans (C), thermally cooled beans (Cold), and heat-treated beans (Warm), all ground to obtain the typical espresso flow rate.
Applsci 16 04886 g002
Figure 3. Percentage particle size distribution of control (C), thermally cooled (Cold), and thermally heated (Warm) coffee powders ground to obtain the typical espresso flow rate. Different letters denote significant differences (Tukey’s HSD, 95% confidence level).
Applsci 16 04886 g003
Figure 4. PCA biplot showing the distribution of untreated (C), thermally cooled (Cold), and thermally heated (Warm) coffee samples ground to obtain the typical espresso flow rate, based on caffeine, CGAs, and VOCs. Ellipses indicate the 95% confidence intervals for each group.
Applsci 16 04886 g004
Table 1. Coding of samples ground to the control grade: C, ColdC, WarmC.
SampleHeat
Treatment
Grinding
Degree
Description
C-2.7Standard
Espresso
ColdC−34 °C × 30 min2.7Cooling and grinding as C
WarmC105 °C × 30 min2.7Heating and grinding as C
Table 2. Coding of samples ground to a specific degree to have a flow rate of approximately 1 mL s−1: C, Cold, Warm.
SampleHeat
Treatment
Grinding
Degree
Description
C-2.7Standard
Espresso
Cold−34 °C × 30 min 2.4Cooling and grinding as C
Warm105 °C × 30 min1.1Heating and grinding as C
Table 3. Flow rate (mL s−1) of untreated control (C), thermally cooled (ColdC), and thermally heated (WarmC) coffee samples ground to the same fineness as the control. Different letters indicate significant differences according to Tukey’s HSD test (95% confidence level).
AnalysesCColdCWarmC
Flow rate
(1 mL s−1)
0.98 ± 0.07
b
1.21 ± 0.04
a
1.31 ± 0.11
a
Table 4. Colorimetric analyses of coffee beans and powder with values reported on an RGB scale and indication of the 95% significance of the differences, using different letters derived from Tukey’s post hoc HSD test.
BeansCColdWarm
R39.2 ± 9.2
a
22.1 ± 5.5
b
25.4 ± 4.7
b
G26.5 ± 8.6
a
15.4 ± 5.6
b
22.9 ± 3.9
a
B30.9 ± 15.4
a
15.4 ± 7.0
b
27.2 ± 11.8
a
PowderCColdWarm
R23.4 ± 4.7
a
23.3 ± 6.5
a
24.3 ± 2.3
a
G14.0 ± 5.2
a
14.1 ± 6.3
a
15.4 ± 3.6
a
B11.6 ± 5.5
a
12.4 ± 6.6
a
13.5 ± 6.6
a
Table 5. Grinder performance and chemical–physical analyses of untreated control (C), thermally cooled (Cold), and thermally heated (Warm) coffee samples ground to obtain the typical espresso flow rate. Different letters indicate significant differences according to Tukey’s HSD test (95% confidence level).
AnalysesCColdWarm
Electricity consumption (Wh) 417.4 ± 15.8 a392.8 ± 19.5 a415.8 ± 29.0 a
Noise
(dB)
78.3 ± 1.0 b80.2 ± 1.4 a 77.9 ± 0.8 b
Height foam (cm)0.58 ± 0.04 a0.40 ± 0.07 b0.36 ± 0.05 b
TDS
(%)
5.61 ±0.51 a4.96 ± 0.43 a5.62 ± 0.45 a
pH5.38 ± 0.01 a5.26 ± 0.02 b5.23 ± 0.02 b
Caffeine (mg/mL)3.14 ± 0.27 a2.43 ± 0.15 b2.73 ± 0.21 b
CGAs
(mg/mL)
4.05 ± 0.32 a3.26 ± 0.18 b3.70 ± 0.33 ab
Table 6. Volatile organic compound content (mg kg−1) of untreated control (C), thermally cooled (Cold), and thermally heated (Warm) coffee samples ground to obtain the typical espresso flow rate. Different letters indicate significant differences according to Tukey’s HSD test (95% confidence level).
FlavorsCColdWarm
Furan, 2-methyl-3.53 ± 0.05 a3.63 ± 0.09 a3.63 ± 0.66 a
2-butanone0.34 ± 0.02 a0.31 ± 0.02 a0.28 ± 0.02 b
Butanal, 2-methyl-0.01± 0.00 a0.01 ± 0.00 a0.01 ± 0.00 a
Butanal, 3-methyl-0.02 ± 0.00 a0.02 ± 0.00 a0.02 ± 0.00 a
Furan, 2,5-dimethyl-0.01 ± 0.00 b0.01 ± 0.00 ab0.01 ± 0.00 a
2,3-Pentanedione 0.22 ± 0.04 a0.17 ± 0.01 a0.20 ± 0.03 a
Hexanal 0.04 ± 0.01 b0.04 ± 0.01 b0.06 ± 0.01 a
1H-Pyrrole, 1-methyl- 0.01 ± 0.00 a0.01 ± 0.00 b0.01 ± 0.00 b
furfuryl methyl ether 0.08 ± 0.01 a0.7 ± 0.00 a0.08 ± 0.01 a
Pyrazine 2,5 dimethyl 0.24 ± 0.06 a0.22 ± 0.02 a0.27 ± 0.03 a
trimethyl pyrazine 0.17 ± 0.04 a0.15 ± 0.01 a0.19 ± 0.02 a
Furfuryl methyl sulfide 0.00 ± 0.00 a0.00 ± 0.00 b0.00 ± 0.00 b
3 methyl 3 trans propenyl pyrazine 0.02 ± 0.00 a0.01 ± 0.00 a0.02 ± 0.00 a
furfuryl acetate 0.09 ± 0.02 a0.08 ± 0.01 a0.10 ± 0.01 a
5 methyl furfural 8.39 ± 0.52 a8.03 ± 1.00 a8.48 ± 0.21 a
furfurol 0.00 ± 0.00 a0.00 ± 0.00 a0.00 ± 0.00 a
2-acetyl1-methyl pyrrole 0.00 ± 0.00 a0.00 ± 0.00 a0.00 ± 0.00 a
beta damascenone 0.00 ± 0.00 a0.00 ± 0.00 a0.00 ± 0.00 a
furfurylpyrrole 0.00 ± 0.00 a0.00 ± 0.00 a0.00 ± 0.00 a
guaiacol 0.00 ± 0.00 a0.03 ± 0.00 a0.04 ± 0.00 a
4-ethyl guaiachol 0.00 ± 0.00 a0.00 ± 0.00 a0.00 ± 0.00 a
Disclaimer/Publisher’s Note: The statements, opinions and data contained in all publications are solely those of the individual author(s) and contributor(s) and not of MDPI and/or the editor(s). MDPI and/or the editor(s) disclaim responsibility for any injury to people or property resulting from any ideas, methods, instructions or products referred to in the content.