Article

Evaluation of Summer Cover Crops for Growth, Nutrient Dynamics, and Weed Suppression in South Florida

by
Divya Sree Govada
,
Biplov Oli
,
Daisy Pineda
,
Patrick Ben Emoi Otema
and
Maruthi Sridhar Balaji Bhaskar
*
Department of Earth and Environment, Florida International University, Miami, FL 33199, USA
*
Author to whom correspondence should be addressed.
Appl. Sci. 2026, 16(10), 4815; https://doi.org/10.3390/app16104815
Submission received: 8 April 2026 / Revised: 30 April 2026 / Accepted: 6 May 2026 / Published: 12 May 2026
(This article belongs to the Special Issue Effects of the Soil Environment on Plant Growth)

Abstract

Soil degradation, nutrient depletion, and persistent weed pressure represent critical challenges in the adoption of sustainable agriculture practices in subtropical organic farming systems. Reliance on conventional inputs threatens long-term soil health and ecosystem resilience, highlighting the need for regenerative alternatives. Cover crops are widely recognized as multifunctional agroecological tools with the capacity to enhance nutrient cycling, perform weed suppression, and improve soil organic matter. To evaluate their effectiveness in South Florida's subtropical climate and organic raised bed systems, a field experiment was conducted as a Randomized Block Design (RBD) at the Florida International University Organic Garden during the 2024 summer season. The six cover crops species that were tested include green gram (Vigna radiata), hibiscus (Hibiscus sabdariffa), sorghum (Sorghum bicolor), soybean (Glycine max), sunn hemp (Crotalaria juncea), and pearl millet (Pennisetum glaucum). Data collected includes plant establishment, biomass accumulation, weed suppression, soil physiochemical properties, and plant nutrient composition. Sorghum and sunn hemp produced the highest fresh and dry biomass, with sorghum achieving the most effective weed suppression with the lowest weed biomass and weed population. Sunn hemp contributed to enhanced nitrogen content in plant tissues, while hibiscus promoted the highest soil P and N concentrations. Pearl millet exhibited the highest total carbon and organic matter content, indicating potential for enhancing soil carbon content and soil fertility. Results show that each cover crop species can provide a specialized or generalized ecosystem service depending on management goals.

1. Introduction

Soil health is a foundation for crop production, productivity, and agricultural sustainability. As a nonrenewable natural resource, soil faces increasing pressure from the rising global population and food demand. Along with this, soil health and soil management for sustainable agriculture are major concerns in recent days for ecosystem stability, food security, agricultural sustainability, and climate resilience. Sandy soil with poor soil structure and low organic matter content, coupled with high temperature and frequent rainfall, will further accelerate nutrient leaching, faster mineralization and soil erosion [1,2]. Furthermore, farmers growing vegetable crops in raised bed systems commonly face soil and nutrient loss [3]. In response to this, growing cover crops during the fallow period will be a regenerative and protective strategy to improve soil health by enhancing nutrient cycling, microbial activity, utilizing residual nutrients, reducing weed infestation and contributing to long-term carbon sequestration [4].
Cover crops play a significant role in enhancing soil organic matter and carbon sequestration, which is a key indicator of soil health. Depending upon the cover crop species and management practices, about 0.3 to 1.1 t ha−1 per year of carbon is stored in the soil [5,6]. Cover crops have been shown to increase soil organic matter by 11.7% compared to fallow land [3]. Crops like pearl millet, sorghum and sunn hemp can produce from 3881 kg ha−1 to above 6000 kg ha−1 of dry biomass, contributing to controlling soil loss and organic matter addition in soil [7]. Weed suppression is another important function of cover crops by creating a living mulch that blocks sunlight and outcompetes weeds for soil nutrients and other resources. Study shows that cover crop reduced weed biomass by 62.6% and weed density by 45.4% [8]. Some cover crops like sorghum and pearl millet are drought-tolerant and release compounds like sorgoleone, which inhibit the germination of weeds [9]. Furthermore, growing cover crops will generate indirect economic benefit by reducing th herbicide input [10,11]. A study carried out in 2024 [12] showed that cover crops help reduce the use of glyphosate application by 50%. This will be even more effective when cover crops are allowed to grow to reach high biomass levels before termination, creating a thick residual layer that suppresses weed emergence and improves soil cover. Another important benefit of growing cover crops is micro-climatic modification, which helps to reduce evaporation, buffer soil temperature, and support microbial activity [13,14].
Despite the several benefits of cover crops in soil health and sustainable agriculture, most of the research studies have focused on conventional fields and limited research has been carried out on raised bed organic farming systems under subtropical climatic condition [4,15]. This field experiment integrates the six different potential summer cover crops from diverse species with different functional traits which include green gram (Vigna radiata), sunn hemp (Crotalaria juncea), and soybean (Glycine max) from the leguminous family, pearl millet (Pennisetum glaucum), and sorghum (Sorghum bicolor) from grasses and a deep rooted and biodiversity supportive hibiscus plant (Hibiscus sabdariffa), to address the gap by evaluating the role of cover crops in improving soil health under raised bed farming systems. The cover crops were selected based on their adaptability, availability, biomass productivity, growth cycle, nitrogen fixation, tolerance to drought, and weed suppression under the climatic conditions of South Florida. This study aims to evaluate the performance of different species of cover crops on soil health under the raised bed, organic and open environmental conditions to promote a sustainable agriculture and climate resilience strategy. The specific objectives of this study are:
(1)
to evaluate the establishment, growth and biomass production of six summer cover crop species under raised bed conditions,
(2)
to assess the effectiveness of the selected cover crops in weed suppression, and
(3)
to analyze the influence of cover crops on soil physicochemical properties and nutrient dynamics.

2. Materials and Methods

2.1. Study Site and Experimental Design

The experiment was conducted during the summer of 2024 at the Florida International University (FIU) Organic Garden (coordinates: 25.7539281, −80.3800388), located in Miami, Florida, which has been previously used for related agroecological and soil–plant interaction studies by Oyege and Balaji Bhaskar [16] and Belbase et al. [17]. The site is characterized by a humid subtropical climate with high temperatures reaching up to 98 °F, minimum temperatures averaging around 73 °F, and frequent rainfall totaling approximately 25–30 inches during the summer months [18] The research used a randomized block design (RBD) to assess six summer cover crop species, which included green gram, hibiscus, sorghum, soybean, sunn hemp and pearl millet. The experiment duplicated local organic farming practices by using raised beds (LHW: 153 × 30 × 91 cm), which were repeated three times for each treatment. The seeds received manual planting at their proper depth (Table 1) and distance according to recommendations, while standard management practices, including irrigation and hand weeding (at approximately 30, 60 and 90 days after sowing) were applied identically to all treatments.

2.2. Plant Growth and Biomass Assessment

Three seeds were planted per hole, and seedlings were thinned at the early vegetative stage to retain one healthy plant per hole, ensuring uniform stand establishment across all plots. The researchers documented the final plant density after the plants reached full establishment. The following measurements of plant growth and biomass parameters occurred at physiological maturity, which was approximately 120 days after sowing:
Plant height was measured from the soil surface to the apical tip using a meter ruler. Plant density (plants m−2): calculated as the number of surviving plants per unit area. Fresh biomass (g m−2) was recorded by harvesting above-ground biomass and weighing it immediately after cutting. For dry biomass, the harvested samples were oven-dried at 65 °C until constant weight was achieved.

2.3. Weed Assessment

Weed populations were quantified at cover crop harvest using a 1 m2 quadrat randomly placed within each plot. The number of individual weeds per quadrat was recorded, and weed biomass was collected, oven-dried at 65 °C, and weighed to determine dry biomass (g m−2).

2.4. Soil Sampling and Chemical Analysis

Soil samples were obtained from three random locations in each plot at depths ranging from 0 to 15 cm both before planting and after harvest. The samples underwent air drying followed by grinding and sieving through a 2 mm mesh before storage at room temperature (18–20 °C) until analysis. The following parameters were determined:
Soil chemical properties were analyzed using standard procedures. Soil pH was measured in 0.01 M CaCl2 with a soil-to-solution ratio of 1:2 after 30 min equilibration [19]. Organic matter (OM) content was determined using the Loss on Ignition (LOI) method [20]. Total carbon (C) and nitrogen (N) were analyzed by dry combustion using a C/N Analyzer (TruSpec, LECO Corporation, St. Joseph, MI, USA) [21]. Macronutrients (N, P, K, Mg) and micronutrients (Fe, Zn, Mn, Cu) were quantified using Inductively Coupled Plasma Mass Spectrometry (ICP-MS, Agilent 7900, Santa Clara, CA, USA) [22]. Cation exchange capacity (CEC) was determined from the sum of charge equivalents of exchangeable cations (K, Ca, Mg, Zn, Na, H) extracted with unbuffered 1 M NH4Cl solution (soil-to-solution ratio 1:10, shaken for 1 h).

2.5. Plant Tissue Analysis

At harvest, above-ground plant tissues were collected from each plot, air-dried at 25–30 °C, and ground to a fine powder using a Mixer/Mill (SPEX 8000M, Metuchen, NJ, USA). The C/N Analyzer measured total nitrogen content, but ICP-MS after acid digestion determined phosphorus, potassium, calcium, magnesium and micronutrients (Fe, Zn, Mn, Cu) [16].

2.6. Statistical Analysis

All data were statistically analyzed using Minitab software (Minitab, LLC 2021). The statistical analysis used one-way analysis of variance (ANOVA) at a 95% confidence level according to Girden [23]. The analysis of treatment means used Tukey’s Honest Significant Difference (HSD) test [24] when significant differences were detected.

3. Results

3.1. Plant Establishment and Growth

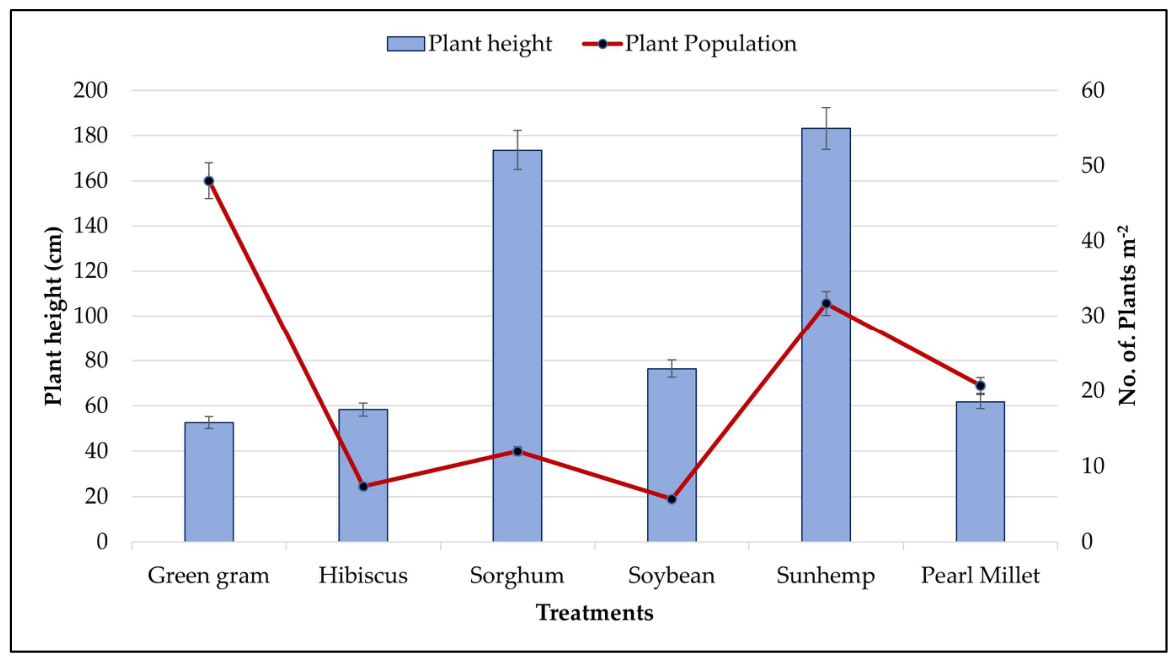
The characteristics of plant establishment and growth are shown in Figure 1. The parameters measured included plant density (number of plants per square meter) and final plant height (cm) at physiological maturity. Green gram had the highest plant density, with 48 plants m−2, followed by sunn hemp and pearl millet, with 31 and 20 plants m−2, respectively. On the other hand, hibiscus, soybean, and sorghum had very low plant densities (<15 plants m−2). In terms of plant height, sunn hemp and sorghum were the tallest with 183.1 cm and 173.6 cm, respectively. These were followed by soybean and pearl millet, with heights of 76.3 cm and 61.8 cm, respectively. Green gram had the lowest plant height of 52.6 cm.

3.2. Biomass Production

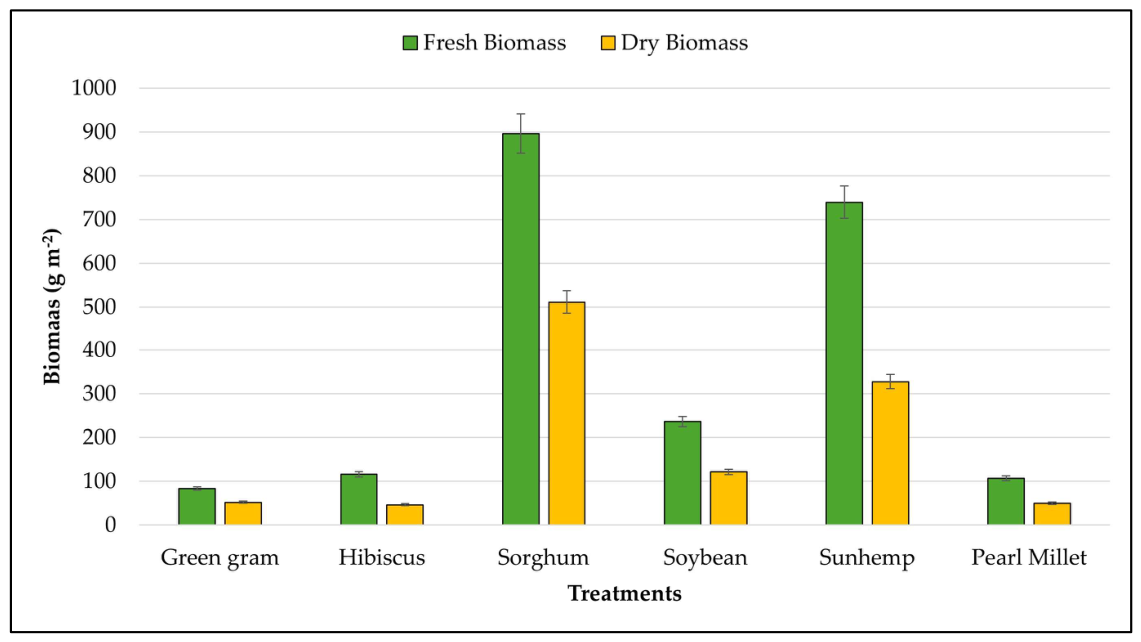
The six cover crop treatments demonstrated different biomass accumulation patterns according to Figure 2. The fresh and dry biomass followed the sequence of sorghum > sunn hemp > soybean > pearl millet > hibiscus > green gram. The highest fresh and dry biomass amounts were recorded in sorghum and sunn hemp, while green gram and pearl millet showed the lowest values. Sorghum generated the greatest fresh biomass at 897 g m−2, while sunn hemp produced 740 g m−2, which exceeded all other treatments. Soybean accumulated biomass at 237 g m−2 while green gram, hibiscus, and pearl millet produced less than 150 g m−2. The dry biomass measurements showed a comparable pattern with sorghum and sunn hemp, producing the highest amounts at 512 g m−2 and 328 g m−2, respectively. The dry biomass of soybean remained at 123 g m−2 while all other treatments produced less than 60 g m−2.

3.3. Weed Population and Biomass

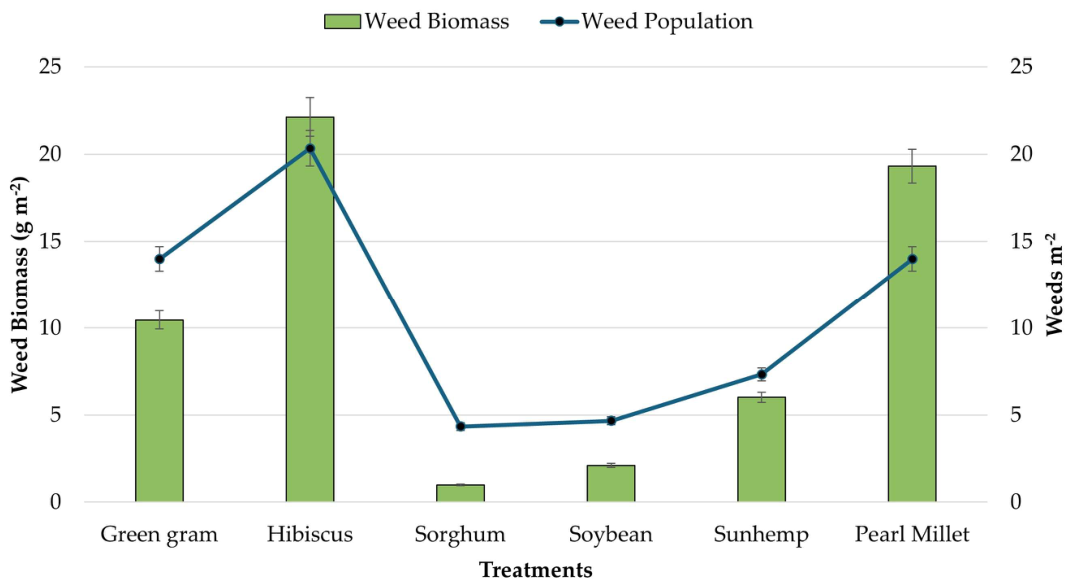
The data in Figure 3 shows the effect of cover crop treatments on weed suppression through weed population density (weeds m−2) and weed dry biomass (g m−2). The treatments showed different levels of effectiveness in controlling weed growth. The weed suppression followed the sequence of sorghum > soybean > sunn hemp > green gram > pear millet > hibiscus. The Hibiscus treatment had the highest weed density at 20 weeds m−2 and the highest weed biomass at 22 g m−2, which indicates that it was not effective in weed suppression. The weed biomass of pearl millet was 19 g m−2 and the weed count was 14 weeds m−2, which was similar to green gram with 14 weeds m−2. Sorghum was the most effective in weed suppression as it had the lowest weed population of 4 weeds m−2 and the lowest weed biomass of 1 g m−2. The weed growth was suppressed in soybean and sunn hemp as they had low weed populations of 4–7 weeds m−2 and low weed biomass of < 6 g m−2.

3.4. Soil Volumetric Water Content (VWC) and Electrical Conductivity (EC)

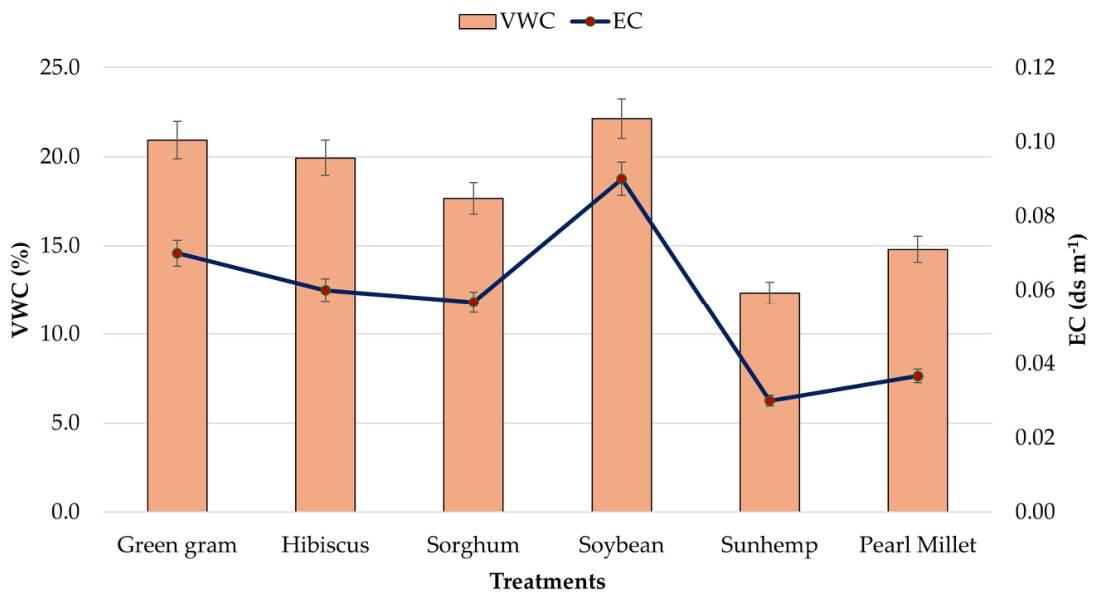
The different cover crop treatments produced varying soil moisture and salinity conditions, as shown in Figure 4. The parameters were measured at the end of the growing season to evaluate the effects of each cover crop on the soil microenvironment. The Volumetric Water Content (VWC) varied between 14% and 22% across the different treatments. The highest VWC was recorded in soybean (22%), followed by green gram (21%) and hibiscus (20%). The lowest soil moisture content was recorded in sunn hemp, which could be due to higher water uptake or lower water retention in this treatment. Electrical Conductivity (EC) values, which indicate soil salinity levels, showed greater variation. Soybean had the highest EC (0.09 dS m−1), followed by green gram, hibiscus and sorghum. On the other hand, sunn hemp and pearl millet had the lowest EC values (0.03 and 0.04 dS m−1, respectively).

3.5. Soil Physicochemical Properties

The baseline pre-plant (background soil) and post-harvest soil chemical properties under each cover crop treatment are summarized in Table 2. The analysis of total N, P, and K concentrations showed significant differences between treatments.
Comparison of background soil with post-harvest soil properties (Table 2) reveals temporal changes during the cover crop growing season. The highest total N concentration was recorded under hibiscus (0.51%), which was significantly greater than green gram (0.41%) (p < 0.05). Sunn hemp and soybean both recorded intermediate nitrogen values (0.45%), like those of sorghum, pearl millet, and not significantly different from hibiscus. Total carbon (%) and organic matter (OM) content showed significant differences among treatments. Pearl millet had the highest total carbon (11.1%) and OM (19.2%) and were significantly higher than sunn hemp, which had the lowest (10.3% C; 17.7% OM). Cation exchange capacity (CEC) ranged from 14.85 to 16.18 MEq 100 g−1 across treatments. The highest CEC values were observed under hibiscus (16.18 MEq 100 g−1), followed closely by sunn hemp (15.77 MEq 100 g−1). The lowest CEC was recorded under green gram treatment with a value of 14.85 MEq/100 g. The P levels varied significantly, with the hibiscus treatment again showing the highest value (94.95 ppm), significantly greater than green gram (56.63 ppm). Soybean (77.85 ppm) and sunn hemp (65.79 ppm) also contributed substantial P levels, though not statistically different from the other treatments. The K concentration was highest under soybean (35.12 ppm), followed by hibiscus and green gram, while the lowest was found in pearl millet (16.45 ppm). The Ca and Zn concentrations did not differ significantly among treatments, with Ca exceeding 0.24 % and Zn ranging between 6 and 10 ppm across all the treatments. There was a significant difference in Mg concentration, which was highest in hibiscus (364.5 ppm) and significantly different from green gram (302.9 ppm). Similarly, the Na content of plant tissues also differed significantly, with the highest value recorded in sorghum (18.8 ppm) significantly higher than green gram (15.6 ppm).

3.6. Plant Nutrient Composition

Although the amounts of nutrients in plant tissues varied significantly among the six cover crop species (Table 3), the total nutrient accumulation per unit area showed large differences in potential nutrient return to the soil. The most notable differences were observed in N, Ca, K, P, S, and several micronutrients. The plant N concentrations showed significant differences between the various treatments. Sunn hemp (3.63%) had the highest concentration of N followed by hibiscus (3.41%) and soybean (3.18%), while green gram (2.25%) had the lowest value. Sunn hemp had the highest plant Ca concentration at 3.57%, while sorghum and pearl millet had the lowest concentrations at 0.96% and 1.10%, respectively. The K content in plant tissues showed large variation between the treatments, with pearl millet (1.27%) and hibiscus (1.02%) having the highest values, which were significantly higher than green gram (0.23%) and soybean (0.53%). Sunn hemp (0.59%) had a moderate K level. The highest Mg concentration in plant tissue was found in pearl millet (1.03%), which was significantly higher than all other treatments (p < 0.05). Sunn hemp and soybean had moderate Mg concentration in plant tissues at 0.65% and 0.63%, but green gram had the lowest at 0.41%. The highest plant P concentration was found in hibiscus (0.58%), which was significantly higher than all other treatments (p < 0.05), followed by pearl millet (0.40%). The P concentration in green gram, sunn hemp and soybean was lower (0.16%, 0.23%, and 0.30%, respectively) but not significantly different from most other treatments. The highest S concentration in plant tissue was found in hibiscus (T2; 0.31%), followed by pearl millet (0.25%), while sorghum had the lowest value of 0.10%.
Micronutrient concentrations in plant tissues (Table 4) differed between treatments and potential nutrient return to the soil (nutrient accumulation per unit area) also differed. The plant Na concentrations showed the most pronounced difference, with pearl millet recording a significantly higher value (2777 ppm) compared to all other treatments, which remained between 90.15 and 95.14 ppm. The highest plant Fe concentrations were found in hibiscus at 88.16 ppm, followed by sunn hemp at 87.86 ppm and pearl millet at 85.98 ppm, while green gram had the lowest amount at 49.05 ppm. The highest B concentration in plant tissues was detected in hibiscus at 67.1 ppm, while sorghum and pearl millet had the lowest amounts at 8.80 ppm and 8.46 ppm, respectively. The plant Mn content showed wide variations among the treatments, with soybean having the highest concentration at 28.61 ppm, followed by hibiscus at 25.27 ppm and sunn hemp at 20.32 ppm. The highest Zn concentrations among plant tissues were found in soybean at 156.6 ppm, while green gram had the lowest amount at 46.60 ppm. The plant Cu concentrations remained stable across treatments with values between 4.13 and 7.01 ppm.

4. Discussion

4.1. Plant Establishment and Growth

4.1.1. Plant Density

The six cover crop species displayed different plant density levels because of the differences in varying establishment vigor and adaptability to subtropical environments [25]. Green gram reached the highest density of 48 plants per square meter because of its smaller seeds, quick germination, and high seeding density. The study by Scianna et al. [26] supports the high-density achievement of mung bean and cowpea legumes when conditions are favorable. The densities of sunn hemp and pearl millet plants reached 31 and 20 plants m−2, respectively, as these species thrive in sandy soils [27]. The three species of hibiscus, soybean and sorghum maintained low plant densities below 15 plants per square meter. The large seed size of soybean and sorghum might explain their low density because these seeds need deeper planting and wider spacing. The poor emergence of hibiscus plants could stem from dormancy or low germination rates or sensitivity to planting depth and soil moisture conditions [28].

4.1.2. Plant Height

Plant height also differed among the cover crops. Sunn hemp and sorghum were the tallest (180 and 170 cm, respectively) and had the lowest weed density. The relationship between height and weed suppression is in agreement with other studies, which have shown that taller cover crops can suppress weed growth through resource preemption and canopy establishment [29,30,31,32]. In contrast, green gram, hibiscus, and pearl millet were shorter (60–70 cm) and exhibited higher weed densities. Similar observations were made by Dong and Zeng [8], Weisberger et al. [33], and Zannopoulos et al. [34], showing that shorter cover crops are generally less competitive and less effective at reducing weed pressure.

4.2. Biomass Production

The different cover crop species demonstrated varying biomass production levels. The biomass production of sorghum and sunn hemp reached more than 750 g m−2 and 350 g m−2 fresh and dry weight, which resulted in effective weed suppression. Cover crops with high biomass production enhance soil structure and nutrient cycling and decrease weed emergence [35,36]. The biomass output of sorghum and sunn hemp exceeded the 6000 kg ha−1 threshold established by Weisberger et al. [33] and Nichols et al. [37], which resulted in substantial weed density reduction. The weed suppression from soybean biomass reached approximately 250 g m−2 fresh weight. The results indicate that weed control remains possible through canopy growth when biomass levels fall within an intermediate range. The weed suppression capabilities of green gram, hibiscus, and pearl millet were restricted because their biomass production remained below 150 g m−2. Low-biomass cover crops failed to suppress weeds effectively due to inadequate canopy closure and insufficient shading [8,38].

4.3. Weed Population and Biomass

4.3.1. Weed Count

The different cover crop species showed varying weed density levels. The rapid growth of sorghum, sunn hemp and soybean, together with their dense canopy cover, resulted in weed counts below 7 weeds m−2. Fast-growing species with dense canopies effectively blocked weed emergence [39,40]. The weed counts in hibiscus, pearl millet and green gram beds ranged between 14 and 0 weeds m−2. The slower growth rates and weaker shading capabilities of these species permitted weeds to establish themselves. Low-biomass or slow-growing cover crops failed to control weeds effectively because of the insufficient canopy closure [41,42].

4.3.2. Weed Biomass

The weed biomass data followed the same pattern as weed count measurements. The lowest biomass values were recorded in sorghum and sunn hemp at 2-6 g m−2. The tall plant growth and high biomass production of these species may have contributed to weed suppression through competitive resource capture. Research has demonstrated that taller cover crops that establish an early canopy are more likely to suppress weed growth by competing for light and resources [31,34]. The highest weed biomass (19–22 g m−2) was observed in hibiscus and pearl millet, which exhibited lower overall biomass production. These results align with studies that show cover crop competitiveness is associated with greater aboveground biomass and height [39,43].

4.4. Soil Volumetric Water Content (VWC) and Electrical Conductivity (EC)

Soil moisture levels differed between the various cover crop species. The volumetric water content (VWC) of soybean reached its highest point at approximately 22%. The combination of moderate canopy shading and reduced transpiration in this crop likely contributed to soil moisture preservation. Early terminated legumes, such as soybean, enhance dryland soil water retention [44,45]. The volumetric water content measurements for green gram and pearl millet were among the highest. The dense plant stands together with their fibrous root systems probably enhanced water infiltration while minimizing runoff. Plant species with dense canopies and fine root systems maintained higher soil moisture levels because they minimized evaporation [46]. The volumetric water content of sunn hemp reached its lowest point at approximately 14%. The plant’s strong growth rate, together with its high-water consumption requirements, might explain this result. Some studies documented that fast-growing legumes consume soil moisture at a faster rate when conditions are warm and evapotranspiration is high [45,47].
The electrical conductivity (EC) measurements across treatments demonstrated variations because of different nutrient cycling patterns and salt movement dynamics. Soybean displayed the highest electrical conductivity measurement at 0.09 dS m−1, while green gram and Sorghum followed in sequence. The results support Freidenreich [48], who found that legume cover crops increase soil nitrogen and organic carbon, which leads to elevated EC through microbial processes and nutrient release. The lowest EC values of 0.04–0.05 dSm−1 were observed in sunn hemp and pearl millet, which indicates their potential to decrease salinity. The deep root system of pearl millet, combined with its drought tolerance and its ability to thrive in saline soils [49,50], could promote leaching processes that reduce salt accumulation. The worldwide analysis conducted by Yan and Arthur [51] revealed that cover crop effects on EC vary depending on specific conditions without establishing a uniform pattern between studies.

4.5. Soil Physicochemical Properties

Background soil samples from the six experimentally raised beds showed baseline soil characteristics presented in 2. These beds were used in a previous experiment with vermicompost [16], causing an initial soil variability. The post-harvest soil chemical analysis revealed substantial variations in N, P, K, and cation exchange capacity (CEC) among the treatments (Table 2). The Hibiscus treatment showed the highest total N content, which exceeded the levels found in green gram, indicating better N retention through decomposition of biomass and root activity. A few studies also demonstrated improved nitrogen availability when cover crops were used [52,53,54]. Total carbon and organic matter (OM) differed significantly, with pearl millet recording the highest values, followed by sunn hemp and soybean. The results demonstrate that both leguminous and non-leguminous cover crops play a role in carbon stabilization. Few researchers observed that multiple years of cover crop implementation are typically needed to achieve significant increases in OM and microbial biomass carbon [3,55]. The results of Rigon et al. [56] and Ma et al. [3] support the conclusion that cover crops improve soil aggregation and mineralization processes, which increase CEC. The high P levels in hibiscus soil can be attributed to P mobilization through root exudates and microbial activity [57]. Soybean and sunn hemp also contributed substantial P. The highest potassium levels were measured under soybean treatment because of its efficient potassium uptake and recycling processes [4,48].
The micronutrients Ca and Zn showed no significant differences between treatments. Sunn hemp and soybean maintained higher Ca and Mg levels, which indicates their ability to support micronutrient availability. The research of Khatoon et al. [58] and Jiang et al. [59] showed that cover crops and their microbial activity have similar effects on micronutrient mobilization. The Na content was highest in sorghum, sunn hemp and soybean, which could be linked to variations in biomass composition and decomposition patterns as described by Freidenreich [60] and Baloch et al. [61]. This research identified species-specific effects on short-term soil nutrient dynamics of six summer cover crops. While single-season results are not sufficient to prove soil fertility improvement, these findings provide baseline information for species selection in subtropical organic production and need to be evaluated over multiple seasons for cumulative soil improvements as reported in other cover crop studies [4,62,63,64,65].

4.6. Plant Nutrient Composition

Cover crops showed broad variations in their tissue composition of macronutrients between different species. Sunn hemp, soybean and hibiscus displayed the highest N content, where sunn hemp reached the highest level (3.63%). The plant’s ability to fix atmospheric nitrogen and its significant impact on soil nitrogen storage, Arruda et al. [66], explains this result. The high N content in soybean and sunn hemp demonstrates their ability to perform biological nitrogen fixation and enhance organic matter accumulation. While hibiscus showed a higher tissue N concentration (3.41%) than green gram and soybean, as a non-legume, this may not indicate superior N uptake but likely reflects N uptake in low biomass. According to Ma et al. [3], in their meta-analyses, it was found that legume–non-legume mixtures enhanced soil N, P, and K availability by 13.1%, 15.6%, and 12.4%, respectively. Sunn hemp and soybean contained the highest Ca levels, which indicates these plants could serve as calcium sources for calcareous soils found in South Florida. The nutrient scavenging abilities of pearl millet and hibiscus were confirmed by their high K and Mg accumulation, which makes them suitable for sandy soil environments [57,67,68]. The P and S content in hibiscus was higher than in other plants because these elements play crucial roles in energy transfer and protein synthesis. The research demonstrates how cover crops enhance soil fertility through biomass recycling and nutrient cycling while providing specific advantages based on their individual characteristics [4,69].
The different plant species demonstrated varying micronutrient uptake patterns, with hibiscus, sunn hemp, and soybean showing the highest levels of Fe, B, Mn, and Zn in plant tissues. The Zn concentration in soybean reached its highest point at 156.6 ppm, which is a vital component for enzyme activation and root development. Pearl millet’s elevated Na uptake (2777 ppm) reflects its salt tolerance and ability to accumulate Na in saline soils [70], but such accumulation may degrade soil structure through clay dispersion and reduced infiltration, requiring calcium-based amendments to prevent sodicity [71]. The highest B and S uptake occurred in hibiscus, as it demonstrates superior micronutrient acquisition abilities. The findings match those of Couëdel et al. [72], who demonstrated that crucifer–legume mixtures enhance both macro- and micronutrient uptake through niche complementarity and facilitation. Sunn hemp and hibiscus accumulated higher amounts of Fe and Mn in plant tissues, which supports their function of improving soil micronutrient levels that are essential for chlorophyll production and photosynthetic performance [73]. The lack of significant Cu accumulation differences between treatments did not diminish the overall micronutrient enrichment observed in legumes, which demonstrates their capability to decrease micronutrient deficiencies in subtropical soils [74,75].

5. Conclusions

The field experiment showed that cover crops differ markedly in their ability to establish, produce biomass, suppress weeds, and influence soil properties under subtropical conditions. Sorghum and sunn hemp were most effective for biomass production and weed suppression, while soybean provided additional benefits by conserving soil moisture and contributing to nutrient enrichment. In contrast, hibiscus, pearl millet, and green gram produced less biomass and canopy cover, which limited their ability to suppress weeds, although each offered selective advantages such as nutrient scavenging or nitrogen retention. The six cover crops differed noticeably in their nutrient cycling, with hibiscus enhancing soil nitrogen and phosphorus, soybean improving potassium, and sunn hemp contributing to both macronutrients and micronutrients such as calcium and magnesium. Nutrient composition within plant tissues further highlighted functional differences, with legumes such as sunn hemp, soybean, and hibiscus enriching nitrogen and key micronutrients, while non-legumes like pearl millet supported carbon stabilization.
These results indicate that no individual cover crop species provided all the expected benefits, and each species displayed unique attributes. These complementary traits should be further evaluated in species rotations and mixtures to potentially balance weed suppression, nutrient provision, and water use in subtropical cover crops. This may help build more resilient and robust cover crop systems in subtropical environments.

Author Contributions

Conceptualization, M.S.B.B.; methodology, M.S.B.B.; software, D.S.G.; validation, D.S.G.; formal analysis, D.S.G.; investigation, D.S.G., resources, M.S.B.B.; data curation, D.S.G., B.O., D.P. and P.B.E.O.; writing—D.S.G., B.O., D.P. and P.B.E.O.; writing—review and editing, D.S.G., M.S.B.B.; visualization, D.S.G.; supervision, M.S.B.B.; project administration, M.S.B.B.; funding acquisition, M.S.B.B. All authors have read and agreed to the published version of the manuscript.

Funding

This research was supported by the funding provided through USDA-NRCS and USDA-NIFA grants under designated award numbers NR224209 XXXXG001; AWD13273, NR233 A750011 G026; AWD15131; 2023-70001-40999, 2023-77040-41154, 25010-84552-1; PO 4500167774.

Data Availability Statement

The data presented in this study are available on request from the corresponding author.

Acknowledgments

The authors would like to thank Ivan Oyege for his scholarly discussions and valuable insights that greatly contributed to the development of this article.

Conflicts of Interest

The authors declare no conflicts of interest.

References

  1. Farmaha, B.S.; Sekaran, U.; Franzluebbers, A.J. Cover cropping and conservation tillage improve soil health in the southeastern United States. Agron. J. 2022, 114, 296–316. [Google Scholar] [CrossRef]
  2. Wiener, S.S.; Álvarez-Berríos, N.L.; Lindsey, A.B. Opportunities and challenges for hurricane resilience on agricultural and forest land in the U.S. Southeast and Caribbean. Sustainability 2020, 12, 1364. [Google Scholar] [CrossRef]
  3. Ma, J.; Yin, B.; Gao, T.; He, K.; Huang, X.; Jiang, T.; Zhen, W. Legume–Non-Legume Cover Crop Mixtures Enhance Soil Nutrient Availability and Physical Properties: A Meta-Analysis Across Chinese Agroecosystems. Agronomy 2025, 15, 1756. [Google Scholar] [CrossRef]
  4. Scavo, A.; Fontanazza, S.; Restuccia, A.; Pesce, G.R.; Abbate, C.; Mauromicale, G. The role of cover crops in improving soil fertility and plant nutritional status in temperate climates. A review. Agron. Sustain. Dev. 2022, 42, 93. [Google Scholar] [CrossRef]
  5. Villat, J.; Nicholas, K.A. Quantifying soil carbon sequestration from regenerative agricultural practices in crops and vineyards. Front. Sustain. Food Syst. 2023, 7, 1234108. [Google Scholar] [CrossRef]
  6. Zhang, K.; Liu, Z.; McCarl, B.A.; Fei, C.J. Enhancing agricultural soil carbon sequestration: A review with some research needs. Climate 2024, 12, 151. [Google Scholar] [CrossRef]
  7. Li, G.; Ren, A.; Anwar, S.; Shi, L.; Bai, W.; Zhang, Y.; Gao, Z. Optimizing Soil Health and Sorghum Productivity through Crop Rotation with Quinoa. Life 2024, 14, 745. [Google Scholar] [CrossRef] [PubMed]
  8. Dong, F.; Zeng, W. Effects of fall and winter cover crops on weed suppression in the United States: A meta-analysis. Sustainability 2024, 16, 3192. [Google Scholar] [CrossRef]
  9. Chaturvedi, P.; Govindaraj, M.; Govindan, V.; Weckwerth, W. Sorghum and pearl millet as climate resilient crops for food and nutrition security. Front. Plant Sci. 2022, 13, 851970. [Google Scholar] [CrossRef] [PubMed]
  10. Blanco, H. Economics of cover crops. Crops Soils 2023, 56, 4–13. [Google Scholar] [CrossRef]
  11. Ficks, T.S.; Karsten, H.D.; Wallace, J.M. Delayed cover-crop termination and reduced herbicide inputs produce trade-offs in soybean phase of US Northeast forage-grain rotation. Weed Technol. 2023, 37, 132–140. [Google Scholar] [CrossRef]
  12. Bernier Brillon, J.; Lucotte, M.; Bernier, A.; Fontaine, M.; Moingt, M. Using cover crops as means of controlling weeds and reducing the applied quantity of glyphosate-based herbicide in no-till glyphosate tolerant soybean and corn. Agriculture 2024, 14, 659. [Google Scholar] [CrossRef]
  13. Beattie, G.A.; Cotrufo, F.M.; Crowther, T.W.; Edlund, A.; Salles, J.F.; Gilbert, J.A.; Jansson, J.K.; Jensen, P.R.; Lennon, J.T.; Makhalanyane, T. Soil microbial strategies for climate mitigation—Report from a climate action workshop in Las Vegas, Nevada, February 2024. Sustain. Microbiol. 2024, 1, qvae033. [Google Scholar] [CrossRef]
  14. Biswas, P.; Mondal, S.; Maji, S.; Mondal, A.; Bandopadhyay, P. Microclimate modification in field crops: A way toward climate-resilience. In Climate-Resilient Agriculture, Vol 1: Crop Responses and Agroecological Perspectives; Springer: Berlin/Heidelberg, Germany, 2023; pp. 647–666. [Google Scholar] [CrossRef]
  15. Wallander, S.; Smith, D.; Bowman, M.; Claassen, R. Cover Crop Trends, Programs, and Practices in the United States; AgEcon Search: St. Paul, MN, USA, 2021. [Google Scholar] [CrossRef]
  16. Oyege, I.; Balaji Bhaskar, M.S. Evaluation of vermicompost and vermicompost tea application on corn (Zea mays) growth and physiology using optical plant sensors. J. Plant Nutr. 2025, 48, 1275–1293. [Google Scholar] [CrossRef]
  17. Belbase, P.; Jayachandran, K.; Balaji Bhaskar, M.S. Assessment of Soil and Plant Nutrient Status, Spectral Reflectance, and Growth Performance of Various Dragon Fruit (Pitaya) Species Cultivated Under High Tunnel Systems. Soil Syst. 2025, 9, 75. [Google Scholar] [CrossRef]
  18. National Weather Service. National and Oceanic Atmospheric Administration. 2024. Available online: https://www.weather.gov/news (accessed on 5 May 2026).
  19. Solly, E.F.; Weber, V.; Zimmermann, S.; Walthert, L.; Hagedorn, F.; Schmidt, M.W. A critical evaluation of the relationship between the effective cation exchange capacity and soil organic carbon content in Swiss forest soils. Front. For. Glob. Change 2020, 3, 98. [Google Scholar] [CrossRef]
  20. Singh, M.S.; Devi, T.T. Field study on soil organic matter content in inundation areas of Langol Catchment by “loss-on-ignition” method. In River Dynamics and Flood Hazards: Studies on Risk and Mitigation; Springer: Singapore, 2022; pp. 385–409. [Google Scholar] [CrossRef]
  21. Locke-Rodriguez, J.; Troxler, T.; Sukop, M.C.; Scinto, L.; Jayachandran, K. Floating flowers: Screening cut-flower species for production and phytoremediation on floating treatment wetlands in South Florida. Environ. Adv. 2023, 13, 100405. [Google Scholar] [CrossRef]
  22. Gaudino, S.; Galas, C.; Belli, M.; Barbizzi, S.; de Zorzi, P.; Jaćimović, R.; Jeran, Z.; Pati, A.; Sansone, U. The role of different soil sample digestion methods on trace elements analysis: A comparison of ICP-MS and INAA measurement results. Accredit. Qual. Assur. 2007, 12, 84–93. [Google Scholar] [CrossRef]
  23. Girden, E.R. ANOVA: Repeated Measures; Sage University Papers Series on Quantitative Applications in the Social Sciences, No. 84; Sage Publications: Newbury Park, CA, USA, 1992; Chapter vi; 77p. [Google Scholar] [CrossRef]
  24. Tukey, J.W. Comparing individual means in the analysis of variance. Biometrics 1949, 5, 99–114. [Google Scholar] [CrossRef]
  25. Demissie, S.; Meshesha, D.T.; Adgo, E.; Haregeweyn, N.; Tsunekawa, A.; Ebabu, K.; Mulualem, T.; Fekadu, G.; Tiruneh, G.A. Cover crops improve soil condition and barley yield in a subtropical highland agroecosystem. Nutr. Cycl. Agroecosyst. 2024, 129, 257–275. [Google Scholar] [CrossRef]
  26. Scianna, J.; Zentner, D.; Pokorny, M.; Majeski, M.; Noack, R. Impact of Cover Crop Seeding Rate on Stand Establishment and Aboveground Biomass Production; USDA Final Study Report; USDA: Washington, DC, USA, 2022; pp. 1–9. Available online: https://www.nrcs.usda.gov/plantmaterials/mtpmcsr13926.pdf (accessed on 5 May 2026).
  27. Bhandari, H.; Shivakumar, K.; Kar, C.; Bera, A.; Meena, J. Sunn hemp: A climate-smart crop. In Developing Climate Resilient Grain and Forage Legumes; Springer: Singarpore, 2022; pp. 277–296. [Google Scholar] [CrossRef]
  28. Lamichhane, J.R.; Debaeke, P.; Steinberg, C.; You, M.P.; Barbetti, M.J.; Aubertot, J.-N. Abiotic and biotic factors affecting crop seed germination and seedling emergence: A conceptual framework. Plant Soil 2018, 432, 1–28. [Google Scholar] [CrossRef]
  29. Uchino, H.; Iwama, K.; Jitsuyama, Y.; Ichiyama, K.; Sugiura, E.; Yudate, T. Stable characteristics of cover crops for weed suppression in organic farming systems. Plant Prod. Sci. 2011, 14, 75–85. [Google Scholar] [CrossRef]
  30. Torun, H. The use of cover crop for weed suppression and competition in limited-irrigation vineyards. Phytoparasitica 2024, 52, 10. [Google Scholar] [CrossRef]
  31. Florence, A.; Higley, L.G.; Drijber, R.; Francis, C.A.; Lindquist, J.L. Cover crop mixture diversity, biomass productivity, weed suppression, and stability. PLoS ONE 2019, 14, e0206195. [Google Scholar] [CrossRef]
  32. Nelson, A.; Pswarayi, A.; Quideau, S.; Frick, B.; Spaner, D. Yield and weed suppression of crop mixtures in organic and conventional systems of the western Canadian prairie. Agron. J. 2012, 104, 756–762. [Google Scholar] [CrossRef]
  33. Weisberger, D.A.; Bastos, L.M.; Sykes, V.R.; Basinger, N.T. Do cover crops suppress weeds in the US Southeast? A meta-analysis. Weed Sci. 2023, 71, 244–254. [Google Scholar] [CrossRef]
  34. Zannopoulos, S.; Gazoulis, I.; Kokkini, M.; Antonopoulos, N.; Kanatas, P.; Kanetsi, M.; Travlos, I. The Potential of Three Summer Legume Cover Crops to Suppress Weeds and Provide Ecosystem Services—A Review. Agronomy 2024, 14, 1192. [Google Scholar] [CrossRef]
  35. Gentsch, N.; Riechers, F.L.; Boy, J.; Schweneker, D.; Feuerstein, U.; Heuermann, D.; Guggenberger, G. Cover crops improve soil structure and change organic carbon distribution in macroaggregate fractions. Soil 2024, 10, 139–150. [Google Scholar] [CrossRef]
  36. Barroso, J.; Reardon, C.L.; Singh, S.; Machado, S.; Gourlie, J.A.; Namdar, G.F.; Oreja, F.H.; Pritchett, L.C.; Kriete, L.; Calderon, F.J.; et al. Biomass production, weed suppression, and soil water use of cover crops in dryland wheat production systems. Agron. J. 2025, 117, e70053. [Google Scholar] [CrossRef]
  37. Nichols, V.; Martinez–Feria, R.; Weisberger, D.; Carlson, S.; Basso, B.; Basche, A. Cover crops and weed suppression in the US Midwest: A meta–analysis and modeling study. Agric. Environ. Lett. 2020, 5, e20022. [Google Scholar] [CrossRef]
  38. Bilenky, M.T.; Nair, A.; McDaniel, M.D. Effect of summer cover crops on cabbage yield, weed suppression, and N mineralization in a low input cropping system. Front. Sustain. Food Syst. 2022, 6, 1021639. [Google Scholar] [CrossRef]
  39. Baraibar, B.; Hunter, M.C.; Schipanski, M.E.; Hamilton, A.; Mortensen, D.A. Weed suppression in cover crop monocultures and mixtures. Weed Sci. 2018, 66, 121–133. [Google Scholar] [CrossRef]
  40. Dhanda, S.; Kumar, V.; Dille, J.A.; Obour, A.; Yeager, E.A.; Holman, J. Effect of fall-planted cover crops on weed suppression, grain sorghum yield, and profitability in the semiarid Central Great Plains. Weed Sci. 2025, 73, e24. [Google Scholar] [CrossRef]
  41. Gerhards, R.; Schumacher, M.; Merkle, M.; Malik, W.A.; Piepho, H.P. A new approach for modelling weed suppression of cover crops. Weed Res. 2024, 64, 219–226. [Google Scholar] [CrossRef]
  42. Gfeller, A.; Herrera, J.M.; Tschuy, F.; Wirth, J. Explanations for Amaranthus retroflexus growth suppression by cover crops. Crop Prot. 2018, 104, 11–20. [Google Scholar] [CrossRef]
  43. McKenzie-Gopsill, A.; Mills, A.; MacDonald, A.N.; Wyand, S. The importance of species selection in cover crop mixture design. Weed Sci. 2022, 70, 436–447. [Google Scholar] [CrossRef]
  44. Zhang, H.; Ghahramani, A.; Ali, A.; Erbacher, A. Cover cropping impacts on soil water and carbon in dryland cropping system. PLoS ONE 2023, 18, e0286748. [Google Scholar] [CrossRef]
  45. Garba, I.I.; Bell, L.W.; Williams, A. Cover crop legacy impacts on soil water and nitrogen dynamics, and on subsequent crop yields in drylands: A meta-analysis. Agron. Sustain. Dev. 2022, 42, 34. [Google Scholar] [CrossRef]
  46. Kokila, A.; Nagarajaiah, C.; Hanumanthappa, D.; Shivanna, B.; Sathish, K.; Mahadevamurthy, M. Effect of tree canopy cover on soil moisture dynamics in different agroforestry systems under semi-arid condition. Int. J. Environ. Clim. Change 2024, 14, 485–495. [Google Scholar] [CrossRef]
  47. Dabney, S.M.; Delgado, J.A.; Reeves, D.W. Using winter cover crops to improve soil and water quality. Commun. Soil Sci. Plant Anal. 2001, 32, 1221–1250. [Google Scholar] [CrossRef]
  48. Freidenreich, A.; Dattamudi, S.; Li, Y.; Jayachandran, K. Influence of leguminous cover crops on soil chemical and biological properties in a no-till tropical fruit orchard. Land 2022, 11, 932. [Google Scholar] [CrossRef]
  49. Shrestha, N.; Hu, H.; Shrestha, K.; Doust, A.N. Pearl millet response to drought: A review. Front. Plant Sci. 2023, 14, 1059574. [Google Scholar] [CrossRef] [PubMed]
  50. Daduwal, H.S.; Bhardwaj, R.; Srivastava, R.K. Pearl millet a promising fodder crop for changing climate: A review. Theor. Appl. Genet. 2024, 137, 169. [Google Scholar] [CrossRef]
  51. Yan, F.; Arthur, E. Cover crops alter soil physicochemical properties: A global meta-analysis. Geoderma 2025, 460, 117436. [Google Scholar] [CrossRef]
  52. Sant'Anna, S.; Martins, M.; Goulart, J.; Araújo, S.; Araújo, E.; Zaman, M.; Jantalia, C.; Alves, B.; Boddey, R.M.; Urquiaga, S. Biological nitrogen fixation and soil N2O emissions from legume residues in an Acrisol in SE Brazil. Geoderma Reg. 2018, 15, e00196. [Google Scholar] [CrossRef]
  53. Tenelli, S.; Otto, R.; de Castro, S.A.Q.; Sánchez, C.E.B.; Sattolo, T.M.S.; Kamogawa, M.Y.; Pagliari, P.H.; Carvalho, J.L.N. Legume nitrogen credits for sugarcane production: Implications for soil N availability and ratoon yield. Nutr. Cycl. Agroecosyst. 2019, 113, 307–322. [Google Scholar] [CrossRef]
  54. White, K.E.; Brennan, E.B.; Cavigelli, M.A.; Smith, R.F. Winter cover crops increased nitrogen availability and efficient use during eight years of intensive organic vegetable production. PLoS ONE 2022, 17, e0267757. [Google Scholar] [CrossRef]
  55. Nyabami, P.; Weinrich, E.; Maltais–Landry, G.; Lin, Y. Three years of cover crops management increased soil organic matter and labile carbon pools in a subtropical vegetable agroecosystem. Agrosyst. Geosci. Environ. 2024, 7, e20454. [Google Scholar] [CrossRef]
  56. Rigon, J.; Franzluebbers, A.; Calonego, J. Soil aggregation and potential carbon and nitrogen mineralization with cover crops under tropical no-till. J. Soil Water Conserv. 2020, 75, 601–609. [Google Scholar] [CrossRef]
  57. Hallama, M.; Pekrun, C.; Lambers, H.; Kandeler, E. Hidden miners–the roles of cover crops and soil microorganisms in phosphorus cycling through agroecosystems. Plant Soil 2019, 434, 7–45. [Google Scholar] [CrossRef]
  58. Khatoon, Z.; Huang, S.; Rafique, M.; Fakhar, A.; Kamran, M.A.; Santoyo, G. Unlocking the potential of plant growth-promoting rhizobacteria on soil health and the sustainability of agricultural systems. J. Environ. Manag. 2020, 273, 111118. [Google Scholar] [CrossRef] [PubMed]
  59. Jiang, D.; Wu, C.; Wang, S.; Zhang, Y.; Chen, Z.; Jiang, N.; Zhang, Y.; Xie, H. Vermicompost derived from mushroom residues improves soil C/P cycling, bacterial community, and fungal abundance. GCB Bioenergy 2023, 15, 1437–1449. [Google Scholar] [CrossRef]
  60. Freidenreich, A. Developing Sustainable Soil Building Strategies for Tropical Fruit Groves within the South Florida Redland. Ph.D. Dissertation, Florida International University, Miami, FL, USA, 2021. [Google Scholar] [CrossRef]
  61. Baloch, S.B.; Ali, S.; Bernas, J.; Konvalina, P.; Naveed, M.; Baloch, F.B.; Jamali, Z.H.; Lošák, T.; Roubík, H.; Ghafoor, A.; et al. Crop Residue Management for Soil Health and Environmental Sustainability: A Comprehensive Review. J. Soil Sci. Plant Nutr. 2025, 25, 7808–7828. [Google Scholar] [CrossRef]
  62. Fageria, N.K.; Baligar, V.C.; Bailey, B.A. Role of cover crops in improving soil and row crop productivity. Commun. Soil Sci. Plant Anal. 2005, 36, 2733–2757. [Google Scholar] [CrossRef]
  63. Sharma, P.; Singh, A.; Kahlon, C.S.; Brar, A.S.; Grover, K.K.; Dia, M.; Steiner, R.L. The role of cover crops towards sustainable soil health and agriculture—A review paper. Am. J. Plant Sci. 2018, 9, 1935–1951. [Google Scholar] [CrossRef]
  64. Quintarelli, V.; Radicetti, E.; Allevato, E.; Stazi, S.R.; Haider, G.; Abideen, Z.; Bibi, S.; Jamal, A.; Mancinelli, R. Cover crops for sustainable cropping systems: A review. Agriculture 2022, 12, 2076. [Google Scholar] [CrossRef]
  65. Seepaul, R.; George, S.; Love, J.; Wright, D.; Mackowiak, C.; Blount, A. Managing Cover Crops for Improved Soil Health: SS-AGR-272/AG277, rev. 1/2023. Agronomy 2023, 2023, 1. [Google Scholar] [CrossRef]
  66. Arruda, E.M.; Collier, L.S.; Oliveira, K.R.; Flores, R.A.; Barros, L.R.; Ferraz-Almeida, R.; Nascimento, B.B.; Santos, M.P.; Duarte, T.C.; Andrade, C.A.O. Cover plants can contribute on macronutrient accumulation in agroforestry systems during off-season. Agrofor. Syst. 2023, 97, 1087–1096. [Google Scholar] [CrossRef]
  67. Jukanti, A.; Gowda, C.L.; Rai, K.; Manga, V.K.; Bhatt, R. Crops that feed the world 11. Pearl Millet (Pennisetum glaucum L.): An important source of food security, nutrition and health in the arid and semi-arid tropics. Food Secur. 2016, 8, 307–329. [Google Scholar] [CrossRef]
  68. Ambati, K.; Sucharitha, K. Pearl Millet: Biology, Functional Potential and Sustainable Utilization: Major Millets. In Millets: The Multi-Cereal Paradigm for Food Sustainability; Springer Nature: Cham, Switzerland, 2024; pp. 57–73. Available online: https://link.springer.com/chapter/10.1007/978-3-031-64237-1_4 (accessed on 5 May 2026).
  69. Wendling, M.; Büchi, L.; Amossé, C.; Sinaj, S.; Walter, A.; Charles, R. Influence of root and leaf traits on the uptake of nutrients in cover crops. Plant Soil 2016, 409, 419–434. [Google Scholar] [CrossRef]
  70. Abo-Elyousr, K.A.; Mousa, M.A.; Ibrahim, O.H.; Alshareef, N.O.; Eissa, M.A. Calcium-rich biochar stimulates salt resistance in pearl millet (Pennisetum glaucum L.) plants by improving soil quality and enhancing the antioxidant defense. Plants 2022, 11, 1301. [Google Scholar] [CrossRef]
  71. Horneck, D.A.; Ellsworth, J.W.; Hopkins, B.G.; Sullivan, D.M.; Stevens, R.G. Managing Salt-Affected Soils for Crop Production; Pacific Northwest Extension Publication PNW 601-E; Oregon State University Extension Service: Corvallis, OR, USA, 2007; 21p, Available online: https://ir.library.oregonstate.edu/concern/administrative_report_or_publications/pr76f371k (accessed on 5 May 2026).
  72. Couëdel, A.; Alletto, L.; Justes, E. The acquisition of macro-and micronutrients is synergistic in species mixtures: Example of mixed crucifer-legume cover crops. Front. Agron. 2023, 5, 1223639. [Google Scholar] [CrossRef]
  73. Colombo, C.; Palumbo, G.; He, J.-Z.; Pinton, R.; Cesco, S. Review on iron availability in soil: Interaction of Fe minerals, plants, and microbes. J. Soils Sediments 2014, 14, 538–548. [Google Scholar] [CrossRef]
  74. Tubaña, B.; Fajardo, H.; Forestieri, D. Sensor-based prediction of cover crops biomass and nutrient recovery. La. Agric. 2020, 63, 1607957504073. [Google Scholar]
  75. Sharma, N.; Kumar, R.; Singh, A.; Sharma, R.; Sharma, P.; Mecarty, J.S.; Farooq, F. Legumes in Cropping System for Soil Ecosystem Improvement: A Review. Legume Res. Int. J. 2025, 48, 1–9. [Google Scholar] [CrossRef]
Figure 1. The average plant density and height of summer cover crop treatments.
Applsci 16 04815 g001
Figure 2. Fresh and dry biomass accumulation of summer cover crop treatments.
Applsci 16 04815 g002
Figure 3. Weed density and biomass under different summer cover crop treatments.
Applsci 16 04815 g003
Figure 4. Volumetric water content (VWC) and electrical conductivity (EC) under summer cover crop treatments.
Applsci 16 04815 g004
Table 1. Seeding specifications and plant establishment details of cover crops.
Cover CropSeeding Rate
(kg ha−1)
Plant Spacing
(cm)
Row Spacing
(cm)
Planting Depth
(cm)
Optimal Density
(Plants m−2)
Establishment (%)
Green gram17–205–730–402.5–45096
Hibiscus8–1220–3045–601.51575
Sorghum40–5013–1545–602–41580
Soybean45–5520–3040–502.5–51057
Sunn hemp35–5515–2015–202.53591
Pearl millet11–157–1050–601.25–2.52592
Table 2. Pre-plant and post-harvest soil chemical properties under different summer cover crop treatments.
Treatments% Total
N
% Total C% OMCEC (MEq 100 g−1)P
(ppm)
K
(ppm)
Ca
(%)
Mg
(ppm)
Zn
(ppm)
Na
(ppm)
Background soil0.712.622.522.1102.387.260.23403.59.7541.2
T1: Green gram0.41 b10.6 ab18.3 ab14.8 a56.6 b25.85 ab0.25 a302.9 b6.11 a15.6 b
T2: Hibiscus0.51 a10.9 ab18.9 ab16.1 a94.9 a26.66 ab0.26 a364.5 a9.70 a16.5 ab
T3: Sorghum0.45 ab10.8 ab18.6 ab15.6 a81.4 ab22.0 b0.25 a338.8 ab7.79 a18.8 a
T4: Soybean0.45 ab10.7 ab18.5 ab15.0 a77.8 ab35.12 a0.25 a320.8 ab9.03 a17.5 ab
T5: Sunn hemp0.45 ab10.3 b17.7 b15.7 a65.7 ab24.90 ab0.26 a347.4 ab7.60 a17.5 ab
T6: Pearl millet0.45 ab11.1 a19.2 a15.7 a65.1 ab16.45 b0.26 a330.6 ab6.33 a16.3 ab
Note: Background soil sample values represent the mean of six raised beds (n = 6) sampled before cover crop planting. For each column, treatments with different letter groupings are significantly different at p < 0.05. Treatments sharing a letter are not significantly different.
Table 3. Macronutrient concentrations and accumulation in above-ground plant tissues under different summer cover crop treatments.
TreatmentsNCaKMgPS
%kg ha−1%kg ha−1%kg ha−1%kg ha−1%kg ha−1%kg ha−1
T1: Green gram2.25 d11.72.02 bc10.50.23 c1.20.41 b2.10.16 b0.80.16 c0.8
T2: Hibiscus3.41 ab15.83.03 ab14.01.02 a4.70.47 b2.20.58 a2.70.31 a1.4
T3: Sorghum2.87 bc146.90.96 c49.10.90 ab46.10.45 b23.00.36 ab18.40.10 e5.1
T4: Soybean3.18 ab38.63.20 ab38.90.53 c6.40.63 b7.60.30 b3.60.15 cd1.8
T5: Sunn hemp3.63 a118.93.57 a116.90.59 bc19.30.65 b21.30.23 b7.50.13 d4.3
T6: Pearl millet2.57 cd12.91.10 c5.51.27 a6.41.03 a5.20.40 ab2.00.25 b1.3
For each column, treatments with different letter groupings are significantly different at p < 0.05. Treatments sharing a letter are not significantly different.
Table 4. Micronutrient concentrations and accumulation in above-ground plant tissues under different summer cover crop treatments.
TreatmentsNa Fe B MnZnCu
(ppm)g ha−1(ppm)g ha−1(ppm)g ha−1(ppm)g ha−1(ppm)g ha−1(ppm)g ha−1
T1: Green gram90.1 b46.949.0 b25.525.4 cd13.212.2 c6.446.60 b24.34.34 a2.3
T2: Hibiscus95.1 b44.088.1 a40.867.1 a31.125.2 ab11.776.7 b35.54.99 a2.3
T3: Sorghum90.1 b461.184.3 ab431.48.8 d45.012.4 c63.555.9 b286.14.82 a24.7
T4: Soybean90.1 b109.472.2 ab87.756.4 ab68.528.6 a34.7156.6 a190.15.67 a6.9
T5: Sunn hemp90.1 b295.187.8 a287.541.7 bc136.620.3 b66.548.4 b158.57.01 a23.0
T6: Pearl millet2777.0 a1388.585.9 a43.08.4 d4.210.8 c5.461.2 b30.64.13 a2.1
For each column, treatments with different letter groupings are significantly different at p < 0.05. Treatments sharing a letter are not significantly different.
Disclaimer/Publisher’s Note: The statements, opinions and data contained in all publications are solely those of the individual author(s) and contributor(s) and not of MDPI and/or the editor(s). MDPI and/or the editor(s) disclaim responsibility for any injury to people or property resulting from any ideas, methods, instructions or products referred to in the content.