1. Introduction
Excessive CO
2 (carbon dioxide) emissions will aggravate global warming and threaten the sustainable development of the whole society [
1]. It is necessary to reduce CO
2 emissions, especially in the transport sector, which accounts for about 25% of global CO
2 emissions [
2]. The transport sector has great potential for carbon emission reduction. However, the issue of transport CO
2 emissions has received insufficient attention in the urban transport development process.
With the acceleration of global urbanization, urban travel demand has continued to increase in recent years. The growing tension between travel demand and limited road resources has led to issues such as traffic congestion, air pollution, and energy waste [
3]. Prioritizing the development of public transport is an important way to alleviate these problems [
4]. Because there are major differences in the performance of various transport modes in terms of energy conservation and emission reduction. The average energy consumption and CO
2 emissions of private cars are more than 10 times those of buses and approximately 20 times those of urban rail transit [
5].
At present, passengers tend to choose more convenient and comfortable transport modes to meet their travel demands, and the government is committed to building a modern urban transport system that is more efficient and environmentally friendly. How to balance the relationship between meeting residents’ travel demands and achieving carbon emission reduction is a practical challenge in urban transport development. In fact, public transport plays a crucial role in urban transport [
6]. In particular, urban rail transit has the advantages of efficiency, punctuality, safety, and environmental protection. It effectively alleviates traffic congestion and fosters the development of a sustainable transport system. The government is committed to promoting the development of rail transit by implementing the policy of switching from road to rail transit, making urban rail transit development plans, and so on.
Reasonable urban transport structures play a significant role in low-carbon transport. Optimizing the transport structure is an effective measure for promoting the achievement of carbon emission reduction goals [
7]. In this paper, we propose a multi-objective optimization model to construct a more rational urban transport structure and explore the potential for carbon emission reduction. We seek to optimize transport CO
2 emissions, travel costs, travel quality, and the utilization rate of public transport operation lines based on meeting the constraints of travel demand, accessibility, energy consumption, transport land, normalization and non-negativity constraints, and range, striving to achieve a balance among multiple objective functions. The improved non-dominated sorting genetic algorithm II (NSGA–II) is mainly reflected in the embedded local search mechanism, which is used to solve the multi-objective model. In the case study, we optimize the urban passenger transport structure of Beijing, China, based on the Beijing Rail Transit Lines Plan 2016–2035 and the Beijing Urban Master Plan 2016–2035. The innovation of this paper is reflected in three aspects:
From individual and public perspectives, we construct a multi-objective optimization model driven by urban rail transit.
Based on urban rail transit development plans, we improve the NSGA–II by embedding a local search mechanism to solve the multi-objective optimization model.
We analyze the evolutionary trends of various transport modes over several years in the future, which indicates a structural transformation in urban passenger transport and reflects a sustainable urban passenger transport structure driven by urban rail transit.
The rest of this paper is organized as follows.
Section 2 summarizes the existing literature;
Section 3 mainly introduces the methods proposed in this paper;
Section 4 presents the case study;
Section 5 presents the conclusions of this paper.
2. Literature Review
There are various optimization problems in the field of transportation, such as transport structure optimization [
8], timetable optimization [
9], and route optimization [
10]. Regarding optimization of the passenger transport structure, scholars have conducted a lot of research. In this paper, the urban passenger transport structure refers to the proportion of the urban passenger volume attributed to different transport modes, such as urban rail transit and private cars.
Goal programming models [
11] based on linear programming theory have gained widespread application due to their operational flexibility and maturity. Qiang et al. [
12] proposed some energy-efficiency models of sustainable urban transport structure optimization, with the objective function being to minimize energy consumption while subject to constraints on CO
2 emissions and traffic efficiency. However, the optimization perspective employed by single-objective models for transport structure optimization lacks comprehensiveness.
With deeper exploration, models have shifted from single objectives like improving transport efficiency [
13] toward achieving multiple objectives such as low CO
2 emissions [
14] and low generalized costs [
15]. Scholars have developed various transport structure optimization models from different perspectives. Conway et al. [
16] developed a new method to find Pareto sets of paths, jointly minimizing fares and travel time, and conducted the analysis using data from Greater Boston, Massachusetts, USA. Considering passengers, operators, and construction, Li et al. [
17] built a multi-objective optimization model of an urban passenger transport structure oriented to low-carbon and conducted a case study of Qingdao, China. Based on the characteristics of different transportation modes, Li et al. [
18] proposed a multi-objective optimization model to maximize transportation utility, minimize ecological impacts, and minimize the generalized cost. Lin at al. [
19] constructed a multi-objective optimization model of China’s transportation structure to explore the carbon emission reduction effect of transportation structure adjustment from the perspectives of transportation structure optimization and transportation mode shift.
Research on urban rail transit has shown the positive effects of low-carbon transport. The rapid development of urban rail transit has a significant impact on passenger travel behaviors. With the formation of the urban rail transit skeleton network, the number of rail transit passengers has significantly increased [
20]. Zhang et al. [
21] found that subway proximity reduces a household’s probability of owning a car and their subsequent fuel consumption, and an increase in subway stations reduces nearby households’ car ownership rate by a greater extent. Basso et al. [
22] studied the role of public transport, including subways, in shaping the urban structure and explored the effects of pricing pollution externalities together with extending the public transport network on the urban structure. Lin et al. [
23] analyzed the impact of urban rail transit on energy efficiency and identified that the introduction of urban rail transit significantly improves the level of green total factor energy efficiency. Yang et al. [
24] combine the following planning strategies together: controlling the percentages of oil-fueled cars, metro and rail network construction, and providing better public transit services around metro stations.
It is difficult to find a unique solution that optimizes each objective because there is often conflict among multiple objectives [
25]. For multi-objective optimization problems, the overall optimal solution represents a tradeoff among the various objectives, achieving a state of equilibrium [
26]. Recently, different algorithms have been proposed for solving multi-objective optimization models. The most common solution is to transform the multi-objective optimization model into a single-objective optimization model. Zhang et al. [
27] constructed a multi-objective optimal urban traffic structure model from diverse perspectives, converting it into a single-objective programming problem based on the concept of carbon emission satisfaction to explore the impacts of urban traffic structure changes on reducing transport CO
2 emissions. Considering carbon emissions, transport costs, and resource utilization, Zhang et al. [
28] developed a multi-objective model to optimize the passenger traffic system and transformed the model into a single-objective optimization model by combining the ideal point method with the entropy weight method, thereby obtaining the optimal solution.
In addition, heuristic algorithms are widely popular for directly solving multi-objective problems. The particle swarm optimization (PSO) [
29] algorithm, Ant Colony Optimization (ACO) [
30] algorithm, and genetic algorithm (GA) [
31] are intensively used multi-objective evolutionary algorithms in real-world applications. These algorithms are modified to achieve better performance. A hybrid particle swarm optimization with crossover operator (C–PSO) is employed for solving high-dimensional bilevel multi-objective programming problems [
32]. The Clustering-Based Hybrid Particle Swarm Optimization (CBHPSO) algorithm is presented to solve bi-objective optimization problems [
33]. Based on the idea of a hybrid algorithm, Song et al. [
34] proposed a new improved PSO–ACO algorithm to solve the problem of poor energy-dispatching efficiency between sites. The matrix-based hybrid genetic algorithm (MBHGA) [
35] has been developed to solve an agent-based model of firms’ behavior with controlled trade interactions. The multiagent hybrid clustering-assisted genetic algorithm (MA–HCAGA) [
36] is proposed for finding the best configurations of reconfigurable multilayer road networks. It is worth noting that the NSGA–II performs well when solving multi-objective models. Ma et al. [
37] introduced the concept of multi-objective optimization and the foundation of NSGA–II, reviewed the family of NSGA–II and their modifications, and categorized their applications. Liu et al. [
38] presented a novel algorithm based on NSGA–II to address the issues of local optima trapping and non-smooth paths in mobile robot path planning. Aiming to solve the problems of slow convergence speed and low precision probability in the multi-objective optimization of energy storage materials, Hu et al. [
39] proposed a multi-objective optimization model of energy storage materials based on NSGA–II.
There are various aspects involved in constructing optimization models. However, scholars have neglected the utilization rate of public transport operation lines from a public perspective. In this paper, we consider it in the urban passenger transport structure optimization model. In addition, we improve the NSGA–II by embedding a local search mechanism to solve the constructed model. Moreover, most scholars who propose transport structure optimization models only solve and analyze results for a specific year. However, optimizing for just one year has limitations, failing to capture overall trends over a period. In this paper, we focus on optimizing the transport structure over multiple years in the future and analyze the evolutionary trends of various transport modes driven by urban rail transit.
3. Method
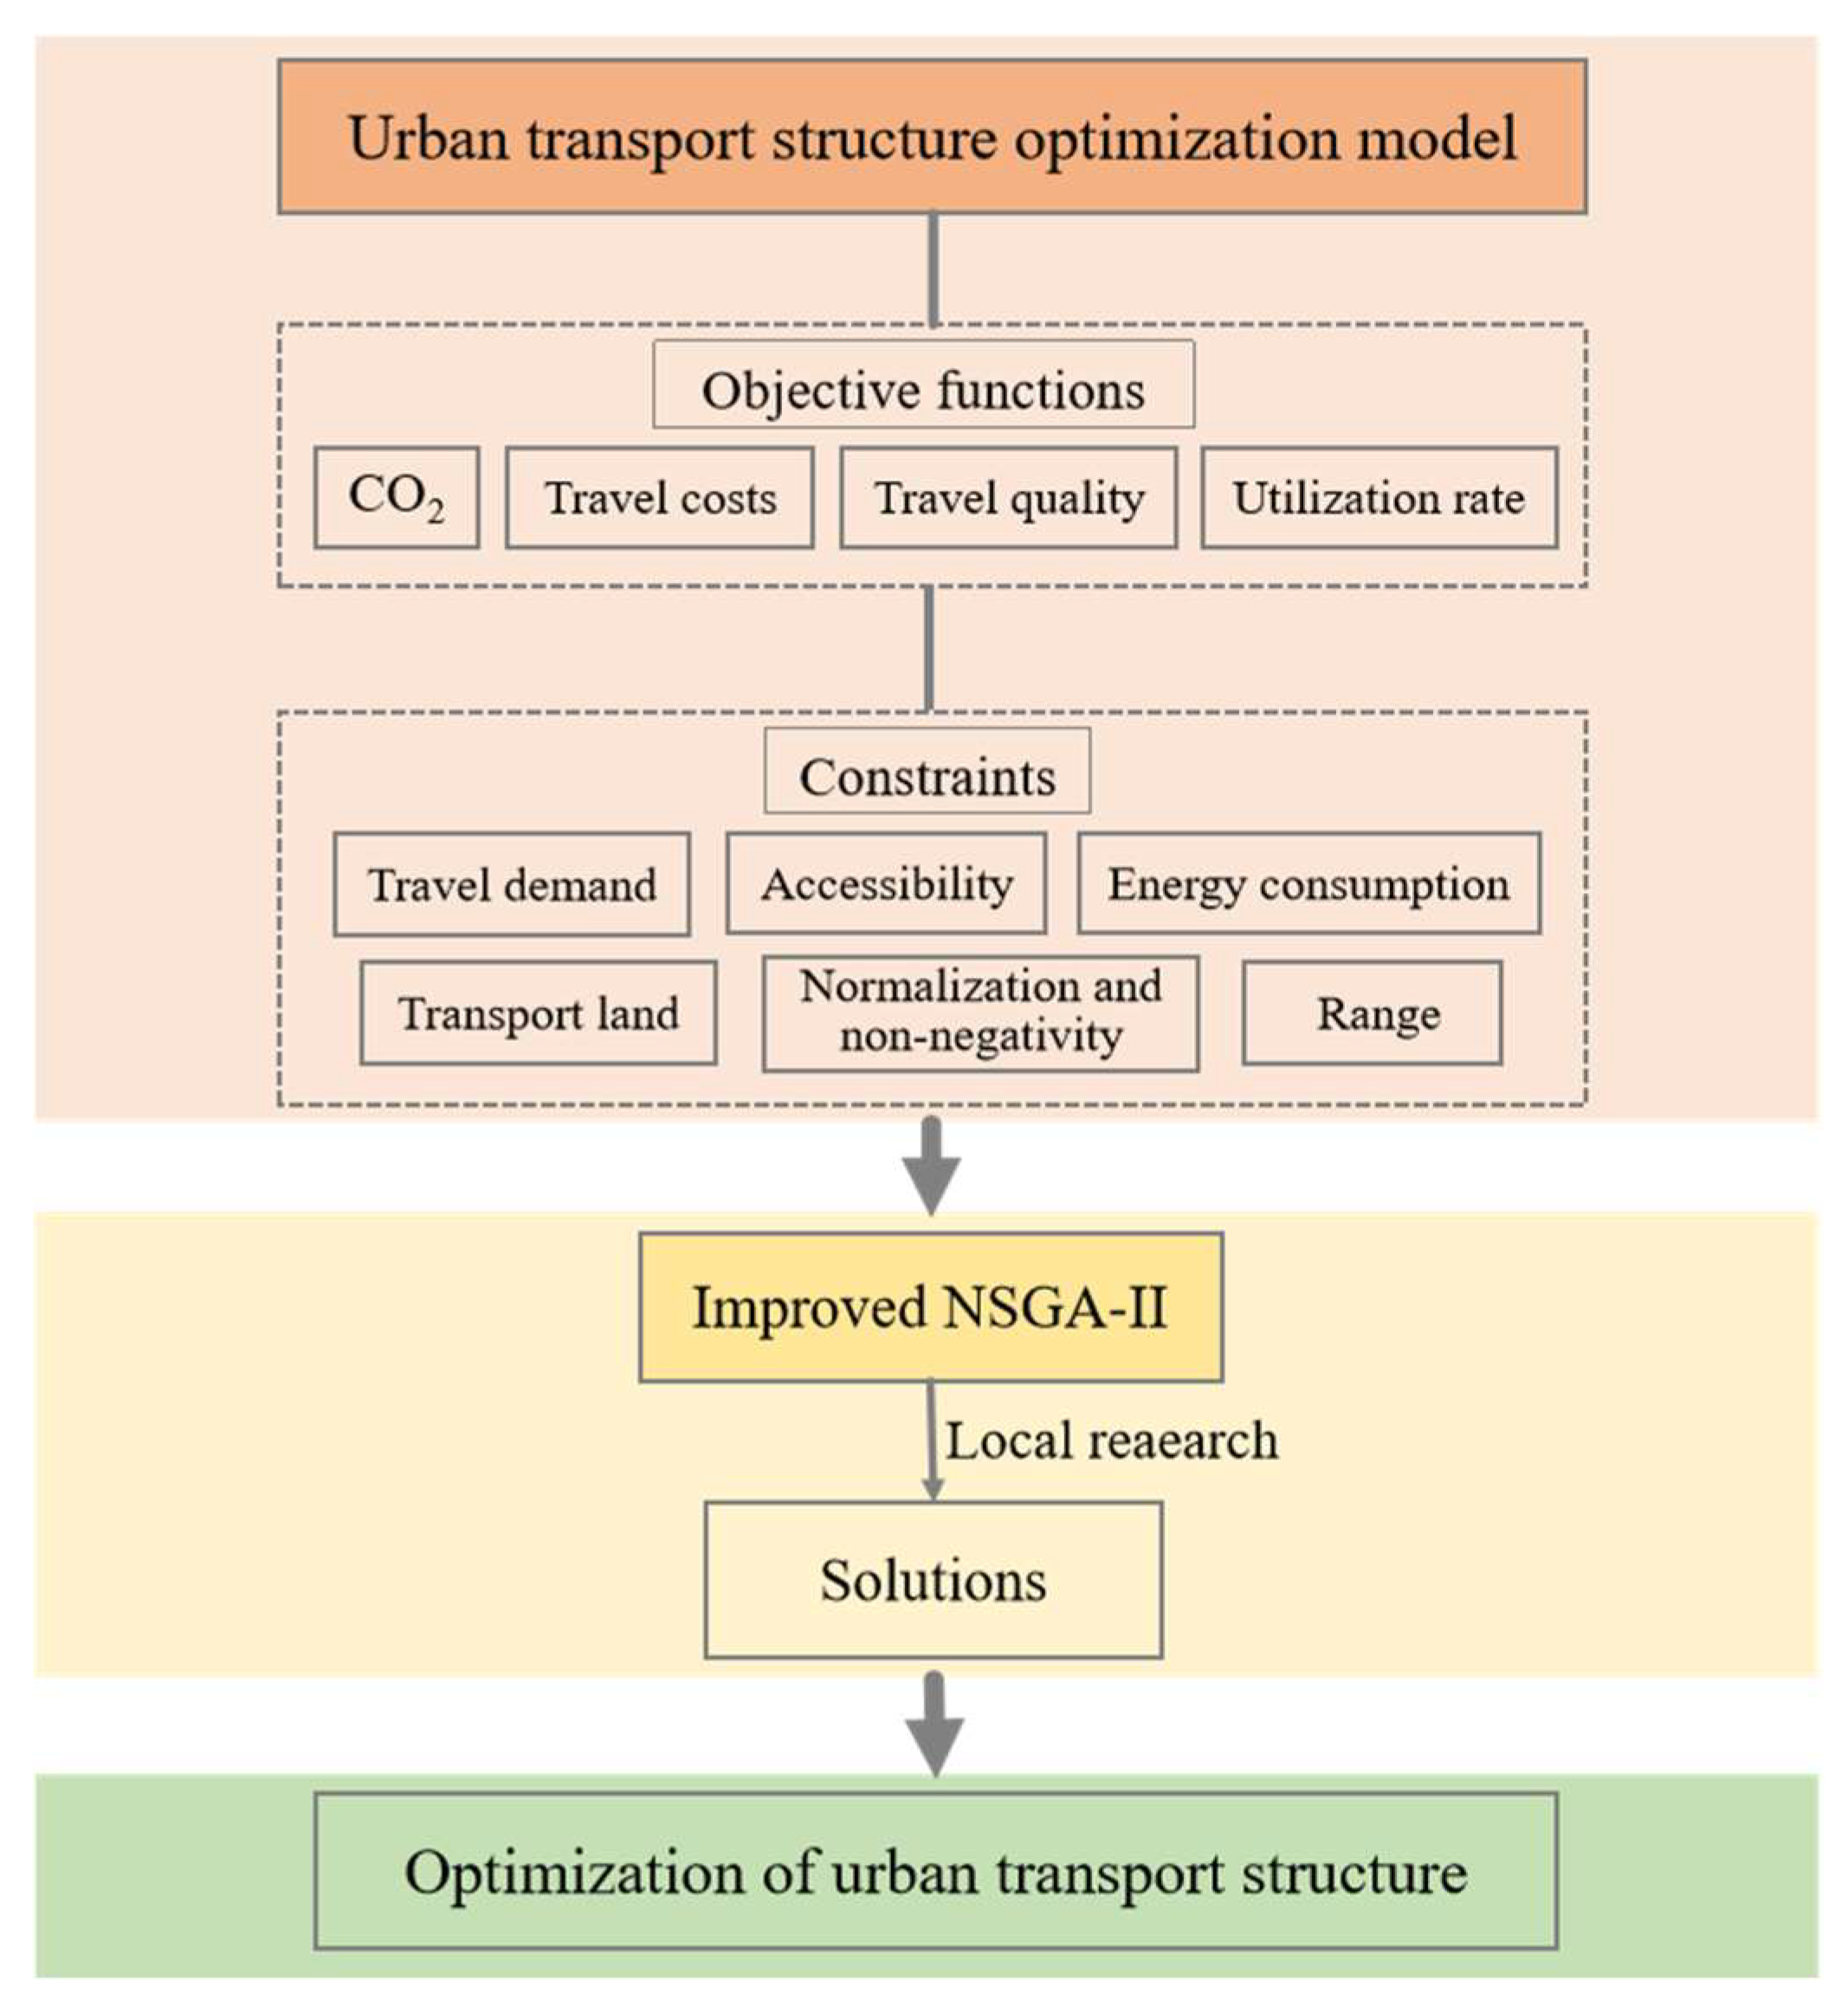
Optimizing the urban transport structure is an effective measure for the development of low-carbon transport. In this section, we establish a multi-objective optimization model for optimizing the urban passenger transport structure from both individual and public perspectives. The overall flow of the model framework in this paper is shown in
Figure 1.
The objective functions comprise four components: transport CO2 emissions, travel costs, travel quality, and the utilization rate of public transport operation lines. Constraints are defined across six aspects: travel demand, accessibility, energy consumption, transport land, normalization and non-negativity, and range. Based on urban rail transit development plans, we employ the improved NSGA–II to solve the optimization model. The final solutions serve as the basis for the optimization of the transport structure.
3.1. Model Assumptions
This paper constructs a multi-objective optimization model to provide guidance for the government in formulating low-carbon transport development plans. Considering the macro characteristics of government decision-making, the following assumptions are made in this paper:
The urban system is treated as a relatively closed system. Only internal urban passenger transport is considered.
The optimization model is constructed based on existing urban transport resources, with the relevant parameters of each transport mode in a stable state. It does not account for the impact of sudden or major events on the urban transport system.
The parameters in this model are taken as the average parameters at the macro level. Individual traveler parameters are disregarded.
In this paper, the optimization model incorporates transport CO2 emissions, energy consumption, the road occupancy area, and so on. Four motorized modes (private car, taxi, bus, and urban rail transit) are selected for analysis.
3.2. Transport Structure Optimization Model
In this section, we construct the transport structure optimization model, including four objective functions and six constraints, to solve Problem A.
Problem A. The need to minimize the values of objective functions , , and and maximize the value of the objective function is through a set of decision variables X:s.t. Here, Equations (1)–(4) are objective functions: is the transport CO2 emissions; is the travel costs; is the crowding degree; is the utilization rate of public transport operation lines. X = {x1, x2, x3, x4} is the set of decision variables at time , corresponding to the proportion of private cars, taxis, buses, and urban rail transit, respectively. The constraints of travel demand, accessibility, energy consumption, transport land, normalization and non-negativity, and range are shown in Equations (5)–(10).
For convenience in subsequent calculations, Equation (4) is reformulated as
3.2.1. Objective Functions
In the transport structure optimization model, objective functions are considered based on four aspects: transport CO2 emissions, travel costs, travel quality, and the utilization rate of public transport operation lines. Practically, it is desirable to optimize these objective functions.
Objective Function 1: Transport CO2 Emissions
The top-down method and the bottom-up method are the mainstream methods for calculating transport CO
2 emissions. The former is based on energy consumption, while the latter is based on the calculation of vehicle ownership and vehicle mileage [
40]. Since different transport modes are involved, the bottom-up method is applied in this paper. It is imperative to develop low-carbon transport under the low-carbon background. The optimization of the urban passenger transport structure should strive toward low carbon emissions. Therefore, the objective function of minimizing transport CO
2 emissions is first proposed, as shown in Equation (1). In Equation (1),
is the total traffic volume across the four transport modes;
and
denote the travel distance and carbon emission factors, respectively. Referring to Reference [
27], the carbon emission factors of different transport modes are presented in
Table 1. The units of the carbon emission factors are kg/(person·km).
Objective Function 2: Travel Cost
Travel costs are from the perspective of the passenger and include economic costs and time costs. It is desirable to minimize travel costs for passengers. Thus, the objective function of minimizing travel costs is proposed, as shown in Equation (2). The details are as follows:
Economic costs refer to the expenses generated by using transport modes. is the total economic cost; is the economic cost of the –th transport mode.
Time costs refer to the value generated by the time spent by passengers on a trip, which is measured using the minimum hourly wage standard. is the total time cost; is the time cost of the –th transport mode; is the average travel time for the –th transport mode.
Objective Function 3: Travel Quality
Nowadays, passengers are increasingly pursuing high-quality travel. Enhancing travel quality is one of the objectives in optimizing the urban passenger transport structure. This paper uses the crowding degree as an indicator to measure travel quality. A lower crowding degree indicates higher travel quality. Therefore, the third objective function is proposed, as shown in Equation (3). and are the average passenger carrying rate and vehicle area of the –th transport mode.
Objective Function 4: Utilization Rate of Public Transport Operation Lines
Transport infrastructure is improved continuously alongside urban development. It should be fully utilized to avoid wasting public transport resources. The fourth objective function is the pursuit of maximizing the utilization rate of public transport (meaning buses and urban rail transit) operation lines, which is displayed as Equation (4). is the utilization rate of public transport operation lines; is the operational mileage of the –th transport mode.
3.2.2. Constraints
In the transport structure optimization model, constraints are considered from several aspects: travel demand, accessibility, energy consumption, transport land, normalization and non-negativity, and range.
Constraint 1: Travel Demand
Optimization of the urban passenger transport structure should meet travel demand, meaning the total transport supply in the planning year should exceed passengers’ travel demands. The travel demand constraint is expressed as Equation (5), where
represents passenger turnover in the planning year. It can be estimated using Equation (12):
where
,
, and
are the passenger volume, urban equivalent radius, and scale of urban land in the planning year, respectively;
is the average travel distance for all transport modes;
and
are the urban equivalent radius and scale of urban land in the current year, respectively.
Constraint 2: Accessibility
Accessibility can be measured by the distance or time achievable within a reasonable travel time. The accessibility constraint reflects that the optimization of the urban transport structure is limited by the ability of passengers to use various transport modes to fulfill their travel needs. The accessibility constraint is shown in Equation (6), where denotes the average operating speed of the –th transport mode; denotes the average travel time for all transport modes.
Constraint 3: Energy Consumption
Transport CO
2 emissions are primarily caused by energy consumption. It is necessary to control total energy consumption under low-carbon background. The constraint on energy consumption is displayed in Equation (7), where
represents the energy consumption factor of the
–th transport mode;
denotes the upper limit for energy consumption. It is noted that the energy consumption factors [
28] of transport modes follow defined standards, as shown in
Table 2. The units of energy consumption factors are MJ/(person·km).
Constraint 4: Transport Land
The urban transport system has limited land resources. The constraint of transport land should be incorporated into the model, meaning that the weighted average per capita dynamic land area for all transport modes must not exceed the per capita road occupancy area. This is calculated by Equation (8), where is the per capita dynamic land area of the –th transport mode; is the per capita road occupancy area.
Constraint 5: Normalization and Non-Negativity
Model variables have the mathematical characteristics of normality and non-negativity. According to these mathematical characteristics, the fundamental constraint regarding the proportion of transport modes should be satisfied, as shown in Equation (9).
Constraint 6: Range
The optimization of a multi-year transport structure should also take into account the range constraint. In general, the results between two consecutive years should vary within a certain range without drastic changes. The range constraint is shown in Equation (10), where is the proportion of the –th transport mode in year and is the upper limit of the range.
3.3. Solution Method
In multi-objective optimization models, the objectives often have conflicts, making it difficult to achieve simultaneous optimization. Consequently, objectives should be coordinated and balanced to seek Pareto optimal solutions within the feasible region. In recent years, multi-objective intelligent optimization algorithms have continuously evolved, demonstrating superior performance and efficiency to traditional solution methods.
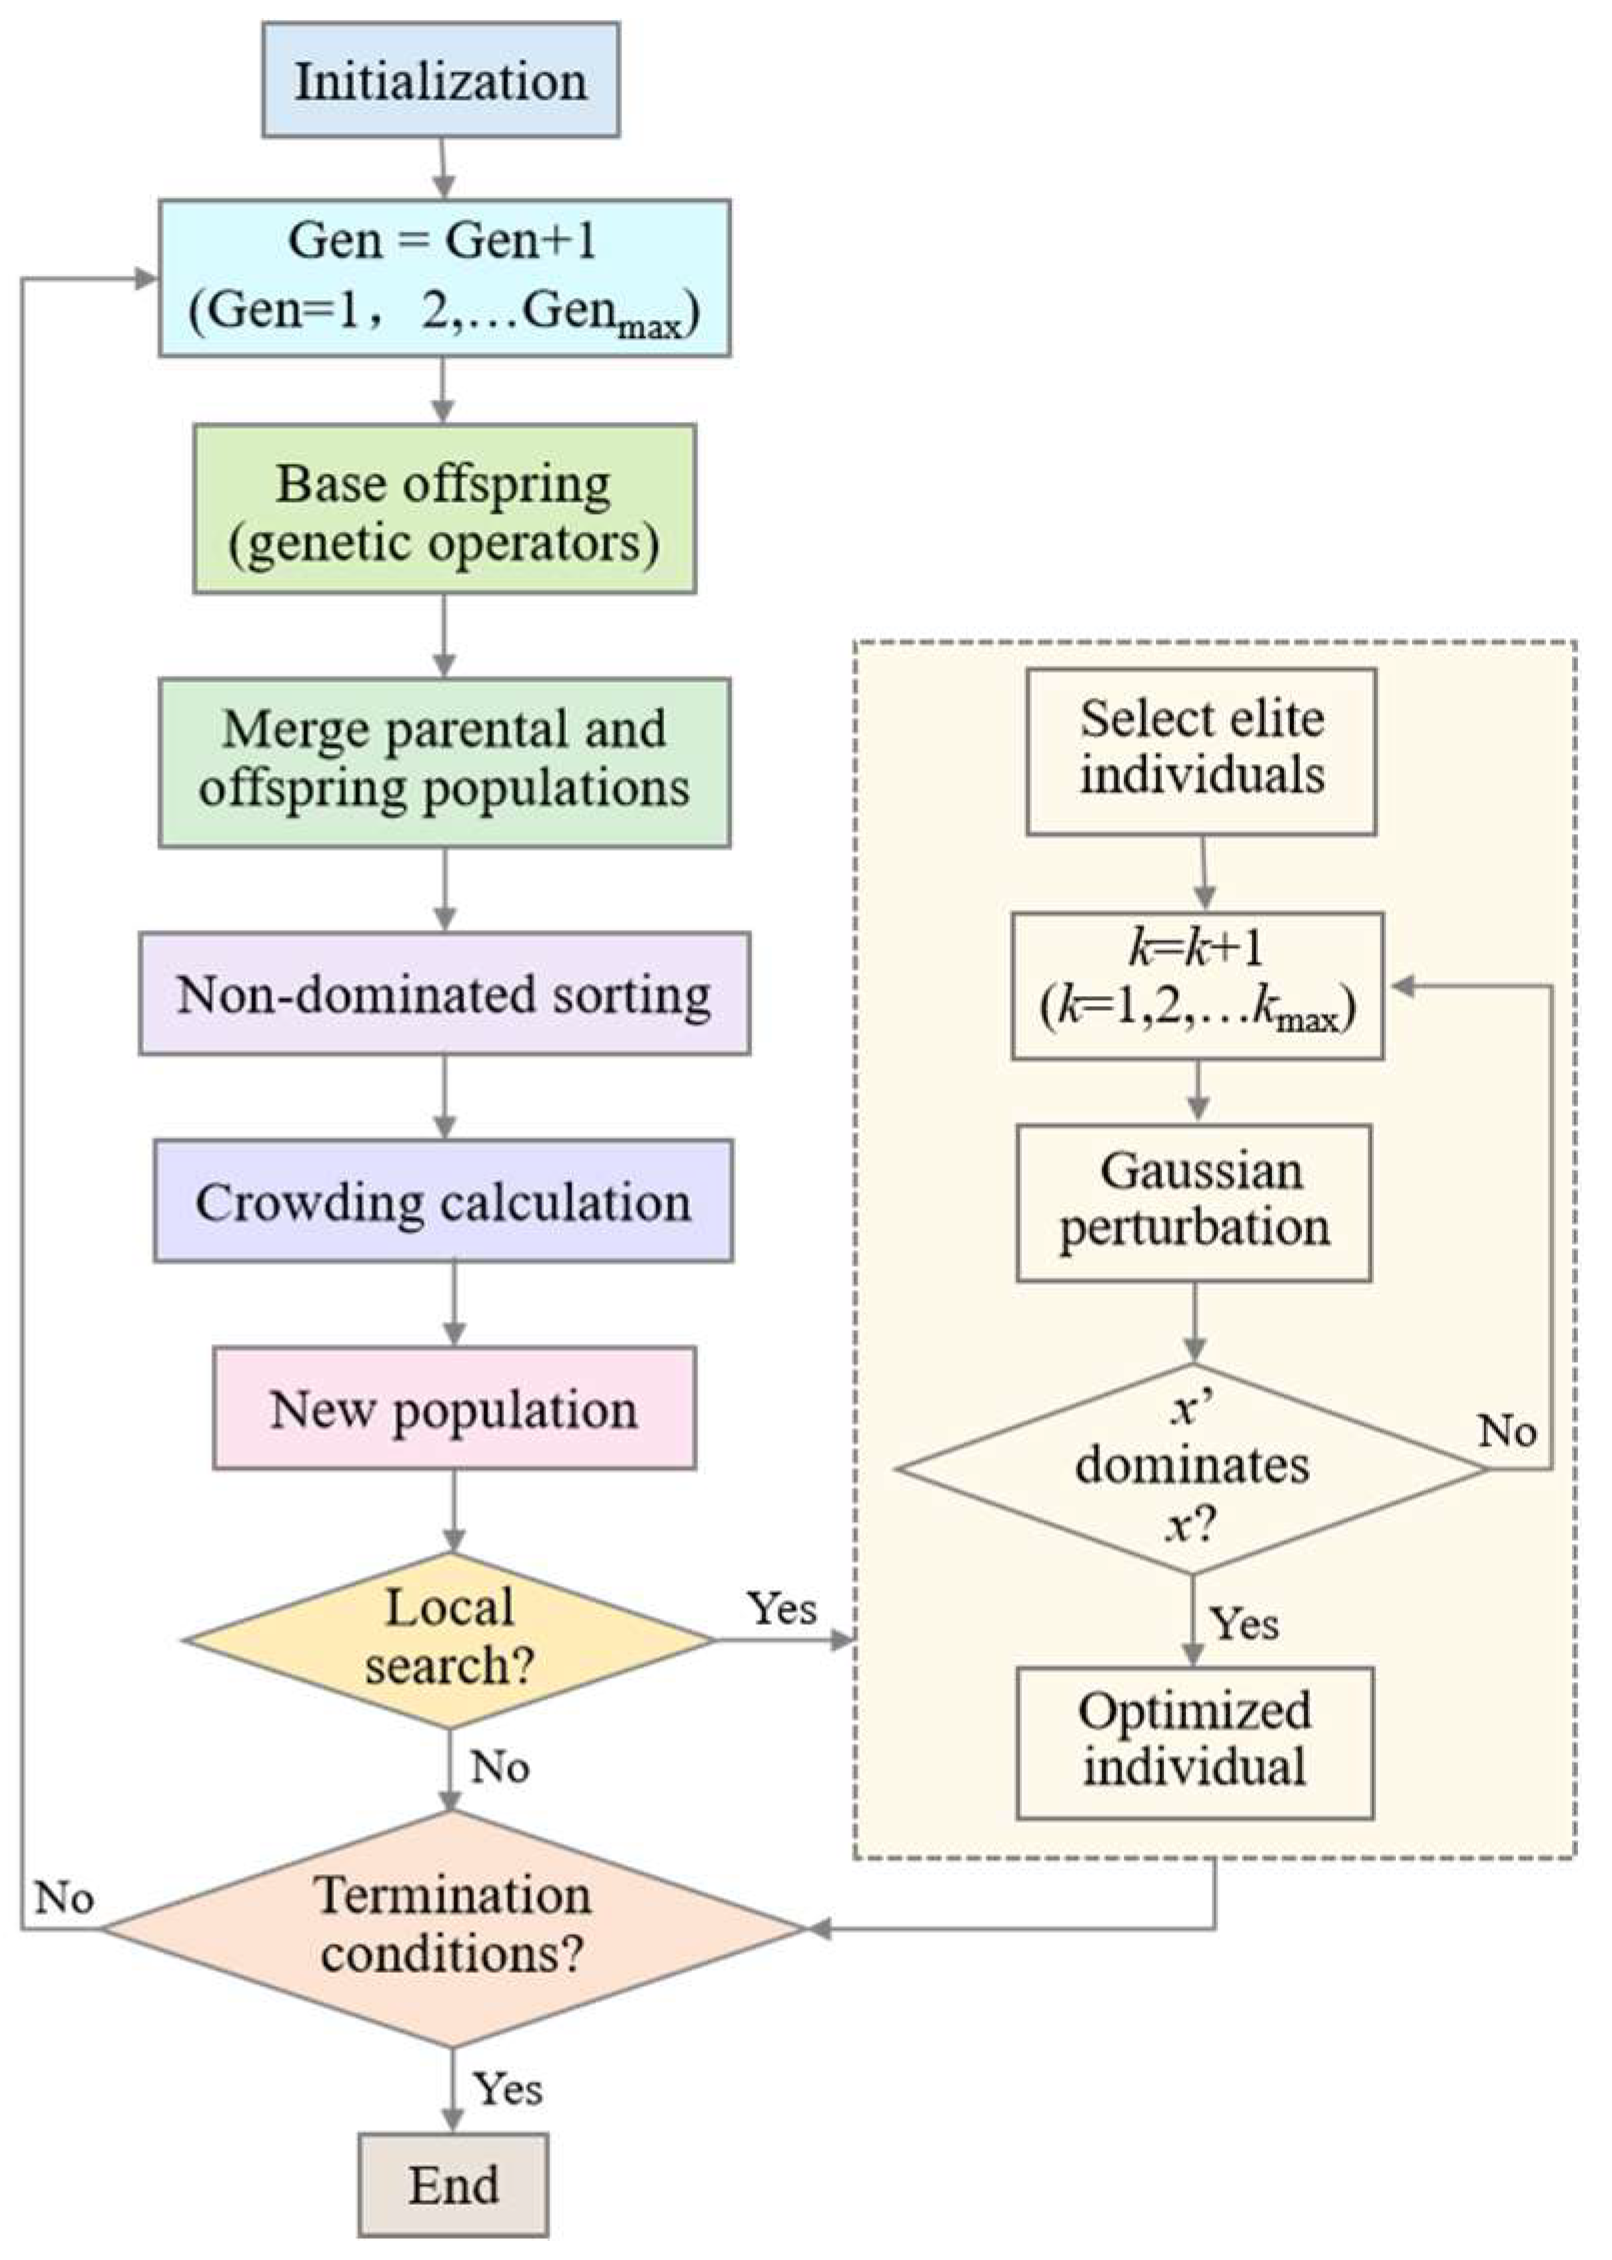
Based on the principles of Pareto optimality and the genetic algorithm, NSGA–II can be employed to solve the transport structure optimization model. In this paper, we propose the improved NSGA–II by integrating a local search mechanism to balance global exploration and the local search. The general steps of the improved NSGA–II are described as follows:
Step 1—Initialize algorithm parameters and generate the initial population.
Step 2—Execute the non-dominated sorting and crowding calculation.
Step 3—Generate base offspring through genetic operators (selection, crossover, and mutation.
Step 4—Merge the parental and offspring populations to perform non-dominated sorting and calculate crowding among individuals.
Step 5—Select the new population using the elitism strategy.
Step 6—Activate the local search module at specified generational intervals.
Step 7—Perform an elitist local search based on Gaussian perturbation, and conduct neighborhood refinement through multiple iterations to generate optimized offspring.
Step 8—Repeat the evolutionary process until termination conditions are met.
Finally, a set of Pareto optimal solutions is obtained. The improved NSGA–II can be implemented using programming code. The algorithm flowchart is shown in
Figure 2.
As shown in
Figure 2, the core mechanism involves regularly conducting neighborhood searches on elite individuals during the global search process, thereby enhancing the quality of the solutions. The Gaussian perturbation is described as follows. For the current solution
, generate a neighborhood solution
:
, where
is a perturbation term that follows a multivariate dynamic distribution:
, where
is the parameter of step size and
is the identity matrix. For
, the calculation formula is
,
, where
is its domain (here,
,
).
It is necessary to explain the situation where solution dominates solution . For minimization problems (with objective functions), solution dominates solution (denoted as ) if and only when
- 1.
All objective functions of are not inferior to the objective functions of .
- 2.
At least one objective function of is superior to the objective function of .
The pseudo-code for the improved NSGA–II is shown in Algorithm 1.
| Algorithm 1. The improved NSGA–II |
| 1: Initialize algorithm parameters and generate initial population SetP0 (population size N) |
| 2: Evaluate objectives and constraint violations for SetP0 |
| 3: Perform non-dominated sorting and crowding distance calculation of SetP0 |
| 4: For Gen = 1 to Genmax do |
| 5: SetQ ← GeneticOperators(SetPgen) |
| 6: SetR ← SetPgen∪SetQ |
| 7: Perform non-dominated sorting and crowding distance calculation of SetR |
| 8: SetPgen+1 ← ElitistSelection(SetR) |
| 9: If Gen = specified generation interval then |
| 10: For elite individual in SetPgen+1 do |
| 11: For k = 1 to kmax do |
| 12: x’ ← x + Gaussian (0, σ) |
| 13: If x’ dominates x then x ← x’ |
| 14: End for |
| 15: End for |
| 16: End if |
| 17: If termination condition met then break |
| 18: End for |
| 19: Return feasible individuals in SetPgen+1 |
4. Case Study
In this section, we will conduct a case study to validate the methods we proposed. The case area in this paper is Beijing, the capital of China. We describe the data sources firstly. Based on available data, we use the improved NSGA–II to solve the urban transport optimization model. The results are analyzed from both single-year and multi-year perspectives.
4.1. Data Resources
The case area of this paper is Beijing, the capital of China. The rapid development of Beijing in recent years has brought an increase in travel demand, placing enormous pressure on the urban transport system. To promote the sustainable development of urban transport, this paper explores the optimization of the urban passenger transport structure in Beijing.
The data used in this paper are mainly from the Beijing Transport Development Annual Report, Beijing Statistical Yearbook, and China Urban Transportation Report. This paper refers to the Beijing Urban Master Plan 2016–2035 and the Beijing Rail Transit Lines Plan 2016–2035. The period from 2024 to 2035 is treated as the planning years. The operating mileage and the scale of urban land are determined through the same annual increase, and the data on passenger volume is assumed to grow by 1% annually. Passenger turnover and the urban equivalent radius can be estimated using the corresponding equations. To prevent excessive variation between consecutive years, threshold is set to 30%. The importance of the objective functions determines the weights. Based on the Pareto dominance relationship in the improved NSGA–II, all objective functions are treated equally in this paper, weighted as 0.25.
In the improved NSGA–II, the size of the initial parent population is set to 100, and the maximum generation is set to 3000. To avoid excessive computational overhead, we perform a local search on the top 15% elite individuals and conduct three neighborhood searches for each solution, strengthening the high-quality solutions without causing premature convergence. The standard deviation of the Gaussian perturbation is set to 0.02, which covers 2% of the decision variable range, making it easy to make local adjustments and satisfy the constraints. The improved NSGA–II terminates early if the population remains stable for 30 consecutive generations, which can improve the efficiency of the algorithm to some extent.
4.2. Case 1: Single Year
The year 2035 is the target year for China to basically realize socialist modernization, so it is one of the important time points in China’s planning. We take 2035 as an example to analyze the multi-objective optimization model of Beijing’s passenger transport structure in this paper. The improved NSGA–II is applied to solve the multi-objective optimization model of Beijing’s passenger transport structure.
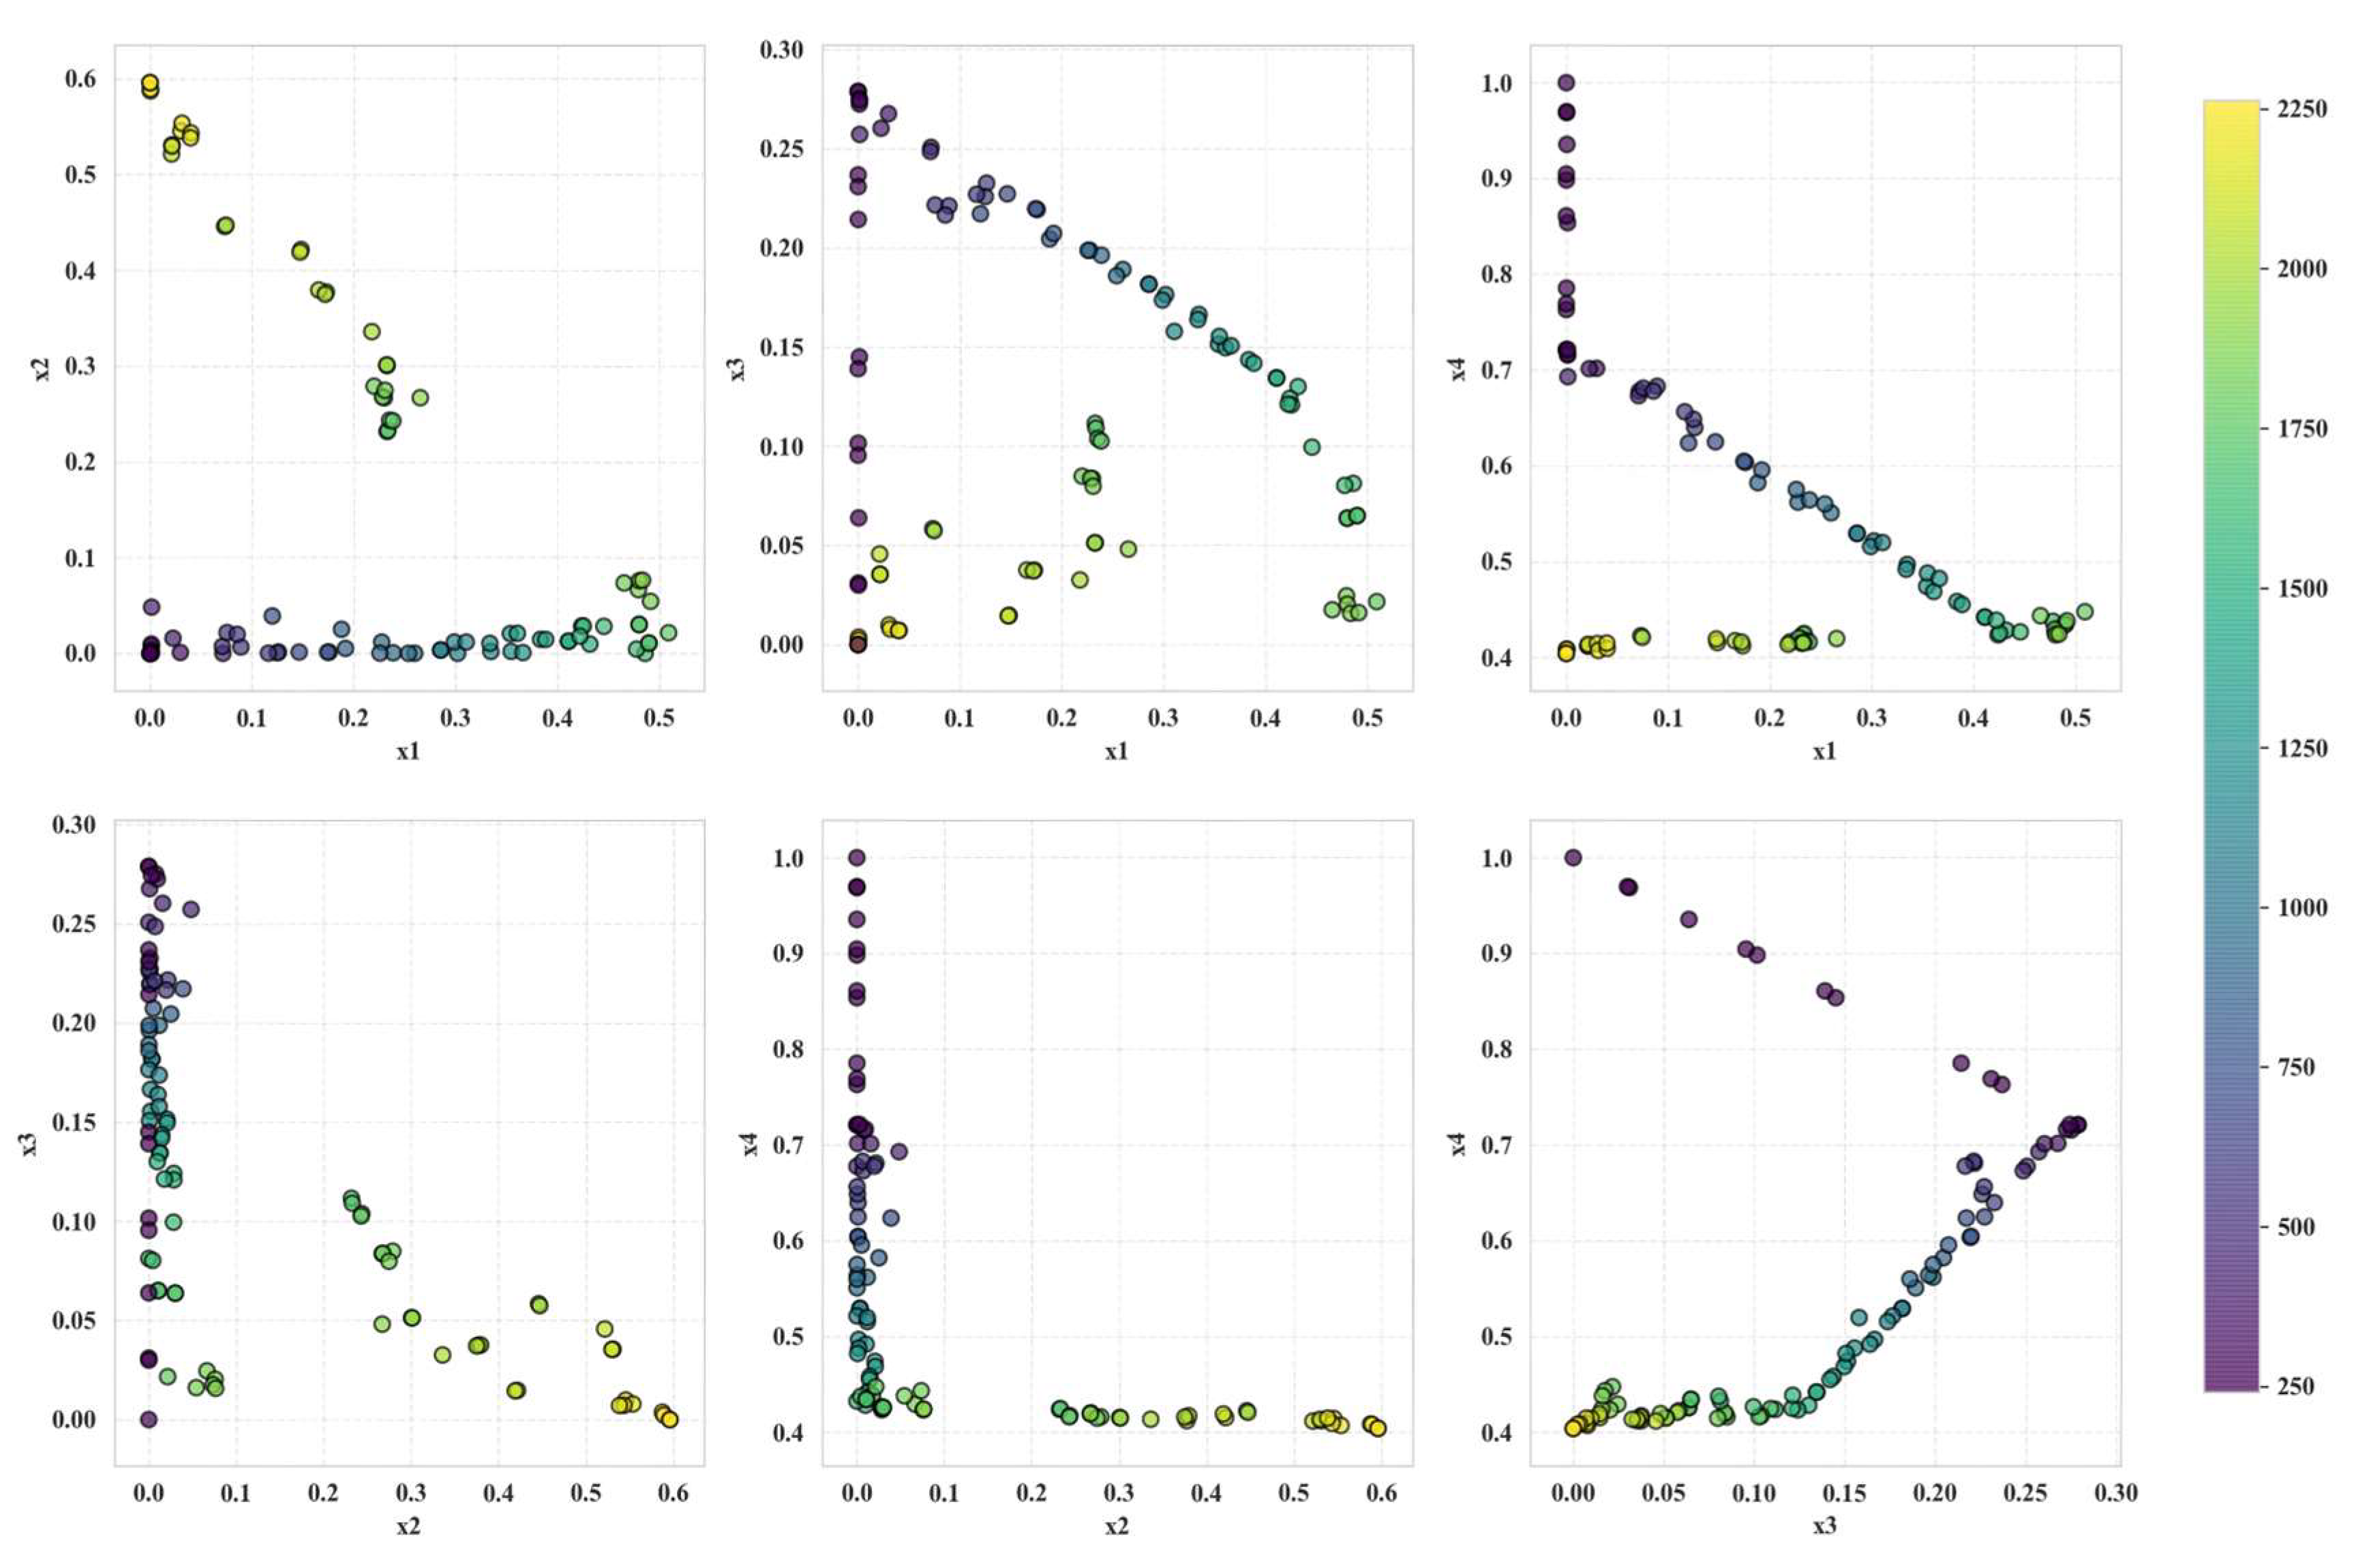
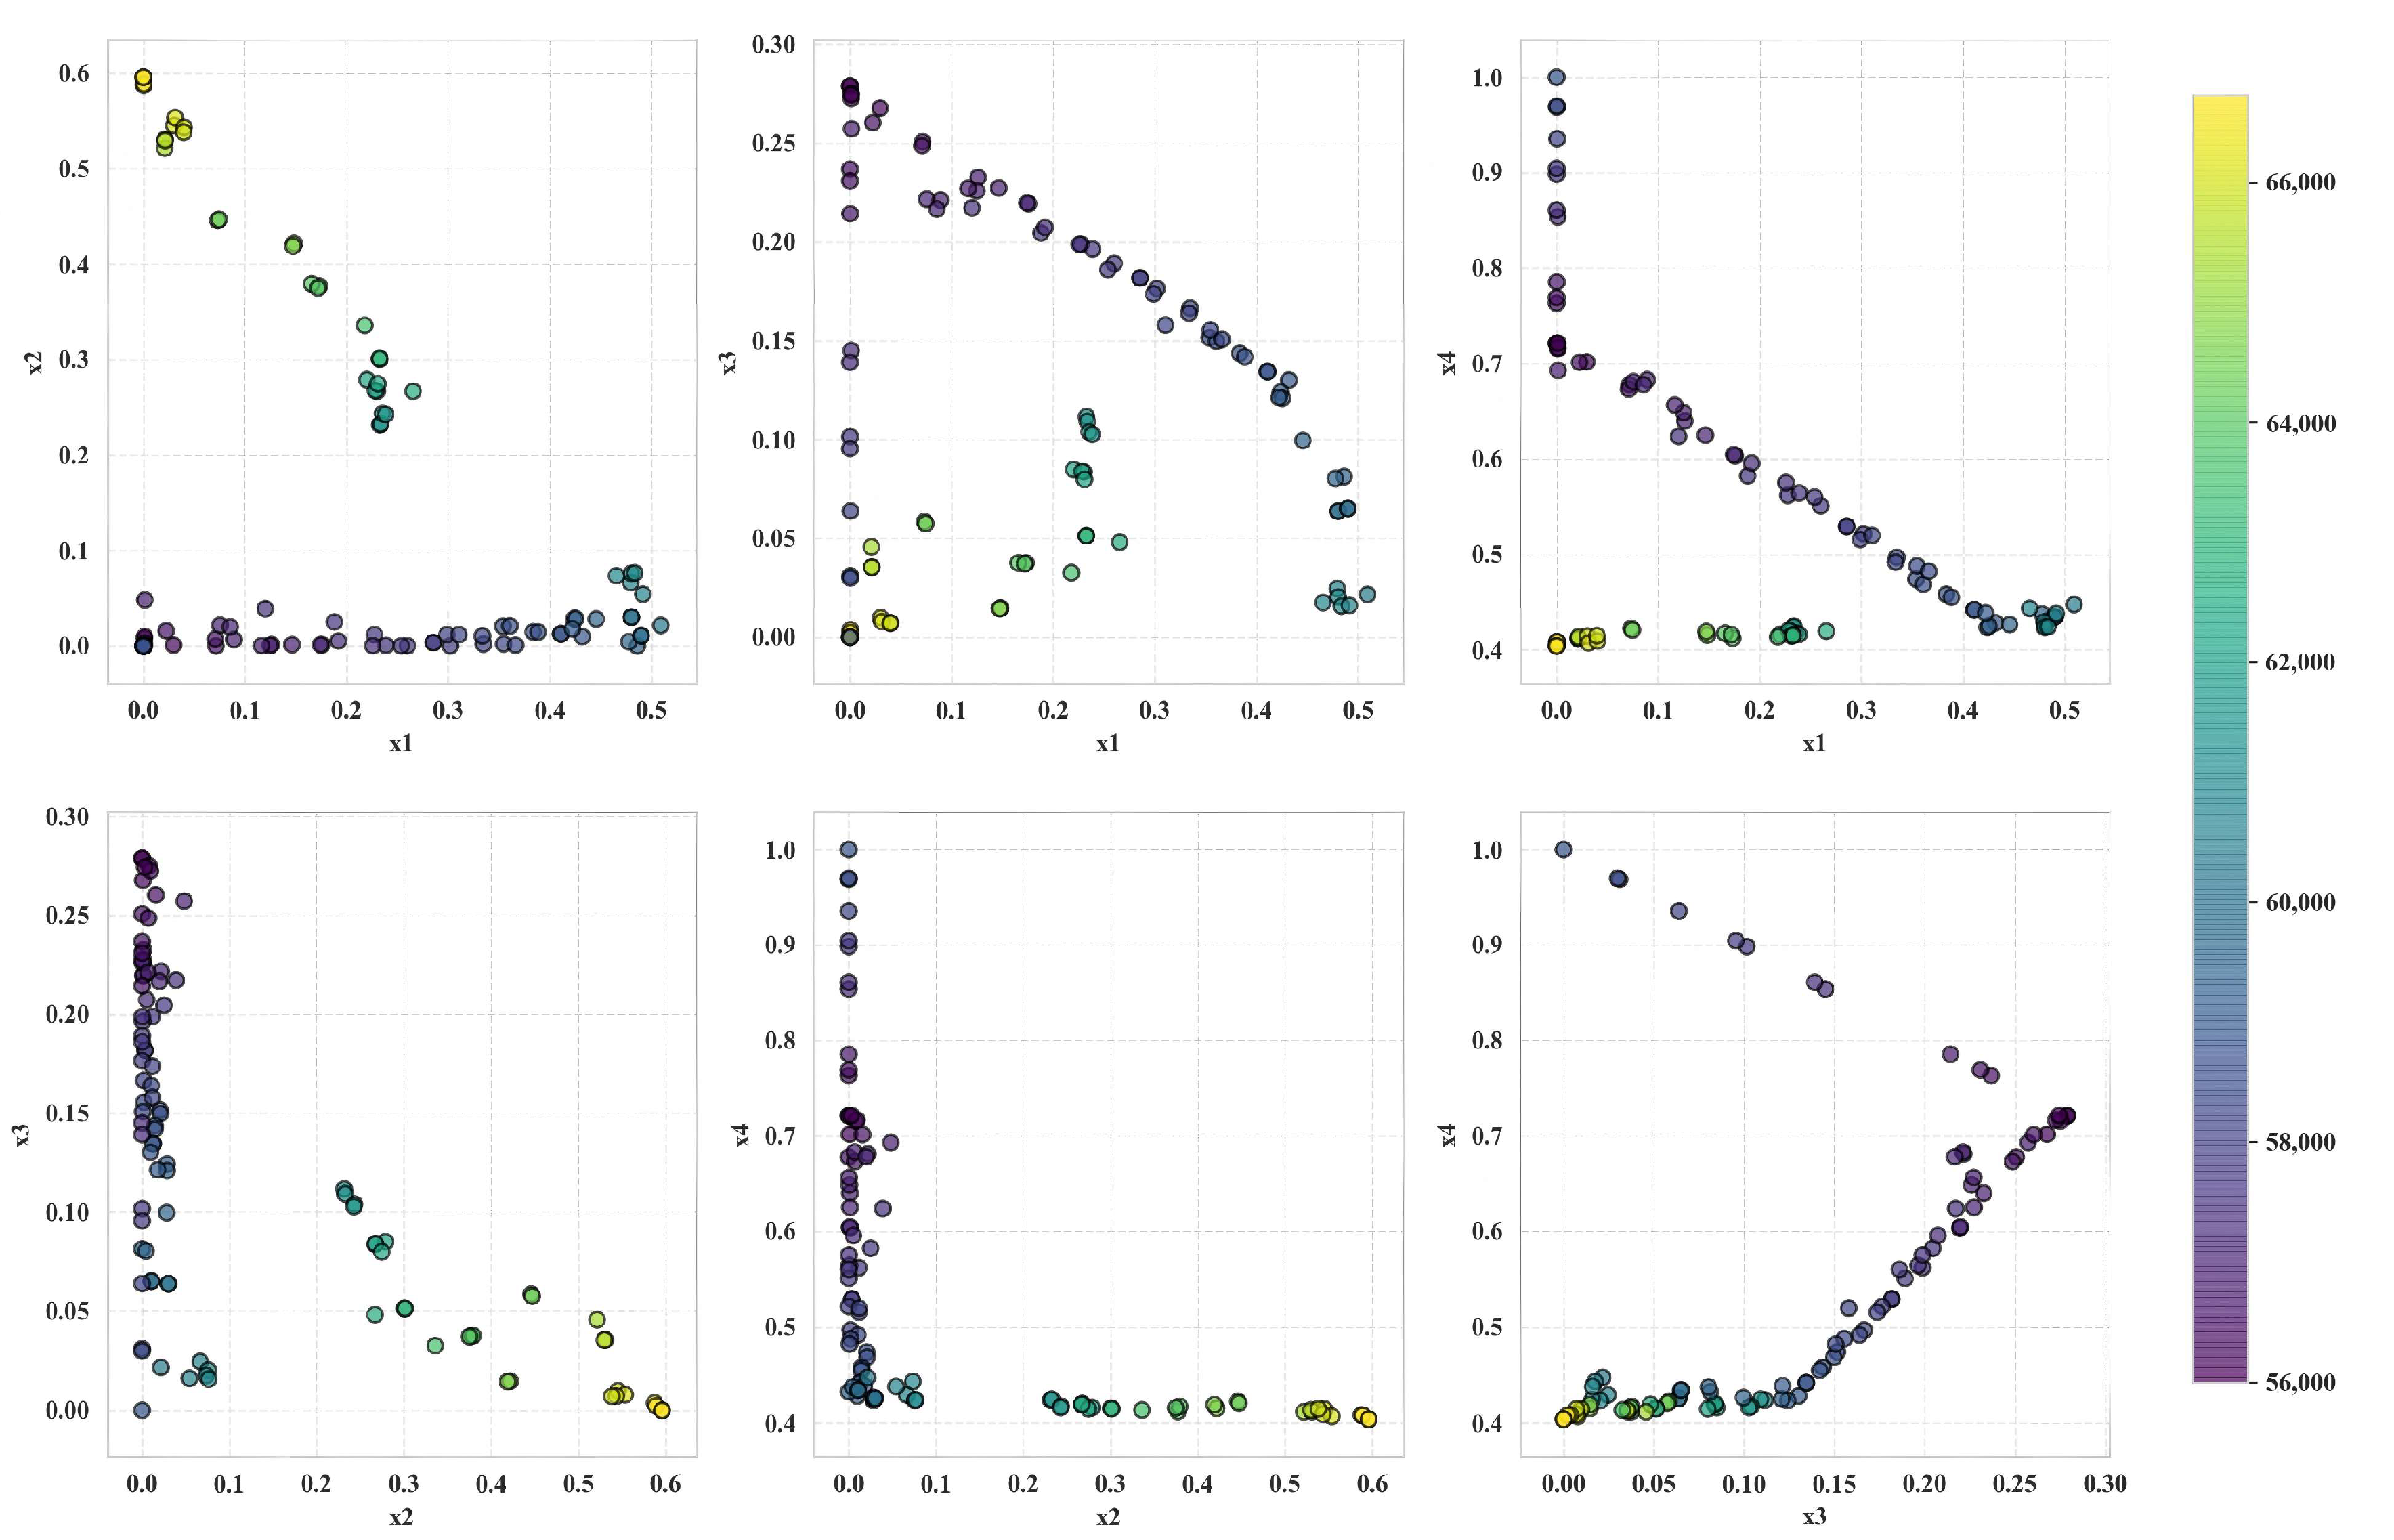
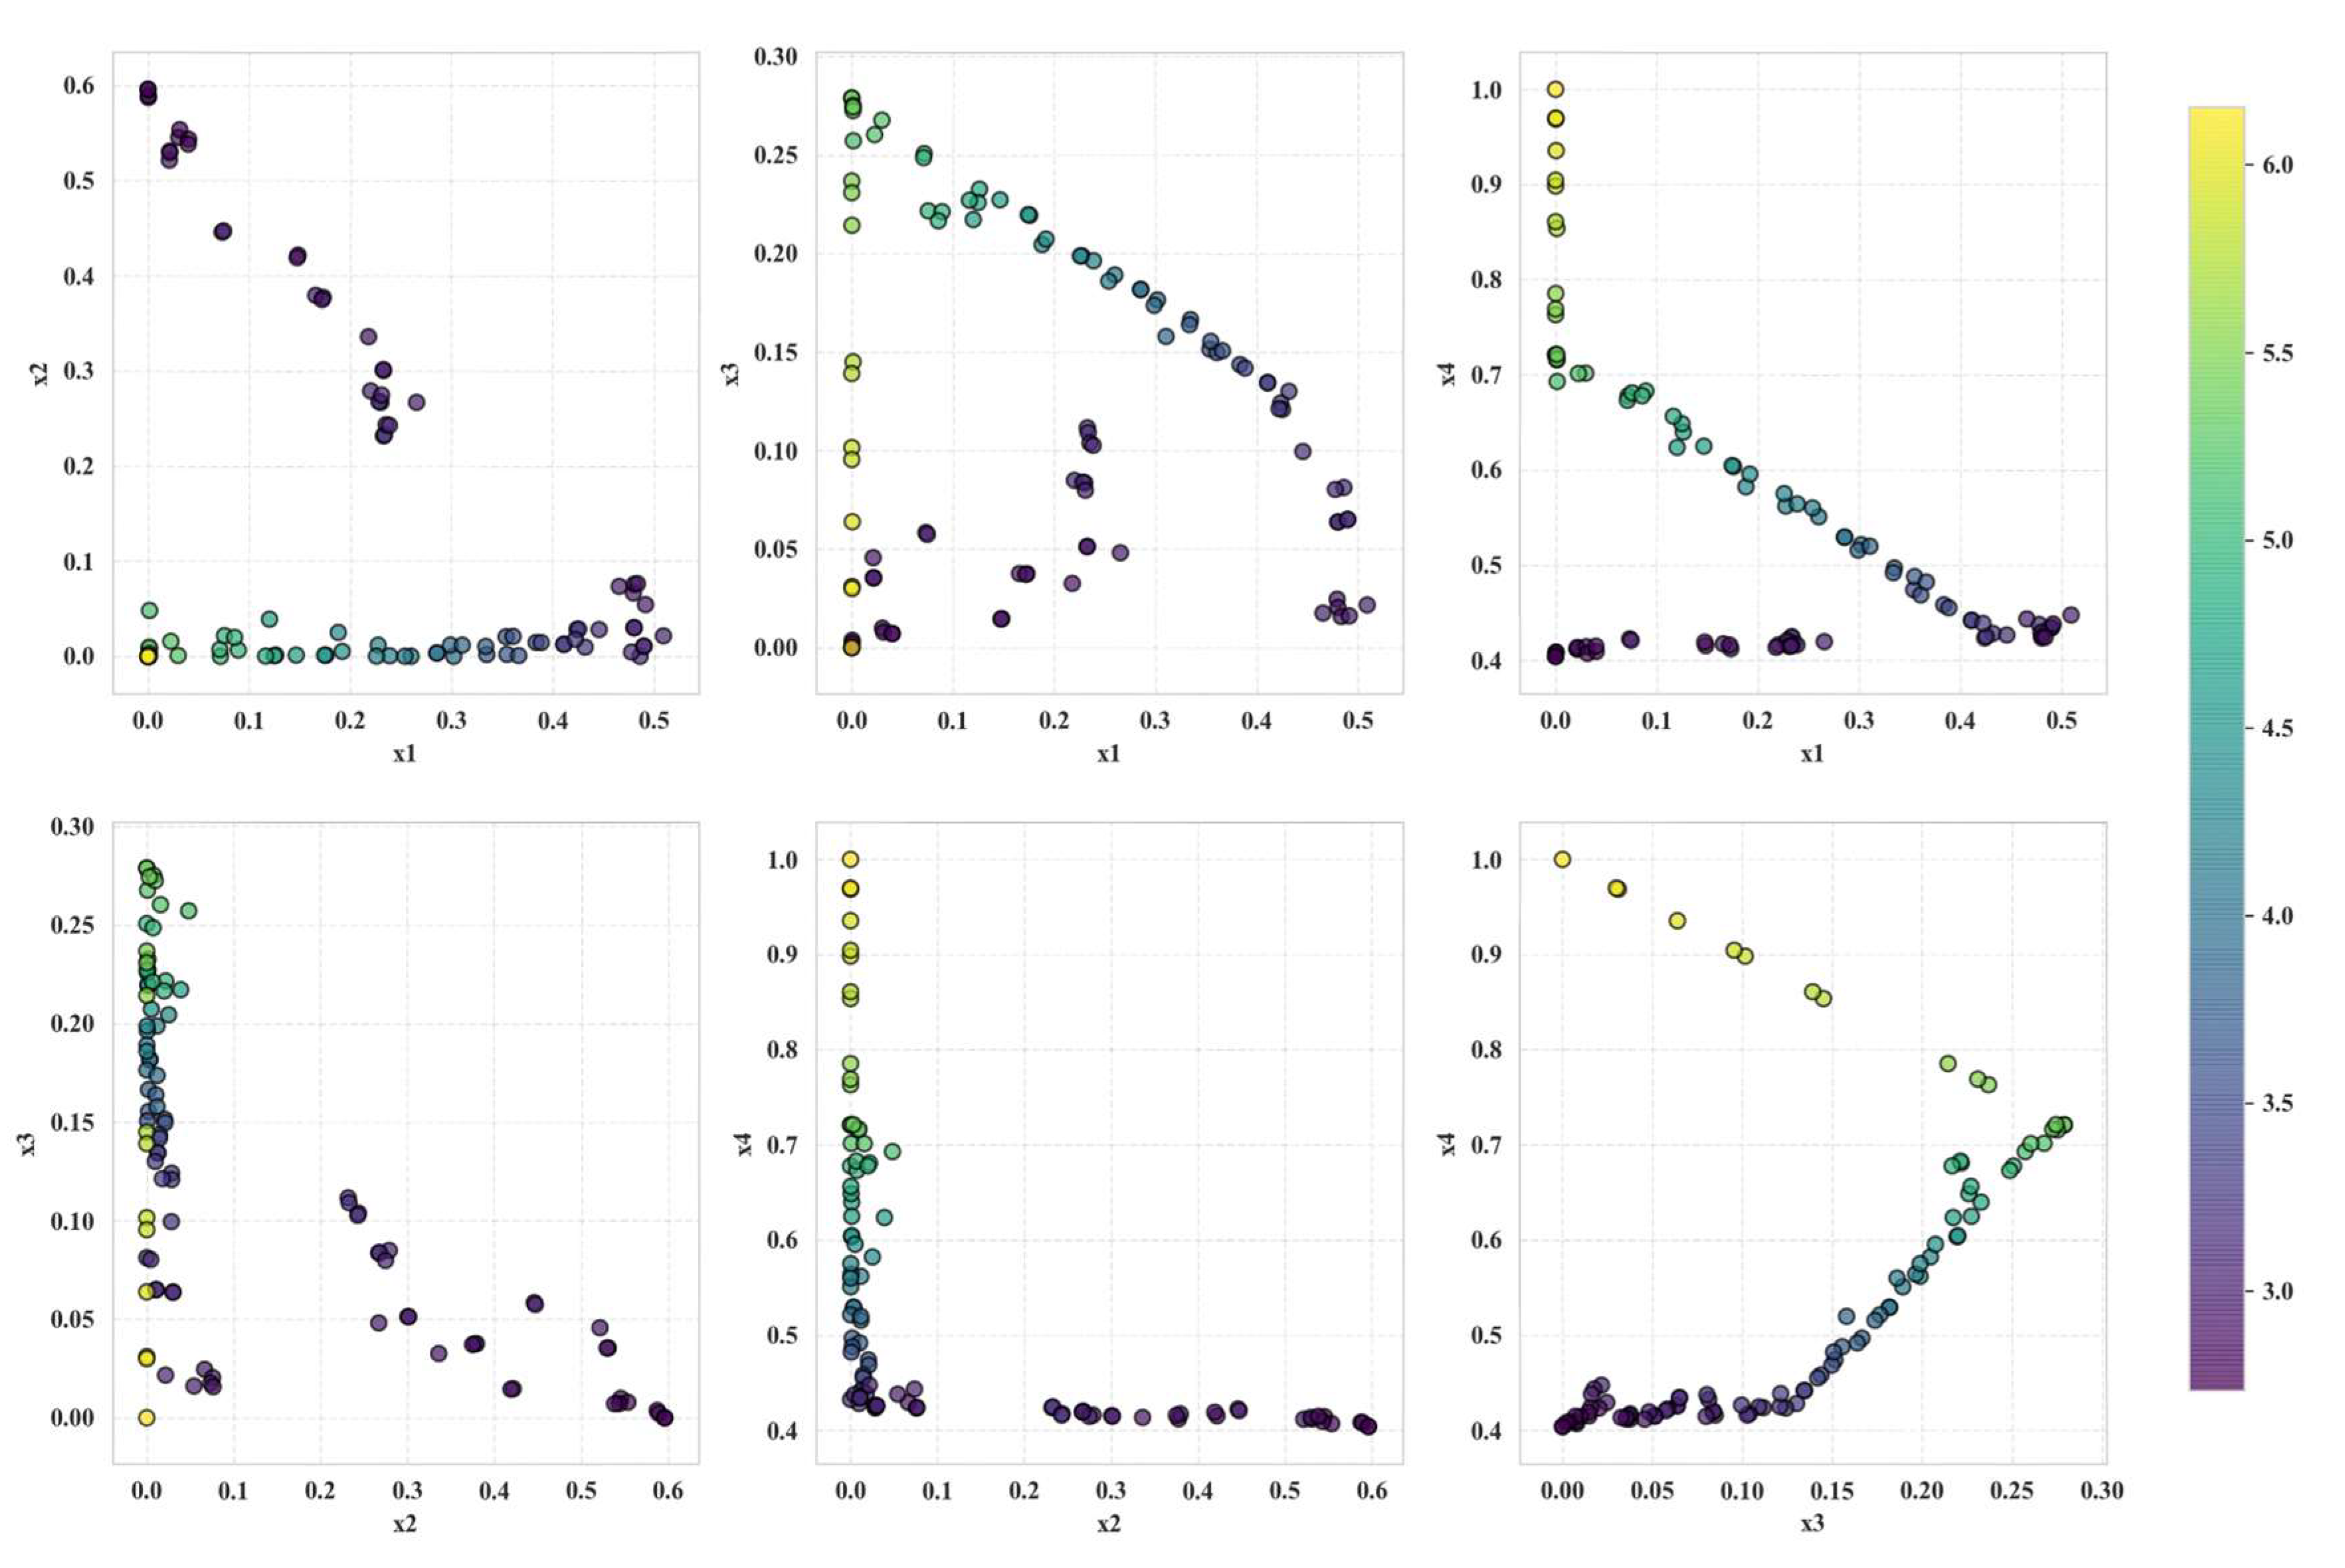
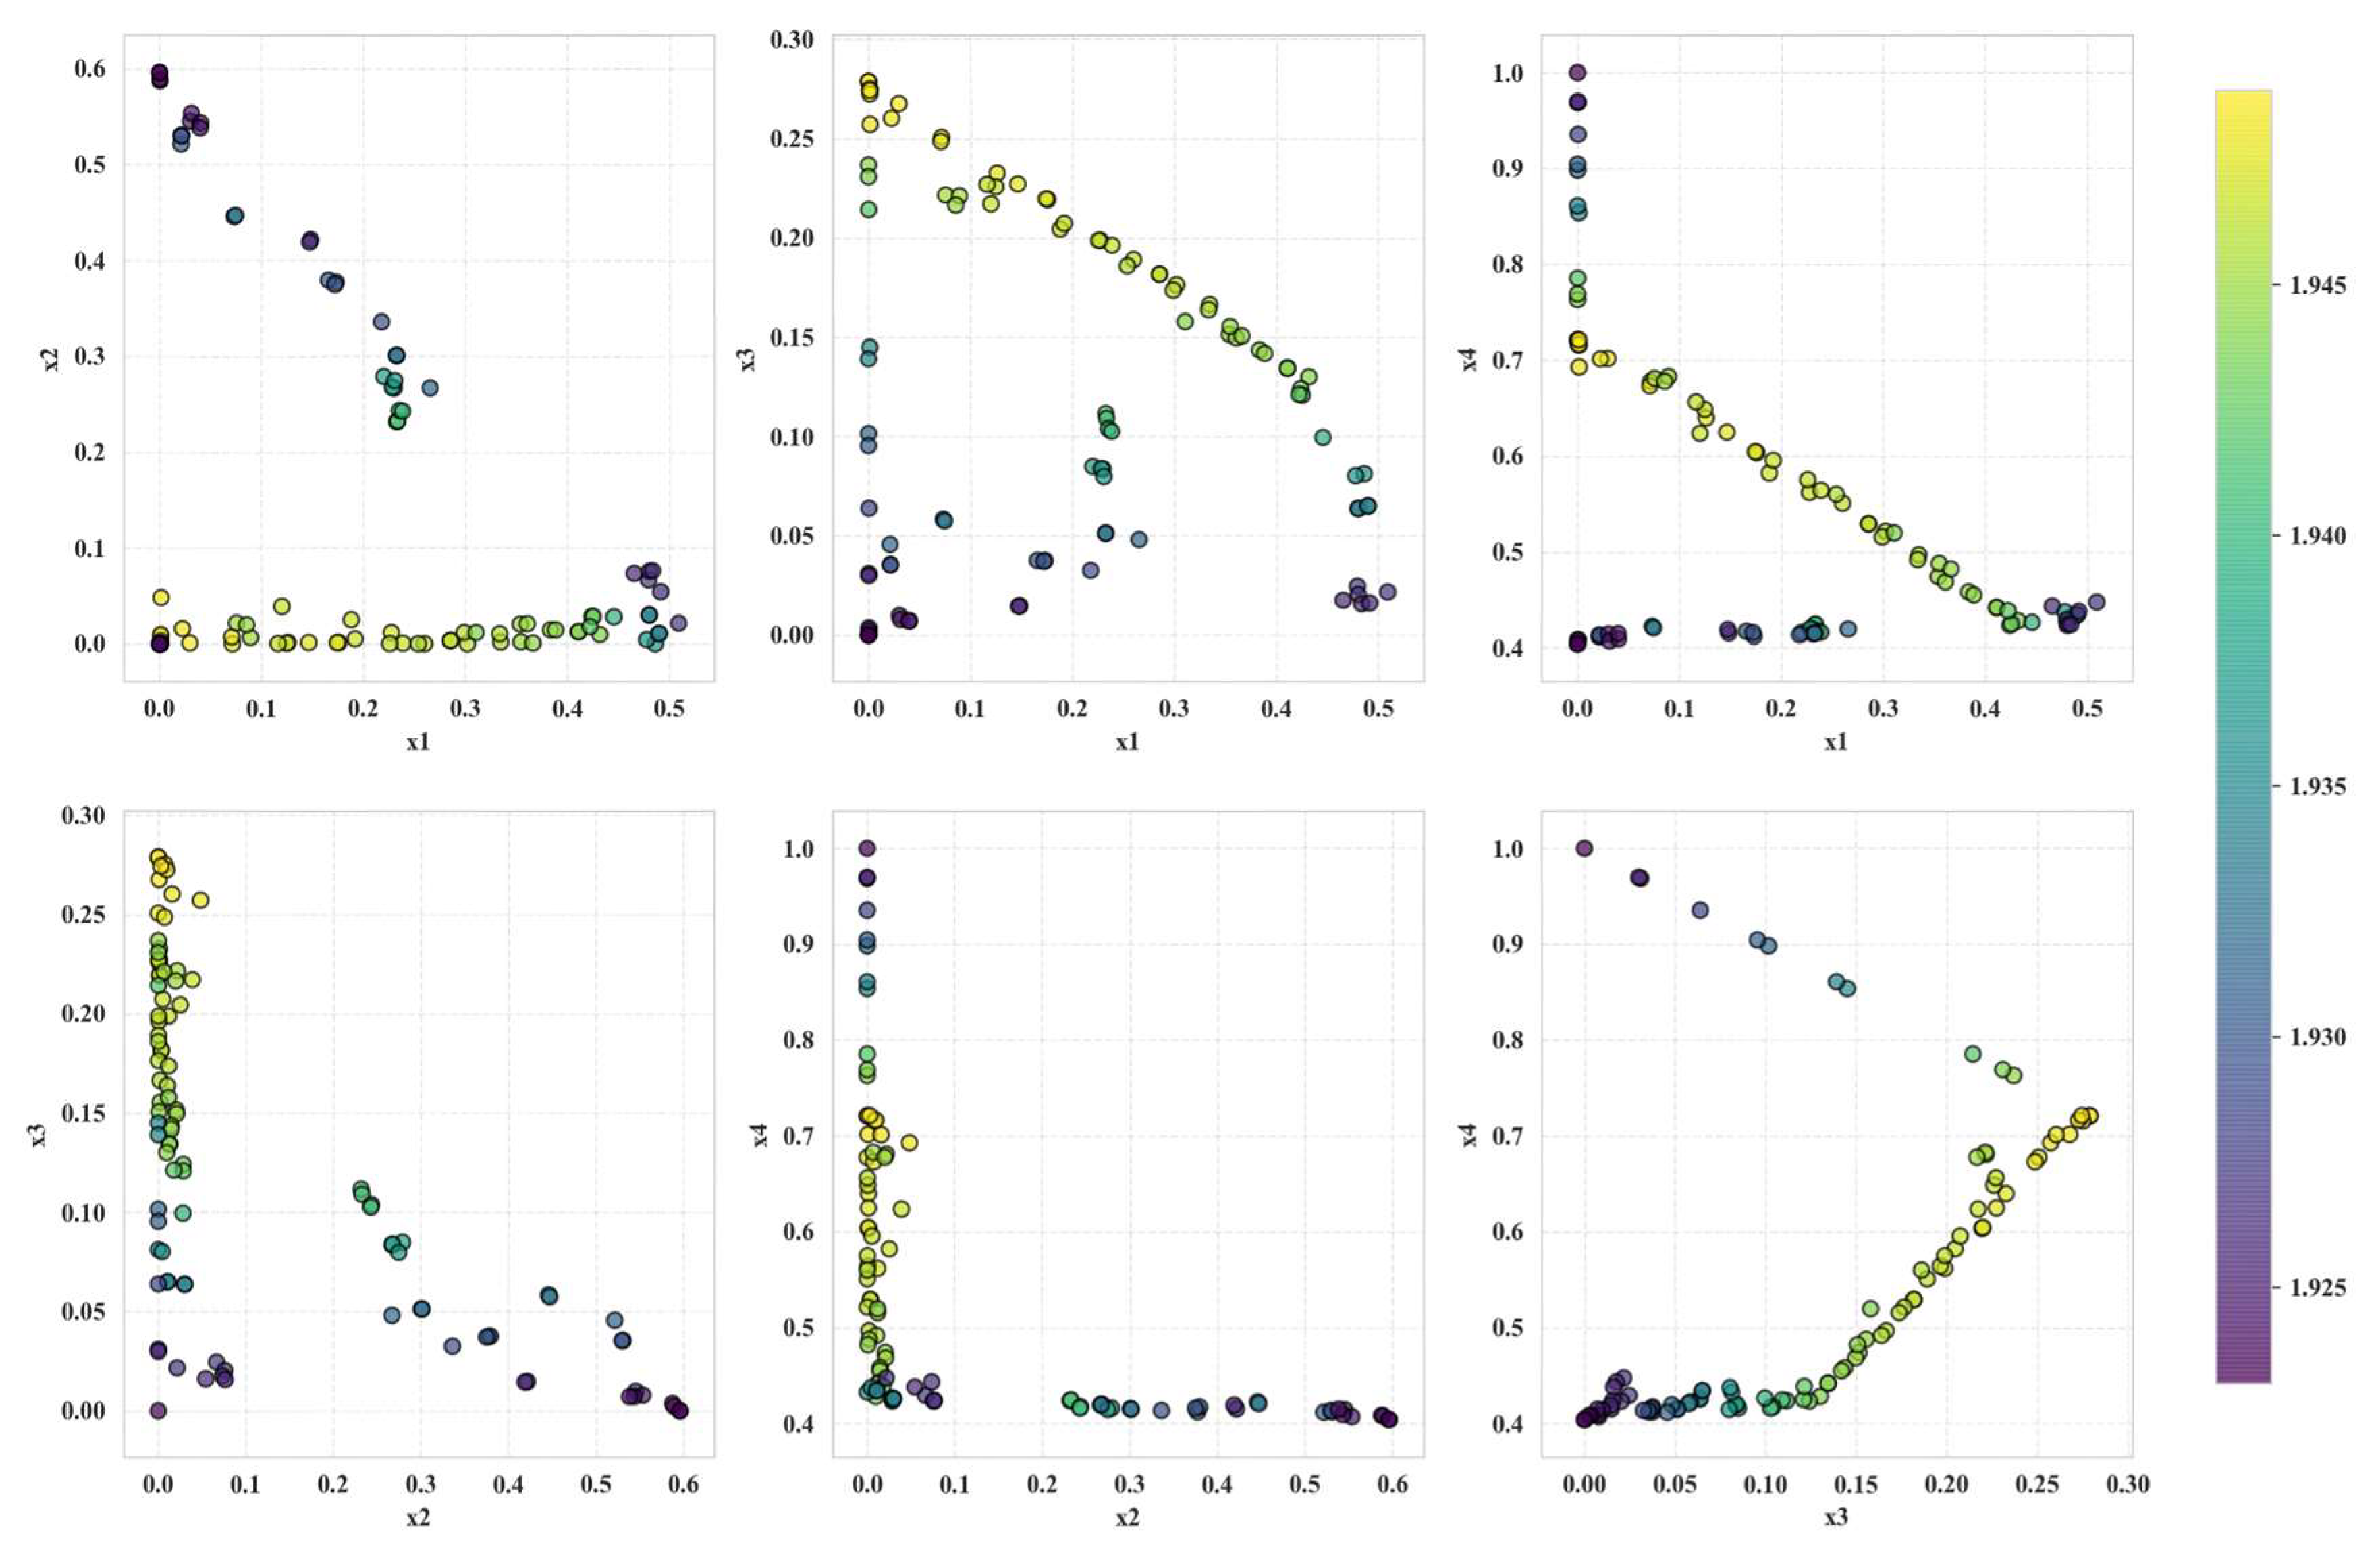
Figure 3,
Figure 4,
Figure 5 and
Figure 6 present the Pareto front for the objective functions.
The figures illustrate the Pareto front derived from the four objective functions. The visualization approach provides a clear and intuitive illustration of the distribution characteristics of non-dominated solutions generated by the improved NSGA–II. It is important to note that all solutions depicted in the figures satisfy the complete set of constraint conditions defined in the multi-objective optimization framework. Each figure presents a projection of the Pareto front onto a two-dimensional plane, where the x-axis and y-axis respectively represent combinations of the decision variables
,
,
, and
. The colors represent the objective functions’ values, which are smaller for deeper colors and larger for lighter colors. Clearly, the decision variables have varying effects on the values of the objective functions.
Figure 3 corresponds to the objective function
. The first subfigure shows the combination of decision variables
and
. It can be seen that
and
are positively correlated with
. The fifth subfigure shows the combination of decision variables
and
. Under the same conditions, the larger the value of
is, the larger the value of
; conversely, the smaller the value of
is, the larger the value of
.
Figure 3 aligns with reality. Similarly,
Figure 4,
Figure 5 and
Figure 6 also reflect reality.
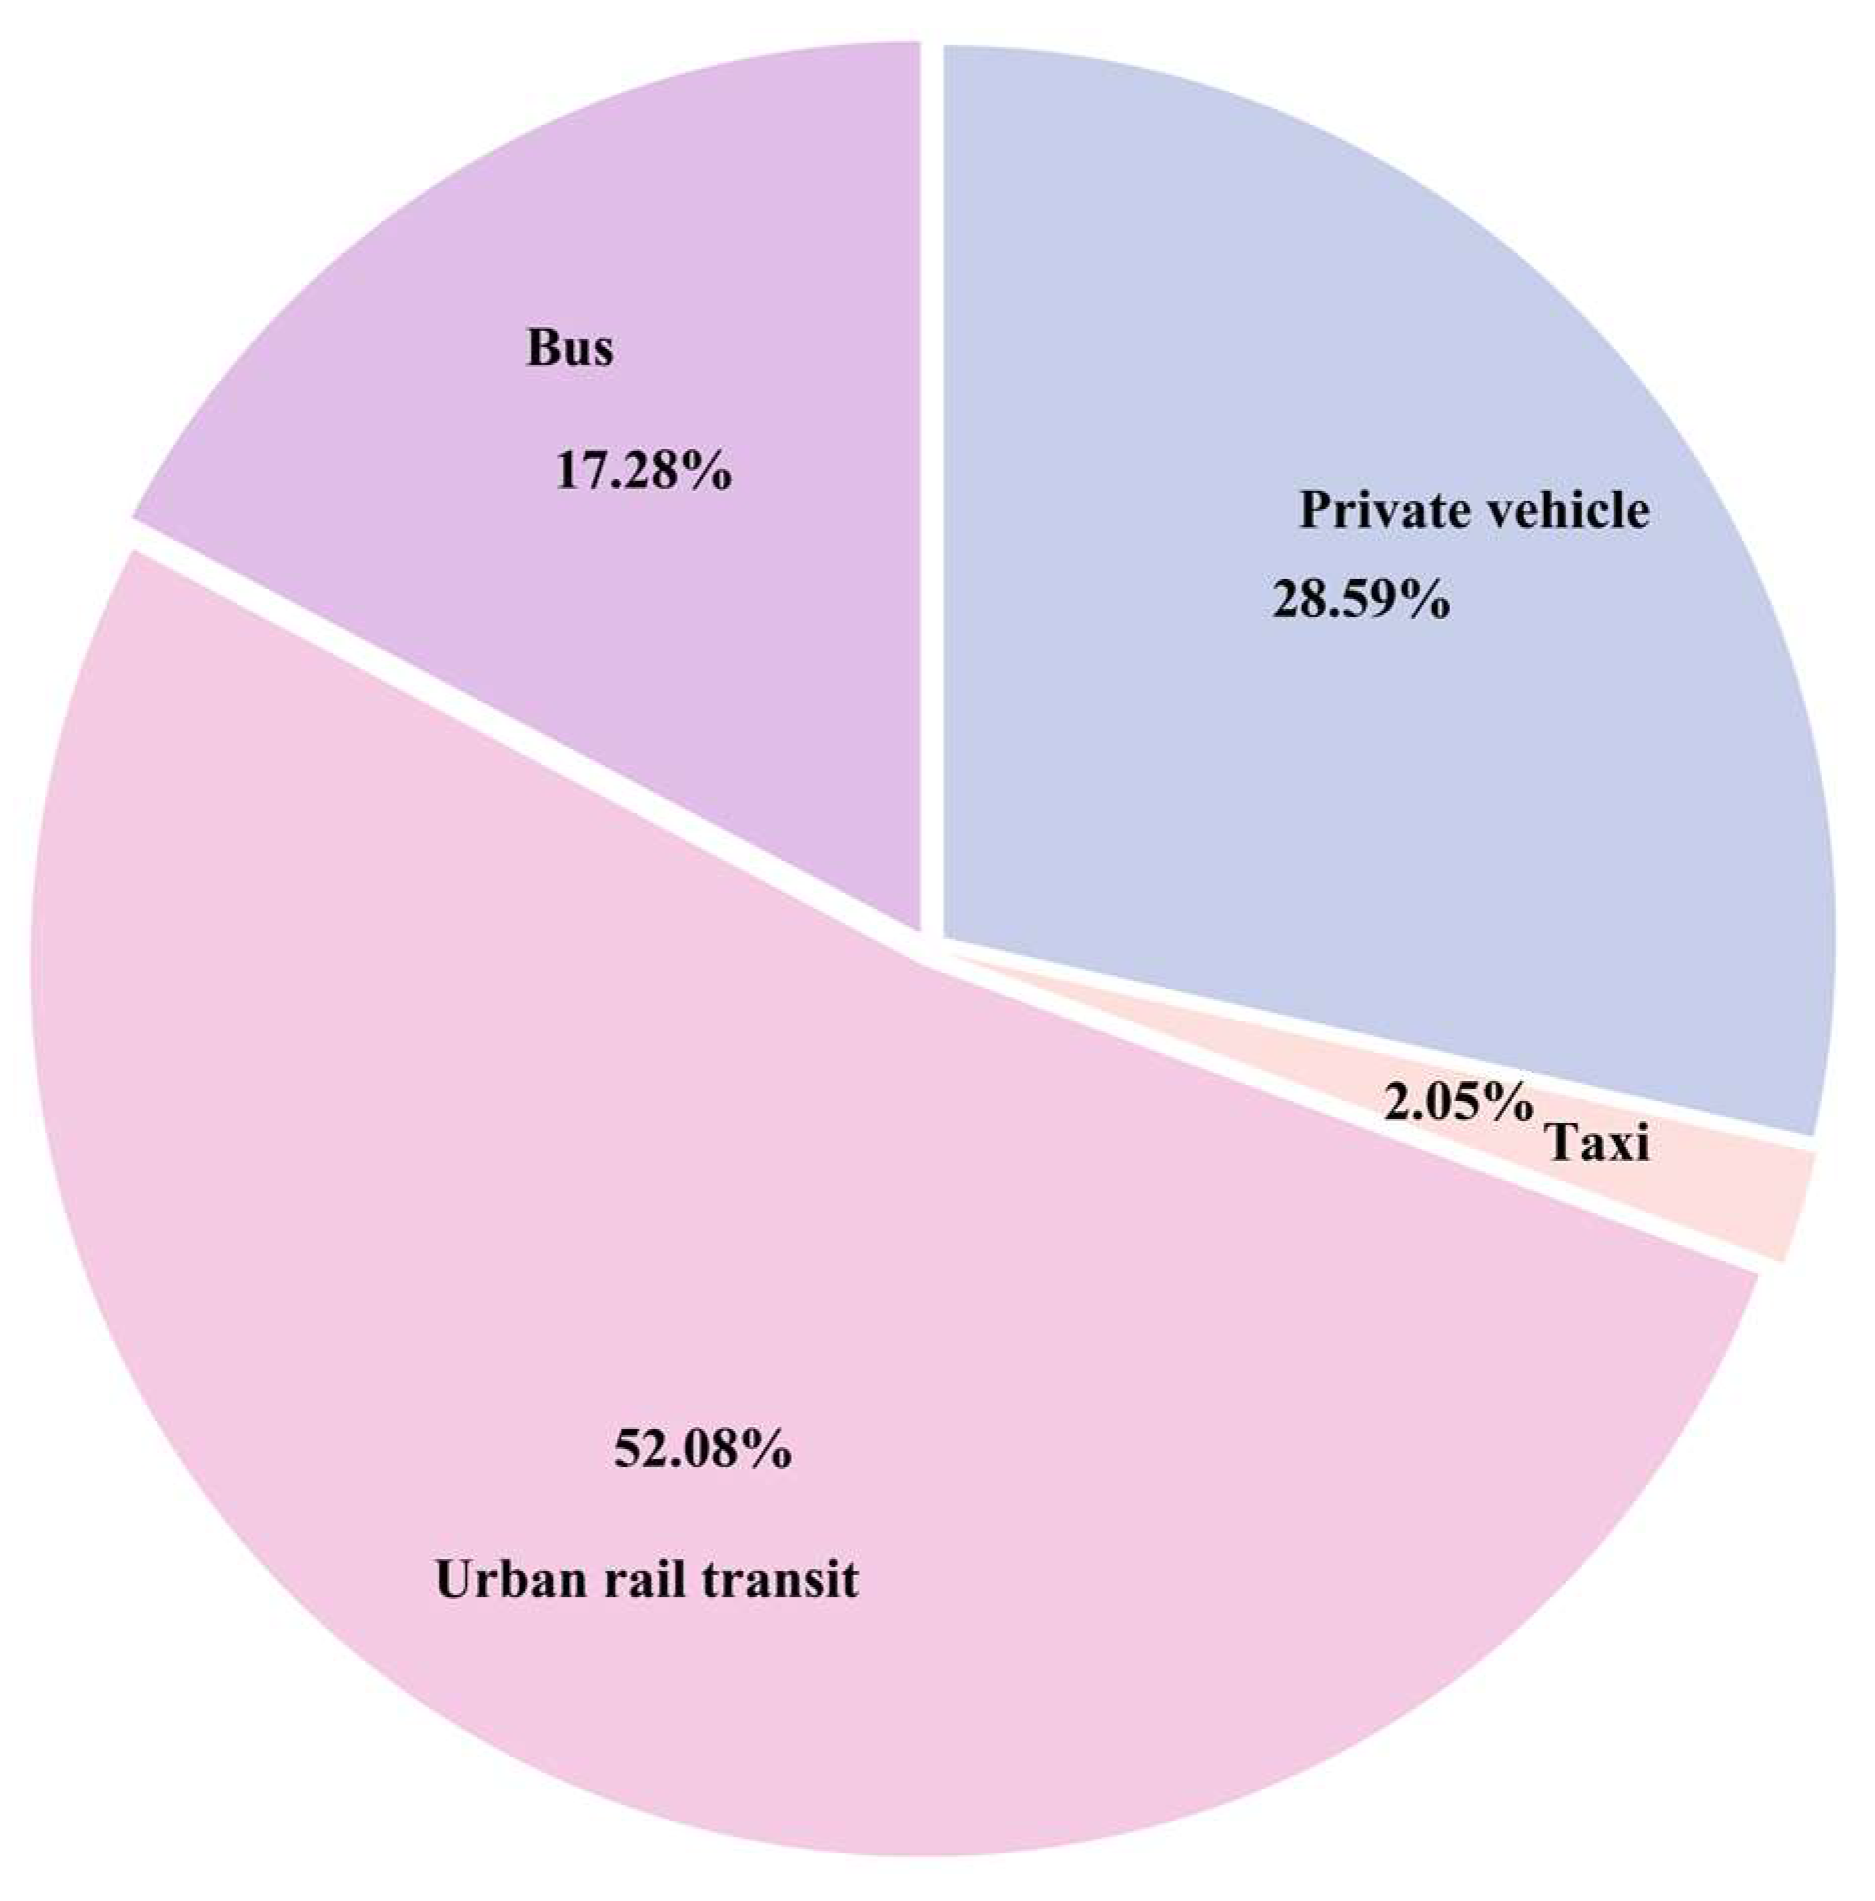
Figure 7 shows one set of optimization results for Beijing’s passenger transport structure in 2035.
As can be seen from
Figure 3,
,
,
,
. This indicates that Beijing’s urban passenger transport structure in 2035 will consist of 28.59% private vehicles, 2.05% taxis, 17.28% buses, and 52.08% urban rail transit. The significant share of urban rail transit highlights its critical role in reducing transport CO
2 emissions and costs while improving travel quality. The proportion of private cars has been reduced from the previous level. Buses and taxis complement the overall structure by providing flexible and accessible options for passengers. The values of the objective functions are calculated as follows:
,
,
, corresponding to transport CO
2 emissions, travel costs, travel quality, and the utilization rate of public transport operation lines in 2035, respectively. The single-year case study not only provides a snapshot of Beijing’s potential passenger transport structure in 2035 but also establishes a foundation for comparing the scenarios of multiple years.
To provide a more intuitive comparison between the improved NSGA–II and the standard NSGA–II, a comparison in terms of the cardinality of the Pareto front (CPF), hypervolume (HV), average crowding distance (ACD), and processing time (PT in seconds) is shown in
Table 3.
As shown in
Table 3, the indicators of the improved NSGA–II are superior to those of the standard NSGA–II overall. CPF represents the number of non-dominated solutions in the Pareto frontier. The two algorithms perform uniformly in this aspect. HV represents the volume proportion of the Pareto frontier covering the target space. The improved NSGA–II has a slightly higher HV value than the standard NSGA–II, indicating that the improved NSGA–II performs better. ACD indicates the degree of uniformity of the distribution of solutions in the Pareto frontier—they are nearly identical. PT in seconds refers to the processing time. The improved NSGA–II is faster according to the results.
The advantages of the improved NSGA–II are as follows. It incorporates the local search mechanism, making it show better performance when solving the multi-objective model. Additionally, its processing time is reduced. Regarding its limitations, the performance of the improved NSGA–II is influenced by its parameter settings, where adaptive strategies have not yet been considered. It is one of the research directions we plan to explore in the future.
4.3. Case 2: Multiple Years
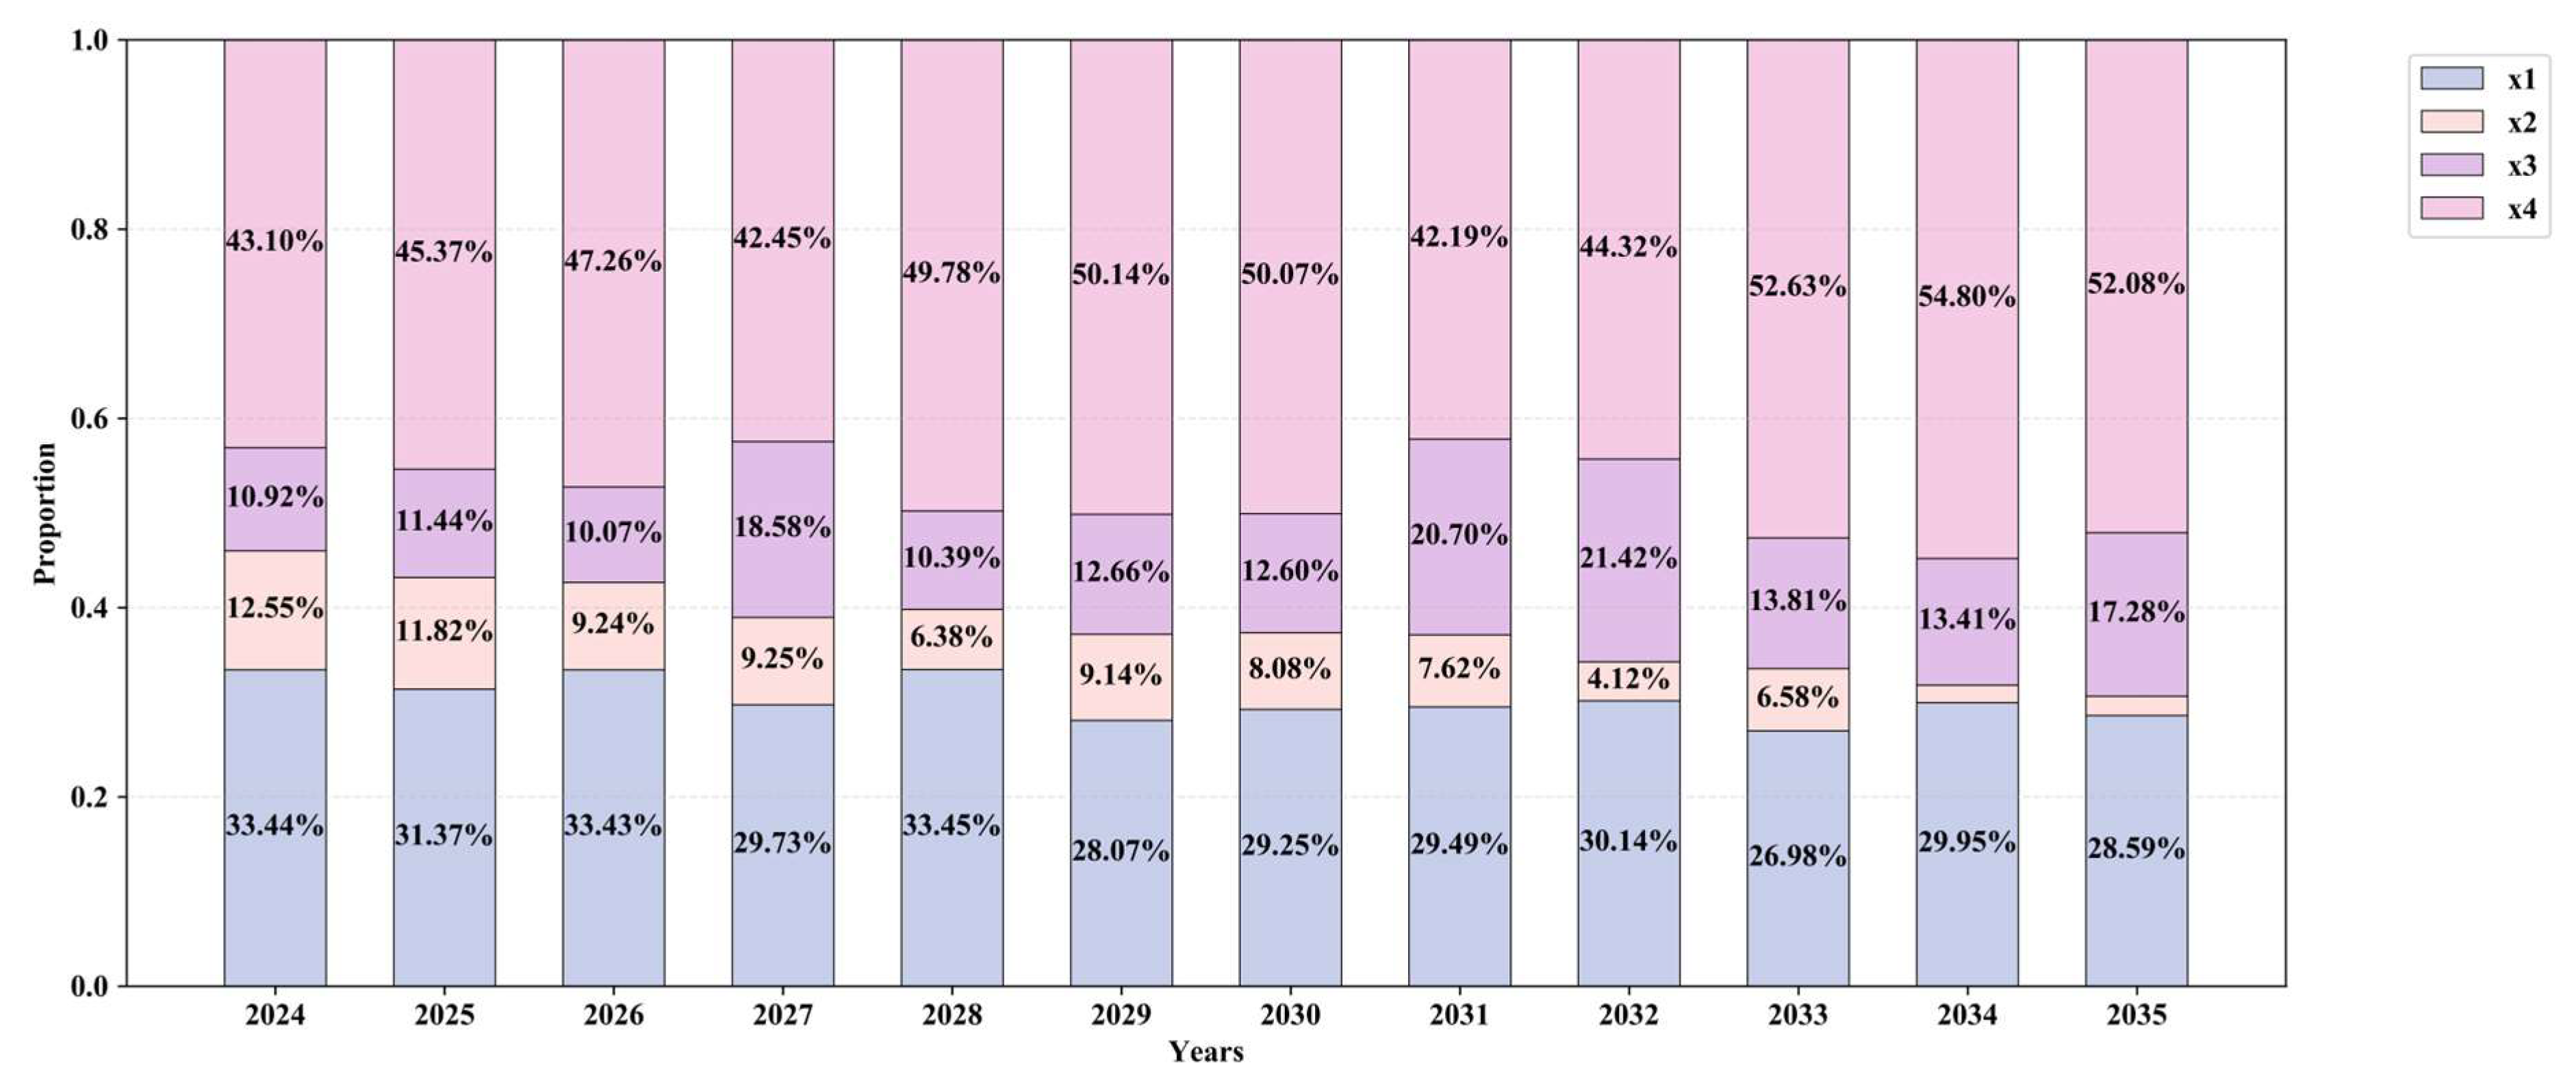
Results analysis for a specific year is insufficient; it is necessary to analyze results over multiple years. The results of the multi-objective optimization model of Beijing’s passenger transport structure from 2024 to 2035 are displayed in
Figure 8.
The evolution trend of the passenger transport structure in Beijing is clear from 2024 to 2035. Urban rail transit corresponds to , maintaining its dominant position with relatively small fluctuations in the proportion. It indicates that urban rail transit will become a core component of the transport system, and passengers will become more dependent on urban rail transit. corresponds to private vehicles, showing some fluctuations but remaining significant, indicating a significant role within the transport system. corresponds to taxis, which account for a relatively small proportion but still play a vital role in providing flexible services for certain travel demands. corresponds to buses, which have shown a gradual trend of change over the years, adapting to the overall transformation of the transport network. The interplay among components reveals the intricate mechanisms of interaction within the urban transport system. The evolution of the proportion of the four transport modes from 2024 to 2035 indicates a structural transformation in urban passenger transport, reflecting the ongoing dynamic equilibrium of the system.
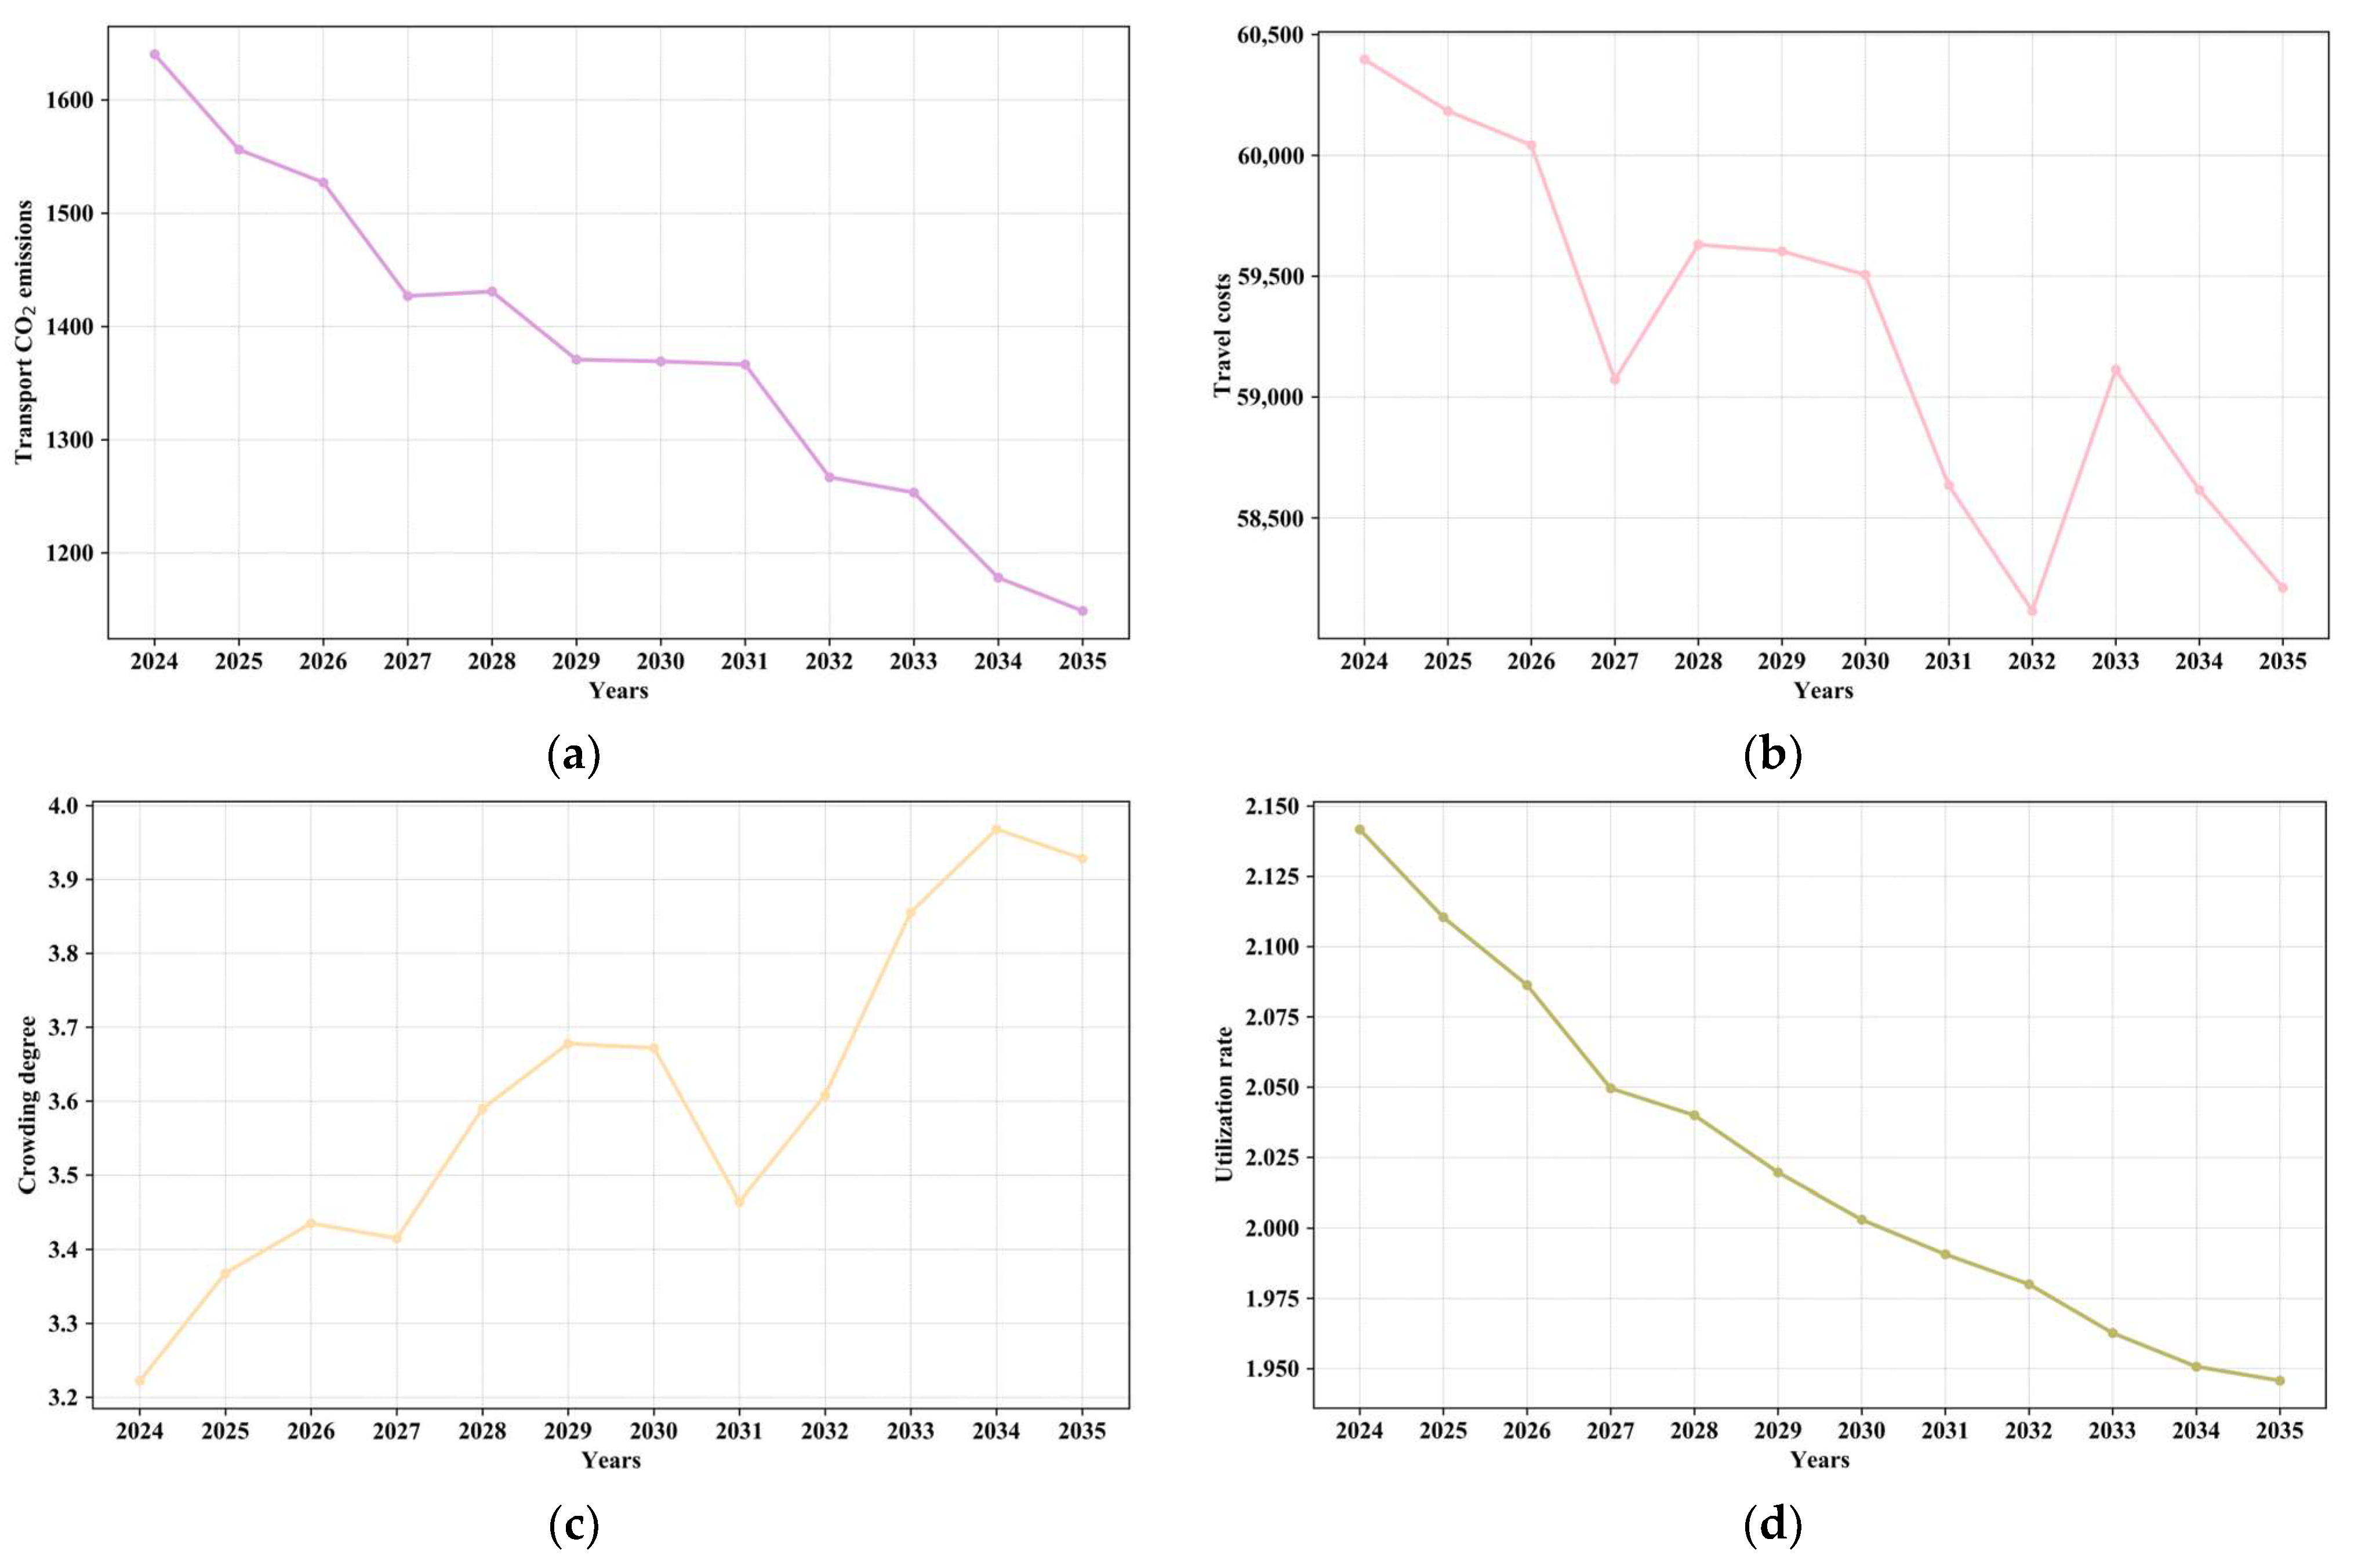
Transport CO
2 emissions, travel costs, crowding degree, and utilization rate from 2024 to 2035 are shown in
Figure 9.
A comprehensive analysis based on four sets of time series data indicates that the transport system exhibits significant tradeoffs among multiple objectives, including environmental benefits, economic benefits, and service quality. This means that an improvement in one aspect often leads to damage in other aspects. Transport CO2 emissions show a fluctuating downward trend, which indicates the effectiveness of the emission reduction measures. Travel costs fluctuate more significantly, demonstrating a certain degree of economic controllability. The fluctuating increase in crowding degree indicates that there is a certain degree of reduction in the system’s comfort. The utilization rate of resources shows a significant and continuous downward trend, and the operational efficiency of the system is gradually declining.
5. Conclusions
A scientific and rational transport structure is indispensable for achieving sustainable urban development. To address the pressing challenges of escalating travel demand and environmental pressures, it is imperative to develop low-carbon transport modes, particularly the establishment of an urban rail transit-backed backbone system.
From a systemic perspective, we construct a multi-objective optimization model aimed at minimizing transport CO2 emissions and travel costs while maximizing travel quality and the utilization rate of public transport operation lines. In this model, we consider the constraints from travel demand, accessibility, energy consumption, transport land, normalization and non-negativity, and range. The model is solved using the improved NSGA–II. We improve NSGA–II by incorporating a local search mechanism, thereby balancing global exploration with local digging.
A case study of Beijing, China, is conducted to validate the proposed methods. The results are analyzed from both single-year and multi-year perspectives. We plot the Pareto front figures and analyze the results in a single year. The evolution trends in transport structure are presented based on results from multiple years. The findings affirm that optimizing the passenger transport structure can reduce transport CO2 emissions. The improved NSGA–II performs better than the standard NSGA–II. The methods presented in this paper are transferable to other cities and offer some guidance for policymakers and researchers engaged in optimizing the urban transport structure.