1. Introduction
Under the paradigm of Industry 4.0 [
1], intelligent manufacturing systems demand real-time, accurate, and deployable visual inspection solutions. Steel surface defect detection plays a critical role in ensuring product quality and production safety, especially in high-risk industries such as steel manufacturing. However, steel defects are often tiny, low-contrast, and boundary-ambiguous under complex textures (e.g., rolling marks, crazing), challenging illumination, and noisy production environments. These characteristics commonly lead to missed detections and inaccurate localization, particularly when defects exhibit large-scale variations.
Traditional defect detection methods rely on handcrafted features (grayscale, edges, texture) [
2] or shallow machine learning (e.g., K-means, Fuzzy C-means) [
3,
4]. These approaches are vulnerable to complex backgrounds and low contrast, and their performance is limited by the poor generalization of handcrafted features. With the advent of deep learning, Convolutional Neural Networks (CNNs) have demonstrated significant advantages in feature extraction and representation learning [
5,
6]. More recently, Transformer-based detectors such as DETR [
7] and RT-DETR [
8] have achieved remarkable progress in general object detection, but their high computational cost restricts their adoption in industrial real-time scenarios. Consequently, the YOLO (You Only Look Once) series [
9] has become the mainstream choice for industrial vision tasks due to its favorable trade-off between accuracy and inference efficiency. Iterations from YOLOv5 to YOLOv11 [
10,
11,
12,
13,
14,
15,
16,
17,
18,
19] have continuously improved feature pyramids, attention mechanisms, and structural re-parameterization; nevertheless, challenges persist for steel surface defect detection.
In recent years, many YOLO-based improvements have been proposed for steel surface defect detection, focusing on reducing weight [
20,
21,
22,
23], attention enhancement [
24,
25,
26,
27], and multi-scale feature fusion [
28,
29,
30,
31,
32,
33,
34]. Despite these efforts, existing YOLO-based methods still suffer from three major limitations. First, they provide insufficient local spatial modeling for deformed or blurred defect boundaries, which are common in steel surfaces. Second, their cross-scale feature interaction during multi-level fusion remains limited, especially under complex and low-contrast backgrounds. Third, structural weight reduction often causes loss of fine-grained details, leading to reduced detection accuracy for small defects [
35]. To the best of our knowledge, no existing YOLO-based method simultaneously addresses local spatial adaptability, cross-scale feature interaction, and inference efficiency in a unified framework for steel surface defect detection. The following scientific challenges therefore remain unresolved: how to adaptively model spatial variations of defects at different scales without increasing computational overhead; how to effectively integrate multi-scale features across layers while preserving low-level detail; and how to decouple training-time representational capacity from inference-time complexity for real-time industrial deployment.
To tackle these challenges, we propose YOLOv11-LLR, an enhanced detection framework built upon YOLOv11. YOLOv11-LLR integrates three complementary modules: Deformable Large Kernel Attention (DLKA) [
36] for adaptive spatial modeling of deformed and blurred defects; Lightweight Group-wise Attention (LWGA) [
37] for efficient cross-scale feature interaction; and Re-parameterized Convolution (RepConv) [
38] to decouple training and inference, preserving representational power while enabling fast deployment. We evaluate YOLOv11-LLR on two representative industrial datasets: NEU-DET (six defect types) and GC10-DET (ten defect types). Experimental results demonstrate consistent and substantial improvements over baseline YOLOv11 and other state-of-the-art YOLO variants, confirming the effectiveness and robustness of the proposed approach. The remainder of this paper is organized as follows.
Section 1 reviews related work.
Section 2 presents the YOLOv11-LLR framework in detail.
Section 3 describes the experimental setup and datasets.
Section 3 reports and discusses results, including ablation studies.
Section 4 concludes the paper and outlines future work.
2. Materials and Methods
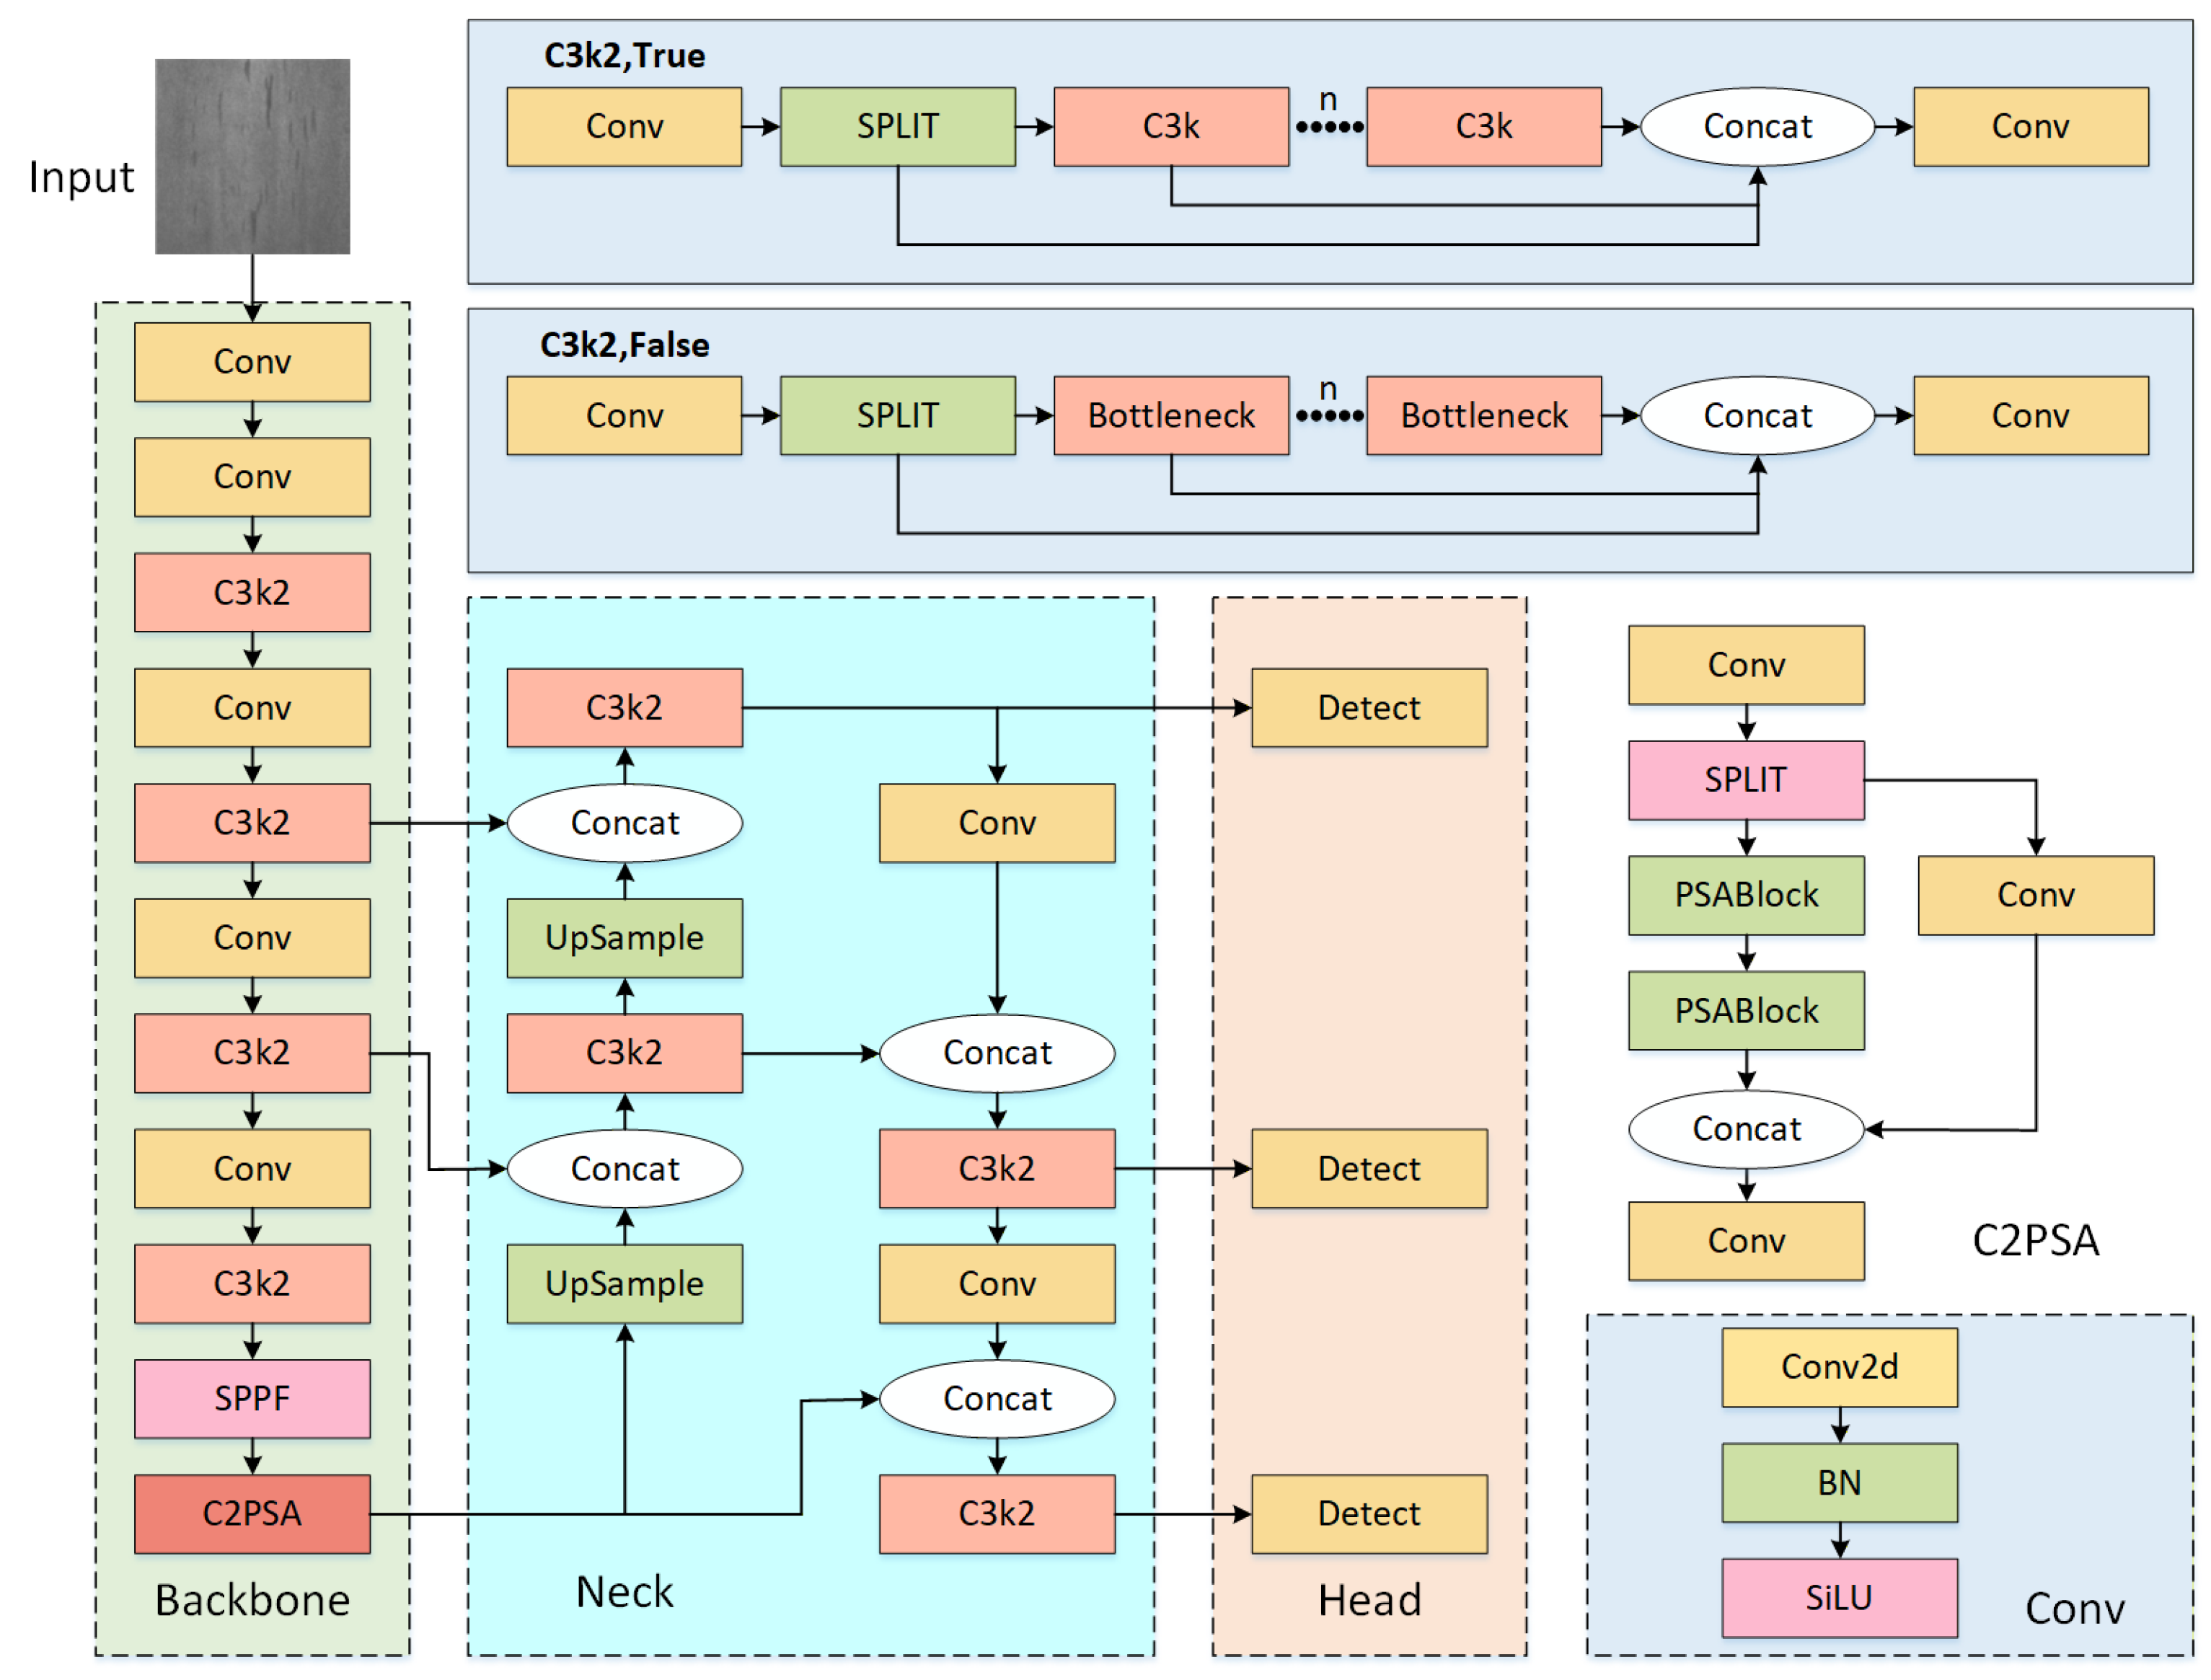
In this study, YOLOv11 was chosen as the detection model for steel surface defect detection, primarily due to its effective balance between accuracy, inference speed, and computational efficiency, which is especially suitable for deployment-oriented industrial applications. Compared to earlier versions in the YOLO series, YOLOv11 has been optimized in several areas, particularly in the integration of multi-scale feature fusion and an anchor-free prediction mechanism, which makes it particularly advantageous for handling complex industrial defect detection tasks. YOLOv11, with its enhanced feature extraction capability and efficient inference speed, is able to process complex images in a shorter time and maintain high accuracy in detecting targets of varying scales, which is particularly important for steel surface defect detection. Although it performs excellently in handling high contrast and complex backgrounds, YOLOv11 still has limitations, such as insufficient spatial modeling capability, poor cross-layer information fusion, and difficulty in handling blurred boundaries or deformed targets. To address these issues, this paper introduces a set of targeted optimizations, constructing an enhanced detection framework named YOLOv11-LLR (YOLOv11 with DLKA, LWGA, and RepConv). This framework integrates three key modules—Deformable Large Kernel Attention (DLKA), Lightweight Grouped Attention (LWGA), and Re-parameterizable Convolution (RepConv)—to further enhance YOLOv11’s spatial modeling, cross-scale feature interaction, and inference efficiency. The overall architecture of YOLOv11 is shown in
Figure 1.
The introduction of these modules allows YOLOv11-LLR to overcome the limitations of YOLOv11 in multi-scale feature transmission and cross-layer information fusion. Specifically, DLKA enhances the model’s ability to model deformed structures and blurred boundaries commonly found in steel surface defects; LWGA strengthens the interaction of multi-scale features, enabling the model to handle defects of varying scales and textures more effectively; and RepConv optimizes inference efficiency, making the model more suitable for large-scale industrial applications. These optimizations collectively improve YOLOv11-LLR’s performance in complex industrial defect detection tasks and ensure its efficiency in real-world deployment.
2.1. Overall Optimization Strategy
To overcome the limitations of YOLOv11, we introduce three complementary optimizations, each detailed in a subsequent subsection. First, local spatial modeling is enhanced via Deformable Large Kernel Attention (DLKA,
Section 2.2), which is designed to capture deformed and blurred defect boundaries. Second, cross-scale feature interaction is achieved through Lightweight Group-wise Attention (LWGA,
Section 2.3), enabling effective multi-scale information exchange at low computational cost. Third, inference efficiency is improved by Re-parameterized Convolution (RepConv,
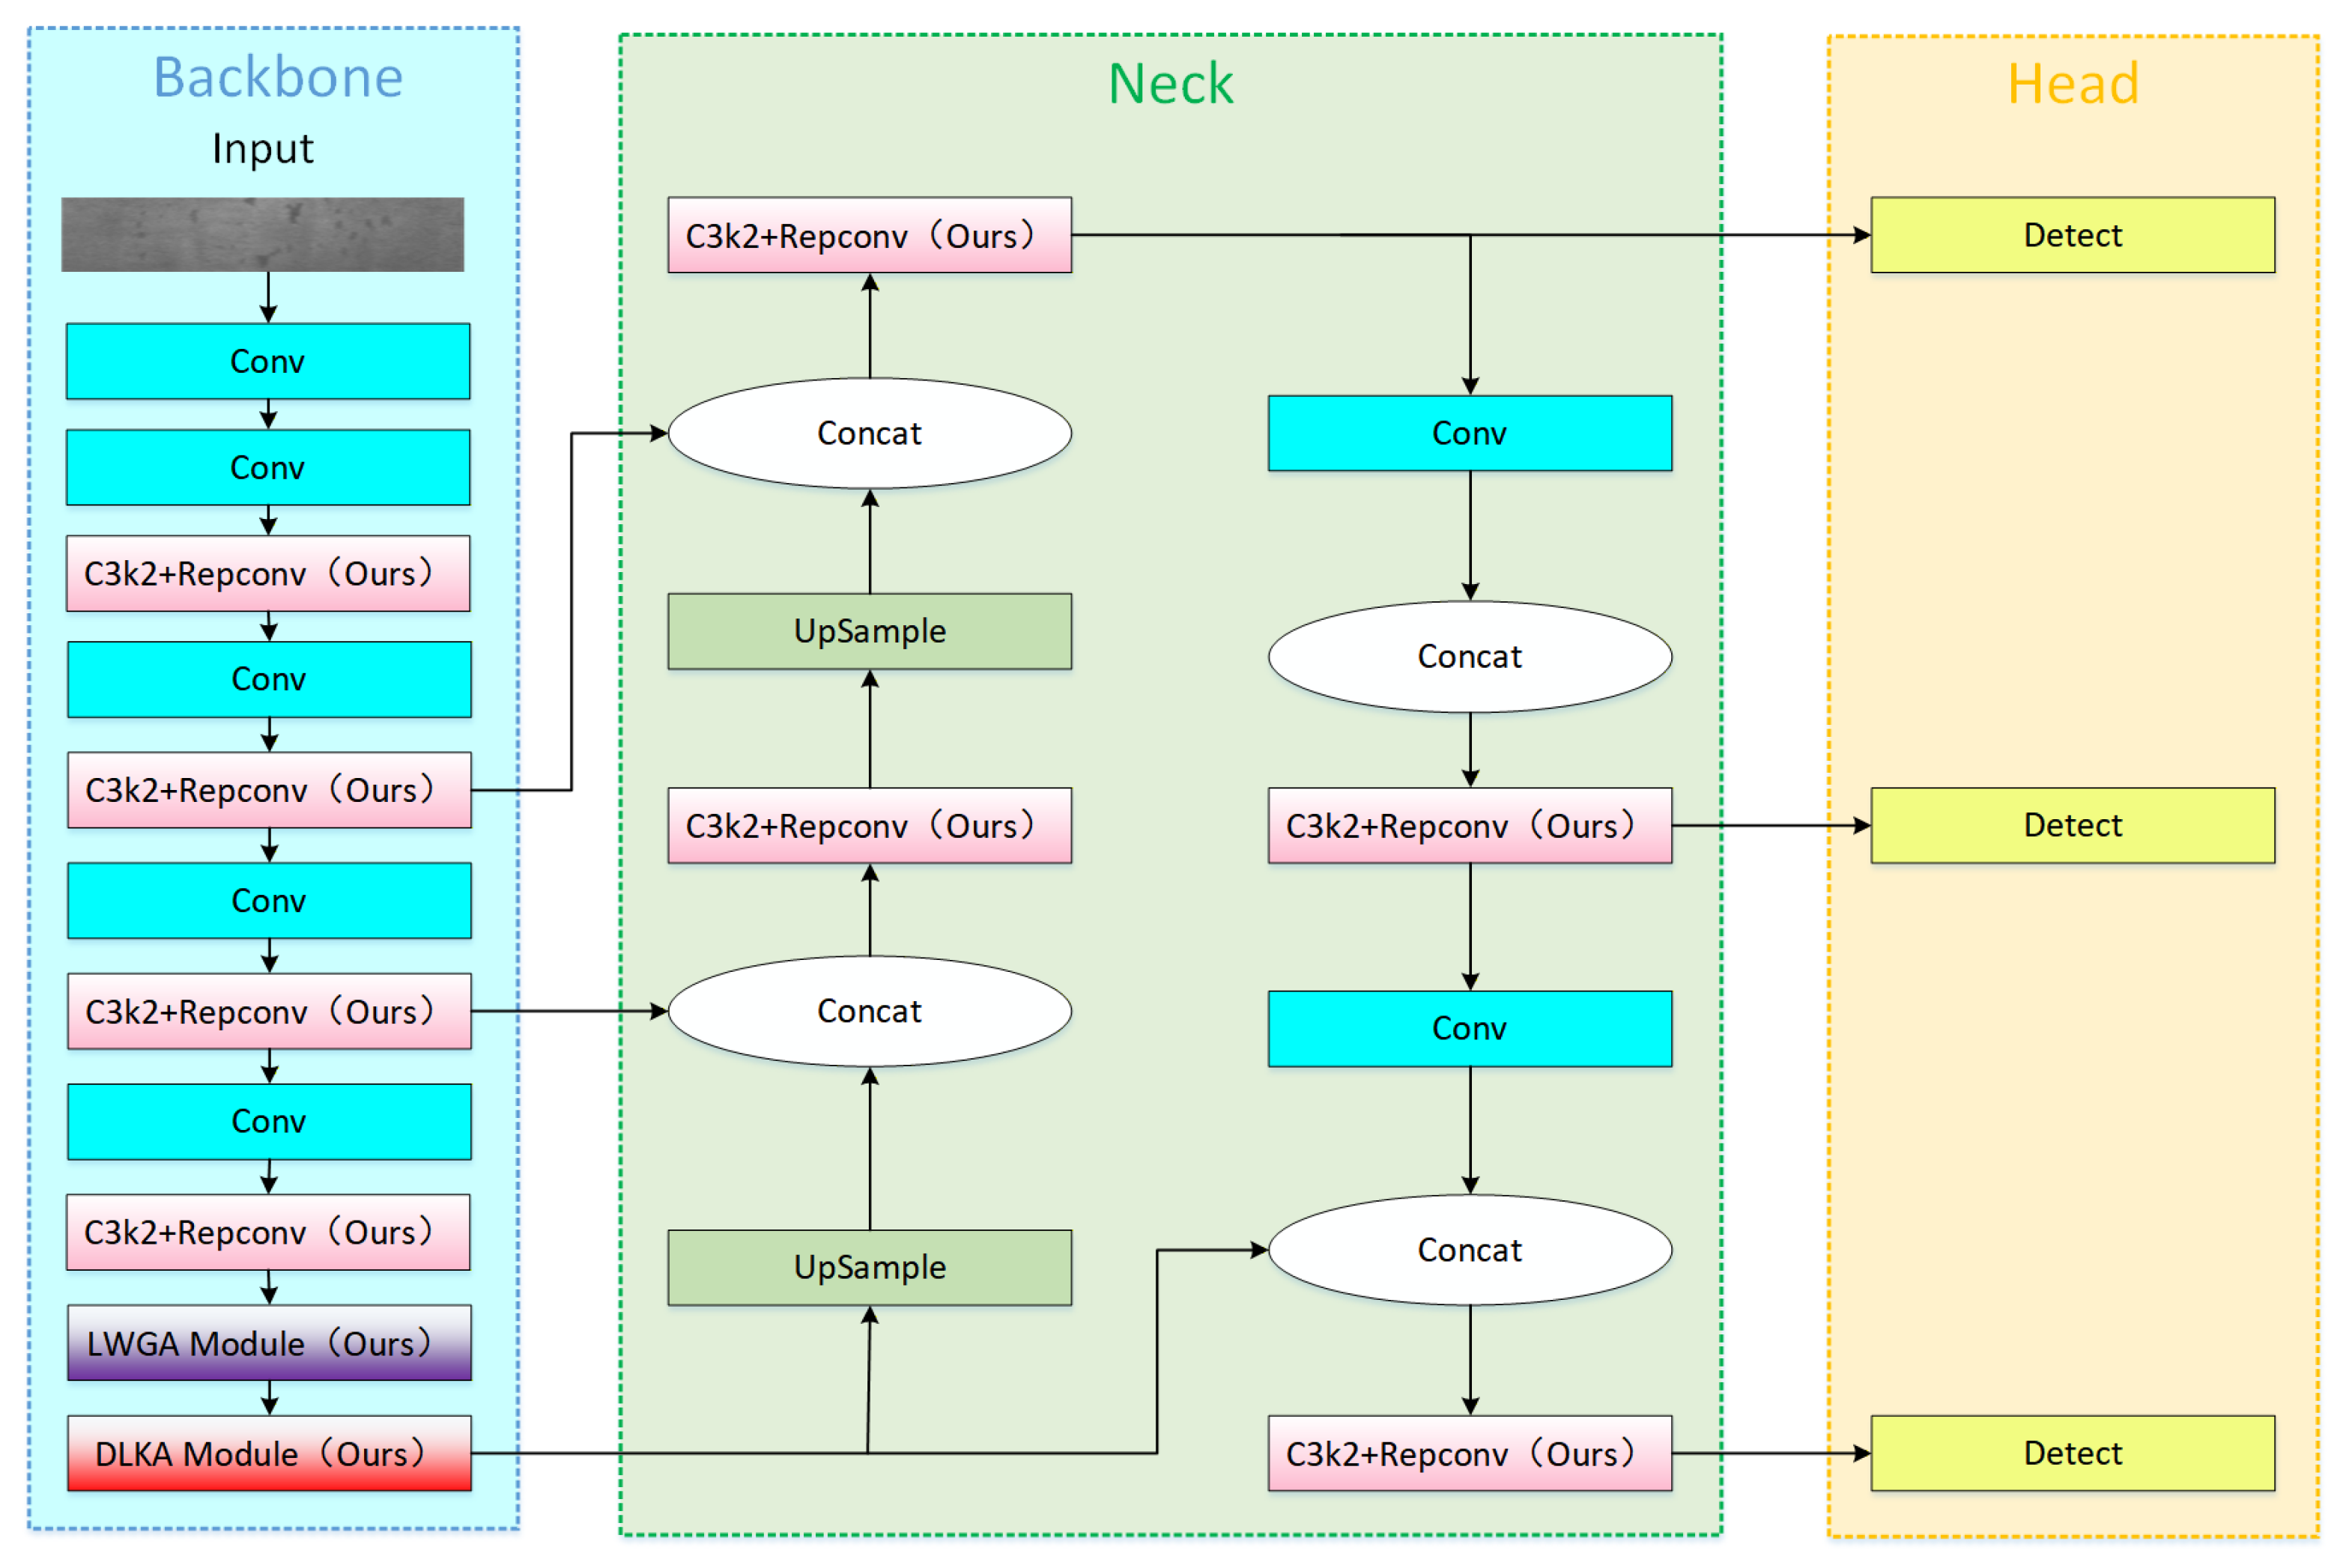
Section 2.4), which decouples training-time representational capacity from inference-time complexity. These modules are seamlessly integrated into YOLOv11’s backbone, neck, and convolutional layers respectively, as shown in
Figure 2.
2.2. Deformable LKA Module
To enhance the model’s ability to represent deformed structures and blurred boundaries, we adopt the Deformable Large Kernel Attention (DLKA) module [
36]. DLKA leverages deformable convolution to adaptively capture local spatial variations, which is beneficial for modeling complex textures and irregular defect shapes.
denotes the input feature map, where C, H, W are the channel number, height, and width.
First, a convolution compresses the feature dimension while preserving spatial resolution:
Then a GELU activation introduces non-linearity:
The core spatial modeling is performed using deformable convolution. For an output location pp, the deformable convolution is defined as:
where
is the number of sampling points (
),
are the pre-defined regular offsets
,
are learnable offset fields, and
are the corresponding convolutional weights. The offset fields
are predicted from the input feature map
via a separate convolutional layer; bilinear interpolation is used to make the sampling process differentiable.
To further enlarge the receptive field and capture long-range dependencies, a dilated deformable convolution is applied:
Here, denotes the dilation rate (set to in our experiments). This formulation integrates dilated convolution and deformable convolution by multiplying the fixed offsets by the dilation rate while keeping the learnable offsets unchanged. It allows the model to sample from a wider context without increasing the number of parameters.
An attention weight map is then generated by a
convolution followed by a sigmoid activation, and is used to re-weight the features:
where
is the sigmoid function,
is the attention map, and
denotes element-wise multiplication.
Finally, a residual connection adds the original input to the attended feature:
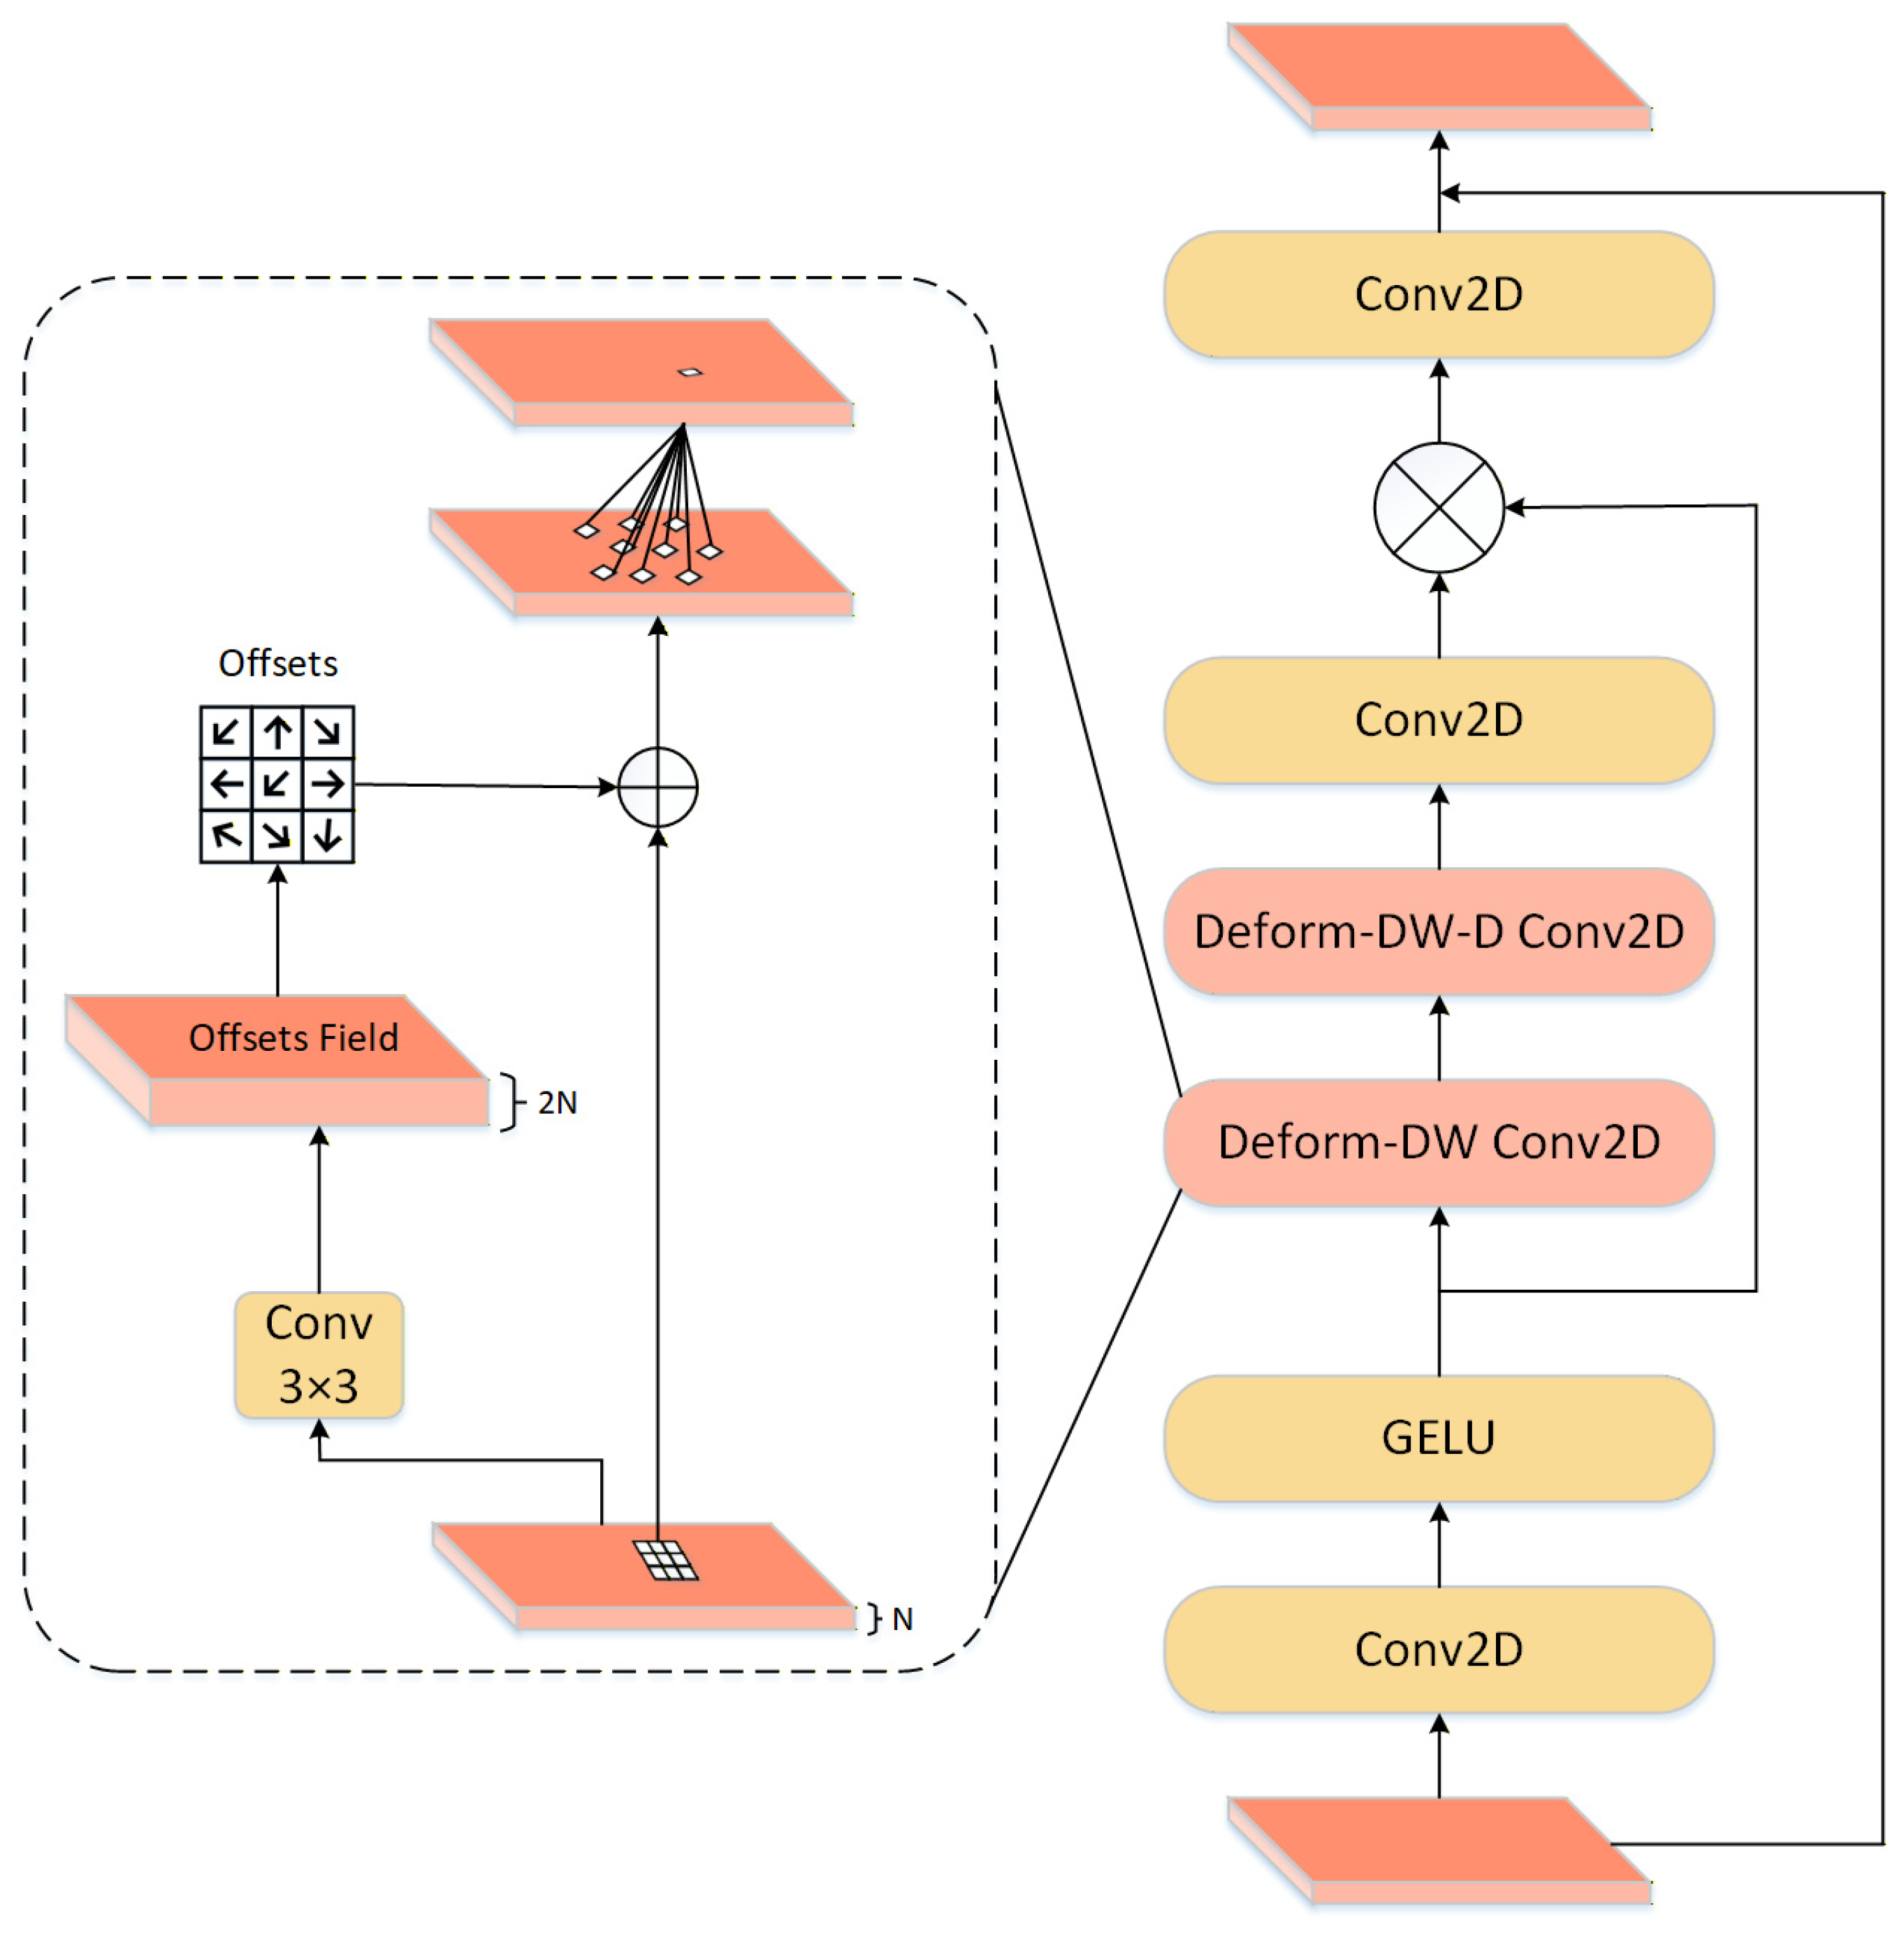
The entire DLKA structure is illustrated in
Figure 3. This residual design preserves the original information while enhancing defect-relevant spatial responses.
2.3. LWGA Lightweight Multi-Granularity Attention Module
The Lightweight Grouped Attention (LWGA) module [
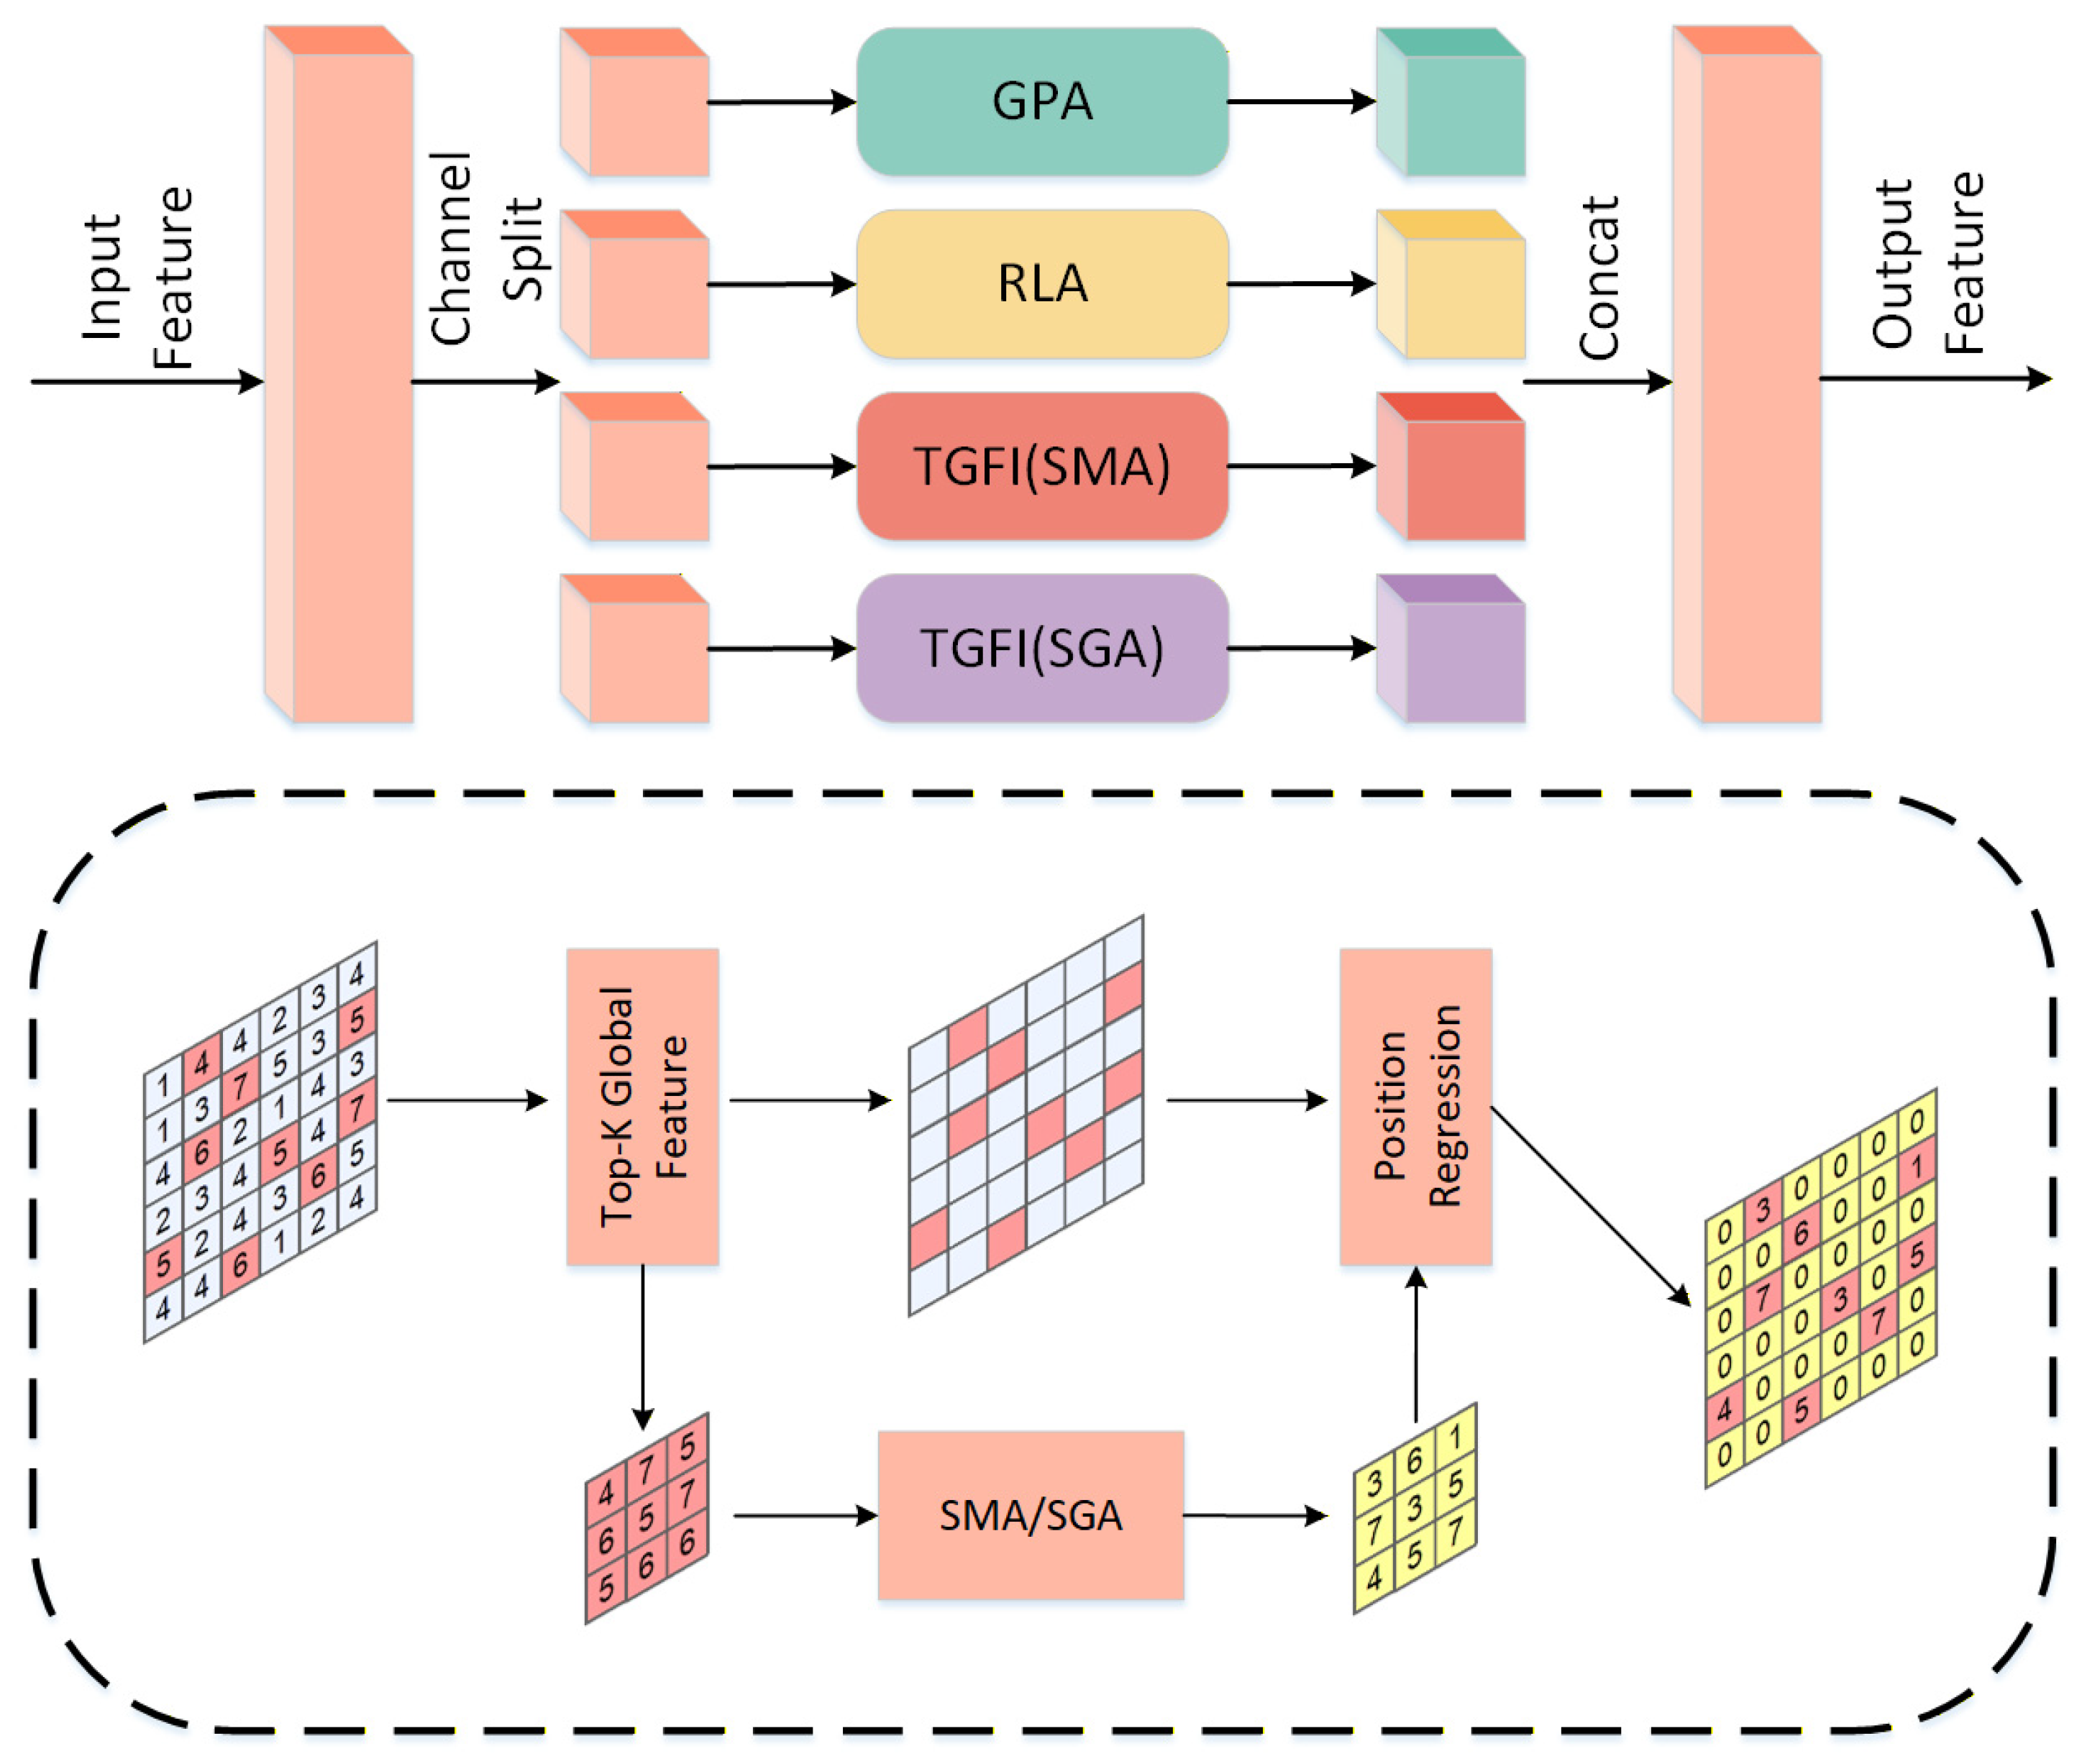
37] enhances multi-scale defect detection by splitting the input feature into four channel subgroups and processing each with a different attention branch: Point Attention (PA), Local Attention (LA), Medium-range Attention (MRA), and Global Attention (GA). Given
, the channels are split equally:
For the Point Attention branch, two successive convolutions generate point-wise attention responses:
The other three branches (LA, MRA, GA) perform local, medium-range, and global dependency modeling respectively, using different kernel sizes or pooling strategies. After obtaining the outputs of all four branches, they are concatenated along the channel dimension:
A Multi-Layer Perceptron (MLP) fuses the concatenated feature and enhances cross-channel interaction:
Finally, a residual connection yields the output:
Figure 4 illustrates the LWGA module. This design ensures robust multi-scale feature representation while maintaining low computational overhead.
2.4. Re-Parameterizable Convolution Structure (RepConv)
In industrial defect detection, the detection model is required to achieve both strong feature extraction capability and efficient inference speed. To address this, we introduce the Re-parameterizable Convolution (RepConv) module [
38]. RepConv adopts a multi-branch structure during training to enhance representation capacity, and merges the branches into a single convolution during inference, thereby reducing computational overhead and improving deployment efficiency.
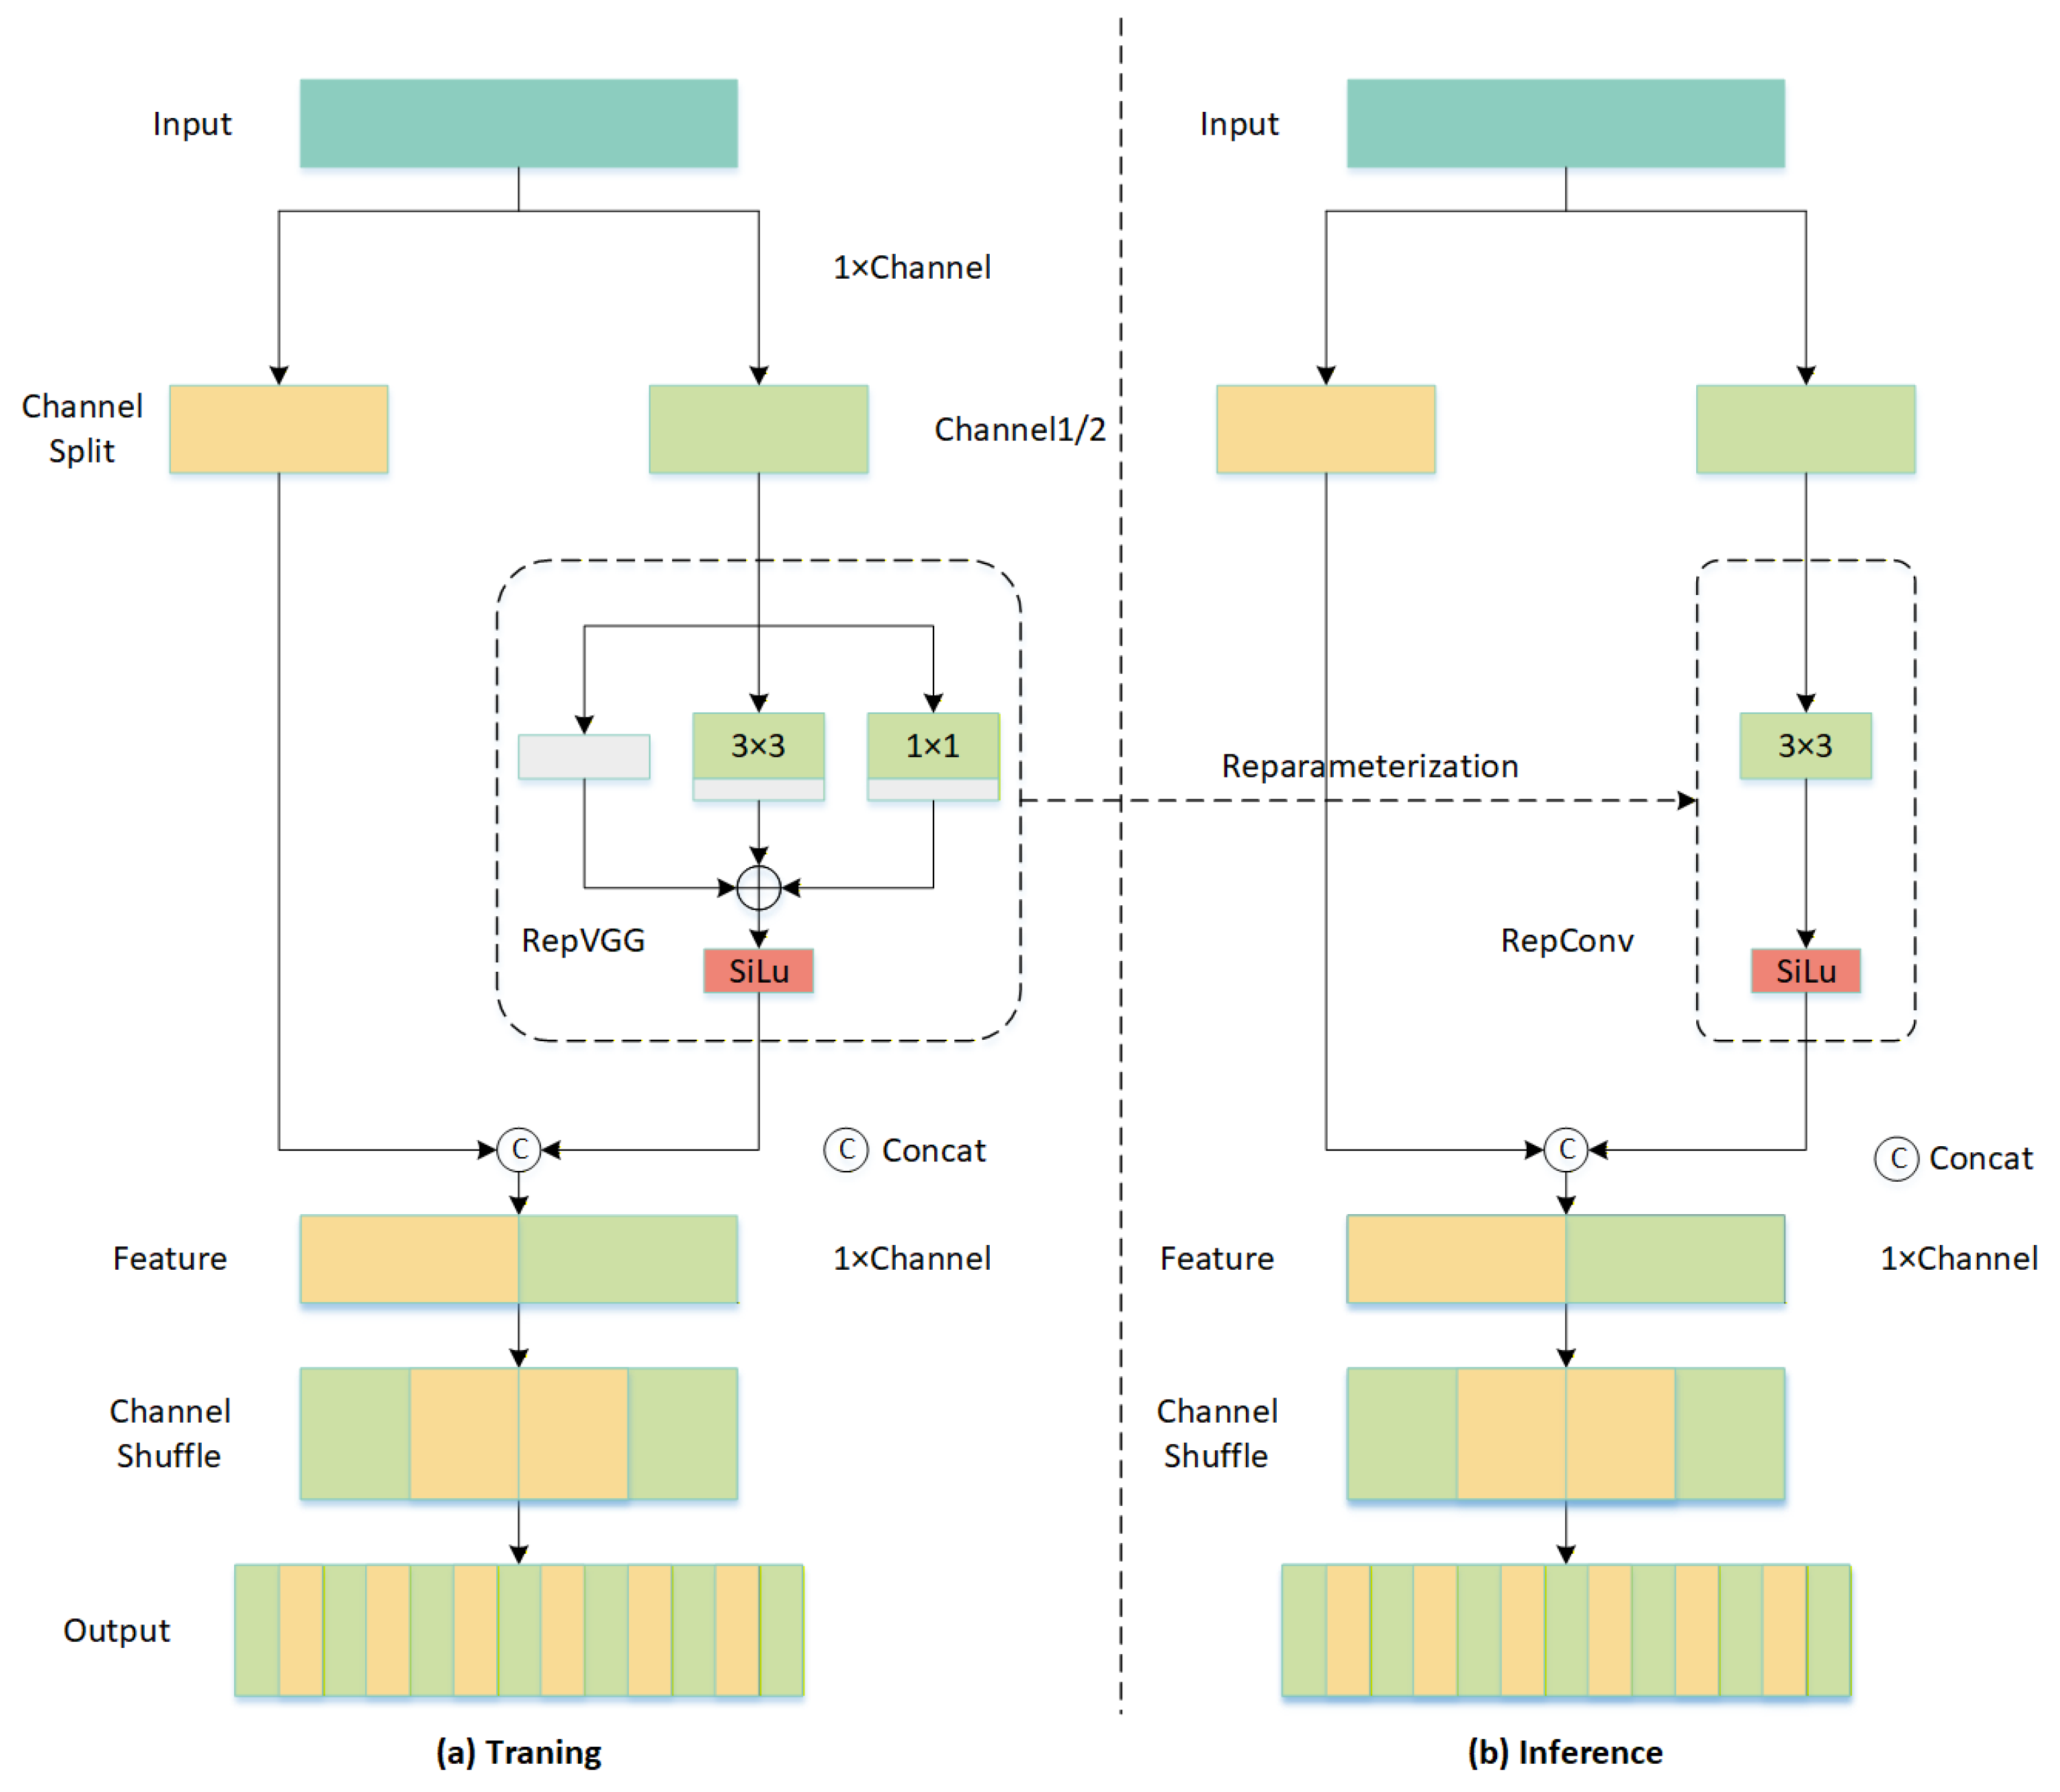
During training, RepConv consists of three parallel branches: a
convolution branch, a
convolution branch, and an identity mapping branch. The outputs of these branches are summed and activated as follows:
where
denotes the input feature map,
the output during training, and
the activation function. The identity branch helps preserve original feature information and improves training stability.
In the inference phase, the multi-branch structure is re-parameterized into a single
convolution, enabling faster computation:
where
denotes the equivalent convolution after branch fusion.
Specifically, the weights of the three branches are fused into a single kernel:
where
,
, and
represent the convolution kernels of the
,
, and identity branches, respectively;
denotes bias terms.
denotes zero-padding used to align the kernel size to
, such that all branch parameters can be merged into an equivalent convolution kernel. By applying this re-parameterization strategy, RepConv preserves training-time representational power while significantly reducing inference complexity, as illustrated in
Figure 5.
In our implementation, RepConv replaces the standard convolutional layers inside the bottleneck blocks of YOLOv11. The modified block, termed , retains the original residual connections but substitutes each sequence with a module, allowing the model to learn richer representations during training while executing as a plain VGG-style convolution during deployment.
2.5. YOLOv11-LLR: Enhanced Object Detection Method Based on Multi-Module Optimization
To address the challenges of multi-scale defects, complex backgrounds, and blurred boundaries in steel surface defect detection, we propose the YOLOv11-LLR framework. Building upon YOLOv11, it integrates three innovative modules: Deformable Large Kernel Attention (DLKA), Lightweight Grouped Attention (LWGA), and Re-parameterized Convolution (RepConv).
Specifically, the DLKA module utilizes deformable convolutions to adapt to local spatial variations at different scales, enhancing the model’s ability to perceive complex defect structures and handle deformed or blurred boundaries. This boosts spatial adaptability and robustness for irregular defects. The LWGA module enhances multi-scale feature fusion by dividing input features into subgroups processed through four attention branches (PA, LA, MRA, GA). This ensures effective integration across scales, improving stability and adaptability for small or low-contrast defects. The RepConv module employs a multi-branch structure during training and merges into a single convolution at inference, enabling a “complex training, simple inference” strategy that preserves detection accuracy while reducing computational overhead—ideal for latency-sensitive industrial deployment.
Together, these three modules provide a comprehensive solution: DLKA enhances spatial modeling, LWGA strengthens multi-scale fusion, and RepConv optimizes inference efficiency. YOLOv11-LLR thus offers a more robust, precise, and efficient solution for steel surface defect detection while maintaining the efficiency of the original YOLOv11 architecture.
2.6. Rationale for Module Selection
The three modules are not arbitrarily chosen; they directly target the identified limitations of YOLOv11. DLKA is selected over standard large-kernel attention (LKA) or self-attention because deformable convolution adaptively samples defect boundaries, which are often irregular and blurred. LWGA is preferred over conventional multi-head attention (e.g., MHSA) due to its grouped design, which reduces computational cost while preserving multi-scale receptive fields, which is critical for the coexistence of small and large defects. RepConv is adopted to decouple training and inference; unlike other weight reduction methods (depth-wise convolution, pruning), it maintains full representational power during training and merges branches at inference, achieving both accuracy and speed.
3. Results
3.1. Dataset
In this experiment, we adopted the NEU-DET dataset, widely used for steel surface defect detection and classification tasks, to train and test the proposed model.
The dataset was collected and organized by the Surface Inspection Laboratory of Northeastern University, covering six typical types of hot-rolled steel strip surface defects, including Crazing, Patches, Inclusion, Pitted Surface, Rolled-in Scale, and Scratches. The dataset contains a total of 1800 grayscale images, 300 for each defect category, with a uniform image size of 200 × 200 pixels. This dataset is representative in characterizing common defect types in industrial steel strips and has been widely used for evaluating the performance of defect detection algorithms. Detailed information of the dataset is shown in
Table 1. The image samples cover a variety of typical surface defect types, with significant differences in the shape and direction (tilted, horizontal, vertical, etc.) of defects across categories, providing sufficient diversity for feature learning and generalization of the model. Although each category contains 300 images, the actual number of defect targets varies significantly, increasing the learning difficulty for the model on small-sample categories. To ensure training stability and evaluation fairness, the dataset was randomly split into training, validation, and test sets in an 8:1:1 ratio.
In addition to NEU-DET [
39], we also use GC10-DET [
40] to test generalization in a more challenging setting. GC10-DET contains 2312 grayscale images covering 10 typical surface defect categories, and multiple defect types may appear in a single image, leading to higher background noise and cross-class ambiguity.
To evaluate the performance of the detection model, we selected four core metrics: Precision (P), Recall (R), mean Average Precision with IoU threshold set to 0.5 (mAP@0.5), and mean Average Precision calculated with IoU threshold ranging from 0.5 to 0.95 in steps of 0.05 (mAP@0.5:0.95). Precision is defined as
and Recall as
, where
represents the number of true positive samples correctly detected, FP refers to the number of negative samples incorrectly identified as positive, and
represents the number of positive samples that were not detected. In object detection tasks, P and R often present a trade-off relationship, so both need to be considered when evaluating model performance. Therefore, Average Precision (AP) is usually introduced as a comprehensive metric to measure the overall detection capability of the model at different recall levels. It is defined as the area under the Precision–Recall curve:
mAP@0.5 represents the average of the APs for all categories under the condition of an IoU threshold of 0.5, commonly used to evaluate the overall accuracy level of an object detection model. Its calculation method is as follows:
This definition follows the standard Pascal VOC evaluation protocol [
41]. Then mAP@0.5 represents the average of the APs for all categories under the condition of an IoU threshold of 0.5, commonly used to evaluate the overall accuracy level of an object detection model. Its calculation method is as follows:
where
represents the total number of categories and
represents the average precision for the i-th category. To obtain more stringent and comprehensive evaluation results, this paper also reports mAP@0.5:0.95, which calculates the average of multiple AP values with the IoU threshold ranging from 0.5 to 0.95 (step size 0.05). This metric can more comprehensively evaluate the detection performance of the model under different precision requirements. The accuracy of the detection box is measured by the Intersection over Union (IoU), defined as the ratio of the area of intersection to the area of union between the predicted box and the ground truth box. When the IoU between a predicted box and a ground truth box exceeds a set threshold (e.g., 0.5), it is judged as a true positive; otherwise, it is considered a false positive.
3.2. Implementation Details
Our implementation is based on the official Ultralytics YOLOv11 repository using PyTorch 1.12.1 with CUDA 11.3. All models are trained from scratch (no pre-trained weights) on a single NVIDIA RTX 4060 GPU (8 GB VRAM). Input images are resized to 640 × 640. The batch size is set to 32, and training runs for 300 epochs. The AdamW optimizer is used with an initial learning rate of 0.001 and weight decay of 0. The learning rate follows the default cosine annealing schedule of YOLOv11. Data augmentation includes the default YOLOv11 pipeline: random horizontal flipping (probability 0.5), mosaic augmentation (probability 0.5), and HSV color jitter (hue = 0.015, saturation = 0.7, value = 0.4). Input normalization scales pixel values to [0, 1]. Mixed precision training (AMP) is enabled to accelerate training and reduce GPU memory usage. The data loader uses four worker threads. The random seed is fixed to the YOLO default (0) to ensure full reproducibility.
3.3. Comparison with Widely Used Detectors on NEU-DET
To comprehensively evaluate the effectiveness of the proposed YOLOv11-LLR model, comparative experiments were conducted on two representative steel surface defect detection datasets, namely NEU-DET and GC10-DET. These datasets differ significantly in defect distribution, background complexity, and category diversity, allowing for a thorough evaluation of the model’s robustness and generalization capability under diverse industrial scenarios.
The quantitative comparison results on the NEU-DET dataset are summarized in
Table 2. As shown, YOLOv11-LLR achieves a Precision of 84.8%, Recall of 74.9%, mAP@0.5 of 83.7%, and mAP@0.5:0.95 of 51.1%, outperforming both traditional detectors and mainstream YOLO-based methods. Compared with the baseline YOLOv11, the proposed model improves mAP@0.5 by 3.5 percentage points and mAP@0.5:0.95 by 2.4 percentage points, indicating a significant enhancement in both coarse and fine-grained detection accuracy. Furthermore, YOLOv11-LLR consistently surpasses improved variants such as GFIF-YOLO, FD-YOLO11, and GDM-YOLO, demonstrating the effectiveness of the proposed multi-module optimization strategy.
The comparison results on the GC10-DET dataset are presented in
Table 3. Despite the increased detection difficulty caused by multi-category overlap and low-contrast backgrounds, YOLOv11-LLR maintains stable performance, achieving 70.8% mAP@0.5 and 36.8% mAP@0.5:0.95, which are higher than those of most competing methods. Notably, Recall reaches 62.5%, reflecting the model’s strong ability to reduce missed detections in complex scenarios. These results indicate that YOLOv11-LLR exhibits superior robustness and adaptability when handling diverse and challenging industrial defect detection tasks.
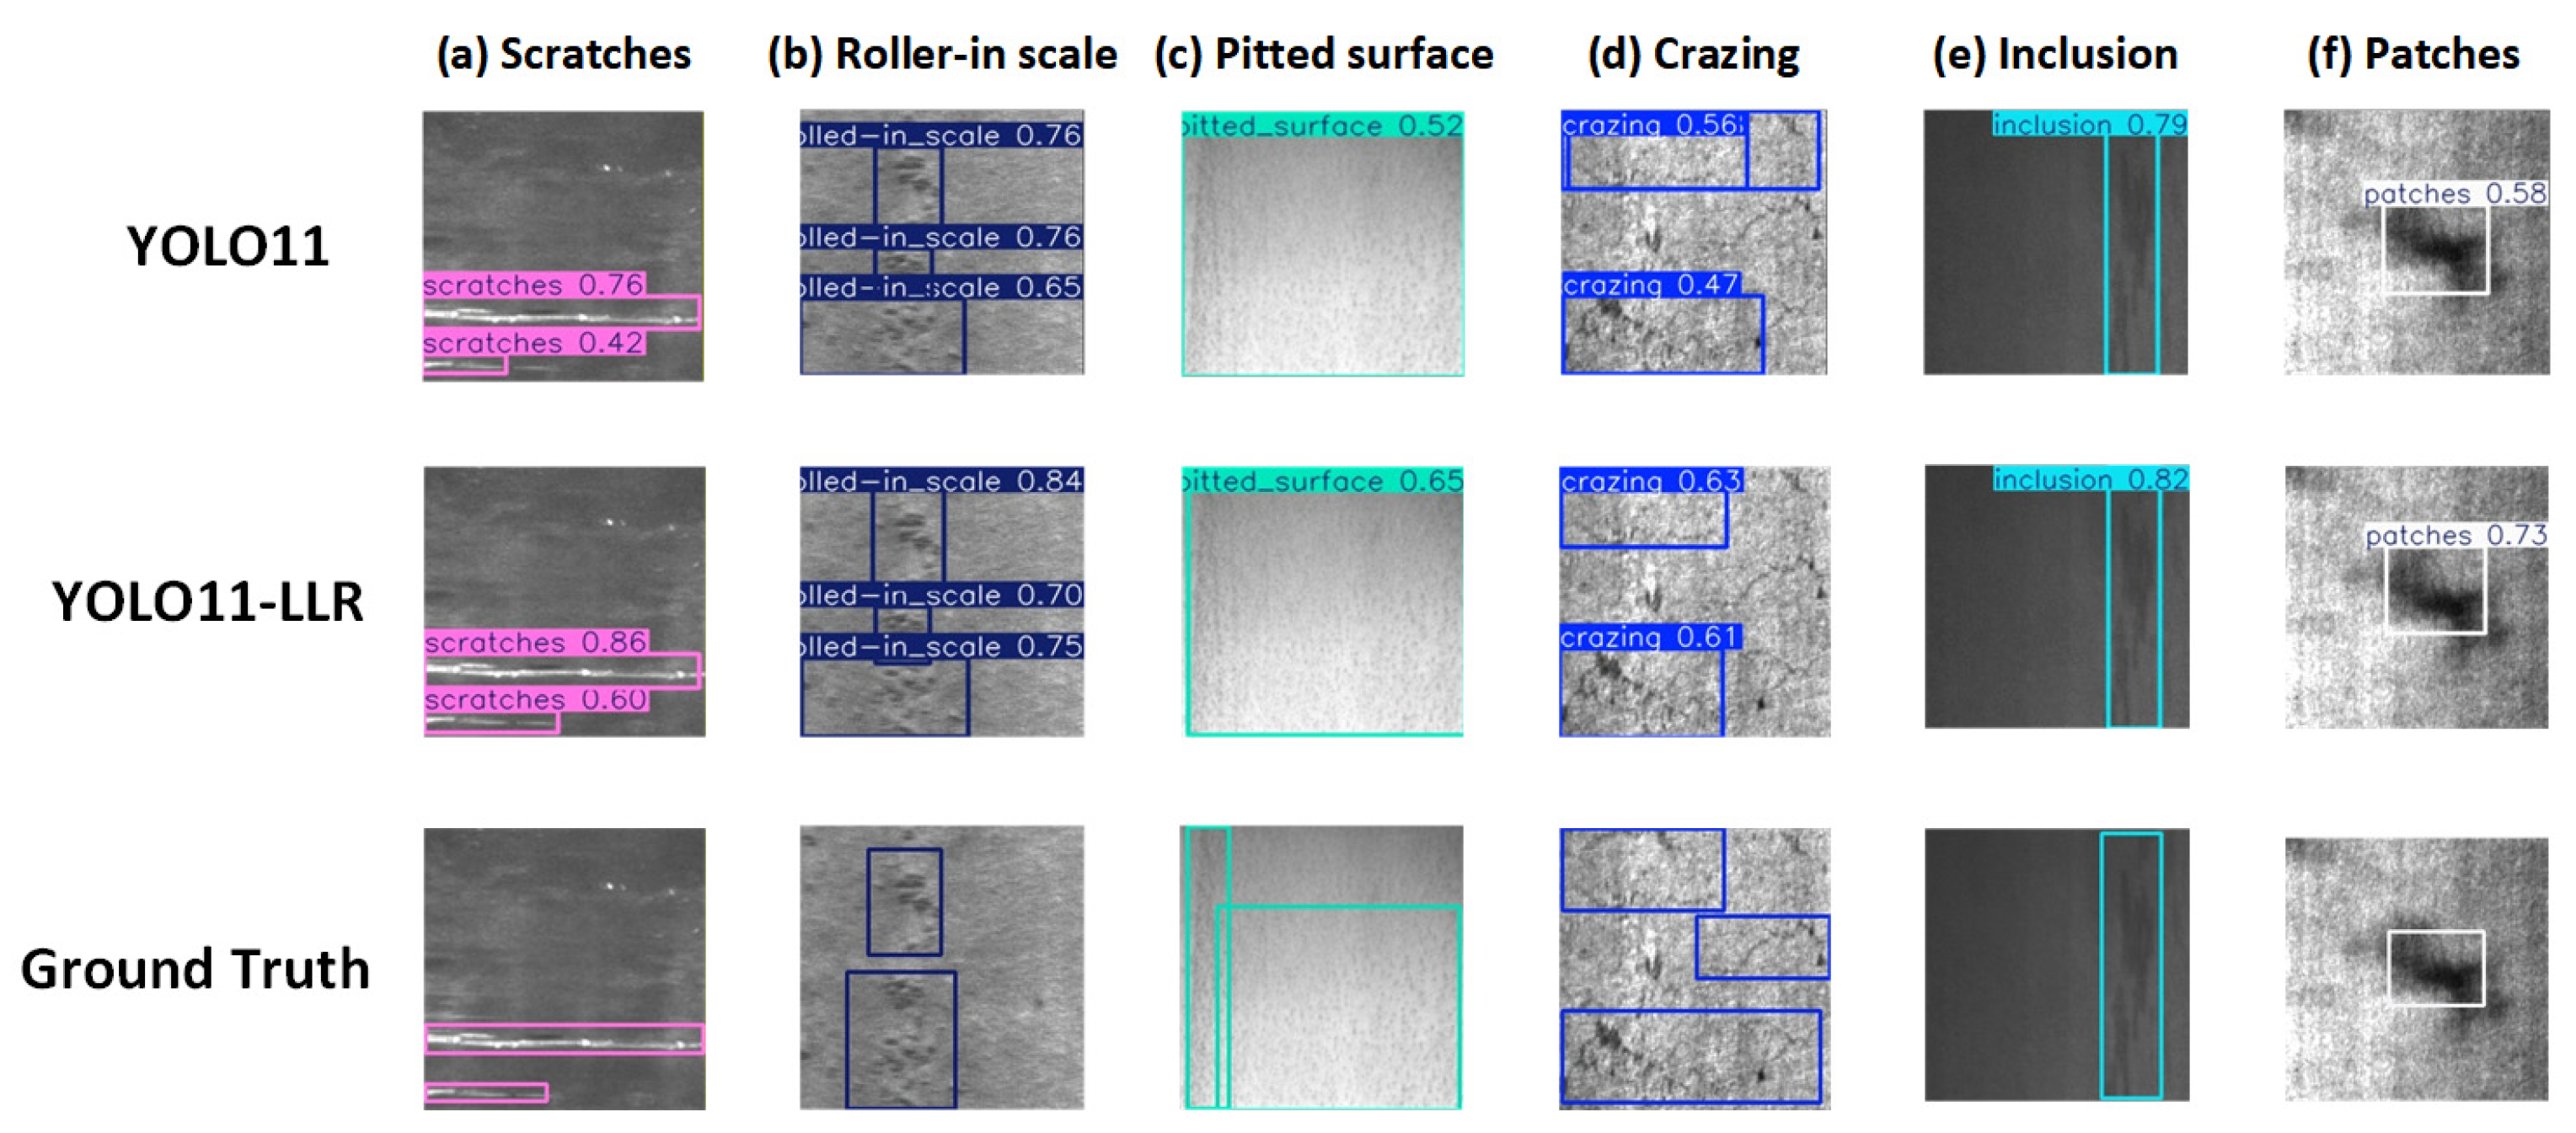
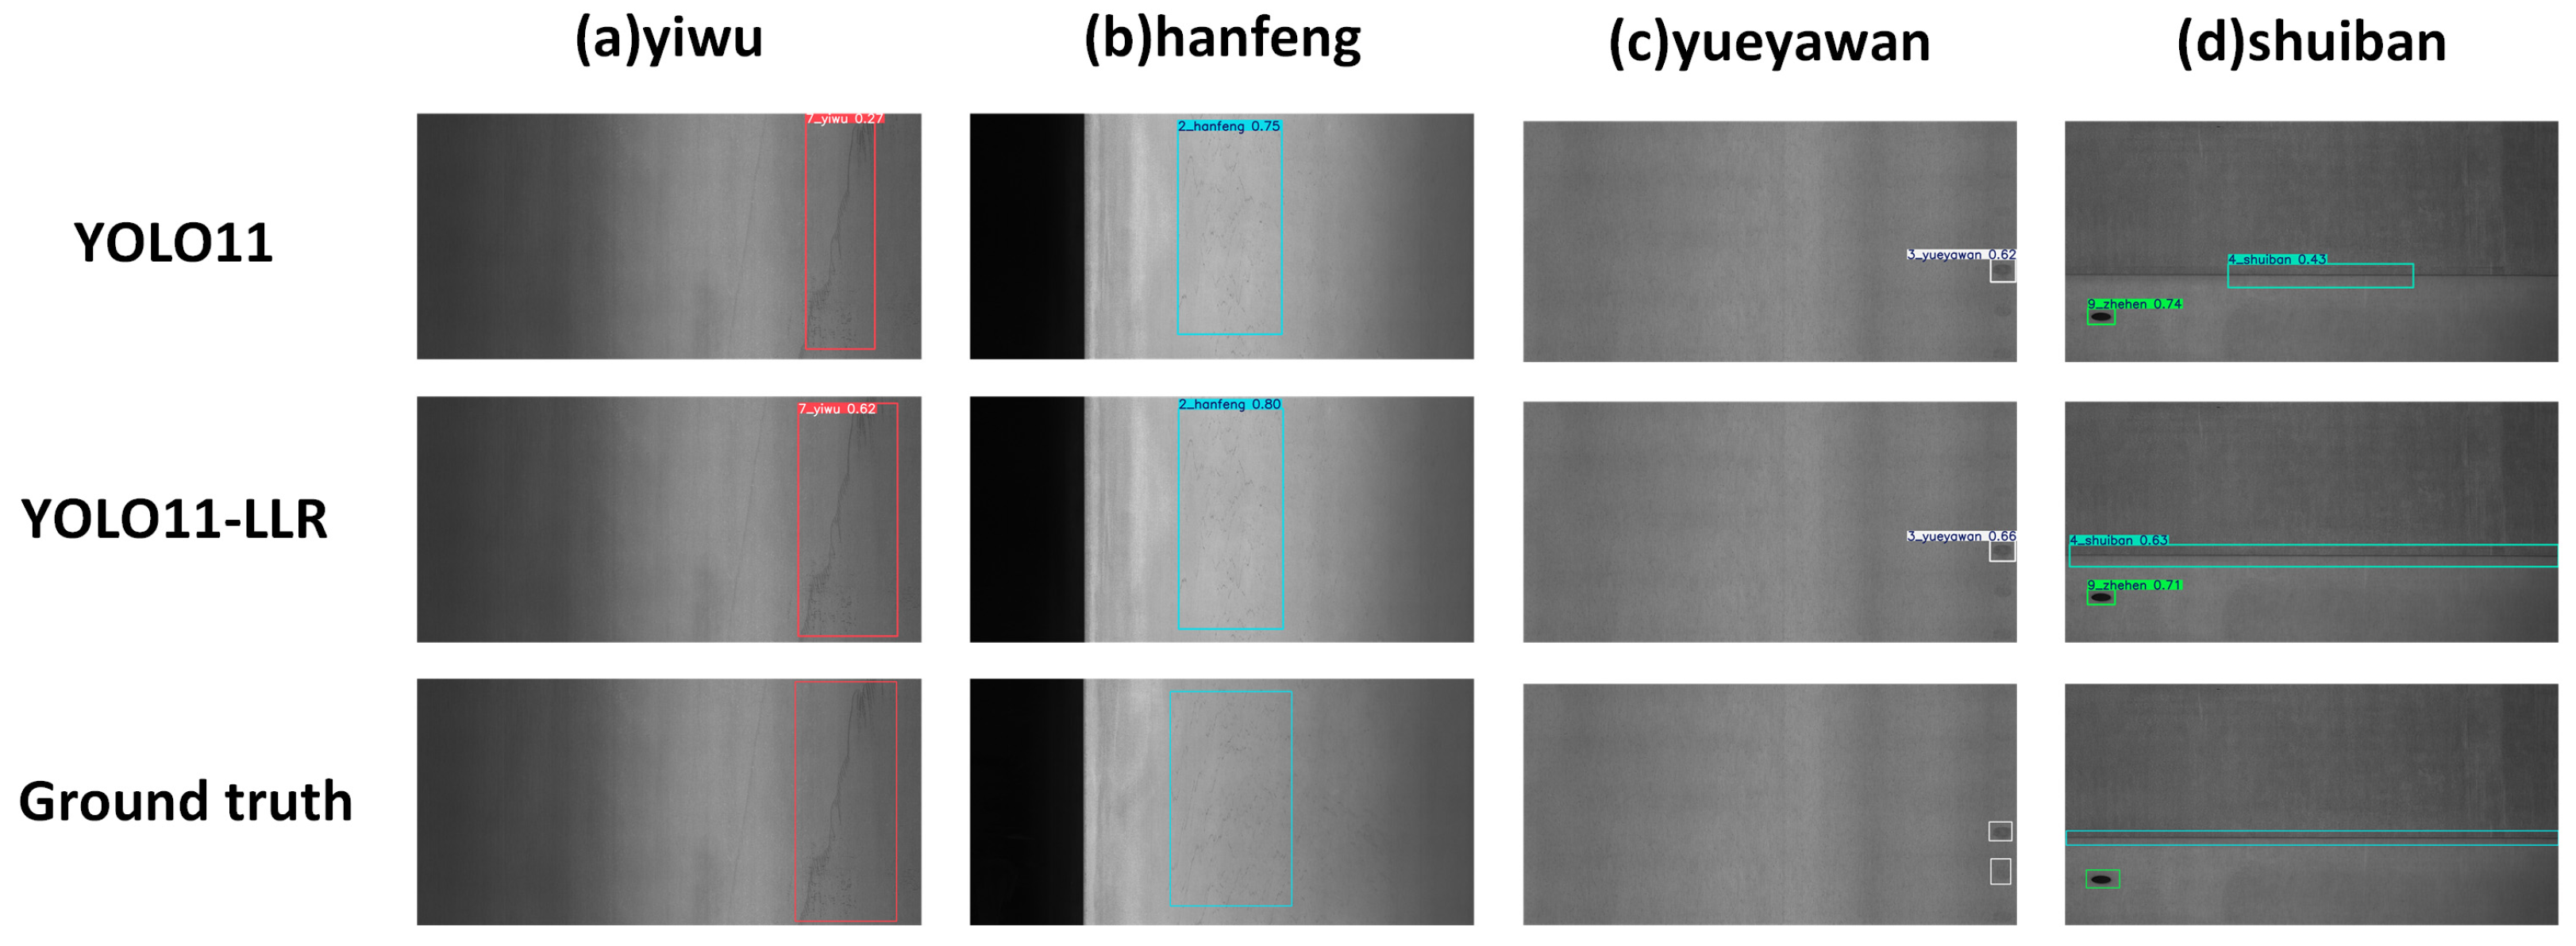
In addition to quantitative evaluation, qualitative visualization results are shown in
Figure 6 and
Figure 7, which present the ground truth bounding boxes together with the detection outputs of YOLOv11 and YOLOv11-LLR on the NEU-DET and GC10-DET datasets, respectively. The proposed model produces detection boxes with higher confidence and more accurate localization, especially for small-scale defects and defects with blurred boundaries, further validating its practical applicability and reliability in real-world industrial environments.
3.4. Ablation Study
After demonstrating the overall superiority of YOLOv11-LLR over mainstream detectors, ablation experiments were conducted to further analyze the contribution of each proposed module and to explain the performance improvements achieved by the model. All ablation experiments were carried out on the NEU-DET dataset using YOLOv11 as the baseline model.
The experimental results of the ablation study are summarized in
Table 4. As shown in
Table 2, introducing DLKA alone leads to a noticeable improvement in Recall and mAP@0.5, indicating its effectiveness in enhancing spatial modeling and capturing deformed defect structures. Similarly, the LWGA module improves multi-scale feature fusion capability, resulting in a moderate increase in detection accuracy, particularly in Recall. However, when these two attention-based modules are used independently, the overall performance gain remains limited, and Precision shows a slight downward trend.
In contrast, the RepConv module demonstrates the most significant individual contribution. When RepConv is introduced alone, the model achieves a substantial increase in mAP@0.5, along with a marked improvement in Recall, highlighting its critical role in strengthening feature representation and improving detection robustness. This result confirms that Re-parameterized Convolution effectively enhances the model’s learning capacity and supports a simplified inference-time structure.
When DLKA, LWGA, and RepConv are jointly integrated, the model achieves the best overall performance. The full YOLOv11-LLR configuration attains 83.7% mAP@0.5 and 51.1% mAP@0.5:0.95, representing the highest values among all ablation settings. This configuration not only significantly improves Precision but also maintains a high Recall, demonstrating the strong complementarity and synergy among the three modules.
To further analyze the impact of each module at the category level,
Table 5 presents the mAP@0.5 results for six defect categories. The results show that DLKA and LWGA are particularly effective in improving the detection performance of low-precision categories, such as Crazing and Rolled-in Scale, by enhancing spatial perception and cross-scale information interaction. Meanwhile, RepConv consistently boosts performance across high-precision categories, further confirming its decisive role in overall detection enhancement.
In summary, the ablation study verifies that each proposed module contributes positively to the performance of YOLOv11-LLR, while their combination yields the most significant improvement. These results provide a clear explanation for the superior performance observed in the comparative experiments and demonstrate the effectiveness of the proposed multi-module optimization strategy.
3.5. Inference Speed Evaluation
To evaluate the practical deployability of the proposed YOLOv11-LLR in industrial scenarios, we measured the inference latency of all model variants on a single NVIDIA RTX 4060 GPU with an input resolution of 640 × 640. Preprocessing and postprocessing times are excluded. As reported in
Table 6, the baseline YOLOv11 achieves an inference time of 6.2 ms (161 FPS). Adding RepConv alone introduces negligible overhead (6.4 ms, 156 FPS), while LWGA increases the latency to 7.2 ms (139 FPS). The DLKA module, due to its deformable convolution operations, requires 8.2 ms (121 FPS). The full YOLOv11-LLR model, which integrates all three modules, runs at 9.4 ms (106 FPS). Although this is the slowest among the variants, it still comfortably exceeds the typical real-time requirement for industrial steel surface inspection (≥30 FPS). Therefore, YOLOv11-LLR offers a favorable trade-off between detection accuracy and inference speed, making it suitable for deployment in real-world production lines.
3.6. Statistical Significance Analysis
To verify that the observed performance improvements are not due to random fluctuations, we conducted five independent training runs on the NEU-DET dataset using different random seeds. All other hyperparameters remained identical to those described in
Section 3.2.
Table 7 reports the mean and standard deviation of mAP@0.5 and mAP@0.5:0.95 across the five runs. The baseline YOLOv11 achieves 80.1% ± 0.3% in mAP@0.5 and 48.6% ± 0.2% in mAP@0.5:0.95, while YOLOv11-LLR achieves 83.6% ± 0.4% and 51.0% ± 0.3%, respectively. A paired two-tailed t-test performed between the baseline and YOLOv11-LLR yields
p-values of 0.0023 for mAP@0.5 and 0.0018 for mAP@0.5:0.95, both well below the 0.01 significance level. These results confirm that the improvements introduced by YOLOv11-LLR are highly statistically significant, further demonstrating the reliability and reproducibility of our proposed method.
4. Conclusions
This paper proposes YOLOv11-LLR for steel surface defect detection, addressing the limitations of existing YOLO-series detectors in handling multi-scale defects, complex textures, and low-contrast boundaries. Unlike prior efforts that primarily emphasize lightweight or single attention mechanisms, our work introduces a synergistic combination of three complementary modules: DLKA for adaptive spatial modeling of deformed defects, LWGA for efficient cross-scale feature interaction, and RepConv for decoupling training and inference. This design distinguishes itself from other YOLO variants (e.g., GFIF-YOLO, FD-YOLO11) by jointly enhancing local spatial adaptability and global multi-scale fusion within a unified framework, while preserving deployment efficiency.
Experimental results on NEU-DET and GC10-DET yield two key insights. First, the proposed model delivers consistent and substantial improvements over YOLOv11—+3.5% mAP@0.5 on NEU-DET and +9.8% on the more challenging GC10-DET—demonstrating robustness against background complexity and defect variability. Second, ablation studies (
Table 4) show that RepConv contributes the largest individual gain, whereas the full combination achieves the best overall performance, indicating strong synergy among the three modules. Category-wise analysis (
Table 5) further reveals that DLKA and LWGA are particularly beneficial for low-precision categories (e.g., Crazing, Rolled-in Scale), suggesting that spatial adaptability and cross-scale interaction are critical for difficult defect types.
Regarding
Table 5, we acknowledge that deeper error analysis would further strengthen these conclusions. Performance variations across categories likely arise from three sources: (i) class imbalance in the dataset (e.g., Inclusion has 1011 defects versus 689 for Crazing), (ii) inherent ambiguity between visually similar defects (e.g., Patches vs. Rolled-in Scale), and (iii) model sensitivity to extremely small or highly elongated defects. Future work will incorporate per-class confidence calibration and confusion matrix analysis to systematically quantify these error sources.
In summary, YOLOv11-LLR provides an effective, robust, and industrially deployable solution for steel surface defect detection. Future directions include model weight reduction for edge devices, adaptive multi-scale fusion, and cross-domain transfer learning to broaden its applicability.




 ,
,