1. Introduction
Intestinal schistosomiasis, caused by the blood fluke
Schistosoma mansoni, is a major public health concern, affecting approximately 54 million people annually, primarily in sub-Saharan Africa [
1]. The infection leads to intestinal schistosomiasis, with pathological manifestations arising from the formation of granulomas around eggs that become lodged in the liver. Granuloma formation leads to PPF, a severe complication affecting a significant proportion of infected individuals, particularly in sub-Saharan Africa [
2]. In Uganda,
S. mansoni infection affects up to 70% of the population in endemic regions, with a particularly high prevalence of PPF observed in communities along the shores of Lake Albert and Lake Victoria [
3]. PPF is a common manifestation of chronic liver diseases and significantly impacts morbidity and mortality [
4]. Early detection of periportal fibrosis is crucial for timely intervention and the potential for reversibility.
Currently, non-invasive diagnostic imaging methods such as ultrasound, CT, MRI, and elastography are used to assess and detect liver damage due to chronic schistosomiasis [
5]. However, these methods have limitations. Conventional scoring systems for liver fibrosis based on these imaging techniques are often time-consuming, subjective, and semi-quantitative, leading to variability in interpretation and potential diagnostic inaccuracies [
6].
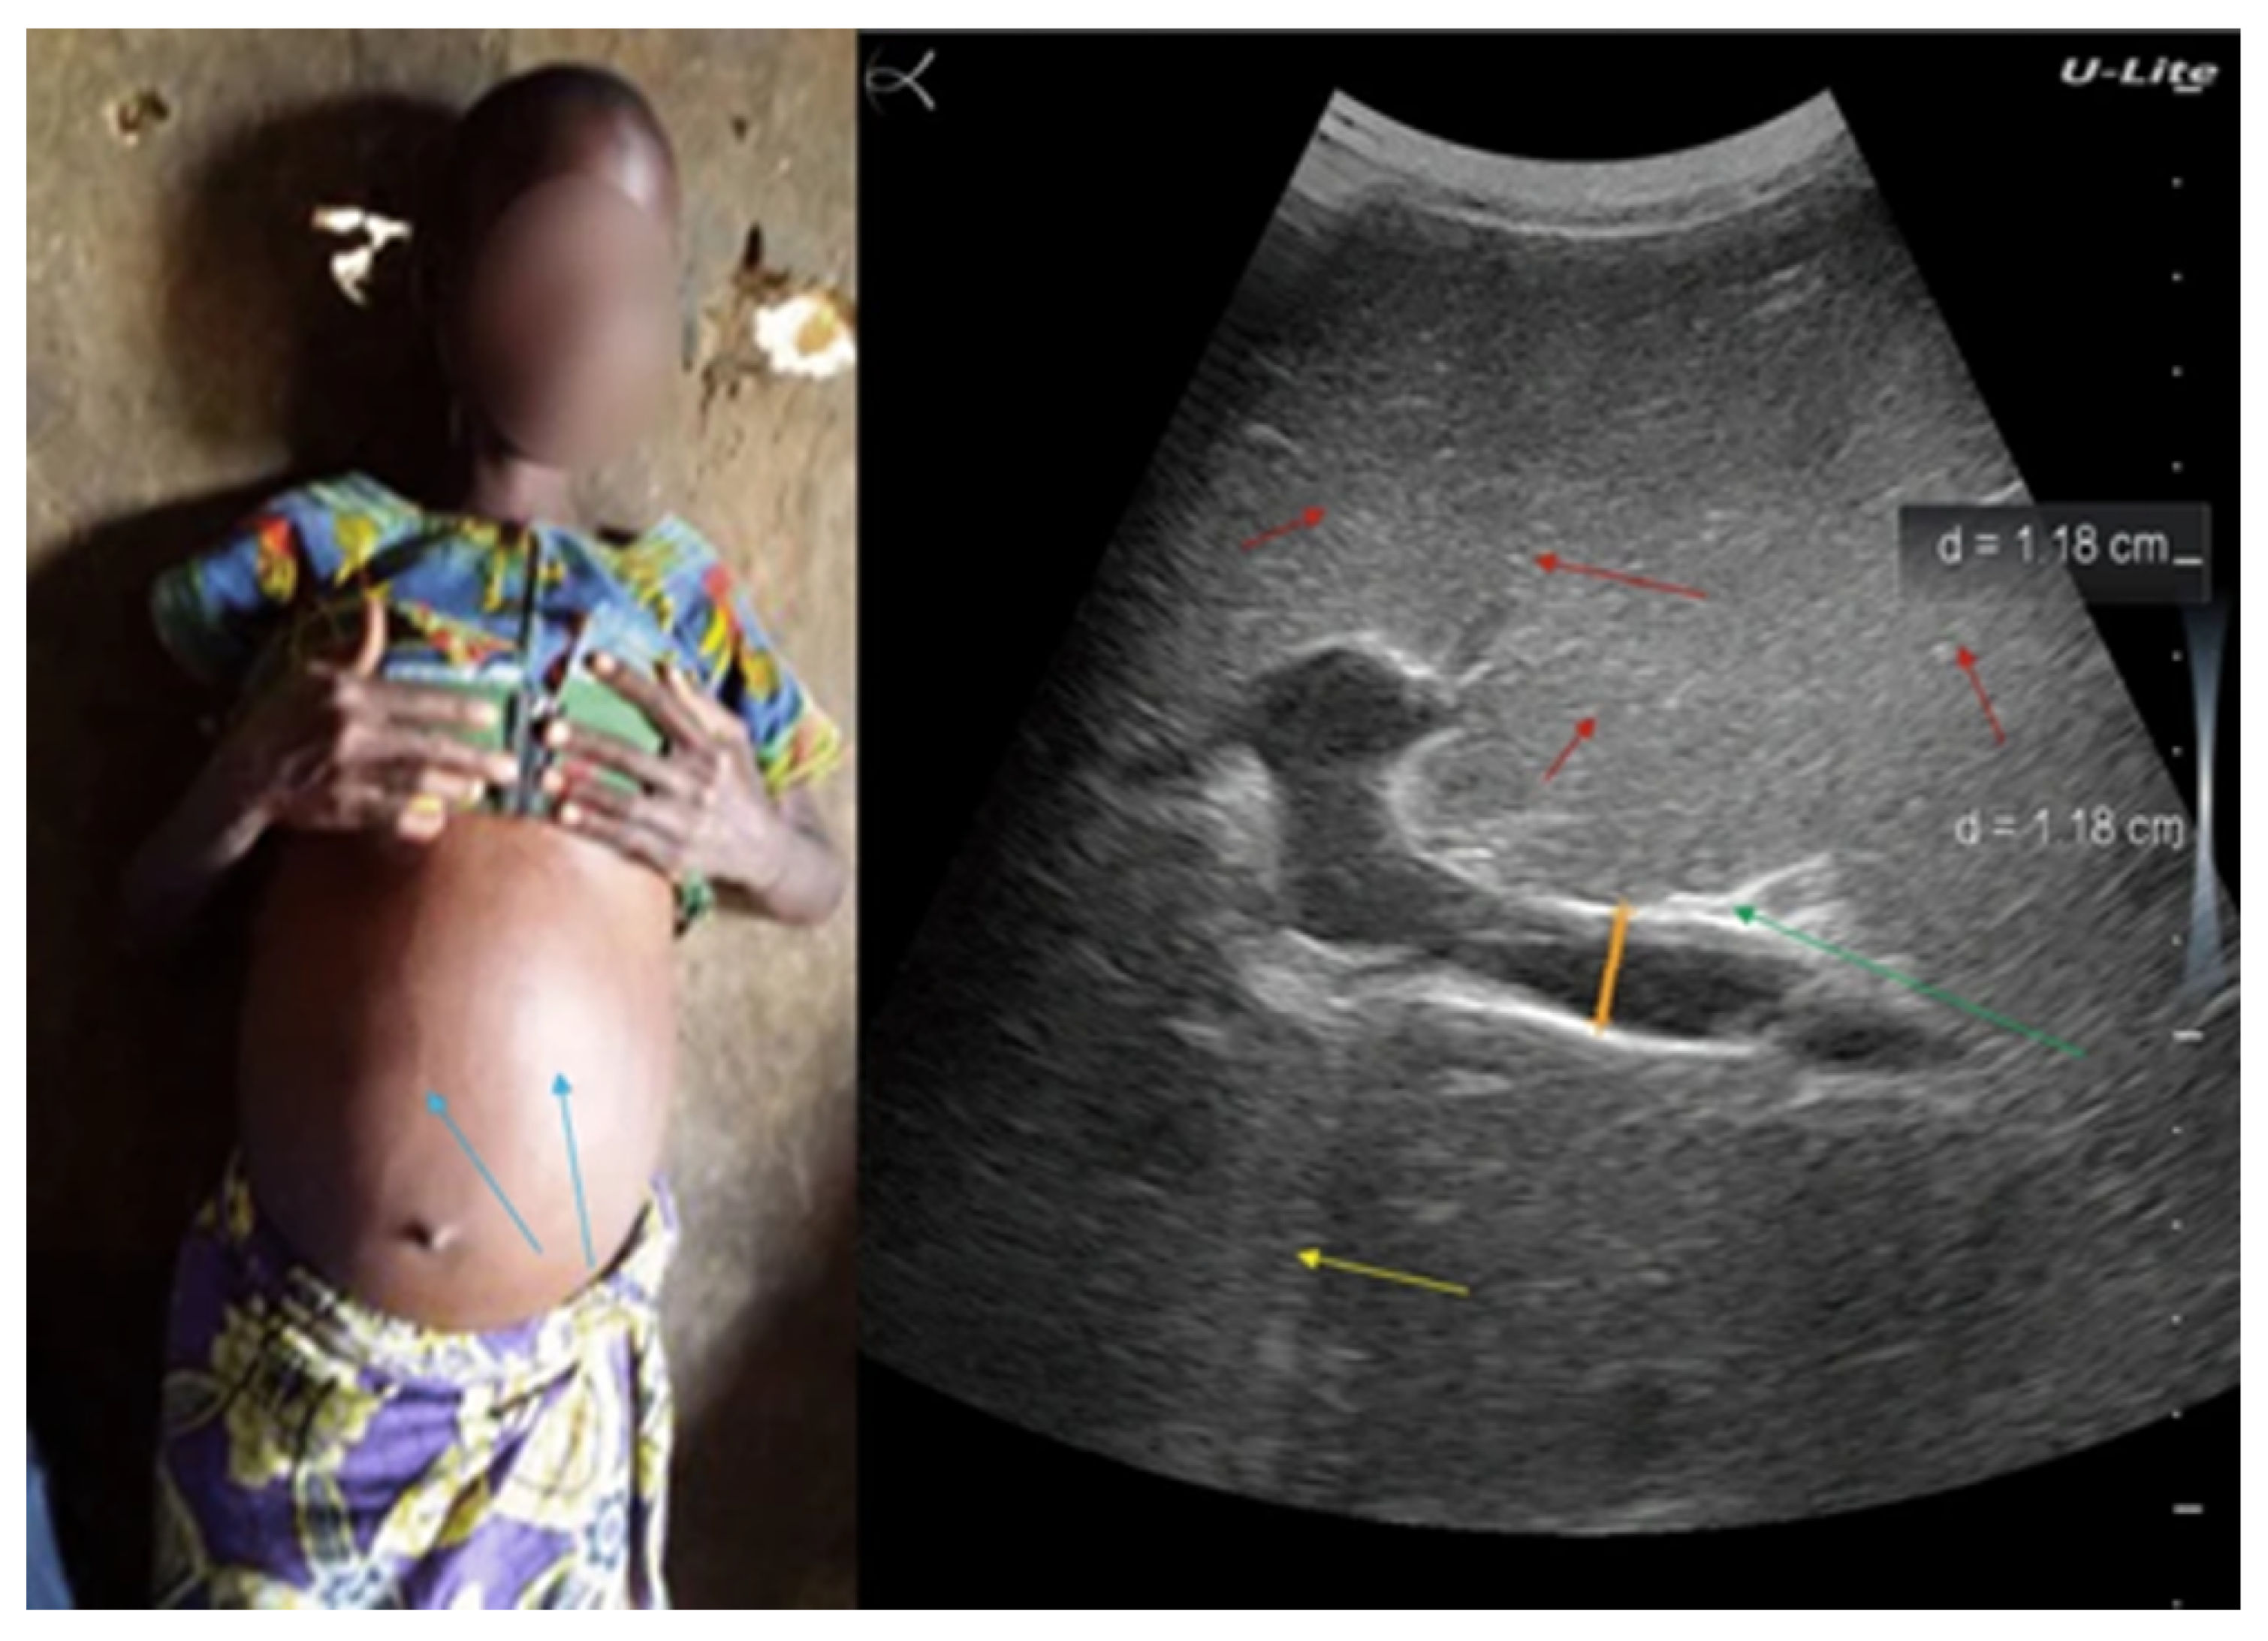
As illustrated in
Figure 1, ultrasound imaging can visualize characteristic features of PPF. However, interpretation still relies heavily on the sonographer’s expertise, which introduces variability and limits scalability in low-resource settings. These limitations stem from the inherent subjectivity in interpreting imaging features and the reduced sensitivity of these methods in identifying the subtle signs of early-stage fibrosis.
Machine learning (ML), a branch of artificial intelligence (AI), enables computers to recognise patterns in data, supporting prediction and decision-making [
8]. Positioned within the broader AI framework, ML plays a pivotal role in the development of intelligent diagnostic systems in healthcare. A computer system trained on thousands of medical images can learn to recognise subtle pathological patterns linked to liver disease and, without explicit programming, continuously improves its diagnostic performance through exposure to data and experience.
Traditional machine learning techniques have been instrumental in advancing medical imaging, supporting tasks such as classification, segmentation, and registration [
9]. These methods rely on manual feature extraction, where domain experts identify characteristics such as texture, shape, or intensity, and feed them into algorithms like Support Vector Machines (SVMs) for classification [
10,
11]. However, this process is inherently subjective and sensitive to image variations, often leading to inconsistent diagnostic outcomes [
12]. Traditional approaches also struggle with the high dimensionality and subtle patterns present in medical images, limiting their ability to detect complex pathological features [
13]. Even established models like SVMs have shown inefficiencies in these contexts compared to newer, data-driven deep learning approaches [
14].
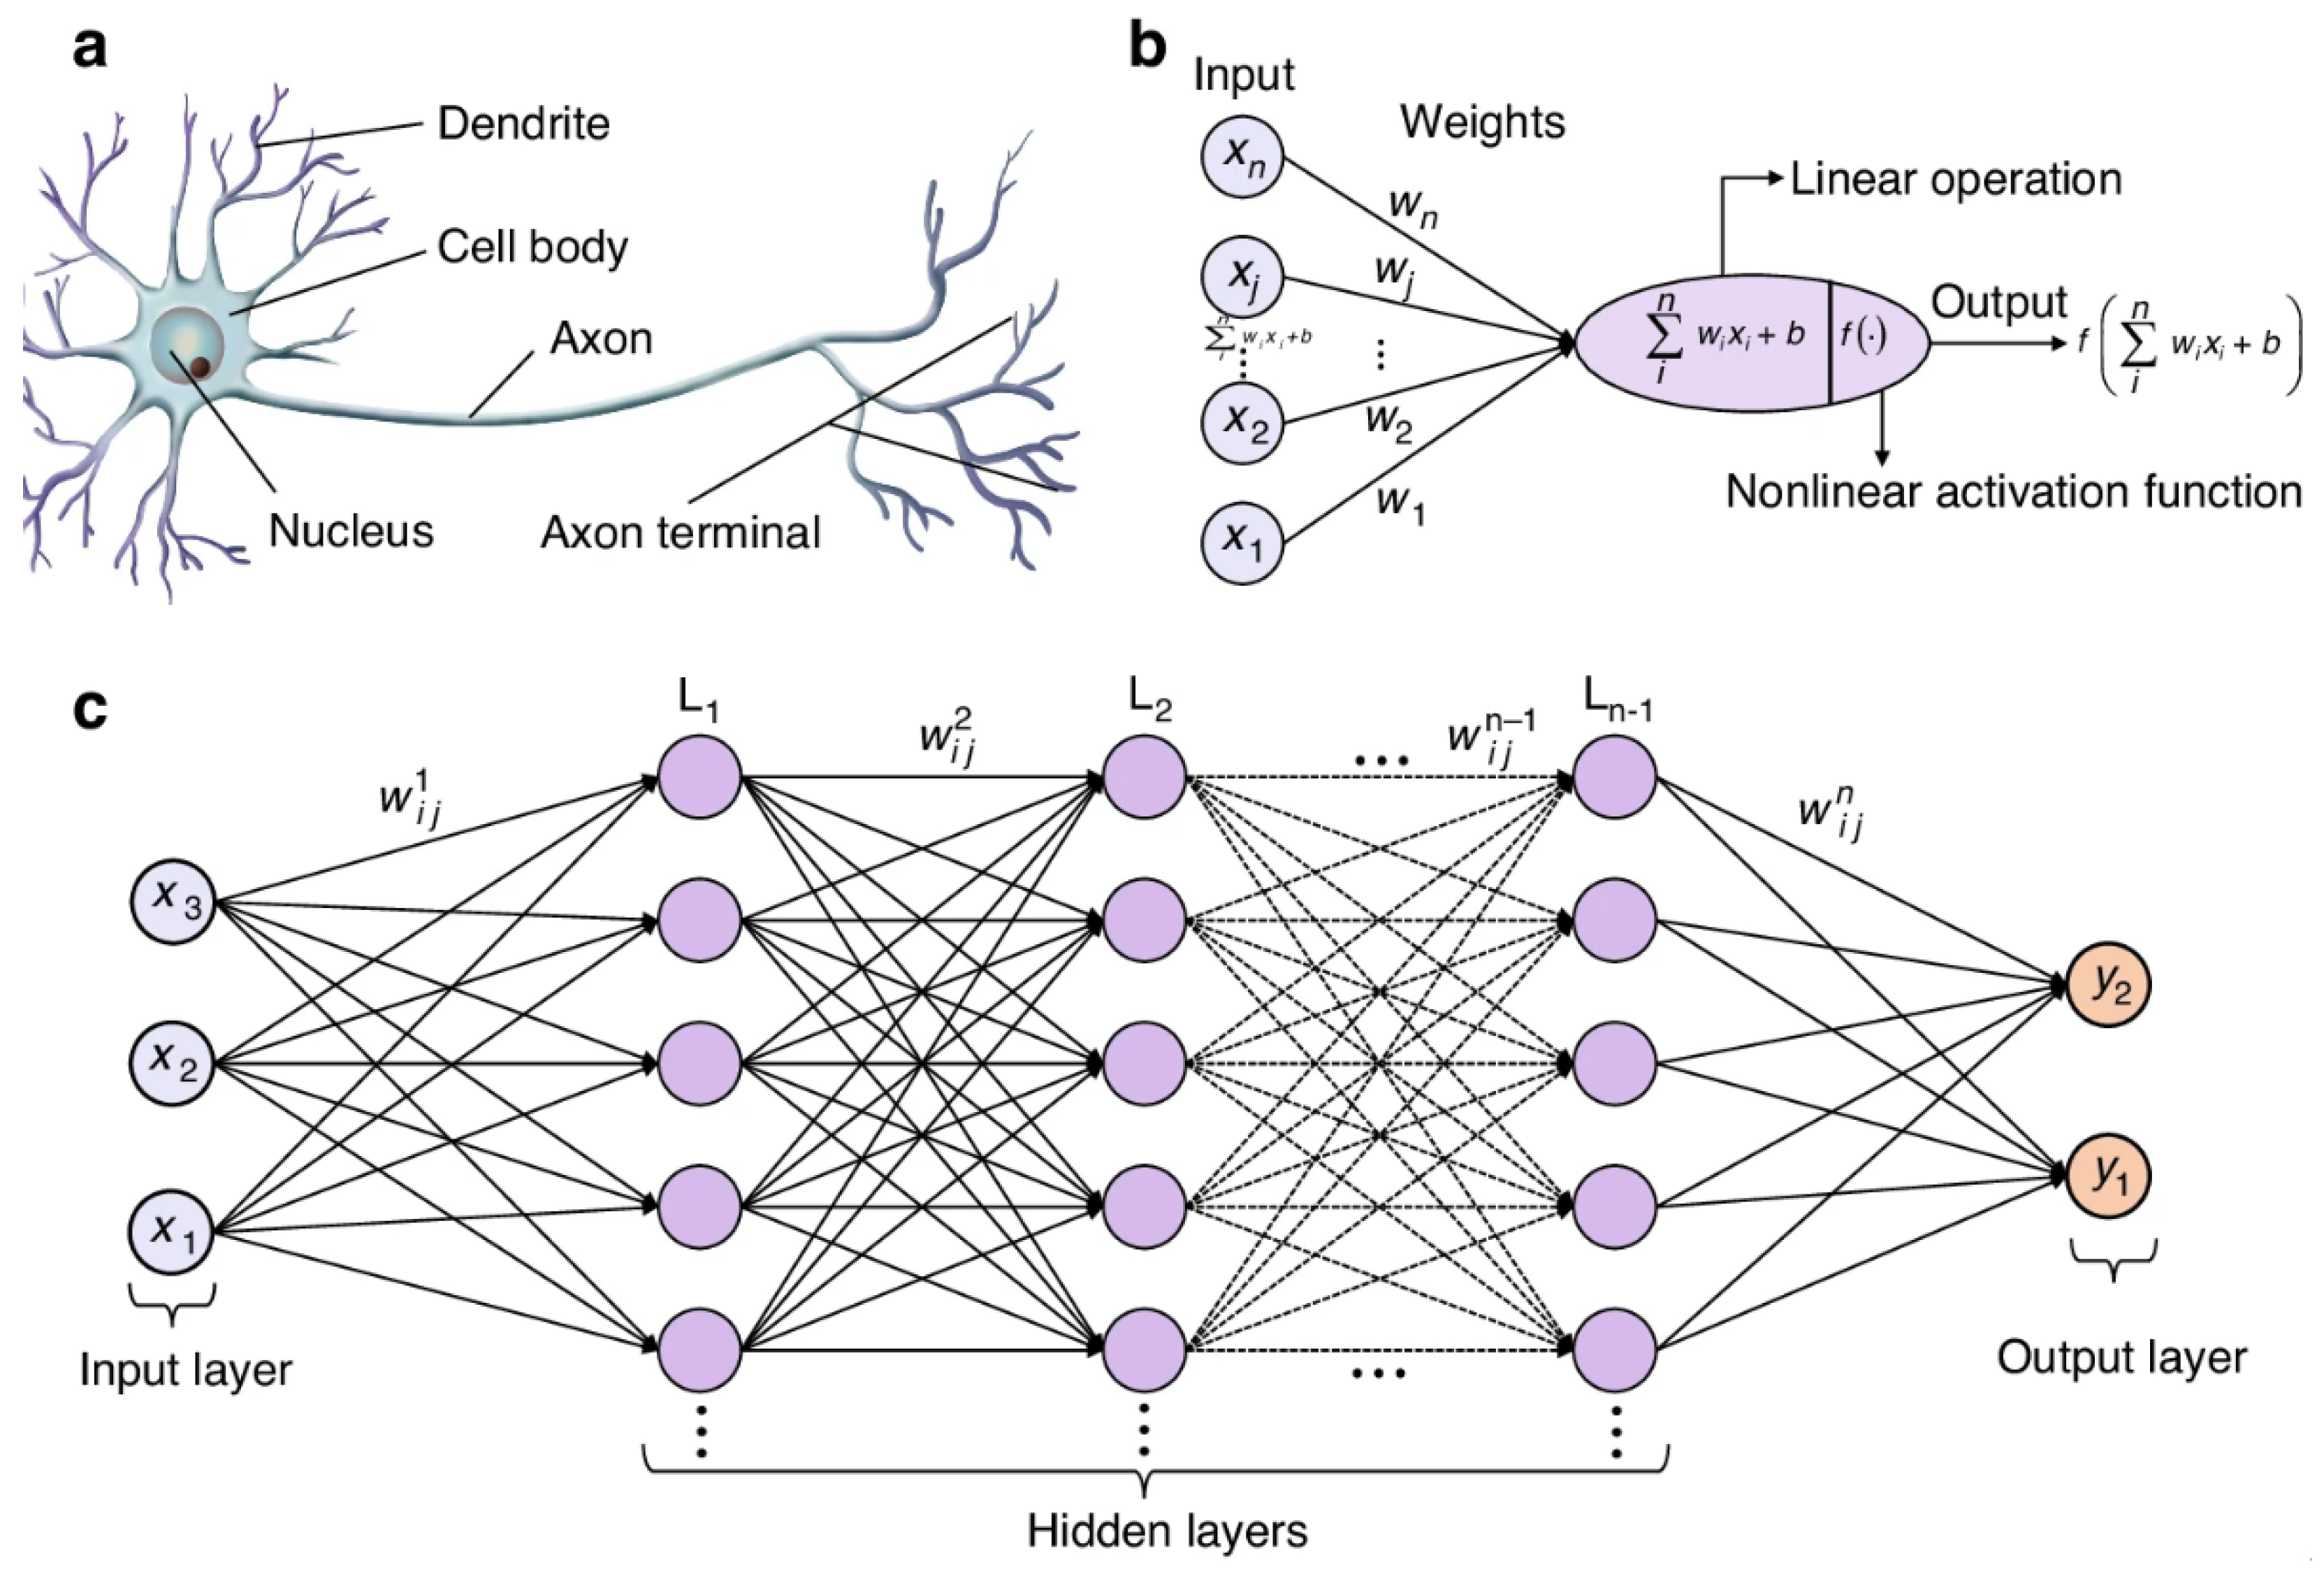
Traditional machine learning techniques have made significant contributions to medical image analysis; however, their limitations have led to the development of more advanced methods, notably deep learning. Deep Learning (DL) is a subset of machine learning that uses deep neural networks (DNNs) with multi-layered architectures designed to automatically learn complex patterns and representations from large amounts of data. Inspired by the human brain (
Figure 2), DL algorithms overcome limitations and reveal new possibilities in medical imaging [
15].
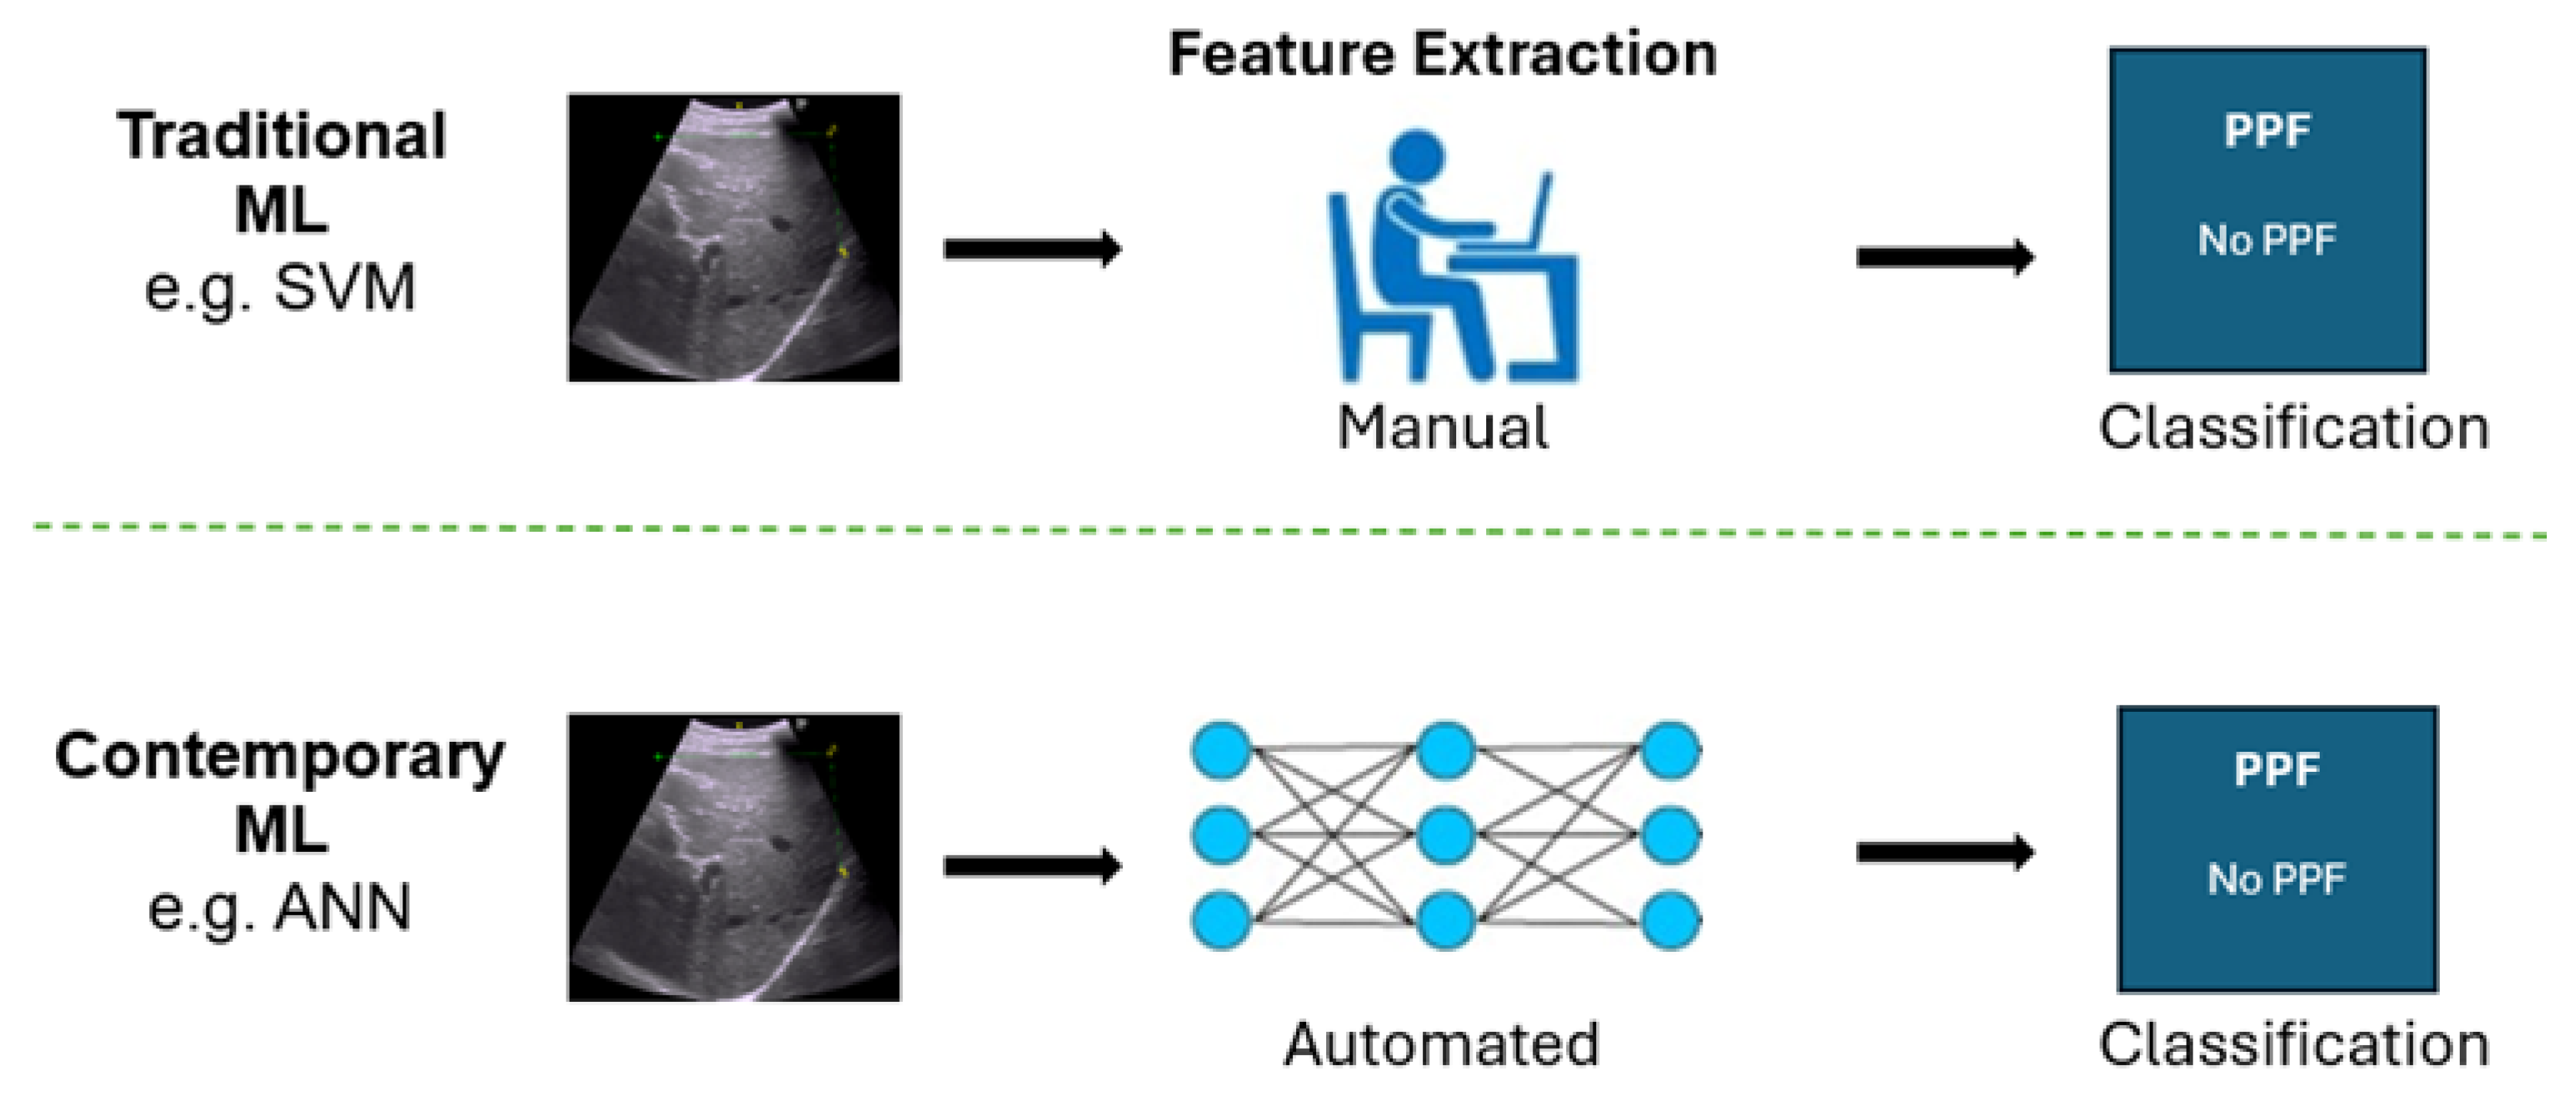
DNNs automate feature extraction and handle the complexity of medical image data, unlike traditional methods dependent on manual feature engineering (
Figure 3). DNN algorithms autonomously learn complex patterns and representations from raw image data, identifying subtle details and relationships that traditional techniques might miss [
12].
Deep Neural Networks excel due to their ability to detect complex visual patterns, generate consistent and objective measurements, and eliminate the need for manual feature selection. These attributes have proven instrumental in enhancing diagnostic accuracy for PPF detection [
15].
Whereas DL has been applied to liver fibrosis detection more broadly [
17], few studies have specifically addressed schistosomiasis-related PPF using the Niamey protocol, a standardised set of ultrasound guidelines for the assessment of schistosomiasis-related morbidity, particularly PPF caused by
Schistosoma mansoni [
18,
19]. This study aims to fill this gap by implementing and evaluating a DL-based approach for automated detection of PPF in ultrasound images, providing an objective and scalable tool for early diagnosis in endemic regions.
2. Materials and Methods
2.1. Dataset Source
This study utilised a comprehensive liver ultrasound image dataset from a case-control study conducted by the Uganda Schistosomiasis Multidisciplinary Research Centre (U-SMRC) [
20]. Data were collected between October 2023 and June 2024 from adult participants living in communities near Lake Victoria and Lake Albert, two distinct epidemiological settings [
21]. The study aimed to investigate risk factors associated with severe schistosomal morbidity by comparing individuals with advanced disease (cases) to those without or with mild infection (controls). Liver ultrasound images were part of the inclusion criteria to assess schistosomiasis-related PPF.
The liver ultrasound images were meticulously annotated by an experienced study sonographer using the Niamey protocol, a standardised ultrasonography protocol, which is fundamental for assessing schistosomiasis related morbidity, particularly hepatic morbidity caused by
Schistosoma mansoni [
18,
19].
The Image Pattern Score (IPS), derived from the Niamey protocol, provided a standardised approach for evaluating liver damage resulting from schistosomiasis. The score incorporates key sonographic indicators including liver surface nodularity, periportal thickening, parenchymal echogenicity, signal attenuation, and intrahepatic nodules or masses to assess the severity of PPF [
22]. Trained sonographers systematically evaluated these features and assigned an IPS.
In this study, we employed image classification as the primary task, framed within the paradigm of supervised learning. In supervised learning, models are trained on labelled datasets, where each input image is paired with a known outcome, enabling the system to learn mappings from input features to target labels [
23]. Ultrasound images were labelled according to the IPS assigned by the study’s radiologist following the Niamey protocol. Specifically, we designated images with IPS of 2 or higher as cases and those with IPS of 0 or 1 as controls. The CNN was trained to identify subtle ultrasound features associated with PPF, conditioned on these labels, and subsequently applied to unseen scans for classification.
The dataset source comprised 791 liver ultrasound images (197 cases and 594 controls) obtained from adults aged 18 to 50 years. However, reliance on secondary data from a resource-constrained setting, together with issues such as untraceable images arising from inconsistencies in the image identification numbers stored on the ultrasound device, resulted in inconsistent data quality and restricted the number of verifiable samples. Furthermore, the dataset exhibited a substantial class imbalance, with substantially more non-diseased than diseased cases. Under these constraints, only 200 images (100 non-disease cases and 100 disease cases) could be reliably verified and included to form a balanced dataset for binary classification. Consequently, the sample size was determined by data accessibility and verification feasibility rather than statistical estimation. Of the 200 labelled images, 80% were used for training and 20% for testing.
All ultrasound images were stripped of identifying information to protect participant privacy, in compliance with the Uganda Data Privacy and Protection Act [
24] and the General Data Protection Regulation [
25]. Participants in the original USMRC study had given prior consent for their ultrasound data to be used in research, allowing for ethical secondary analysis. The study received approval from the University of Essex ethics committee following the submission of a detailed proposal, including formal consent from USMRC principal investigators.
2.2. Data Extraction and Pre-Processing
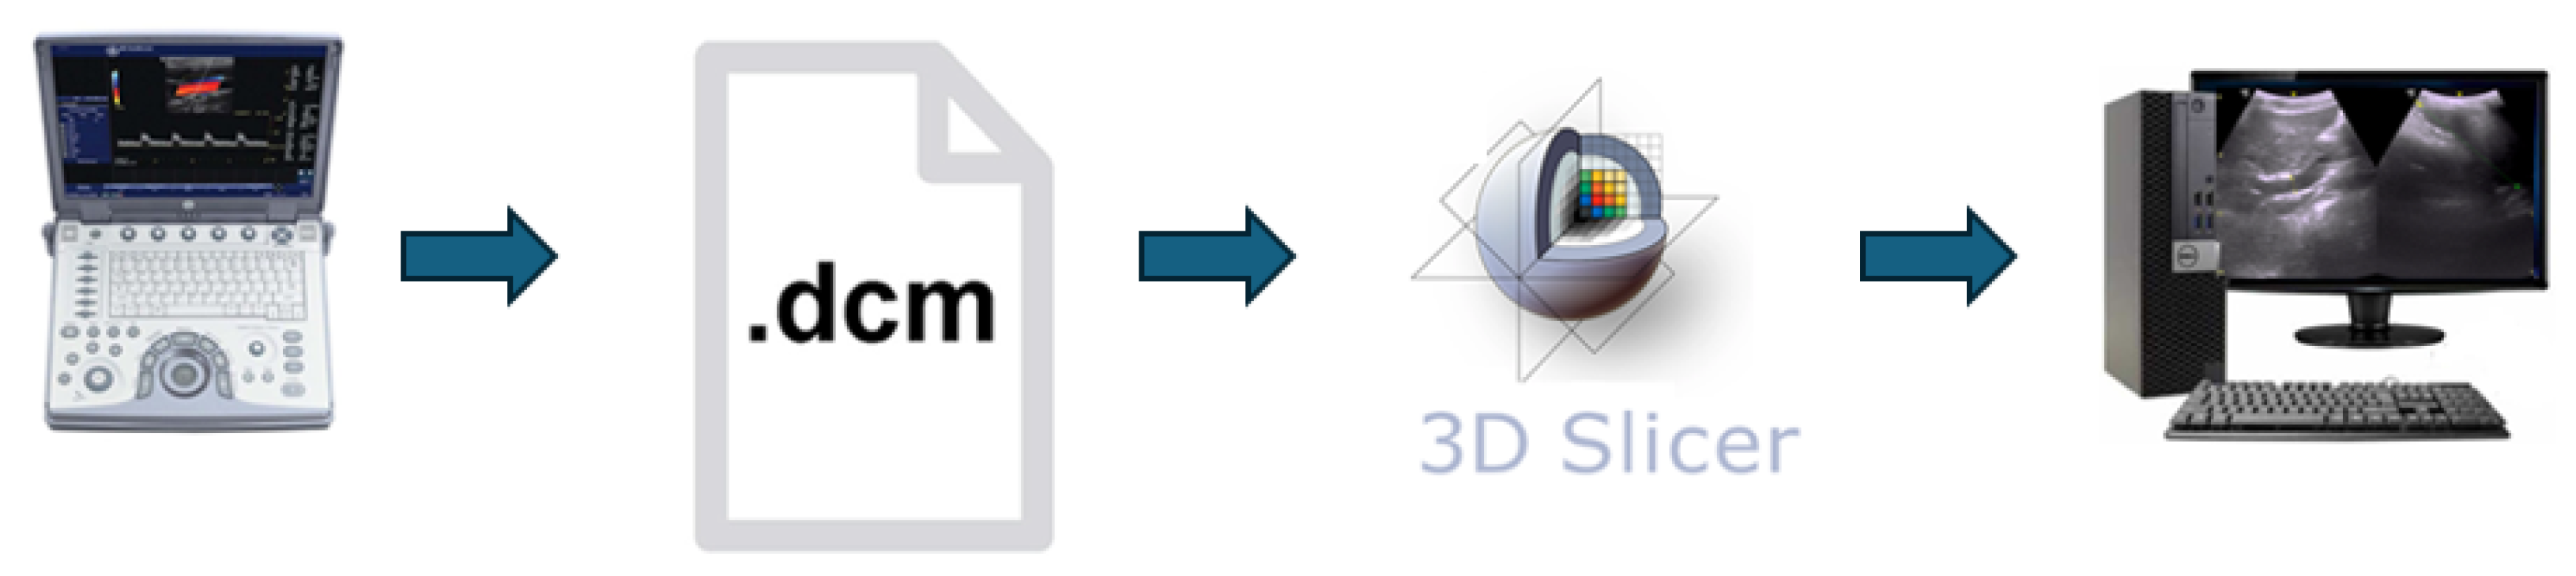
As illustrated in
Figure 4, 3D Slicer was used to extract and anonymise DICOM ultrasound frames of varying sizes, reflecting differences in body habitus and imaging parameters. Larger or deeper livers required greater imaging depth and a wider field of view, whereas smaller or shallower livers required less. Variations in probe positioning, transducer settings, gain, and resolution also influenced frame dimensions. To standardize the dataset, all frames were resized to uniform dimensions (
and
pixels) while preserving the original aspect ratio using padding, ensuring consistency and computational efficiency during model training.
Processed images were exported as PNG files, with all identifiable metadata removed to ensure compliance with privacy regulations and maintain participant anonymity. Several steps were performed to optimize image data for model training. Study IDs were replaced with anonymised labels, and images were categorized with prefixes (e.g., fibrosis_, nofibrosis_) for classification.
Participants were scanned in the supine position after fasting or consuming only water to optimize visualization of abdominal organs. Examinations were conducted using a GE Healthcare Logiq E portable ultrasound system equipped with a 4 MHz curved linear transducer and colour Doppler capability. All images were acquired in B-mode and stored with participant identifiers. Scanning was performed by a Radiological Technologist with over 20 years of experience in diagnosing Schistosoma mansoni-related morbidities and applying the Niamey Protocol.
To enhance the robustness and generalisation capability of the CNN, data augmentation techniques were applied during training using the ImageDataGenerator class from Keras. The augmentation strategy introduced random variability into the training images through Random rotations of up to , Horizontal and vertical shifts of up to 20% of the image width and height, respectively and Random horizontal flips. These transformations simulate common variations in medical or real-world imaging and increase the diversity of the training data. As a result, they help to reduce overfitting and improve the model’s ability to generalize to unseen data.
Data Normalization was performed to enhance training stability and model performance, all pixel values in the training and test datasets were first cast to 32-bit floating-point format. The mean and standard deviation of the training images were then computed, representing the average brightness and pixel value dispersion, respectively. Normalization was performed using the equation:
where
and
denote the mean and standard deviation of the training dataset. A small constant (
) was added to the denominator to avoid division by zero. This normalization was also applied to the test dataset using the training set statistics, ensuring consistent preprocessing across datasets and avoiding data leakage.
2.3. CNN Model Implementation
The CNN model in this study was implemented using the
Keras Sequential API, a widely adopted high-level deep learning framework built on top of TensorFlow [
26]. The implementation was carried out in Python 3.12.3 and utilised several libraries and packages for model construction, training, evaluation, and visualisation. The model layers were constructed using keras.
We used Google Drive, Git 2.34.1, and Google Colab for an efficient model development workflow. Google Colab is a cloud platform which provides access to high-performance hardware such as GPUs and TPUs, significantly accelerating computations compared with typical local machines. This results in faster model training and potentially higher accuracy [
27].
The workflow involved several key steps to ensure seamless integration between data storage, version control, and model training. Initially, periportal images were collected on the local computer and stored in a designated Google Drive directory. These images were organized into two folders labelled “fibrosis” and “nofibrosis” for clear categorization. Jupyter notebooks used for data preprocessing, model training, and evaluation were developed and stored in a GitHub repository, enabling version control and collaboration. Finally, these notebooks and the pre-processed data were linked to Google Colab, where the actual model training took place using the pre-processed data and the computational resources provided by the cloud platform.
2.4. VGG16-Inspired CNN Architecture
The choice of a CNN for PPF detection was motivated by its proven effectiveness in image processing tasks. We adopted a model inspired by the VGG16 network, known for its balance between simplicity and performance. This architecture was selected for its ability to extract deep features from ultrasound images while remaining computationally efficient [
28,
29,
30].
Compared with other models such as ResNet or transformer-based approaches, the VGG16-inspired CNN offers several advantages [
31]. Although the dataset used in this study was relatively small, the deep structure of the network enabled effective feature learning while minimizing the risk of overfitting. Its convolutional layers effectively captured detailed and discriminative image features, supporting accurate fibrosis detection. VGG16 and similar architectures have also demonstrated consistent success across a range of medical imaging applications, including disease classification. Furthermore, the model’s computational efficiency made it well-suited to the resource constraints of this study, unlike more complex transformer-based models that demand greater computational power. Overall, the VGG16-inspired CNN provided an optimal balance between performance and efficiency, making it an appropriate choice for the study’s objectives.
The CNN used two activation functions at different stages to perform binary PPF image classification. Rectified Linear Unit (ReLU) activation functions were applied to all convolutional and dense layers except the final layer. Defined as
, the ReLU function introduces non-linearity by zeroing out all negative input values while preserving positive ones. This facilitates efficient training by mitigating the vanishing gradient problem and enabling the network to learn hierarchical, discriminative features from liver ultrasound images such as texture, edge contrast, and structural anomalies. The output layer consisted of two neurons activated by the hlsigmoid function, defined as:
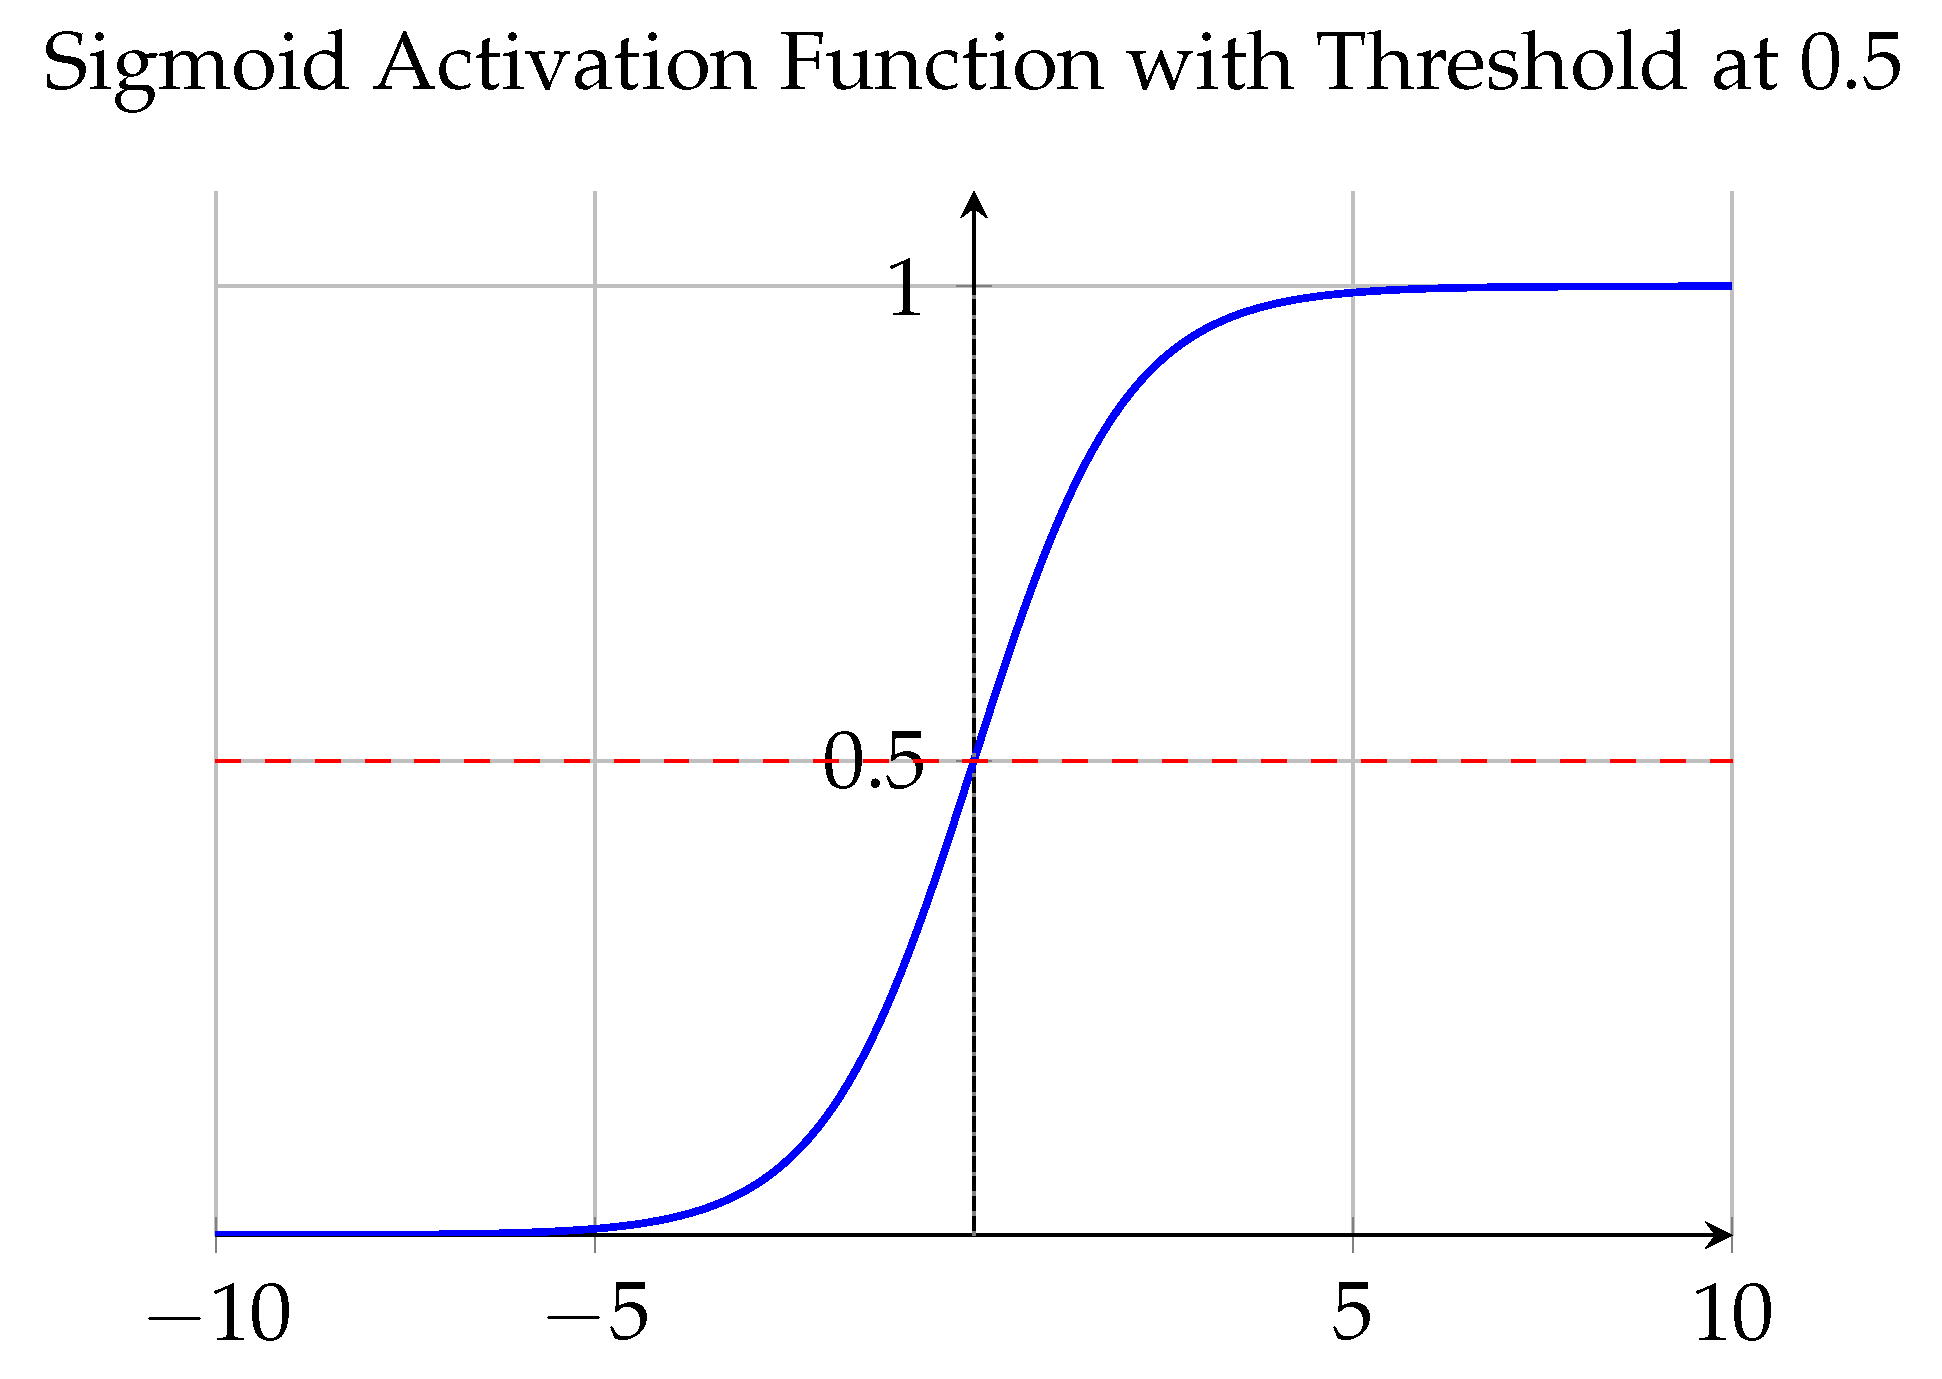
Each sigmoid unit independently maps its input to a probability range between 0 and 1 (
Figure 5), allowing the model to assign class confidence scores for the presence or absence of PPF. Since the classification problem was binary and the dataset had a balanced class distribution, a threshold of 0.5 was applied [
32], outputs
were interpreted as PPF-positive, and outputs
as PPF-negative. In deployment, the higher of the two probabilities was used to determine the predicted class.
Together, this activation configuration enabled the model to learn rich representations of image features and translate them into clinically relevant binary predictions.
2.5. Evaluation Metrics
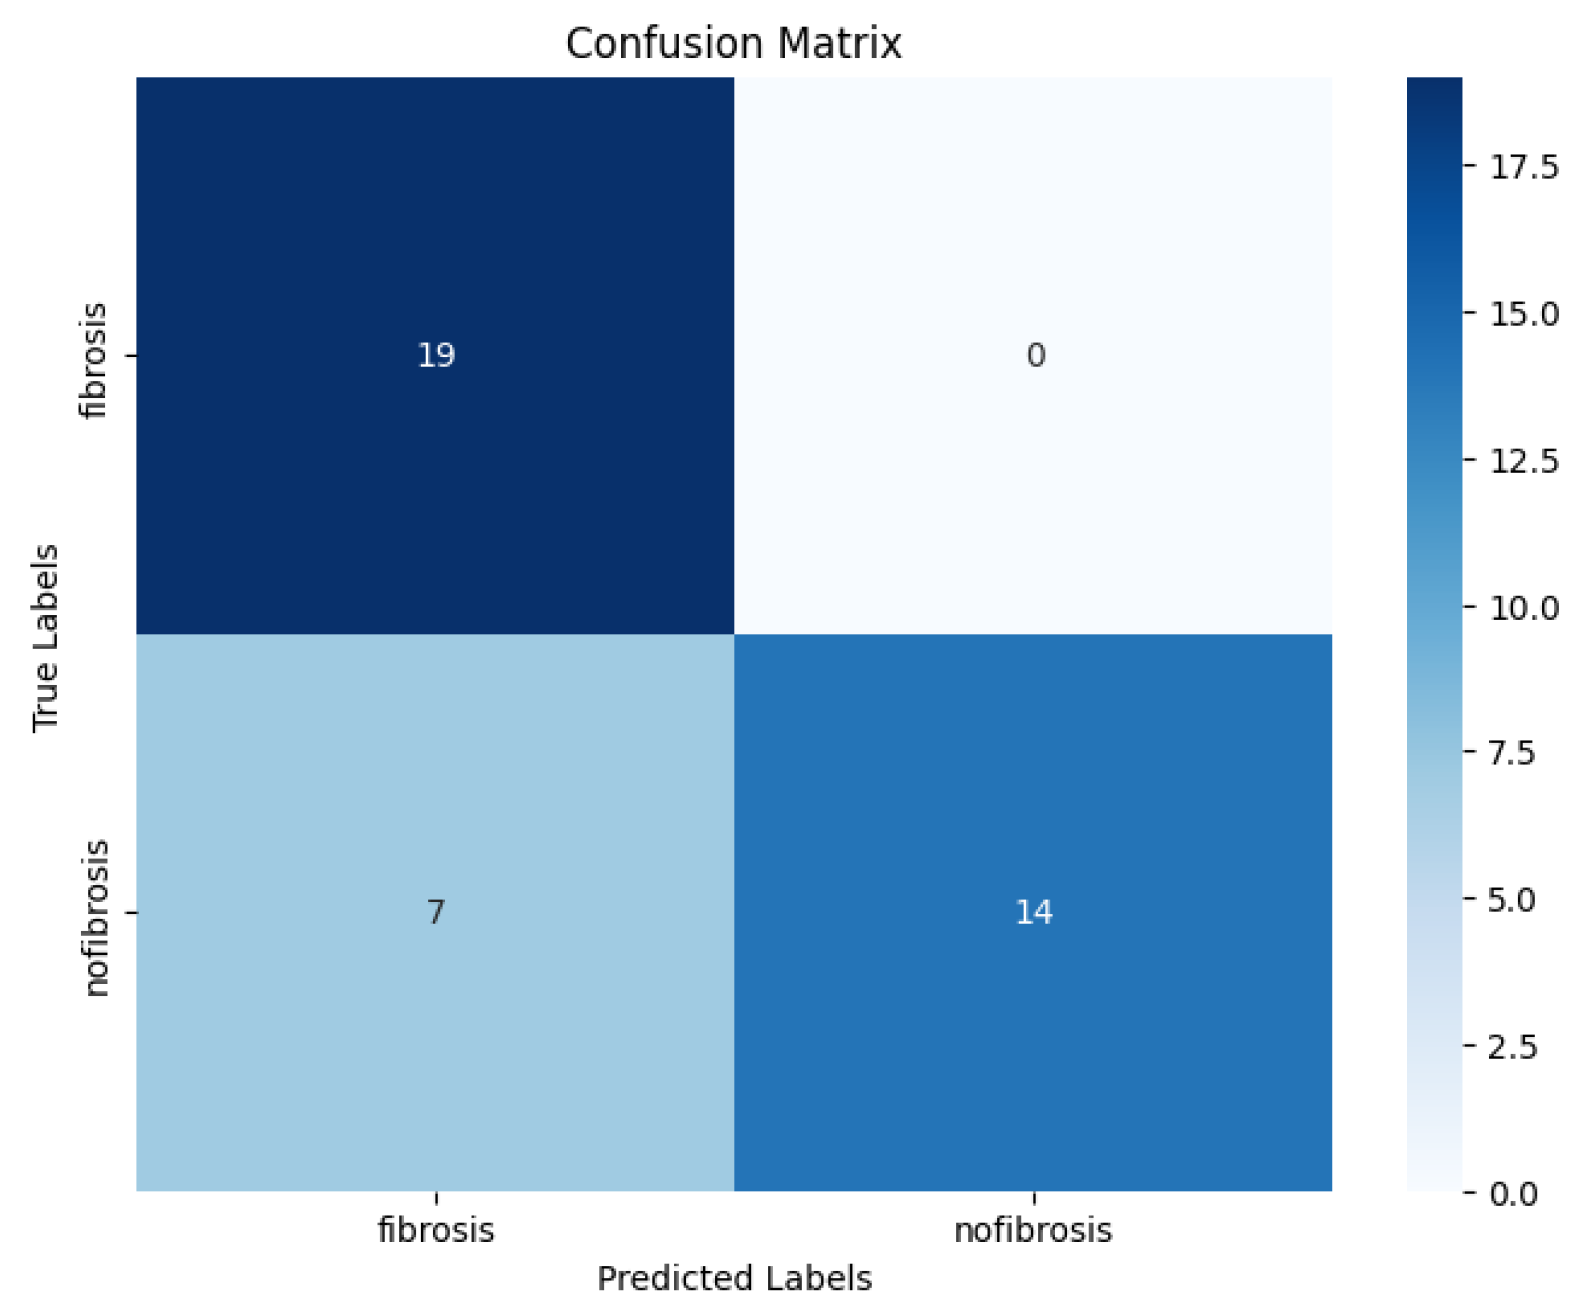
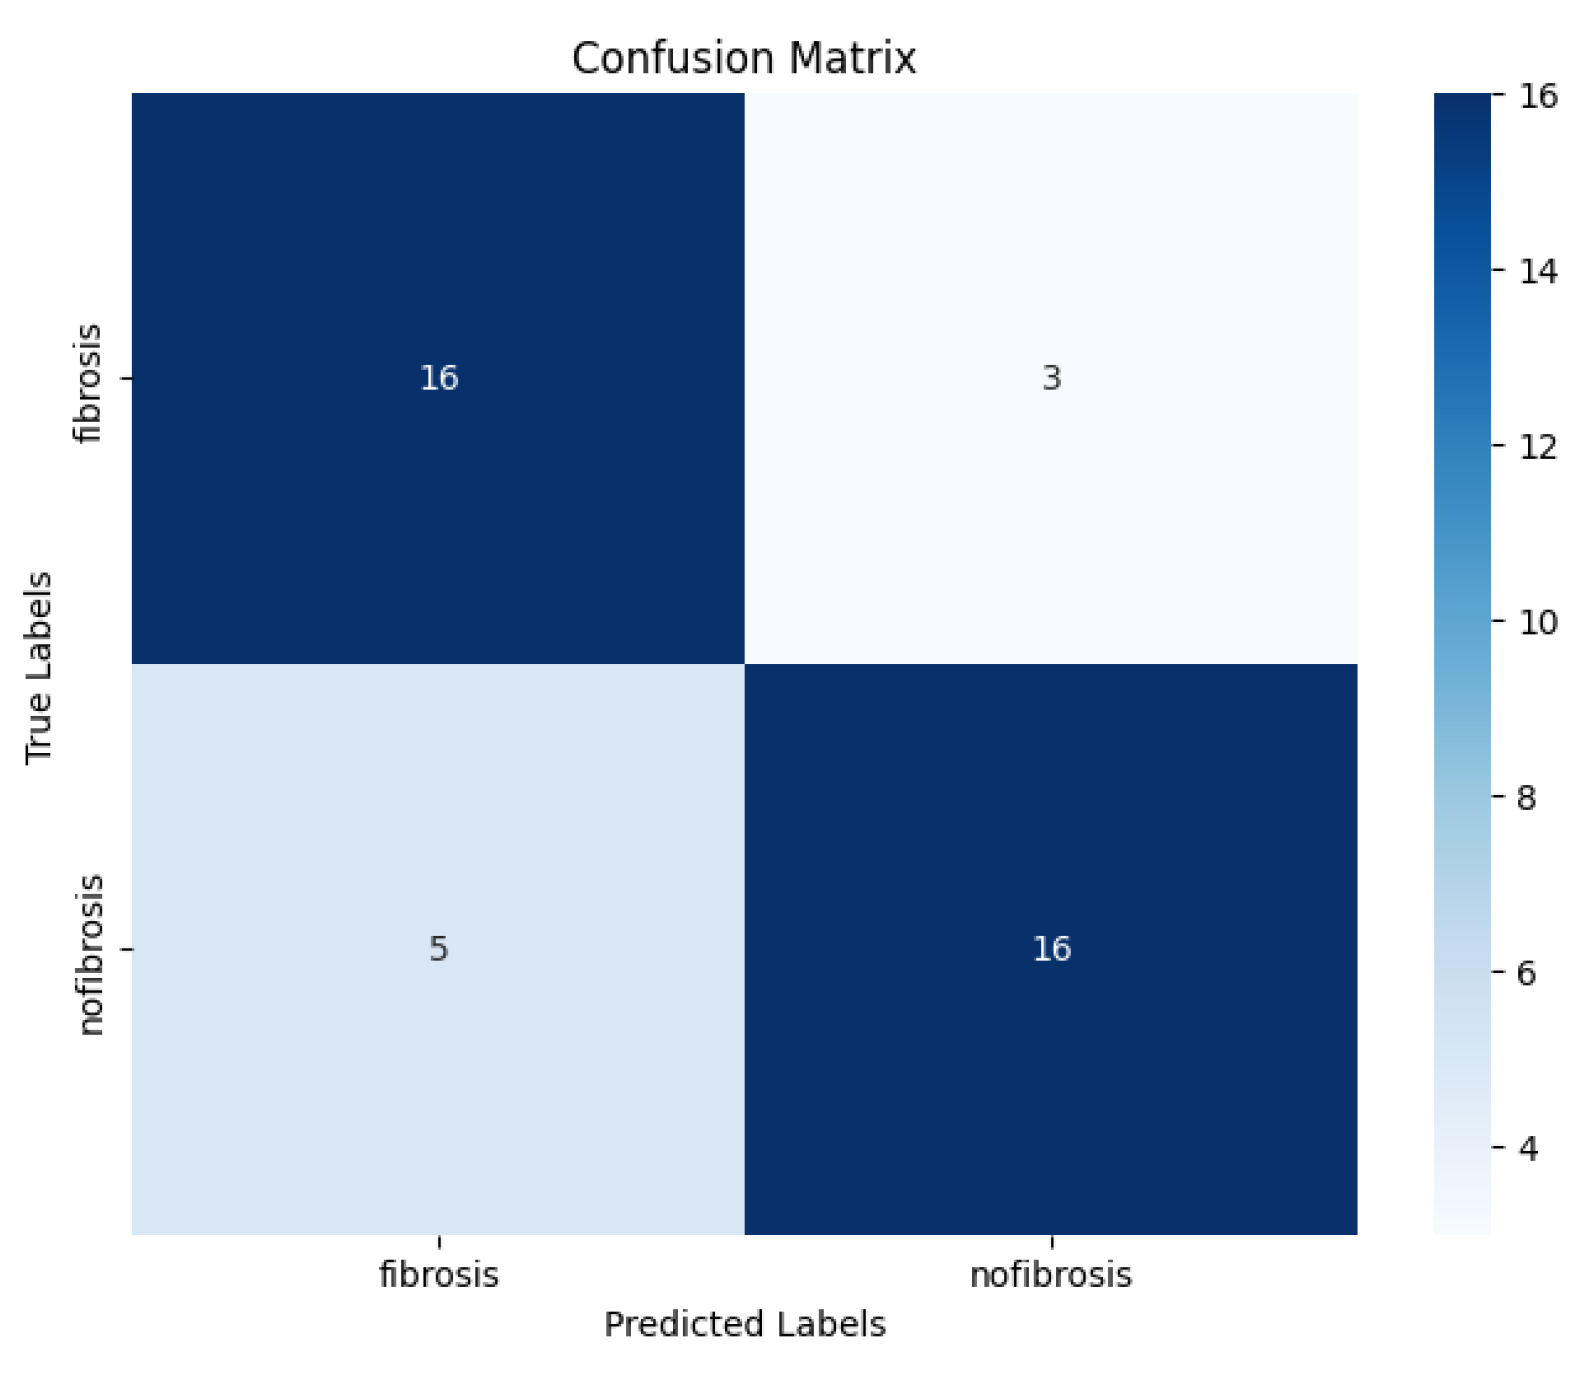
To evaluate model performance, we used standard classification metrics derived from the confusion matrix, including accuracy, precision, recall, F1 score, and specificity. In addition, we assessed the area under the ROC curve (AUC). Together, these metrics provide a comprehensive assessment of both the sensitivity and reliability of the model.
Accuracy represents the proportion of correctly classified instances (both positives and negatives) among the total number of cases. It provides an overall measure of how well the model performs across all classes. It is calculated as:
Precision is defined as the proportion of true positive predictions among all instances that were predicted as positive. It is given by:
Recall, also referred to as sensitivity or the true positive rate, is defined as the proportion of true positive predictions among all actual positive instances. It is calculated using the formula:
The F1 score is a combined measure of precision and recall, calculated as their harmonic mean. It provides a balance between the two metrics, especially in scenarios where data is imbalanced or when both false positives and false negatives carry significant consequences.
Specificity, also called the true negative rate, measures the proportion of correctly identified negatives among all actual negatives. It is expressed as:
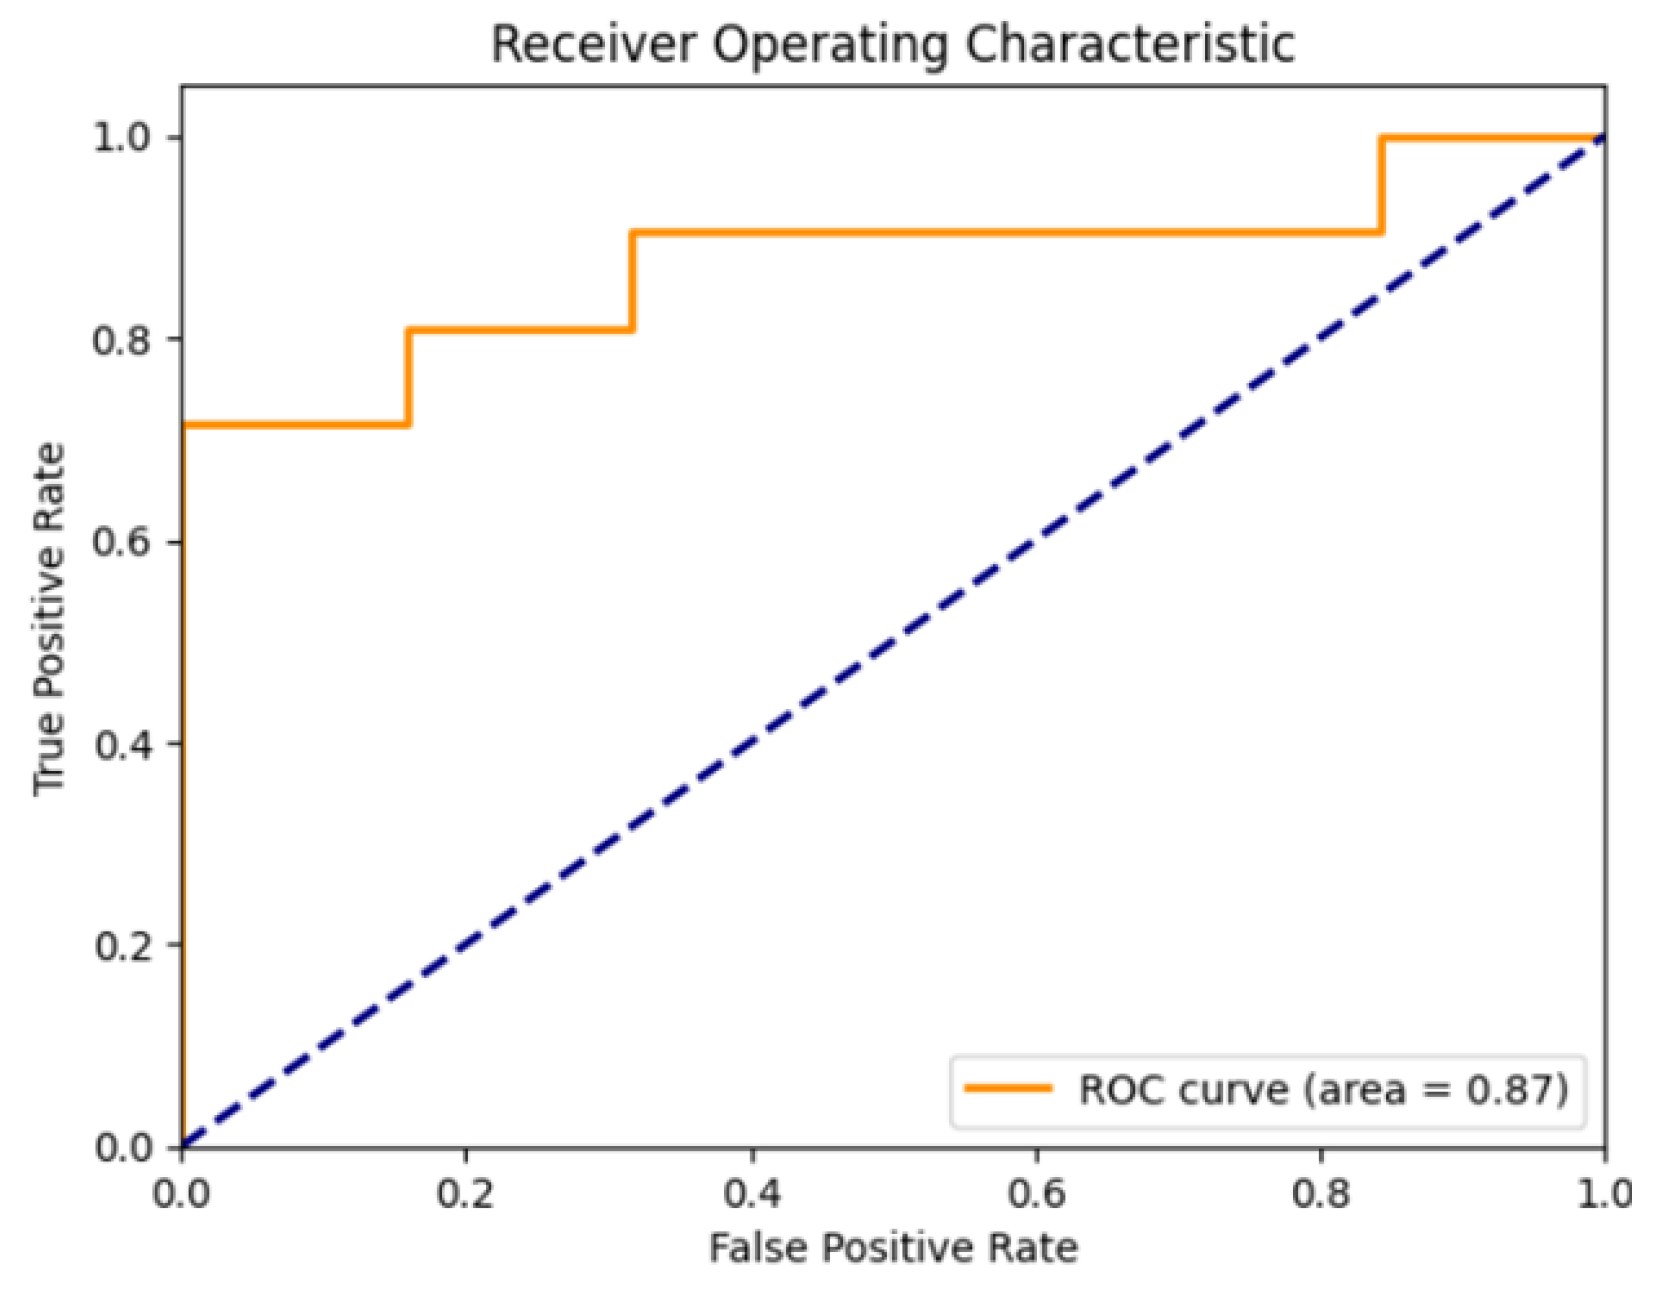
The AUC is a threshold-independent metric that evaluates the model’s ability to distinguish between positive and negative classes. It is computed as the area under the ROC curve, where the curve plots the true positive rate against the false positive rate at various thresholds. An AUC of 1.0 indicates perfect classification, whereas 0.5 corresponds to random guessing.
2.6. Model Training
Random seed initialisation was performed using Python’s built-in random and numpy modules to ensure reproducibility of training results. Several key hyperparameters were selected and adjusted during the model training process. These adjustments were supported by callbacks that helped fine-tune training based on model performance. Training began by evaluating two input image resolutions (32 × 32 pixels and 128 × 128 pixels), cycling through each size to identify the optimal scale for feature extraction. Comparison of the two input resolutions showed that the model trained on 32 × 32 frames achieved higher accuracy and greater consistency across validation runs than the 128 × 128 configuration. The network employed the Adam optimizer with an initial learning rate of .
To enhance generalisation and mitigate overfitting, on-the-fly data augmentation was applied using Keras’s ImageDataGenerator, which randomly rotated, shifted, and flipped input images during training. Finally, a dropout rate of 0.5 was used in the fully connected layer to reduce overfitting by randomly deactivating half the neurons during each update. In addition to our baseline training setup, we leveraged two key Keras callbacks to enhance model performance. The first, ReduceLROnPlateau, monitors validation loss and automatically reduces the learning rate by a factor of 0.1 after 10 epochs without improvement. This approach helps the optimizer converge more precisely once performance plateaus [
33]. The second callback, EarlyStopping, halts training when no further progress is seen over ten epochs. Together, these callbacks streamlined training, prevented overfitting, and secured an optimally tuned model.
In summary, training was performed using the Adam optimiser, selected for its adaptive learning rate and strong empirical performance on complex medical imaging tasks. For activation functions, we applied the ReLU in all hidden layers to introduce non-linearity while maintaining computational efficiency. The final layer used a sigmoid activation function to output probabilities suitable for binary classification, specifically distinguishing between cases with and without PPF [
34]. Although no automated search strategy was applied, the use of well-chosen hyperparameters and responsive callbacks played an important role in shaping the model’s learning behaviour and improving overall performance.
3. Results
Table 1 presents the descriptive characteristics of the study population from whom the ultrasound images were collected and used to train and test the CNN model. It summarizes the demographic, anthropometric, and ultrasound IPS for the 200 individuals included in the analysis.
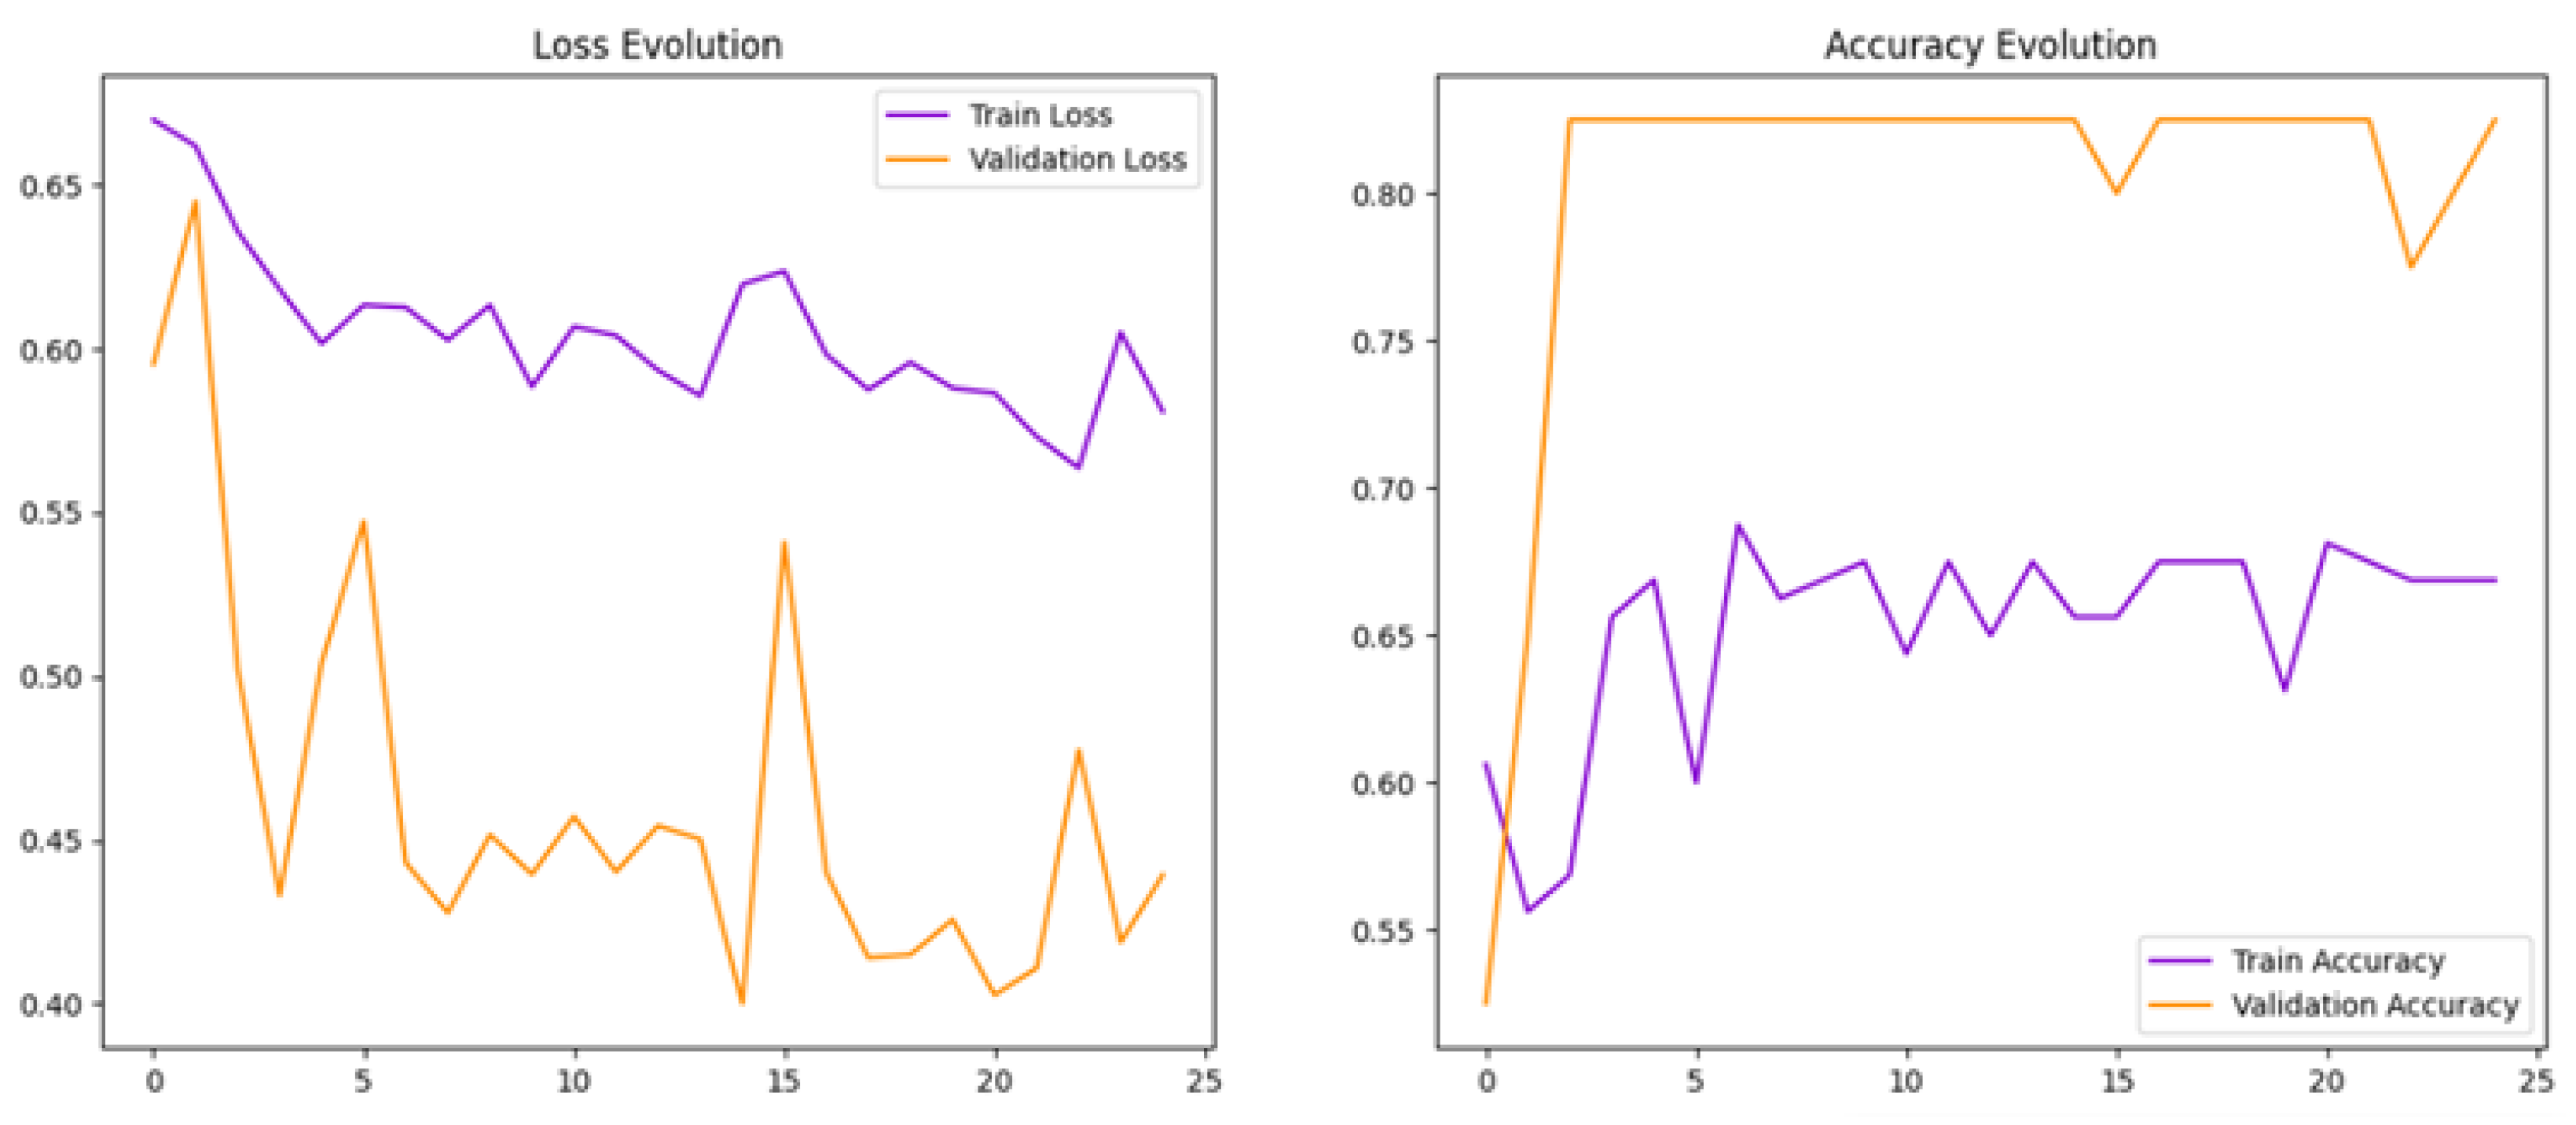
Initially, a baseline model (Model 1) was developed using a batch size of 16. It achieved a test accuracy of 83% and a test loss of 0.40, showing promising results [
35,
36].
Figure 6 loss and accuracy curves indicated overfitting, as reflected by stable high validation accuracy but fluctuating validation loss. This suggested that the model memorised training data rather than generalizing well.
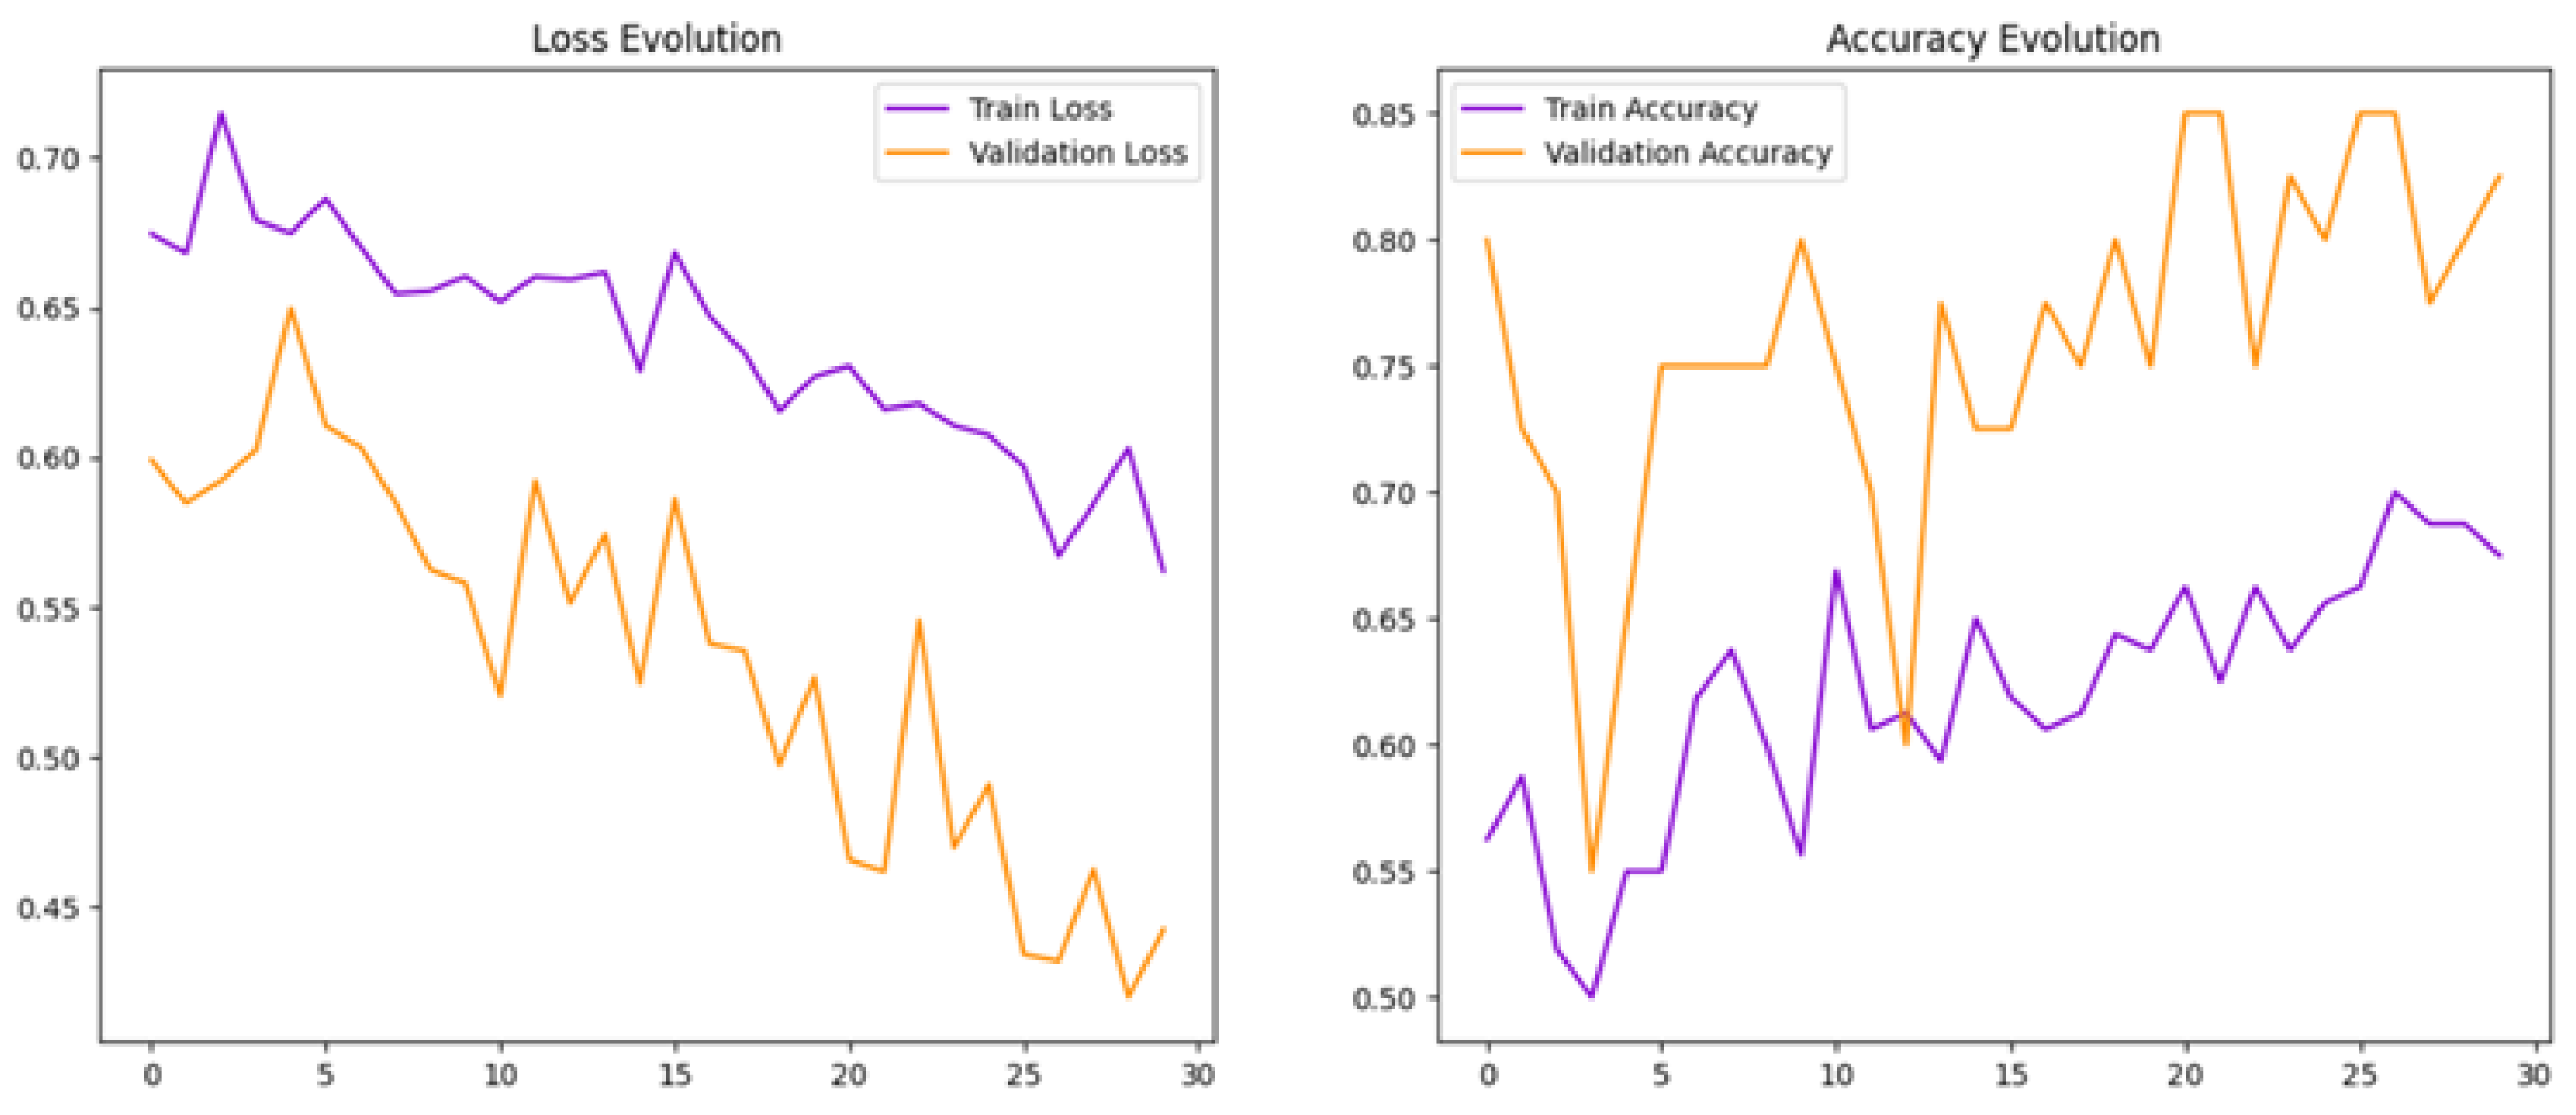
To help reduce overfitting, we increased the batch size from 16 to 32 in Model 2. This adjustment aimed to stabilise training and improve the model’s ability to generalise.
4. Discussion
This study demonstrates that a CNN can effectively detect PPF from ultrasound images. Even at a reduced 32 × 32 resolution, diagnostic performance remained robust, indicating that essential visual features were preserved. The results highlight the value of a well-designed preprocessing pipeline that maintains structural integrity while improving computational efficiency. Preserving the original aspect ratio during resizing prevented distortion of anatomical structures, allowing the model to focus on relevant echogenic and textural features. These findings also emphasise the potential of lightweight, resource-efficient models for ultrasound analysis, particularly in field or low-resource settings, and support the feasibility of scalable, automated approaches for PPF screening.
The second model (Model 2), developed through iterative optimisation, achieved strong overall performance, suggesting that deep learning can play a valuable role in improving diagnostic accuracy for liver disease caused by Schistosoma mansoni. The results reflect a balanced ability to both identify true positive cases and avoid false positives, a critical consideration in clinical diagnostics. The model’s high precision indicates that when fibrosis is predicted, it is usually correct, reducing unnecessary concern or follow-up. At the same time, its ability to capture most positive cases highlights its potential to support earlier identification of patients with fibrosis. Taken together, these findings point to a model that could complement human expertise by providing consistent and reliable diagnostic support.
The area under the curve further reinforces the strength of the classifier, indicating that the model could be confidently applied to distinguish between individuals with and without PPF [
37]. One of the main improvements from the baseline model (Model 1) to Model 2 was in addressing overfitting. Initially, while the model achieved strong training performance, the unstable validation loss suggested it had memorised the training data rather than learned general patterns. By adjusting the batch size, implementing early stopping, and applying data augmentation, Model 2 was able to generalise better. The resulting learning curves, though showing mild oscillations, indicated more consistent performance on unseen data. Such fluctuations are common in models trained on limited or noisy datasets, where validation metrics often reflect sampling variability rather than convergence failure [
38]. Nevertheless, the overall trajectories demonstrated stable and progressive optimisation. To further mitigate overfitting and improve generalisation, expanding the dataset to capture greater diversity and better represent real-world distributions is recommended [
39]. The results reported here, however, reflect the best-performing configuration following iterative adjustment of training parameters.
In clinical practice, diagnosing PPF through ultrasound imaging requires significant expertise and is prone to subjectivity. The use of a CNN model provides an opportunity to standardise this process, reducing reliance on expert interpretation and increasing the consistency of results. This could be especially beneficial in low-resource settings where access to trained radiologists or sonographers is limited.
Moreover, early detection of PPF is crucial, as it can prevent progression to more severe liver complications. An automated tool capable of identifying early signs of fibrosis in routine ultrasound scans could support timely interventions and improve patient outcomes.
The results observed here are comparable to those from similar studies. For instance, Lee et al. (2020) [
17] reported strong performance using deep learning on ultrasound data to detect liver fibrosis, similar to the performance achieved in this study. However, this project differs in that it focuses specifically on PPF, rather than general liver fibrosis, and applies the Niamey protocol, which is widely used in field-based diagnostics. This makes the model more applicable to schistosomiasis-endemic settings, particularly in sub-Saharan Africa.
While the results are encouraging, this study has a number of limitations. The dataset included only 200 ultrasound images, which may restrict how well the model generalises to broader populations or different imaging settings. Another limitation is that the initial classification of images was carried out by only one ultrasonographer. Having a second independent reviewer would have reduced the risk of relying on a single person’s subjective perspective. Moreover, no other types of liver disease were included, meaning the procedure may not perform as well if other causes of fibrosis are present.
Future research should therefore aim to train and validate the model on larger and more varied datasets, ideally collected from multiple centres and regions. In addition, future studies should consider stratified or randomised recruitment strategies to minimise bias and improve dataset representativeness. Another direction is extending the model beyond binary classification (fibrosis versus no fibrosis) to predict different levels of fibrosis severity, as defined by the Niamey grading system, which could enhance clinical utility. Future work should incorporate a wider range of hepatic pathologies to ensure the model can distinguish PPF from other causes of liver fibrosis. Exploring alternative architectures, such as ResNet, DenseNet, or EfficientNet, may provide improved accuracy and efficiency compared to VGG16. Ensemble approaches could also be investigated to combine the strengths of multiple models for more robust PPF detection.
Manual hyperparameter tuning was employed in this study to optimize model performance. While this approach allowed careful adjustment based on observed model behavior, we acknowledge that automated methods such as Bayesian optimisation could be explored in future work to further refine the hyperparameters systematically. Future work could also explore the use of interpretability methods such as Gradient-weighted Class Activation Mapping (Grad-CAM), which highlight the regions of an image most influential in the model’s decision. This would make the system more transparent and help build clinician confidence in its outputs.
5. Conclusions
This study adds to the growing body of evidence supporting the application of deep learning techniques to routine ultrasound imaging for the detection of PPF. The CNN model developed demonstrated strong diagnostic performance, highlighting its potential to assist clinical decision-making, particularly in schistosomiasis-endemic regions where access to specialised radiological expertise is limited. With further validation, this AI-based approach could help shift fibrosis diagnosis from a subjective process to a more standardised and scalable one, thereby promoting more equitable and timely care for individuals at risk of liver complications due to schistosomiasis.
In summary, our CNN achieved strong diagnostic performance for detecting PPF in ultrasound images. With further validation on larger and more diverse datasets, this approach could support earlier, more consistent diagnosis in endemic regions. We acknowledge that deployment metrics (e.g., inference latency, memory footprint) and comparative evaluation against clinical experts were beyond the scope of this study. Future work will address these aspects, alongside extending beyond binary classification to capture fibrosis severity and improve interpretability for clinical adoption.




 ,
,