


Abstract
Yard crane (YC) operations are critical to the overall productivity of container terminals, especially as terminals move toward higher levels of automation. This study proposes a score-based dispatching strategy for twin RTGCs operating within a single yard block. The proposed logic evaluates each job using four factors—distance between crane and job, job waiting time, estimated processing time, and an elasticity term inspired by spring mechanics that reflects the tendency of each crane to stay within its preferred working zone. These factors are normalized and combined into a single score, and the corresponding weights are optimized by a genetic algorithm (GA). Jobs with lower scores are given higher priority for assignment. A discrete-event simulation model of a twin RTGC system is developed using AutoMod® to assess the performance of the proposed strategy. The score-based rule is compared with conventional dispatching policies such as First-Come-First-Served (FCFS), Nearest-First-Served (NFS), and their weighted combination under various workload scenarios. Relative to the score-based strategy without elasticity, the inclusion of the elasticity term reduces average and maximum truck turnaround time by 7.51% and 7.79%, respectively; these improvements translate into higher yard throughput and strengthen the advantage over the benchmark dispatching rules. In particular, the elasticity term effectively mitigates crane interference while maintaining a balanced spatial distribution of work between the two cranes. These findings indicate that the proposed dispatching logic provides a practical and implementable control strategy for retrofitting existing RTGC systems and integrating them into terminal operating systems.
1. Introduction
The slow growth of maritime trade in 2022 was driven by multiple factors, including slower global economic development, high inflation, the conflict in Ukraine, and strict COVID-19 containment measures that particularly affected China’s trade and economic performance [1].
Despite this, the United Nations Conference on Trade and Development projected that maritime trade volume will resume moderate growth, with a 2.4% increase expected in 2023 and steady expansion through 2024–2028 [2]. As trade volumes rise, container terminals face increasing pressure to enhance operational efficiency, reliability, and the level of automation.
Container terminal operations are generally divided into quay operations, yard operations, and integrated operations that coordinate multiple equipment types. While quay operations focus on berth allocation and quay crane (QC) scheduling to minimize vessel turnaround times, yard operations often become a critical bottleneck in the logistics chain [3]. YCs play a central role in this context, as they are responsible for transferring containers between storage locations in the yard and seaside or landside interfaces such as QCs and trucks [4]. Inefficient YC control can therefore delay container flows and degrade terminal performance.
In modern automated yards, various types of handling equipment are employed, including YCs, automated guided vehicles (AGVs), automated lifting vehicles (ALVs), straddle carriers, and intelligent autonomous vehicles (IAVs) [4]. YCs are typically categorized as either rail-mounted gantry cranes (RMGCs) or rubber-tired gantry cranes (RTGCs). RMGCs, which operate on fixed rails, are advantageous for high precision automation but are sensitive to ground conditions and require substantial infrastructure investment. RTGCs, in contrast, lower infrastructure costs and offer greater flexibility for inter-block movements, but they generally rely on diesel engines, resulting in higher energy consumption and maintenance costs [5].
Despite these drawbacks, the RTGC market is expected to grow at a compound annual rate of 4.7% [6]. Recent research and industrial practice have therefore focused on retrofitting existing RTGCs for automation [7] and transitioning to electric or hybrid solutions to reduce emissions and improve sustainability [8].
Retrofitting existing terminal facilities for automation can be more cost-effective than constructing entirely new automated terminals [9]. This has led to growing interest in low-cost automation strategies that leverage existing RTGC fleets [7].
In particular, there is increasing global demand—especially in regions such as China and the Middle East—for RTGC automation to enhance safety, operational consistency, and productivity [10]. Operating twin yard cranes within the same block, however, introduces additional challenges: when two cranes share the same lane or work in close proximity, inappropriate job assignment can cause mutual interference, longer truck waiting times, and safety risks, as well as higher energy consumption, maintenance costs, and operator workload. As smart port initiatives advance, YC control algorithms must be tightly integrated with terminal operating systems (TOS), reinforcing the need for intelligent and adaptive dispatching strategies that can effectively coordinate multiple cranes while leveraging existing infrastructure.
Previous research on YC control can be broadly divided into scheduling-based approaches and dispatching rules. Scheduling approaches typically formulate mixed-integer programming models and apply exact or heuristic algorithms to generate task sequences, but yard crane scheduling is NP-complete and even finding feasible solutions becomes difficult within a reasonable time as the number of tasks and the planning horizon increase [10]; in addition, optimal plans derived under known task information often need to be frequently rescheduled in dynamic and uncertain port environments [11]. As a result, many container terminals rely on immediate dispatching rules—such as FCFS and NFS—which are simple to implement and responsive in real time, but do not explicitly account for multi-crane interference or workload balance.
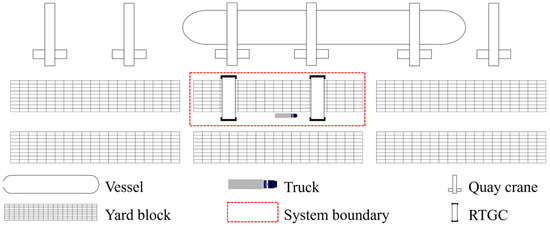
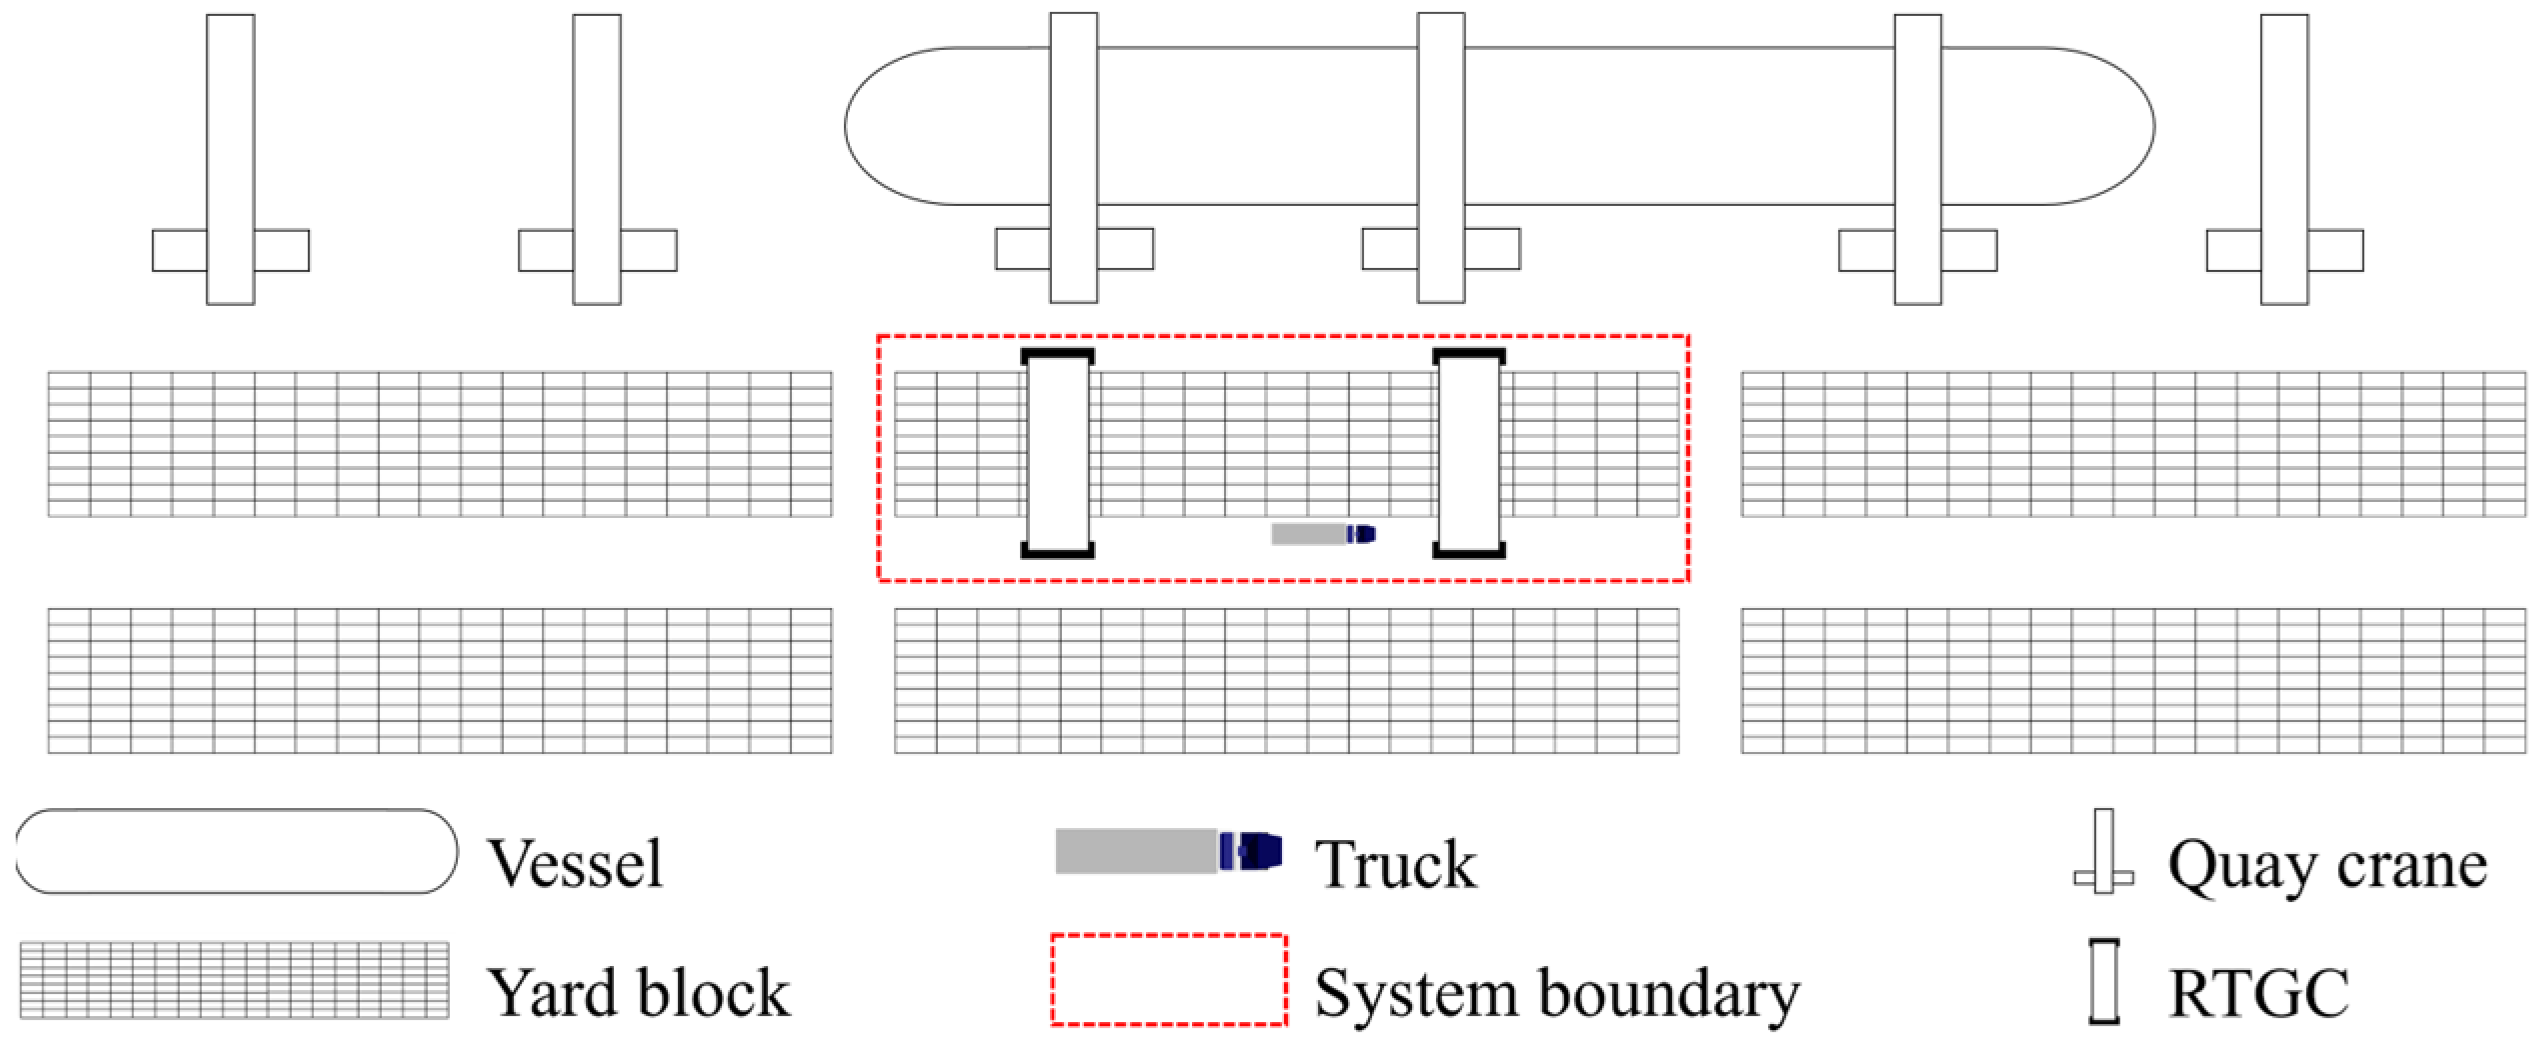
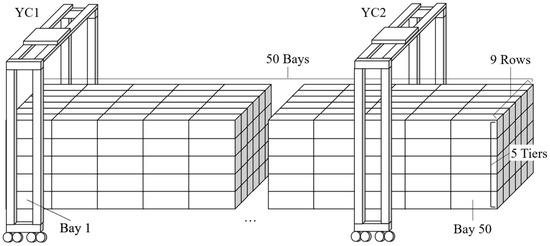
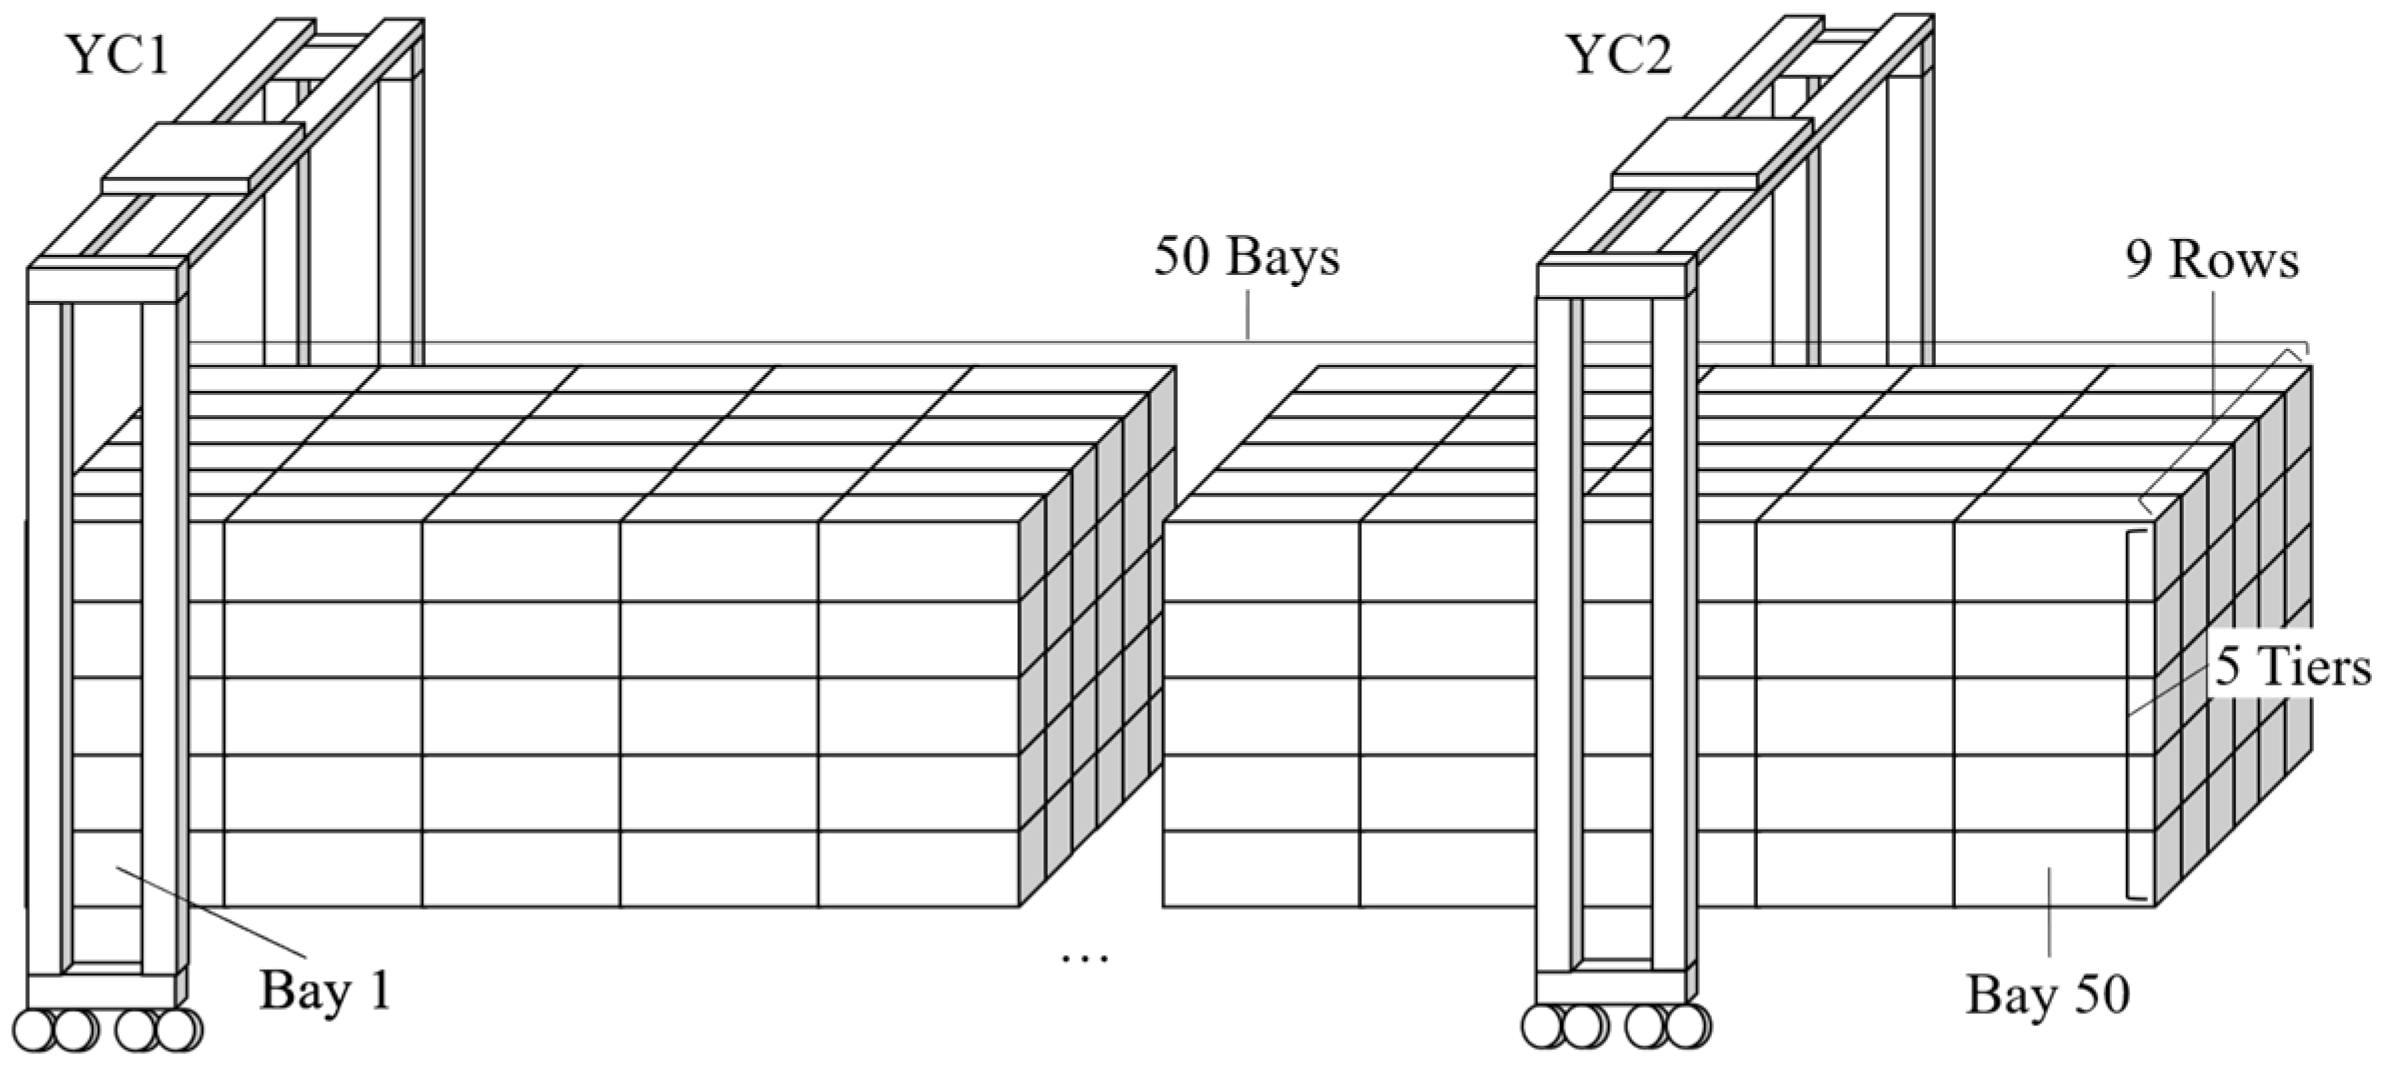
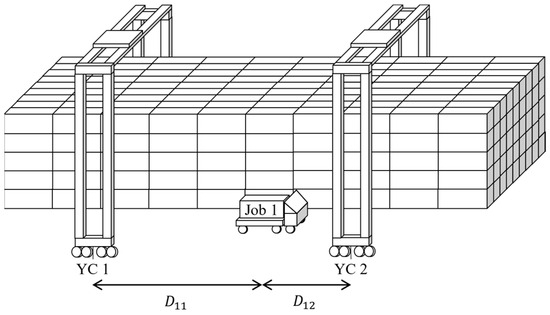
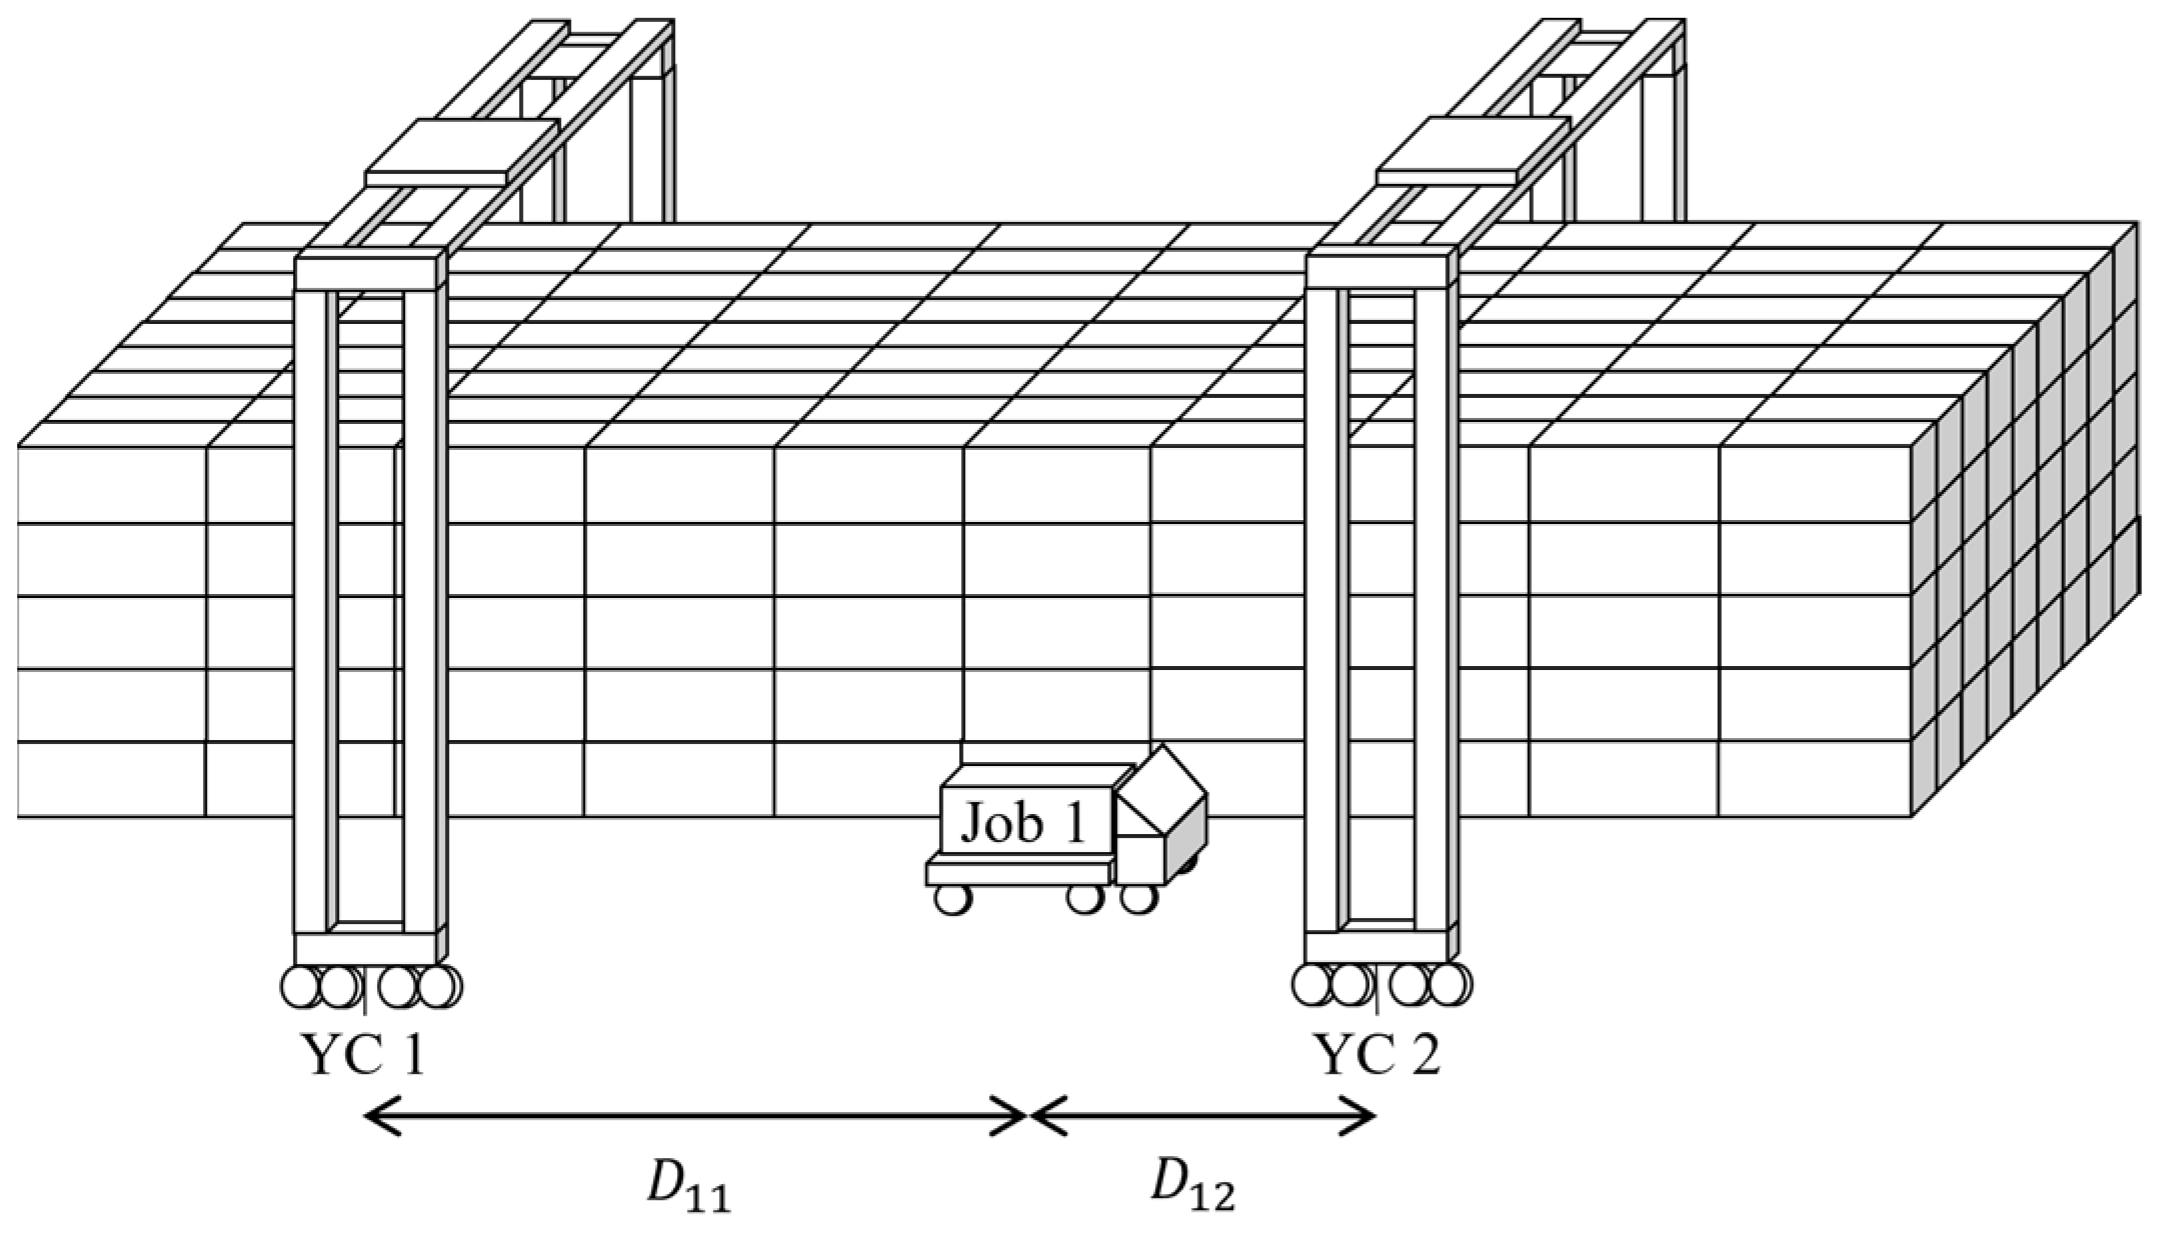
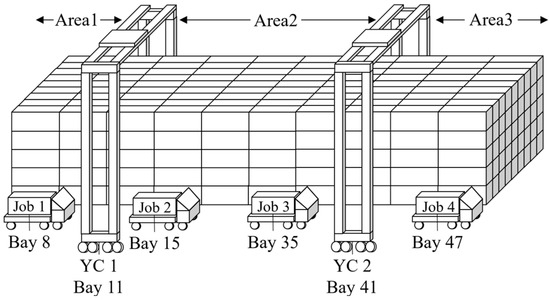
To bridge this gap between theoretically optimal scheduling and practical re-al-time control, this study proposes a Score-based dispatching strategy for twin RTGCs operating within a single yard block, as depicted in Figure 1.
Figure 1.
Research area.
Each job is evaluated by a score that combines four factors—distance between crane and job, job waiting time, estimated processing time, and an elasticity term that captures the directional tendency of each crane relative to its assigned working zone—with the corresponding weights optimized by a GA. A discrete-event simulation model developed in AutoMod® shows that, compared with FCFS, NFS, and their weighted combination under various workload scenarios, the proposed strategy reduces average by 7.51% and maximum by 7.79%, while also improving yard throughput.
The remainder of this paper is organized as follows: Section 2 reviews related literature, Section 3 describes the problem environment, Section 4 presents the proposed score-based dispatching logic, Section 5 reports the simulation experiments and results, and Section 6 discusses conclusions and future research directions.
2. Literature Review
2.1. Port Research
A container terminal can be broadly divided into the quayside, where ships are loaded and unloaded, and the yard side, where containers are stored and handled before reaching the gate. Reflecting this structure, many studies distinguish between quay and yard operations. Covic [12] focus on yard management issues such as storage, relocation, and handling equipment coordination, whereas [13,14] concentrate on quay-side operations including berth and QC management.
Research on handling equipment and optimization models in container terminals is also active. This includes work on cranes [15] and yard trucks [16], as well as integrated operational logic that coordinates multiple subsystems within the terminal [17]. In parallel, methodologies aimed at reducing energy consumption [5] and lowering CO2 emissions [18] reflect the increasing importance of sustainability in terminal operations.
Two types of automated cranes—the QC and the YC—play central roles in these processes. While QCs at the seaside have been extensively studied in terms of berth allocation and crane scheduling, the present work is more closely related to yard side operations [13]. In the yard, YCs operate in the container yard connecting seaside and landside flows, and their control strategies have been widely investigated to improve terminal performance [19]. These strategies can be broadly divided into scheduling models and real time dispatching rules, which are discussed in the next subsection with emphasis on multi-crane environments.
2.2. Scheduling and Dispatching
Yard crane scheduling is an NP-complete problem [10], and as the number of jobs and the planning horizon grow, even finding feasible solutions can become computationally expensive. Many studies therefore formulate mixed-integer programming models and propose exact or heuristic algorithms to obtain optimal or near optimal task sequences for one or more cranes. In multi-crane settings, interference constraints further increase model complexity. Briskorn and Zey [20] explicitly model interference for triple cranes and use mixed-integer formulations combined with heuristics or metaheuristics to derive collision-free schedules.
Because of this complexity, many container terminals rely on job dispatching rules as a practical alternative. Dispatching rules select the next job to process from a list of waiting tasks, trading global optimality for real-time responsiveness. Classic rules such as FCFS and NFS are simple and widely used, but their performance depends on yard layout and operating conditions and they do not explicitly address multi-crane inter-ference [21]. Huang et al. [22] proposed a modified A* algorithm for a single YC in one block and showed that it reduces waiting time compared with FCFS and NFS, and consequently contributes to shorter vessel port stays. Guo et al. [23] divided the planning horizon into short windows and optimized YC schedules within each window, again using FCFS and NFS as benchmarks.
Several studies have evaluated dispatching rules through simulation. Petering, M. E. [24] ana-lysed the effect of different yard crane dispatching rules on gross crane rate for QCs and found that prioritizing containers already placed in the block for loading im-proved performance. Yu et al. [25] considered terminal operating cost as a performance metric, showing that prioritizing jobs closer to the crane reduced both truck waiting time and operating cost. Guo et al. [26] studied two blocks, each served by twin YCs, with a handshake area that allows containers to move between blocks. Because only one crane can occupy the handshake area at a time, they tested dispatching rules that combine interference avoidance with job priority and demonstrated reductions in overall completion time.
Building on these works, more recent research on twin YC operations can be grouped into several themes. First, interference control and non-crossing constraints are explicitly considered when cranes share the same rail or cannot pass each other. Li et al. [27] incorporated dynamic cut-off times and non-crossing constraints into a scheduling model for twin YCs and proposed an LRPSO algorithm that combines particle swarm optimization with local rescheduling. Zheng et al. [28] also modelled crane interference and used a GA to minimize maximum delay. Second, to enhance responsiveness in dynamic environments, studies have examined real-time variability in job arrivals and processing times, employing dynamic dispatching rules and simulation-based noisy optimization [22]. Third, integrated optimization with other automated equipment—such as AGVs and QCs—has been addressed by Li et al. [27], Zheng et al. [29,30] using mixed-integer models, NSGA-II, and deep reinforcement learning. Fourth, cooperative strategies using handshake areas have been proposed to coordinate neighboring cranes and reduce blocking [31]. Finally, simulation-based and digital-twin approaches have been used to evaluate crane operations and control logic under realistic stochastic conditions [32].
Recent studies have addressed more realistic yard crane scheduling problems by incorporating complex operational constraints. For example, Wang et al. [33] formulated a generalized YC scheduling problem that considers input/output point assignments and crane congestion and showed that even advanced mixed-integer models become computationally intractable for moderate-sized instances. Although heuristic and metaheuristic approaches such as iterated greedy and GRASP can produce high quality solutions, they are mainly designed for offline or batch scheduling and remain difficult to apply directly to real-time dispatching environments with continuous job arrivals and frequent crane interference.
Overall, these studies show that YC scheduling and dispatching have been exten-sively investigated from both optimization and simulation perspectives. However, a gap remains between complex optimization-based scheduling approaches, which are often difficult to apply in real time, and simple dispatching rules, which do not explicitly handle multi-crane interference or workload balance. In particular, score-based dispatching methods have rarely been tailored specifically to twin RTGC operations within a single yard block. The present study addresses this gap by proposing a score-based dispatching logic that applies weights to multiple decision factors—such as the distance between the YC and the job, truck arrival time at the container block, the estimated processing time, and a newly introduced elasticity factor—and by determining appropriate weights through simulation-based optimization, with the aim of providing practical, interference-aware dispatching rules for twin YCs.
3. Job Assignment for Twin YC
As highlighted in the literature review, the control logic for dual-crane operations has been extensively investigated by many researchers. In this study, however, our focus is placed on the twin-crane configuration rather than the crossover type, since the structural characteristics of RTGC systems necessitate the use of twin cranes.
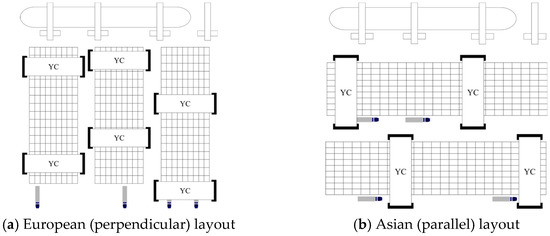
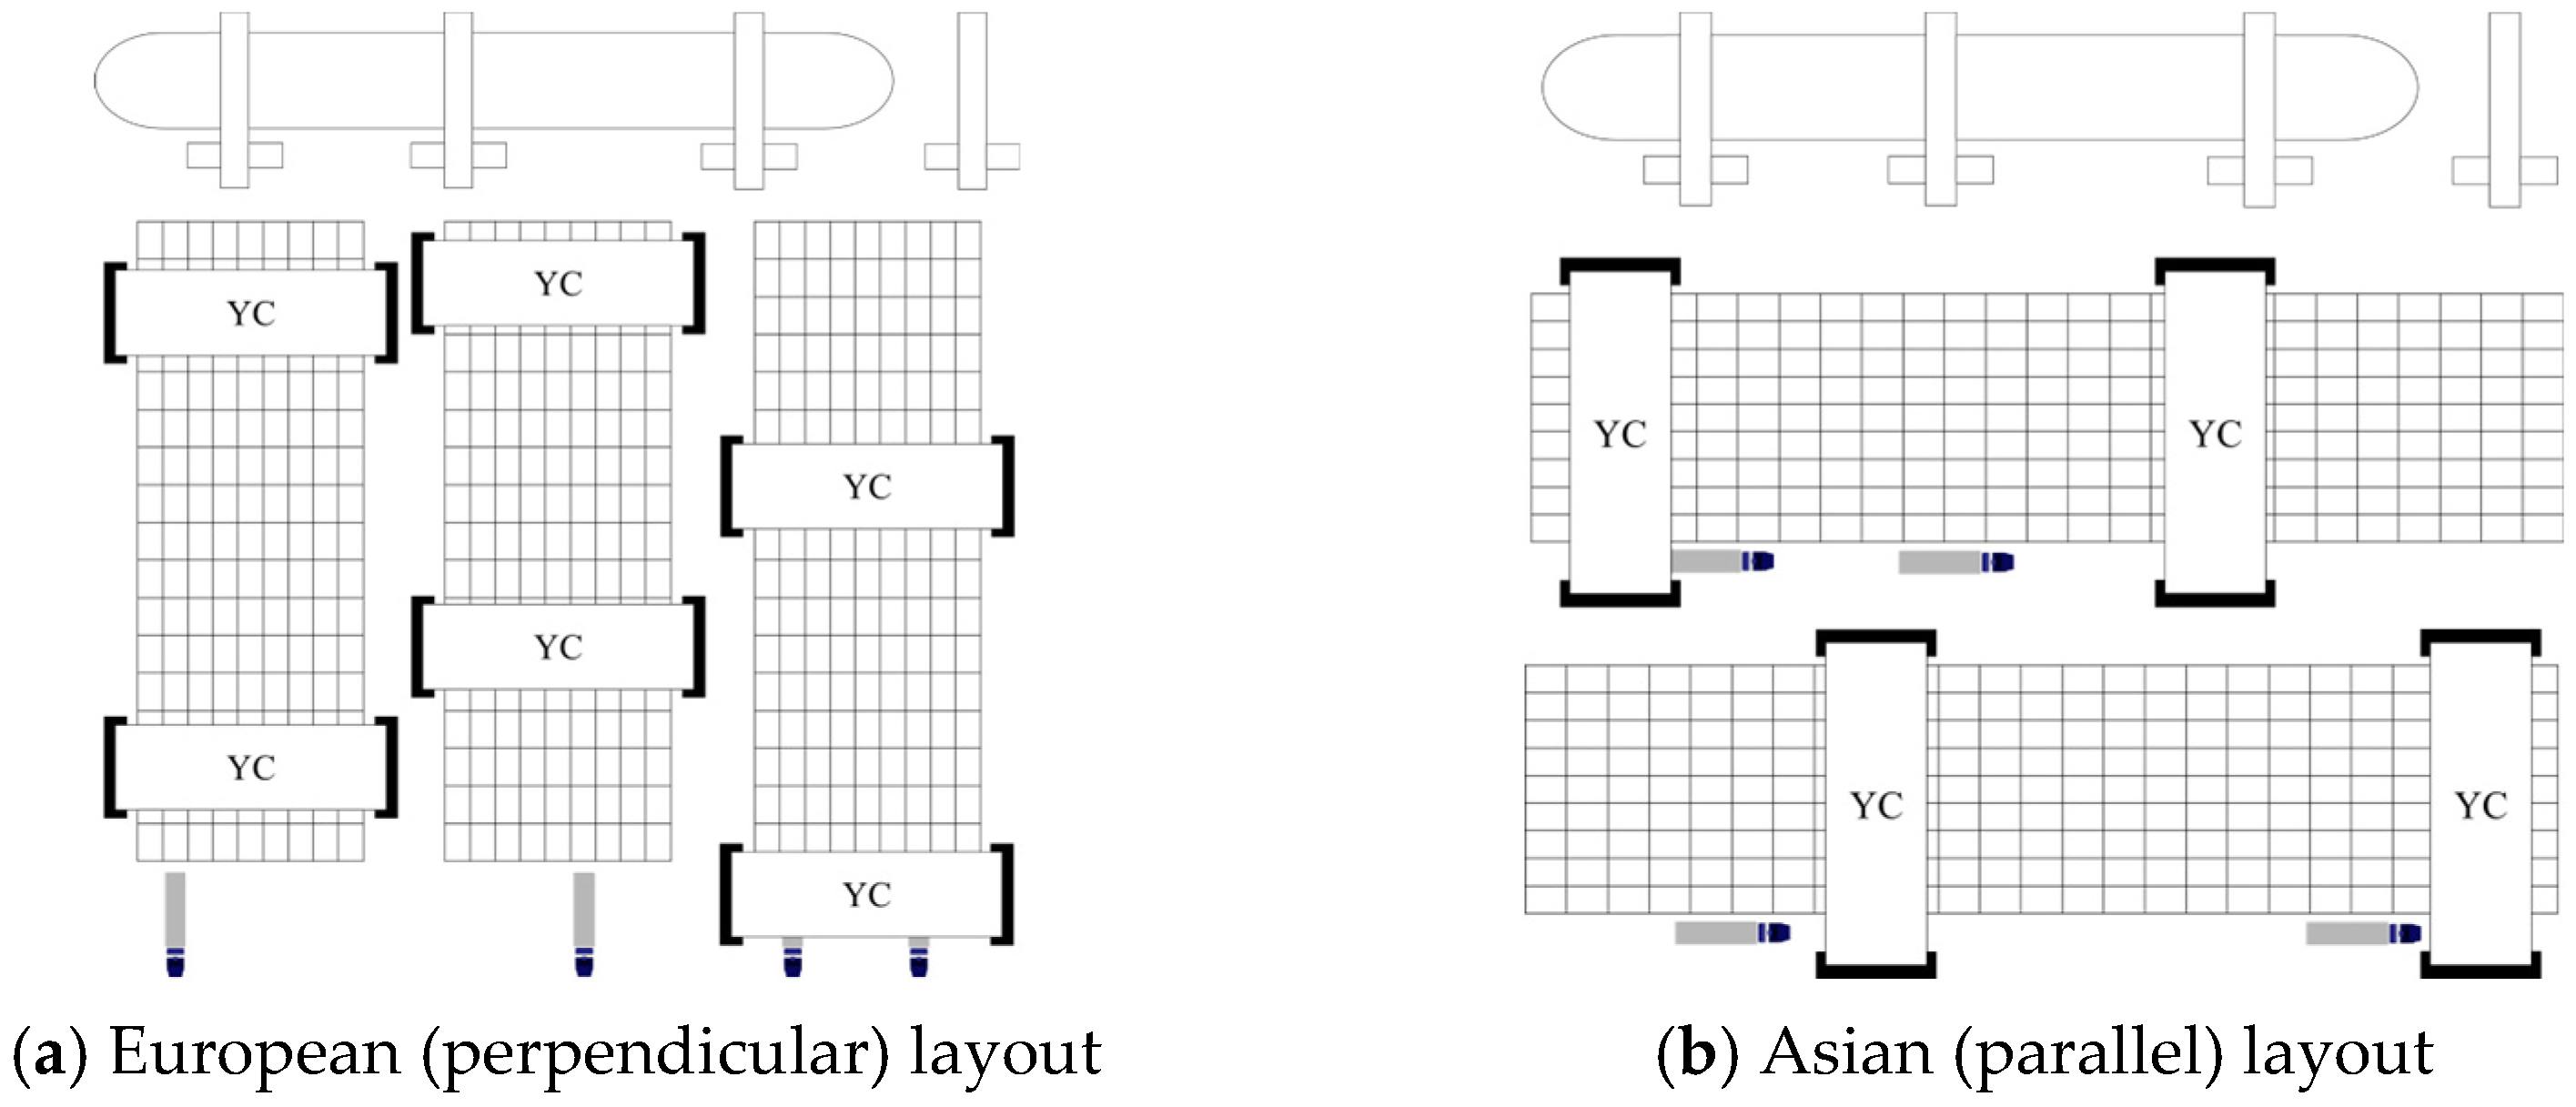
In addition to crane control strategies, the overall layout of container terminals also shapes operational design. The structure of container terminals can generally be categorized into European and Asian layouts, as shown in Figure 2. In this study, we adopt an Asian layout with parallel container blocks, assuming single-sided Input and Output (I/O) points.
Figure 2.
Typical container port terminal layouts.
As illustrated in Figure 3, we adopt a single yard block configured with 50 bays, 9 rows, and 5 tiers. These dimensions lie within the ranges commonly used in empirical testbeds for yard-side control and twin-crane studies, enabling like-for-like comparisons with prior work [34]. Following standard storage rules, a 20ft container occupies one 20ft bay-location, whereas a 40ft container requires two contiguous 20ft bay-locations; furthermore, stacks/bay-locations are typically single-size (either 20′ or 40′) to maintain operational consistency [35]. We model an Asian (parallel-block) yard layout and assume sin-gle sided I/O points for the block to isolate yard-side effects in our evaluation; this assumption is consistent with widely used layout characterizations and block-level analyses in the literature [19]. Taken together, these choices align our experimental setup with established twin-crane environments and facilitate a rigorous assessment of the proposed control logic against recognized benchmarks [31].
Figure 3.
An example of twin YC in a container block.
Given the operational characteristics of RTGC, each block is equipped with single-sided I/O points, which distinguishes their functionality from RMGC operations within yard block. To prevent collisions, a minimum safety distance of at least two bays must be maintained between cranes. Each yard crane is assumed to process only one job at a time; upon completion of a task, the crane remains at the finishing location until the subsequent assignment is allocated. For analytical tractability, the model is simplified to focus on a single yard block and its associated transport area.
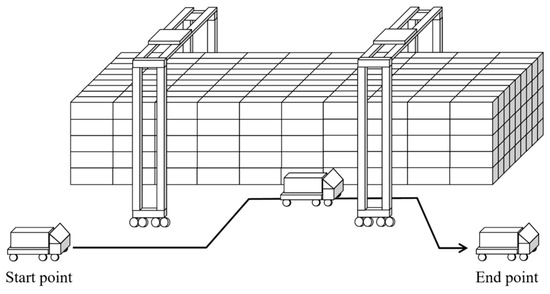
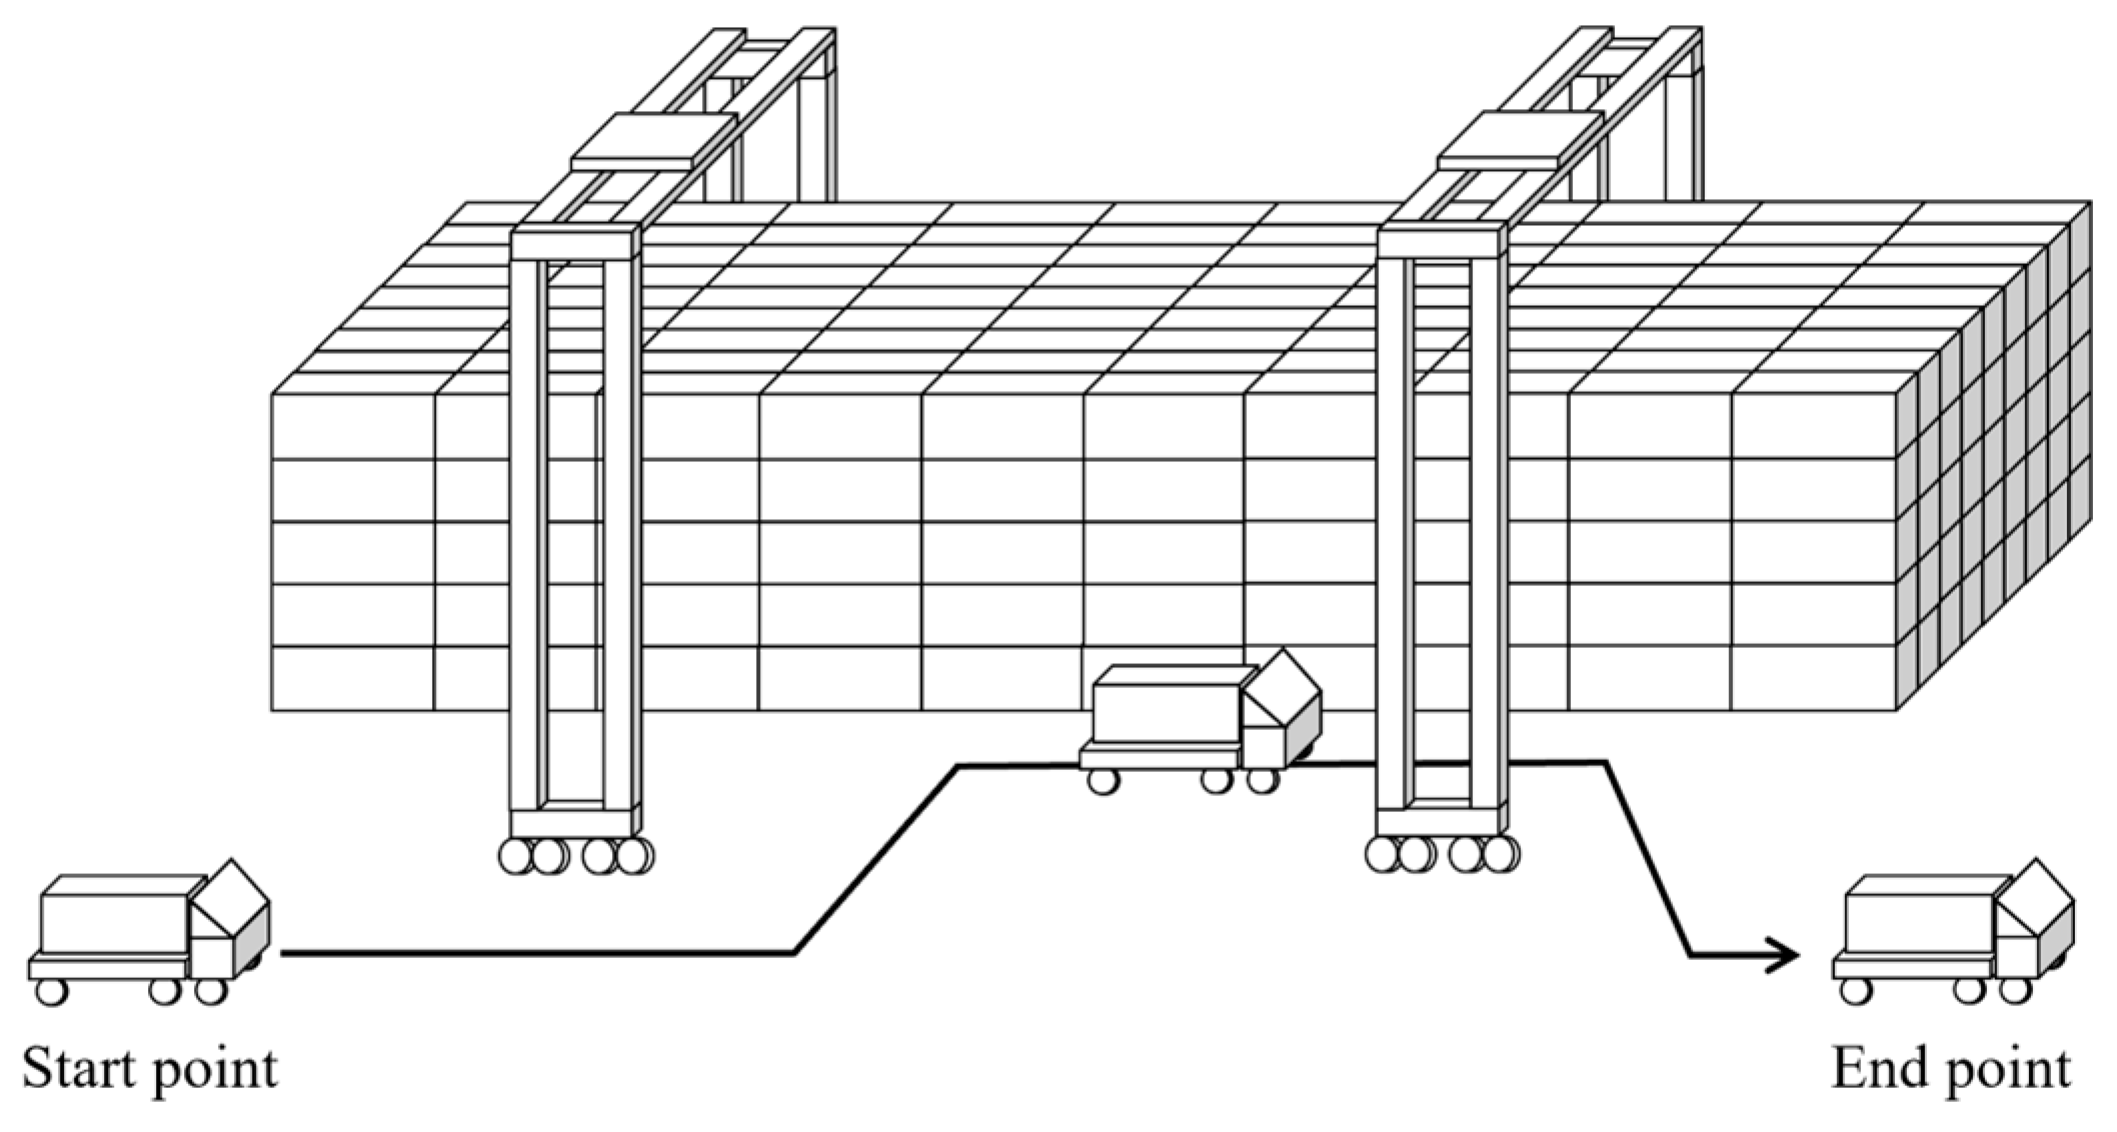
The objective function of this study is to minimize the average for vehicles. As depicted in Figure 4, represents the time it takes for task to be created at the starting point, enter the block, complete the task, and move to the far-right endpoint of the block. includes the vehicle’s travel time, wait time at the destination, and the operation time of task at crane . In addition to average , we also consider the maximum as an additional performance metric.
Figure 4.
Explanation on how is measured.
In current operations, trucks enter the crane working area upon arrival at a bay, complete their tasks, and then exit. For safety, there are also policies under which vehicles are restricted to move only within the crane area. Under such deterministic and constrained routing settings, simple rule-based dispatching—particularly FCFS—has been reported to perform strongly [11]. Nevertheless, to evaluate our proposed approach under more generalizable yard conditions, scenarios in which truck movement is confined solely to the crane area are excluded from this study.
4. Proposed Methodology
4.1. A Score-Based Job Assignment Rule
Building upon prior research on twin-crane coordination, the proposed approach introduces enhancements tailored to automated yard operations. Specifically, it computes task scores based on the relative positions of cranes and job locations, thereby enabling the same dispatching logic to remain applicable even when the number of yard blocks and cranes varies. In this way, the method extends the scalability of the score-based dispatching framework to address the -crane allocation problem in blocks, where and denote the number of cranes and blocks, respectively.
The objective is to efficiently solve the dispatching problem by assigning, at each decision step, the job with the lowest score to each crane. To this end, a score function is derived that simultaneously minimizes both the average and the maximum . The performance of this approach is then benchmarked against widely used dispatching rules, including FCFS, NFS, and a hybrid of the two. The detailed experimental settings and scenarios are described in Section 5.3.
In this framework, a score-based job assignment rule is used to determine the next job to be assigned to each YC when a new job is created or when a YC’s job is completed. Once a job is created and moves to its target bay, it waits in the working-list for assignment. The assignment of cranes from this working-list is determined using a Score function.
As illustrated in Figure 5, job assignment based on score calculation can be decomposed into two main processes: (i) the allocation of jobs to crane, and (ii) the selection of the most suitable job—where lower scores indicate higher priority—among the jobs assigned to each crane. The Design and fine-tuning the Score function is therefore critical to effective crane assignments and job scheduling. Efficient execution of the assignment process can improve operational efficiency and enhance the overall productivity of port operations. In particular, the accuracy of the Score function and the proper calibration of its weights are crucial factors influencing job processing and crane assignment.
Figure 5.
Flow of the score-based job assignment procedure.
4.2. Design of the Score Function
When a job is completed or a new job is created, the yard crane determines the next task using proposed Score-based control logic. The score-based control logic uses the notations shown in Table 1. To evaluate the effectiveness of the assignment rule, the turnaround time, , of containers is defined as the objective function of this study. Specifically, denotes the time difference between the moment an operation becomes active and the moment it is completed.
Table 1.
Notations for the Score-based dispatching logic.
Four factors—distance, wait time, process time, and elasticity—were selected to calculate the score. Among these, waiting time and processing time are measured in seconds, whereas distance and elasticity are measured in bays.
4.2.1. Distance
Experiments have demonstrated that prioritizing jobs located closer to a crane can reduce operating costs. Guo et al. [23] In that study, the unit of distance is expressed in terms of bays. Accordingly, denotes the distance, measured in bays, from to job . As illustrated in Figure 6, the score for Job1 located between YC1 and YC2 is calculated based on the distances from each crane.
Figure 6.
Calculate of distance.
4.2.2. Wait Time
is one of the key performance indices for a container yard. It represents the time a container has waited from the moment it becomes active until a crane was allocated to that operation. As shown in Equation (1), it is calculated as the time elapsed between the job activation and its assignment to a crane, and the unit is expressed in seconds.
4.2.3. Process Time
The process time () is defined as the sum of the estimated re-handling time () and the job time (). The re-handling time, , was derived from the analysis of 43,887 data points obtained through simulation experiments. From this dataset, the minimum, mode, and maximum values were extracted within a 95% confidence interval, as shown in Table 2. Finally, is computed by multiplying the number of containers stacked above the target job by a triangular distribution, as formulated in Equation (2).
Table 2.
Analysis results of re-handling time at the 95% confidence level (unit: s).
The job handling time () in the process time denotes the duration required for a crane to process the target job. The value of varies depending on the row, tier, and the crane’s load-carrying side, with detailed values provided in Figure 3. Accordingly, the process time is obtained by summing and , as demonstrated in Equation (3).
The presented in Table 3 are determined based on verified RTGC equipment Table 4 specifications and standard operational parameters, rather than being derived from the 90-day simulation results or aggregated port-level statistics. The detailed motion characteristics of the RTGC, including speed and acceleration/deceleration parameters used to derive these handling times, are summarized in Table 3 and Table 4.
Table 3.
Job handling time () according to row, tier, and the crane’s load-carrying side (unit: sec).
Table 4.
RTGC specifications on speed, acceleration, and deceleration.
The speed and acceleration/deceleration information used in the YC is summarized in Table 4. The cranes have three movement axes. The gantry drive, representing movement along the x-axis, corresponds to bay movement. The trolley drive, representing movement along the y-axis, corresponds to row movement. The hoist drive, representing movement along the z-axis, corresponds to tier movement. While movement along the x and y-axes can occur simultaneously, movement along the z-axis is only possible after the crane comes to a complete stop.
4.2.4. Elasticity
In the proposed dispatching rule, the concept of elasticity is introduced to capture how favorable a job is with respect to the preferred working zone of each crane. The movement of each crane is modelled by drawing an analogy to the potential energy of a spring. According to Hooke’s law in physics, the force required to compress or extend a spring is directly proportional to its displacement , and is expressed as , where is the stiffness constant. Based on this relationship, the elastic potential energy of a spring is given by Equation (4):
In the crane–job system, each crane has a reference position (criteria point) within its assigned zone, and movements away from this position create a virtual elastic potential. For crane , the displacement can be defined in a local coordinate system as ‘’ or ‘’, representing the positions of job iii and crane relative to the criteria point. The spring constant ccc, which characterizes the stiffness of the spring, is set to 1 in this study for simplification. The elasticity of job iii with respect to crane is then defined as the difference in elastic potential energy, as shown in Equation (5):
A smaller value of indicates that assigning job iii to crane requires less movement against the crane’s elastic tendency and is therefore more desirable. Unlike conventional distance-only penalties or proximity costs, this formulation distinguishes between movements that bring the crane closer to its criteria point and those that move it farther away, even when the absolute crane–job distance is identical.
The proposed elasticity term also differs conceptually from virtual-boundary or handshake-potential models, which typically impose hard constraints or symmetric penalty functions on the relative positions of two cranes. Here, the elastic potential is defined individually for each crane with respect to its own zone center, allowing asymmetric preferences and a more nuanced representation of workload balance.
This behavior is inspired by physical spring systems, in which restoring forces drive the system back toward equilibrium, and it provides a simple yet expressive mechanism for biasing job assignments toward configurations that reduce interference and keep cranes near their preferred regions. Consequently, determining the criteria position of each crane is essential, as it defines the shape of the elastic potential landscape and directly influences the elasticity-based dispatching decisions.
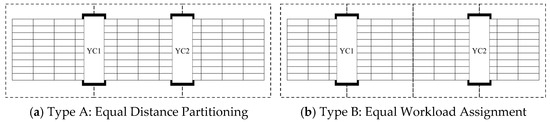
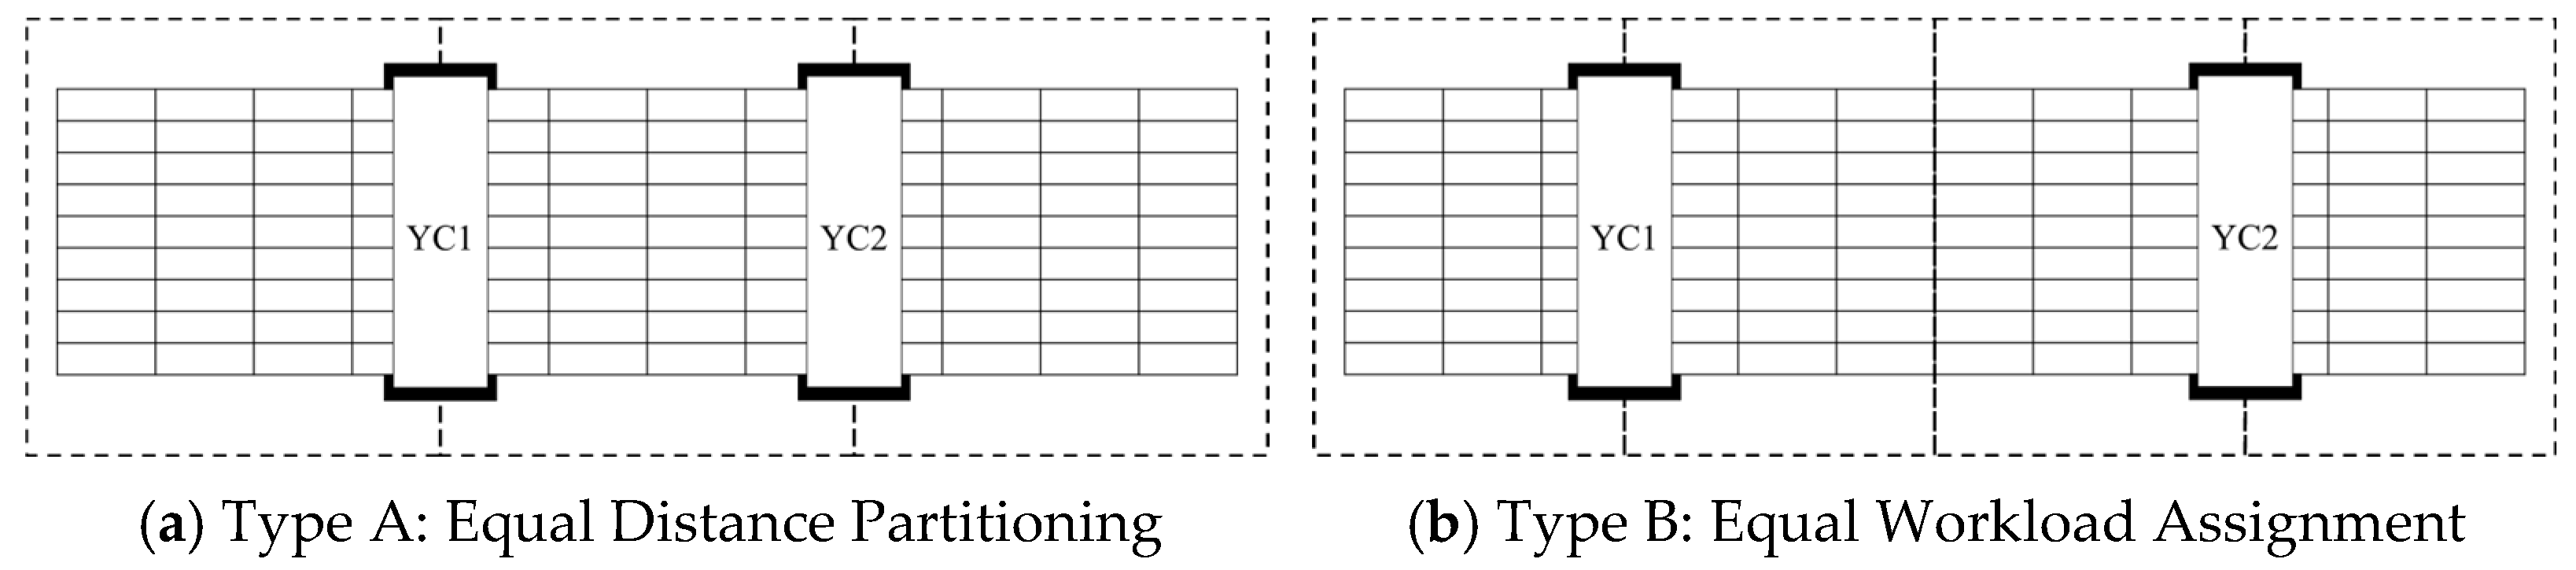
Two alternative methods are considered: Type A (Equal Distance Positioning) and Type B (Equal Workload Assignment). In both approaches, the horizontal segments correspond to bays, which represent individual storage blocks in the yard, and YC1 and YC2 are assigned to operate across the entire area of bays. The key distinction lies in how the initial positions of the cranes are determined. In Type A, illustrated in Figure 7a, the workspace is divided in to into equal special segment, whereas in Type B, illustrated in Figure 7b, the initial positions are set balance the workload, ensuring that each crane is responsible for an equal amount of handling task.
Figure 7.
Determination of the initial positions of yard cranes.
Type A determines the initial crane positions based on spatial uniformity. Specifically, each crane is placed at a location obtained by dividing the number of bays by the number of cranes plus one, as per the Equation (6):
As illustrated Figure 7a, this approach yields evenly spaced crane positions, ensuring equal distances between cranes and yard boundaries. The objective is to divide the yard area into equal spatial proportions, independent of expected workload distribution.
In contrast, Type B determines the initial crane positions with the aim of balancing workload across cranes, as formulated in Equation (7).
As shown in Figure 7b, each crane is positioned at the center of its assigned working zone, such that both cranes are responsible for an equal number of bays. This method explicitly accounts for workload symmetry and seeks to enhance operational balance from the outset.
In summary, Type A is based on spatial symmetry, whereas Type B emphasizes workload equilibrium. These differing philosophies result in distinct initial crane placements, which can significantly influence yard crane efficiency. Under the Type A method, YC1 is assigned to 16 bays and YC2 to 32 bays. In contrast, the Type B method allocates 13 bays to YC1 and 37 bays to YC2. To evaluate the effectiveness of each method, we applied a score-based approach considering only elasticity and compared the average TAT between the two configurations.
The comparative experiments demonstrated that Type B yielded a lower average TAT than Type A. Specifically, the average TAT under Type B was 483.9 s, compared with 500.5 s for Type A, representing a reduction of approximately 16 s. Based on these results, Type B was selected as the more effective method for minimizing the objective function, namely the average TAT.
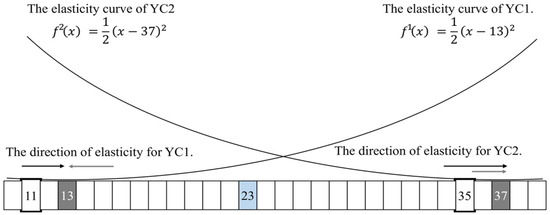
Figure 8 illustrates the computation of elasticity based on potential energy differences. In this figure, the gray boxes represent the criteria points of each crane, and the blue box indicates the job location. The black arrows indicate the movement direction of the cranes, while the gray arrows represent the direction of the elasticity acting on each crane. The current position of YC1 is at bay 11, and that of YC2 is at bay 35. YC1 first moves 2 bays in its direction of elasticity and then 10 bays in the opposite direction before reaching the job located at bay 23. By contrast, YC2 must move 12 bays entirely in the direction opposite to elasticity to arrive at bay 23. Therefore, although both cranes travel the same distance of 12 bays, YC2 inevitably consumes more energy due to moving entirely against the elastic direction.
Figure 8.
Computation of the elasticity based on potential energy differences.
More specifically, for YC1, the crane moves toward its criteria point to reach the job, which is consistent with the direction of elasticity. The relative position of YC1 is 2, as it first moves 2 bays in the direction of spring elasticity, followed by an additional 10 bays against the elastic direction to arrive at the job location. Thus, the elasticity is calculated as:
In contrast, YC2 moves away from its criteria point, which is opposite to the direction of elasticity. Its relative position is −2, while the job is located at −14, leading to
Since is smaller than , the job is ultimately assigned to YC1, yielding a more elastic and efficient assignment path.
4.3. Factor Normalization
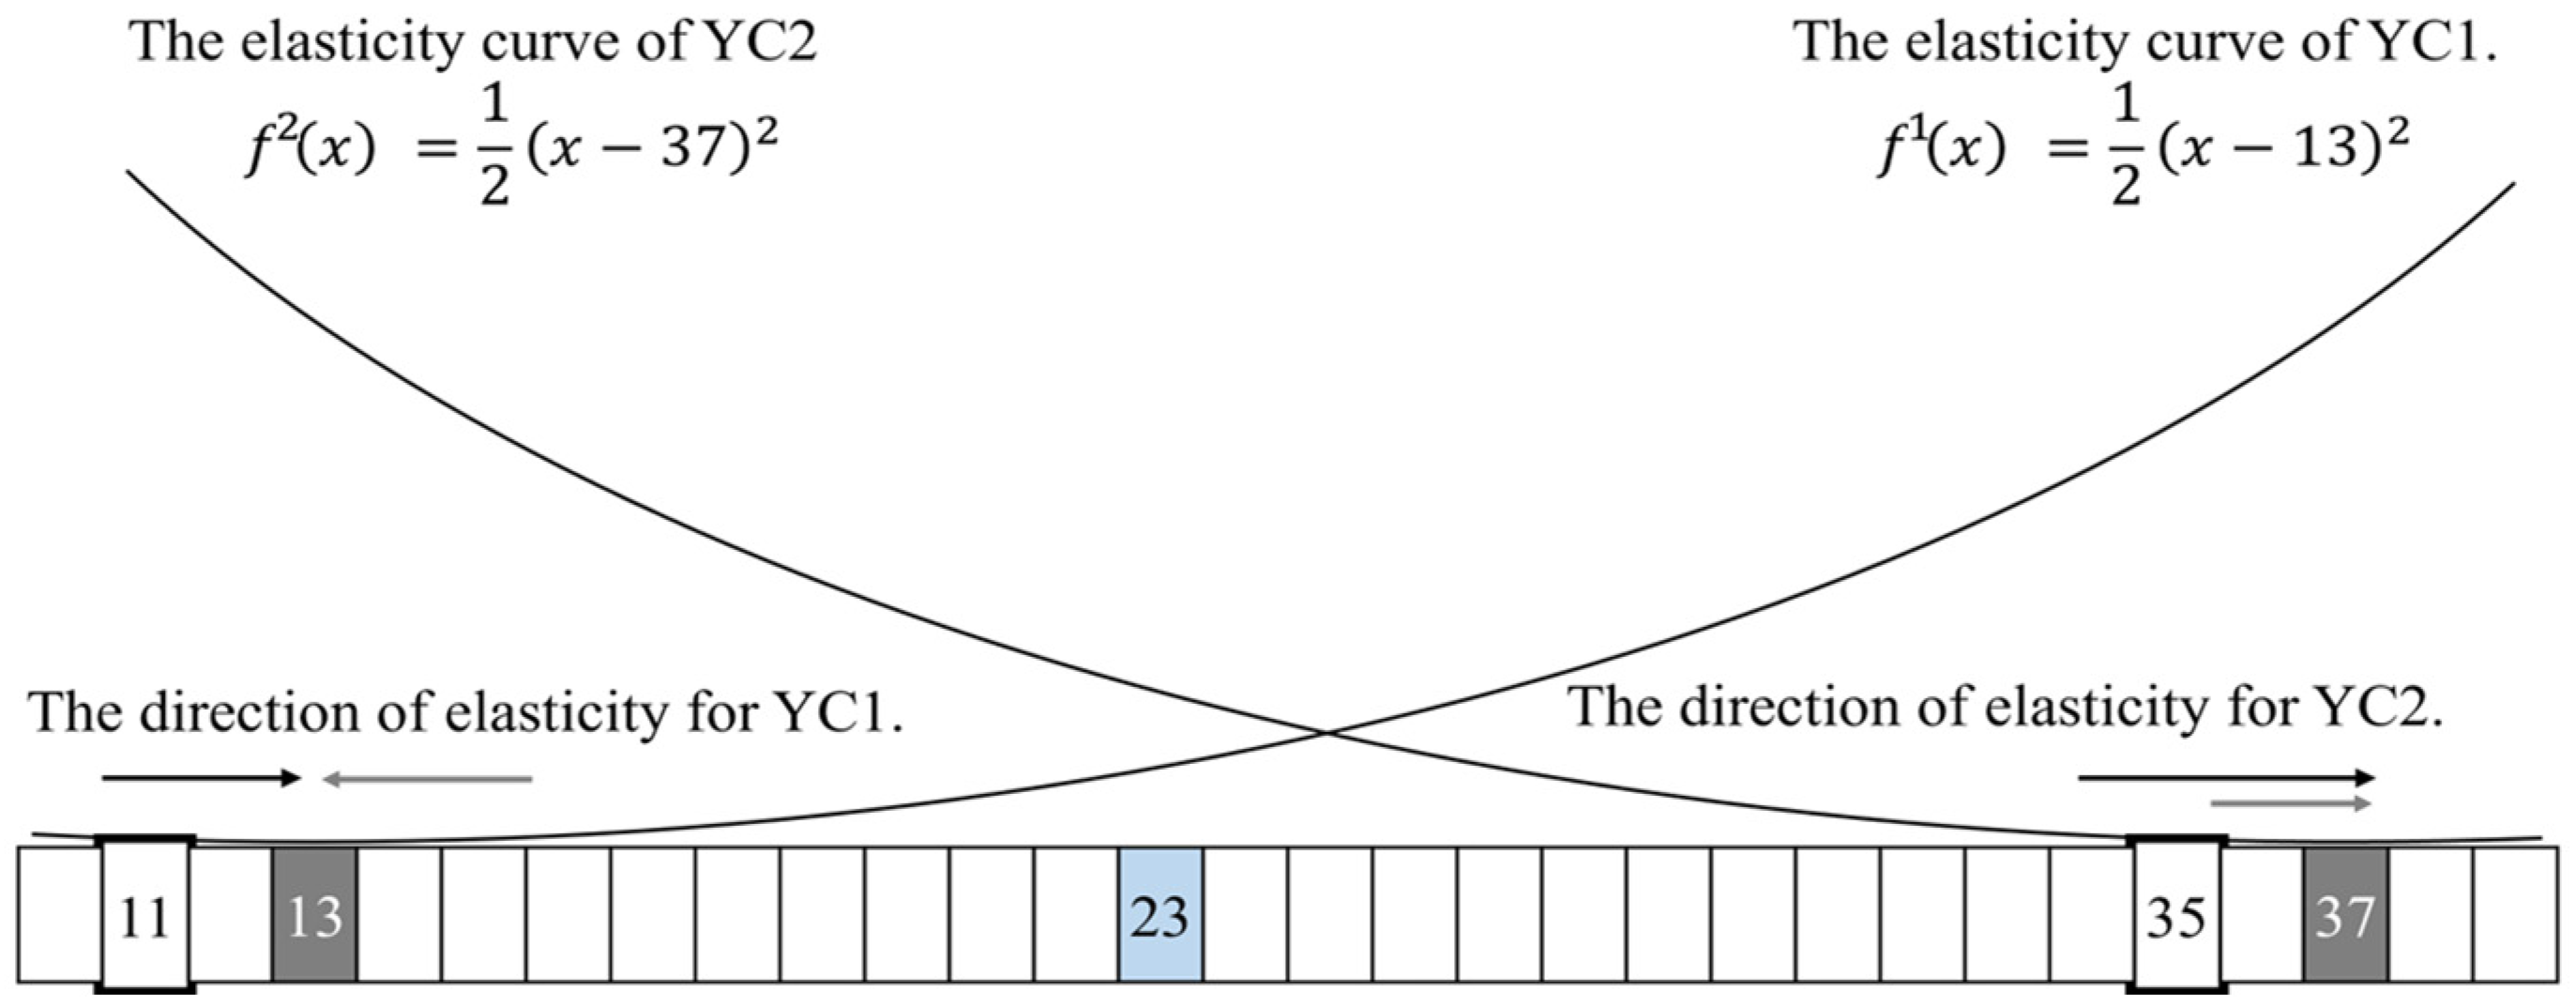
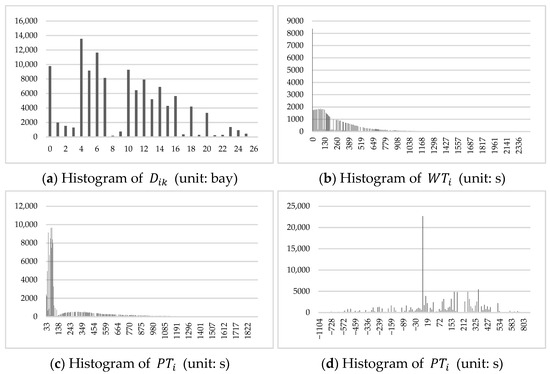
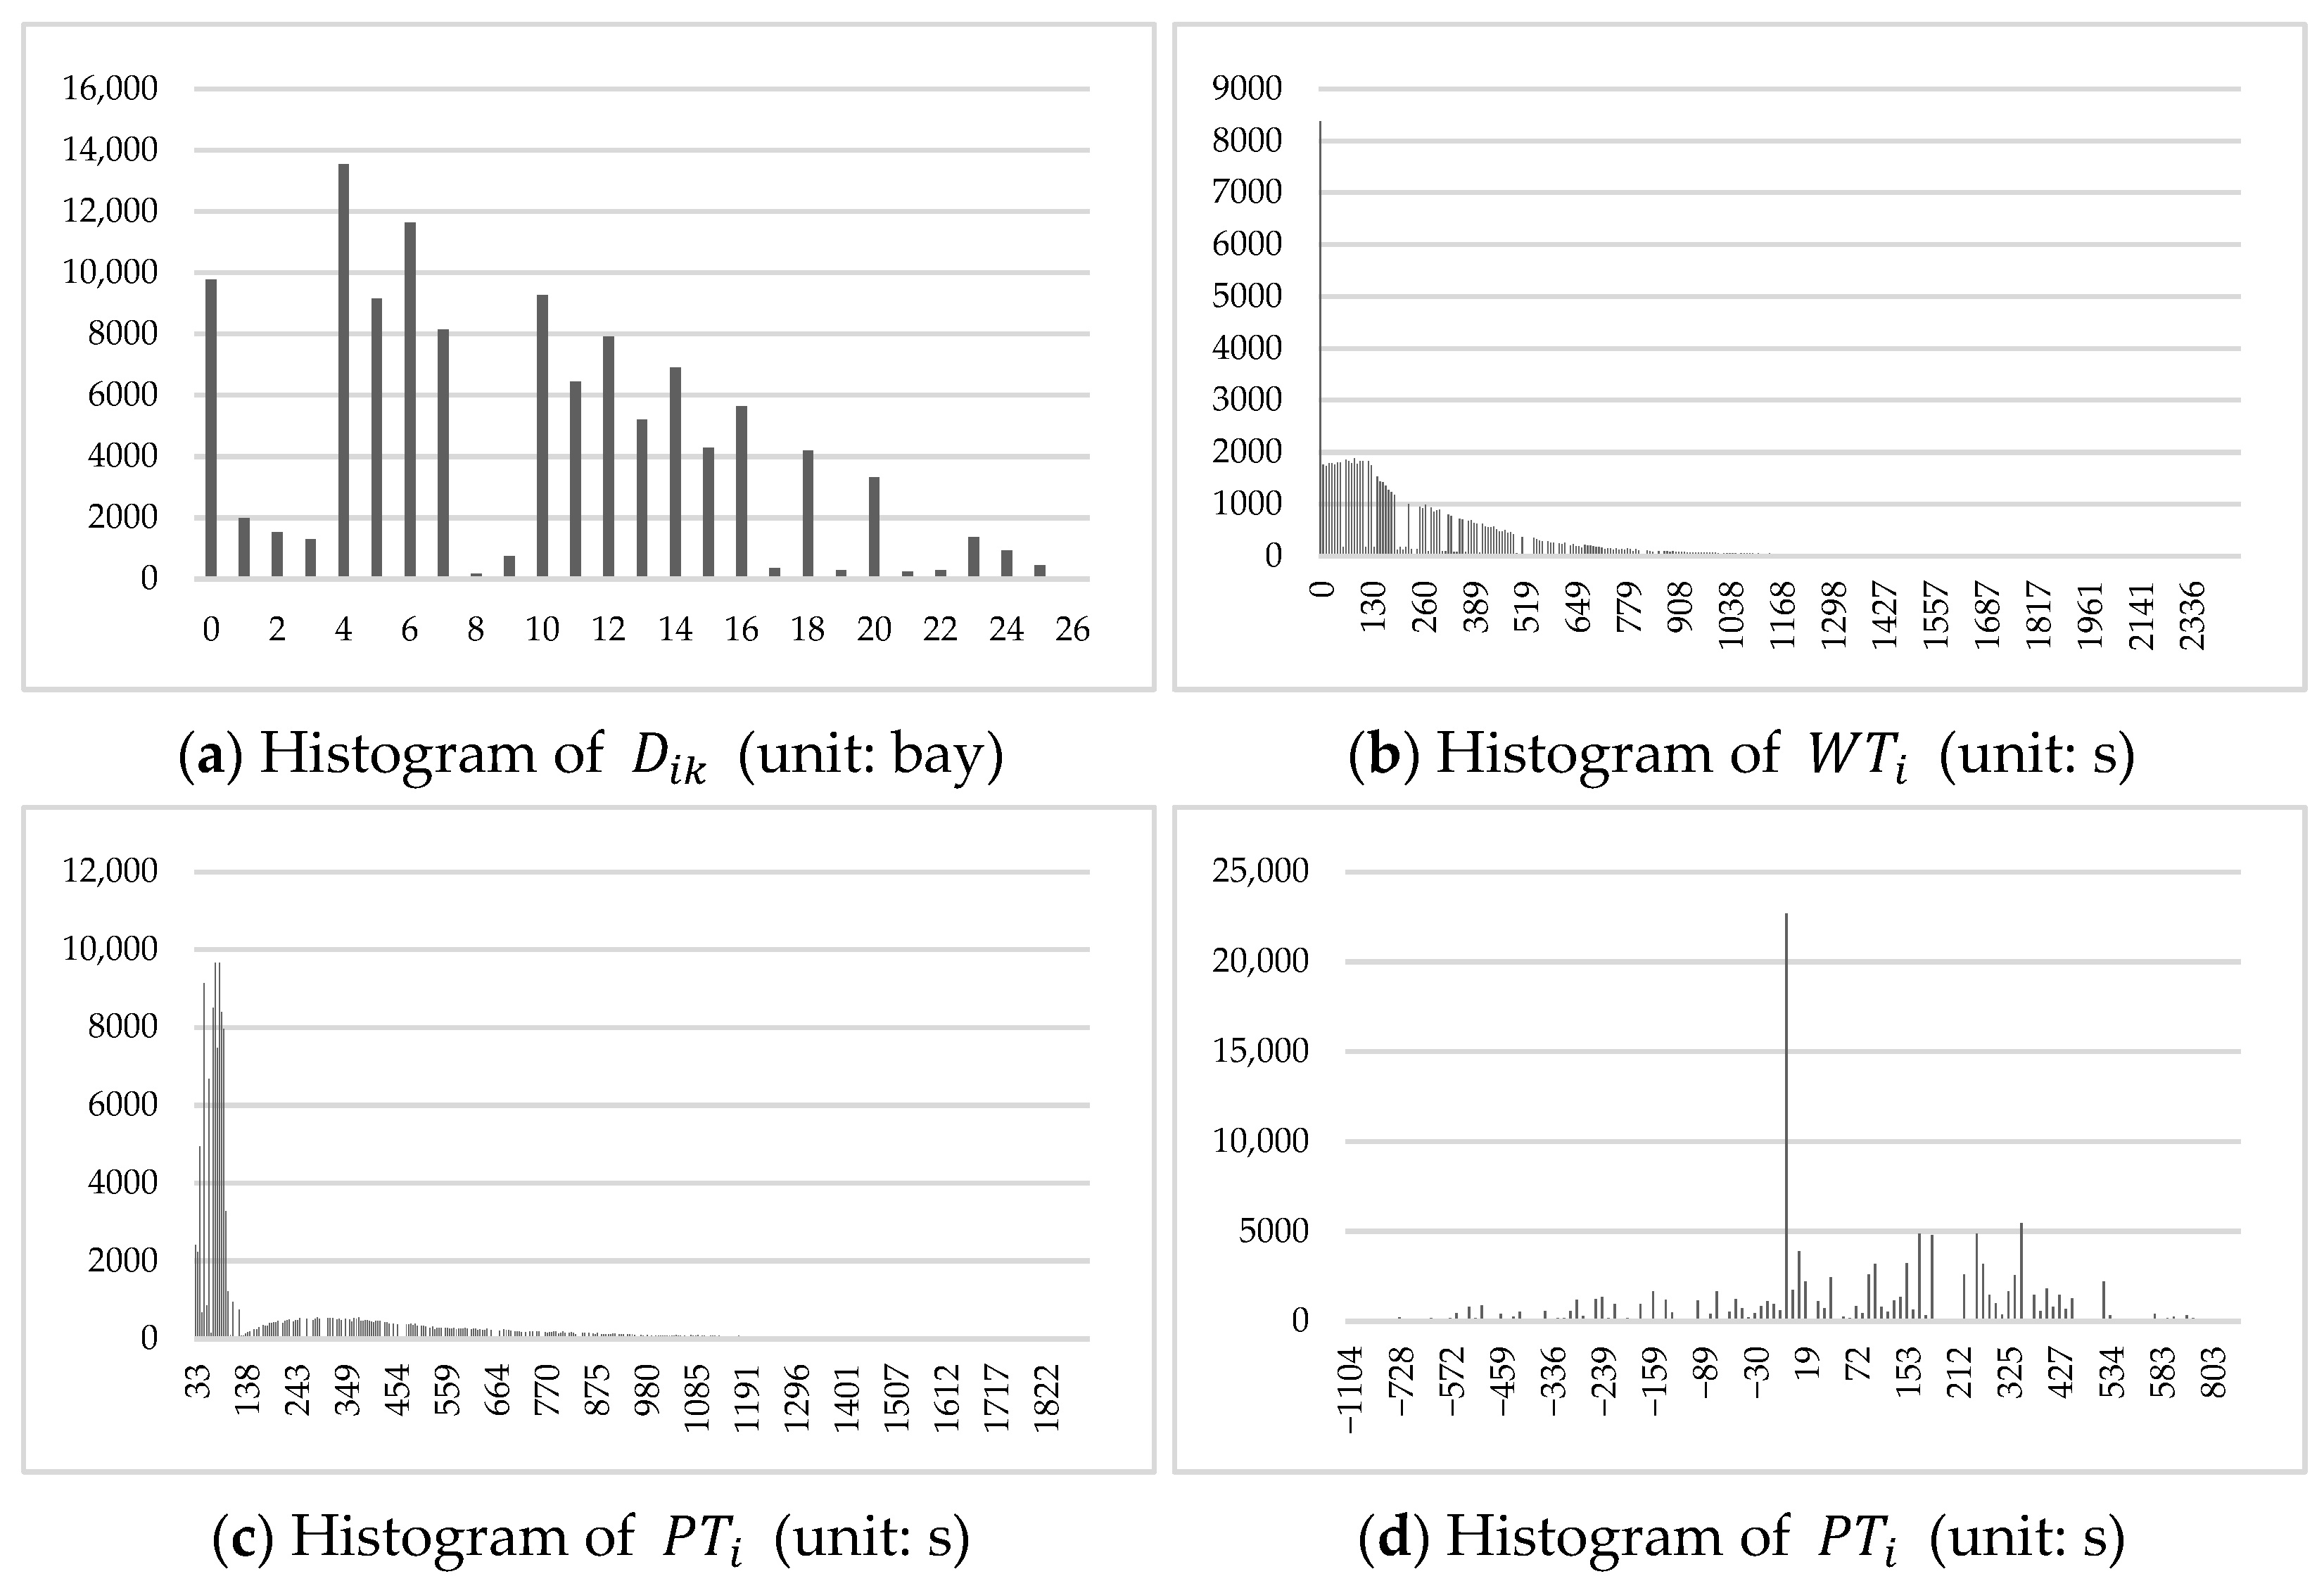
Through the histograms of each element in Figure 9, it is evident that the factors differ substantially in their measurement units—for example, waiting time and processing time are expressed in seconds, whereas distance and elasticity are measured in bays. Without adjustment, these discrepancies in scale would cause factors with larger numerical ranges to dominate the score function, regardless of their actual importance. Therefore, it is necessary to normalize all factors to a comparable range before assigning weights, ensuring that each factor contributes fairly to the overall score.
Figure 9.
Histograms showing the distributions of the four scoring factors.
To achieve compatibility among factors, normalization is performed using min-max scaling. All factors used in the score calculation is normalized to a range between 0 and 1, as expressed in Equation (8). For distance, process time, , and elasticity, , smaller values indicate higher priority at Equation (9). In contrast, waiting time, , represent higher priority when its value is larger. To align its directionality with the other factors, it is adjusted by applying after normalization.
In the score-based task assignment logic, the score is defined as a function of , , , and , as shown in Equation (10). Each variable was transformed into values between 0 and 1 using min-max scaling normalization and then used to calculate the score. As indicated in the formula, each variable is multiplied by its weight and added together, with lower scores indicating favorable tasks. The optimal combination of weights across various combinations of variables is determined through simulation experiments.
4.4. Calculation of the Score-Based Rule
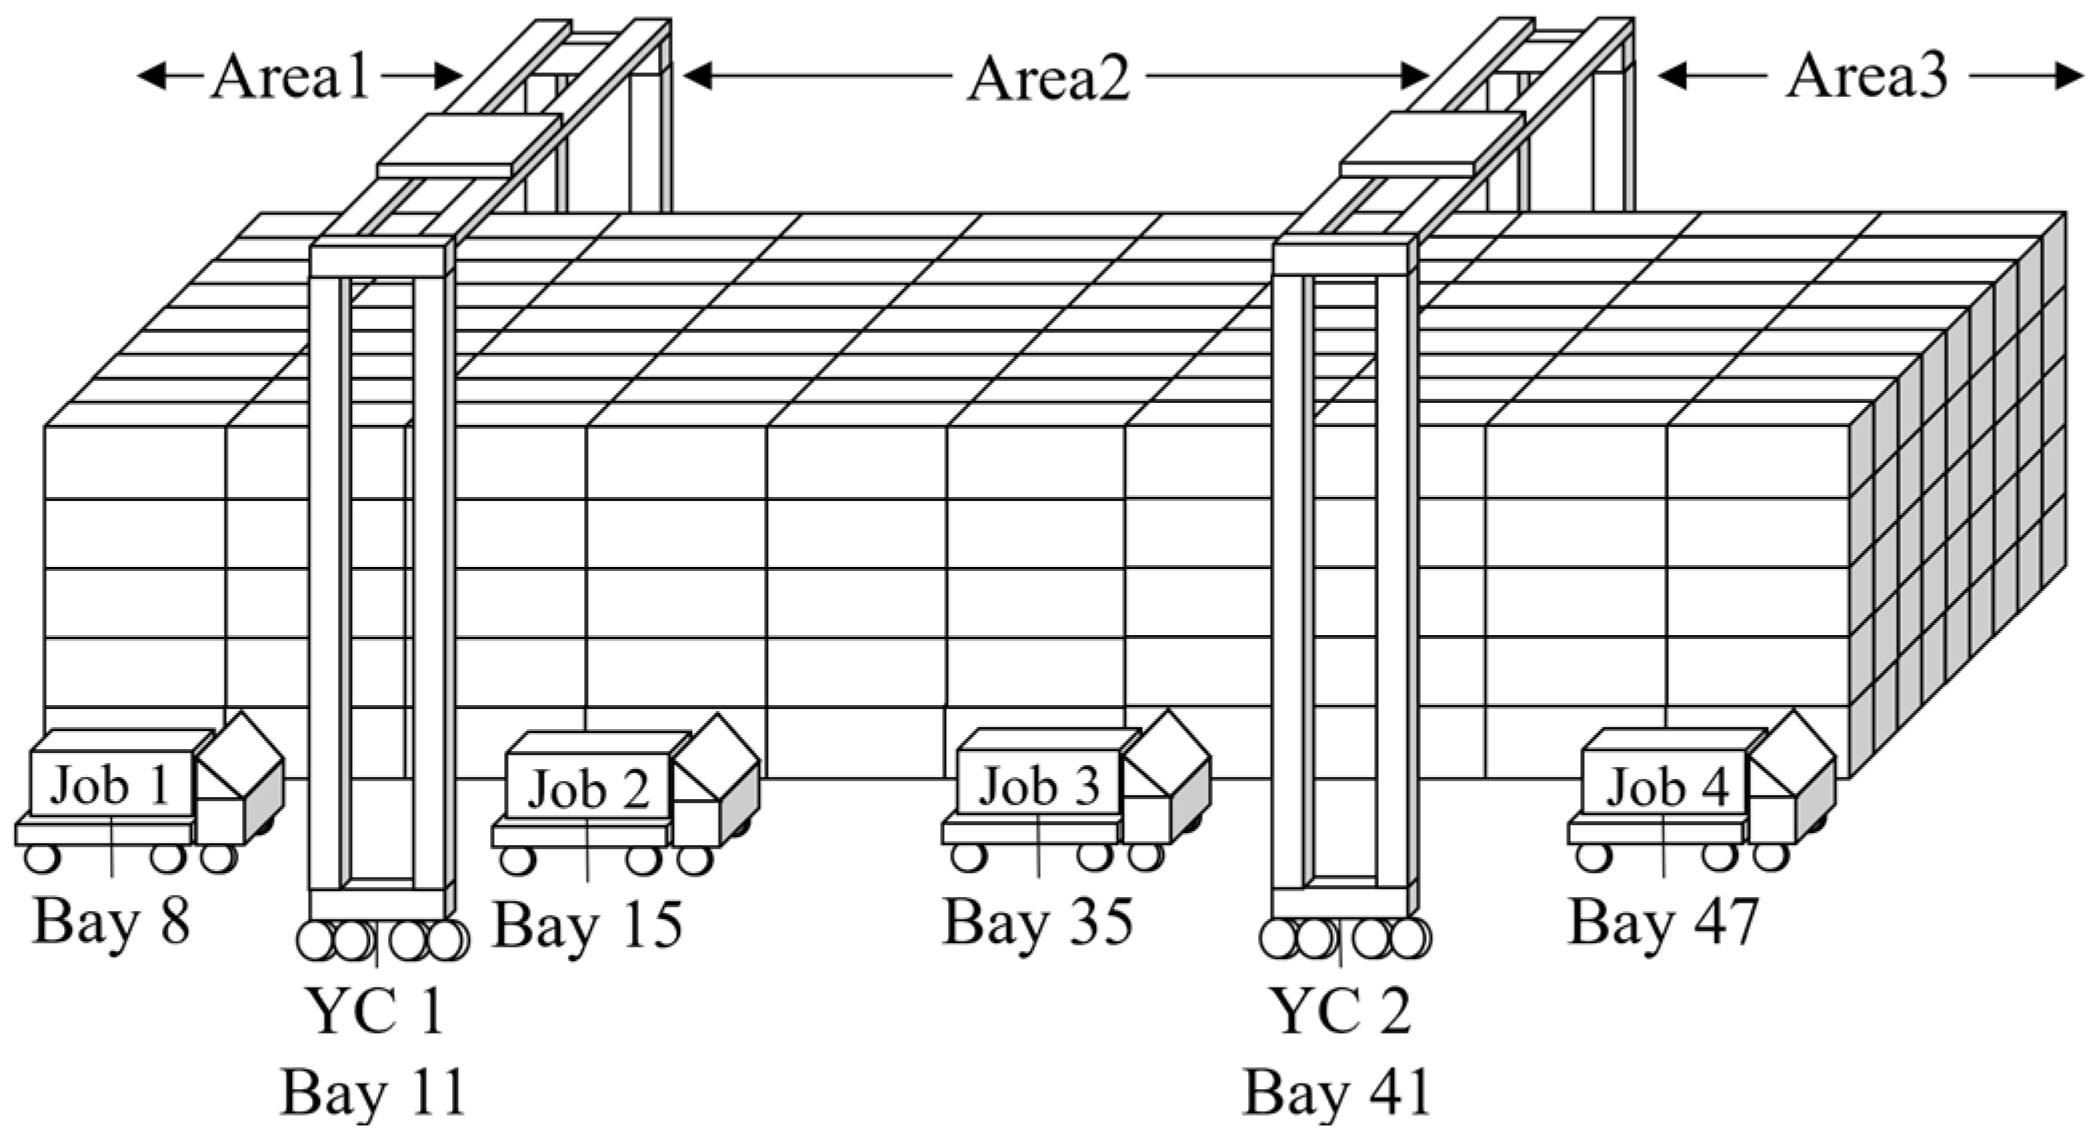
When calculating the score, the yard block can be divided into three areas based on the crane’s position, as illustrated in Figure 10. Container score calculates their scores from their respective area. In Figure 10, jobs in Area 1 can only be accessed by YC1, and jobs in Area 3 can only be accessed by YC2. This study assumes the use of non-crossing cranes. Therefore, without additional score calculations, jobs in Area 1 are initially allocated to Crane 1, and jobs in Area 3 are assigned to Crane 2. On the other hand, jobs located in Area 2, accessible by both cranes, are first allocated to the YC through score calculations.
Figure 10.
Calculation of the dispatching score.
, , and are computed for all the available cranes. These scores are then weighted and summed, and the crane with the lower total score is allocated. Following the crane allocation, is added to the overall score. Subsequently, among the containers assigned to each crane, the job with the lowest score is executed.
Before assigning jobs to cranes, it is possible to allocate multiple jobs to the same crane. Therefore, the best (lowest score) job is selected from the various jobs assigned to each crane. The example provided in Figure 10 assumes a scenario with twin YCs available, similar to Table 5. This table explains the process of allocating jobs to each crane and selecting the job to be executed from the assigned jobs. Each variable is represented as a value between 0 and 1, thanks to the applied min-max normalization
Table 5.
An example of normalized score calculations with .
As shown in Table 5, certain scores are not calculated for some job-crane combinations based on the areas separated by cranes and job bays. Job 1 and Job 2 are sequentially assigned to YC1, while Job 4 and Job 3 are sequentially assigned to YC2. However, based on the final scores, YC1 executes Job 1, and YC2 executes Job 4. The remaining jobs, Job 2 and Job 3, will be assigned to cranes according to the score-based logic when more YCs become available.
5. Simulation Analysis
5.1. Assumptions
- Cranes cannot pass through each other—twin YCs.
- There must be a minimum safety distance of 2 bays between cranes.
- Cranes cannot move between bays while holding containers.
- The number of containers that can be stored in one bay is equal to (the number of rows) * (the number of tiers) − (the number of tiers − 1).
Due to the presence of re-handling operations, the number of cranes that can enter a bay is limited as per Assumption 4. While incoming operations require only one free space, outgoing operations that necessitate re-handling need up to a maximum of the number of tiers minus one in free spaces to access a job at the bottom. If a bay has free spaces equal to the number of tiers minus one, all operations can be carried out. Therefore, the maximum number of containers that can fit in one bay is (the number of rows) * (the number of tiers) − (the number of tiers − 1).
5.2. Conceptual Design
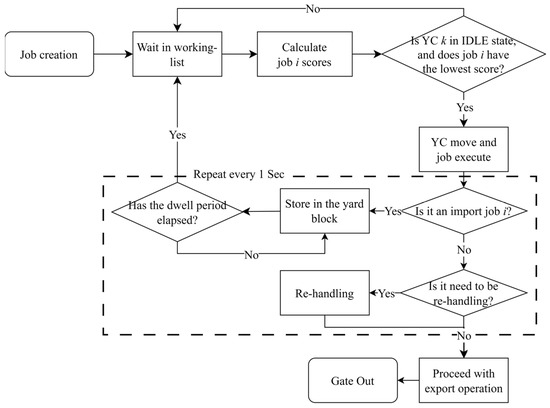
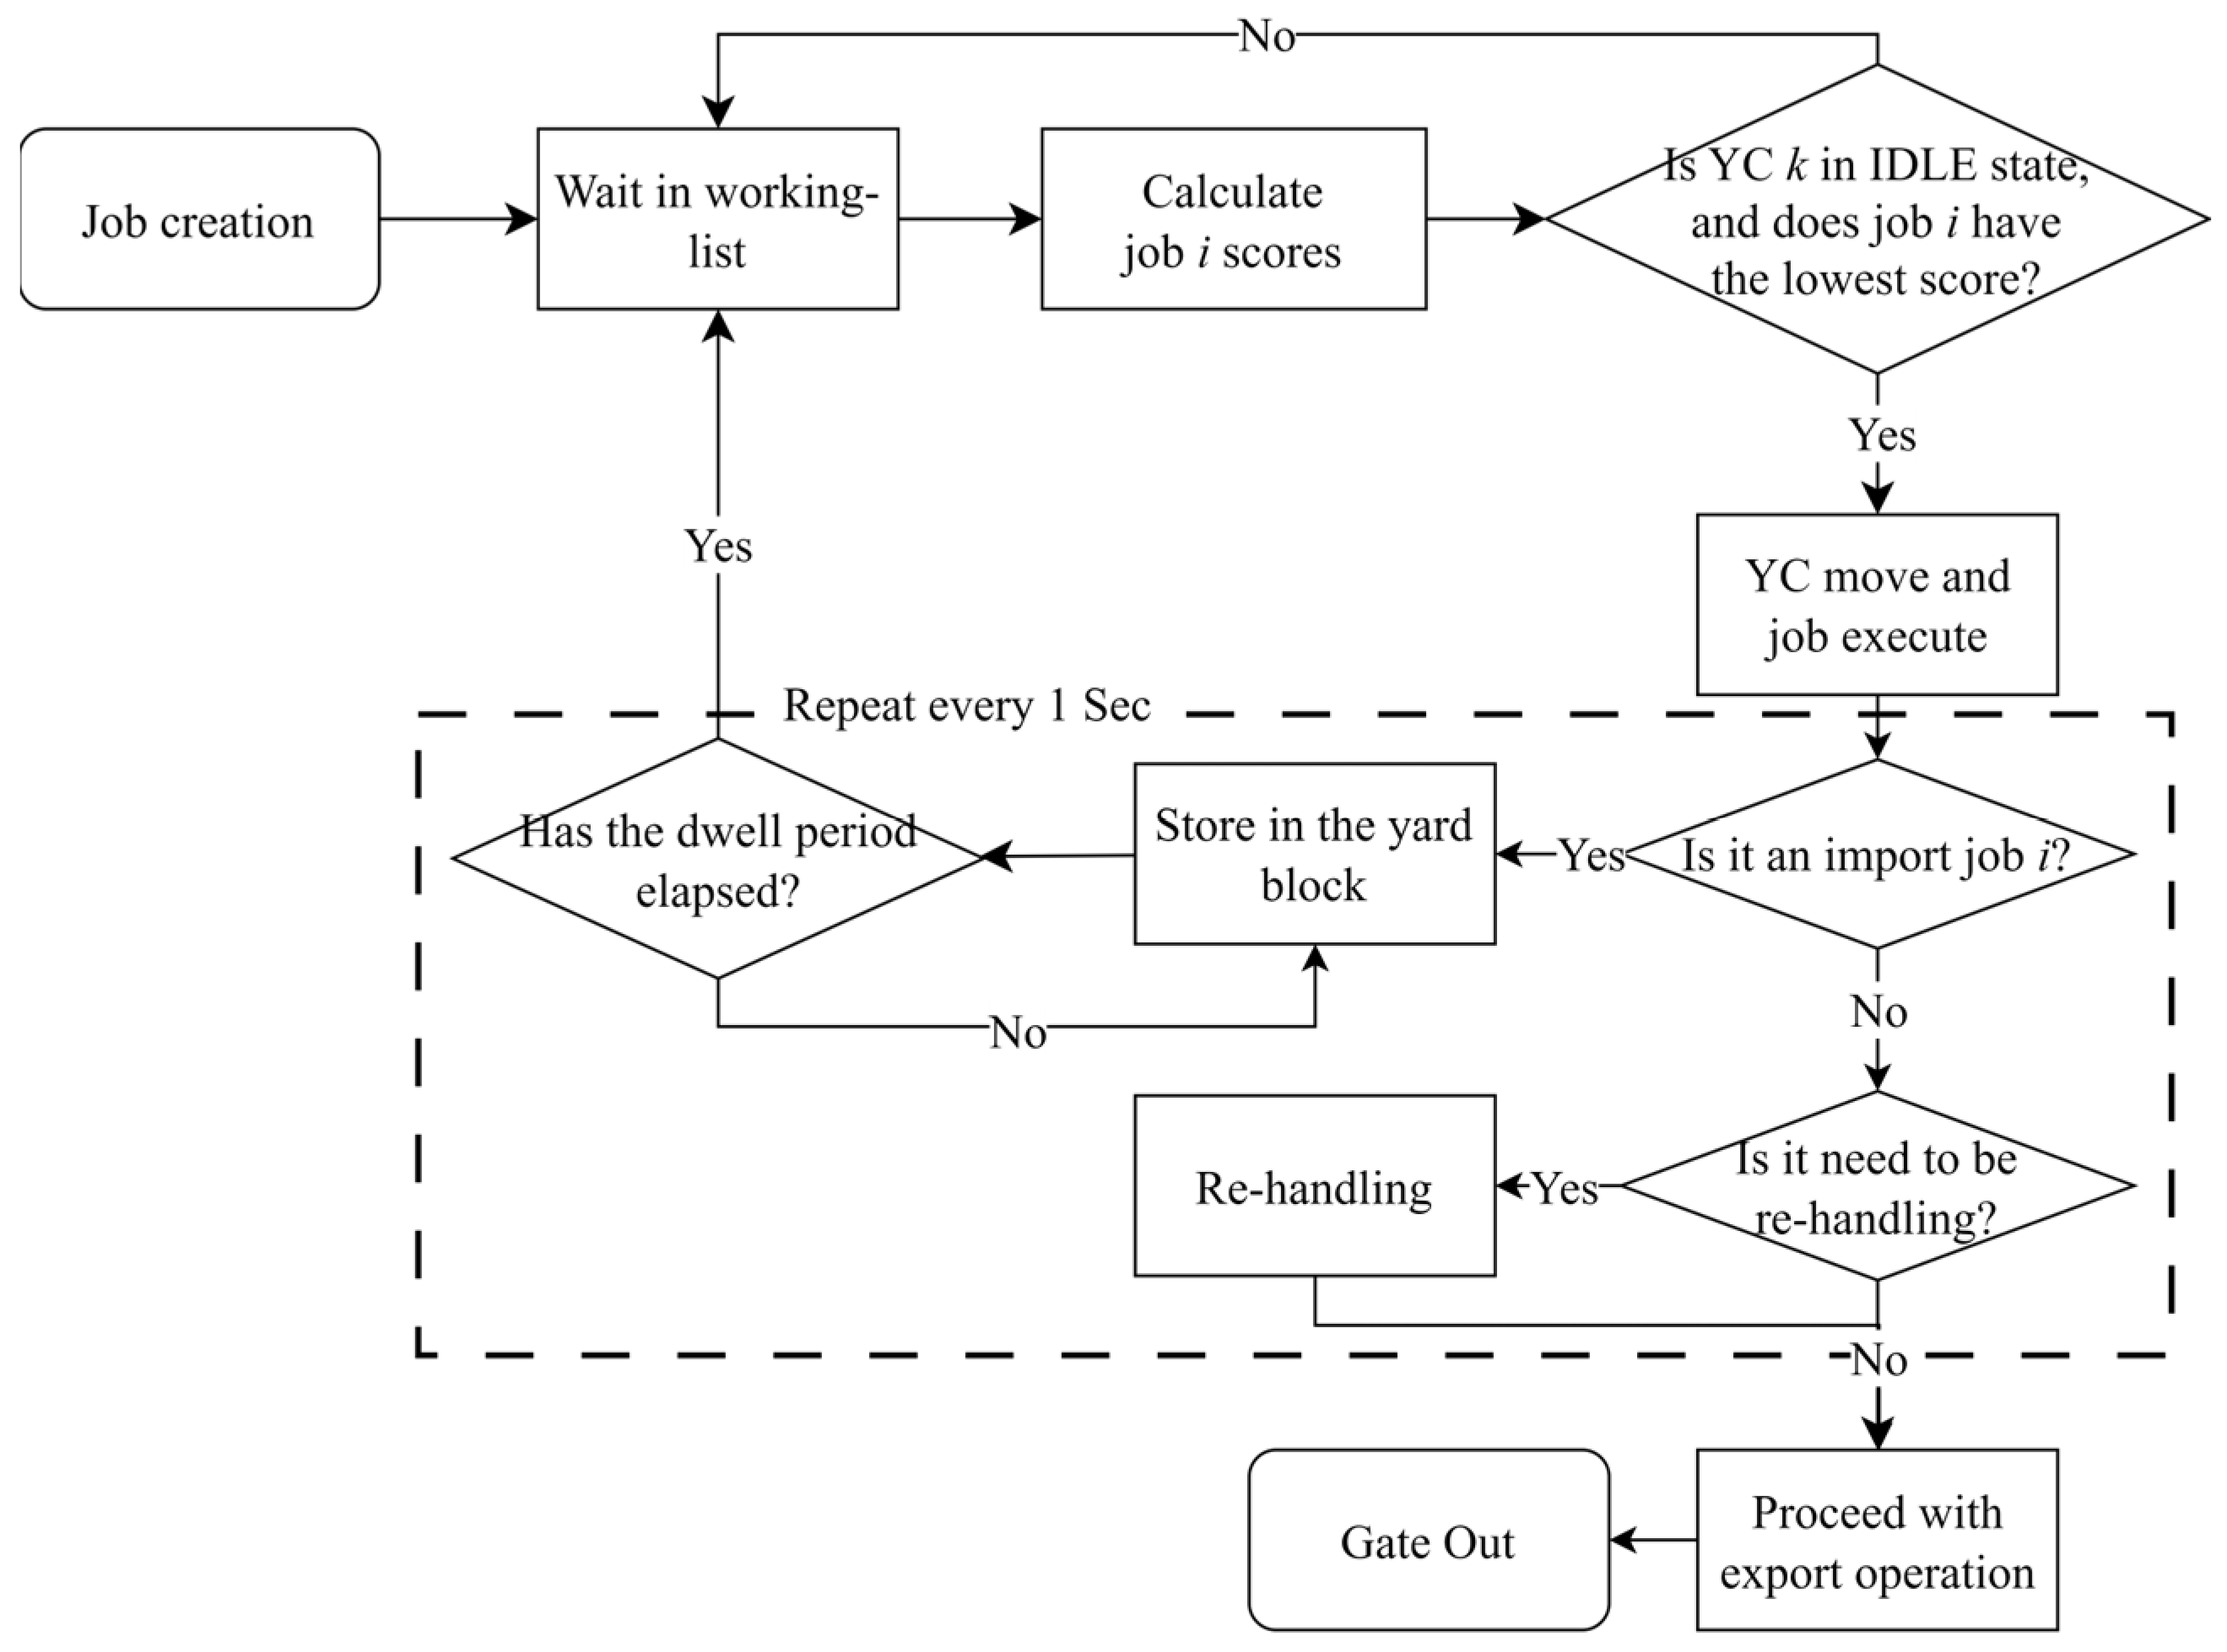
The flowchart of this simulation is illustrated in Figure 11. The model starts by waiting for crane allocation when a job is generated. Once a load is created and moves towards the target bay, it waits for crane allocation from a working list. After a crane finishes a job or when a new job is generated, the scores are recalculated, and the crane processes the job with the lowest score. After the Score function, if a crane needs to move for a job, and it violates the safety distance of neighboring cranes, it waits at that position until the neighboring crane completes its job and then proceeds. If the neighboring crane is in an idle state, that crane moves aside so the other crane may process the job.
Figure 11.
Process flow.
The job creation distribution and job attribute ratios used are based on data collected from a container terminal located in South Korea. Inbound jobs, which involve stacking containers inside the block, are generated following an exponential distribution. Outbound jobs are generated after the dwell time of the inbound containers has passed. To realistically simulate congested and non-congested periods at the container terminal, the parameters of the exponential distribution for inbound job generation vary according to the time periods.
For example, in a scenario with twin YCs deployed in one container block, on average, one inbound job is generated every 705.54 s during peak congestion and every 4851.38 s during off-peak hours. The dwell time for each container follows an empirical distribution ranging from a minimum of 0.06 days to a maximum of 15.45 days. Inbound and outbound jobs are further categorized into seaward and landside operations, with the ratio of seaward to landside jobs set at 63.5:36.5.
Tasks are categorized into import, export, and transshipment. Gate-in operations are considered landside tasks, while berth-in operations are considered seaside tasks. Additionally, only import operations, which fill the berth’s stacking period and depart, are classified as landside tasks, while export and transshipment operations are considered seaside tasks.
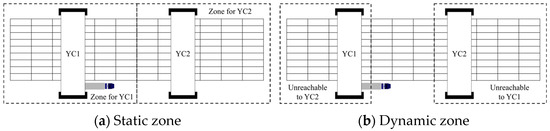
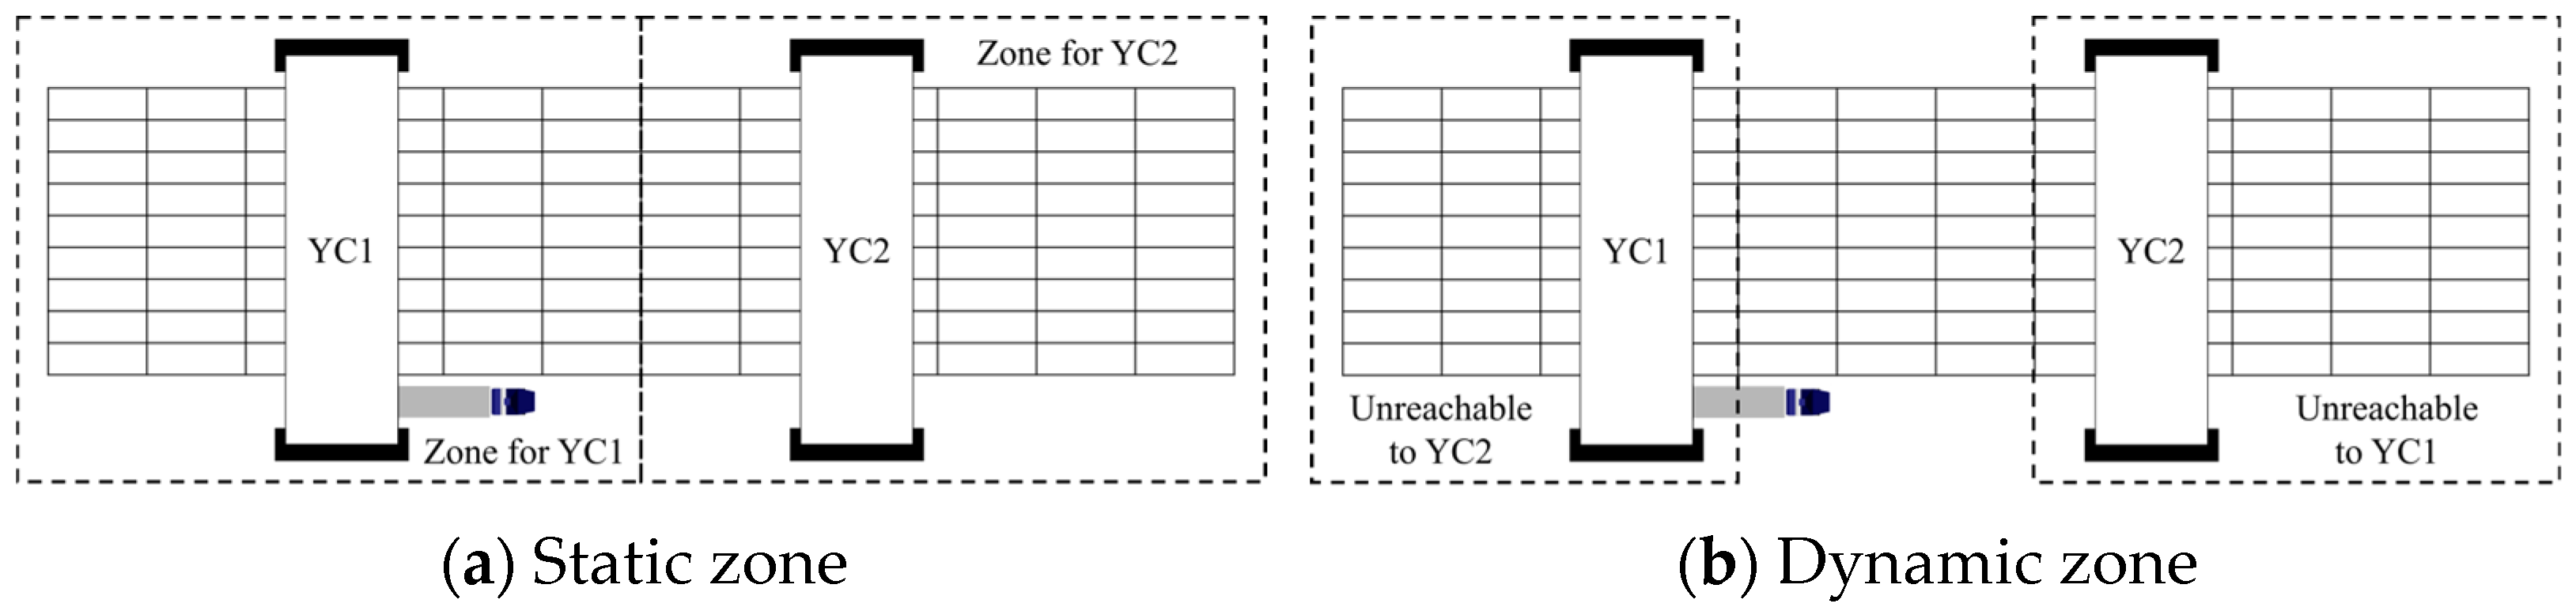
According to an interview with the port terminal operator, YCs operate within exclusive areas known as sub-zones, each designated for a specific crane. As shown in Figure 12a, when two YCs operate within their individual sub-zones, the operator can define the boundaries of these sub-zones. Typically, these sub-zones are divided into equal-sized areas. However, in this paper, as depicted in Figure 12b, the exclusive areas for each crane were removed, allowing the cranes to handle operations in all areas without interfering with each other.
Figure 12.
Static zone and dynamic zone.
Reassignment occurs when a YC is in transit to a task, and it happens when a task is waiting at the same bay as the target bay. Re-handle logic is triggered when a crane arrives at the target bay, and there are containers stacked on top of the container that needs to be taken out. It checks adjacent rows for empty spaces and moves the container to a lower row if space is available. If there are no empty spaces in the adjacent rows, it continues checking for empty spaces in rows further away.
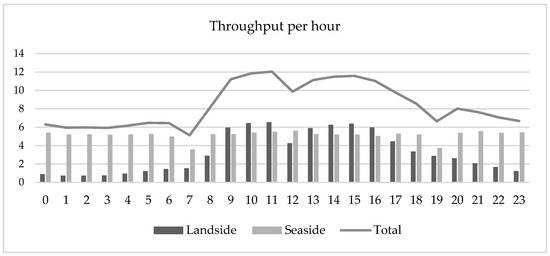
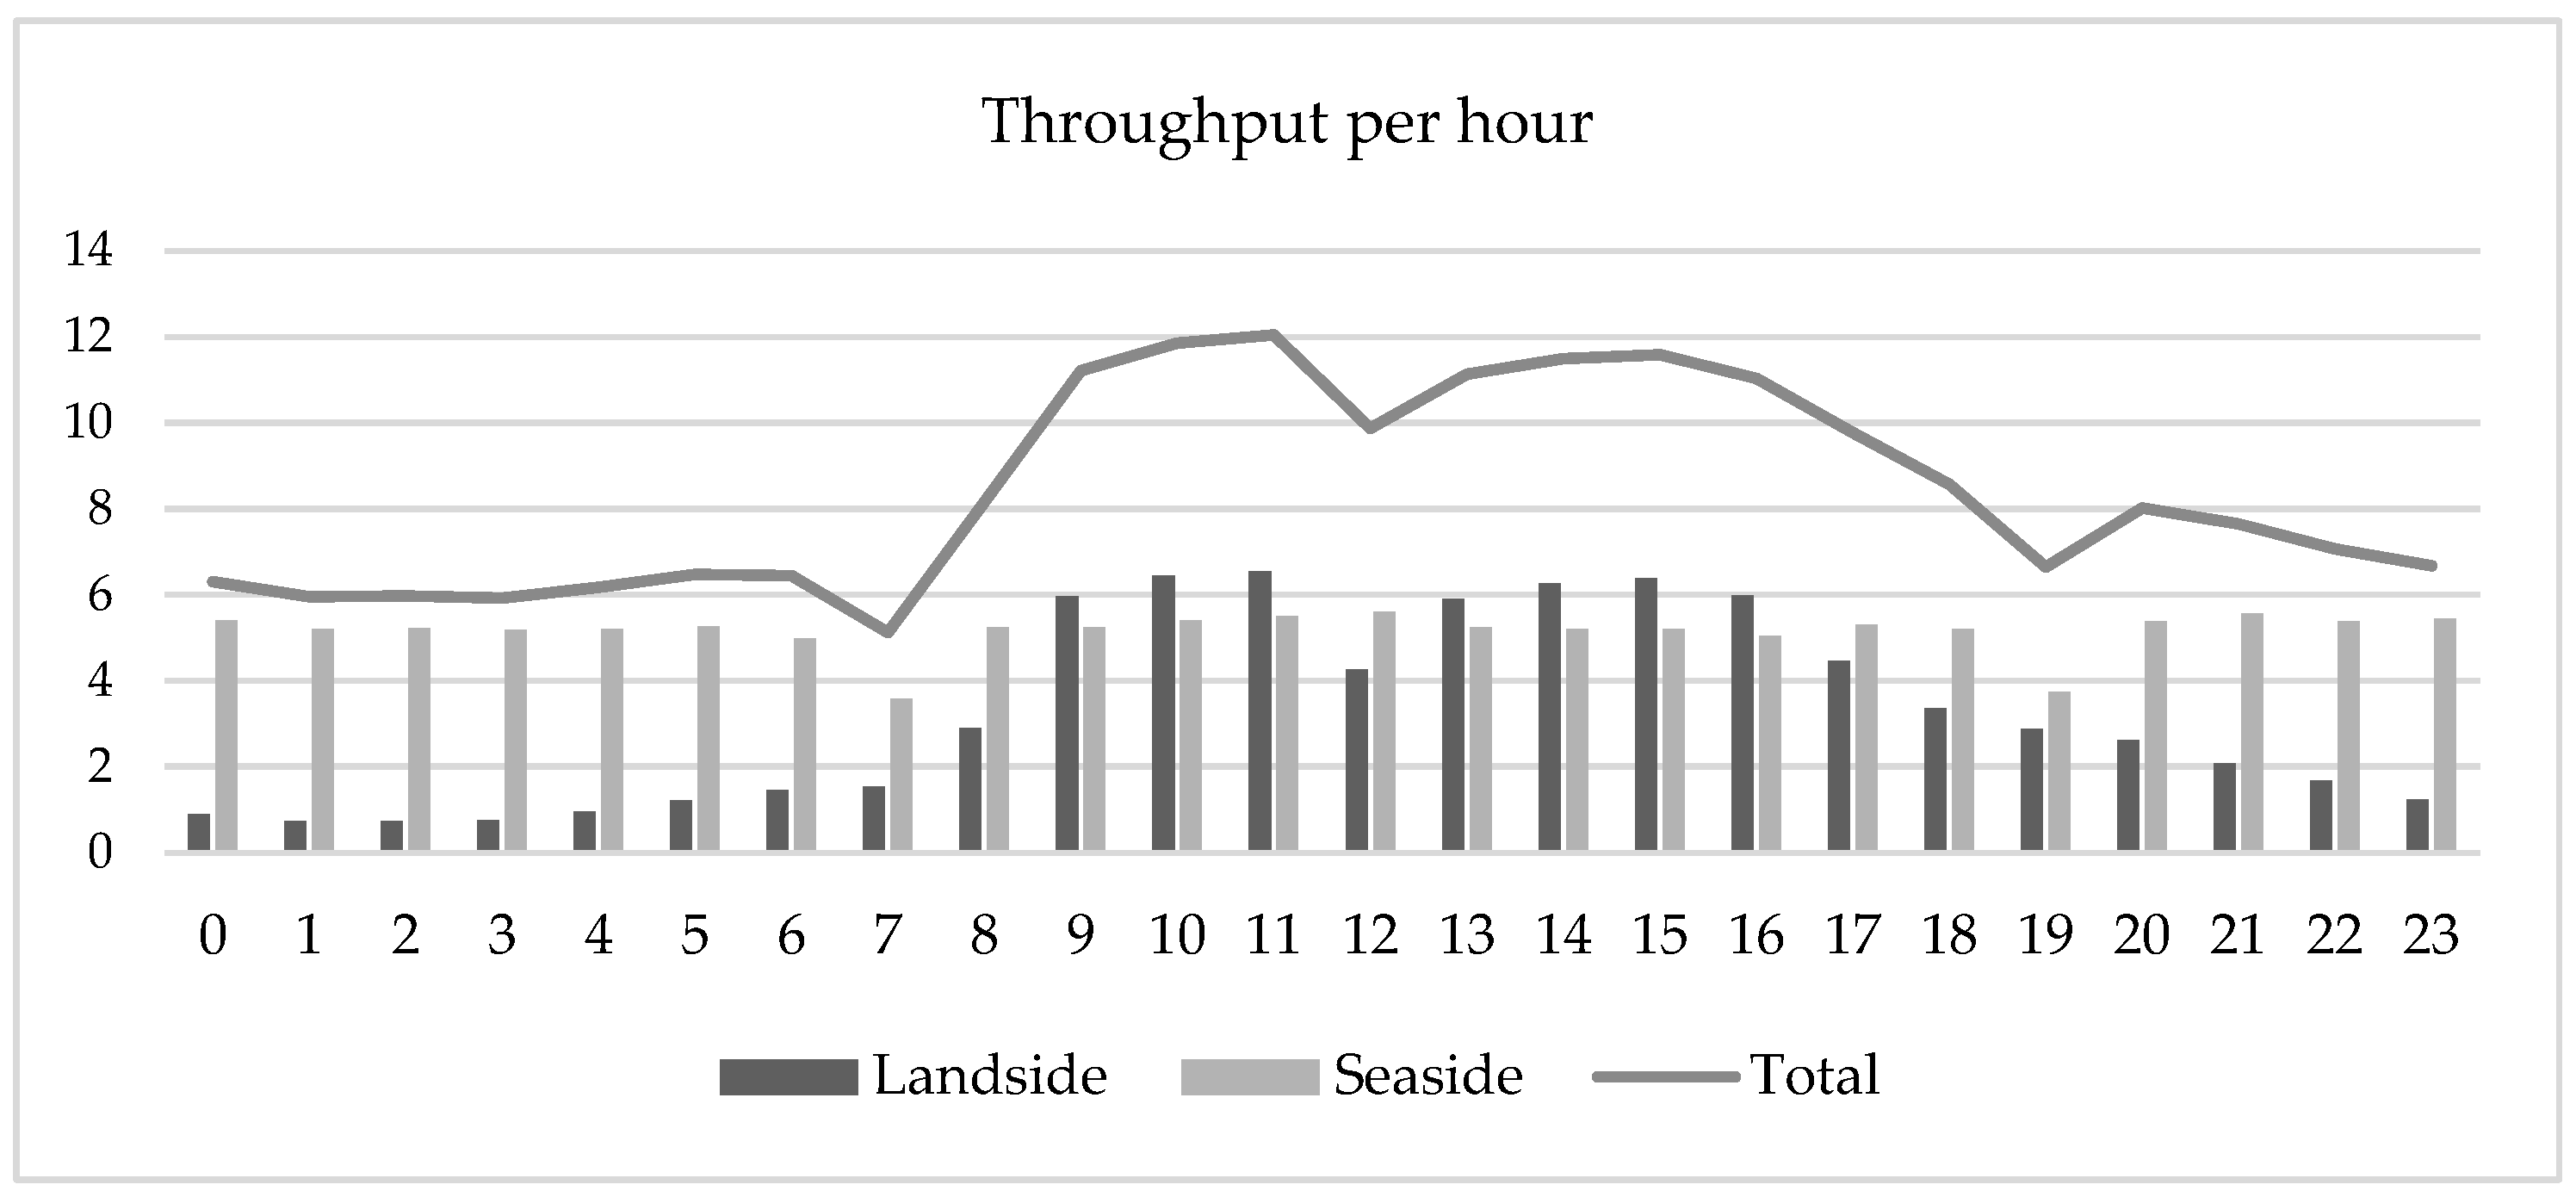
Throughput per hour can be distinguished between landside and seaside, as shown in Figure 13. There is not much difference in seaside operations throughout the day. However, landside operations tend to peak during working hours. The total throughput per hour is 8.381, with the peak hours designated from 9 to 16.
Figure 13.
Throughput per hour.
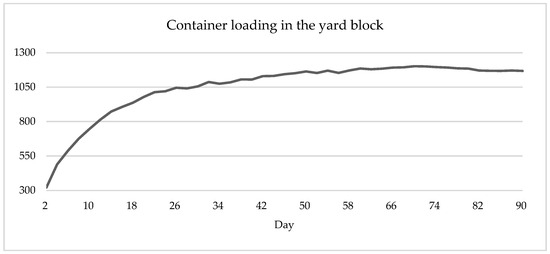
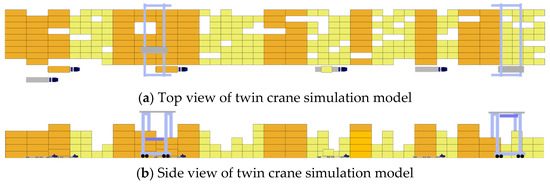
The container loading in the yard block of Figure 14 was examined, and it was determined that a warm-up period of 60 days should be set. The experimental duration is 30 days, resulting in a total of 90 days of experimentation, and the experiment was conducted for a total of 3 replications.
Figure 14.
The container loading in the yard block.
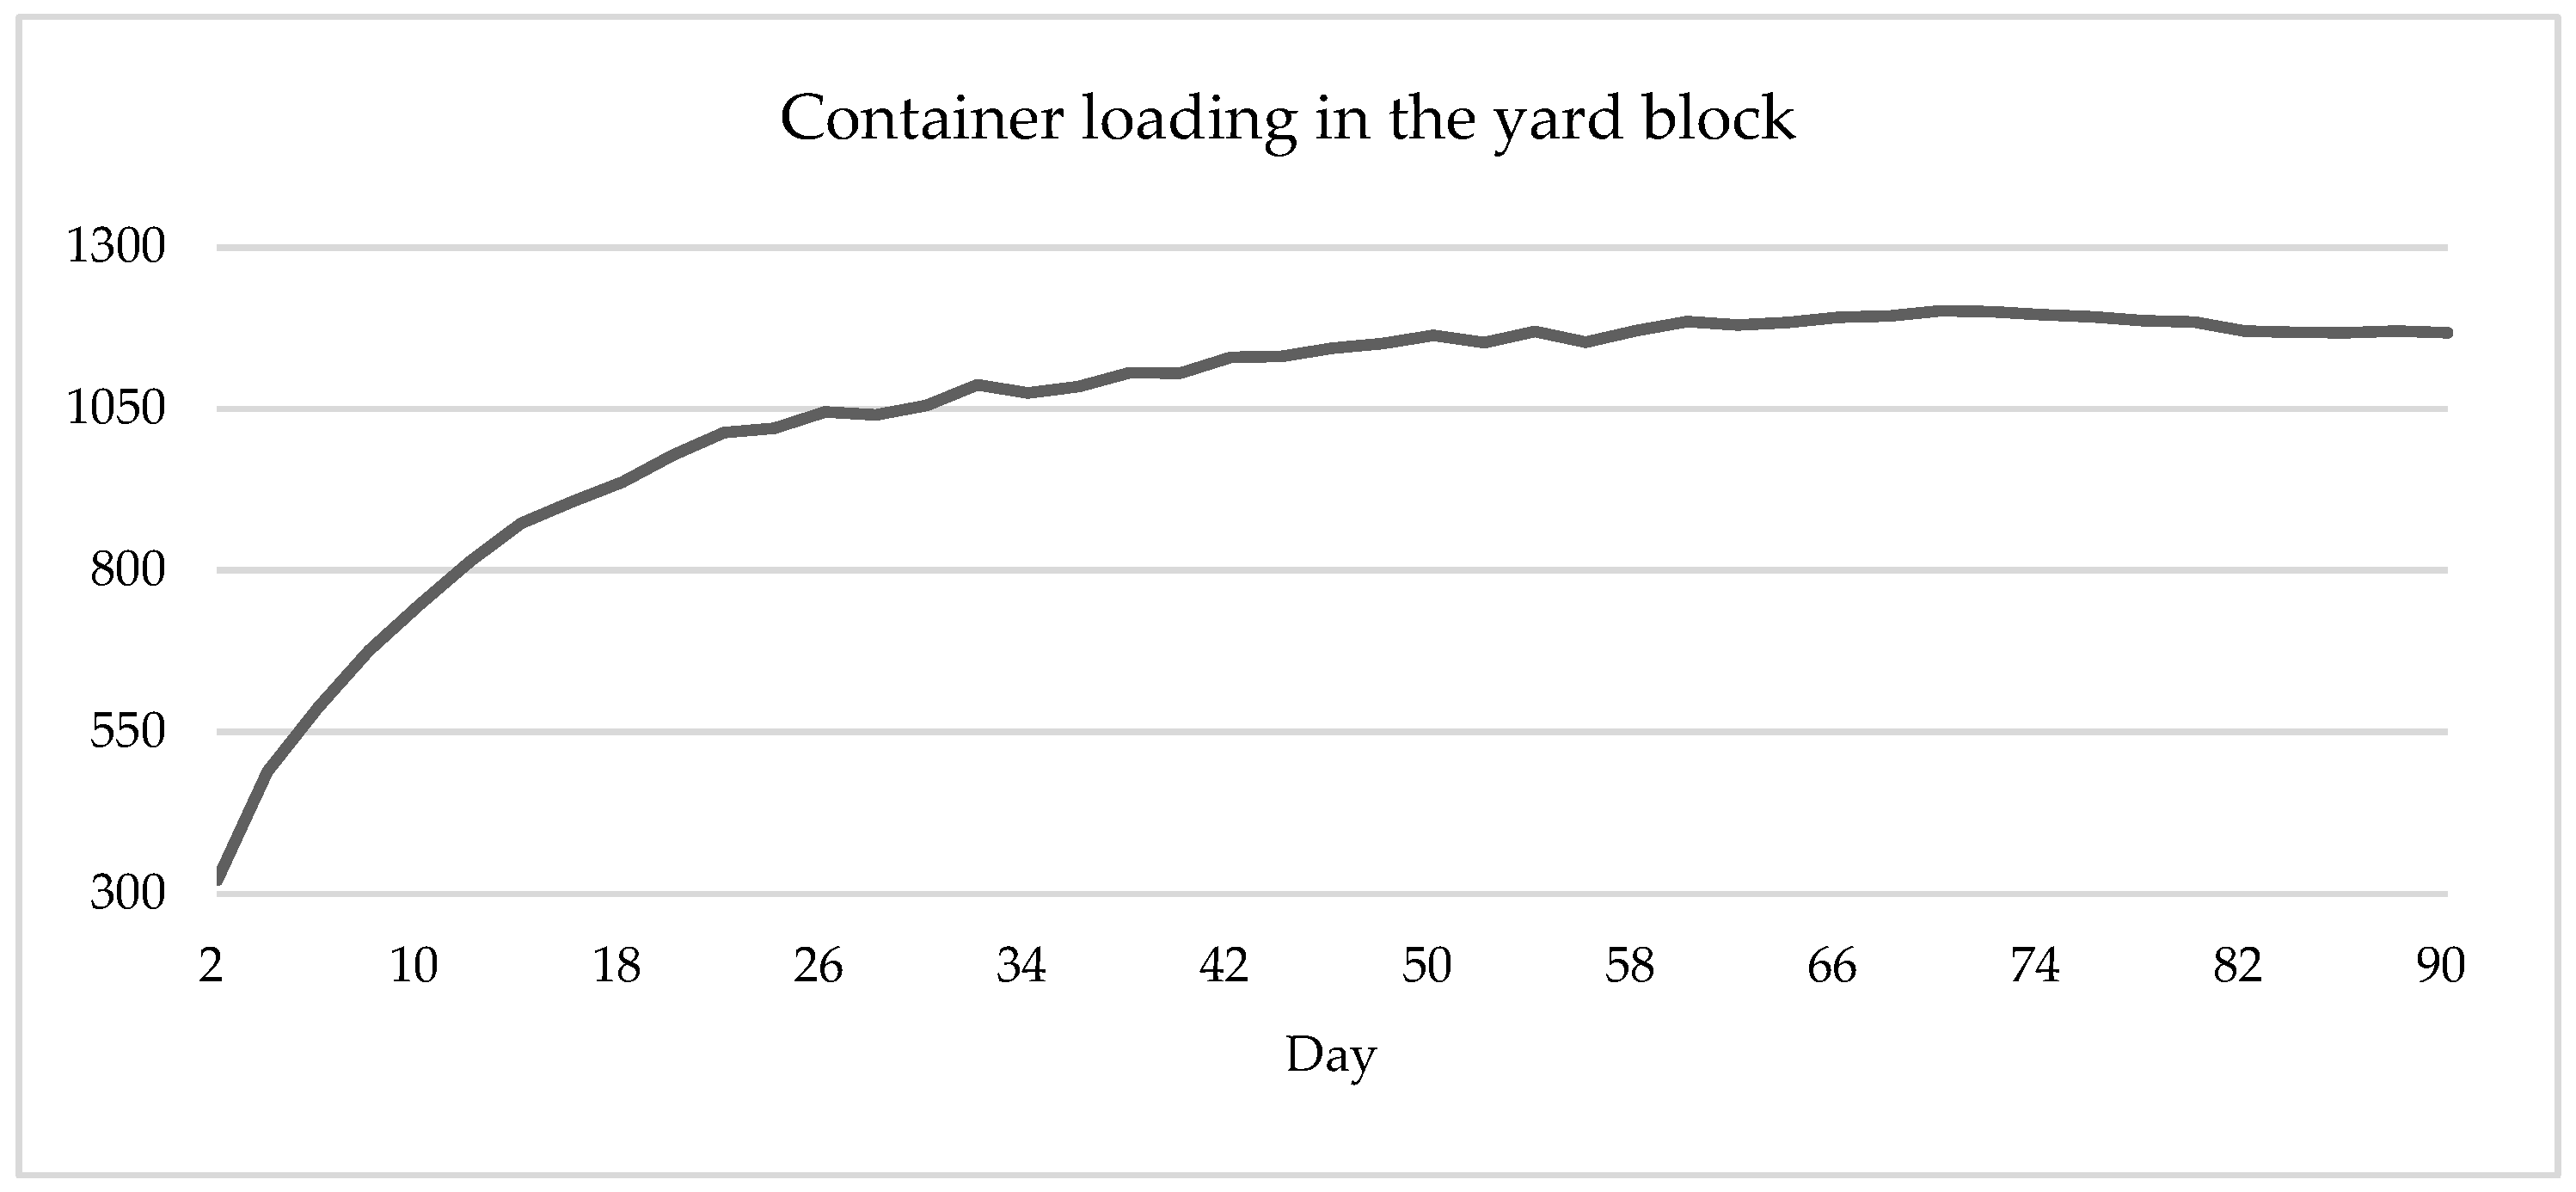
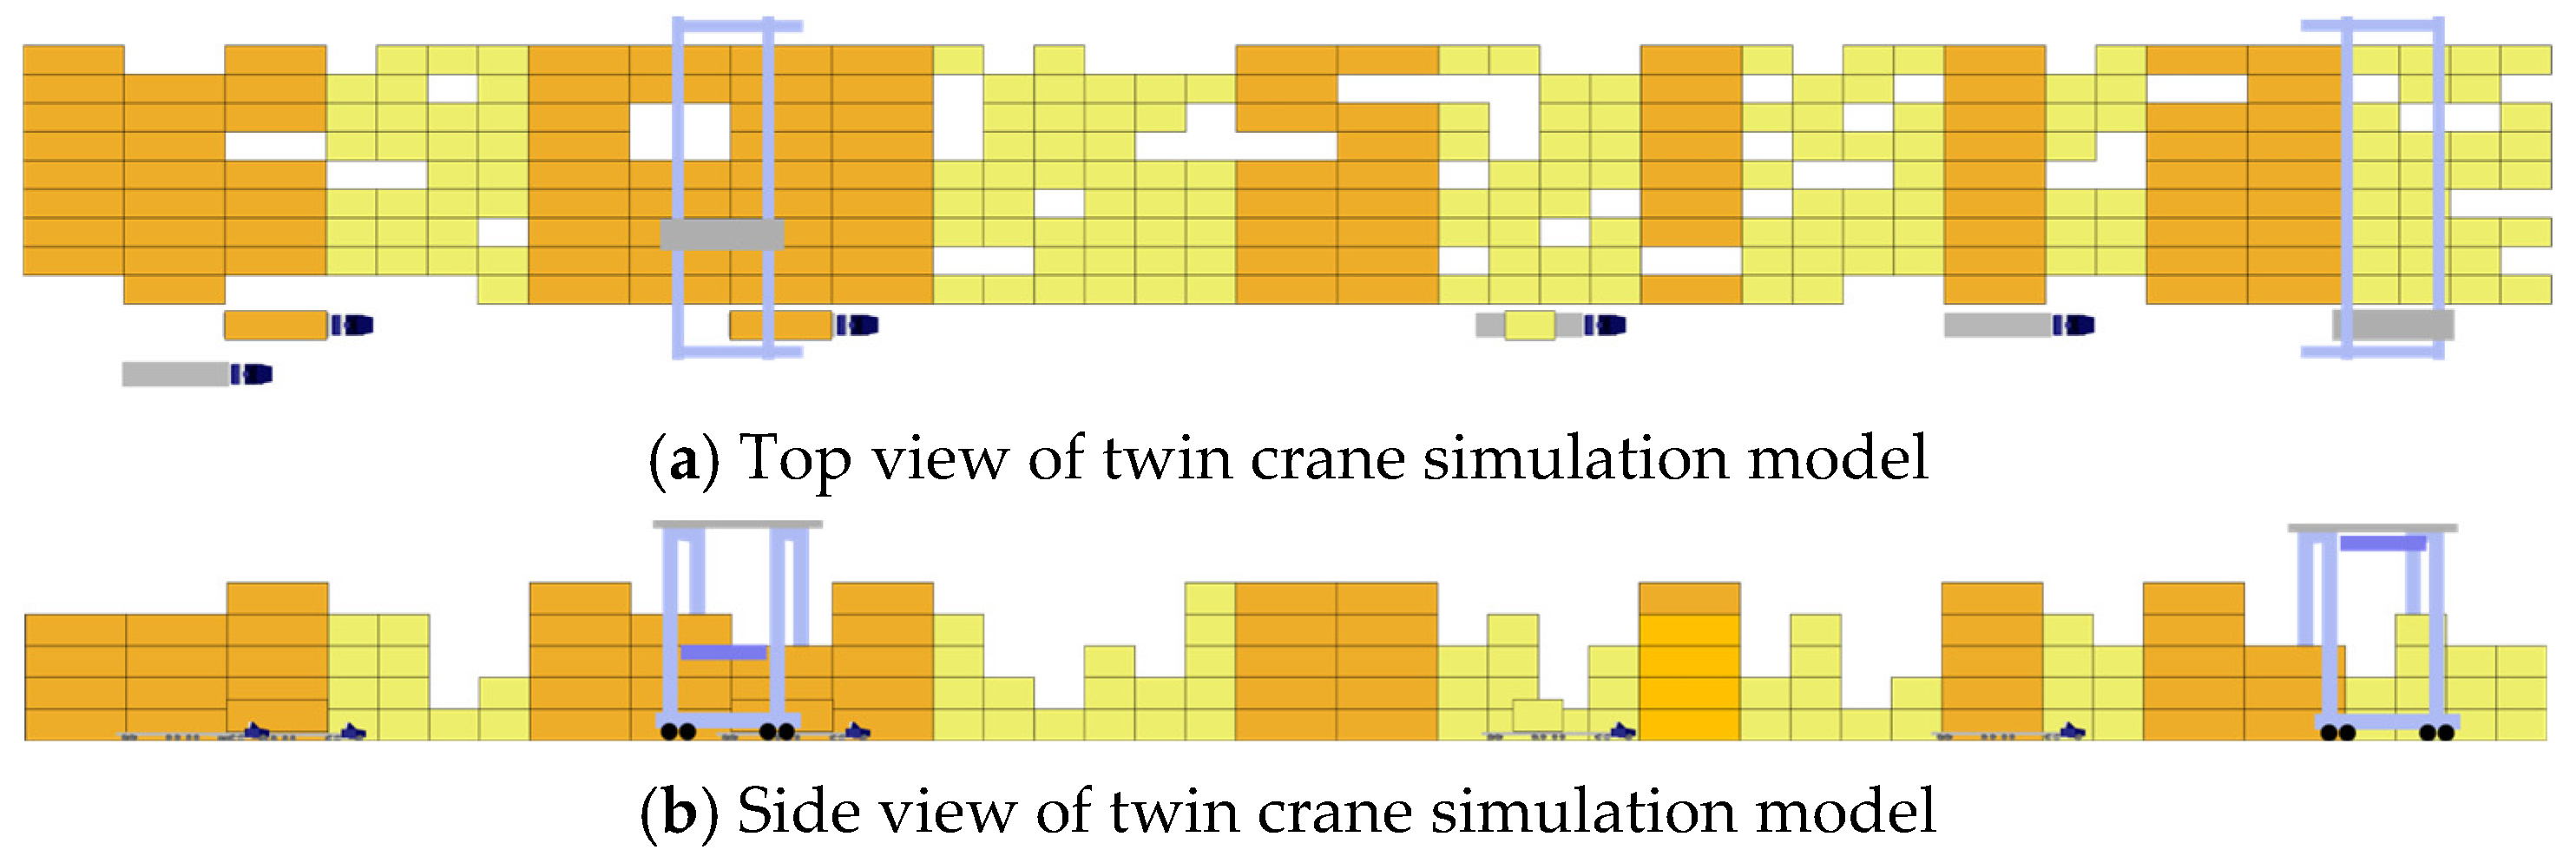
The environment in which the experiment was conducted featured a 13th Gen Intel(R) Core (TM) i5-13600K, 3500 Mhz, 14 Cores, 20 Logical Processors, and utilized 32GB of memory. The simulation was configured using AutoMod® x64 14.5, and the total duration of the experiment averaged 202.403 s. The system configuration is illustrated in Figure 15, where panel (a) provides a top view and panel (b) presents a side view of the layout. Yellow containers represent 20-ft containers, while orange containers represent 40-ft containers.
Figure 15.
AutoMod® simulation model constructed for experiments.
5.3. Scenario
To evaluate the effectiveness of the score-based job allocation logic proposed in this study, AutoMod® simulation experiments were conducted. The score-based logic assigns each job a score computed from four factors—distance waiting time , processing time , and elasticity —with corresponding weights . Since different weight combinations lead to different trade-offs between average and maximum , we search for a weight vector that primarily minimizes average while also reducing maximum .
A genetic algorithm (GA), implemented via the AutoStat Optimization module of AutoMod®, is employed to determine the weights of these four factors. Each individual in the population represents a weight vector associated with distance, waiting time, processing time, and elasticity, respectively. The weights are restricted to the range [0, 1] and normalized such that their sum equals 1. The GA parameters and settings that are used in AutoStat are summarized in Table 6.
Table 6.
Configuration of GA.
In AutoStat, each generation consists of offspring, where N is the number of parents per generation ( in this study, so 35 solutions are evaluated per generation). For every offspring, two parents are randomly selected and combined by discrete recombination: for each factor, the child inherits the value from either one parent or the other. After crossover, all factors are independently mutated by slightly perturbing their values within the predefined ranges (integer factors are mutated and then rounded to the nearest integer). The mutation step size is controlled adaptively; if further mutation of a given factor does not improve the fitness, its mutation magnitude is gradually reduced to zero, effectively fixing that factor at its best value [36].
In each generation, the fitness of an individual is evaluated by running the simulation and computing the composite objective value defined in Equation (11):
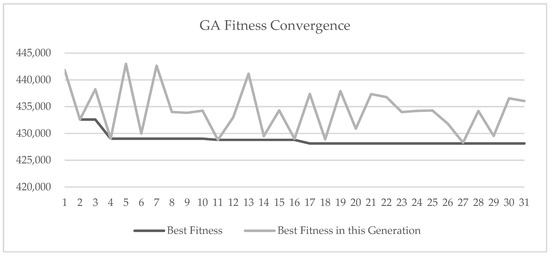
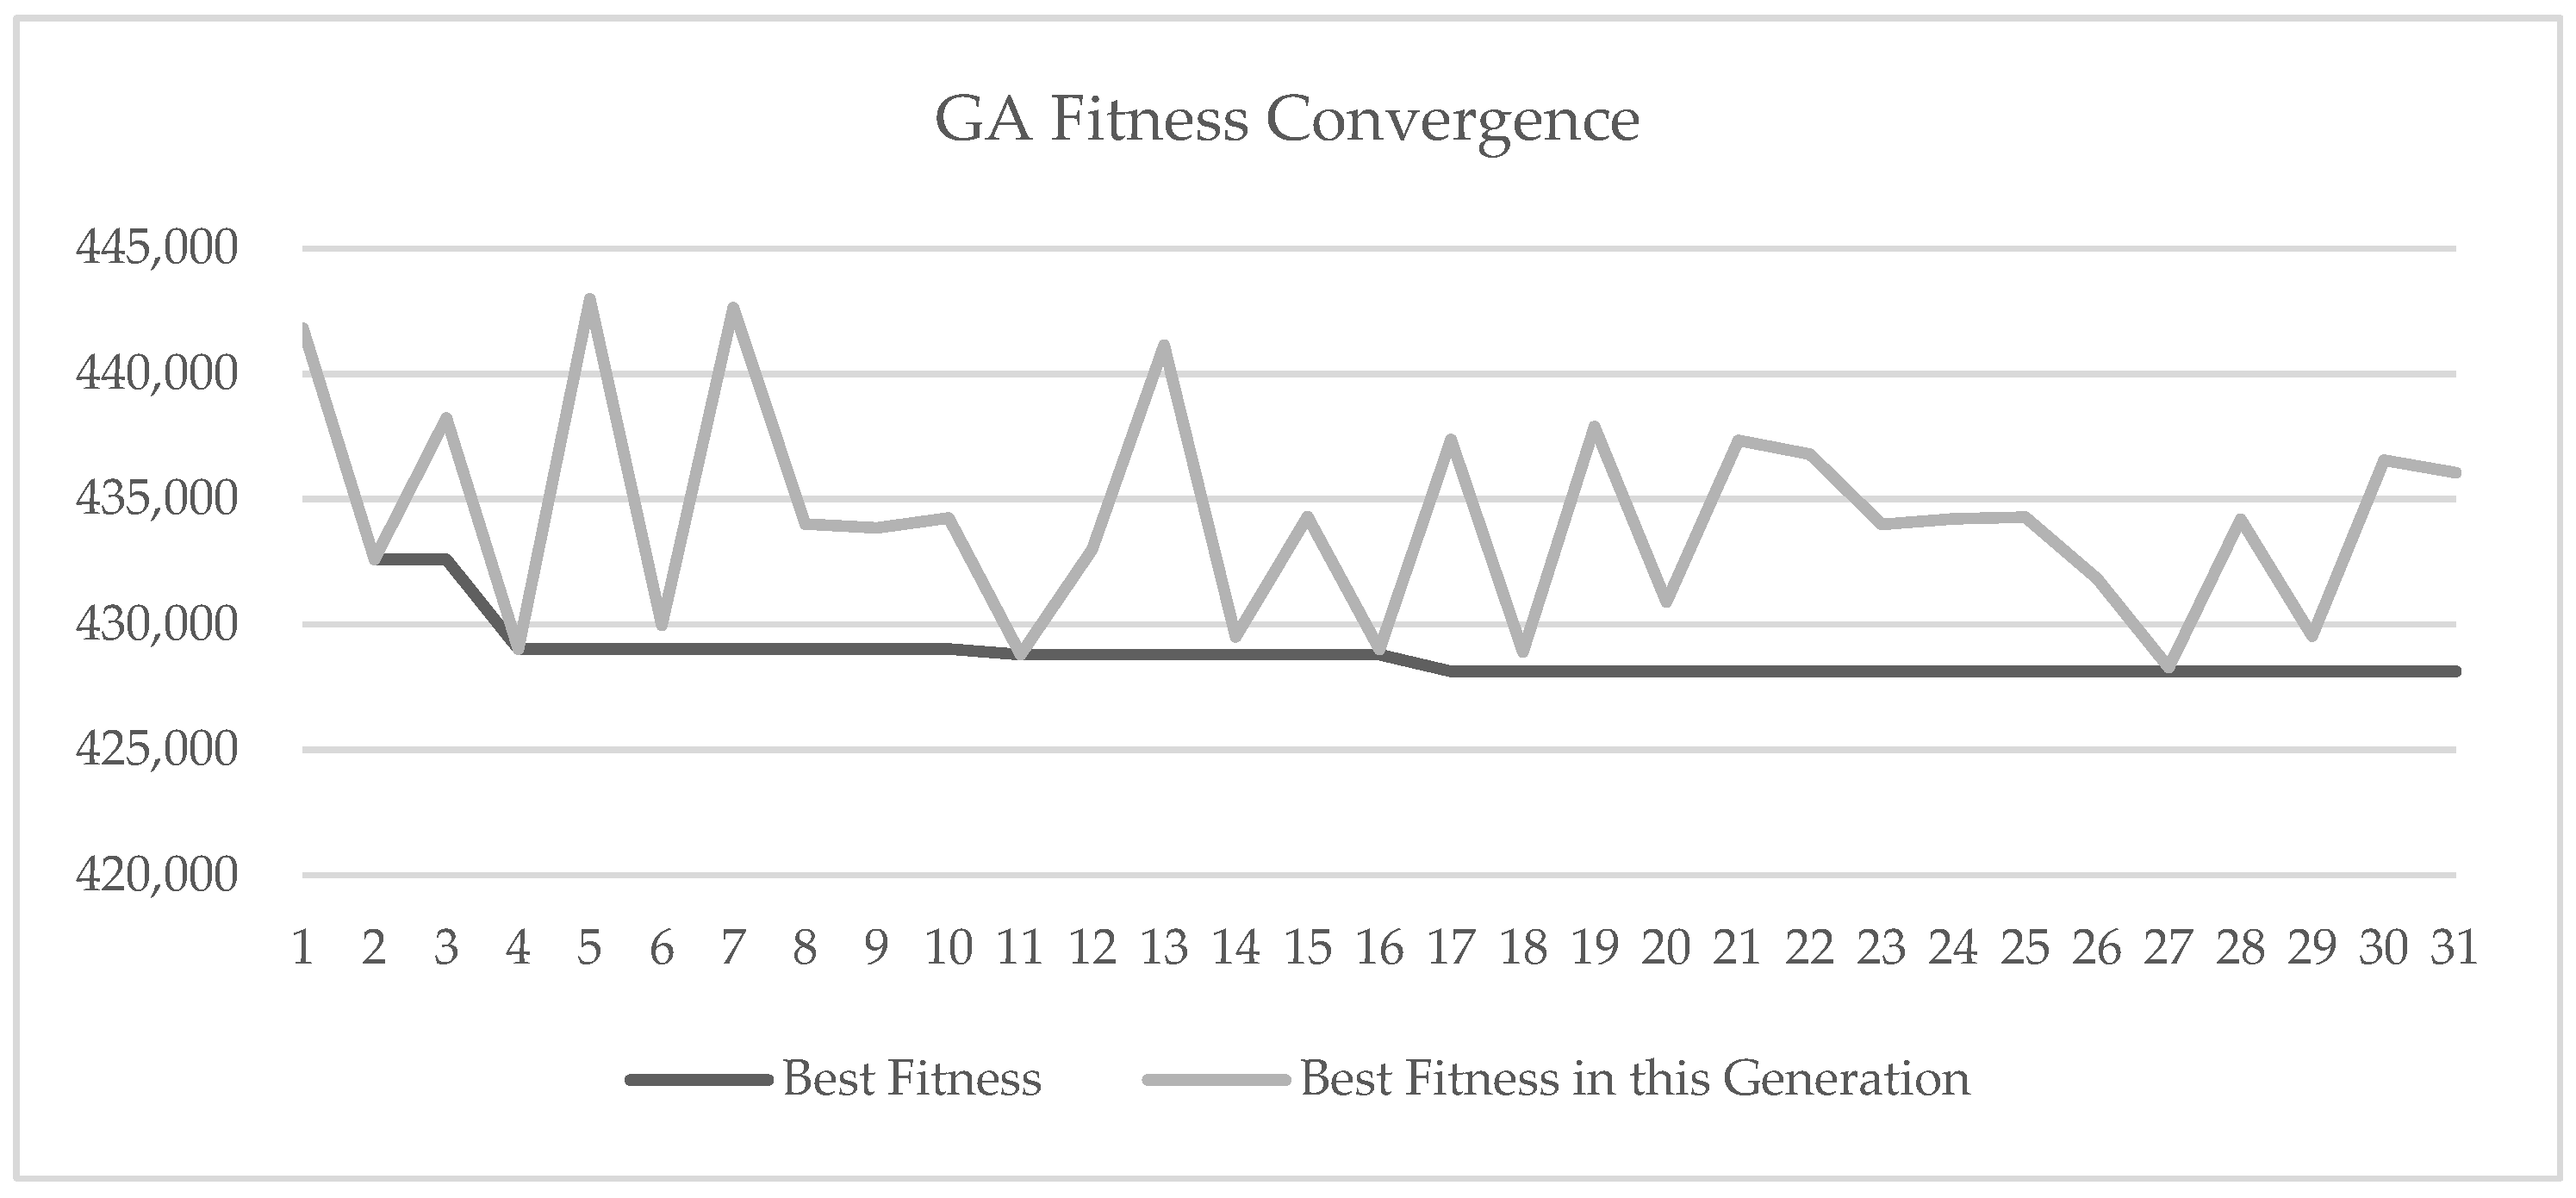
In this formulation, the average is weighted 1000 times more than the maximum , so reducing the average is prioritized, while the maximum is used as a secondary criterion to discriminate between candidate solutions with similar averages. The best five individuals in each generation are selected as parents for the next generation. The GA terminates when either (i) 100 generations are reached or (ii) the relative improvement in the best fitness over a sliding window of 30 consecutive generations falls below 1%. In the base-case experiment, this stopping rule led to convergence after 31 generations.
Figure 16 illustrates the convergence behavior of the GA. The line “Best Fitness in this Generation” shows the best fitness value found in each generation, which fluctuates due to the stochastic nature of the simulation-based evaluation. The line “Best Fitness” represents the best fitness value observed so far and gradually decreases before stabilizing after around 25–30 generations. This pattern confirms that the chosen parameter settings and stopping criterion allow the GA to converge to a stable solution.
Figure 16.
GA Fitness Convergence.
To evaluate the performance of the proposed score-based job allocation logic, we then designed a set of experimental scenarios by combining various influencing factors. A total of four variables were considered, and each scenario was constructed by either including or excluding each variable in the score calculation. This resulted in 16 unique combinations, allowing for a comprehensive analysis of how different variable configurations affect allocation performance.
For performance comparison, we consider three traditional job assignment rules as baselines: FCFS, NFS, and a combined FCFS + NFS rule. The FCFS rule prioritizes tasks in order of arrival in the job list, whereas the NFS rule prioritizes tasks located closer to the yard crane. Previous studies have shown that FCFS and NFS are simple yet practically applicable in real yard operations. In this study, hybrid configurations are also examined in which FCFS and NFS are combined with different weight ratios. Through these experiments, we verify that the score-based logic provides a more flexible and effective strategy for minimizing both average and maximum than conventional assignment rules.
5.4. Simulation Results
To evaluate the effectiveness of the proposed score-based job allocation logic, a comprehensive set of simulation experiments was conducted under the twin yard crane scenario. The experiments were designed to examine both (i) the impact of different factor combinations in the score formulation and (ii) the relative performance of the proposed logic compared with representative conventional dispatching rules.
First, a full-factor analysis was performed by selectively including or excluding the four scoring components—, , , and . This resulted in a total of 16 scenarios, including conventional single-rule cases and hybrid score-based configurations.
Table 7 reports the average and maximum obtained for each scenario. Several cases (e.g., Cases 3, 4, and 9), which rely solely on time-related variables, fail to produce valid task allocations because such variables do not differentiate between cranes at the moment of dispatch. This highlights the necessity of incorporating spatial information into real-time yard crane assignment decisions.
Table 7.
Performance results of all score-based and conventional scenarios (Cases 1–16).
The optimized weights obtained using the genetic algorithm, as summarized in Table 7, provide further insight into the relative contribution of each factor. Across most scenarios, the weight assigned to remains below 0.1, indicating that it plays a secondary role in real-time dispatching decisions. In contrast, the consistently receives the highest weight, confirming the dominant influence of spatial proximity in yard crane operations. Notably, is selected together with distance and waiting time in the best-performing configuration, highlighting its complementary role in guiding crane movements toward favorable regions while maintaining responsiveness to job waiting conditions.
When only distance-related variables are considered, such as in Case 2 (pure NFS) or Case 5 (elasticity-only), both average and maximum TAT remain relatively high. This indicates that distance-based criteria alone are insufficient to ensure balanced crane utilization and stable system performance. Hybrid cases that combine distance and waiting time (e.g., Case 6) show substantial reductions in maximum , confirming the effectiveness of multi-criteria dispatching.
Among all scenarios, Case 13—which integrates , , and —achieves the best overall performance by simultaneously minimizing average and maximum . This case therefore serves as the representative configuration of the proposed score-based logic.
To more clearly demonstrate the incremental benefits of the proposed approach, a focused comparison is conducted against representative benchmark rules commonly used in practice. Table 8 compares three representative cases: Case 2 (NFS), Case 6 (FCFS + NFS), and Case 13 (proposed score-based logic with elasticity).
Table 8.
Benchmark comparison.
Starting from the NFS baseline, the FCFS + NFS rule significantly reduces maximum TAT by incorporating job arrival order, while also achieving moderate improvements in average . This confirms that combining multiple criteria already offers advantages over single-rule dispatching.
However, the proposed score-based strategy (Case 13) further improves performance beyond the FCFS + NFS baseline. Compared with Case 6, the inclusion of the elasticity term results in an additional reduction of approximately 7.51% in average and 7.79% in maximum . Relative to the pure NFS rule, the reductions reach approximately 14.7% and 154.4% for average and maximum , respectively.
These results demonstrate that elasticity provides a meaningful incremental contribution beyond conventional distance- and time-based scoring components. While FCFS + NFS mitigates extreme waiting times, it does not explicitly account for directional workload balance or crane movement tendencies. By contrast, the elasticity term biases assignments toward crane movements that align with preferred working zones, reducing counterproductive motion and interference.
Overall, the combined analysis using both the full scenario table and the benchmark comparison confirms that the proposed score-based job allocation logic consistently outperforms representative conventional dispatching rules and offers a robust and practical solution for real-time twin yard crane operations.
Among the evaluated scenarios, the FCFS + NFS rule (Case 6) exhibits a relatively low maximum compared with most other configurations, indicating that combining arrival order and distance information is effective in mitigating extreme delays. A similarly low maximum is also observed in scenarios that rely only on , and related factors; however, these cases tend to show higher average , reflecting a trade-off between delay stability and overall operational efficiency. In contrast, the best performing score-based configuration achieves simultaneous reductions in both average and maximum , demonstrating a more balanced and robust job allocation performance.
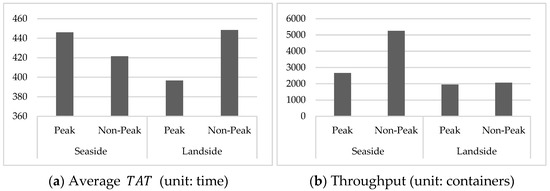
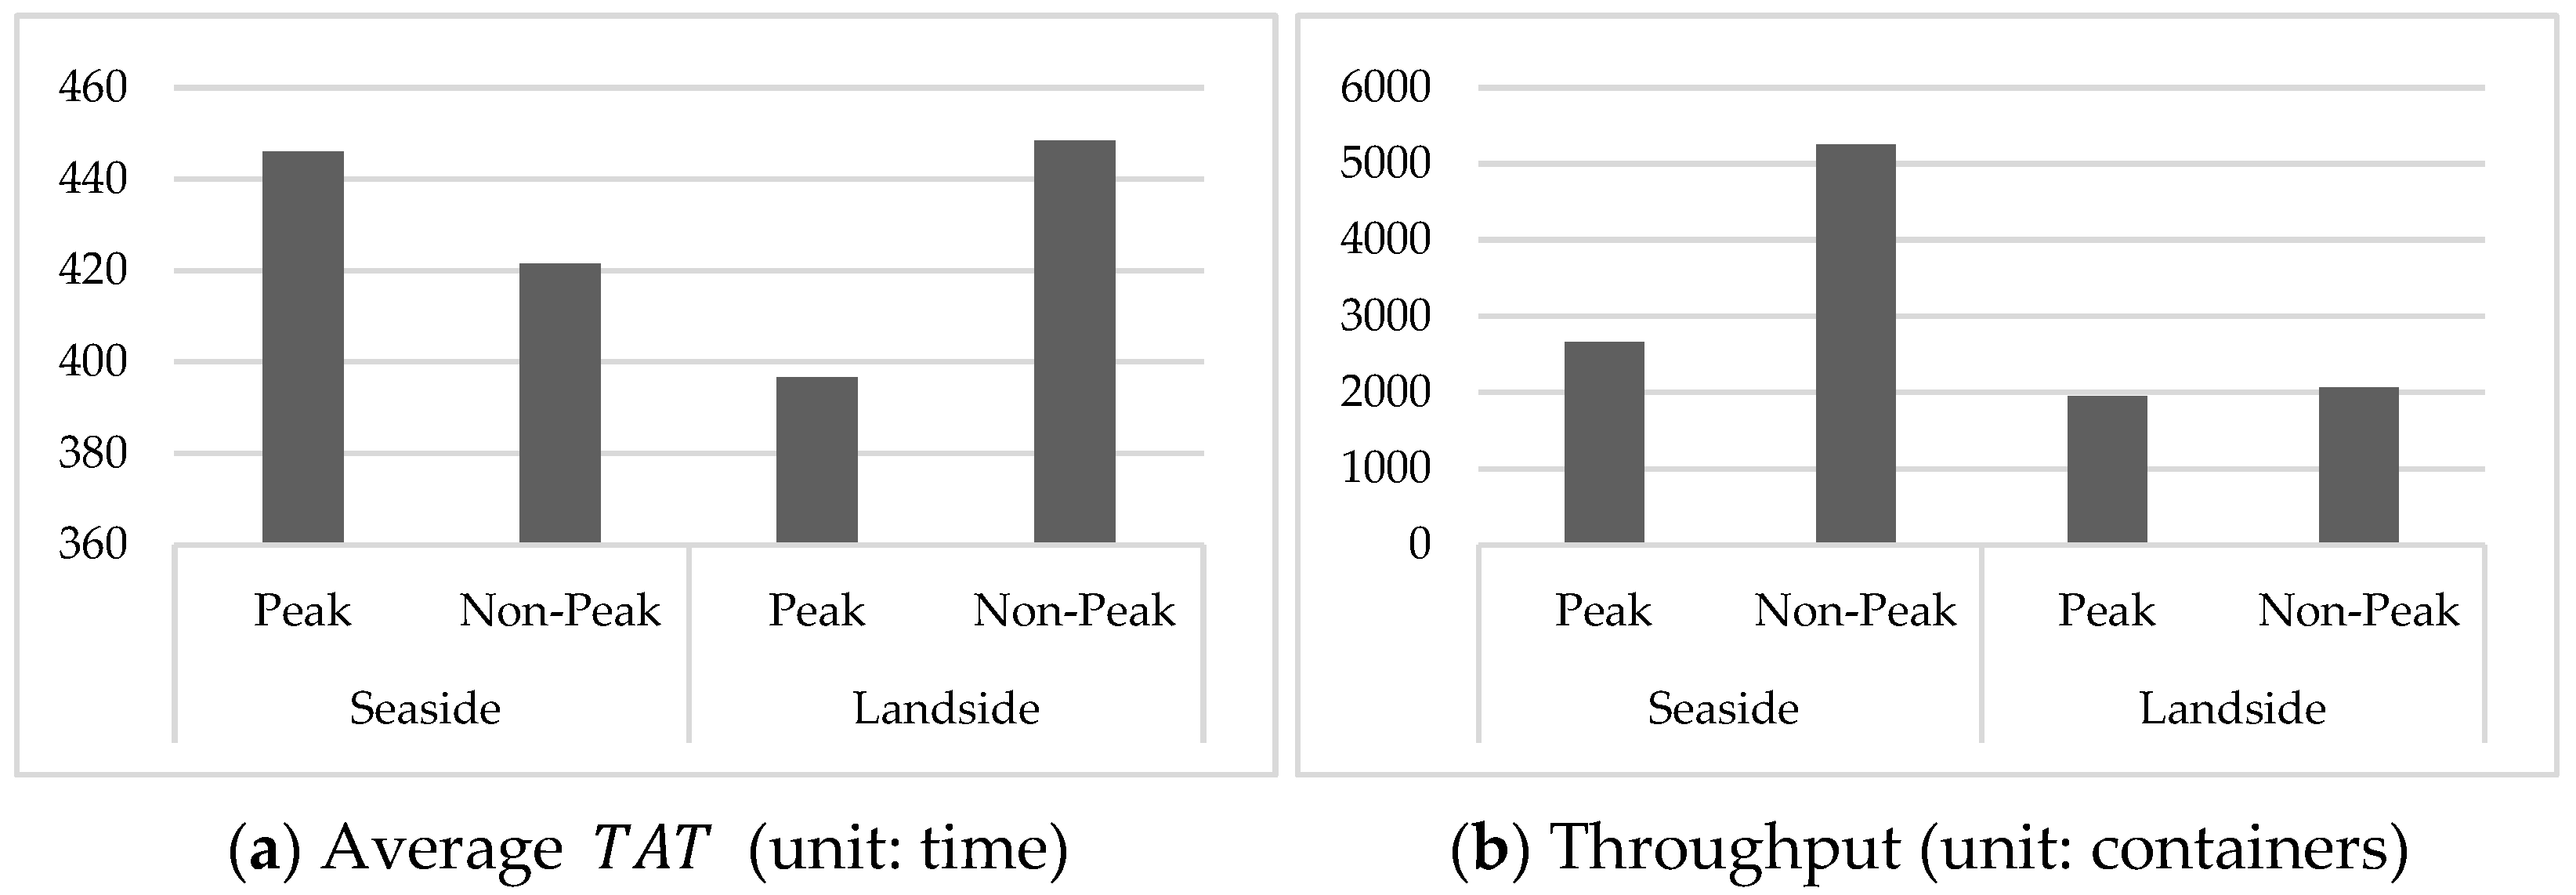
We compared the effects of peak time in each area. Even for seaside operations, we observed shorter average during non-peak times compared to peak times. Figure 17a indicates that although the incoming volume is relatively stable in seaside, the average is influenced by variations in landside workload. As workload increases, the average processing time also increases. Figure 17b reveals that on the landside, shorter is observed during peak times compared to non-peak times. It suggests that the algorithm performs better when the workload is sufficiently high.
Figure 17.
Average and Throughput in case 13.
We analyzed the algorithm’s effects in each spatial-temporal zone. We found that during peak times, the average is shorter in landside than seaside. Conversely, during non-peak times, seaside exhibits a shorter average .
All values in Figure 17 and Table 9 are expressed in seconds for and container throughput. For clarity of comparison, the numerical results in Table 9 are rounded to three decimal places.
Table 9.
In/Out Average (unit: time) and throughput (unit: containers) in case 13.
Seaside operations involve more container outbound tasks, while landside operations involve more container inbound tasks, resulting in differences in average processing times. In the case of seaside operations, they have a shorter average processing time compared to landside operations. This is because they handle a significantly higher volume and exhibit a more stable average processing rate across all times. Therefore, it can be inferred that this score-based allocation logic is more effective in environments where the workload remains constant.
6. Discussion
The numerical results demonstrate that the proposed score-based dispatching strategy consistently outperforms conventional rules such as FCFS, NFS, and their weighted combinations in terms of both average and maximum truck turnaround time. The improvement is particularly pronounced under high-workload conditions, where interference between twin YCs becomes more frequent. By incorporating distance, waiting time, processing time, and elasticity into a unified scoring framework, the method can balance short-term responsiveness with longer-term workload distribution.
Compared with traditional rule-based approaches that rely solely on distance or arrival order, the elasticity term plays a critical role in mitigating crane blocking. Even when two jobs are located at the same distance from a crane, the elasticity measure differentiates whether serving the job moves the crane toward or away from its criteria point, thereby favoring assignments that maintain separation between cranes. This behavior is not captured by conventional proximity costs or simple spatial penalties.
At the same time, the method remains considerably simpler than full optimization-based scheduling models. It does not require solving large-scale mixed-integer programs in real time and can therefore be implemented within existing TOS architectures. Nevertheless, the approach has limitations: the elasticity model assumes a single block with twin YCs and a fixed assignment of criteria points, and the GA-optimized weights are obtained offline under representative traffic conditions. Extending the approach to multiple blocks, more than two cranes, or online adaptation of weights would further enhance its applicability.
7. Conclusions
This paper proposed a score-based dispatching strategy for twin yard cranes that leverages a spring-inspired elasticity concept. The method evaluates each job by four normalized factors—distance, waiting time, processing time, and elasticity—and determines job priorities using a weighted score, with the factor weights optimized by a GA. A discrete-event simulation of a single RTGC block with twin cranes was developed to compare the proposed logic against FCFS, NFS, and hybrid FCFS + NFS rules. The results show that the proposed strategy achieves lower average and maximum truck turnaround times and higher throughput across a range of traffic scenarios, particularly when the system is heavily loaded.
In addition to improving performance, the elasticity-based formulation provides a transparent and interpretable mechanism for controlling crane movements and reducing interference, while remaining computationally light enough for real-time deployment. Future research will extend the approach to multi-block and multi-crane settings, investigate adaptive strategies that update weights online based on observed traffic patterns, and explore integration with digital-twin platforms for continuous monitoring and optimization of yard operations.
Author Contributions
Conceptualization, J.C.; methodology, J.C.; software, D.K.; validation, D.K. and J.C.; formal analysis, D.K.; investigation, D.K.; resources, D.K.; data curation, D.K.; writing—original draft preparation, D.K.; writing—review and editing, J.C.; visualization, D.K.; supervision, J.C.; project administration, J.C.; funding acquisition, J.C. All authors have read and agreed to the published version of the manuscript.
Funding
This research was supported by a grant from the R&D Program of the Ministry of Oceans and Fisheries (R&D ID: 20220582), titled ‘Development of automation and safety module for Rubber Tired Gantry Crane’.
Data Availability Statement
The raw data supporting the conclusions of this article will be made available by the authors on request.
Conflicts of Interest
Author Dokyung Kim was employed by the company Hyundai Glovis. Author Junjae Chae was employed by the company Jcolab Inc. The remaining authors declare that the research was conducted in the absence of any commercial or financial relationships that could be construed as a potential conflict of interest.
Abbreviations
The following abbreviations are used in this manuscript:
| RTGC | Rubber Tired Gantry Crane |
| RMGC | Rail Mounted Gantry Crane |
| FCFS | First Come First Serve |
| NFS | Nearest First Serve |
| QC | Quay Crane |
| YC | Yard Crane |
| YT | Yard Truck |
| GA | Genetic Algorithm |
| AGV | Automated Guided Vehicle |
| ALV | Automated Lifting Vehicle |
| BAP | Berth Allocation Problem |
| QCSP | Quay Crane Scheduling Problem |
| QCAP | Quay Crane Assignment Problem |
References
- ICC. 2023 Trade Report: A Fragmenting World. 2023. Available online: https://iccwbo.org/news-publications/policies-reports/icc-2023-trade-report-a-fragmenting-world/ (accessed on 4 July 2023).
- UNCTAD. Review of Maritime Transport 2023. 2023. Available online: https://shop.un.org/ (accessed on 4 July 2023).
- Kizilay, D.; Eliiyi, D.T. A comprehensive review of quay crane scheduling, yard operations and integrations thereof in container terminals. Flex. Serv. Manuf. J. 2021, 33, 1–42. [Google Scholar] [CrossRef] [Scilit]
- Zhen, L.; Jiang, X.; Lee, L.H.; Chew, E.P. A Review on Yard Management in Container Terminals. Ind. Eng. Manag. Syst. 2013, 12, 289–304. [Google Scholar] [CrossRef] [Scilit]
- Sha, M.; Zhang, T.; Lan, Y.; Zhou, X.; Qin, T.; Yu, D.; Chen, K. Scheduling optimization of yard cranes with minimal energy consumption at container terminals. Comput. Ind. Eng. 2017, 113, 704–713. [Google Scholar] [CrossRef] [Scilit]
- Global Industry Analysts Inc. Rubber Tired Gantry (RTG) Cranes-Global Strategic Business Report. 2023. Available online: https://www.researchandmarkets.com/reports/5304200/rubber-tired-gantry-rtg-cranes-global (accessed on 8 July 2023).
- Korea Maritime Institute. KMI International Logistics Weekly. 2020, Volume 530. Available online: https://www.withlogis.co.kr/bbs/board.php?bo_table=research_weekly&wr_id=544 (accessed on 4 July 2023).
- Kusakana, K. Optimal energy management of a retrofitted Rubber Tyred Gantry Crane with energy recovery capabilities. J Energy Storage 2021, 42, 103050. [Google Scholar] [CrossRef] [Scilit]
- Port Technology International. Automation in 2020 and Beyond. Port Technology International. Available online: https://www.porttechnology.org/news/automation-in-2020-and-beyond/ (accessed on 4 July 2023).
- Ng, W.C.; Mak, K.L. Yard crane scheduling in port container terminals. Appl. Math. Model. 2005, 29, 263–276. [Google Scholar] [CrossRef] [Scilit]
- Liu, W.; Zhu, X.; Wang, L.; Yan, B.; Zhang, X. Optimization approach for yard crane scheduling problem with uncertain parameters in container terminals. J. Adv. Transp. 2021, 2021, 5537114. [Google Scholar] [CrossRef] [Scilit]
- Covic, F. A literature review on container handling in yard blocks. In Lecture Notes in Computer Science (Including Subseries Lecture Notes in Artificial Intelligence and Lecture Notes in Bioinformatics); Springer: Berlin, Germany, 2018; pp. 139–167. [Google Scholar] [CrossRef] [Scilit]
- Bierwirth, C.; Meisel, F. A follow-up survey of berth allocation and quay crane scheduling problems in container terminals. Eur. J. Oper. Res. 2015, 244, 675–689. [Google Scholar] [CrossRef] [Scilit]
- Carlo, H.J.; Vis, I.F.A.; Roodbergen, K.J. Seaside operations in container terminals: Literature overview, trends, and research directions. Flex. Serv. Manuf. J. 2015, 27, 224–262. [Google Scholar] [CrossRef] [Scilit]
- He, J.; Tan, C.; Zhang, Y. Yard crane scheduling problem in a container terminal considering risk caused by uncertainty. Adv. Eng. Inform. 2019, 39, 14–24. [Google Scholar] [CrossRef] [Scilit]
- Carlo, H.J.; Vis, I.F.A.; Roodbergen, K.J. Transport operations in container terminals: Literature overview, trends, research directions and classification scheme. Eur. J. Oper. Res. 2014, 236, 1–13. [Google Scholar] [CrossRef] [Scilit]
- Karakas, S.; Kirmizi, M.; Kocaoglu, B. Correction to: Yard block assignment, internal truck operations, and berth allocation in container terminals: Introducing carbon-footprint minimisation objectives. Marit. Econ. Logist. 2021. [Google Scholar] [CrossRef] [Scilit]
- Yu, H.; Ge, Y.E.; Chen, J.; Luo, L.; Tan, C.; Liu, D. CO2 emission evaluation of yard tractors during loading at container terminals. Transp. Res. D Transp. Environ. 2017, 53, 17–36. [Google Scholar] [CrossRef] [Scilit]
- Carlo, H.J.; Vis, I.F.A.; Roodbergen, K.J. Storage yard operations in container terminals: Literature overview, trends, and research directions. Eur. J. Oper. Res. 2014, 235, 412–430. [Google Scholar] [CrossRef] [Scilit]
- Briskorn, D.; Zey, L. Interference aware scheduling of triple-crossover-cranes. J. Sched. 2020, 23, 465–485. [Google Scholar] [CrossRef] [Scilit]
- Blackstone, J.H.; Phillips, D.T.; Hogg, G.L. A state-of-the-art survey of dispatching rules for manufacturing job shop operations. Int. J. Prod. Res. 1982, 20, 27–45. [Google Scholar] [CrossRef] [Scilit]
- Huang, S.Y.; Li, Y.; Guo, X. Yard crane dispatching to minimize vessel turnaround times in container terminals. In Proceedings of the Winter Simulation Conference 2014, Seattle, WA, USA, 7–10 December 2014; IEEE: New York, NY, USA, 2014; pp. 1747–1758. [Google Scholar] [CrossRef] [Scilit]
- Guo, X.; Huang, S.Y.; Hsu, W.J.; Low, M.Y.H. Yard crane dispatching based on real time data driven simulation for container terminals. In Proceedings of the 2008 Winter Simulation Conference, Miami, FL, USA, 7–10 December 2008; IEEE: New York, NY, USA, 2008; pp. 2648–2655. [Google Scholar] [CrossRef] [Scilit]
- Petering, M.E.H. Real-time container storage location assignment at an RTG-based seaport container transshipment terminal: Problem description, control system, simulation model, and penalty scheme experimentation. Flex. Serv. Manuf. J. 2015, 27, 351–381. [Google Scholar] [CrossRef] [Scilit]
- Yu, X.; Tang, G.; Guo, Z.; Song, X.; Yu, J. Performance Comparison of Real-Time Yard Crane Dispatching Strategies at Nontransshipment Container Terminals. Math. Probl. Eng. 2018, 2018, 5401710. [Google Scholar] [CrossRef] [Scilit]
- Guo, P.; Cheng, W.; Wang, Y.; Boysen, N. Gantry crane scheduling in intermodal rail-road container terminals. Int. J. Prod. Res. 2018, 56, 5419–5436. [Google Scholar] [CrossRef] [Scilit]
- Li, J.; Yang, J.; Xu, B.; Yin, W.; Yang, Y.; Wu, J.; Zhou, Y.; Shen, Y. A Flexible Scheduling for Twin Yard Cranes at Container Terminals Considering Dynamic Cut-Off Time. J. Mar. Sci. Eng. 2022, 10, 675. [Google Scholar] [CrossRef] [Scilit]
- Zheng, F.; Man, X.; Chu, F.; Liu, M.; Chu, C. Two Yard Crane Scheduling with Dynamic Processing Time and Interference. IEEE Trans. Intell. Transp. Syst. 2018, 19, 3775–3784. [Google Scholar] [CrossRef] [Scilit]
- Zhang, X.; Li, H.; Sheu, J.-B. Integrated scheduling optimization of AGV and double yard cranes in automated container terminals. Transp. Res. Part B Methodol. 2024, 179, 102871. [Google Scholar] [CrossRef] [Scilit]
- Zhou, C.; Wang, W.; Li, H. Container reshuffling considered space allocation problem in container terminals. Transp. Res. E Logist. Transp. Rev. 2020, 136, 101869. [Google Scholar] [CrossRef] [Scilit]
- Zey, L.; Briskorn, D.; Boysen, N. Twin-crane scheduling during seaside workload peaks with a dedicated handshake area. J. Sched. 2022, 25, 3–34. [Google Scholar] [CrossRef] [Scilit]
- Oladugba, A.; Ajayi, O. An integrated solution approach for the steady-state modelling of the twin yard crane operation in automated container terminals. SSRN Electron. J. 2024. [Google Scholar] [CrossRef] [Scilit]
- Wang, X.; Liu, Y.; Zhao, Z.; Wang, Y. A generalized yard crane scheduling problem considering input/output point assignment and crane congestion. Eur. J. Oper. Res. 2025, 321, 1–15. [Google Scholar] [CrossRef] [Scilit]
- Kim, T.; Ryu, K.R. Deriving Situation-Adaptive Policy for Container Stacking in an Automated Container Terminal. Appl. Sci. 2022, 12, 3892. [Google Scholar] [CrossRef] [Scilit]
- Ambrosino, D.; Xie, H. Optimization approaches for defining storage strategies in maritime container terminals. Soft Comput. 2023, 27, 4125–4137. [Google Scholar] [CrossRef] [Scilit]
- Applied Materials, Inc. Applied AutoMod® 12.6.1 User’s Guide; Applied Materials, Inc.: Santa Clara, CA, USA, 2015. [Google Scholar]



Disclaimer/Publisher’s Note: The statements, opinions and data contained in all publications are solely those of the individual author(s) and contributor(s) and not of MDPI and/or the editor(s). MDPI and/or the editor(s) disclaim responsibility for any injury to people or property resulting from any ideas, methods, instructions or products referred to in the content. |
© 2026 by the authors. Licensee MDPI, Basel, Switzerland. This article is an open access article distributed under the terms and conditions of the Creative Commons Attribution (CC BY) license.