3.1. Crested Porcupine Optimizer (CPO) Optimization
The Support Vector Machine (SVM) was proposed by Cortes and Vapnik in 1995 and shows many unique advantages in solving small samples and in nonlinear and high-dimensional pattern recognition, and it can be generalized to other machine learning problems such as function fitting [
23]. In this study, for each working condition point there are 25 sets of experimental data. Therefore, in the case of fewer data samples, it is obvious that SVM is more advantageous compared to other machine learning methods such as neural networks.
Most machine learning algorithms have a number of parameters that can be tuned, called hyperparameters. Hyperparameters are very important in building effective and accurate models. They help us find a balance between bias and variance, thus preventing the model from overfitting or underfitting. In order to improve the predictive accuracy of SVM models, it is necessary to find the optimal hyperparameter penalty coefficient C, as well as the kernel function coefficient gamma.
The Crested Porcupine Optimizer (CPO) algorithm was proposed by Mohamed Abdel-Basset and, along with the Particle Swarm Optimization (PSO) algorithm, is a population-based algorithm. Population-based algorithms have advantages over single-based algorithms due to their strong search space and global optimum. In addition, the core advantage of CPO and PSO optimization of SVM is its global search capability, efficiency and ease of use, and it is especially suitable for complex kernel function parameter optimization and small sample scenarios. Its robustness can be further enhanced when combined with hybrid strategies or adaptive improvement. Therefore, it will be combined with genetic algorithm in the subsequent optimization process to avoid overfitting. However, the CPO algorithm is more effective than its counterparts in terms of average fitness, standard deviation, convergence curve and computational cost [
24]. Therefore, in this paper, the CPO algorithm is used to optimize the hyperparameters of the SVM model and the optimization results are compared with those of the PSO algorithm.
The CPO optimization algorithm combines exploration and exploitation mechanisms by visualizing the search space. The first two of these defense strategies (vision and sound) correspond to exploratory behaviors, and the last two (odor and physical attack) correspond to exploitative behaviors. The algorithm is similar to other population metaheuristics in that the search is initiated from an initial set of candidate solutions and the quality of individuals is evaluated by an objective function.
The optimization problem consists of multiple dimensions, all of which need to be applied to minimize or maximize. The CPO algorithm begins by randomly initializing the dimensions within the search space of each problem, as shown in Equation (1).
where
denotes the number of individuals (population size),
is the
ith candidate solution in the search space,
and
are the lower and upper boundaries of the search range, respectively, and
is a vector randomly initialized between 0 and 1. The initial population can be represented by Equation (2).
where
X is the population matrix,
is the
ith member of the population.
denotes the
jth position of the ith solution,
is the number of candidate solutions and d denotes the size of the dimension of the given problem.
The CPO optimization algorithm introduces a cyclic population reduction technique designed to accelerate convergence and maintain population diversity. The technique simulates a mechanism whereby only threatened population members initiate a defense response. During the optimization process, some of the population members are temporarily withdrawn to accelerate convergence and subsequently reintroduced to enhance diversity and avoid local optima. This cyclic process is controlled by the variable
T, which determines the number of executions. The mathematical expression for population size reduction is given in Equation (3).
where
T is the variable that determines the number of cycles,
t is the current number of function evaluations,
is the maximum number of function evaluations, % stands for the remainder or modulus operator and
is the minimum number of individuals in the newly generated population, i.e., the size of the population must not be smaller than
.
In the exploration phase of the CPO optimization algorithm, population members adopt two defense strategies based on predator distance: a visual strategy and an acoustic strategy. In the first strategy, population members create the illusion of larger size by lifting and flapping their feathers, forcing the predator to choose between approaching or moving away. If the predator moves closer, the distance between the two decreases, promoting local area exploration to accelerate convergence; if the predator moves away, the distance is maximized, promoting the search of unexplored areas for potential solutions. This behavior is simulated by generating random values through a normal distribution, the mathematical expression of which is shown in Equation (4).
where
is the optimal solution of the function evaluating
t,
is a vector generated between the current population member and a randomly selected population member from the population, representing the position of the predator at iteration
t,
is a random number based on a normal distribution and
is a random value in the interval [0, 1].
can be expressed by Equation (5):
where
r is a random number between [1, N]. This equation provides the CPO optimization algorithm with a strong potential to cover the entire search space as much as possible, thus avoiding falling into local minima.
The second defense strategy is as follows: in this strategy, members of the population use acoustic methods to create noise and threaten predators. When a predator approaches, the porcupine’s voice becomes louder. To model this behavior mathematically, it is represented using Equation (6):
where
and
are two random integers between [1, N] and
is a random value generated between 0 and 1.
In the development phase of the CPO optimization algorithm, when a predator approaches, the population members employ odor and physical attack strategies that focus on local search to exploit potential areas.
The CPO algorithm uses these strategies to approximate the optimal solution in the search space. In the third strategy, population members secrete foul odors to discourage predators from approaching, the mathematical simulation of which is shown in Equation (7):
where
is a random number between [1, N],
is a parameter controlling the search direction, defined by Equation (8),
is the position of the
ith individual at iteration
t,
is a defense factor defined by Equation (9),
is the odor diffusion factor, defined by Equation (10).
where
denotes the value of the objective function of the ith individual at iteration
t,
is a small value to avoid division by zero,
is a vector containing random numbers between 0 and 1,
is a random number between 0 and 1,
N is the population size,
t is the current number of iterations, and
is the maximum number of iterations. The vector
simulates three scenarios: (1) when
= 0, the predator stops moving and the population members stop spreading odors at the same distance, (2) when
= 1, the population members release noticeable odors and (3) when
is a combination of 0 and 1, the predator maintains a safe distance from the population members without the need to release large amounts of odors.
The fourth defense strategy is physical attack. When a predator approaches, members of the population attack with short, thick feathers, simulating a one-dimensional inelastic collision. Its mathematical expression is shown in Equation (11).
where
is the optimal solution, denoting the population member,
is the position of the ith individual at iteration
t, denoting the predator at that position,
is the convergence rate factor,
is a random value in the interval [0, 1] and
is the average force affecting the ith predator’s population member, as provided by the non-elastic collision law given by Equation (12):
where
is the mass of the ith individual (predator) at iteration
t,
denotes the objective function,
is the final velocity of the
ith individual at the next iteration
t + 1, assigned according to a random solution chosen from the current population,
is the initial velocity of the
ith individual at iteration
t,
is the current number of iterations and
is a vector including random values between 0 and 1.
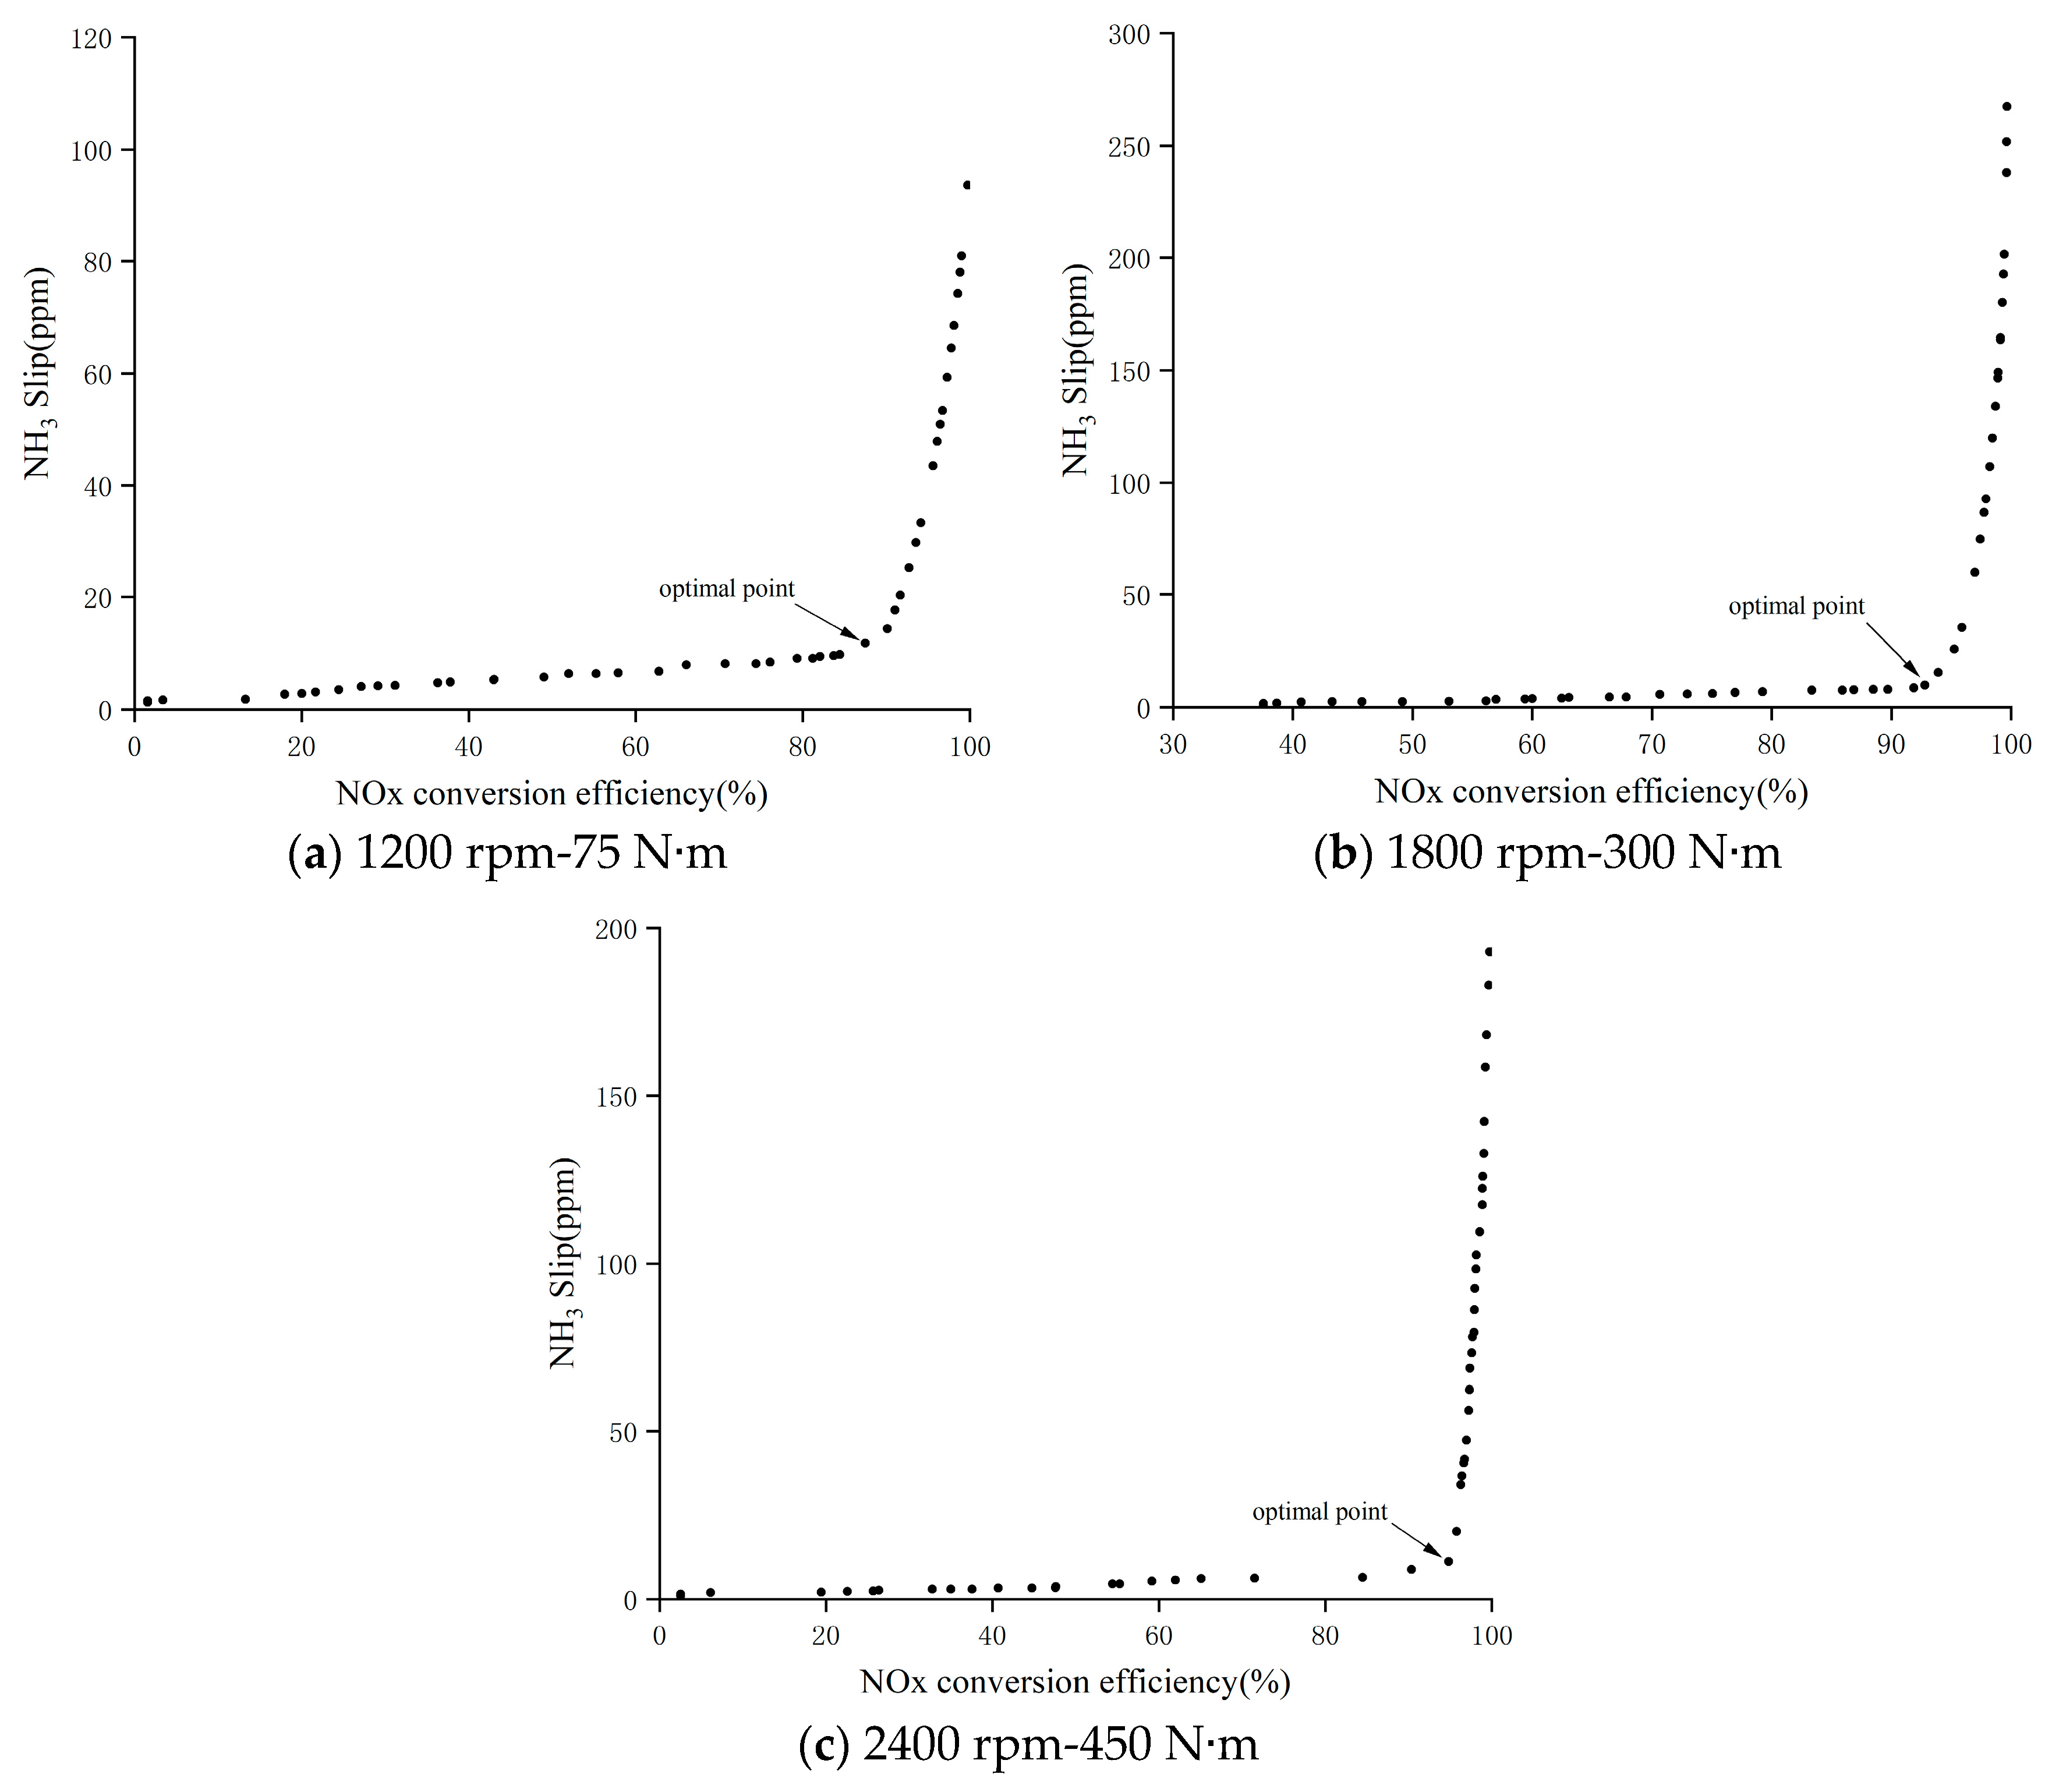
In the SCR system, the parameters affecting the NOx conversion efficiency are mainly the SCR inlet temperature, exhaust flow rate, SCR inlet NOx concentration and urea injection volume. Therefore, these four data points are selected as input parameters of the SVM model for each condition, and the output parameters are NOx conversion efficiency and NH
3 slip. The output parameter NH
3 slip is the NH
3 slip before ASC, and the NH
3 slip after ASC is not selected because it is more difficult to observe the NH
3 slip when the urea injection volume is low. in order not to affect the prediction accuracy of the SVM model for the NH
3 slip, the NH
3 slip before ASC is selected as the output parameter of the model. The NOx conversion efficiency is calculated by Equation (13).
where
is the NOx conversion efficiency, %,
and
are SCR inlet and outlet NOx concentrations, respectively, ppm.
Of the 25 sets of data for each operating condition, a randomized division was used to divide the dataset in order to eliminate the subjective errors of manual division. A total of 70% of the data (18 sets) were selected to train the SVM model, and the remaining 30% (7 sets) were used to test it. Before training the model, the four input parameters have different magnitudes; in order not to affect the model training results and eliminate the effect of magnitude, the input parameters are normalized using Equation (14). Taking 1800 rpm-300 N
m as an example, 25 sets of test data are shown in
Table 5.
where
is the sample data,
is the maximum value of the sample data and
is the minimum value of the sample data.
In support vector machines (SVMs), the penalty coefficient C and the kernel function coefficient gamma are the two most critical tuning parameters, both of which directly affect the classification performance and generalization ability of the model. The penalty coefficient C is defined to control the penalty strength of classification error and balance the model complexity and training error. The kernel coefficient gamma is defined to control the “width” of the Gaussian kernel function, which determines the influence of a single sample. Both parameters can be set when building the SVM model. In this paper, in order to find the optimal penalty coefficient C and kernel coefficient gamma, these two parameters are used as the parameters to be optimized; the empirical range of values for these two parameters is [10−2, 103]. Both parameters have an upper bound of 1000 and a lower bound of 0.01, and their values are real numbers. The population size for both optimizations was 20 and the number of iterations was 50. Finally, the model was evaluated using the coefficient of determination R2 and Root Mean Square Error (RMSE).
In order to compare the optimization of the two algorithms, three working conditions, 1200 rpm-75 N
m, 1800 rpm-300 N
m, 2400 rpm-450 N
m, were selected to show the results of the optimization among all the working conditions.
Table 6 lists the optimal parameter penalty coefficients C and the kernel function coefficients gamma.
Figure 2 and
Figure 3 show the test results with NOx conversion efficiency and NH
3 slip as SVM model outputs, respectively. For model accuracy, the coefficient of determination R
2 and RMSE were used to assess the model accuracy, as shown in
Table 7 and
Table 8. For the prediction of NOx conversion efficiency, it can be seen that the CPO optimization algorithm as well as the PSO optimization algorithm are able to make accurate predictions of NOx conversion efficiency under the three operating conditions. The coefficient of determination R
2 of the SVM model optimized by the CPO optimization algorithm is above 0.98 and RMSE for the three conditions is 0.76, while the coefficient of determination R
2 of the SVM model optimized by the PSO optimization algorithm is about 0.96 and the RMSE for the three conditions is 2.05. It can be seen that the SVM model optimized by the CPO optimization algorithm can predict the NOx conversion efficiency accurately as compared with that of the PSO optimization algorithm; the SVM model has higher prediction accuracy for NOx conversion efficiency.
For the prediction of NH3 slip, the CPO optimization algorithm is still able to accurately predict the NH3 slip under the three operating conditions. On the other hand, the PSO optimization algorithm was able to predict the NH3 slip more accurately only at 2400 rpm-450 Nm, and the prediction of NH3 slip for the other two conditions, especially at 1200 rpm-75 Nm, had a large deviation. This phenomenon may be due to the fact that the established SVM model has two output parameters, and the PSO optimization algorithm is unable to find the optimal parameters that can take into account the two output parameters, so the prediction accuracy of the NOx conversion efficiency is first considered when optimizing the model using the PSO algorithm. Compared with the PSO optimization algorithm, the CPO optimization algorithm has the ability to extensively explore the search space (which enables it to avoid falling into local minima) and to protect population diversity based on the novel cyclic population reduction mechanism, which enables it to find the optimal parameter that can take into account the two output parameters within the specified parameter range, allowing it to accurately predict both output parameters. Therefore, the SVM model optimized by the CPO optimization algorithm can be used for the prediction of NOx conversion efficiency and NH3 slip.


