Article

Dynamic Simulation and Characteristic Analysis on Freezing Process in Ballast Tanks of Polar LNG Carriers

School of Naval Architecture and Ocean Engineering, Jiangsu University of Science and Technology, Zhenjiang 212003, China
*
Author to whom correspondence should be addressed.
Appl. Sci. 2025, 15(9), 5192; https://doi.org/10.3390/app15095192
Submission received: 10 April 2025 / Revised: 3 May 2025 / Accepted: 5 May 2025 / Published: 7 May 2025
(This article belongs to the Section Marine Science and Engineering)

Abstract

:
The ballast tank is a critical system for LNG carriers, ensuring structural safety and stability during navigation. When LNG carriers navigate in polar regions, the ballast tank is prone to freezing, which will reduce the efficiency of ballast water circulation. Furthermore, the freezing process generates frost heaving forces that may damage the walls of the ballast tank, shorten the structure’s service life, and disrupt the ship’s normal operations. Therefore, analyzing the freezing process of ballast tanks is essential. This paper focuses on the ballast tank of a polar LNG carrier as the research subject. It assumes that the ballast water is fresh water with unchanging physical properties and takes into account the environmental conditions in polar regions. A numerical simulation model of the freezing process within the ballast tank is established. This study investigates the influence of various environmental parameters on the freezing process and determines the evolution of ice shape in relation to temperature field changes under different environmental conditions. The results indicate that as the ambient temperature decreases, the rate of temperature reduction at the ballast water level accelerates, resulting in a thicker ice layer formed by freezing. Additionally, as the seawater temperature decreases, the rate of temperature decline in the ballast water at the bulkhead is significantly accelerated, leading to an increased rate of ice shape evolution. Furthermore, a reduction in the height of the ballast water level enhances the heat transfer rate of the ballast water, which markedly increases the degree of freezing in the ballast water.

1. Introduction

In recent years, global warming has accelerated the melting of Arctic sea ice, enhancing the navigability of the region to some extent [1]. Simultaneously, the Arctic is abundant in natural gas resources; according to a report by the U.S. Geological Survey, the undeveloped natural gas reserves in the Arctic account for 30% of the global total [2]. As a result, navigation and resource development in the polar region have increasingly become a focal point of interest for countries worldwide.
The vigorous development of polar resources is accompanied by significant risks for ships operating in polar regions, including material failure, harsh environmental conditions, structural ice accumulation, and other hazards. Due to the unique geographic environment of polar regions, structures such as ballast water tanks are prone to freezing phenomenon, and ballast water freezing is extremely hazardous to ships but is often easily ignored [3]. The freezing of ballast water will form the ice layer, and the ice layer will have an expansion effect on the structure; during the freezing process, it will be constrained by the bulkhead, which will exert a freezing expansion force on the structure, and when the temperature of the ice layer rises, the ice layer will exert a temperature expansion force, which will have a certain effect on the structure and reduce the service life of the structure [4,5]. Additionally, ice accumulation increases the weight of the ship, raises its center of gravity, and prolongs the duration of transverse rocking, all of which compromise the safety and stability of the vessel and may lead to serious safety incidents [6]. Therefore, to ensure the safety of the ship and its crew, it is essential to conduct comprehensive studies on the icing of ballast tanks in LNG carriers operating in cold regions.
Ballast water tank icing analysis can be mainly divided into temperature field analysis and ballast water freezing analysis.
At this stage, the analysis of the temperature field in ballast water tanks has developed into a more comprehensive research framework. Zhu et al. conducted a study on the temperature field of floating LNG membrane tanks in harsh environments, analyzing the effects of various heating system states, double-row tank spacing, and water injection in both the middle and longitudinal compartments on the temperature field [7]. Ding et al. employed finite element analysis software to investigate the temperature field distribution of the hull, support structure, and compartments of LNG ships. They identified the temperature field distribution patterns of the compartments under different structural configurations, providing valuable data for the low-temperature design of LNG ship compartments [8,9,10]. Lu et al. utilized computational fluid dynamics (CFD) methods to examine the coupled heat transfer characteristics and temperature field distribution of the cargo sealing system (CCS) and the liquid cargo hold. By integrating the volume of fluid (VOF) model, they determined the variations in the temperature and velocity fields within the hold [11,12,13].
At present, basic research on the issue of ballast water freezing remains limited, and the research framework has yet to be fully developed. However, in the realm of freezing challenges related to marine structures—such as ice pools, wind turbine blades, and ships—scholars have conducted extensive studies and achieved significant results, which offer valuable insights for the investigation of ballast water freezing. In the area of ice pool freezing research, Rosenau et al. developed a predictive model for ice growth based on ice pools in Hamburg, Germany, which provided data on the growth rate and final thickness of the ice [14]. Fatahillah et al. employed the finite volume method to numerically simulate the freezing process in a saltwater pond, obtaining the distribution characteristics of the ice thickness and temperature under varying water temperatures. This research provides valuable insights for managing icing in ice ponds [15,16]. Huo et al. investigated the growth and disappearance of lake ice, using Lake Ulansu as a case study, and identified the patterns of change in ice thickness and temperature [17].
In the field of freezing research related to ship structures, Zhang et al. conducted experimental research and numerical simulations to analyze the distribution of wind turbine blade icing under offshore environmental conditions. They investigated the impact of icing on the aerodynamic performance of wind turbine blades [18,19]. Gao et al. performed experimental studies on the changes in the aerodynamic performance of wind turbine blades during dynamic icing, establishing a relationship between performance degradation due to ice accumulation and the blade model [20]. Xu et al. examined the effects of ice crystal growth on the performance of heat exchangers under various dimensionless conditions, identifying the optimal environmental conditions for their operation [21]. Mintu et al. executed numerical simulations on the icing of ship superstructures and polar offshore platforms, determining the ice shape distribution and icing characteristics of different structures in polar environments [22,23]. Given the complex environmental conditions within a ship’s ballast water tank, this paper employs numerical simulation methods to study and analyze the freezing process in the ballast water tank.
In summary, numerous scholars have conducted extensive research on the mechanisms, phenomena, and laws of icing. However, the study of ice shape evolution in the ballast tanks of polar ships remains limited, with many issues still requiring further investigation. Unlike the freezing processes observed in indoor ice pools, the environmental conditions in polar regions are complex and harsh. These conditions include significant temperature fluctuations, high humidity levels within the cabin, and the presence of various impurities in ballast water, all of which complicate the prediction of ice shape evolution. To explore the variation in the temperature field and the evolution of ice shape in ballast tanks under polar environmental conditions, this paper analyzes ice growth by integrating the volume fraction equation with a phase-change heat and mass transfer model. Additionally, it examines the temperature field variation in ballast tanks under different environmental parameters. Based on the characteristics of the temperature field, the trends and patterns of ice shape evolution are presented.
This study focuses on the ballast tank of a polar LNG carrier as the research subject. Taking into account the environmental and climatic conditions in polar regions, we utilize Fluent 2022 fluid calculation software to integrate interphase mass, momentum, and heat transfer models into the Volume of Fluid (VOF) multiphase flow model. A numerical model for the freezing of ballast water is established, and the freezing process is simulated. The main research contents of this paper are as follows: Section 2 introduces the physical model of heat and mass transfer in the ballast tank. It elaborates on the fundamental theory and control equations used in the numerical calculations, as well as the boundary conditions for these calculations. Additionally, it outlines the numerical calculation process and verifies the reliability of the numerical model. Finally, Section 3 analyzes the variations in the temperature field and ice formation under different environmental parameters, revealing how changes in the temperature field influence the evolution of ice shape.

2. Materials and Methods

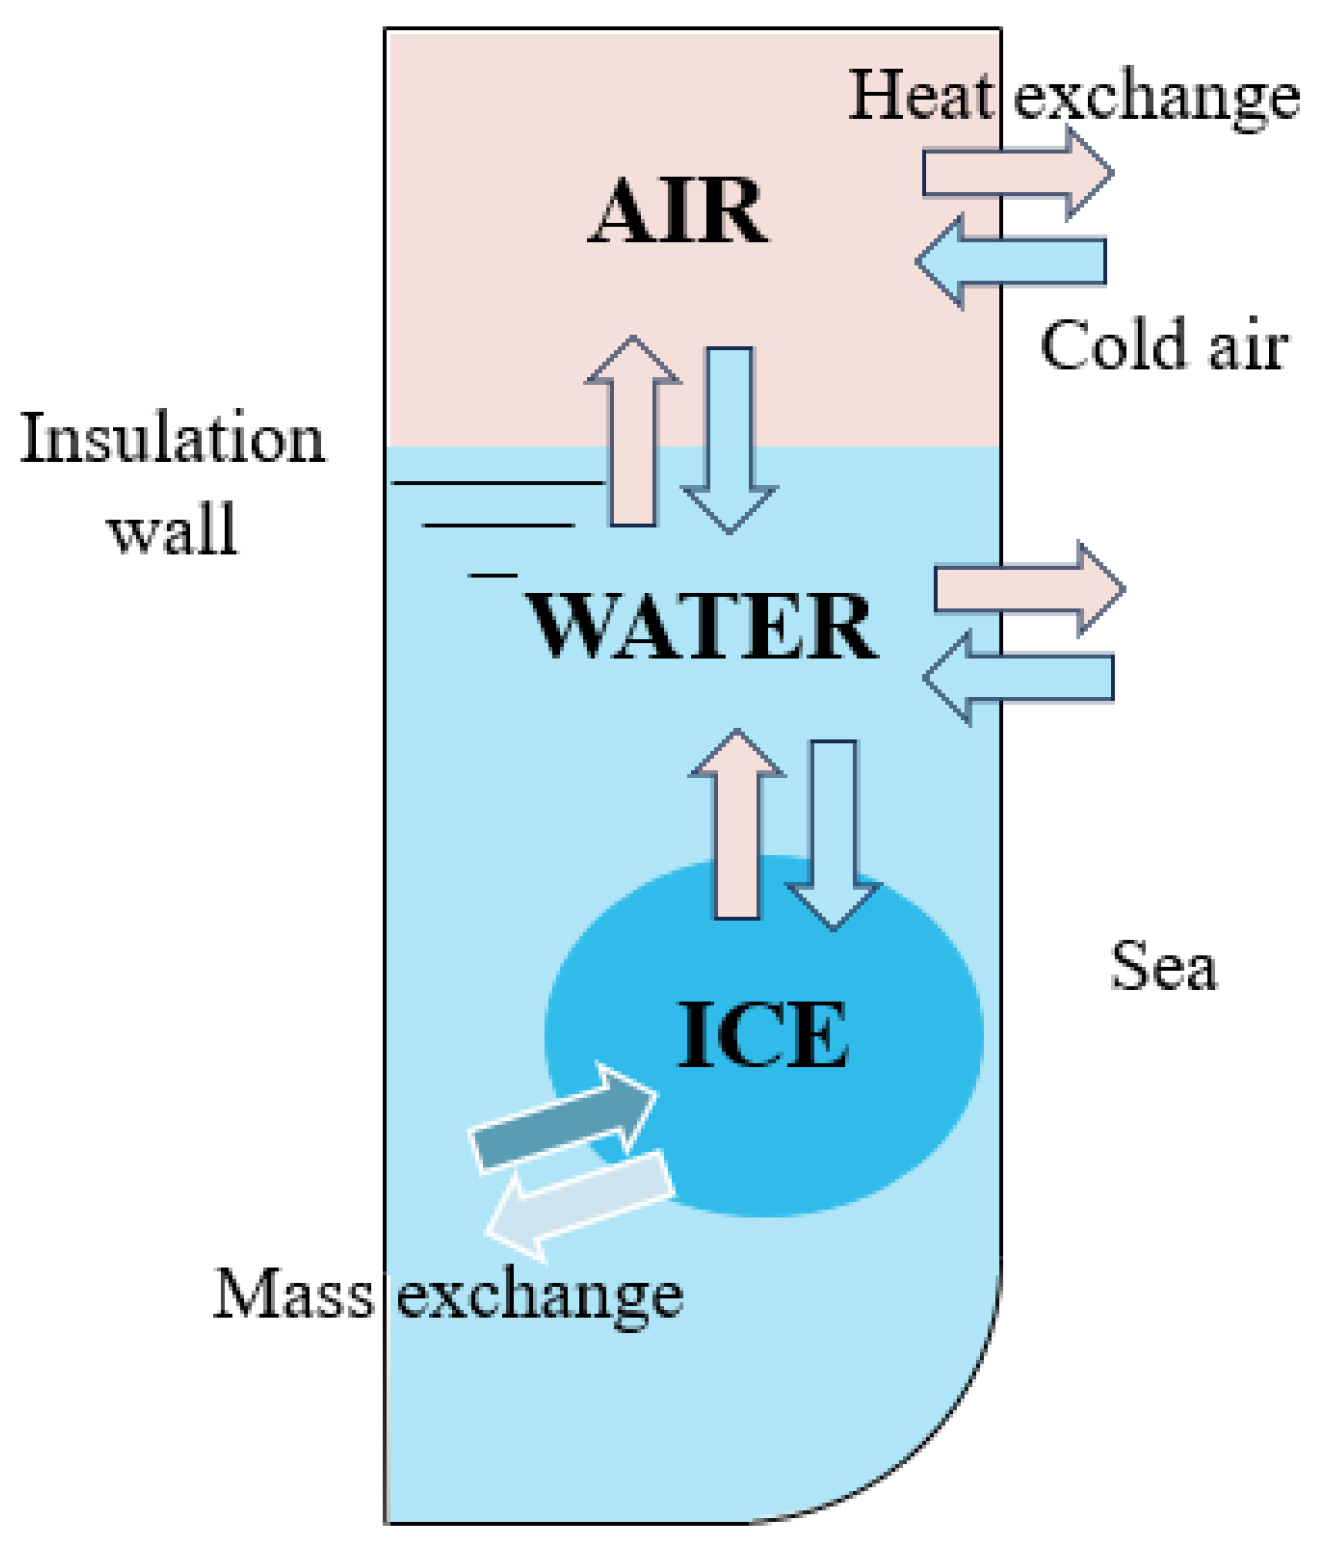
2.1. Presentation of Heat Transfer Model in Ballast Tank

During the navigation of ships in polar regions, the temperature of ballast water and cabin air is typically maintained above 0 °C. When the external environmental temperature fluctuates, a more complex heat exchange occurs between the ballast tank and the surrounding environment. Heat transfer in the ballast tank primarily occurs through three mechanisms: conduction, convection, and radiation. However, since the ballast tank is a closed structure and the effects of airflow and thermal radiation can be disregarded, the primary modes of heat transfer within the ballast tank are conduction and convection.
When the ambient temperature decreases, a temperature difference develops between the external environment and the ballast tank. During this period, forced convection heat transfer occurs between the air within the ballast tank and the external environment, as well as between the ballast water and the surrounding seawater. Furthermore, when the ballast tank is not fully loaded, a volume of air remains above the ballast water. Due to the low specific heat capacity of air, the temperature changes significantly, leading to natural convection heat transfer between the air in the ballast tank and the ballast water. This results in a decrease in the temperature of the ballast water [24].
When the temperature of ballast water drops below the freezing point, as illustrated in Figure 1, the water freezes, forming an ice layer. This process involves heat and material exchanges, primarily characterized by heat migration and water movement. Due to the high thermal conductivity of ice, heat transfer within the ice layer is accelerated. Simultaneously, convective heat transfer occurs between the ice layer and the ballast water, as well as between the ice layer and the air. This transfer of heat is the primary reason for the freezing of the ballast water [25,26]. Consequently, this paper focuses on the ballast tank as the research subject to investigate the influence of various environmental parameters on the evolution of ice shape during the freezing process within the ballast tank. A schematic diagram illustrating the heat and mass transfer between different phases in the ballast tank is presented in Figure 2. Among them, points A and B play the role of constraining the line segment, and point C indicates the magnitude of the pressure when the water and gas phases are in equilibrium at this temperature.

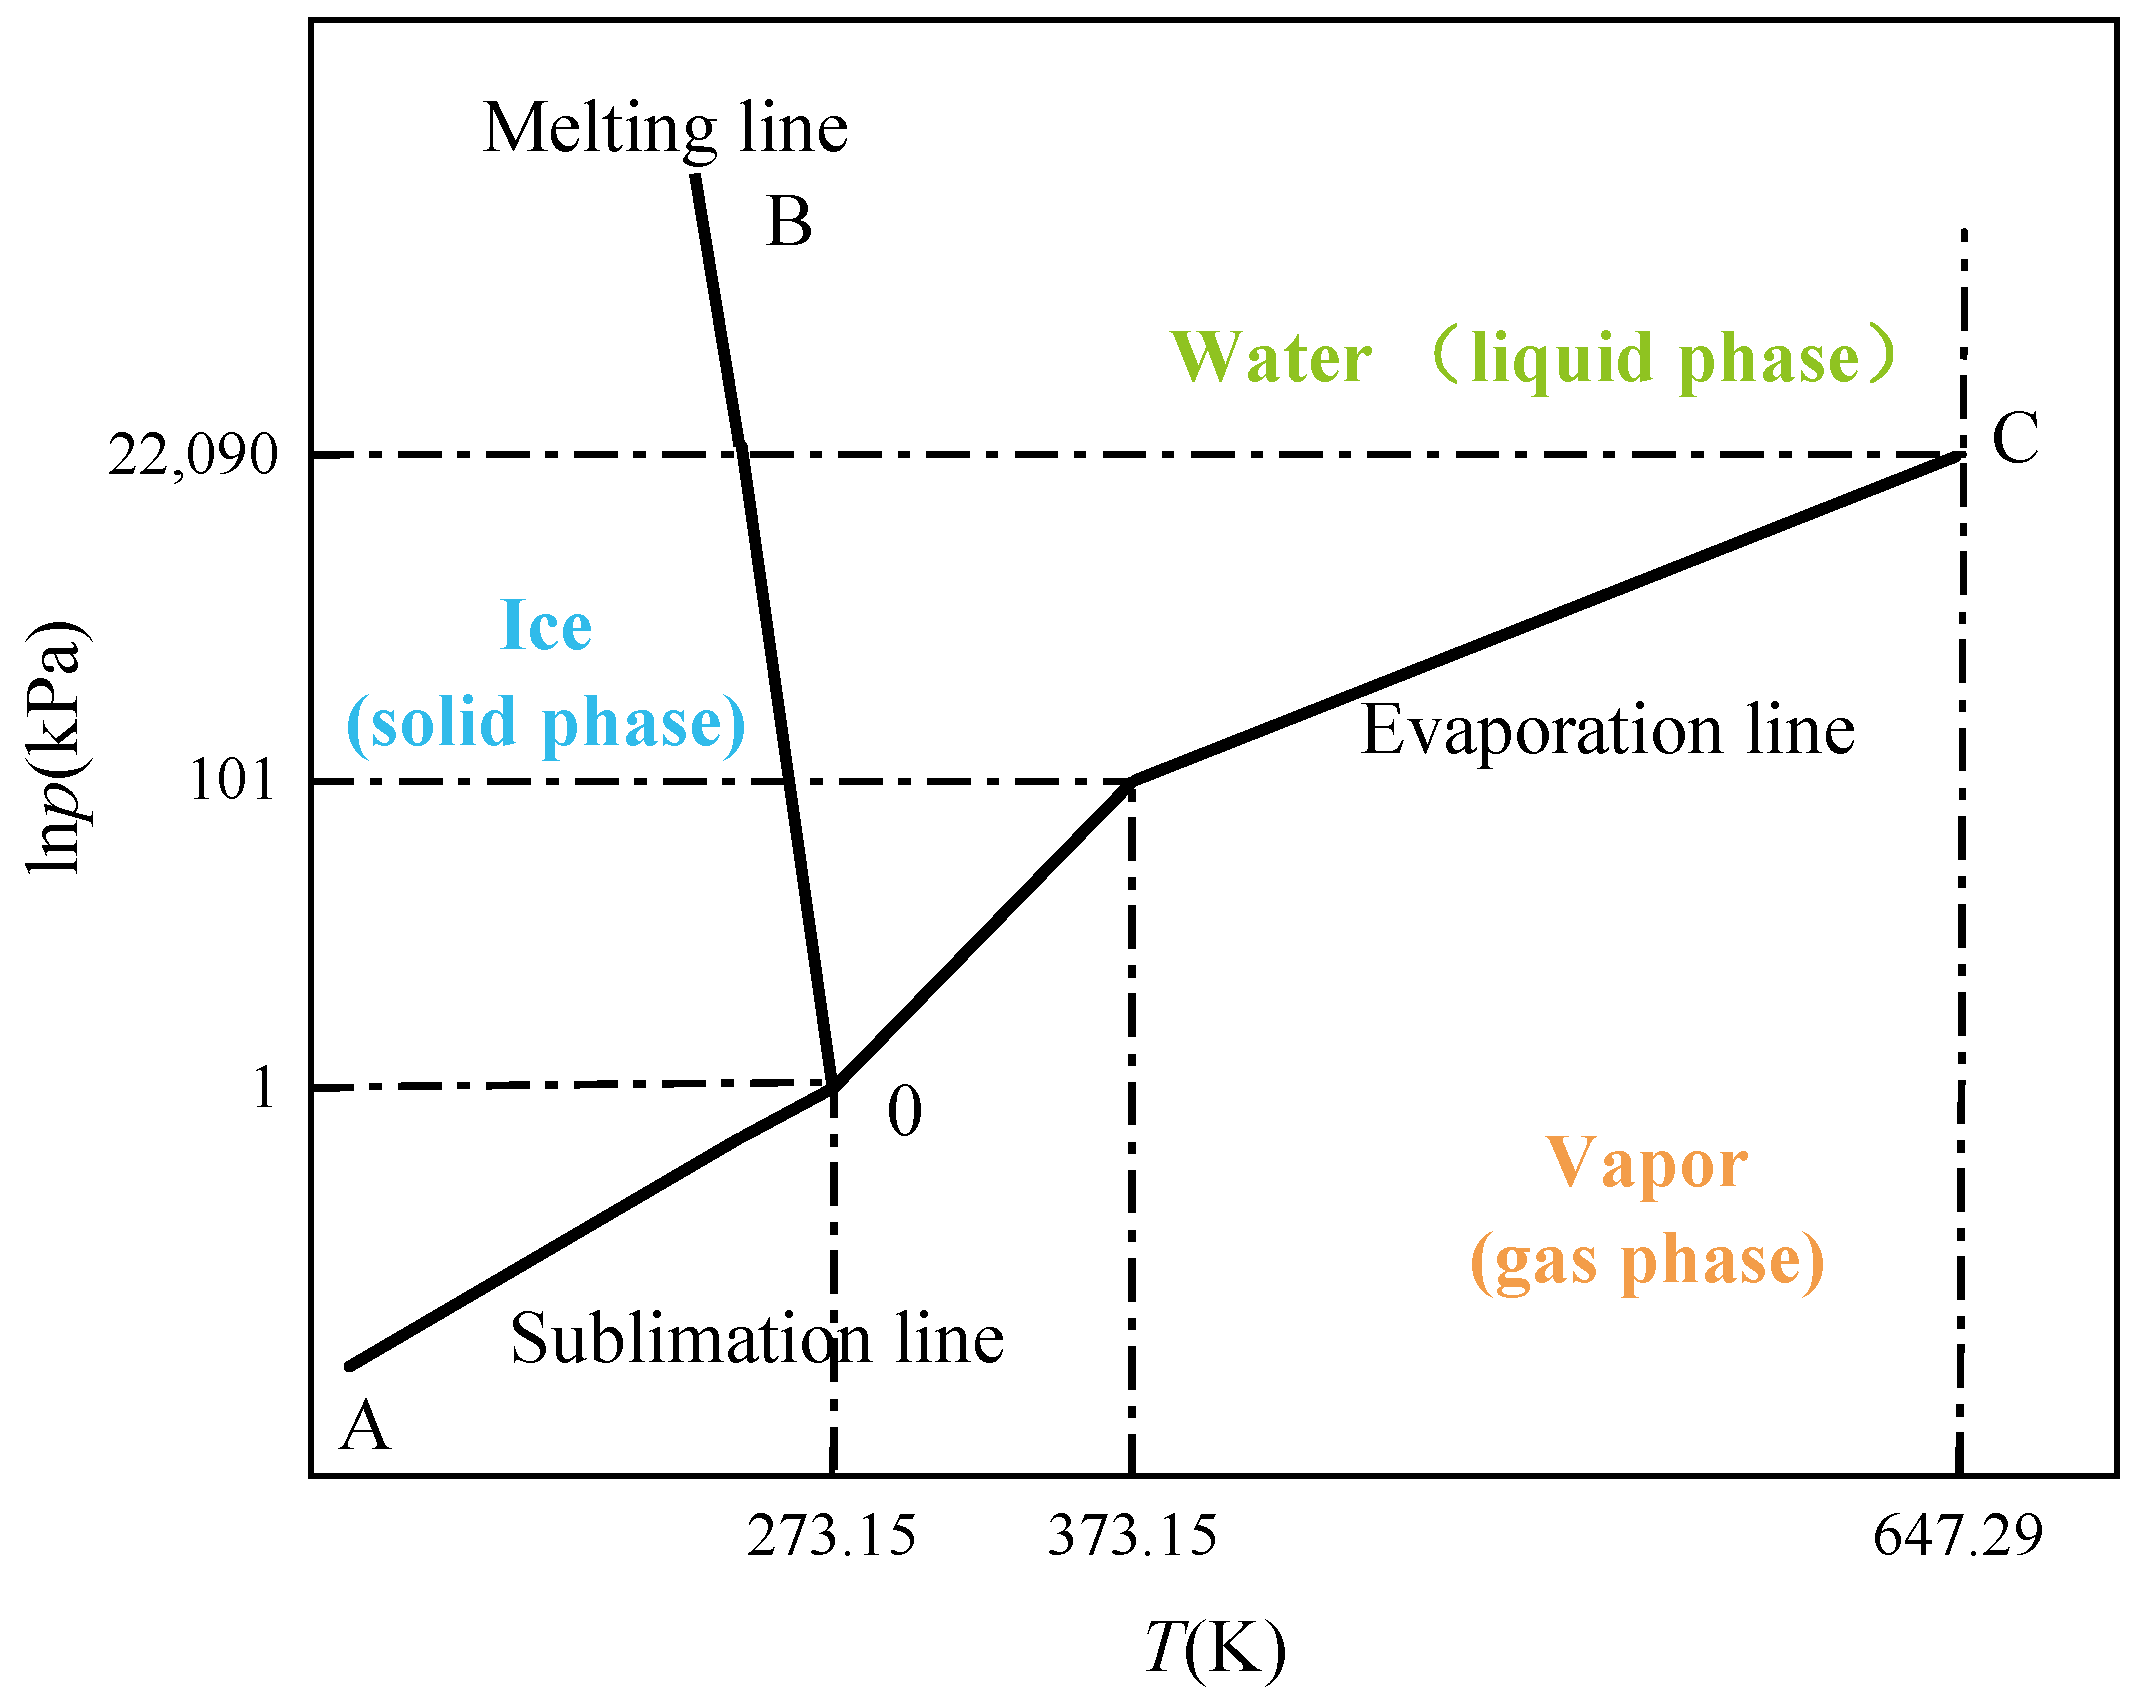
2.2. Freezing Theories

2.2.1. Two-Phase Flow Control Equation

In the polar low-temperature environment, the ballast water in the ballast water tank will freeze by phase change, and the liquid water will freeze to form solid ice. The phase-change process involves the coexistence of air, water and ice. Therefore, this paper uses the VOF multiphase flow model in the numerical simulation software Fluent to simulate the flow process of the fluid. The VOF multiphase flow model is a numerical calculation model for tracking and positioning the free-form surface or fluid interface in computational fluid dynamics. It can track the fluid interface with a changing topological structure, accurately analyze the interface changes between different fluid components, and has good convergence [27].
This paper introduces the variable of phase volume fraction αp to track the interface between phases in the computational domain, where αp represents the ratio of the volume of a phase to the volume of the grid. In this paper, the process of phase-change freezing in ballast water is simulated, and only two items of air (p = 1) and water (ice) (p = 2) are involved:
α 1 = 1   Control   only   air   in   the   body 0 ~ 1   Control   the   body   contains   water   ( ice )   and   air 0   Control   the   body   only   water   ( ice )
and α 1 + α 2 = 1 .
The volume fraction equation of each component is as follows:
1 ρ p t α p ρ p + α p ρ p ν p = 0
The common momentum equation of different fluid groups is as follows:
t ρ v + ρ v v = p + μ v + v T + ρ g + F vol + S M
In the equation, F vol is the source term of the momentum equation of the gas–liquid surface tension and S M is the source term of the momentum equation of the ice phase transition.

2.2.2. Phase Transformation Model

The ballast water tank will freeze in the polar environment with low temperature and high humidity. The freezing process involves the phase change of water–ice. Therefore, the solidification melting model is used to solve the freezing process. The model assumes that the solidification and melting of the material are controlled by temperature, and the temperature remains constant during the phase transition process (for pure materials). The heat transfer at the phase transition interface is mainly achieved by heat conduction [28]. The enthalpy of the material is calculated as the sum of the apparent enthalpy h and the latent heat:
H = h + Δ H
In the equation, H is enthalpy and h is the apparent enthalpy.
h = h r e f + T r e f T c p d T
In the equation, h r e f is the reference enthalpy; T r e f is the reference temperature; and cp is the specific heat capacity at constant pressure.
In this model, the physical quantity of liquid fraction β is used to express the degree of phase transition. The liquid fraction β is defined as follows:
β = 0 T T s o l i d u s T T s o l i d u s T l i q u i d u s T s o l i d u s T s o l i d u s < T < T l i q u i d u s 1 T T l i q u i d u s
The latent heat can be written as the product of the latent heat value of the liquid phase and the liquid fraction:
Δ H = β L
The latent heat varies from 0 (solid) to L (liquid). For the problem of solidification and melting, the common energy equation of different fluid groups is as follows:
t ρ H + ρ v H = k T + S
In the equation, ρ is the density, v is the fluid velocity, and S is the source term.
The source term S represents the generation or consumption of energy in the system, usually caused by external effects or internal physical mechanisms. It is composed of terms without the variable T to be determined, and its form is as follows:
S = ( ρ Δ H ) t + ( ρ u Δ H )

2.2.3. Composition Equation

In the solidification and melting of pure substances, phase transitions occur at distinct melting temperatures T m e l t . In multicomponent mixtures, there exists a mushy solidification/melting zone between the lower solidus temperature and the higher liquidus temperature. When a multicomponent liquid solidifies, the solute diffuses from the solid phase to the liquid phase. This phenomenon can be quantified by the composition coefficient Ki of solute i, which is described as the ratio of the solid phase mass fraction to liquid phase mass fraction at the interface [29,30].
The calculation formula of the solidus temperature of the multi-component mixture is as follows:
T s o l i d u s = T m e l t + s o l u t e s m i Y i / K i
The calculation formula of liquidus temperature is as follows:
T liquid u s = T m e l t + s o l u t e s m i Y i
In the formula, Ki is the composition coefficient of solute i, Yi is the mass fraction of solute i, and mi is the slope of the liquidus.
If the value of the mass fraction Yi exceeds the value of the eutectic mass fraction Yi, Eut, it is truncated when calculating the liquidus and solidus temperatures. The calculation assumes that the last component of the mixture is a solvent and the other components are solutes.
A negative slope mi is input to the liquidus of component i. If a positive slope mi is input, Fluent will ignore this input, and use eutectic temperature and eutectic mass fraction to calculate the slope:
m i = T E u t T m e l t Y i . E u t
In multi-component mixtures, updating the liquid fraction by the conventional liquid fraction equation will lead to numerical errors and convergence difficulties. At this time, the following iterative equation is used to calculate the liquid fraction:
β n + 1 = β n λ a p T T Δ t ρ V L a p Δ t T β
In the equation, the superscript n represents the number of iterations, λ is the relaxation factor, the default is 0.9, and ap is the element matrix coefficient; Δ t is the time step, ρ is the current density; V is the volume of the mesh unit; T is the temperature of the current grid; and T* is the interface temperature.
The Lever method component separation model is selected for calculation. Assuming that the solute diffuses infinitely in the solid, the interface temperature calculation formula is as follows:
T = T m e l t + i = 0 N s 1 m i Y i K i + β ( 1 K i )
In the equation, Ns is the number of components.
The component transport equation is expressed as follows:
t ρ Y i + ρ β v l i q Y i , l i q + 1 β v p Y i , s o l = J i + R i
In the equation, Ri is the reaction rate; expressed as follows:
J i = ρ β D i , m , l i q Y i , l i q + 1 β D i , m , s o l Y i , s o l
In the equation, v l i q is the liquid velocity and v p is solid phase velocity (pull-out velocity). When the pull-out speed is not included in the calculation, the variable is 0. The liquid phase rate is calculated by the following formula:
v l i q = v v p 1 β β
The mass fraction of the liquid phase (Yi,liq) and solid phase (Yi,sol) is related to the distribution coefficient Ki:
Y i , s o l = K i Y i , l i q

2.3. Physical Model and Boundary Conditions of Ballast Tank Freezing

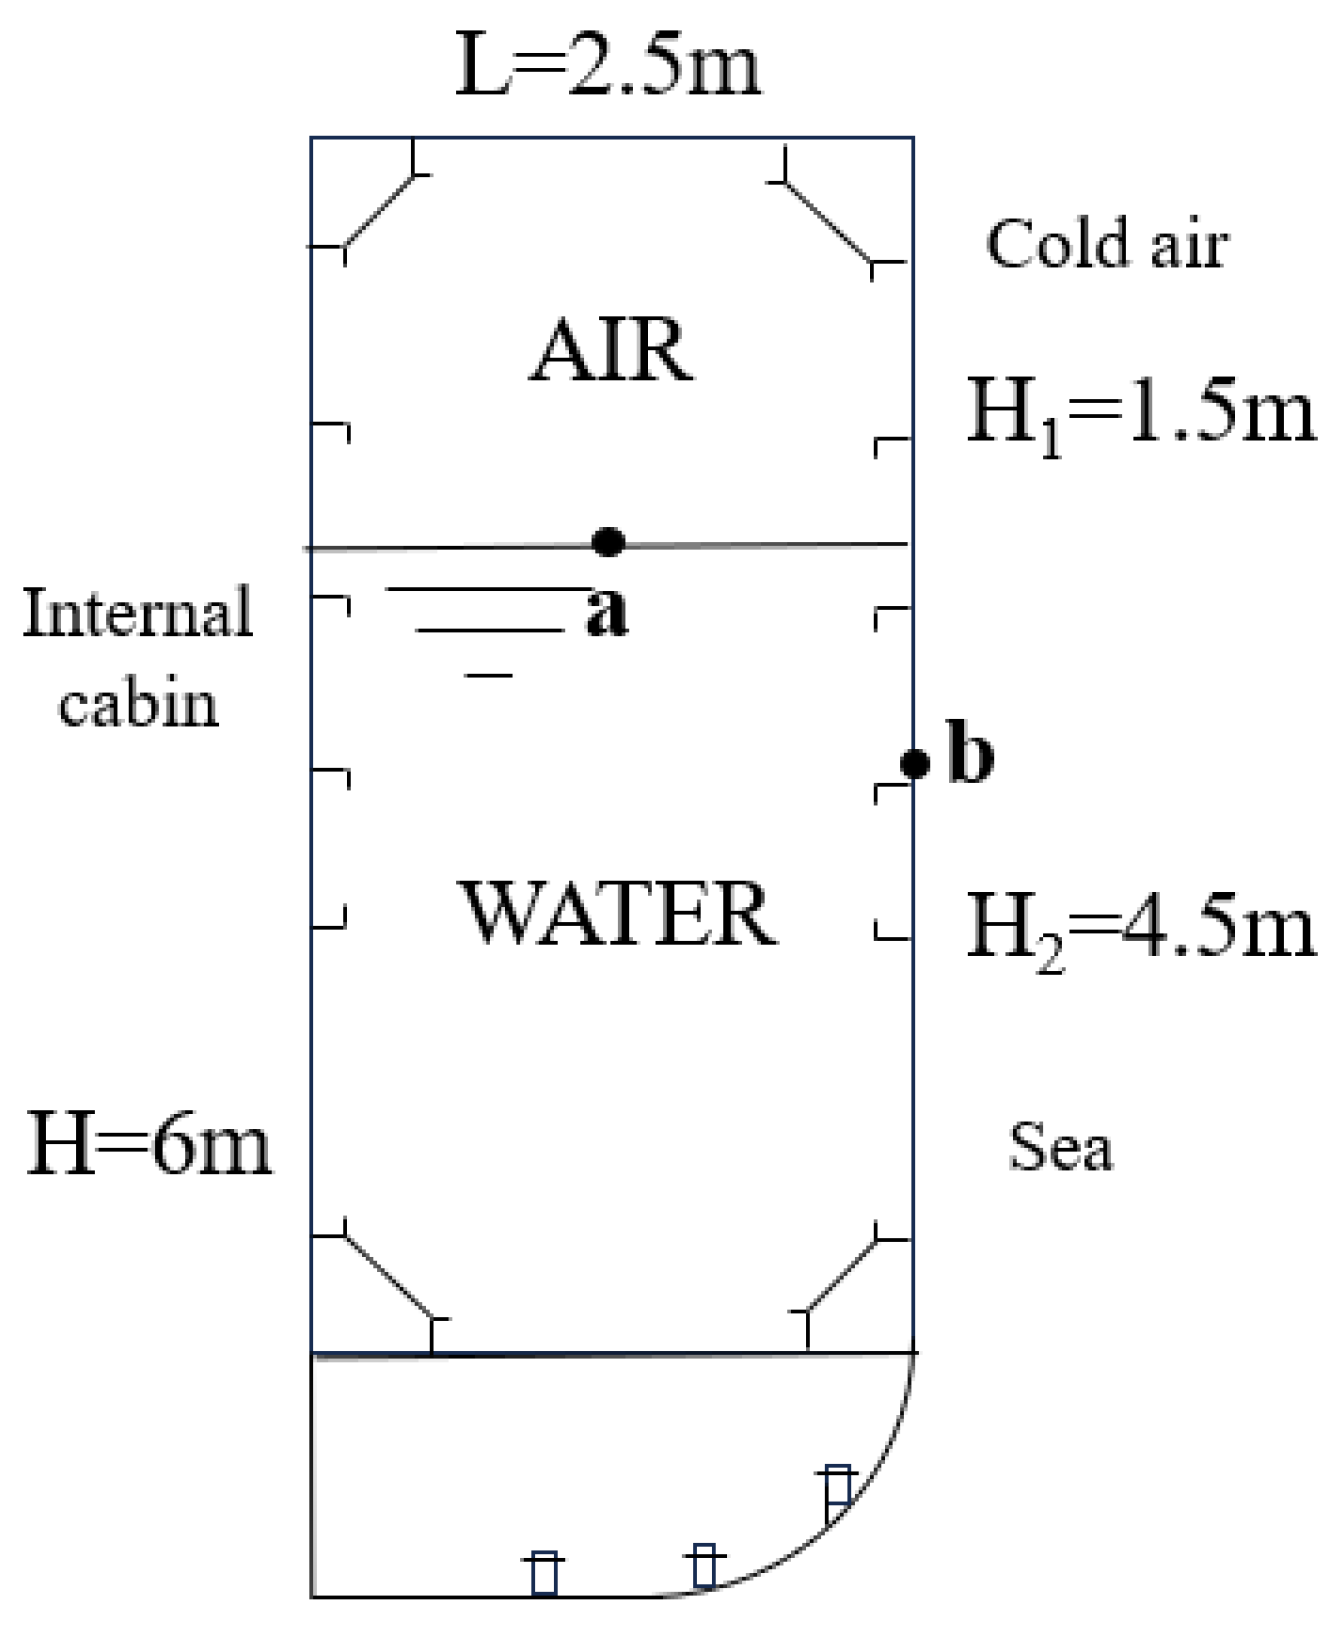
2.3.1. Physical Model of Ballast Tank Freezing

This study uses the Arc7 ice-breaking LNG carrier designed by COSCO as a reference [31]. To enhance the efficiency of numerical calculations and analyze the evolution of ice shape, a two-dimensional geometric model of the ballast tank has been established. The ballast tank measures 6 m in height, 2.5 m in width, 1.5 m in height in the air domain, and 4.5 m deep at the ballast water line. Figure 3 illustrates the geometric model of the ballast tank.
As illustrated in Figure 3, the ballast water tank is adjacent to the internal chamber on the left and the external environment on the right. The air above the waterline comes into contact with the cold air from the outside, while the ballast water tank is in contact with the seawater from the outside. Two points, point a at the center of the ballast water surface and point b at 1/4 of the water depth on the bulkhead, were selected as numerical monitoring points to analyze the variation laws of temperatures at different monitoring points under different environmental conditions.

2.3.2. Boundary Condition

The hull material of the ballast tank is low carbon steel Q235, with a thickness of 0.01 m. The environmental conditions in polar regions are complex and harsh, with low temperatures and ice throughout the year and a long winter. When LNG carriers navigate in polar regions, they may encounter extremely low-temperature sea conditions. Most of the time, the temperature varies within the range of −43 °C to −26 °C, with an average temperature of −34 °C, while seawater temperatures vary between −3 °C and 0 °C [32,33,34]. Boundary H1 is influenced by cold air, and the convective heat transfer coefficient on the H1 side is 15.21 W·m−2·K−1. The boundary H2 is adjacent to the seawater side, and is affected by the seawater temperature. The convective heat transfer coefficient on the H2 side is 130.56 W·m−2·K−1. The SIMPLE (Semi-Implicit Method for Pressure Linked Equations) algorithm is employed to solve the momentum and continuity equations, while the PRESTO! (Pressure Staggering Option) method is used for pressure dispersion calculations and analysis. The time step is set at 0.05 s, with a total of 288,000 time steps. The quasi-freezing duration is 4 h, and the initial temperature of the ballast tank is 0.15 °C.

2.3.3. Material Physical Parameters

This paper primarily investigates the phase transition process of ballast water freezing into ice. It is important to note that when ships navigate in polar regions, ballast water typically consists of seawater with a certain salinity. As the temperature drops below the freezing point of water, the ballast water freezes into ice, resulting in the formation of a regular hexagonal crystal structure by water molecules. The volume and charge of dissolved salt ions do not align, preventing them from integrating into the ice lattice. Consequently, salts precipitate, creating brine channels within the ice layer, which subsequently affects physical properties such as the strength of the ice. Additionally, as the salinity of the remaining ballast water increases, parameters such as the density, thermal conductivity, and specific heat capacity will also change. However, since these parameter changes in the ballast water have a relatively minor impact on the overall trend of ice shape evolution, they can be disregarded. Therefore, to enhance the efficiency of numerical calculations, this paper assumes the ballast water to be fresh water, and the relevant physical property parameters for fresh water are presented in Table 1.

2.4. Numerical Calculation Method and Verification

2.4.1. Numerical Analysis Process

In this paper, Fluent fluid calculation software is employed to simulate the freezing process in ballast tanks. A numerical model of the ballast tank is developed based on the actual dimensions of a liquefied natural gas (LNG) carrier, and the grid is appropriately refined. Considering the environmental conditions in polar regions, the temperature variation range is defined, and the boundary conditions for the ballast tank are established. A numerical simulation of the freezing process of ballast water is conducted to investigate the effects of various environmental parameters on the freezing process. The results of the calculations are discussed and analyzed, highlighting the variations in the temperature field and the evolution of ice shape during the freezing process of the ballast water. Figure 4 illustrates the numerical analysis process.
As shown in Figure 4, the numerical simulation of the ballast water freezing process encompasses pretreatment, calculation and analysis, as well as result interpretation. A physical model was developed based on the actual dimensions of the ballast water tank, followed by a meshing process. The temperature field variations within the ballast water tank were simulated numerically. By integrating heat transfer, fluid dynamics, and structural analysis, the distribution of ice shapes was calculated. Utilizing the control variable method, the effects of the cold air temperature, seawater temperature, and the liquid level height of the ballast water on the temperature field and ice shape distribution were examined. The patterns of temperature field variation and ice shape evolution, along with the impact of temperature changes on ice formation, were identified.

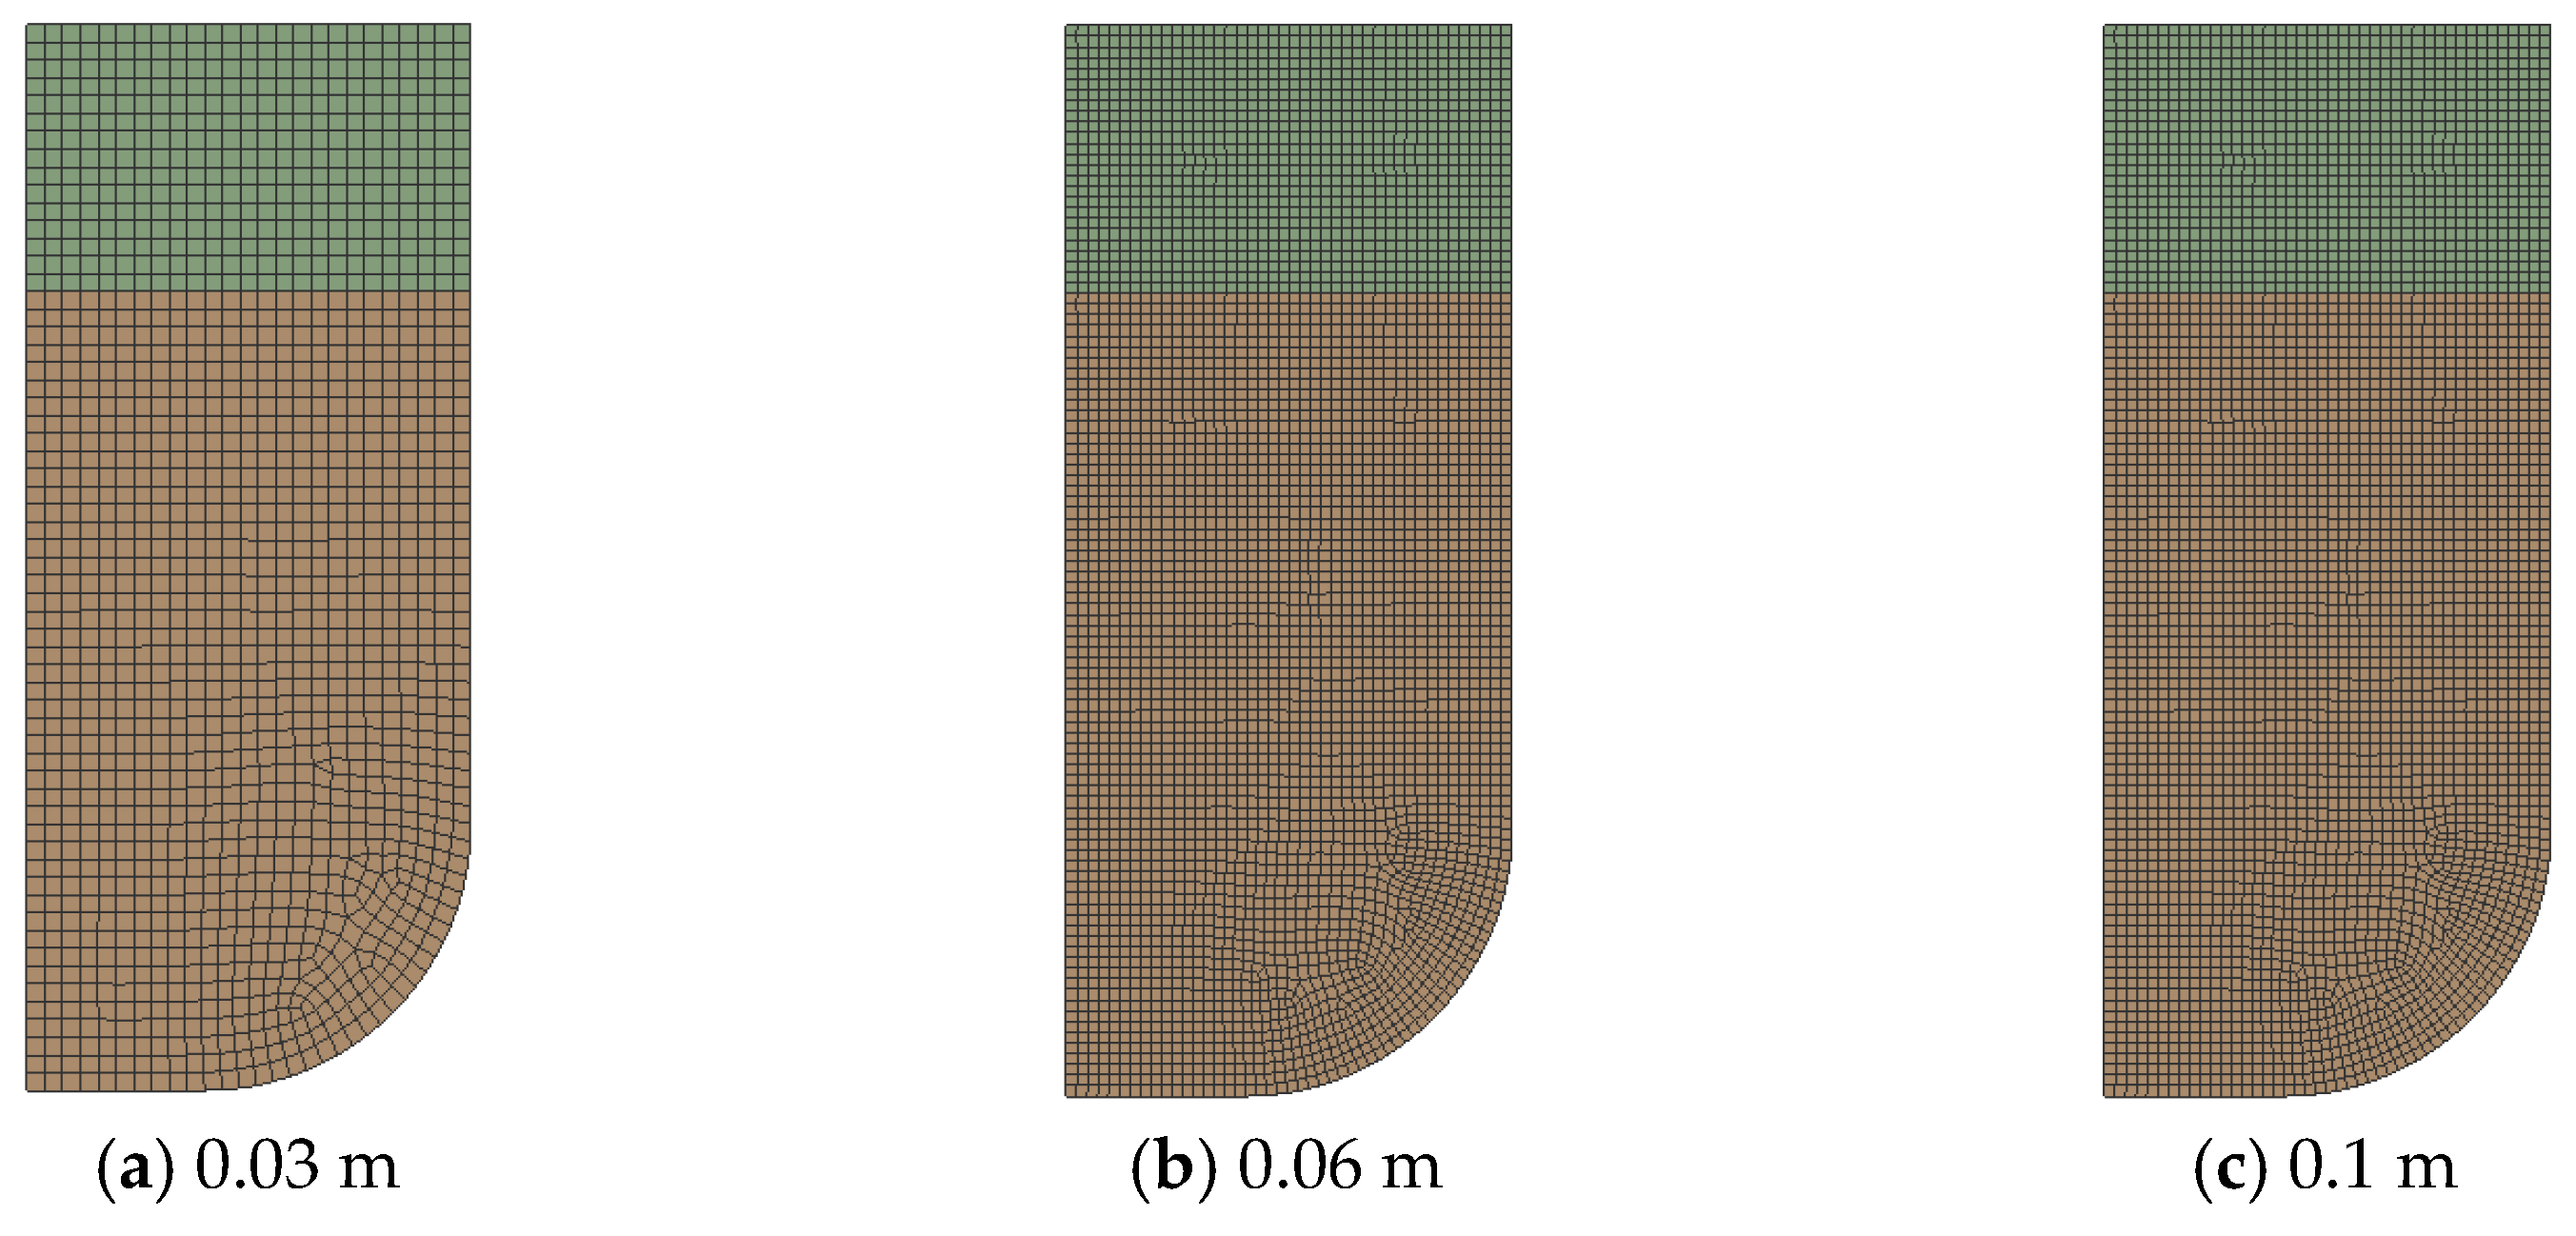
2.4.2. Grid Independence Analysis

This study analyzes the complex interaction of multiple physical phenomena, including interphase heat transfer, fluid flow, and phase change, by simulating the freezing process in ballast tanks. Consequently, the selection of the model mesh size is crucial for obtaining accurate numerical results. To enhance the precision of the numerical calculations, this paper examines three different grid sizes, namely 0.1 m, 0.06 m, and 0.03 m, and evaluates grid independence when calculating the temperature and ice volume fraction across these varying grid sizes. Table 2 presents the temperature and ice volume fraction for each grid size.
It can be observed from Table 2 that as the mesh size decreases from 0.1 m to 0.06 m, the range of temperature change is small, and the ice phase volume fraction increases from 69.470% to 69.049%, resulting in a change of 0.84%. When the mesh size further decreases from 0.06 m to 0.03 m, the ice phase volume fraction increases from 69.049% to 69.336%, with a change of 0.41%. Therefore, the mesh size has a negligible effect on the calculation results. Considering both the calculation rate and accuracy, this paper employs a structured grid division method to model the evolution of ice shape within the ballast tanks, while utilizing an unstructured grid to depict the evolution of ice shape in the curved section at the bottom of the ballast tank. Figure 5 illustrates the grid models of ballast tanks with varying sizes. Among them, the upper green area is the air domain, and the lower brown area is the ballast water.

2.4.3. Numerical Model Validation

In order to verify the reliability of the numerical model presented above, this paper references the work of Hu et al. to compare the freezing simulation results in ballast tanks [35]. The simulation parameters are set as follows: an ambient temperature of −40 °C, a seawater temperature of −2 °C, a water line height of 4 m, and a freezing duration of 4 h. Figure 6 illustrates the comparison of ice volume fraction curves at different time intervals.
As illustrated in Figure 6, the time-varying curve of the ice phase volume fraction in the ballast tank, obtained through numerical simulation, is compared with data from the literature under identical operating conditions. The trends in the ice phase volume fraction are largely consistent, with an average error of approximately 6.81%. At around 10,800 s, the volume fraction of the ice phase formed by freezing in the literature is approximately 43.95%, while the volume fraction of the ice phase obtained through numerical simulation is about 39.86%. At this point, the error is the largest, with a maximum deviation of approximately 9.31%, which remains below 10%. Therefore, the numerical model of the ballast tank established in this paper is considered reliable.

3. Discussion and Analysis

Given the dynamic variability of environmental parameters during polar navigation, it is essential to analyze their influence on the freezing process of ballast water. The flow of ballast water can significantly impact freezing. Therefore, this paper assumes that the ballast water is in a static state and disregards its circulation. This investigation focuses on assessing the effects of ambient temperature, seawater temperature, and ballast water height on the temperature field and the freezing of ballast water. These parameters are relevant to the environmental conditions associated with freezing in ballast tanks.

3.1. Influence of Environmental Parameters on the Temperature Field Evolution

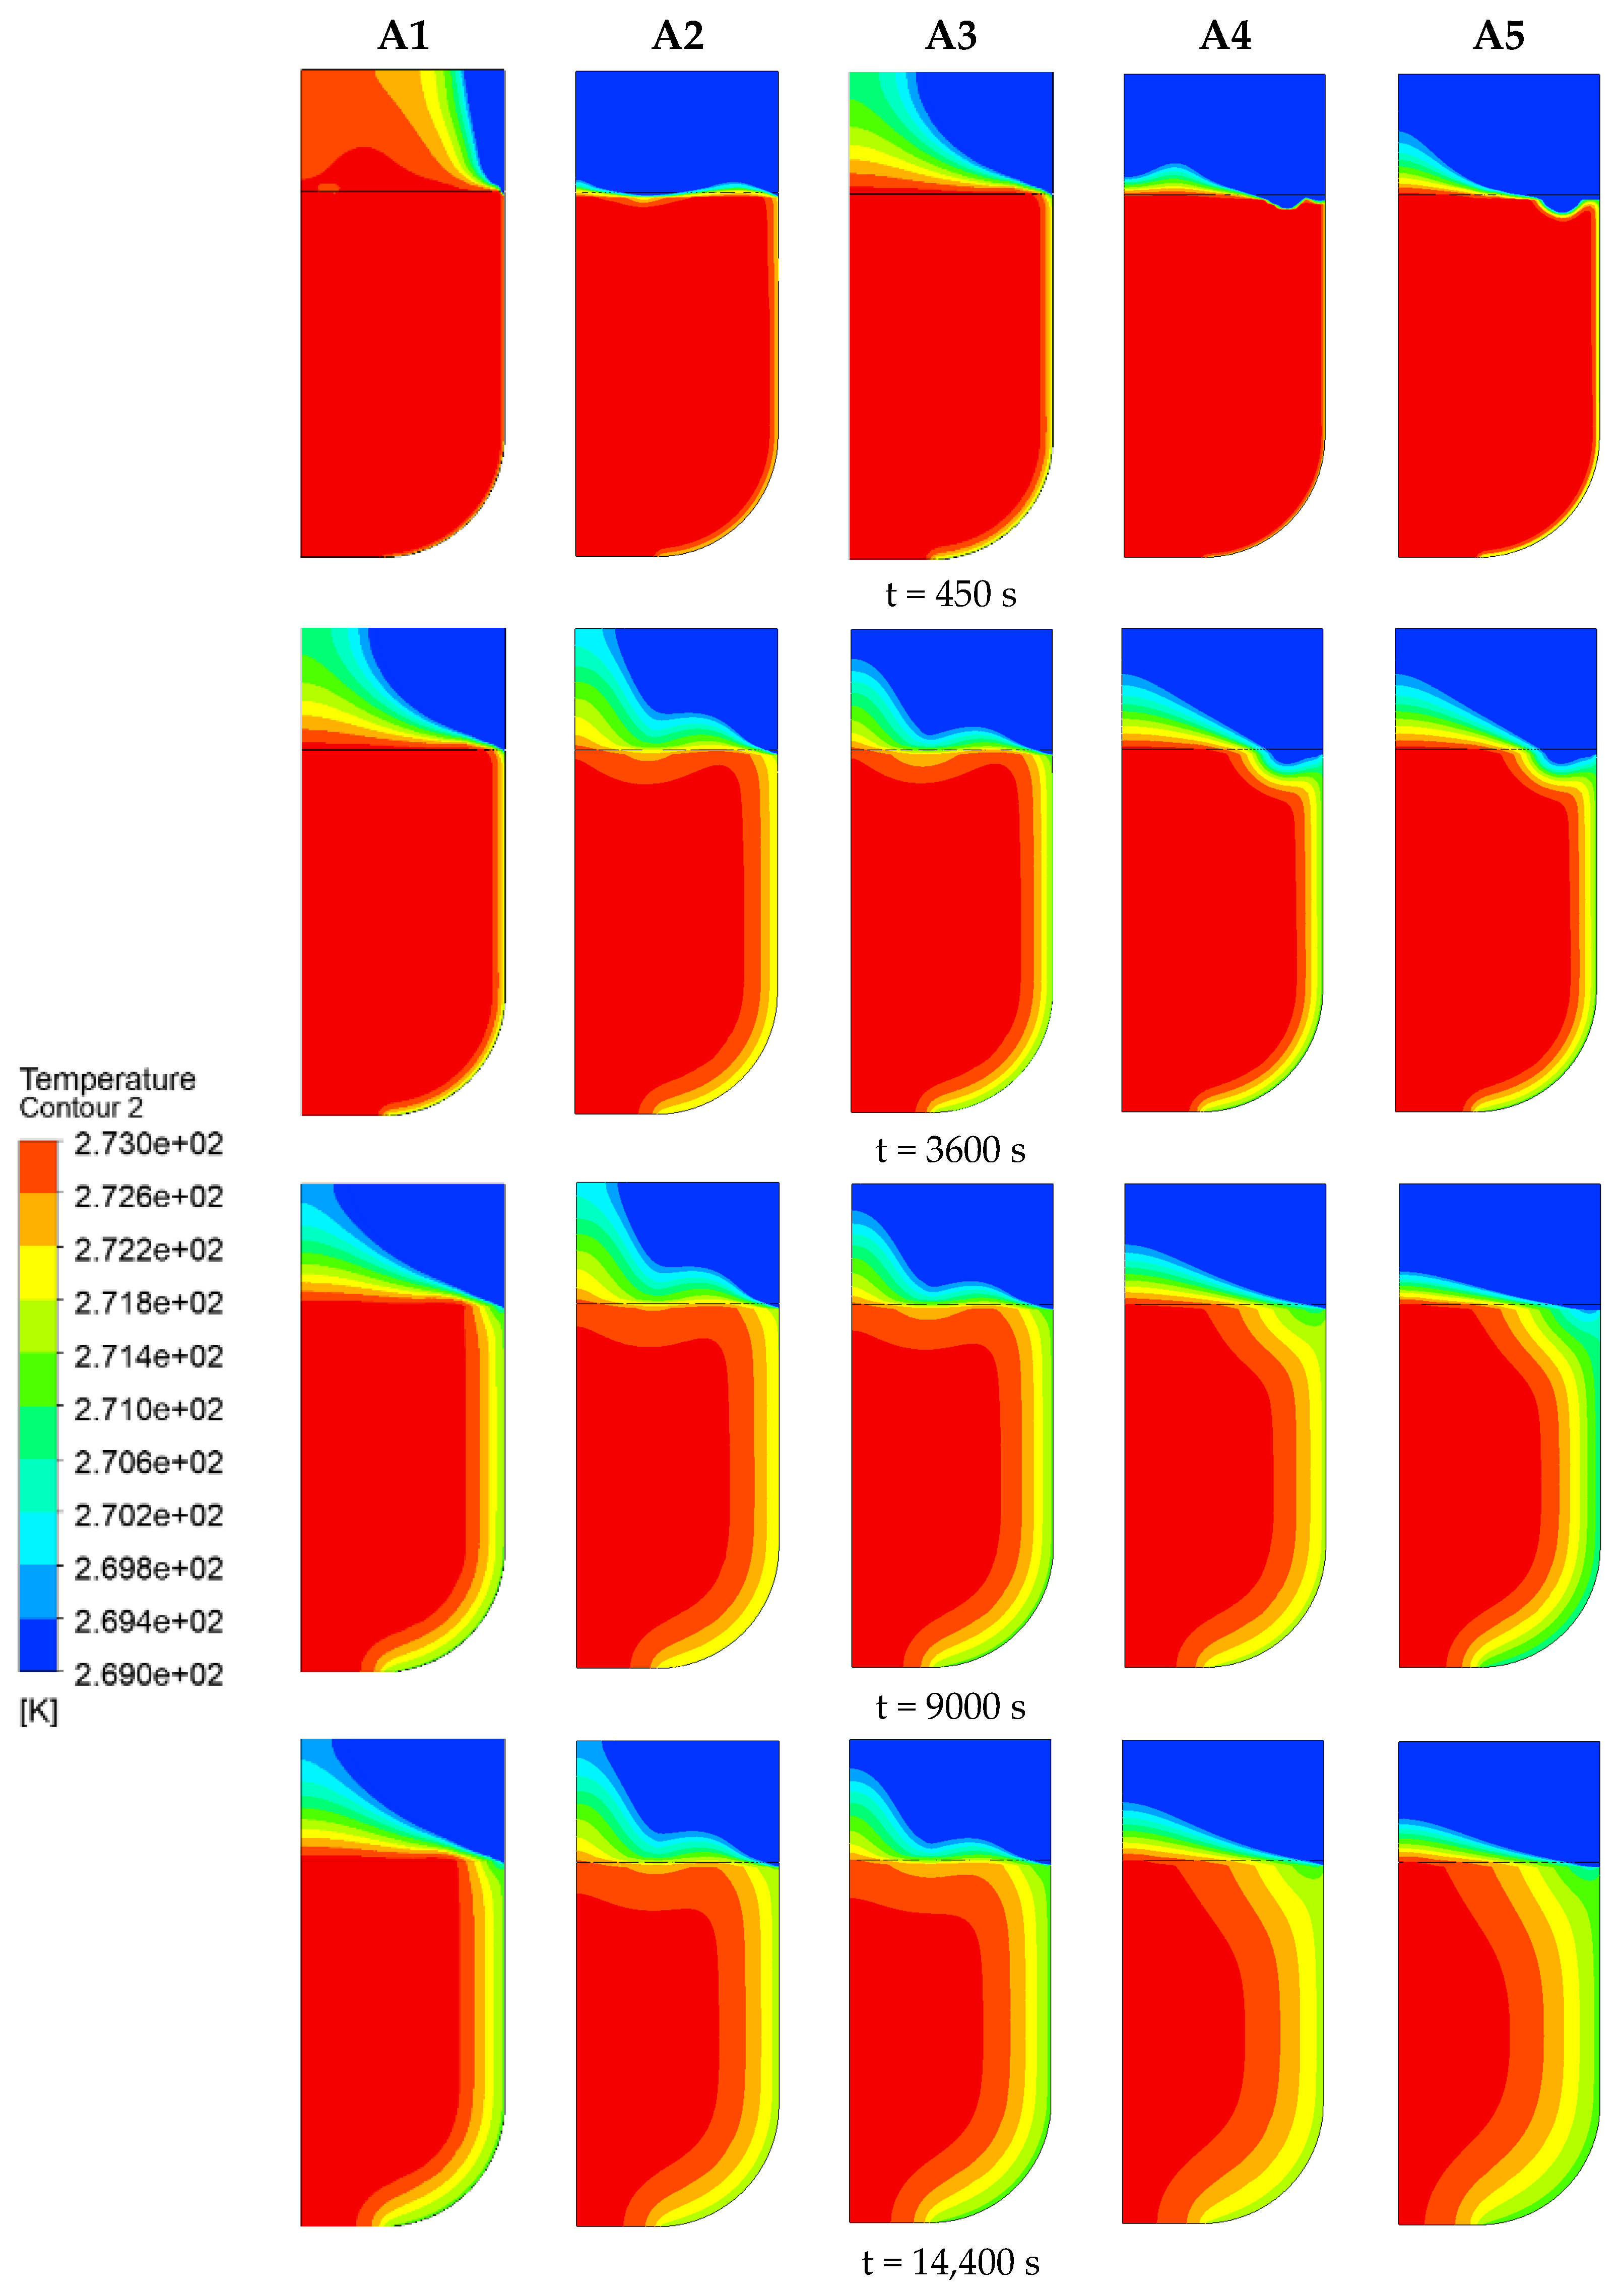
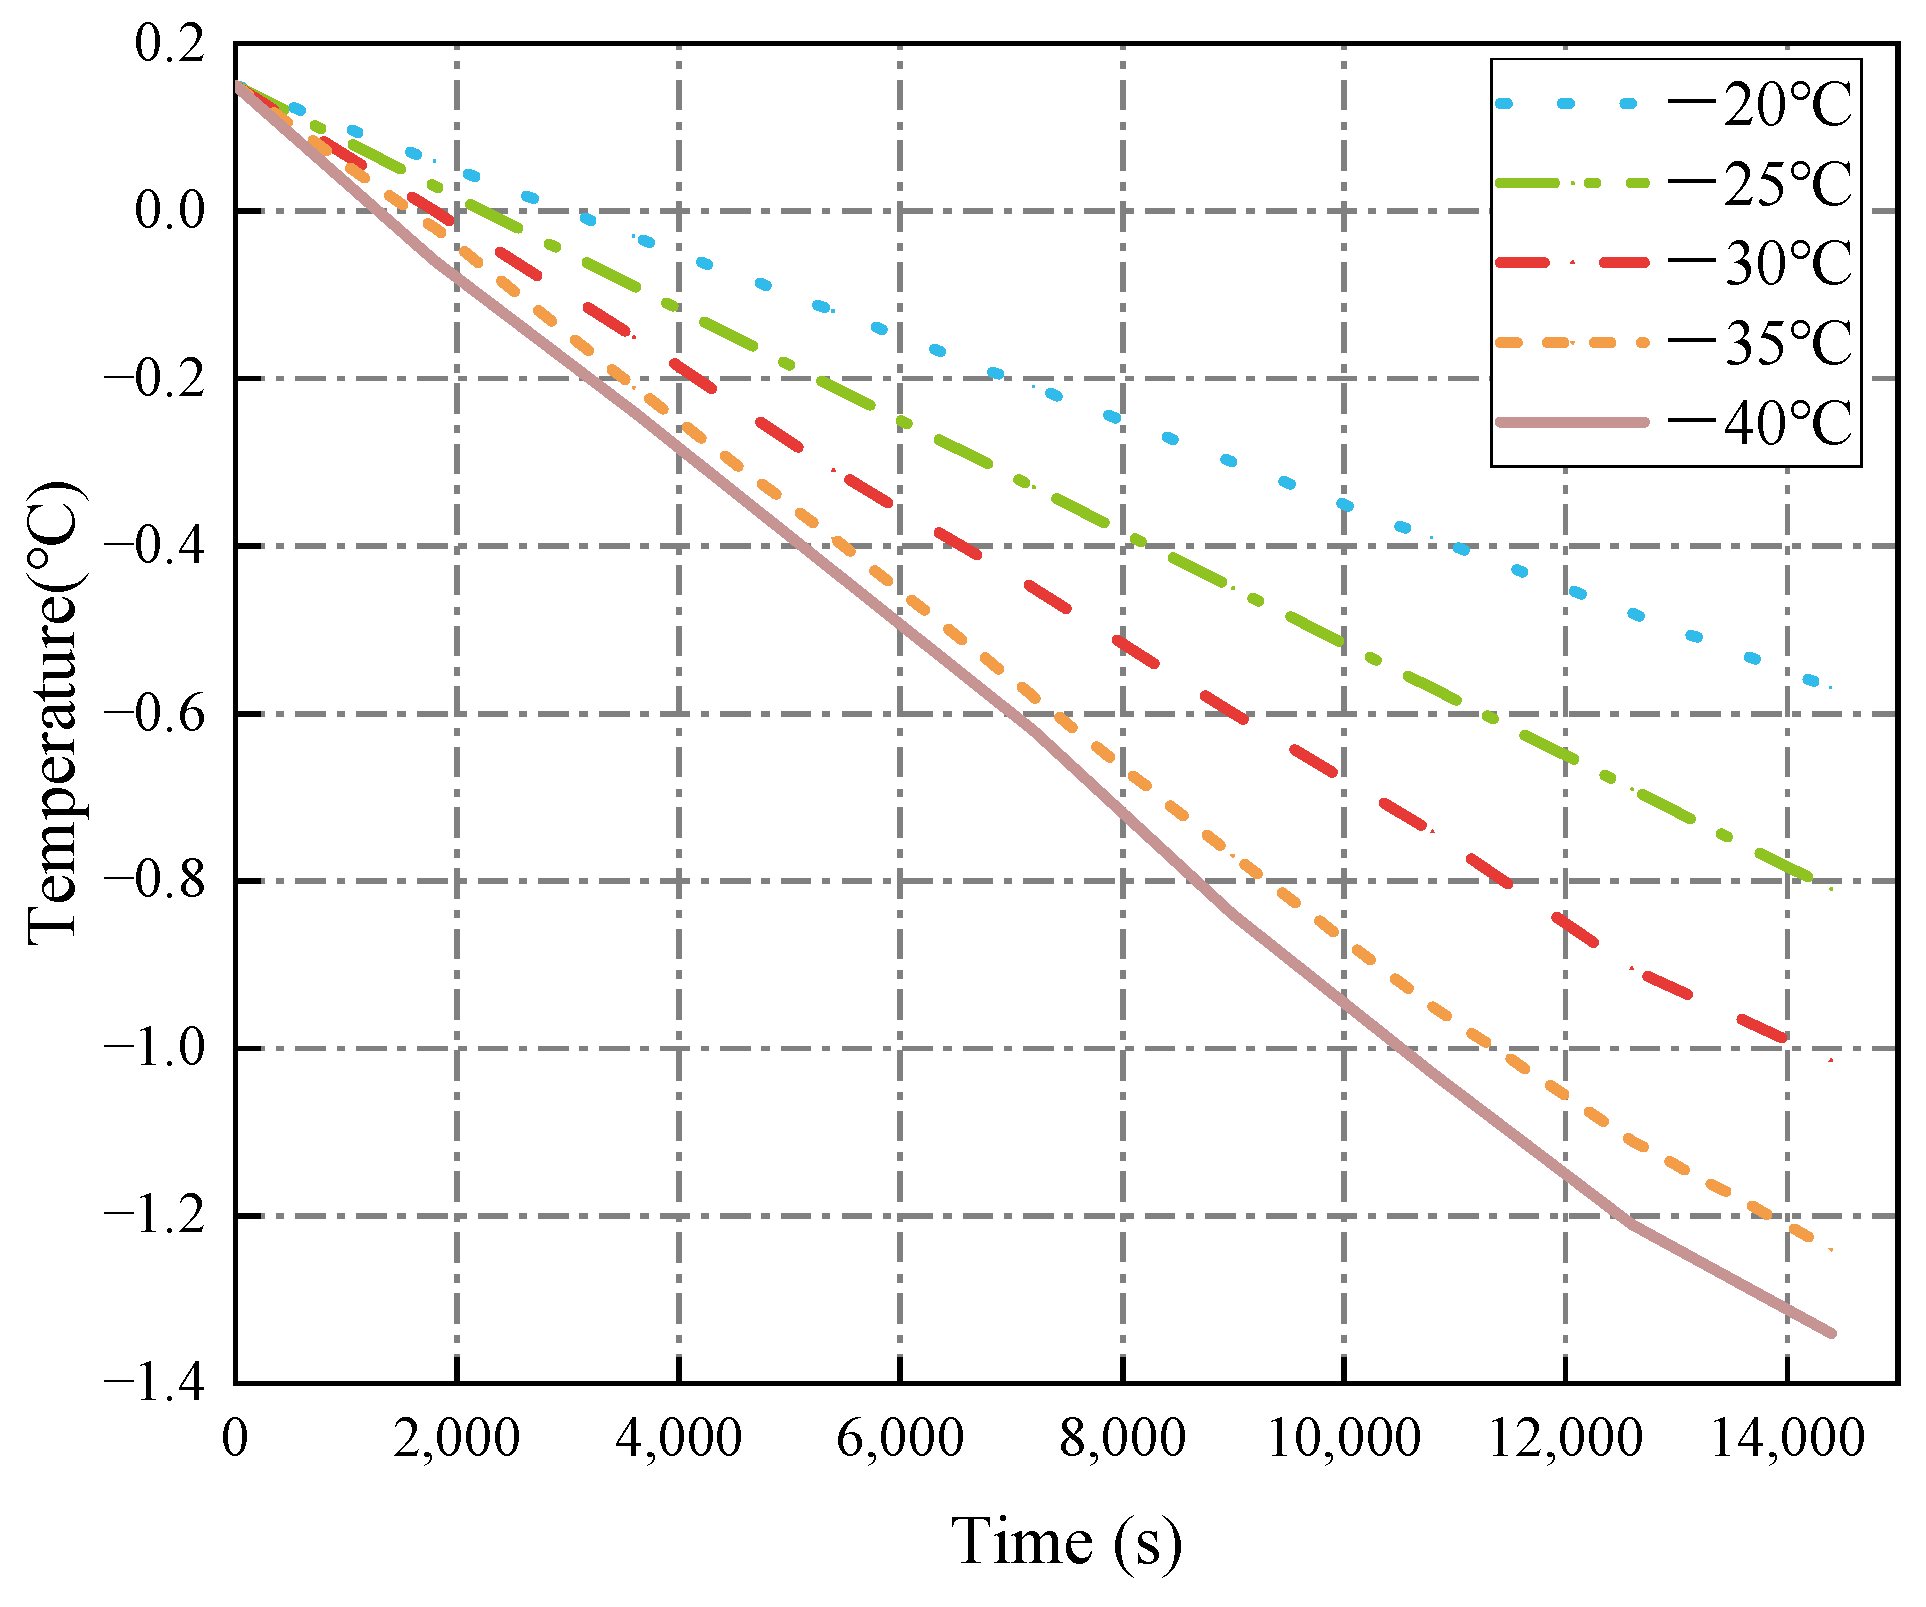
3.1.1. Cold Air Temperature

This section primarily studies and analyzes the evolution and distribution of temperature during the freezing process in ballast tanks. Considering that the temperature variation range of LNG carriers during navigation in polar regions is between −43 °C and −26 °C, the average temperature is −34 °C. Therefore, the temperature of the cold air is selected as −40 °C, −35 °C, −30 °C, −25 °C and −20 °C, the temperature of the seawater is −2 °C, and the height of the ballast water is 4.5 m. The evolution law of ballast tank freezing at different ambient temperatures is analyzed. Table 3 shows the environmental conditions under different working conditions.
This paper presents the temperature change over time at two points, a and b. Figure 7 illustrates the temperature field distribution during the freezing process at various cold air temperatures. Figure 8 and Figure 9 depict the temperature change curves for points a and b over time under different working conditions.
It can be observed from Figure 7 that as the temperature of the cold air decreases, there is a significant variation in the rate of temperature change within the air domain of the ballast tank. When the cold air temperature reaches −25 °C, there is a small temperature fluctuation above point a in the center of the ballast water level. As the cold air temperature continues to decline, the temperature fluctuations gradually shift toward the right bulkhead and penetrate deeper into the ballast water. This phenomenon occurs due to convective heat transfer between the ballast water and the air domain, which results in slight fluctuations in the temperature field above point a. As the cold air temperature decreases further, the heat exchange effect of the air domain on the ballast water intensifies, causing the right side of the ballast water surface to be affected by the cold air temperature more rapidly. Consequently, the temperature fluctuations progressively migrate toward the right side of the ballast water surface.
As shown in Figure 8 and Figure 9, the temperature at point a exhibits a stable downward trend under the influence of cold air temperatures. Initially, the temperature at point b decreases rapidly; however, around 4800 s, the rate of decline slows, and the temperature gradually stabilizes. This is because point a is located at the center of the ballast water surface and is greatly affected by the air domain. The heat of the ballast water is lost rapidly, and the cooling rate is relatively fast. While point b is close to the bulkhead and is affected by the seawater temperature, the initial cooling is relatively fast. After the temperature drops to a certain value, the temperature tends to stabilize. When the temperature of the cold air is −40 °C, the temperature of the ballast water is the smallest. The minimum temperature at point a is approximately −1.34 °C, and the minimum temperature at point b is approximately −1.1 °C.

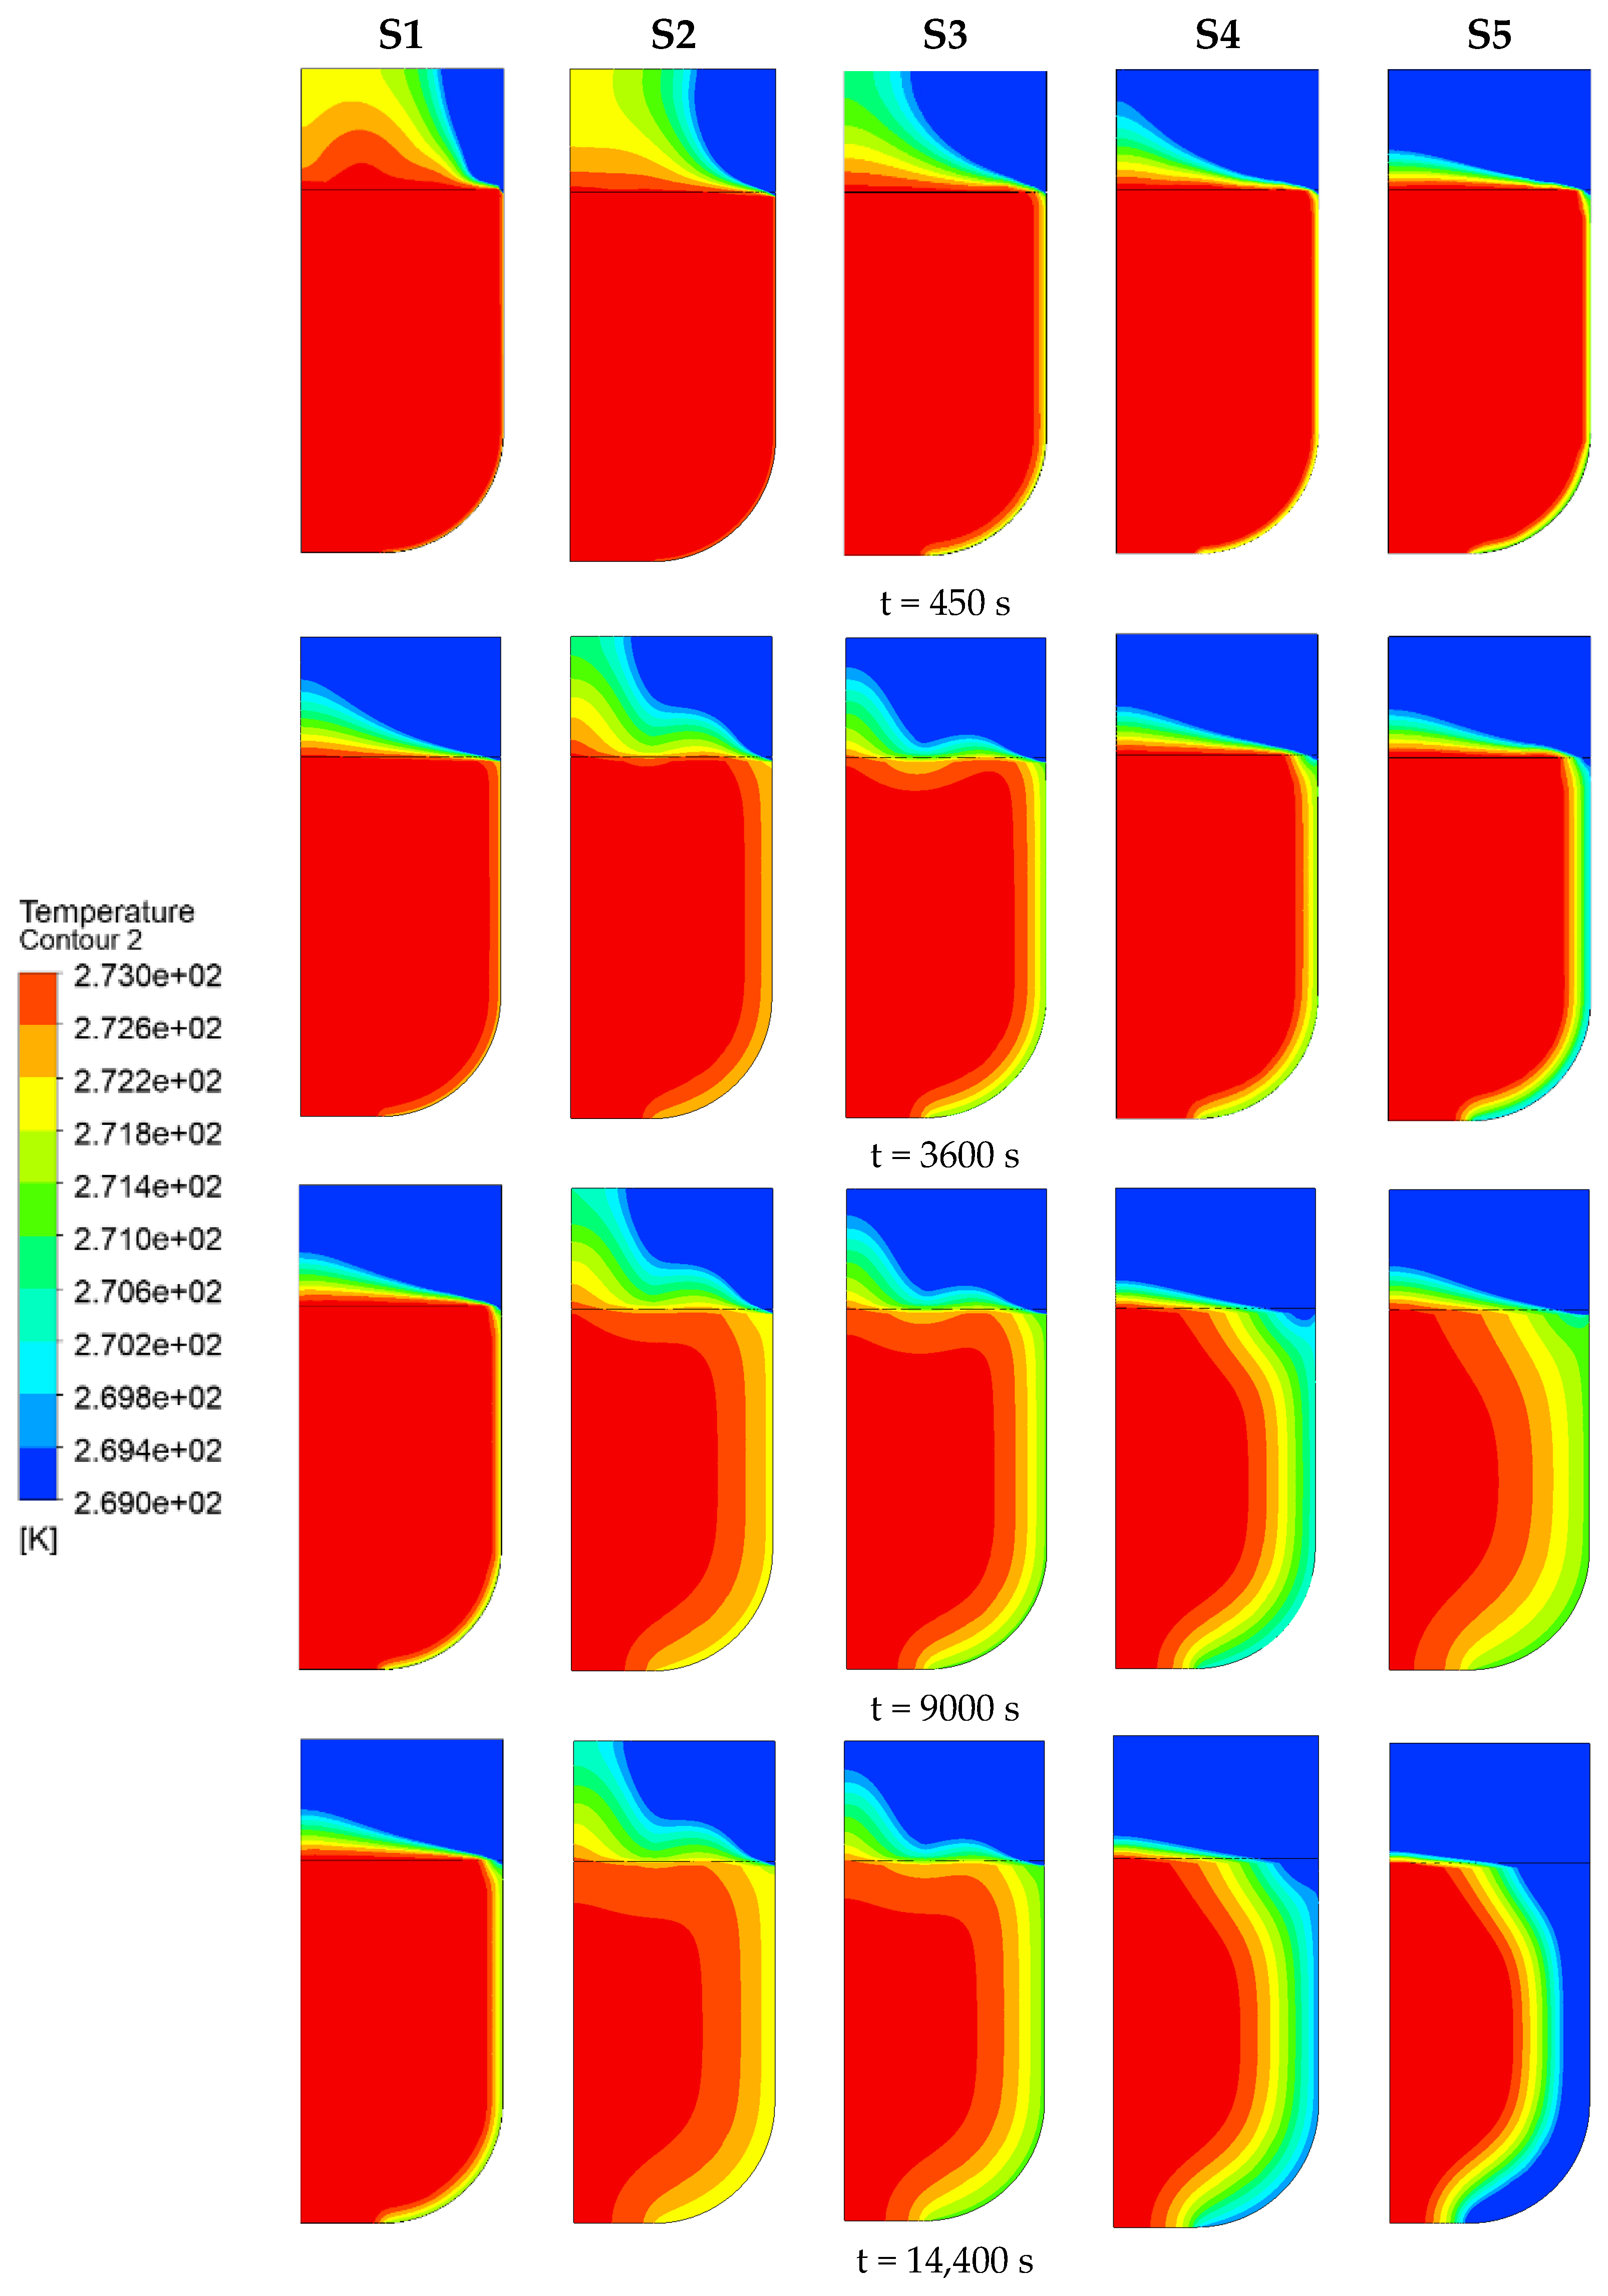
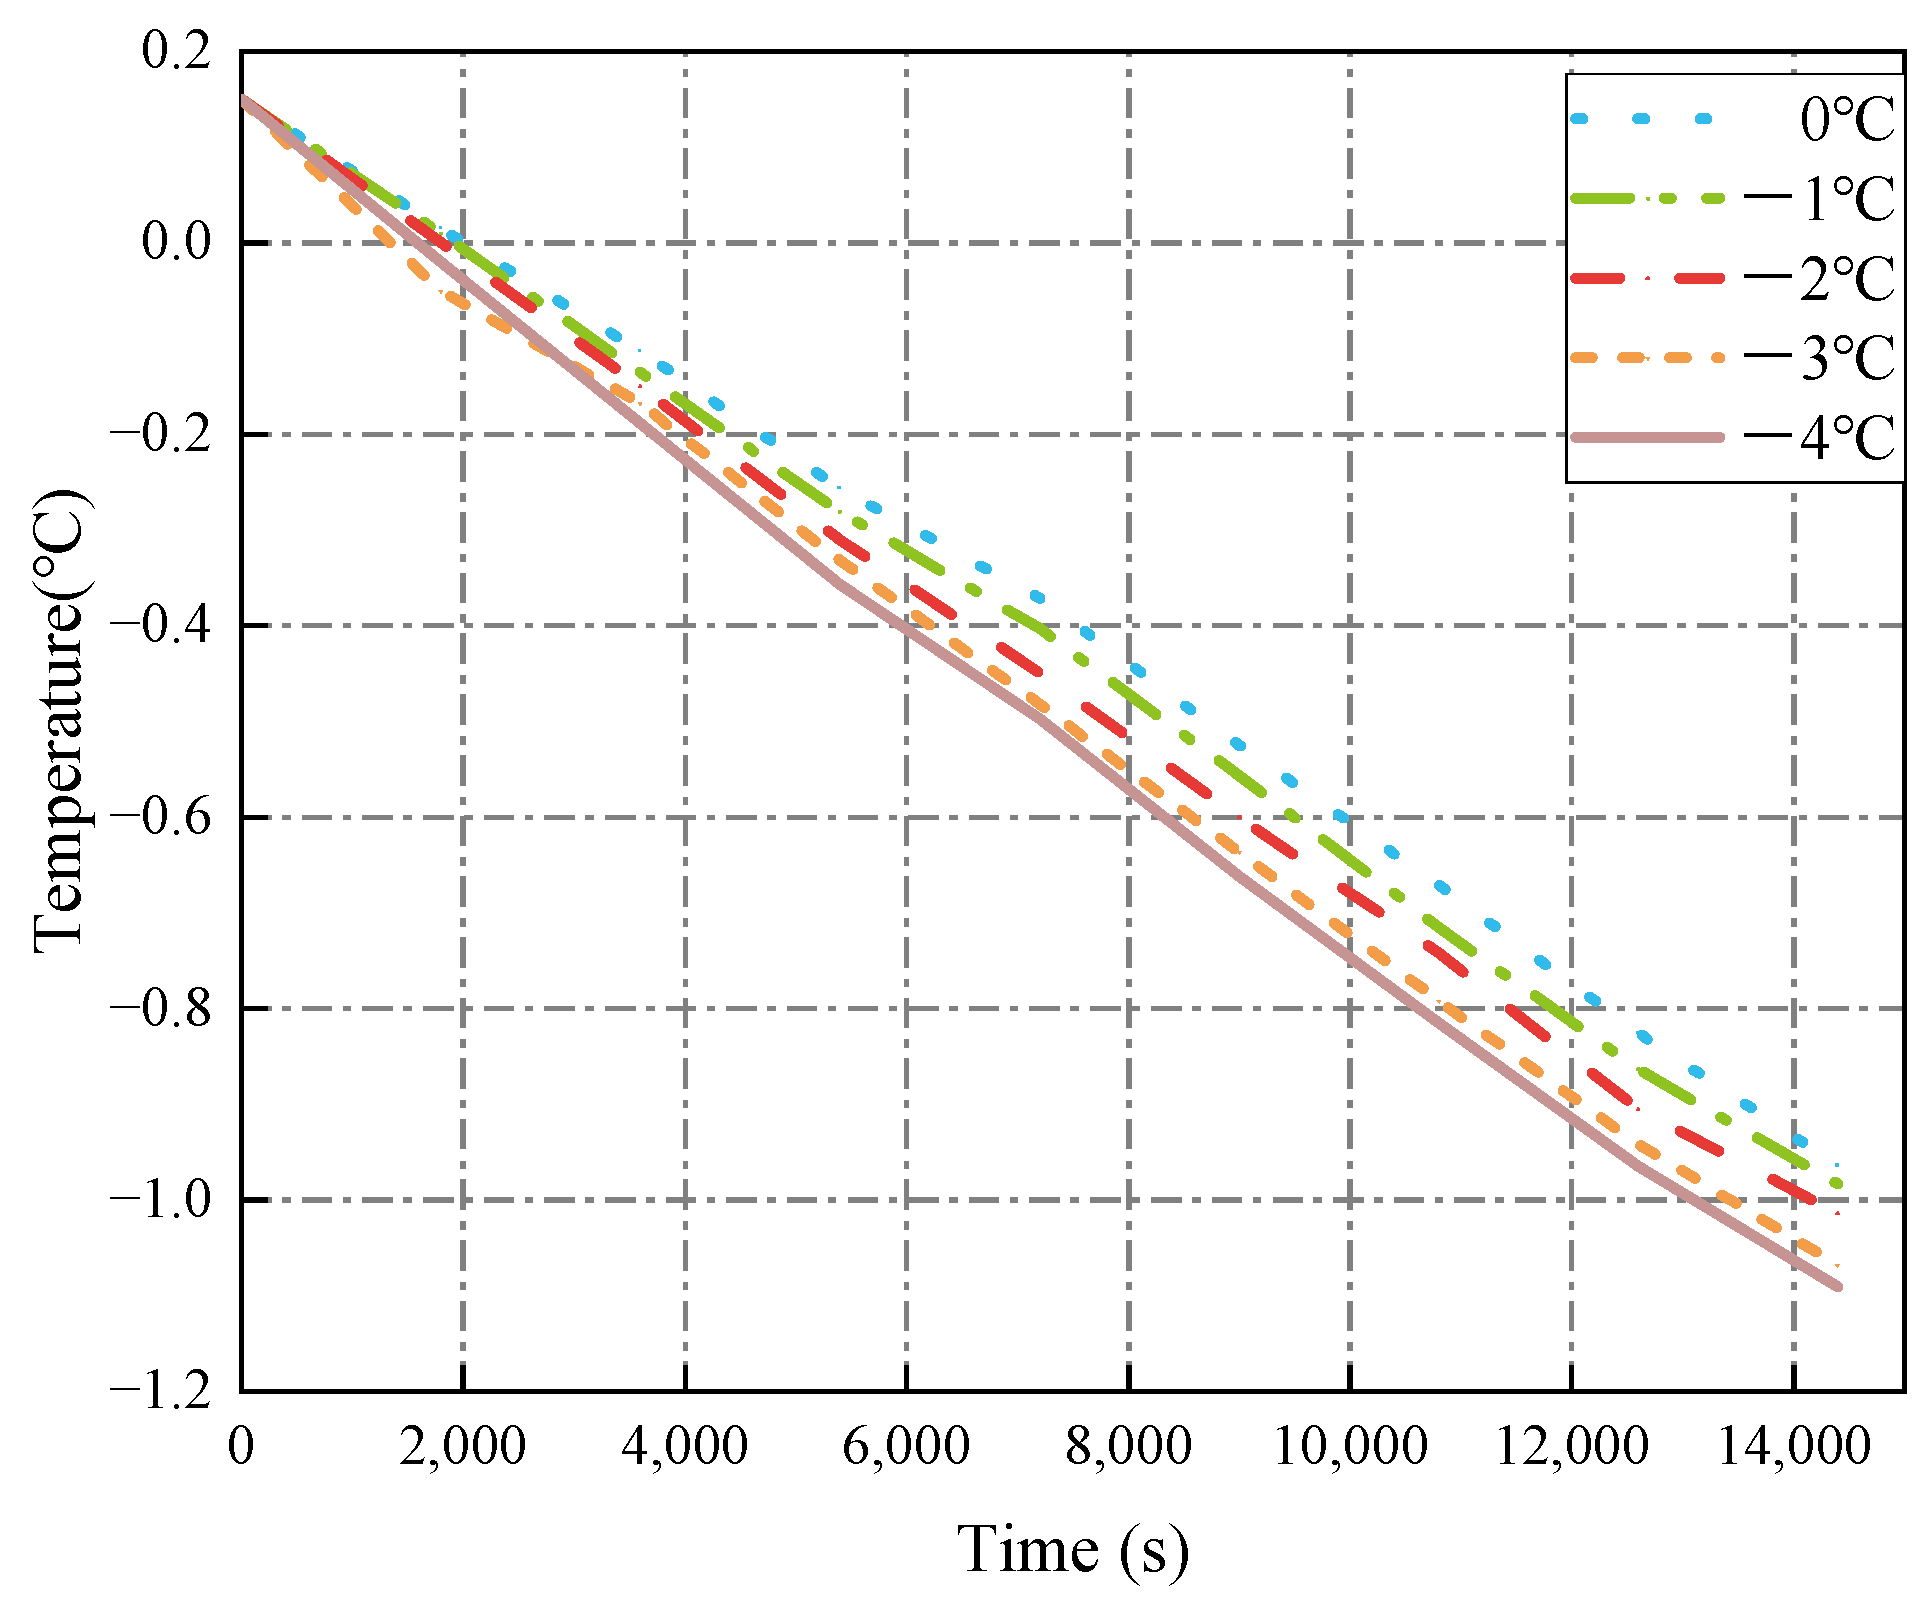
3.1.2. Seawater Temperature

This section mainly discusses the influence of seawater temperature change on the temperature change in the ballast tank. Considering that the seawater temperature generally changes in the range of −3 °C~0 °C, the seawater temperature is selected as 0 °C, −1 °C, −2 °C, −3 °C and −4 °C, the ambient temperature is maintained at −30 °C, the ballast water height is 4.5 m, and other environmental conditions remain unchanged. Table 4 shows the environmental conditions under different working conditions, and Figure 10 shows a temperature field distribution cloud map of the freezing process under different seawater temperatures.
Figure 11 and Figure 12 show the curves of temperature at a and b points with time at different seawater temperatures.
As illustrated in Figure 10, changes in seawater temperature significantly impact the temperature distribution within the tank. As the seawater temperature decreases, the temperature variation in the air domain remains minimal, while the temperature change in the ballast water near the right bulkhead is substantial. The lower the seawater temperature, the more rapidly the temperature of the ballast water adjacent to the right bulkhead decreases. At 14,400 s, when the seawater temperature drops from 0 °C to −4 °C, the temperature gradient on the right side of the ballast tank gradually increases, and the low-temperature zone progressively extends into the ballast water. Comparing cases S1 and S5, it is evident that when the seawater temperature is 0 °C, the cooling range of the right bulkhead is limited. However, when the seawater temperature reaches −4 °C, a distinct low-temperature freezing zone forms on the right bulkhead.
Comparing and analyzing Figure 11 and Figure 12, it is evident that as the seawater temperature decreases, the temperature change at point a is minimal, while the temperature change at point b is substantial. When the seawater temperature dropped from 0 °C to −4 °C, the minimum temperature at point a decreased from −0.964 °C to −1.091 °C, representing a reduction of approximately 13.17%. In contrast, the minimum temperature at point b decreased from −0.587 °C to −1.518 °C, indicating a decrease of about 158.61%. This discrepancy can be attributed to the location of point a, which is situated at the center of the ballast water level, where convective heat transfer with the air is frequent. Consequently, it is less affected by seawater temperature fluctuations, resulting in a relatively stable temperature change. Conversely, point b is located near the right bulkhead, where the convective heat transfer coefficient between the ballast water and seawater is high, facilitating significant heat transfer. As the seawater temperature decreases, the heat released by the ballast water increases, leading to a more rapid temperature reduction.

3.1.3. Ballast Water Height

During the navigation of ships in the polar region, due to the complex and harsh environmental conditions in the polar region, the height of the ballast water level needs to be adjusted frequently to improve the stability of the ship. In order to explore the influence of the ballast water level height on temperature change, this section selects ballast water heights of 0.5 m, 0.45 m, 0.4 m, 0.3 m, and 0.2 m for sensitivity analysis. The ambient temperature is constant at −30 °C, and the seawater temperature is constant at −2 °C. Table 5 shows the environmental conditions under different working conditions, and Figure 13 shows the temperature field distribution cloud map of the freezing process at different liquid level heights.
Figure 14 and Figure 15 are shown as the curves of temperature change with time at points a and b at different liquid level heights.
It can be observed from Figure 13 that as the height of the ballast water level decreases from 5 m to 2 m, the range and impact of the air domain on the ballast water gradually increase. This enhancement promotes convective heat transfer between the air domain and the ballast water, subsequently increasing the cooling rate of the ballast water. Additionally, when the ballast water level falls below the waterline, the air domain is influenced by both the cold air temperature and the seawater temperature. For instance, in cases B3 to B5, the temperature of the right bulkhead is lower than that of the air domain, resulting in a temperature hysteresis phenomenon. As the ballast water level decreases, the temperature hysteresis becomes more pronounced, and the range of temperatures that are not completely cooled becomes more evident. This occurs because both the seawater temperature and the cold air temperature are elevated, significantly affecting the air heat transfer rate. The lower the liquid level, the more pronounced the effect of seawater temperature becomes. Consequently, the temperature of the air domain decreases at a slower rate.
Figure 14 and Figure 15 illustrate the correlation between the height of the ballast water level and temperature changes. As the height of the ballast water level decreases, the minimum temperatures at points a and b also decline, albeit to varying degrees, with the overall change being relatively small. When the ballast water level is at 5 m, the volume of the air domain is limited, resulting in a shorter heat transfer time. Consequently, the temperature of the ballast water decreases rapidly, with the minimum temperature at point a reaching −1.14 °C and at point b reaching −1.34 °C. When the ballast water level is reduced to 2 m, the volume of the air domain increases, leading to a longer heat transfer time and a slower decrease in temperature. In this case, the minimum temperature at point a is −0.88 °C, while at point b, it is −1.04 °C.

3.2. Influence of Environmental Parameters on the Ice Shape Evolution

3.2.1. Cold Air Temperature

This section primarily studies the impact of cold air temperature changes on the evolution of ice shape in the freezing process in ballast tanks. The temperature of cold air is selected as −40 °C, −35 °C, −30 °C, −25 °C and −20 °C, while the other environmental conditions remain unchanged. This paper selected the volume fraction of ice phase (the proportion of ice to ballast water) as an index to measure the degree of freezing. Figure 16 shows the evolution of ice shape in the ballast tank at a typical time under different cold air temperatures. Figure 17 shows the variation curve of the ice volume fraction of the ballast tank with time under different cold air temperatures.
Combined with Figure 7 and Figure 16, it is evident that, under the influence of cold air temperatures, the freezing degree of the ballast tank increases over time. At a cold air temperature of −20 °C, the temperature change at the ballast water level is relatively gradual, resulting in the formation of a thin ice layer at that level. However, when the cold air temperature drops to −25 °C, the temperature near the center point ‘a’ of the ballast water level fluctuates slightly, which reduces the temperature of the ballast water and increases the ice thickness at that level. As the cold air temperature decreases further, the amplitude of these fluctuations increases slightly, and the fluctuation position gradually migrates toward the right bulkhead. At a cold air temperature of −40 °C, temperature fluctuations are observed on the right bulkhead, extending to the inner depression of the ballast water, as illustrated in Figure 16a. A certain thickness of ice forms at the junction of the ballast water level and the right bulkhead.
The temperature of the cold air decreased from −20 °C to −40 °C. The right bulkhead of the ballast water gradually transformed from a thin, strip-like cooling zone into a significant temperature gradient, as illustrated in Figure 16a–d. When the temperature of the cold air was higher, the ice layer formed on the right bulkhead was thinner. Conversely, when the temperature of the cold air dropped, the extent of freezing in the right bulkhead increased, gradually extending into the interior of the ballast water tank. As shown in Figure 17, when the ambient temperature is −20 °C, the maximum volume fraction of the ice phase in the ballast water tank is approximately 42.05%. When the temperature decreases to −40 °C, the maximum volume fraction of the ice phase in the ballast water tank rises to approximately 84.33%, indicating a relatively high degree of freezing in the ballast water tank. Therefore, the evolution of ice formation in ballast water tanks is primarily influenced by changes in the temperature field. The faster the rate of change in the temperature field, the more rapid the evolution of ice form evolution.

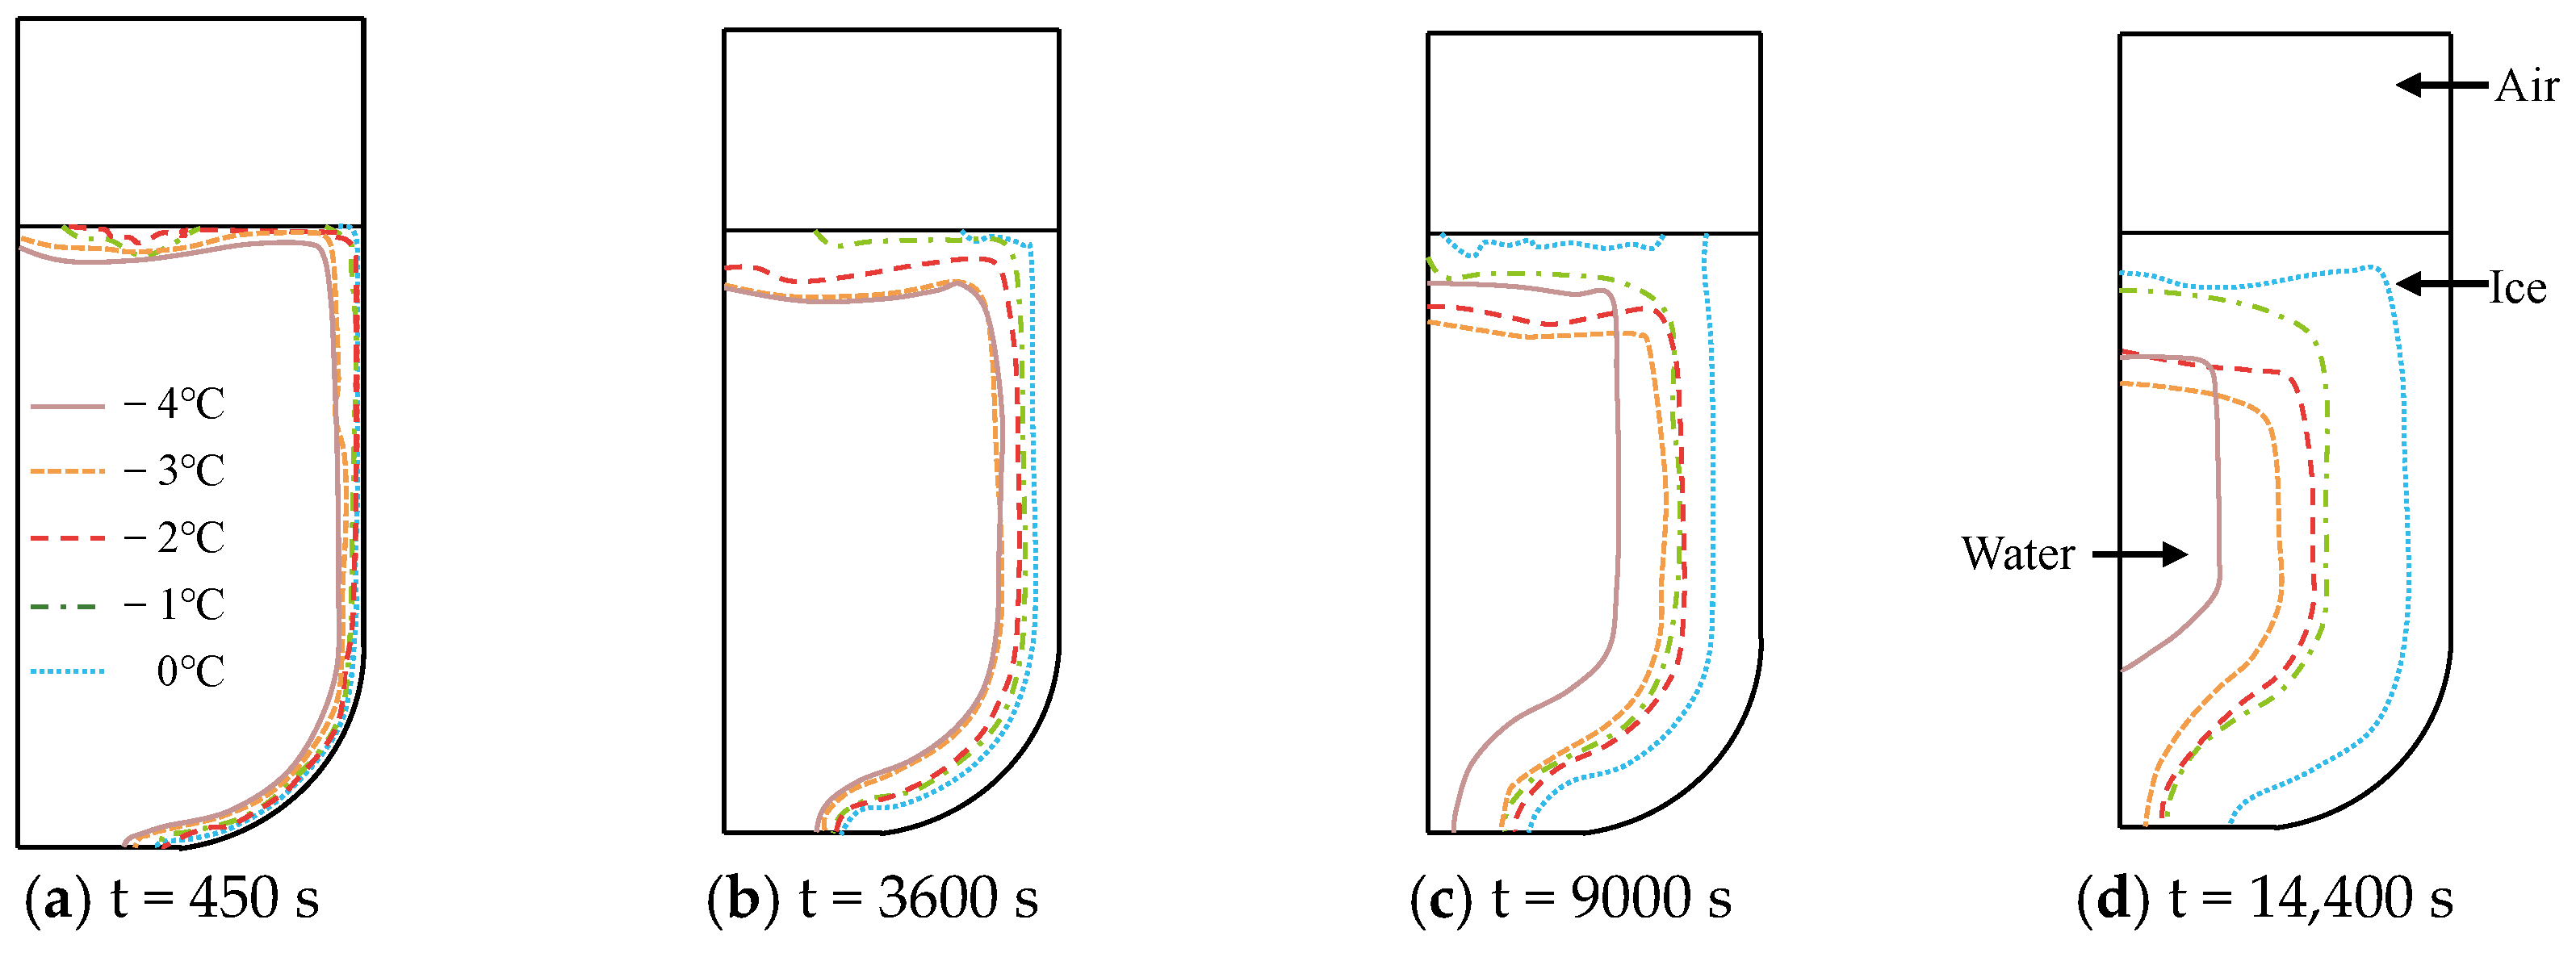
3.2.2. Seawater Temperature

The seawater temperatures were selected as 0 °C, −1 °C, −2 °C, −3 °C and −4 °C, respectively, while the other environmental conditions remained unchanged. The evolution of ice shape in the freezing process of ballast water under changes in the seawater temperature was analyzed. Figure 18 shows the evolution of the ice shape in the ballast tank at typical moments at different seawater temperatures. Figure 19 shows the curve of the ice volume fraction of the ballast tank with time at different seawater temperatures.
Combined with Figure 10 and Figure 18, it is evident that changes in the seawater temperature significantly influence the freezing characteristics of ballast water. When the seawater temperature is at 0 °C, as shown in Figure 18a, the temperature change within the ballast tank is minimal, resulting in a slow ice growth rate, a low freezing degree, and the formation of almost no ice layer. As the seawater temperature decreases to −1 °C, the temperature near point a, located at the center of the ballast water level, fluctuates slightly. At this point, the ice formation at the ballast water level takes on a distinct curvature. When the seawater temperature drops to −4 °C, the temperature at the liquid level of the ballast water reaches the freezing point, creating a thicker freezing temperature zone on the right side of the bulkhead, as illustrated in Figure 18d. Therefore, changes in seawater temperature have a substantial impact on the growth of ice formations on the right bulkhead. The greater the decrease in seawater temperature, the more pronounced the growth rate of the ice formations on the right bulkhead.
It can be observed from Figure 19 that as the seawater temperature decreases, the volume fraction of the ice phase in the ballast tank increases correspondingly. At a seawater temperature of 0 °C, the ice volume fraction is approximately 24.57% at 14,000 s, indicating a low degree of freezing. In contrast, at a seawater temperature of −4 °C, the ice volume fraction rises to about 91.53% at 14,000 s, reflecting a high degree of freezing, which represents an increase of approximately 272.52%. This phenomenon occurs because the seawater is in direct contact with the ballast water. A decrease in seawater temperature directly impacts the ballast water, enhancing its heat transfer efficiency and promoting the formation of ice on the right side of the bulkhead. Consequently, at a seawater temperature of −4 °C, the volume fraction of ice in the ballast water tank reaches its maximum.

3.2.3. Ballast Water Height

The height of the ballast water is selected as 0.5 m, 0.45 m, 0.4 m, 0.3 m and 0.2 m, respectively, while the other environmental conditions remain unchanged. The influence of a change in the height of the ballast water level on the evolution of ice shape during the freezing process in ballast tanks is analyzed. Figure 20 shows the evolution of the ice phase in ballast tanks at different liquid level heights, and Figure 21 shows the change curve of the ice volume fraction in ballast tanks at different liquid level heights.
As illustrated in the ice shape evolution depicted in Figure 20, the freezing rate and degree of freezing of ballast water vary with different liquid level heights. As the liquid level of the ballast water decreases, the degree of freezing increases correspondingly. Combined with the analysis of Figure 13, it can be concluded that at positions with a significant temperature variation range, the freezing rate of ballast water fluctuates considerably. As shown in Figure 20a–d, when the liquid level height is 5 m, the ice layer first appears on the left and right sides of the ballast water surface near the bulkhead, gradually evolving into the interior of the ballast water as the liquid level decreases. When the liquid level height reaches 2 m, the volume of the air domain is larger, significantly enhancing the effect of cold air temperature on the ballast water. Consequently, the ice layer formed by the freezing of ballast water is relatively thick and exhibits a high degree of freezing.
The influence of the ballast water height on the freezing rate differs from that of temperature. When the ballast water height is elevated, the volume of the air space in the ballast water tank decreases. Due to the low specific heat capacity of air, the heat transfer rate increases, leading to a faster freezing rate in the ballast water. Conversely, when the ballast water height is lower, the volume of the ballast water is also diminished, requiring less heat for complete freezing. As a result, the ballast water demonstrates a relatively high degree of freezing.
Figure 21 clearly illustrates the change in the ice volume fraction over time at varying liquid levels. When the ballast water height is 5 m and the time is 14,400 s, the ice phase volume fraction in the ballast tank is approximately 63.17%. Conversely, when the ballast water height is reduced to 2 m, the ice phase volume fraction in the ballast tank increases to approximately 92.35%, indicating a greater degree of freezing. Therefore, the change in the liquid level of the ballast water significantly impacts the heat transfer rate. As the height of the ballast water decreases, the heat transfer rate diminishes, while the relative degree of freezing increases.

3.3. The Limitations of the Numerical Model

On the one hand, during the navigation of ships in polar regions, ballast water is typically seawater with a specific salinity. Although some researchers have studied the freezing of brine, salts precipitate during the freezing process, causing the salinity of ballast water to fluctuate and subsequently affecting the distribution of ice formations. This issue still requires in-depth exploration [36,37]. Consequently, the assumption in this paper that ballast water is fresh water does not accurately reflect reality. Additionally, the ballast water in the ballast tank is often in a dynamic state. While some researchers have conducted experimental studies on the freezing of flowing water, the environmental conditions in polar regions are complex and variable, and current technology cannot precisely determine the movement patterns of ballast water [38]. Therefore, this paper does not consider the influence of ballast water flow on freezing, which may significantly impact the actual distribution of ice formations.
On the other hand, due to limitations in technical resources and testing conditions, there are currently few experiments on ballast water freezing simulation, ice pool freezing simulation, and reservoir freezing simulation. The numerical calculation model established in this paper has only been validated against the numerical results of other researchers, lacking comparison and verification with empirical test data. Consequently, the reliability of the numerical model is insufficient, and the data supporting the results are inadequate.
In the future, a numerical model of ballast water tanks that accounts for liquid flow will be developed. Additionally, the impact of salinity variations on freezing will be considered, thereby enhancing the accuracy of predictions regarding the ice shape distribution within ballast water tanks.

4. Conclusions

This study simulates the freezing process in ballast tanks of a polar LNG carrier. Utilizing Fluent fluid dynamics software, we integrate interphase mass, momentum, and heat transfer models into the Volume of Fluid (VOF) multiphase flow model to establish a numerical calculation framework for ballast water freezing. The accuracy of this numerical model is validated by comparing it with the ice phase volume fraction reported in the literature. We investigate the effects of the cold air temperature, seawater temperature, and ballast water level height on the temperature distribution and freezing process within the ballast tank. The main conclusions are as follows:
(1)
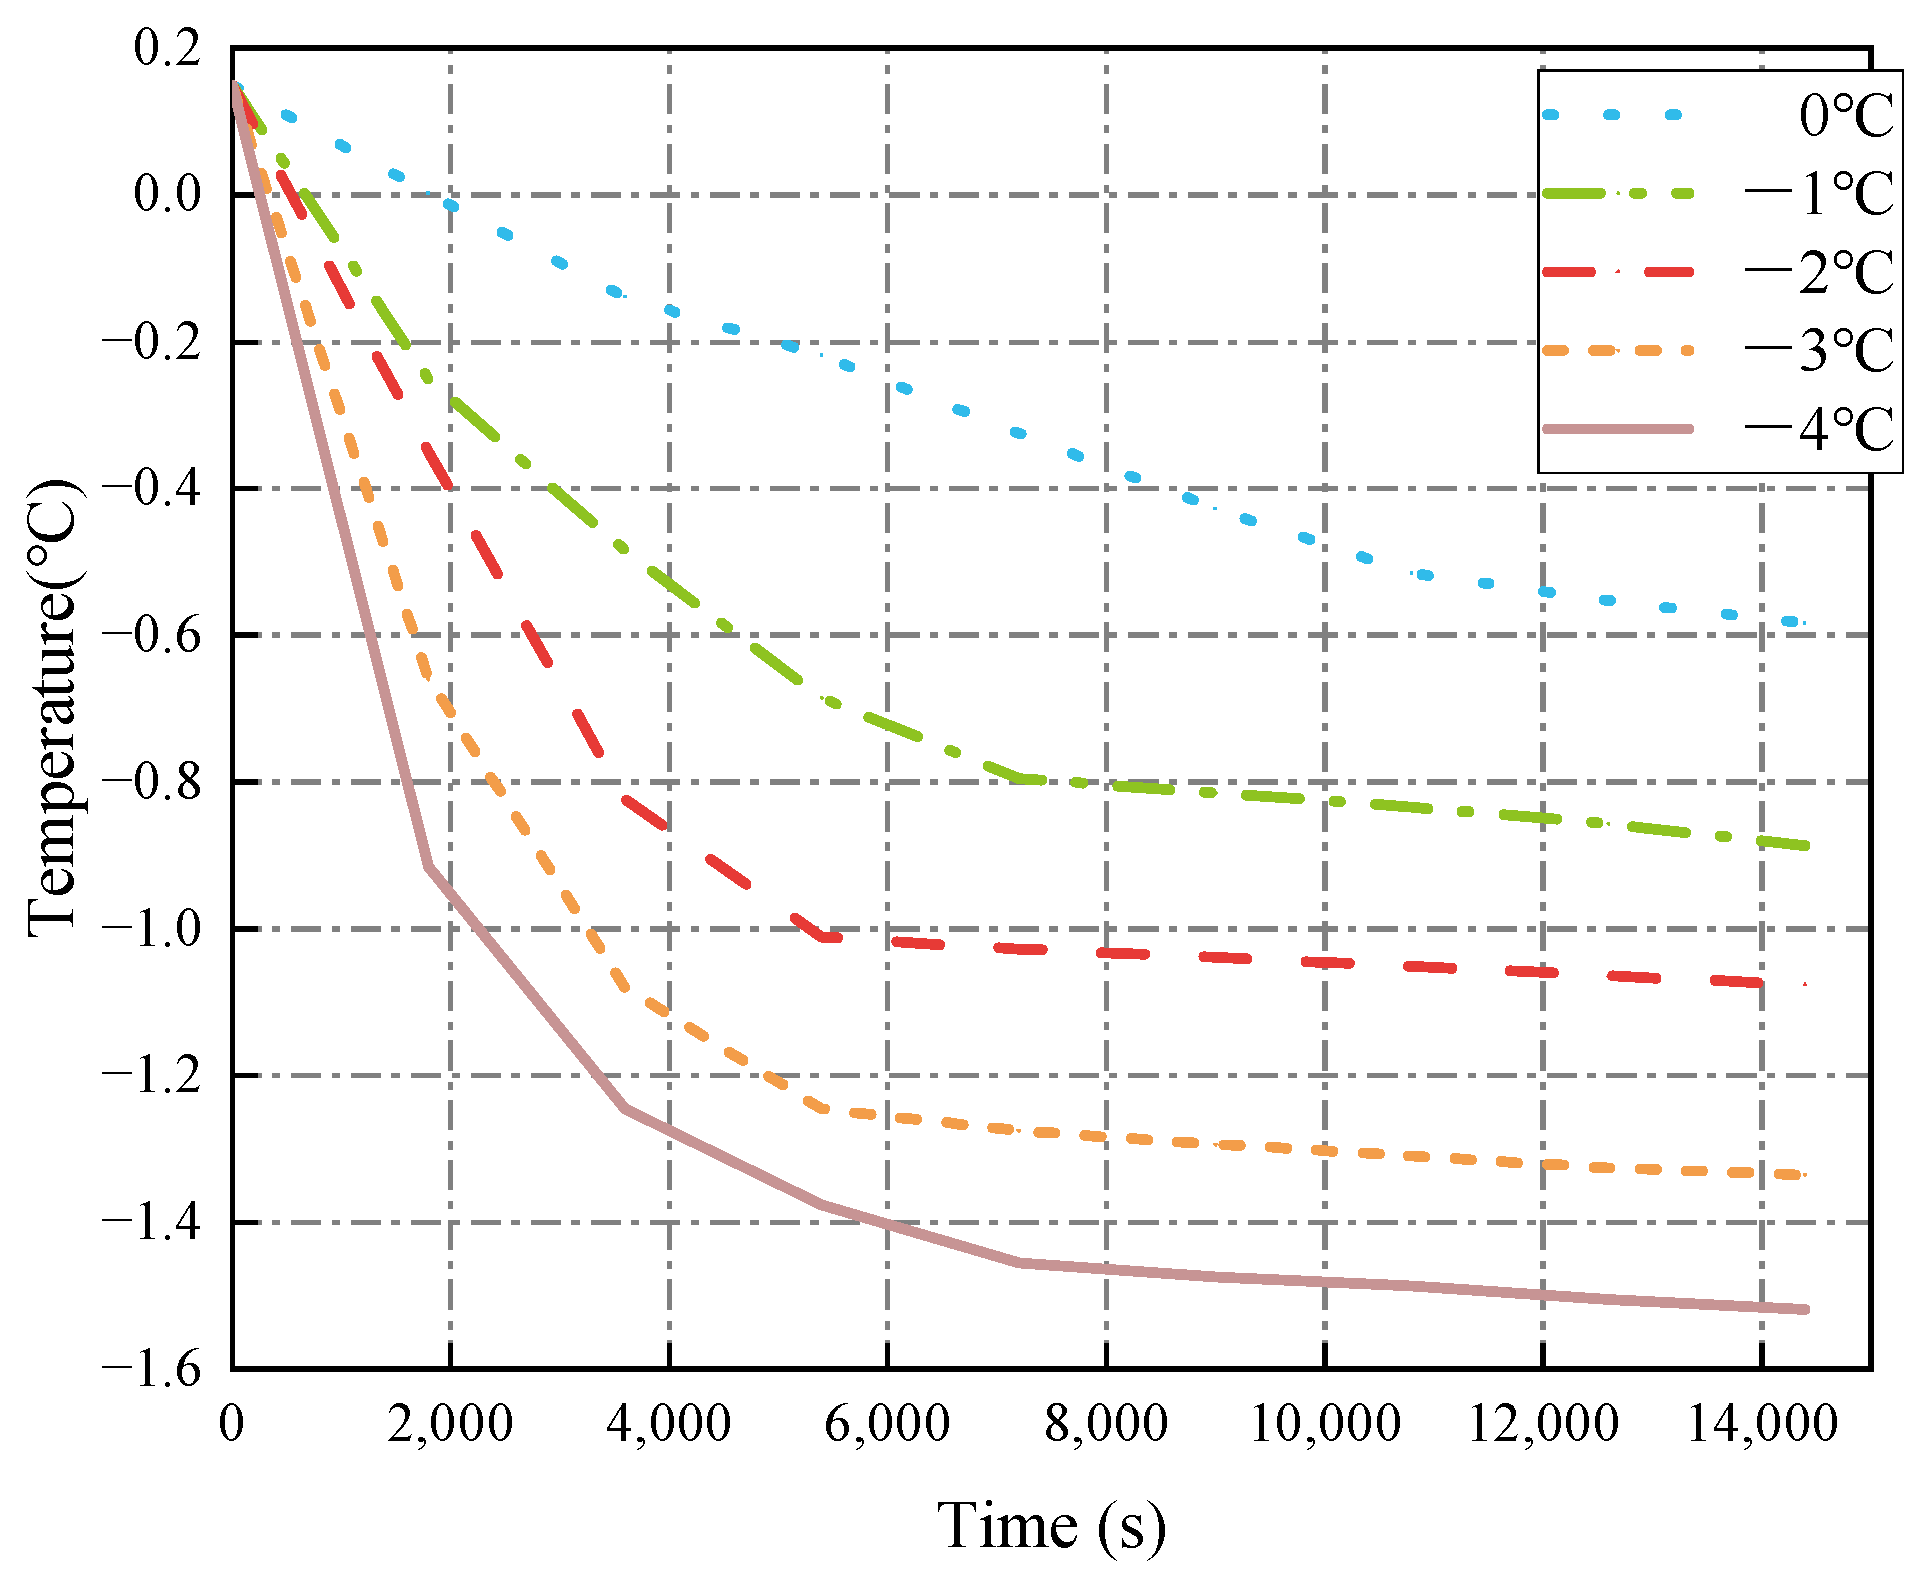
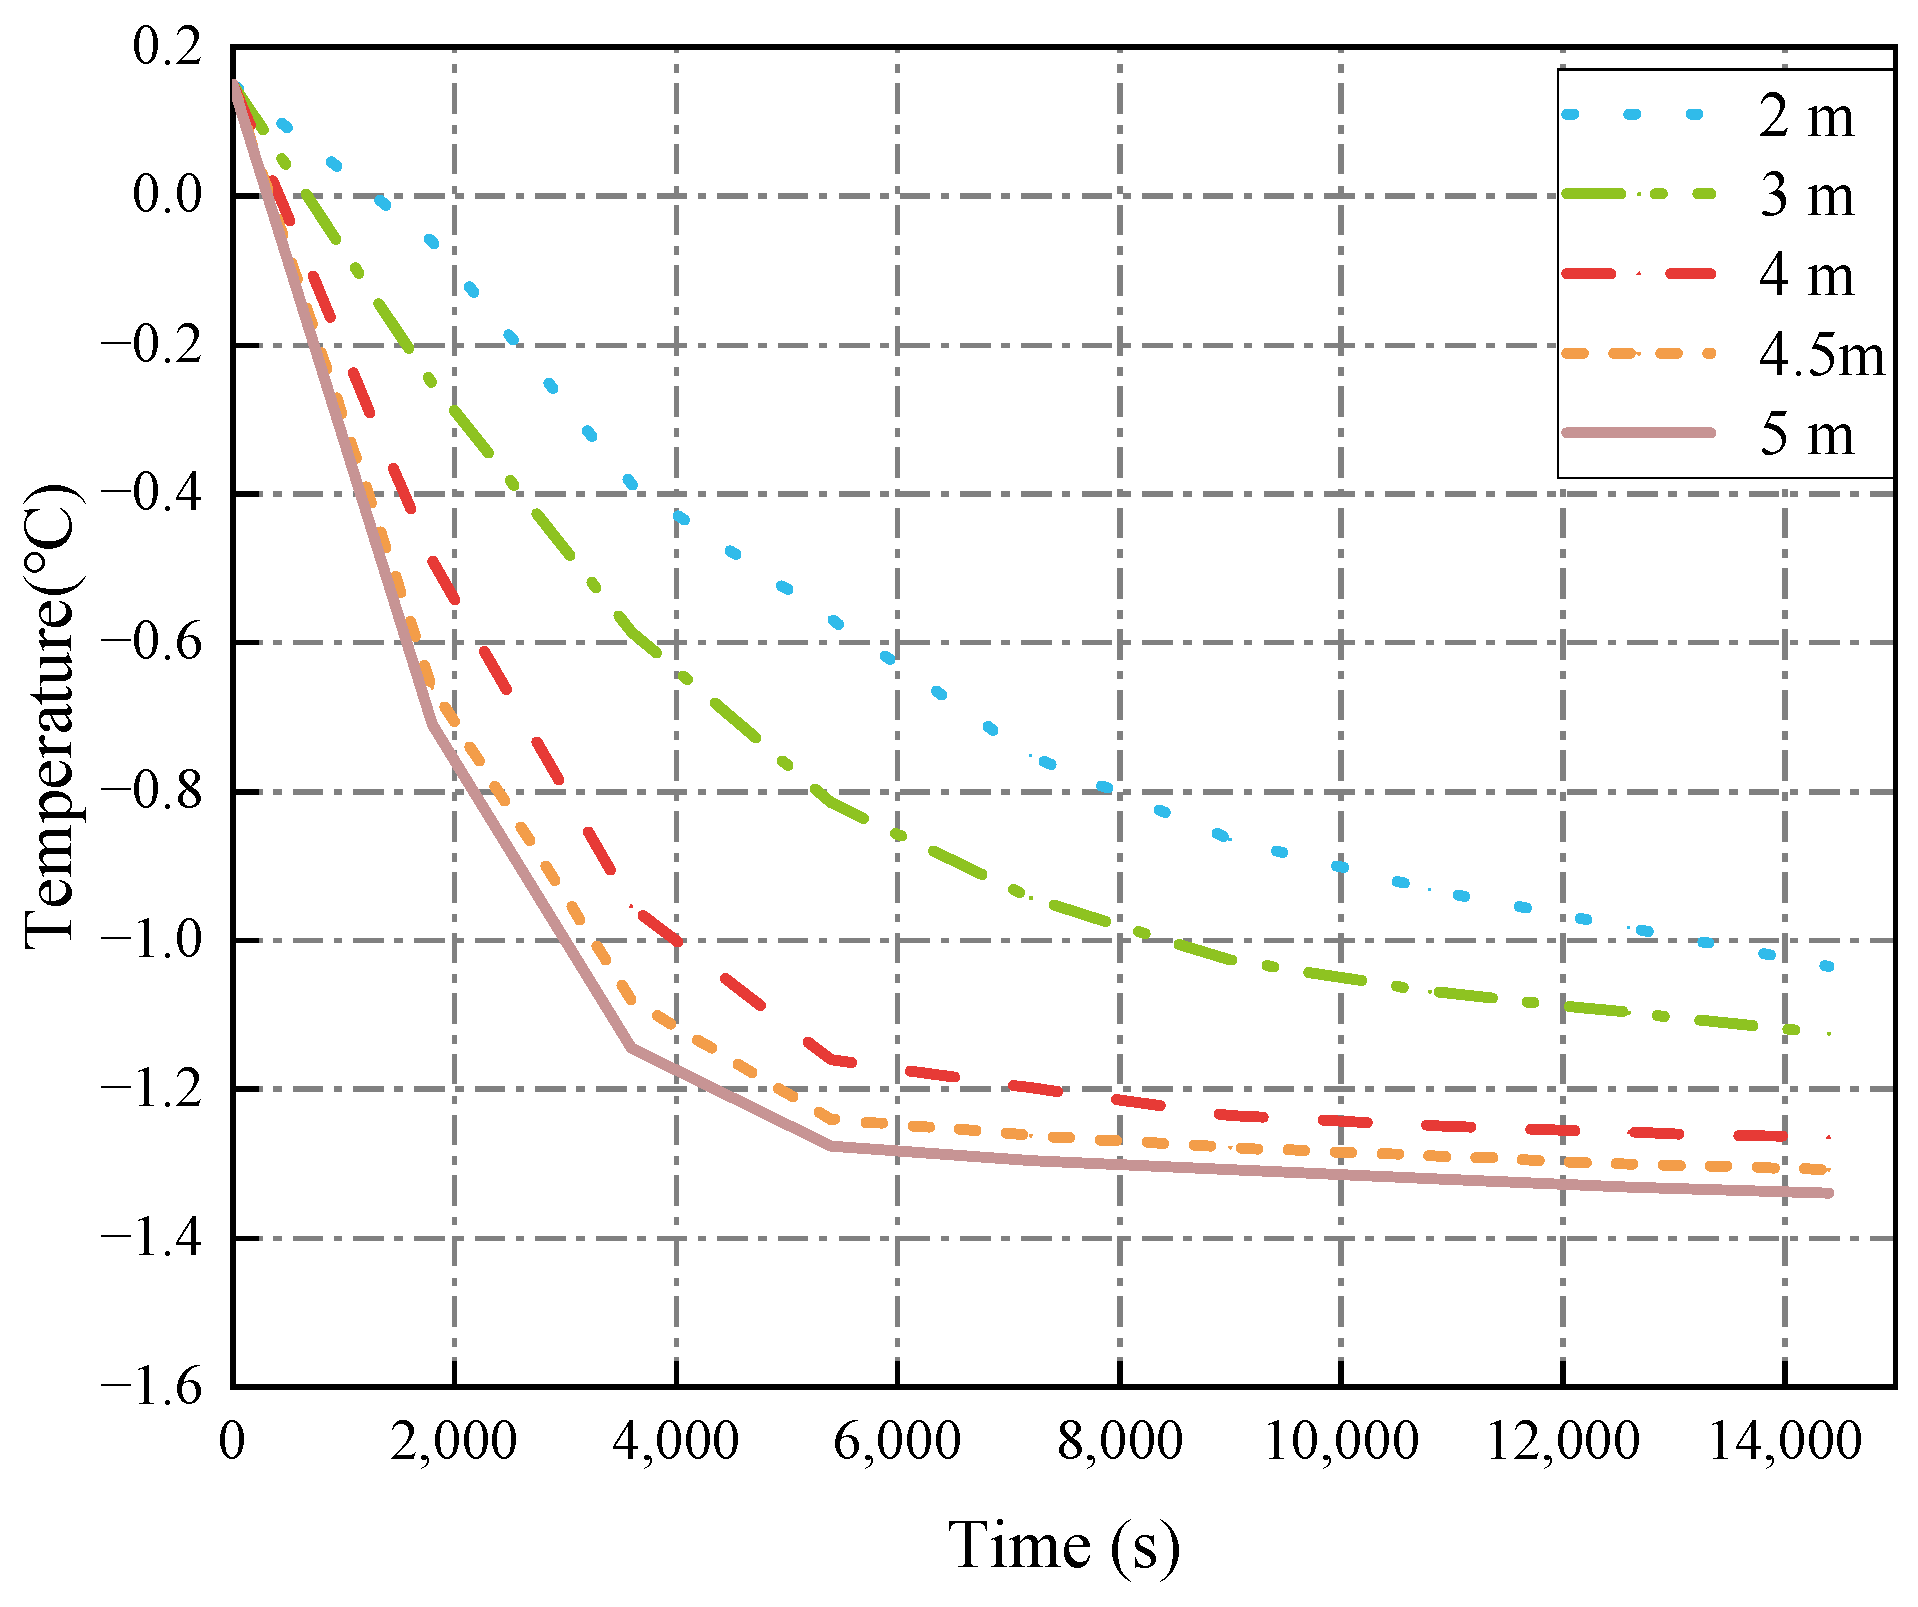
The decrease in cold air temperature significantly impacts the temperature of ballast water. As the cold air temperature drops, the rate of temperature reduction at the ballast water level accelerates markedly. When the cold air temperature reaches −40 °C, the temperature of the ballast water reaches its lowest point at −1.34 °C. Additionally, changes in the seawater temperature greatly affect the temperature near the bulkhead. As the seawater temperature decreases, the rate of temperature reduction in the ballast water at the right bulkhead also accelerates significantly. When the seawater temperature is −4 °C, the ballast water temperature at the right bulkhead reaches its lowest point at −1.518 °C. The change in the height of the ballast water level has a substantial influence on the heat transfer rate. As the height of the liquid level decreases, the time required for heat transfer increases, causing the heat transfer rate to slow down. When the height of the liquid level is 5 m, the heat transfer rate is at its fastest, and the temperature of the ballast water at that level is the lowest, measuring −1.14 °C.
(2)
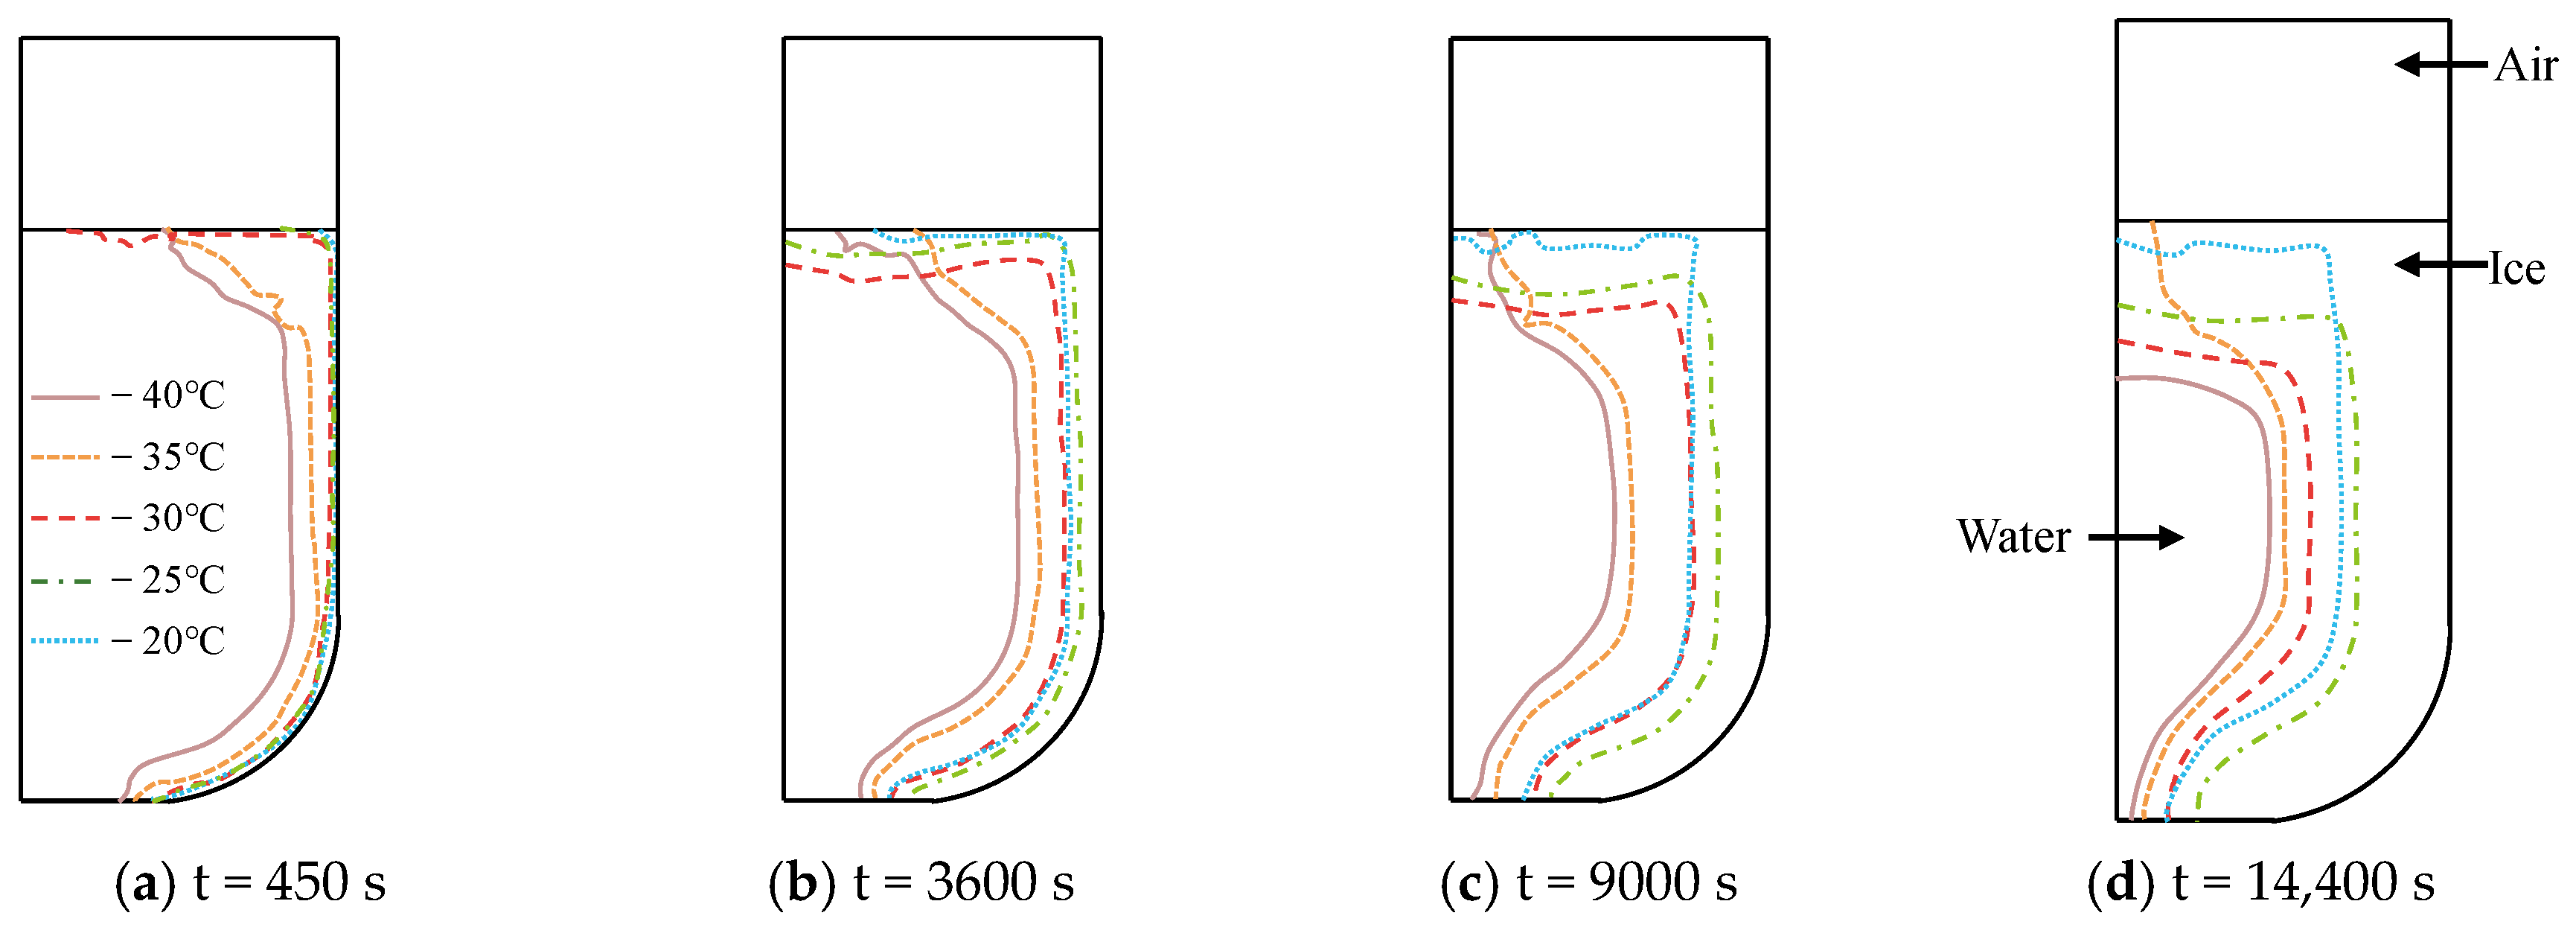
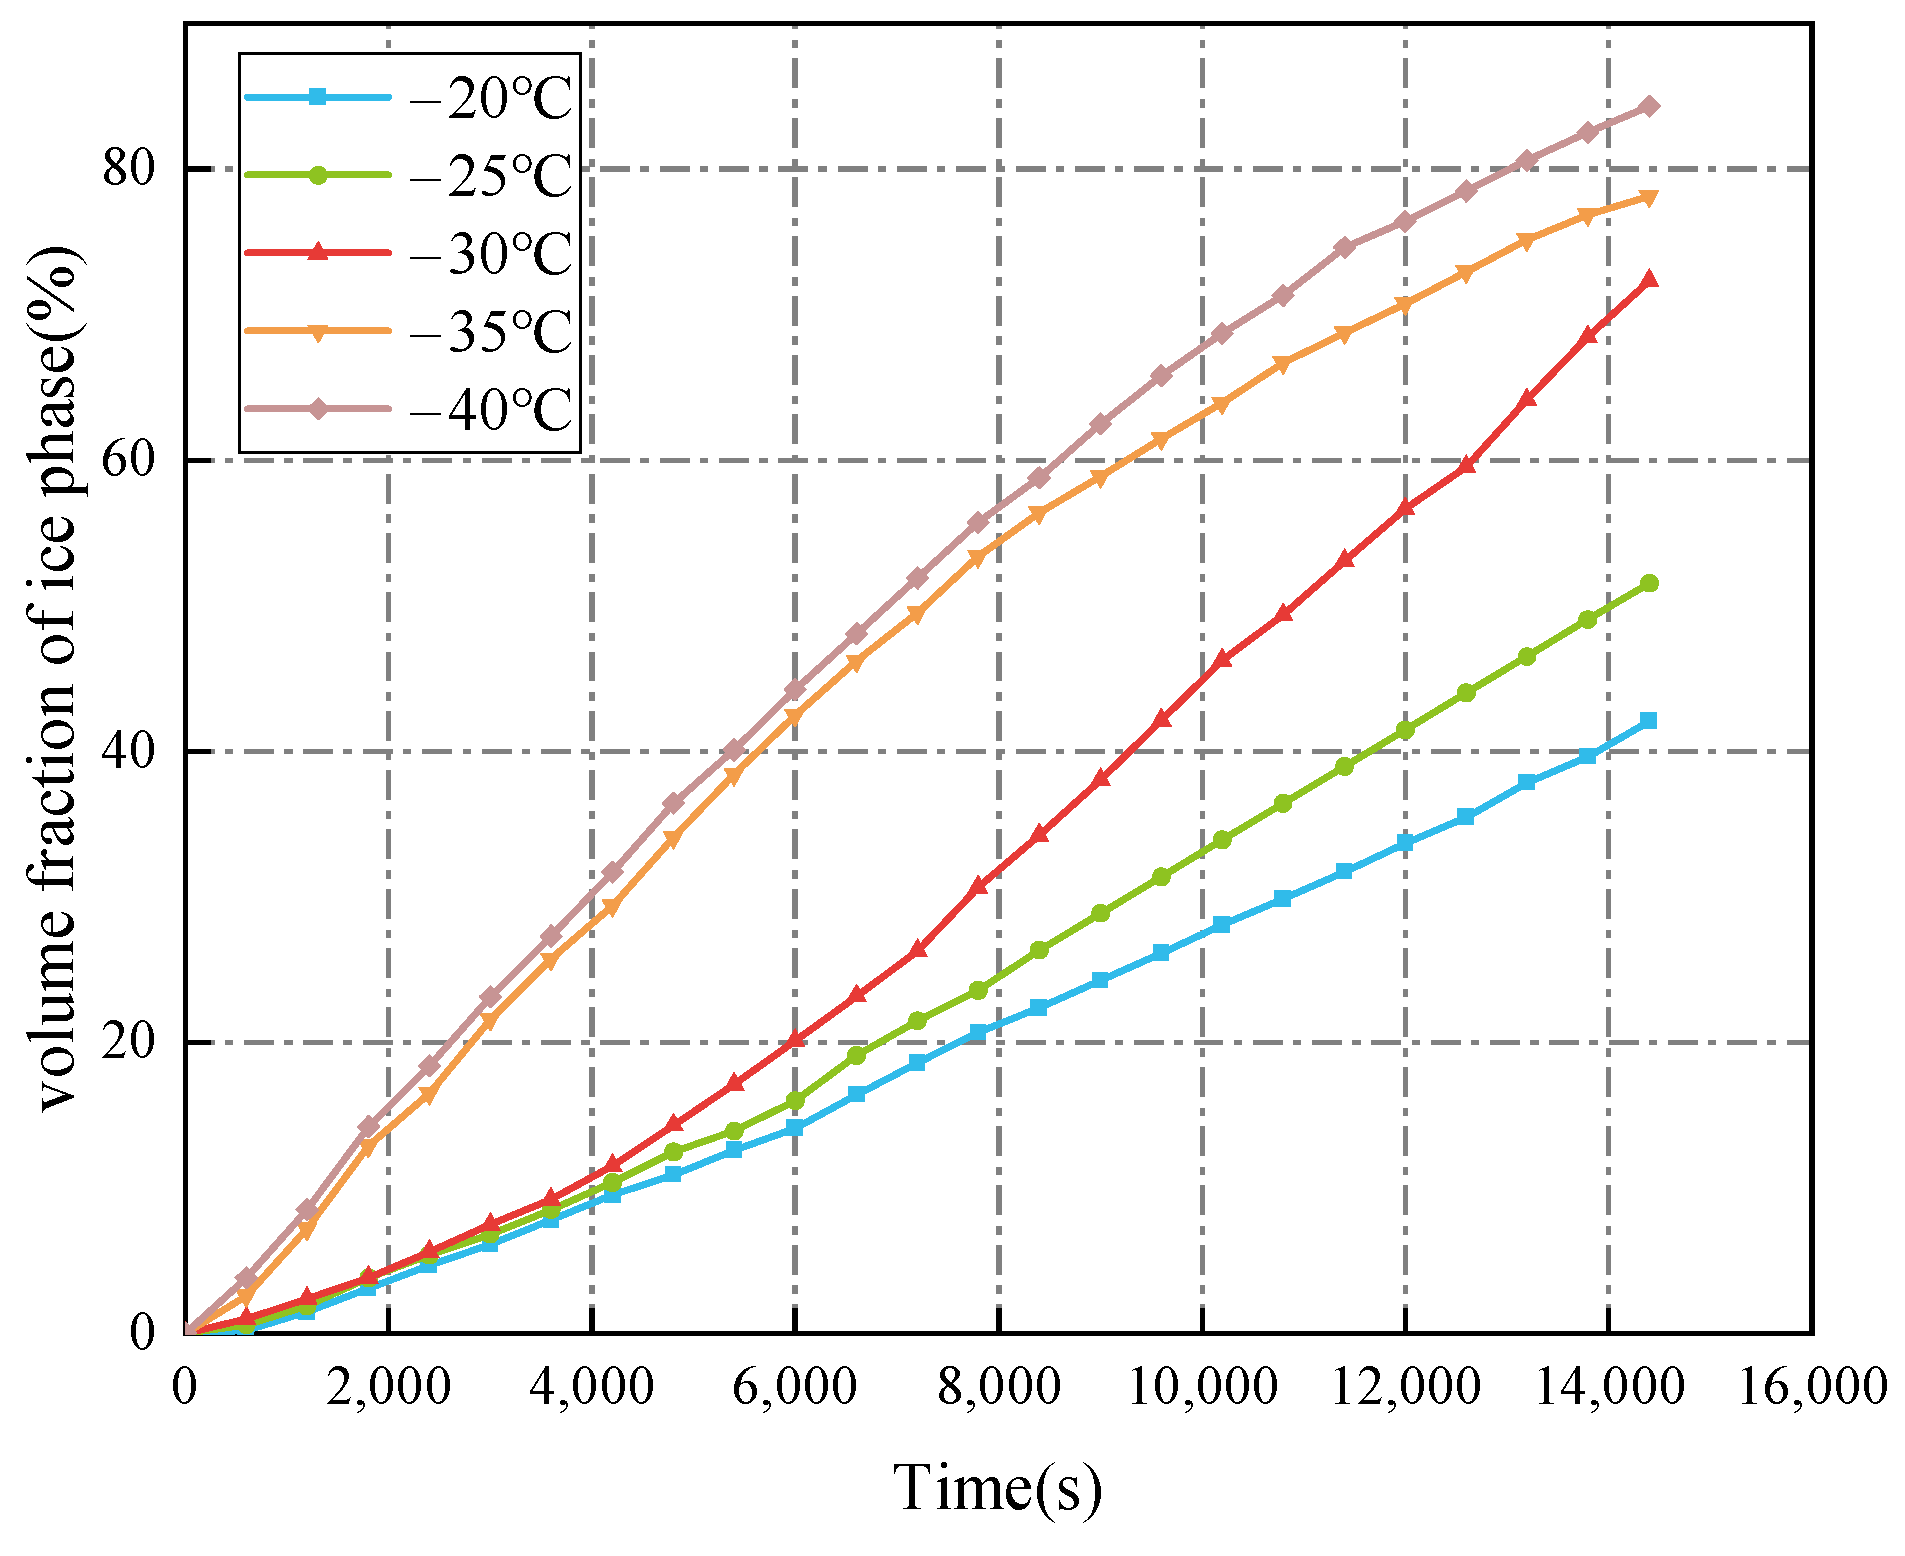
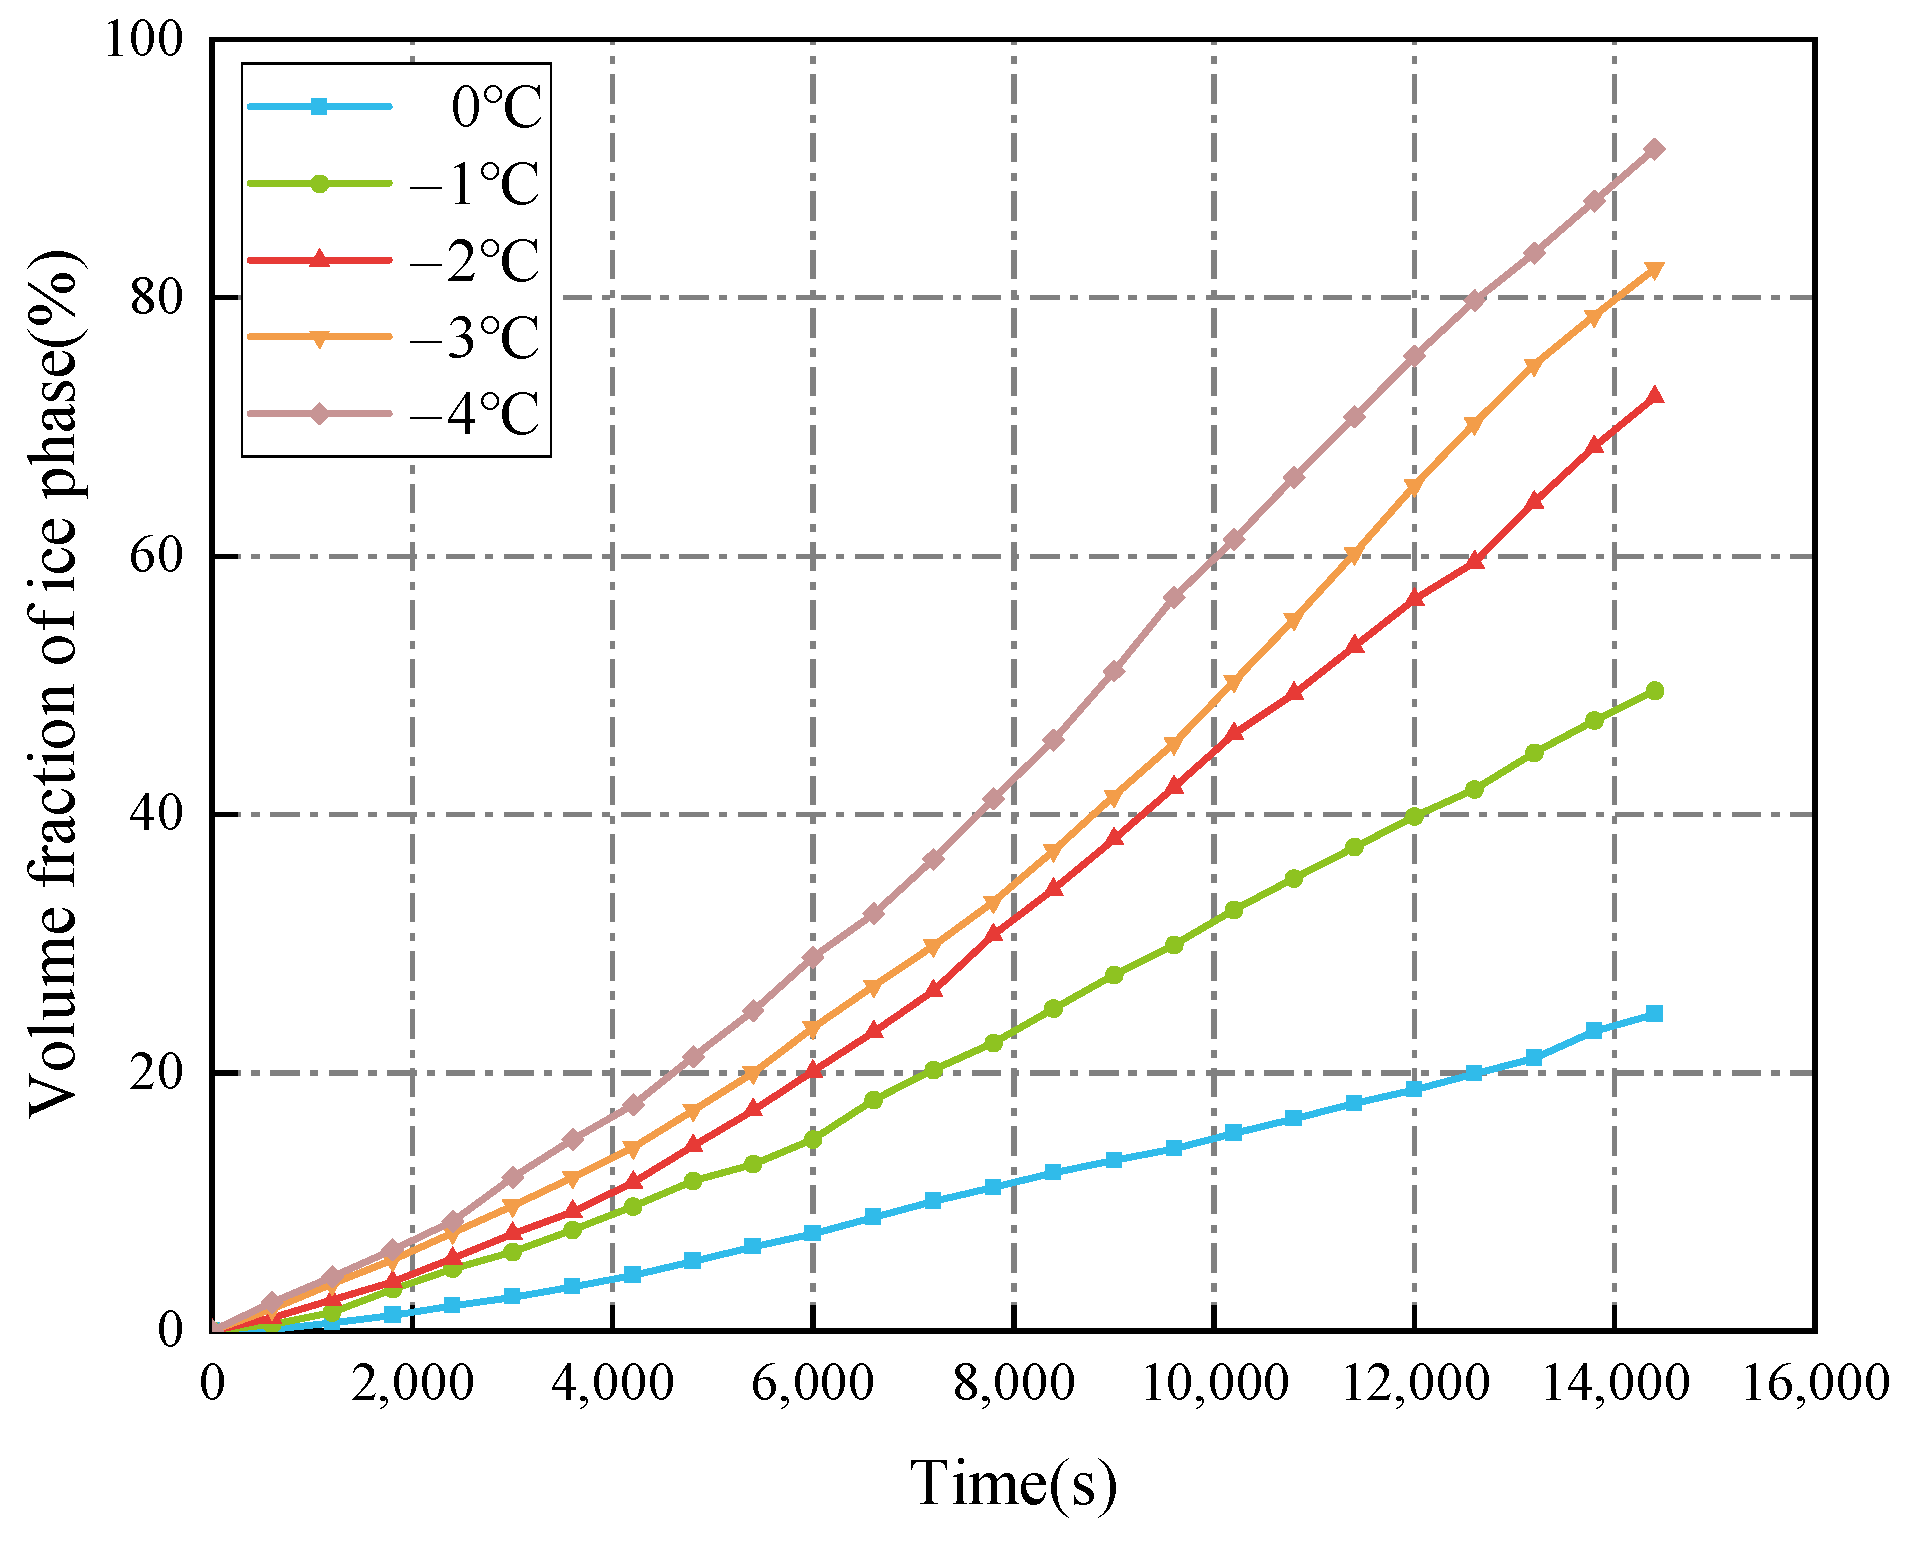
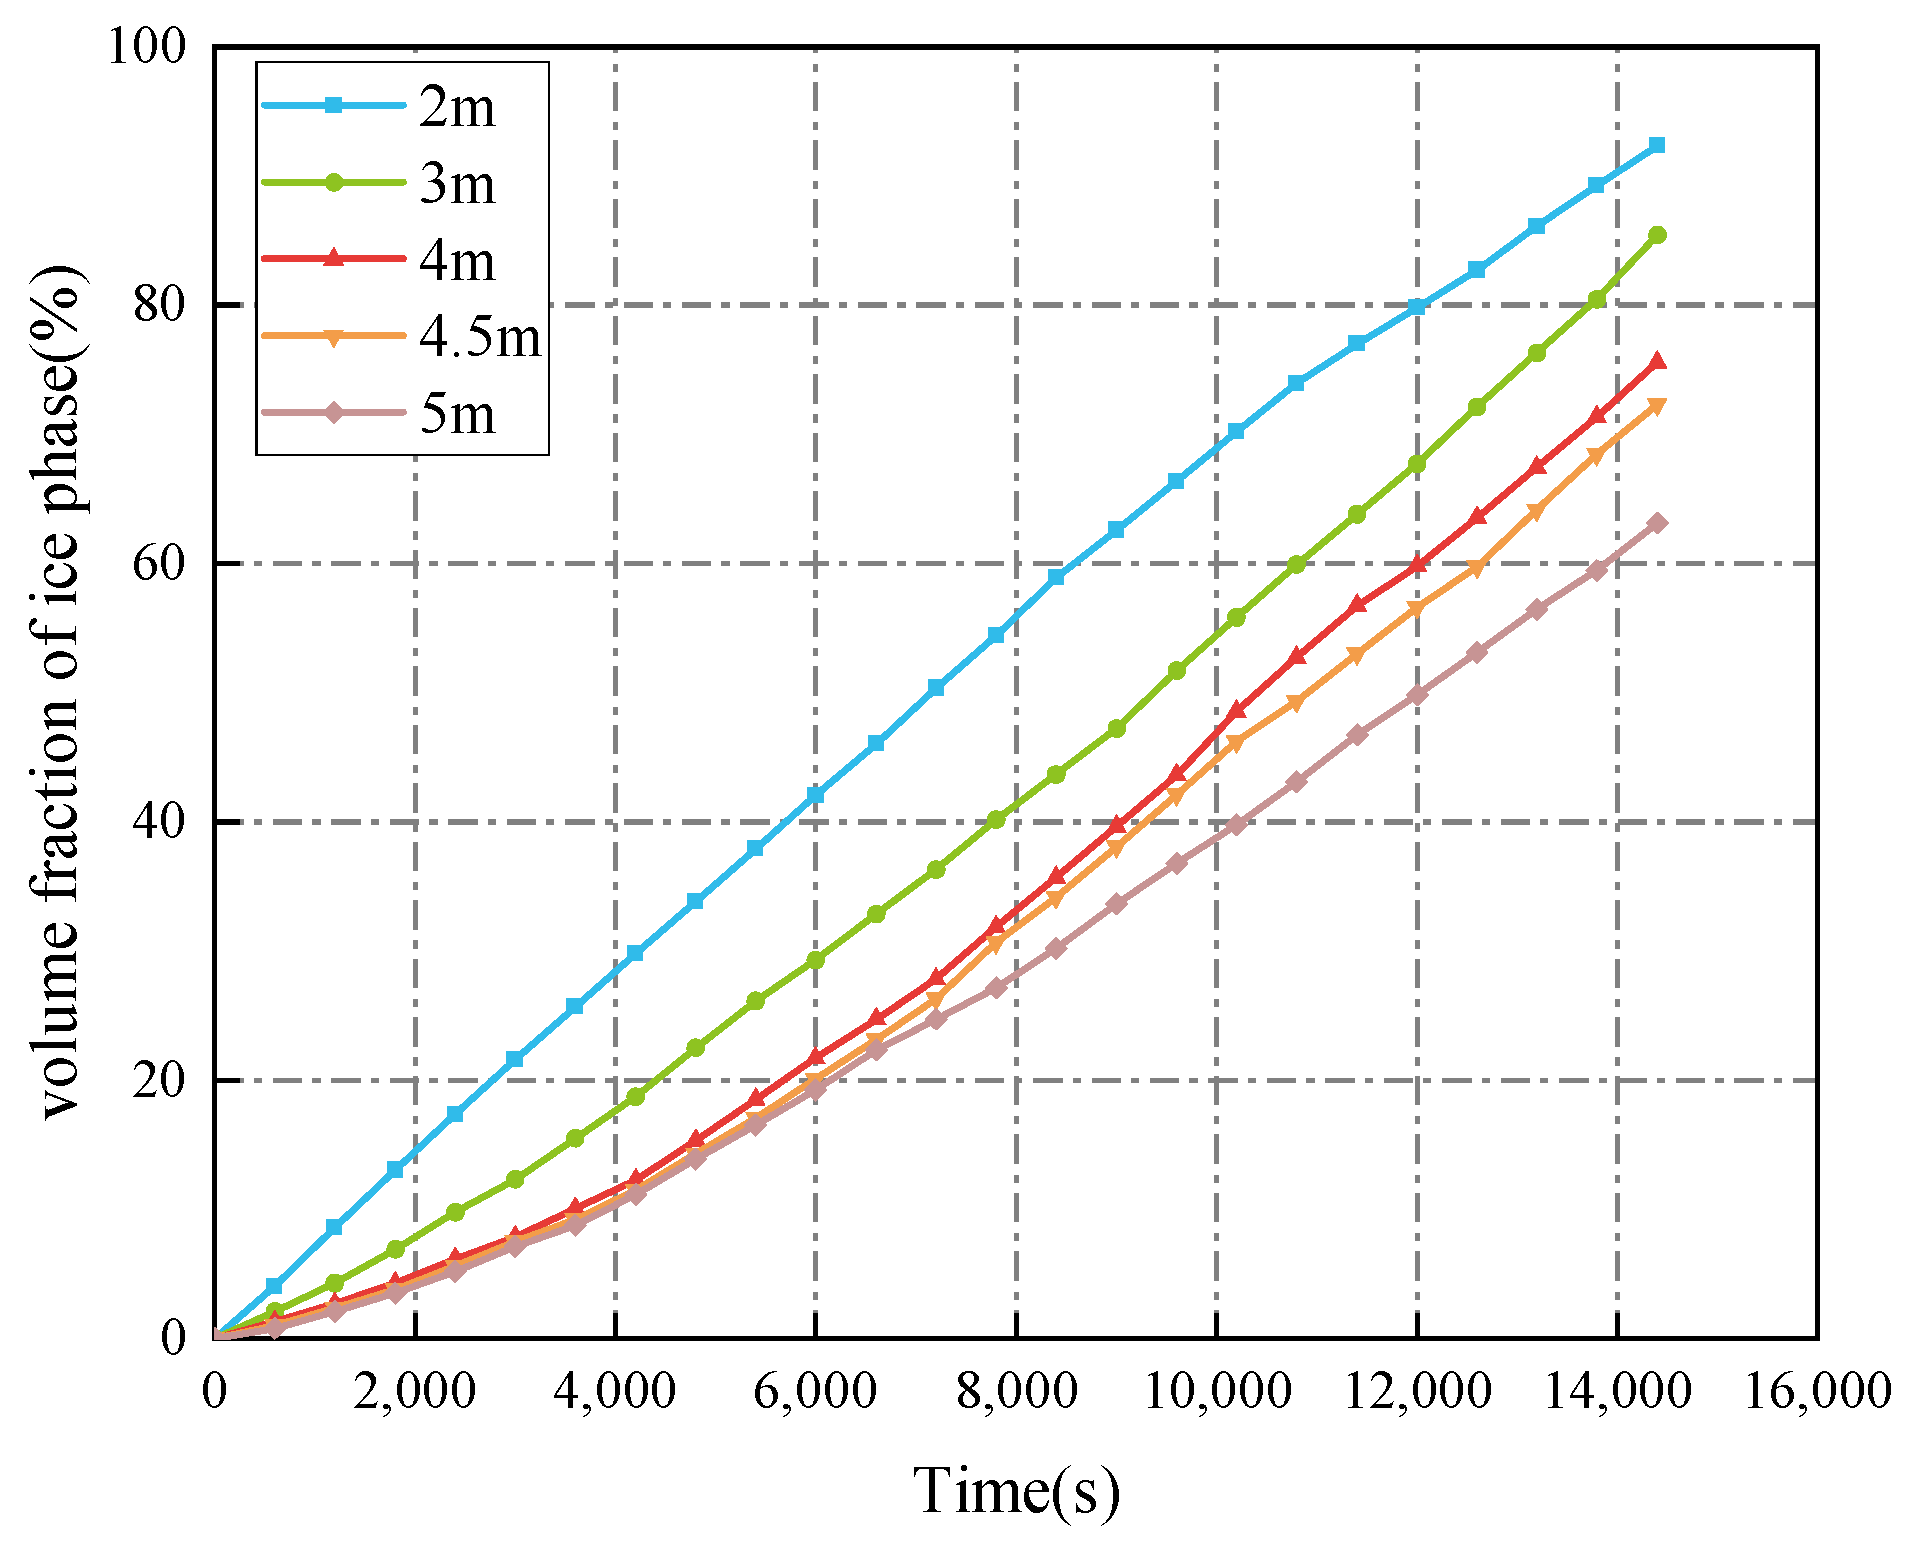
The decrease in the cold air temperature significantly impacts the evolution of ice formation at the ballast water level. As the cold air temperature drops, the thickness of the ice layer formed by freezing at the surface of the ballast water increases. When the ambient temperature reaches −40 °C, the volume fraction of the ice phase reaches its maximum, approximately 84.33%. Additionally, changes in the seawater temperature primarily influence the evolution of ice formation at the right bulkhead. As the seawater temperature decreases, the thickness of the ice layer formed by freezing at the right bulkhead also increases significantly. When the seawater temperature is −4 °C, the freezing degree of the ballast tank is at its highest, with the volume fraction of the ice phase in the ballast tank reaching approximately 91.53%. The change in the height of the ballast water level primarily affects the volume of ballast water. As the liquid level decreases, the volume of ballast water diminishes, resulting in a shorter time required for the ballast water to freeze and an increase in the degree of freezing. When the liquid level height is 2 m, the volume fraction of the ice phase is approximately 92.35%.
(3)
The variation in the temperature field has the most significant impact on the evolution of ice shape. As the rate of change in the ballast water temperature increases, the rate of ice shape evolution also shows an upward trend. Notably, in areas where the temperature field experiences substantial fluctuations, a faster freezing rate in ballast water leads to a thicker ice layer and a greater degree of freezing.
Due to limitations in technical resources and research areas, this paper presents certain deficiencies and flaws in the numerical study of ballast water freezing. The proposed numerical model lacks experimental validation, which undermines its reliability. Furthermore, the effects of salinity and flow on the freezing process of ballast water were overlooked during the calculations, resulting in a significant deviation from the actual distribution of ice shapes. These issues represent urgent challenges that must be addressed in the field of polar ship icing.
In summary, the simulation of the freezing process and the analysis of its characteristics in the ballast water tanks of polar LNG carriers have provided a theoretical foundation and technical support for the design of these tanks. By controlling the temperature variation range within the ballast water tank and utilizing appropriate insulation materials for the tank walls, the formation of ice layers can be effectively suppressed. This approach reduces the impact of ice accumulation on ballast water circulation and decreases the likelihood of safety incidents. Additionally, this research offers valuable guidance for predicting and analyzing structural icing in the field of polar vessels and in other areas related to cold and ice prevention in the future.

Author Contributions

Conceptualization, X.B. and C.X.; methodology, X.B.; software, C.X.; validation, X.B., C.X. and D.W.; formal analysis, X.B.; investigation, C.X.; resources, X.B.; data curation, C.X. and D.W.; writing—original draft preparation, X.B.; writing—review and editing, X.B. and C.X.; visualization, D.W.; supervision, X.B.; project administration, C.X.; funding acquisition, X.B. All authors have read and agreed to the published version of the manuscript.

Funding

This research was funded by the National Natural Science Foundation of China (No. 51879125).

Institutional Review Board Statement

Not applicable.

Informed Consent Statement

Not applicable.

Data Availability Statement

The original contributions presented in the study are included in the article, further inquiries can be directed to the corresponding author.

Acknowledgments

The authors wish to express their many thanks to the reviewers for their useful and constructive comments.

Conflicts of Interest

The authors declare no conflicts of interest.

References

  1. Kim, K.S.; An, I.S. Emergence of a climate oscillation in the Arctic ocean due to global warming. Nat. Clim. Change 2024, 14, 1267–1274. [Google Scholar] [CrossRef]
  2. Nieuwejaar, P.; Mazauric, V.; Betzler, C.; Carapuco, M.; Cattrijsse, A.; Coren, F.; Danobeitia, J.; Day, C.; Fitzgerald, A.; Florescu, S.; et al. Next generation European research vessels: Current status and foreseeable evolution. In Position Paper 25 of the European Marine Board; European Marine Board: Ostend, Belgium, 2019. [Google Scholar]
  3. Cai, W.Q.; Lin, J.D. Navigation practice and Prospect of normalized navigation in the Northeast Arctic channel. China Water Transp. 2016, 37, 21–24. [Google Scholar]
  4. Bagaev, D.V.; Syraleva, M.N.; Kudinovich, I.V. Comparative analysis of energy efficiency of ballast tank anti-freezing systems. J. Phys. Conf. Ser. 2020, 2, 022023. [Google Scholar] [CrossRef]
  5. Kang, H.K.; Kim, K.P.; Ahn, S.W. Numerical investigation on freezing in ballast tank of ship navigating in ice-bound sea. J. Korean Soc. Power Syst. Eng. 2013, 17, 95–102. [Google Scholar] [CrossRef]
  6. Wan, Z.; Yuan, Y.C.; Tang, W.Y. Experimental investigation on ice resistance of an arctic LNG carrier under multiple ice breaking conditions. Ocean. Eng. 2023, 267, 113264. [Google Scholar] [CrossRef]
  7. Zhu, X.S.; Han, X.L.; Xie, B.; Wang, J.R.; Yu, X.C. Application of simplified thermal transfer analysis in FLNG tank optimization. In Proceedings of the 28th International Ocean and Polar Engineering Conference; ISOPE International Ocean and Polar Engineering Conference, ISOPE-I-18-178, Sapporo, Japan, 10–15 June 2018. [Google Scholar]
  8. Ding, S.F.; Zhou, L.; Gu, Y.J.; Zhou, Y.J. Research on temperature field of the support structure for the independent LNG tank. Hydro Sci. Mar. Eng. 2020, 2, 33–39. [Google Scholar] [CrossRef]
  9. Li, R.; Shan, X.D.; Zhang, J.Y. Thermal Design of LNG Cabin on Sea Transport. In Proceedings of the 2015 International Conference on Industrial Technology and Management Science, Tianjin, China, 27–28 March 2015; pp. 1543–1546. [Google Scholar]
  10. Wang, C.; Qin, H.D.; Shen, J.; Hao, X.Z. The Temperature Distribution Analysis of the Large LNG-FSRU. In Proceedings of the ASME 2016 35th International Conference on Ocean, Offshore and Arctic Engineering, Busan, Republic of Korea, 19–24 June 2016; p. 49989. [Google Scholar]
  11. Lu, J.S.; Xu, S.; Deng, J.J.; Wu, W.F.; Wu, H.X.; Yang, Z.B. Numerical prediction of temperature field for cargo containment system (CCS) of LNG carriers during pre-cooling operations. J. Nat. Gas Sci. Eng. 2016, 29, 382–391. [Google Scholar] [CrossRef]
  12. Wu, S.X.; Ju, Y.L.; Lin, J.C.; Fu, Y.Z. Numerical simulation and experiment verification of the static boil-off rate and temperature field for a new independent type B liquefied natural gas ship mock up tank. Appl. Therm. Eng. 2020, 173, 115265. [Google Scholar] [CrossRef]
  13. Zhang, K.; Li, H.X.; Wang, J.L. CFD simulation of airflow organization in the ship accommodation. Appl. Mech. Mater. 2015, 711, 91–95. [Google Scholar] [CrossRef]
  14. Rosenau, S.G.; Reimer, N.K.; Notz, D.; Von, R.U.F. A growth model for aqueous model ice. In Proceedings of the International Conference on Port and Ocean Engineering under Arctic Conditions, POAC, Glasgow, UK, 12–14 June 2023. [Google Scholar]
  15. Fatahillah, A.; Setiawan, T.B.; Sholihin, A. Numerical analysis of ice freezing processes of block ice production in a brine tank factory using the finite volume method. J. Phys. Conf. Ser. 2021, 1832, 012023. [Google Scholar] [CrossRef]
  16. Ding, S.F.; Cai, J.Y.; Zhou, L.; Zhou, Y.J. Numerical simulation analysis of icing process in ice model tank. Chin. J. Ship Res. 2021, 16, 137–142. [Google Scholar]
  17. Huo, P.Z.; Lu, P.; Xie, F.; Wang, Q.K.; Li, Z.J.; Arvola, L. Numerical simulation of the complete process of lake ice formation and melting in Lake Ulansu. Adv. Water Sci. 2024, 35, 145–155. [Google Scholar]
  18. Zhang, Y.W.; Guo, W.F.; Li, Y.; Chi, H.D.; Zhao, P.Y.; Tagawa, K. An experimental study of icing distribution on a symmetrical airfoil for wind turbine blade in the offshore environmental condition. Ocean. Eng. 2023, 273, 113960. [Google Scholar] [CrossRef]
  19. Chuang, Z.J.; Li, C.Z.; Liu, S.W.; Li, X.; Li, Z.Y.; Zhou, L. Numerical analysis of blade icing influence on the dynamic response of an integrated offshore wind turbine. Ocean. Eng. 2022, 257, 111593. [Google Scholar] [CrossRef]
  20. Gao, L.Y.; Liu, Y.; Zhou, W.W.; Hui, H. An experimental study on the aerodynamic performance degradation of a wind turbine blade model induced by ice accretion process. Renew. Energy 2019, 133, 663–675. [Google Scholar] [CrossRef]
  21. Xu, L.; Chen, S.H.; Jiang, H.B.; Zhang, L.L. The phase field simulation of the influence of heat exchanger performance on ice crystals in sea water piping system of polar ship. China Shiprep. 2017, 30, 45–48. [Google Scholar]
  22. Mintu, S.; Molyneux, D. Ice accretion for ships and offshore structures. Part 1—State of the art review. Ocean. Eng. 2022, 258, 111501. [Google Scholar] [CrossRef]
  23. Bai, X.; Shen, J.; Xue, Y.Z.; Shu, Y.C. Numerical Forecasting of Icing on Structural Components of Offshore Platforms in Polar Region. China Ocean. Eng. 2021, 35, 588–597. [Google Scholar] [CrossRef]
  24. Liu, J.N.; Xia, H.B.; Zhao, H.J.; Wei, X.Q.; Wu, H. Temperature Field Analysis of 175000m3 Membrane FSRU. Ship Ocean. Eng. 2021, 50, 13–16. [Google Scholar]
  25. Liu, J.F.; Wang, J.Y.; Liu, T. Temperature Field Distribution of LNG Carrier for Type B Independent Tank. Ship Eng. 2017, 39, 33–38. [Google Scholar]
  26. Zhang, Y.K. Simulation Study on Heat and Mass Transfer Characteristic of Droplet Vacuum Freezing Process. Ph.D. Thesis, Northeastern University, Shenyang, China, 2015. [Google Scholar]
  27. Hirt, C.W.; Nichol, B.D. Volume of fluid (VOF) method for the dynamics of free boundaries. J. Comput. Phys. 1981, 39, 201–225. [Google Scholar] [CrossRef]
  28. Wang, Y.K. Numerical Research on the Freezing Process of Supercooled Saline Water Droplets Impacting on the Cold Wall. Ph.D. Thesis, Harbin Engineering University, Harbin, China, 2022. [Google Scholar]
  29. Clyne, T.W.; Kurz, W. Solute redistribution during solidification with rapid solid state diffusion. Metall. Trans. A 1981, 12, 965–971. [Google Scholar] [CrossRef]
  30. Zhao, P.B.; Dai, R.K.; Li, W.; Wang, Q.W.; Zeng, M. Modeling the mushy zone during the melting process under Neumann boundary condition using the improved enthalpy-porosity method. Numer. Heat Transf. Part A Appl. 2020, 78, 423–442. [Google Scholar] [CrossRef]
  31. Chen, M. Characteristics of the LNG carrier with high ice class. J. Ship Des. 2020, 160, 7–12. [Google Scholar]
  32. Xie, Q.; Chen, H.L.; Zhang, J.F. Research progress of anti-icing and de-icing technology for polar navigation ships and offshore platforms. Chin. J. Ship Res. 2017, 12, 45–53. [Google Scholar]
  33. Luo, G.L. Temperature Field Analysis and Application of Independent Tank LNG Carrier. Mar. Technol. 2021, 49, 17–22. [Google Scholar]
  34. Horjen, I. Offshore drilling rig ice accretion modeling including a surficial brine film. Cold Reg. Sci. Technol. 2015, 119, 84–110. [Google Scholar] [CrossRef]
  35. Hu, Y.F.; Ding, S.F.; Liu, Z.B.; Zhou, L.; Wu, G.; Cao, J. Temperature Field Analysis and Freezing Process Simulation of Polar Ship Tanks. Ship Boat 2023, 34, 110–118. [Google Scholar]
  36. Zhu, J.H.; Dai, Z.; Wang, Y.H.; Wang, M.; Wang, Z.Y. Rapid freezing process of static salt-containing droplets under salt exclusion. Int. J. Heat Mass Transf. 2024, 220, 124927. [Google Scholar] [CrossRef]
  37. Barma, M.C.; Peng, Z.B.; Moghtaderi, B.; Doroodchi, E. Freeze desalination of drops of saline solutions. Desalination 2021, 514, 115265. [Google Scholar] [CrossRef]
  38. Qu, K.Y.; Jiang, Y. Study on the factors affecting freezing of the water flowing inside a circular tube. Acta Energiae Solaris Sin. 2001, 7, 250–255. [Google Scholar]
Figure 1. Phase equilibrium diagram of water.
Applsci 15 05192 g001
Figure 2. Heat exchange diagram of ballast tank.
Applsci 15 05192 g002
Figure 3. Geometric calculation model of ballast tank.
Applsci 15 05192 g003
Figure 4. Numerical analysis process.
Applsci 15 05192 g004
Figure 5. Different size grid models.
Applsci 15 05192 g005
Figure 6. Comparison of ice volume fraction curves at different times.
Applsci 15 05192 g006
Figure 7. The temperature field evolution of the ballast tank under different cold air temperatures.
Applsci 15 05192 g007
Figure 8. The temperature change curve with time at point a under different cold air temperatures.
Applsci 15 05192 g008
Figure 9. The temperature change curve with time at point c under different cold air temperatures.
Applsci 15 05192 g009
Figure 10. The temperature field evolution of the ballast tank under different seawater temperatures.
Applsci 15 05192 g010
Figure 11. The temperature change curve with time at point a under different seawater temperatures.
Applsci 15 05192 g011
Figure 12. The temperature change curve with time at point c under different seawater temperatures.
Applsci 15 05192 g012
Figure 13. The temperature field evolution of the ballast tank under different ballast water heights.
Applsci 15 05192 g013
Figure 14. The temperature change curve with time at point a under different ballast water heights.
Applsci 15 05192 g014
Figure 15. The temperature change curve with time at point c under different ballast water heights.
Applsci 15 05192 g015
Figure 16. Ice shape evolution under different cold air temperatures.
Applsci 15 05192 g016
Figure 17. The variation curve of the ice phase volume fraction in the ballast tank under different cold air temperatures.
Applsci 15 05192 g017
Figure 18. Ice shape evolution under different seawater temperatures.
Applsci 15 05192 g018
Figure 19. The variation curve of the ice phase volume fraction in the ballast tank under different seawater temperatures.
Applsci 15 05192 g019
Figure 20. Ice shape evolution under different ballast water heights.
Applsci 15 05192 g020
Figure 21. The variation curve of the ice phase volume fraction in the ballast tank under different ballast water heights.
Applsci 15 05192 g021
Table 1. Physical parameters of fresh water.
ParameterValue
Density/(kg/m3)1000
Thermal conductivity/(W/m·K)0.6
Specific heat capacity/(J/kg·K)4182
Solidus temperature/°C0
Table 2. Temperature and ice volume fraction of different mesh sizes.
Grid Size/mTemperature/°CVolume of
Ice Phase/%
ab
0.1−1.009−1.03668.470
0.06−1.014−1.04269.049
0.03−1.015−1.04369.336
Table 3. Case of cold air temperature analysis.
CaseCold Air Temperature/°CSeawater Temperature/°CBallast Water Height/m
A1−20−24.5
A2−25−24.5
A3−30−24.5
A4−35−24.5
A5−40−24.5
Table 4. Case of seawater temperature analysis.
CaseCold Air Temperature/°CSeawater Temperature/°CBallast Water Height/m
S1−3004.5
S2−30−14.5
S3−30−24.5
S4−30−34.5
S5−30−44.5
Table 5. Case of ballast water height analysis.
CaseCold Air Temperature/°CSeawater Temperature/°CBallast Water Height/m
B1−30−25
B2−30−24.5
B3−30−24
B4−30−23
B5−30−22
Disclaimer/Publisher’s Note: The statements, opinions and data contained in all publications are solely those of the individual author(s) and contributor(s) and not of MDPI and/or the editor(s). MDPI and/or the editor(s) disclaim responsibility for any injury to people or property resulting from any ideas, methods, instructions or products referred to in the content.

