1. Introduction
1.1. Background and Motivation
The importance of the ocean has increased significantly with the advancement of human civilization. Meeting the growing demands of exploiting marine resources and establishing marine military defenses has highlighted the need for advancements in underwater cyberspace infrastructure. Currently, long-distance transmission using acoustic waves is the most well-developed form of underwater communication. However, the underwater acoustic channel is limited by its bandwidth, significant environmental noise, and susceptibility to the Doppler phenomenon and multipath effects. Consequently, it is necessary to explore reliable communication technologies that can operate effectively within the complex underwater acoustic channel environment [
1]. DSSS technology is extensively utilized in underwater acoustic communication owing to its excellent resistance to interference and fading [
2,
3,
4]. Therefore, evaluating the interference suppression capabilities of underwater acoustic DSSS systems is of considerable importance.
Underwater acoustic communication systems face critical challenges, including limited bandwidth, environmental noise, Doppler shifts, and multipath effects. While Direct-Sequence Spread Spectrum (DSSS) is widely adopted for its anti-interference capabilities, existing theoretical frameworks predominantly assume long-period pseudo-noise (PN) sequences. However, practical underwater systems often rely on short-period PN sequences due to:
Synchronization constraints: Short codes simplify pseudo-code synchronization in dynamic underwater channels.
Bandwidth limitations: Short sequences align with the narrowband nature of underwater acoustic links.
Real-time processing requirements: Short codes reduce computational overhead for resource-constrained underwater nodes.
Prior studies lack quantitative models to analyze how short-code DSSS systems perform under variable interference conditions (e.g., frequency offsets, phase deviations). This gap hinders the design of robust underwater communication systems. Our work addresses this by bridging theory and practicality for short-code DSSS systems.
1.2. Related Work
When researching the capability of spread spectrum systems to counter single-frequency interference, it is commonly assumed that the spread spectrum sequence is a completely random and infinite binary sequence. This implies that the length of the spread spectrum sequence is significantly larger than the number of chips in each bit, and different spread spectrum sequences are employed for spreading each information bit. Based on this assumption, Peterson et al. analyzed the influence of single-frequency interference on the BER of a system [
5,
6,
7], while Tian et al. examined the processing gain of a DSSS system [
8]. However, due to the necessity of pseudo-code synchronization, practical underwater acoustic DSSS systems often use short-period PN sequences. In these systems, each information bit employs the same periodic sequence for spreading, with the code period matching the duration of the bit. The anti-interference capabilities of short-code systems differ from those of long-code systems, which employ infinite long PN sequences. Various studies have explored the anti-interference performance of short-code systems. For example, some authors [
9,
10] have presented the output power of single-frequency interference and the processing gain of the spread spectrum system against single-frequency interference. Others [
11,
12,
13] have investigated the additive interference sequence of the system’s output. X. Wang et al. demonstrated the impact of single-frequency interference on the performance of spread spectrum systems through simulations [
14,
15]. Additionally, some authors [
16,
17,
18,
19,
20] have provided the BER of the system when the frequency of single-frequency interference matched the carrier frequency of the signal.
Current research on the anti-single-frequency interference capability of short-code systems faces several issues. Firstly, the system’s anti-jamming performance cannot be quantitatively analyzed, and there is no quantitative expression regarding the BER under single-frequency interference in relation to the SIR, spreading ratio, and frequency bias coefficient. Secondly, the BER performance of the system is only discussed when the single-frequency interference and the signal carrier are at the same frequency, without delving into the study of deviation in interference frequency from the signal carrier.
1.3. Contributions of This Work
In this study, we make the following novel contributions:
(1) We derived a closed-form expression to quantify anti-single-frequency interference performance in short-code DSSS systems, incorporating parameters such as signal-to-interference ratio (SIR), frequency offset, phase deviation, and spreading code structure.
(2) We demonstrated that interference components after despreading exhibit DC or sinusoidal distributions, with fluctuation frequencies tied to interference offsets.
- 2.
Key Distinctions from Prior Work:
(1) Unlike long-code systems, short-code DSSS exhibits periodic BER oscillations with interference frequency offsets, with minimal BER at zero offset.
(2) We identified threshold SIR values (e.g., −24 dB for N = 15) below which BER degrades sharply, providing actionable design criteria.
- 3.
Practical Insights:
(1) We showed that interference at integer multiples of bit bandwidth (e.g., Δf = Rb) causes maximum performance degradation, guiding frequency planning.
(2) We highlighted how spreading code structure influences BER trends, even for codes of identical length (e.g., m-sequences vs. Gold codes).
- 4.
Validation:
(1) We validated theoretical models through simulations and experiments, confirming alignment in scenarios where interference frequency offsets match integer multiples of Rb.
2. Theoretical Derivation of Short-Code Systems
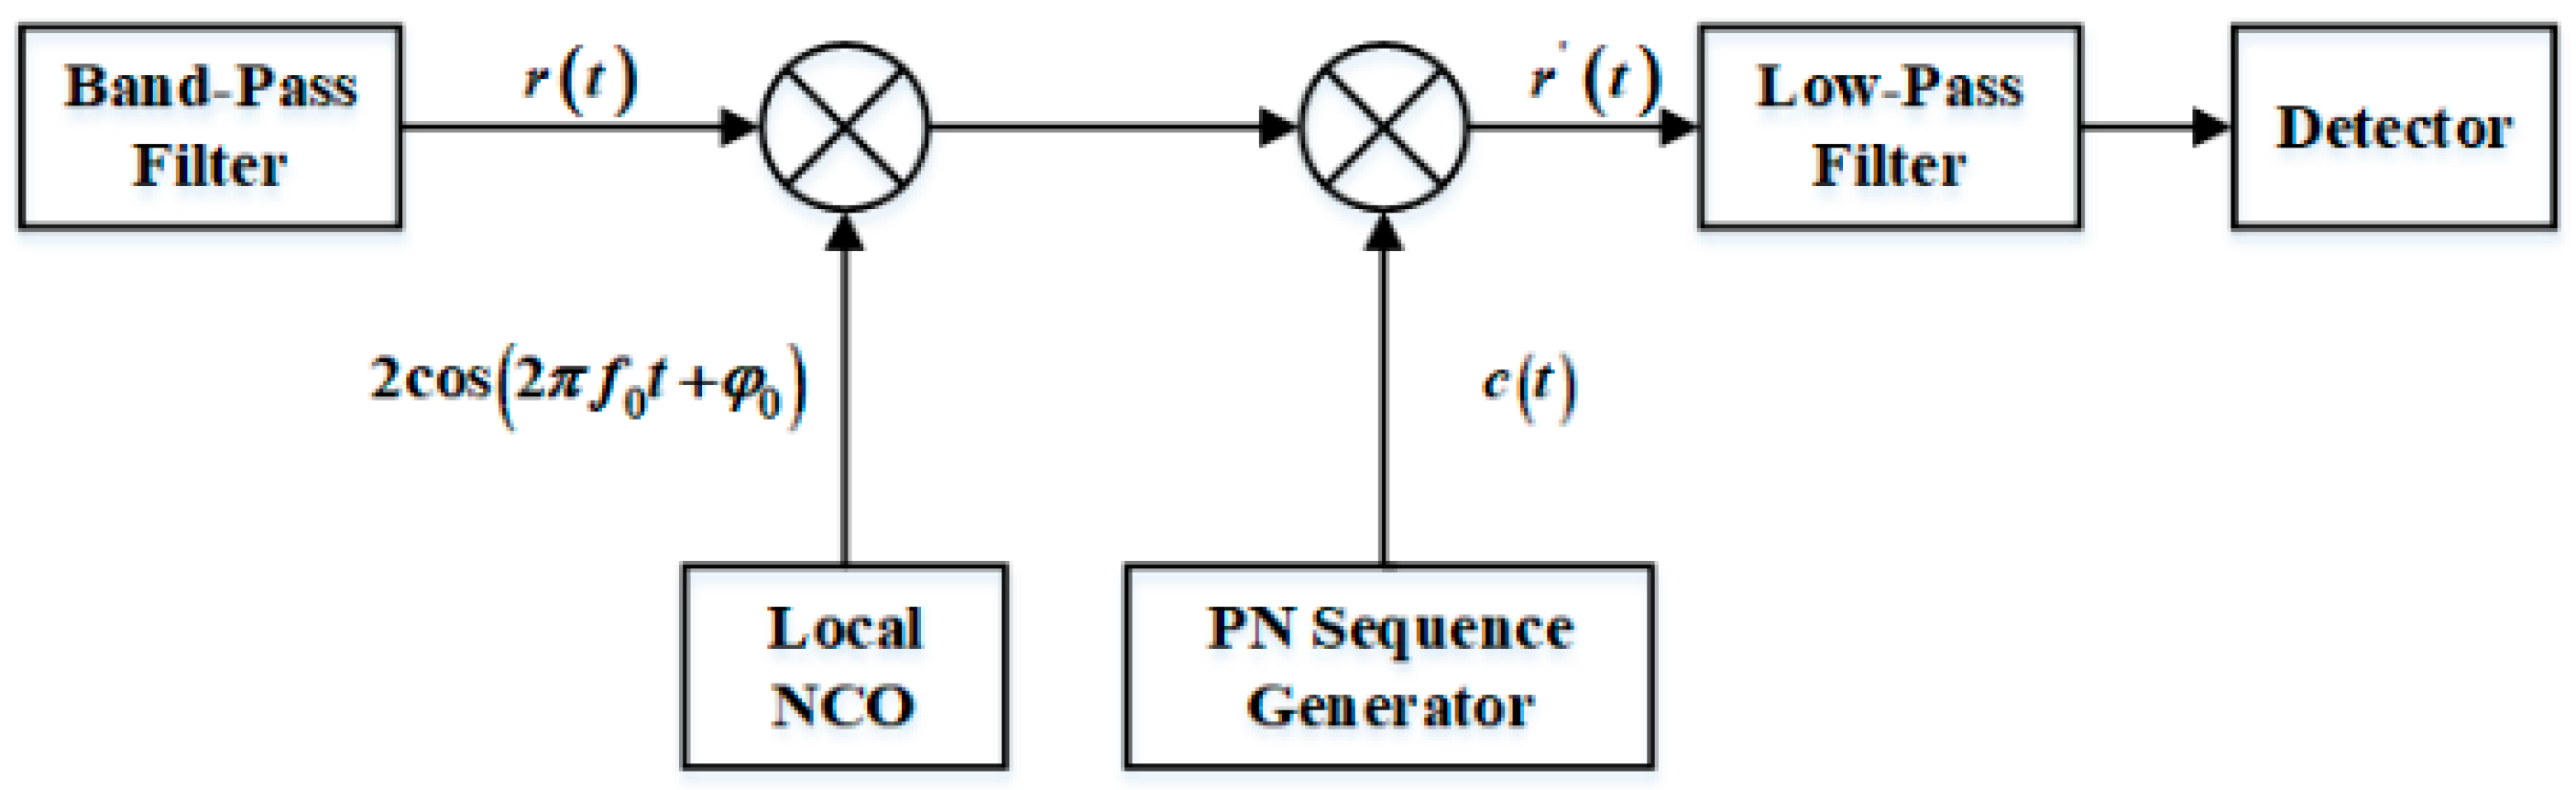
This paper takes the commonly used BPSK-DSSS system as an example to discuss the anti-single-frequency interference performance of the system. The principal diagram of the DSSS system receiver is shown in
Figure 1.
Assuming that the receiver has achieved accurate carrier synchronization and code synchronization of the received signal, the Doppler frequency shift and transmission delay are not considered in this paper. The received signal through the front-end band-pass filter is as follows:
where
s(
t) is a useful DSSS signal;
n(
t) is a white Gaussian noise with mean bilateral power spectral density
N0/2;
j(
t) is a single-frequency interference; and
s(
t) and
j(
t) are modeled as follows:
In (2), P and I denote the input signal power and interference power, respectively;
d(
t) is the information sequence to be decoded, with a value of ±1 and a bit duration of
Tb; and
c(
t) is the pseudo-random ± 1 sequence, with a cycle period of
N and a chip duration of
Tc. For the DSSS system using short-period PN sequence,
Tc =
Tb/
N,
f0 is the carrier frequency of the received signal;
φ0 is the random phase; and
fj and
φj are the frequency and phase of the interference, respectively. The power spectral density of
c(
t) is given by
After despreading and demodulating, the signal output by the low-pass filter can be written as
After the single-frequency interference is processed,
In the above, Δf = fj − f0 is the frequency offset of the interference relative to the signal carrier, and Δφ = φj − φ0 is the phase deviation.
Therefore, the decision statistic of the
m-th data bit sent to the decision maker can be written as
Here,
Ad(
m) is the response to the signal with a value of
Tb, positive or negative, depending on the data bit;
AN(
m) is a zero-mean Gaussian random variable with a variance of
N0Tb, which is the response of the correlation receiver to additive white Gaussian noise; and
Aj(
m) is the receiver’s response to interference, which can be written as
According to the periodicity of the spread spectrum sequences, the above equation can be rewritten as
where Δ
θ = 2πΔ
fTb. For any given Δ
f and Δ
φ, the above formula can be expanded into
Defining
C1 =
, and
C2 =
, the above formula can be simplified as
where
C=
, and α = arctan(
C2/
C1).
Therefore, the sequence
Aj(
m) can be regarded as a sequence of linearly increasing Δ
θ in phase, varying according to the sinusoidal law. According to the characteristics of a sine wave, from
Aj(
m) to
Aj(
m + 1) the effective phase increases by <2πΔ
fT
b>
2π, where <·>
2π represents taking the remainder for 2π. Therefore, the angular frequency of
Aj(
m) is
In particular, the sequence Aj(m) is a fixed value when ω = 0, that is, Δf is an integer multiple of Rb, and Aj(m) = Ccos(α + Δφ). It can be seen that with the increase in the interference frequency offset, the angular frequency of the interference sequence changes periodically in the range of [0, π·Rb]; in other words, the frequency varies periodically in the range [0, Rb/2]. This result shows that there is a large difference between the performance of the long-code system and the short-code system.
3. Interference Power Output by the Short-Code Systems
The power of the interference output by the baseband low-pass filter is
Here, |
H(
f)|
2 is the transfer function of the baseband low-pass filter. In order to ensure that the useful signal passes through the low-pass filter without distortion, the passband bandwidth of the baseband low-pass filter should be equal to the bit bandwidth, that is,
Sj(
f) is the power spectral density after demodulation of single-frequency interference. Here, the high frequency components are filtered out. Without loss of generality, if Δ
φ is uniformly distributed from 0 to 2π, then
Sj(
f) can be written as
Therefore, the output interference power is
It can be seen that the power spectral density curve interval of single-frequency interference after despreading is 1/Tb.
After processing by the receiver, the output power of the useful signal is
In (16), Sd(f) is the power spectral density function of the data signal d(t). Because d(t) is a binary waveform function taking +1 or −1 with equal probability, the integral is equal to 1. Therefore, the useful signal output power is Ps, equal to P.
When the interference frequency offset is an integer multiple of the bit bandwidth, that is, when Δ
f =
kRb (
k is an integer, |
k| ≤
N), the power of the interference output by the baseband low-pass filter is
Because the sinc2 function decreases monotonically within a given range, the power of the interference output by the DSSS system is at maximum when |k| = 1, i.e., when the absolute value of frequency offset is equal to the bit bandwidth. At this point, the performance of the system is severely reduced.
4. Changing Laws of BER Performance
According to the analysis conducted above, in the case of a short-code system, when the interference frequency offset Δf is a multiple of Rb, the resulting single-frequency interference remains constant after processing. However, it only affects the mean value of the receiver output decision statistics, increasing or decreasing it depending on whether the data bit is 0 or 1, without changing its variance. The variance of the decision statistic is still determined solely by the processing outcome of Gaussian noise. Therefore, this scenario is appropriate for assuming the standard Gaussian approximation (SGA). By solving the value of the signal component (including the interference component) in the decision statistics and the variance of the Gaussian noise, the bit error rate (BER) can be obtained using the error function. However, if the interference frequency offset Δf is not a multiple of Rb, the interference component at the output of the correlation despreader fluctuates sinusoidally. As a result, the decision statistics no longer follow a Gaussian distribution, making the method based on the SGA hypothesis inadequate for analyzing the BER.
4.1. BER of Long-Code System
The BER expression of the long-code system under single-frequency interference can be expressed thus, following [
21]:
(2) Δ
f ≠ 0
where N represents the spread spectrum ratio, and
Eb is the energy per bit.
Because the single-frequency interference phase
φ is assumed to be a uniform random variable between 0 and 2π, the phase deviation Δ
φ has the same distribution. The average probability of error is then calculated by integrating over Δφ, so that
4.2. BER of Short-Code System Under Interference with a Frequency Offset of Zero, That Is, Δf = 0
When the spreading code is a short-period PN sequence, the ratio of the number of spreading codes “1” and “0” in one bit is not a random quantity but a definite value. According to the balance of m-sequences, there is always one more “1” than “0” in the sequence. The interference sequence after despreading becomes
The decision statistic of the mth data bit sent to the decision maker is
The probability density function of
AN is given by
In order to avoid confusion with n(t), η is used to represent the dummy variable of AN.
When the transmitted data is ‘+1’, the judgment error is
A(
m) < 0, and the probability of the event is expressed as follows:
Similarly, when the transmitted data is ‘−1’, the system BER is
Assuming that the transmitter sends information ‘+1‘ and ‘−1‘ with equal probability, the average BER of the system can be expressed as
If the interference phase
φ is randomly distributed on [0, 2π), in order to eliminate the relationship with the phase difference, the average probability of error is calculated by integrating over Δ
φ; thus, the error probability can be determined as
where
Q± = Q.
In addition, if the influence of thermal noise [
Appendix A] is ignored, the system BER is 0.5 when |
Tccos(Δ
φ)| <
Tb. It can be seen that the threshold SIR that affects the system output is (in units of decibels) as follows:
The threshold signal-to-interference ratio (SIR) is dependent on the spread spectrum ratio N and the phase deviation Δφ. When the spreading ratio N is fixed, the threshold SIR varies periodically with the phase deviation Δφ, with a period of π. When Δφ is an integer multiple of π, the maximum SIR threshold of the system is −20lgN. For a spread spectrum ratio of 15, the SIR needs to be lower than −24 dB, meaning that for effective interference the interference power is 251 times that of the signal. Similarly, for a spread spectrum ratio of 31, to achieve effective interference the SIR should be lower than −30 dB, corresponding to an interference power 1000 times that of the signal. Thus, increasing the spread spectrum ratio enhances the system’s ability to resist single-frequency interference. However, due to the limited bandwidth of the underwater acoustic channel, increasing the spreading ratio results in a sacrifice in the information transmission rate. Therefore, in practical communication, the spreading multiple should be selected reasonably based on the environmental conditions. Optionally, the transmission rate can be reduced if necessary to ensure that the system has high immunity to interference.
4.3. BER of Short-Code System Under Interference with a Frequency Offset of a Non-Zero Integer Multiple of the Bit Bandwidth, That Is, Δf = kRb (k Is Integer, k ≠ 0, |k ≤ N|)
From Equation (10), it is evident that the value of
Aj(
m) is influenced by the structure of the spread spectrum sequences, frequency offset, and phase deviation, making direct calculation challenging. Based on Equations (10) and (11),
Aj(
m) can be represented as a sinusoidal signal with a frequency of zero:
Therefore, the output interference amplitude can be calculated by the ratio of the output power when
k ≠ 0 to the output power when
k = 0 obtained using Equation (17), so that
where
Pj0 and
Pjk represent the output interference power when
k = 0 and
k ≠ 0, respec-tively. Therefore, when
k ≠ 0, the interference component output by the receiver is
where
K =
sin
c.
Then, the system error rate can be written as
The composite phase deviation
βk =
αk + Δ
φ is defined and uniformly distributed on (0, 2π), and α
k is the frequency offset phase deviation caused by frequency offset. There-fore, the average BER is
In (33), Q± = Q. According to the characteristics of Q function, Formula (33) reaches the maximum when |k| = 1, that is, when the interference frequency offset is equal to the bit rate Rb, the BER is the largest.
According to the previous definition, the system SIR threshold can be expressed as
5. Results and Discussions
Because the decision statistics of single-frequency interference after correlation despreading in a short-code DSSS system do not fully conform to a Gaussian distribution, the use of the SGA hypothesis method to analyze its performance may result in inconsistent findings when compared with actual performance of the short-code DSSS system against single-frequency interference. This paper calculates the BER of the system under single-frequency interference based on the SGA assumption analysis for two specific scenarios. This section validates the accuracy of the derived conclusions through simulation and experimentation. The simulation model is illustrated in
Figure 1.
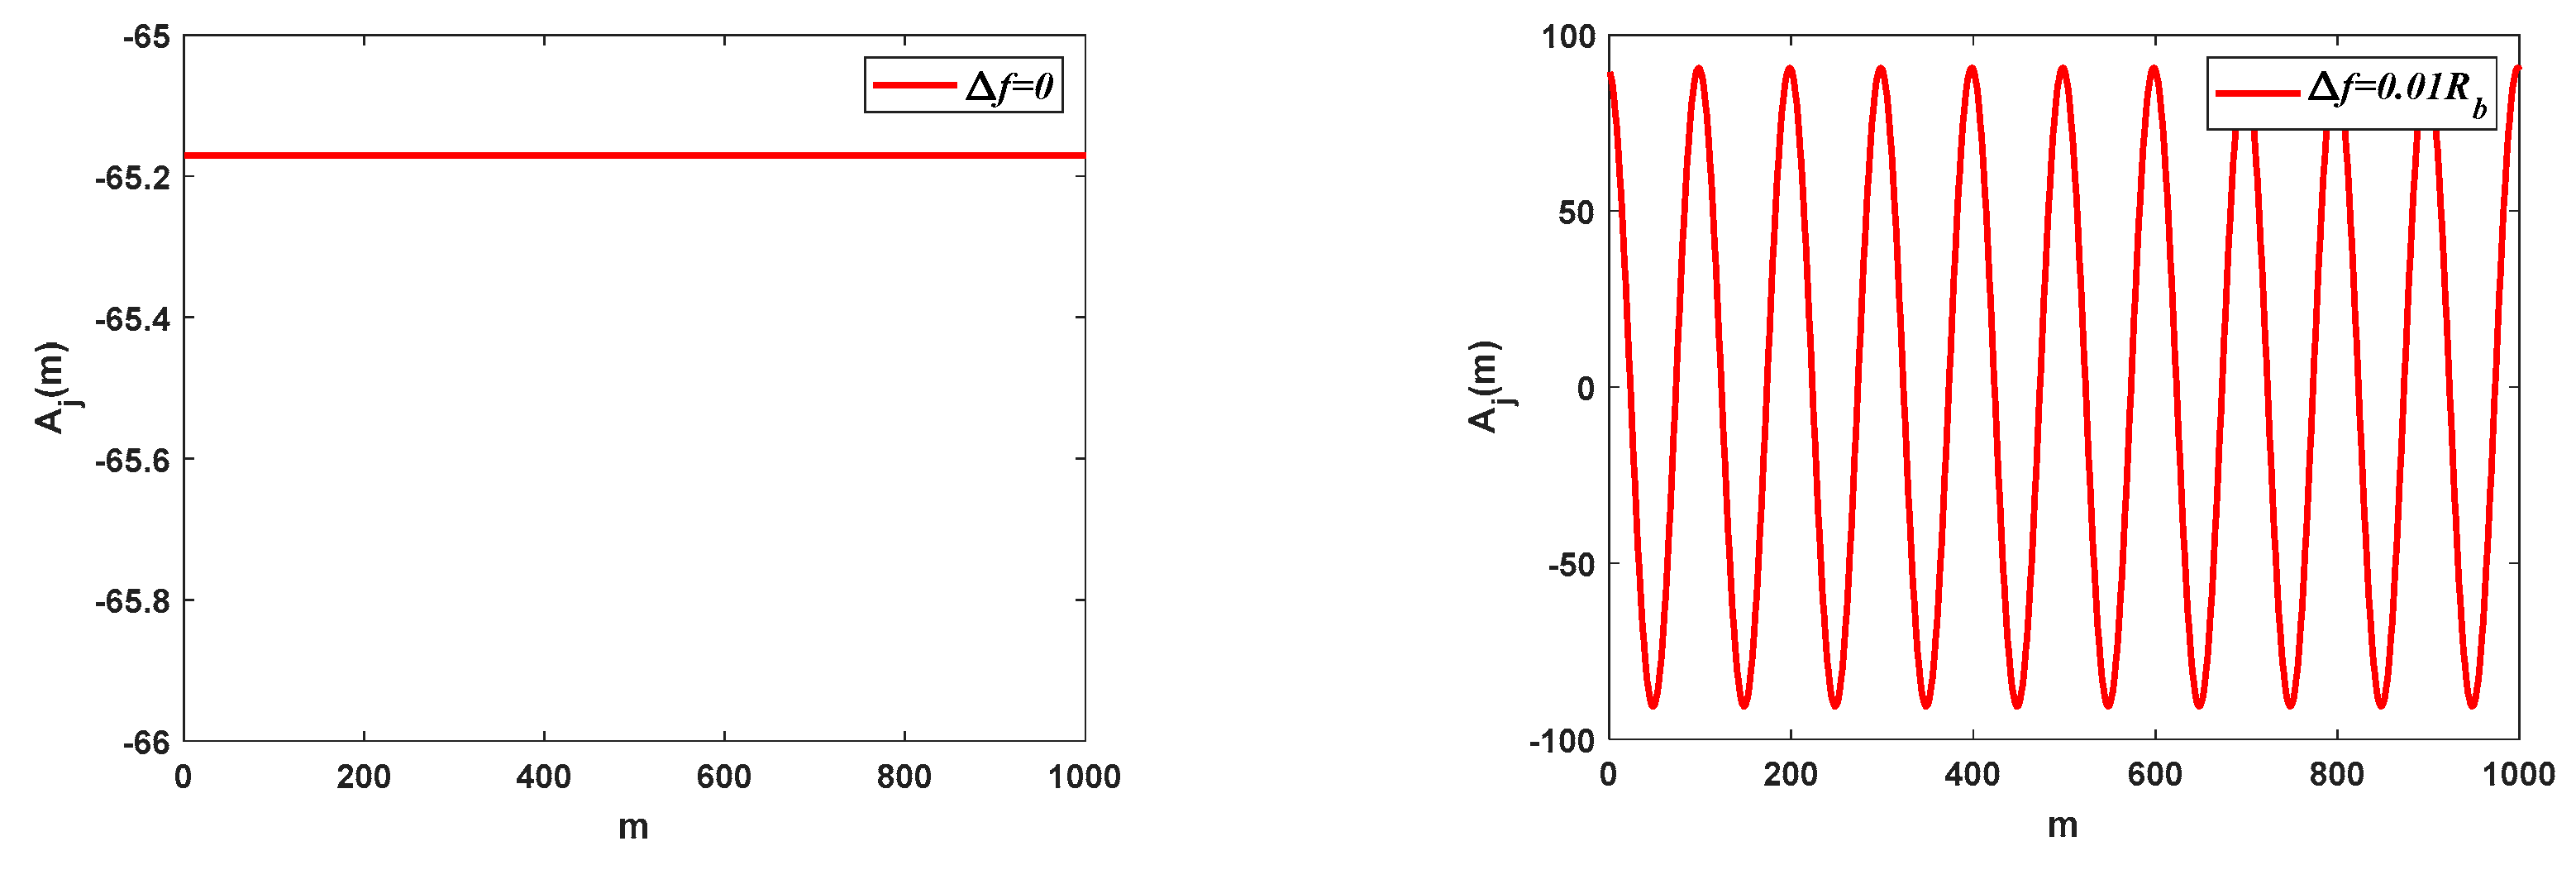
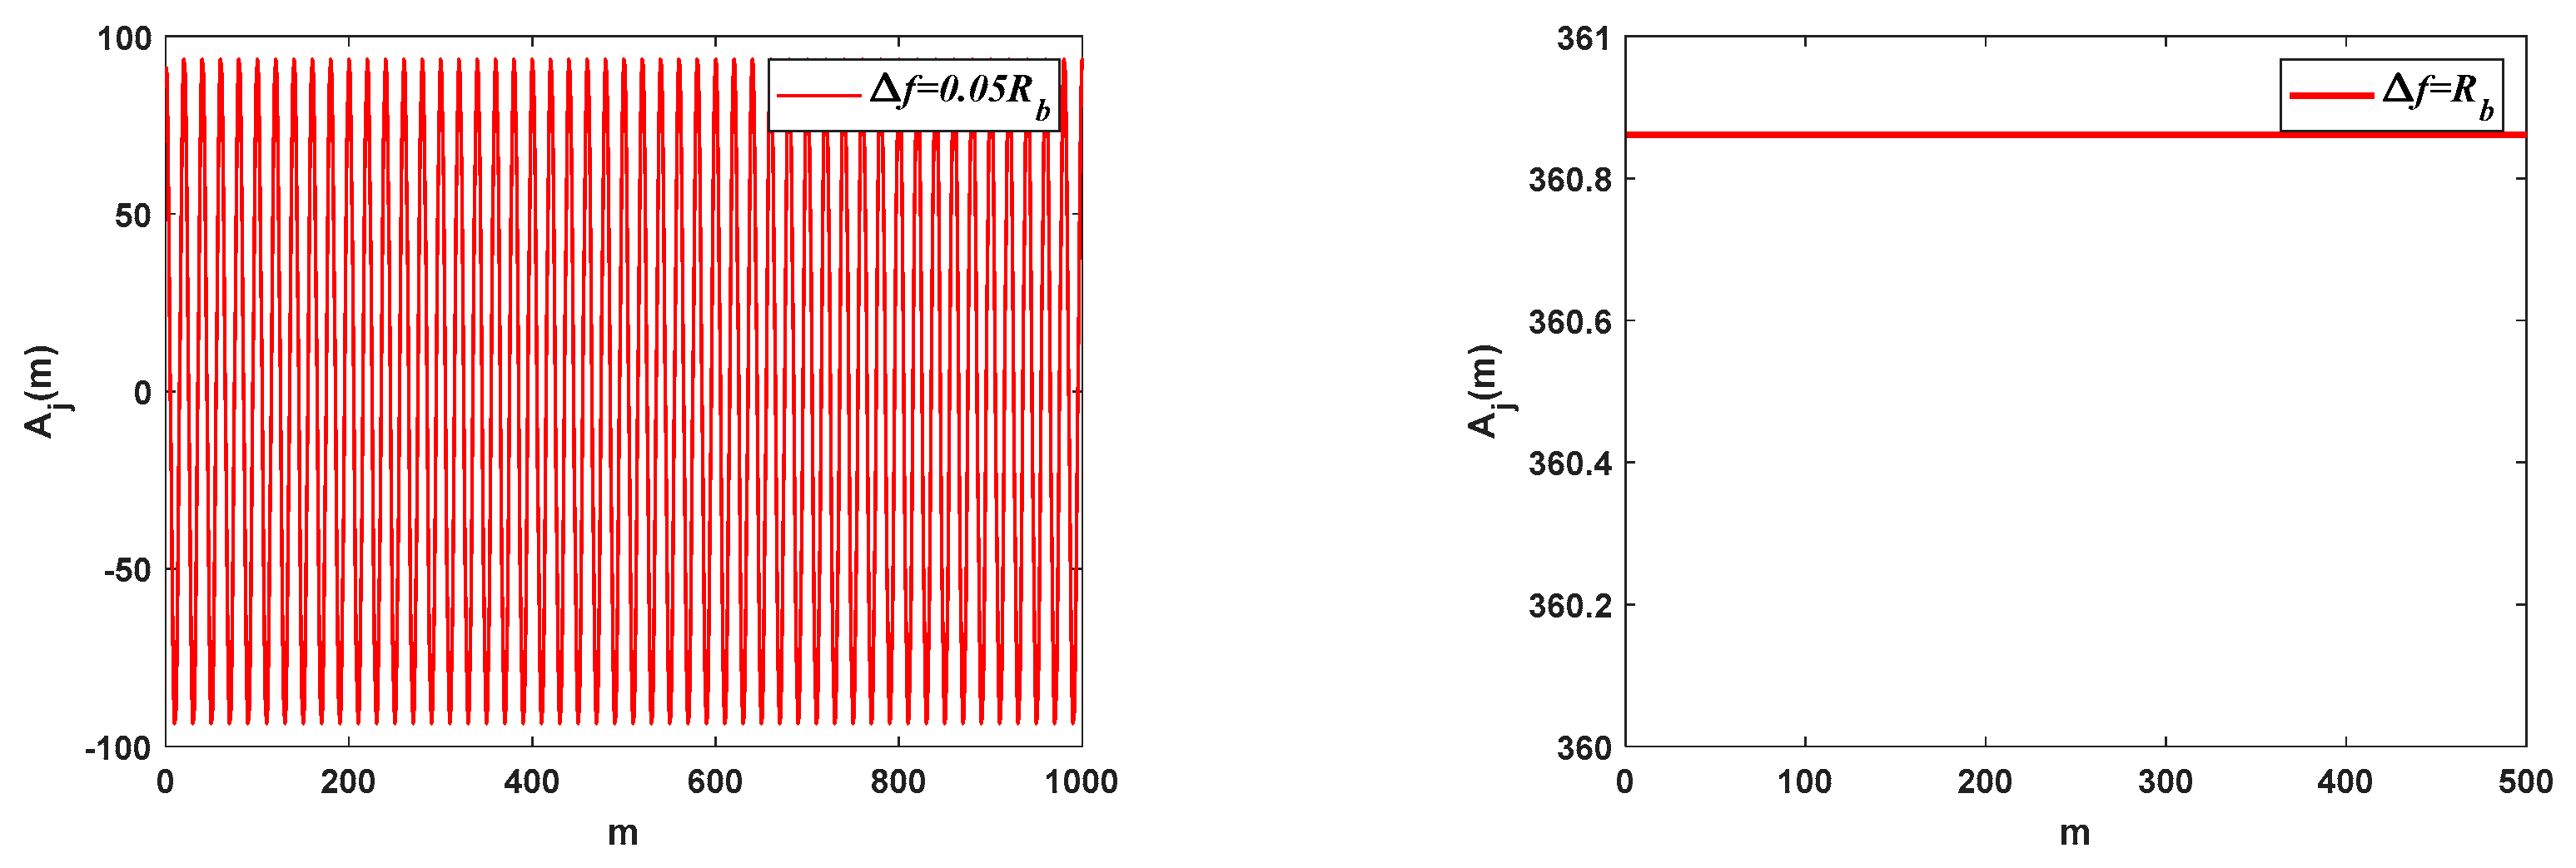
Figure 2 demonstrates the interference component resulting from single-frequency interference with various frequency offsets after correlation processing. In this simulation, the bit rate is 10 bit/s, and the spread spectrum code used is an m-sequence with a period of 15. The transmitted data information consists of an all-1 sequence, and the SIR is −20 dB. Different values are assigned to the interference frequency deviation (Δ
f): 0 Hz, 0.1 Hz, 0.5 Hz, and 10 Hz. These values respectively represent Δ
f =
kRb and Δ
f ≠
kRb, with
k being an integer. It can be observed that at 0 Hz and 10 Hz interference frequency offsets, which correspond to an integer multiple of the bit rate, the interference component in the decision variable remains constant. However, for interference frequency offsets of 0.1 Hz and 0.5 Hz, which do not correspond to an integer multiple of the bit rate (Δ
f ≠
kRb), the interference component in the decision variable exhibits sinusoidal waveform variations.
The system’s BER in the presence of single-frequency interference, which has the same frequency as the signal carrier, is illustrated in
Figure 3. In the simulation, an m-sequence with a period of 15 is utilized, and two different phase deviations (Δ
φ) are considered: 0 and π/3. It can be observed that the influence of single-frequency interference on the system presents a distinct threshold effect. When the input SIR exceeds the threshold value, the system operates without errors. However, when the input SIR is below the threshold value, the BER rapidly increases to 0.5. Specifically, for the case in which the interference and the signal carrier share the same frequency and phase, the maximum SIR that results in an error in the system is −23.6 dB. On the other hand, when the phase deviation (Δφ) is set to π/3, the maximum SIR of the system decreases to −29.6 dB. These simulation results align well with the theoretical calculation formula of the SIR threshold in
Section 3. The corresponding threshold SIR values for Δ
φ = 0 and Δ
φ = π/3 are −23.52 dB and −29.54 dB, respectively.
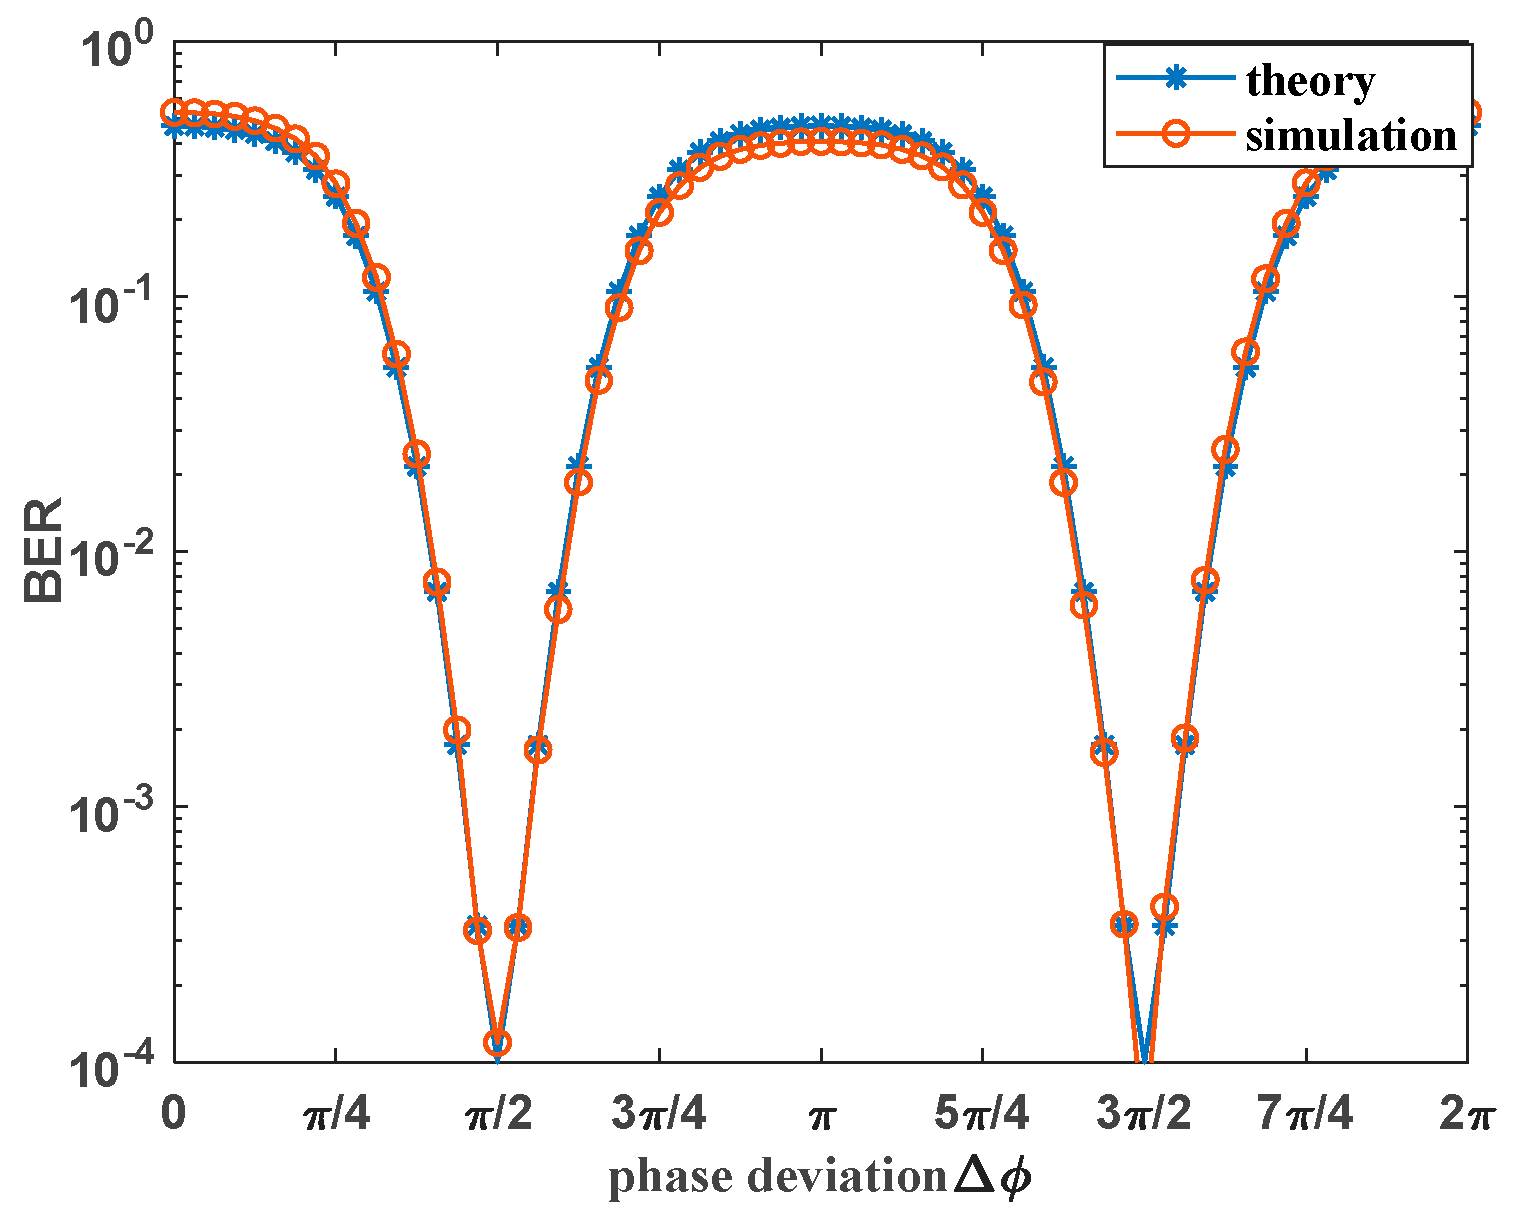
In order to further analyze the impact of the SIR threshold on the system’s BER,
Figure 4 illustrates the variation curve of the BER with the phase deviation (Δ
φ) in the presence of both single-frequency interference at the same frequency as the signal carrier and Gaussian white noise. In the simulation,
Eb/N0 is set to 8.4 dB (resulting in a BER of 10
−4 only with Gaussian white noise interference), the SIR is −26.5 dB (the SIR threshold at which the system produces an error when Δ
φ = π/4), and an m-sequence of period 15 is used. It can be observed that when the single-frequency interference frequency matches the carrier frequency, the theoretical BER curve of the DSSS-BPSK system aligns closely with the simulation curve. This indicates that the quantitative analysis of the system BER calculation is correct at this time. The BER of the system undergoes periodic changes as the phase deviation increases with π as the period. Taking the period from 0 to π as an example, when Δ
φ < π/4, the BER exhibits minimal changes and remains around 0.5. This occurs because the single-frequency interference threshold is greater than the given −26.5 dB, and the BER is primarily determined by the single-frequency interference. When π/4 <Δ
φ < π/2, the BER decreases rapidly with increasing phase deviation as the threshold is crossed, and the influence of the single-frequency interference component on the system gradually diminishes. When π/2 < Δ
φ < 3π/4, the BER increases with the increase in the single-frequency interference component. When Δ
φ > 3π/4, the actual SIR is lower than the threshold SIR, and the BER stabilizes at approximately 0.5. It is clear from the above analysis that adjusting the signal phase can enhance the system’s ability to resist interference in practical communication systems.
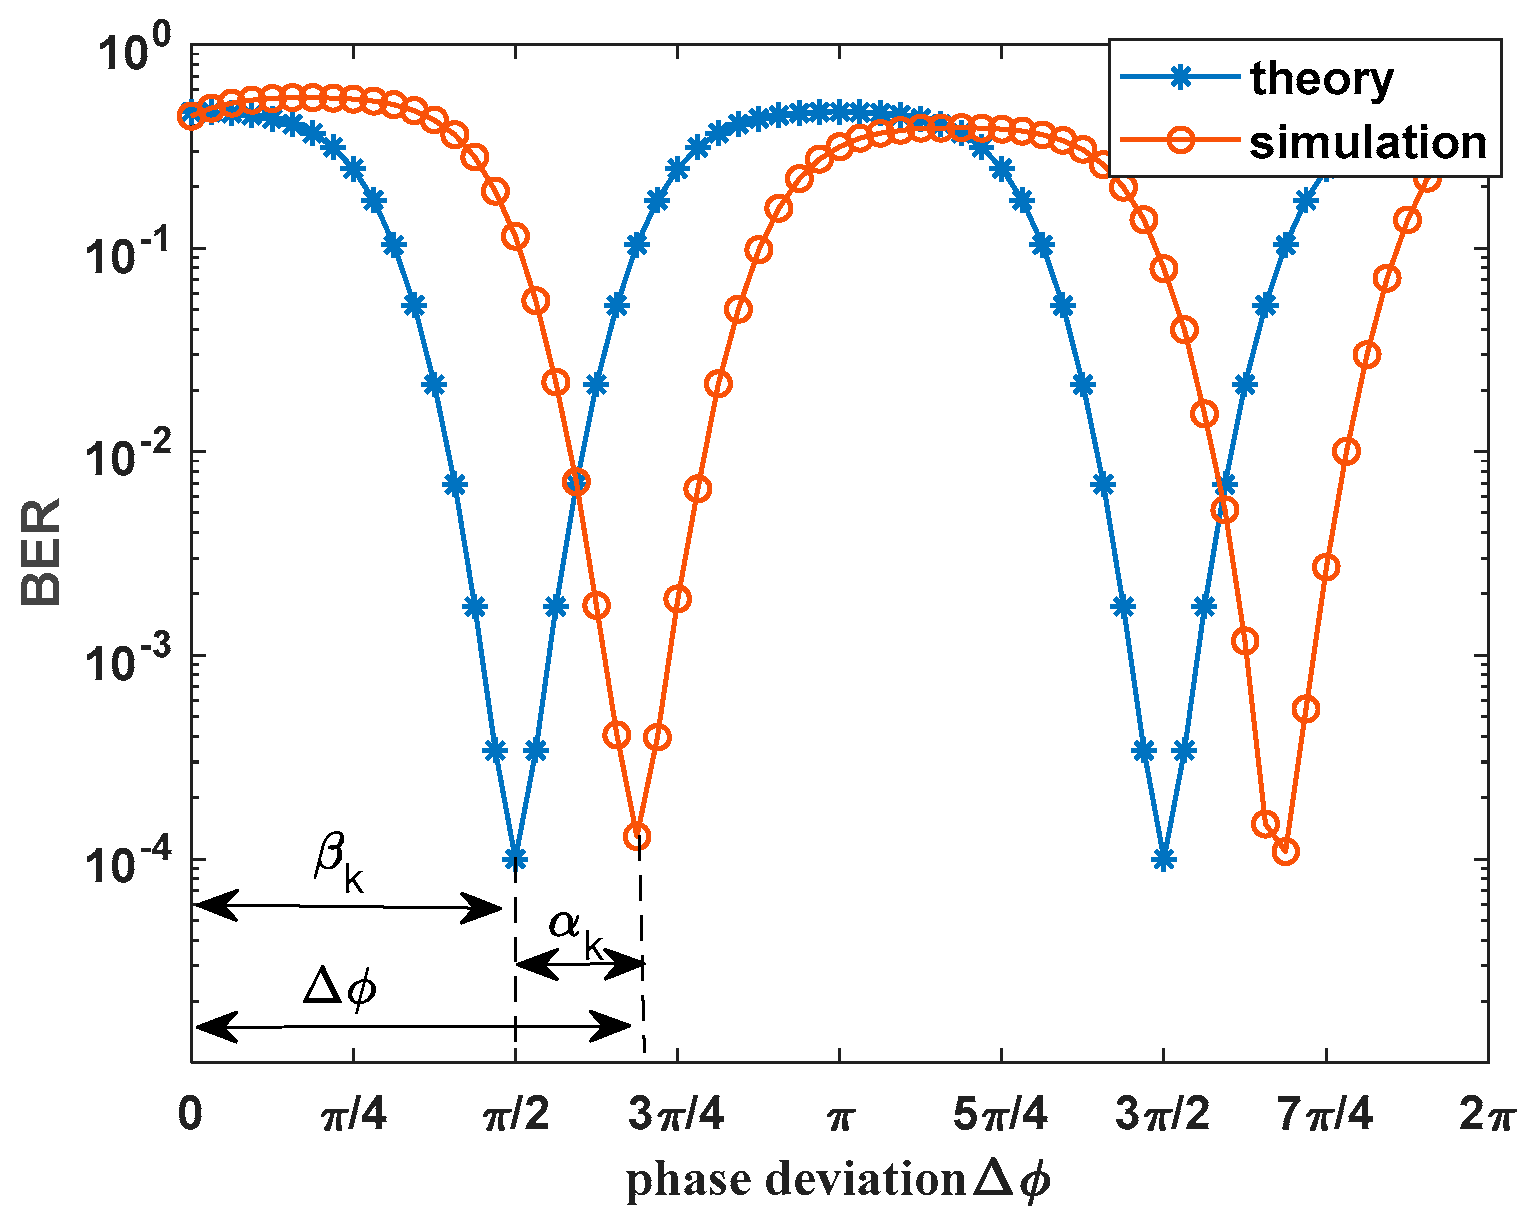
Figure 5 illustrates the BER of the system when the single-frequency interference deviates from the signal carrier frequency. A m-sequence with a period of 15 is employed, with an
Eb/N0 value set at 8.4 dB and a SIR of −14.5 dB. The theoretical BER curve is established using the BER formula derived from the SGA assumption. In
Figure 5, we can observe the BER curve for an interference frequency offset equivalent to the bit bandwidth. The change pattern of the theoretical curve is consistent with
Figure 4, although there is a notable phase difference compared to the simulation curve. This discrepancy arises because the x-axis of the theoretical curve represents the composite phase deviation
βk in Equation (32), while the x-axis of the simulation curve represents the actual phase deviation Δ
φ, with the disparity between them being the frequency offset phase deviation α
k.
Next, the system’s BER performance is simulated and experimentally verified as a function of the interference frequency offset.
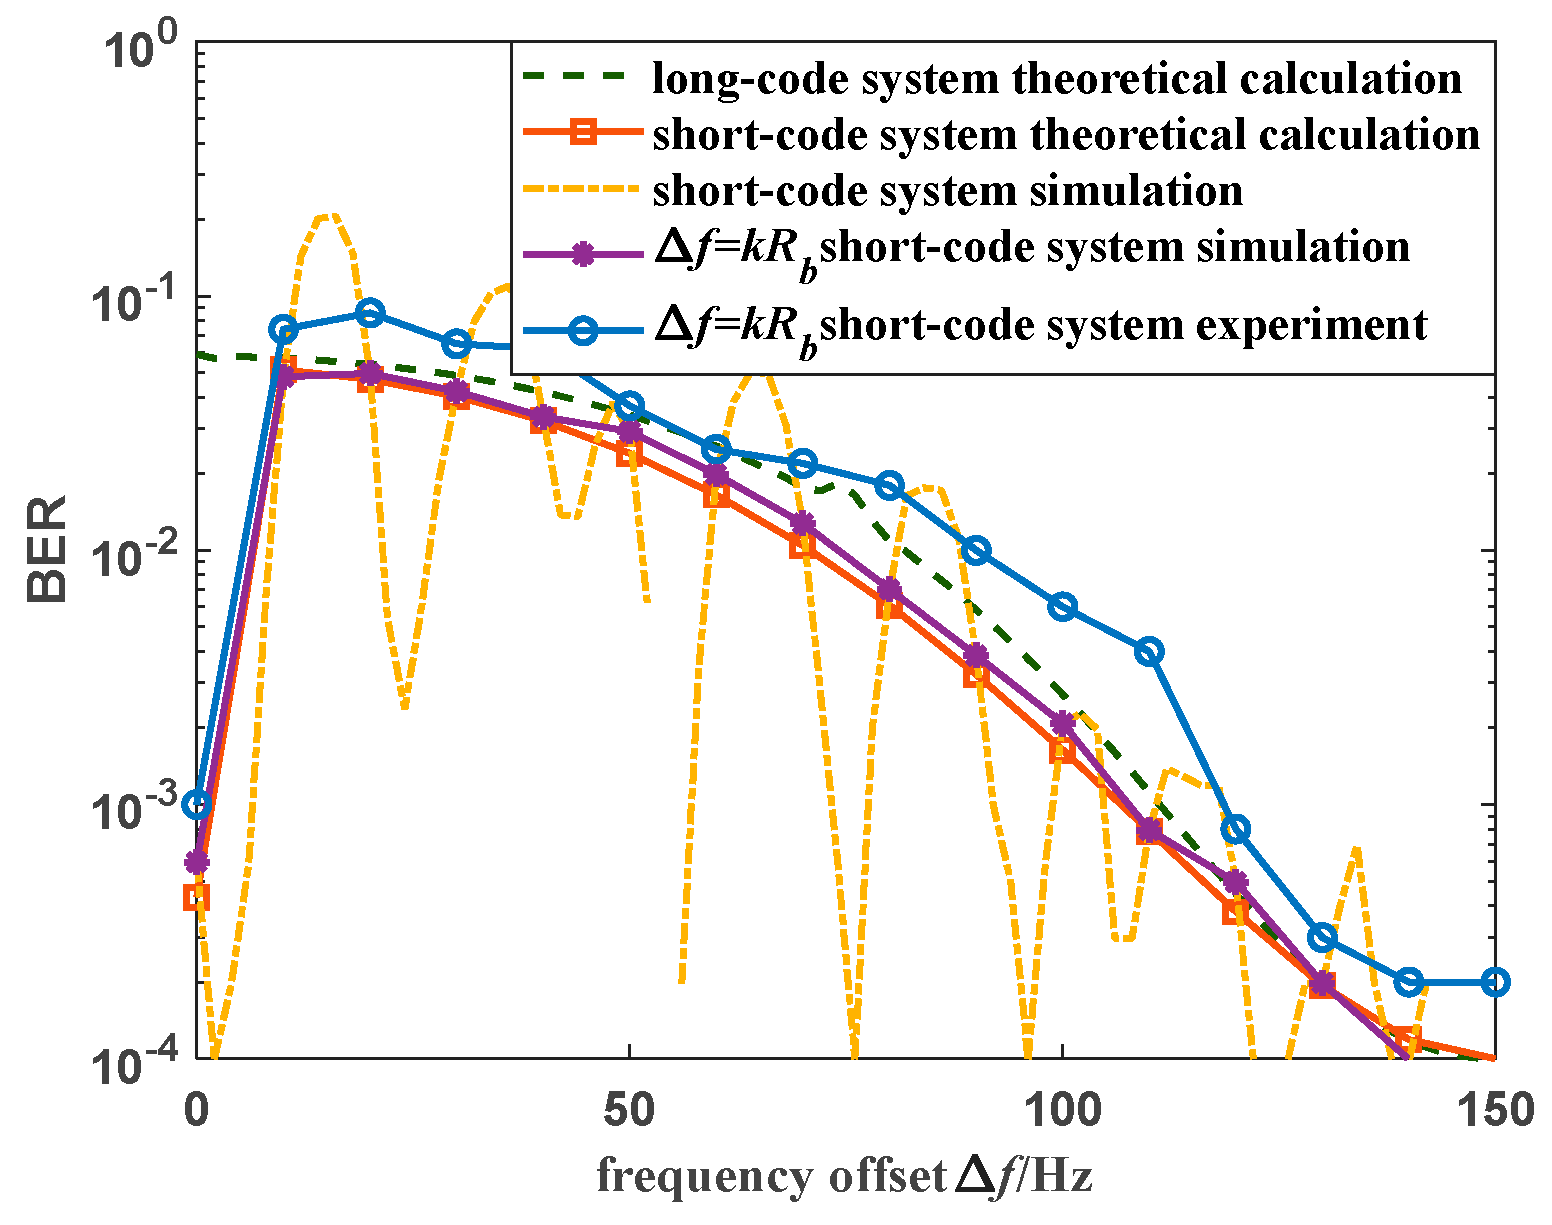
Figure 6 illustrates the theoretical BER of the long-code system compared to the simulated and experimental BERs of the short-code system with a code length of 15. In this scenario, the
Eb/N0 is 8.4 dB, the single-frequency interference SIR is −10 dB, and the bit bandwidth is 5 Hz. The results indicate that when the interference frequency offset is an integer multiple of the bit bandwidth, the theoretical and simulated BERs of the short-code system align closely, with the experimental BER slightly higher. The overall trend of change for the three BERs remains consistent, which confirms the accuracy of the proposed BER calculation formula for the short-code system. However, when the interference frequency offset is not an integer multiple of the bit bandwidth, the simulated BER of the short-code system exhibits periodic oscillation as the frequency offset increases. The period of oscillation is approximately twice the bit bandwidth, consistent with the minimum sinusoidal fluctuation period of the interference sequence as defined in Equation (9). This finding validates the correctness of the theoretical derivation presented in
Section 2.
Furthermore, comparing the BER curves of the long-code system and the short-code system, it is evident that the BER of the long-code system decreases gradually with increasing interference frequency offset. The impact on system performance is most significant when the interference is directed at the carrier frequency of the signal. On the other hand, the BER of the short-code system experiences drastic fluctuations with small changes in the interference frequency offset. At zero frequency offset, the BER of the short-code system is significantly lower than that of the long-code system. This observation demonstrates that the short-code system is highly sensitive to changes in the interference frequency offset.
While the BER of the short-code system closely resembles that of the long-code system when the interference frequency offset is an integer multiple of the bit bandwidth, so that there are similar trends in the BER oscillations of the two systems, their BERs differ significantly when there is zero frequency offset or non-integer multiples of the bit bandwidth. Therefore, the BER of the long-code system cannot be directly applied to analyze the short-code system. Only when the frequency offset is not zero and is an integer multiple of the bit bandwidth can the theoretical BER of the long-code system approximate the BER of the short-code system.
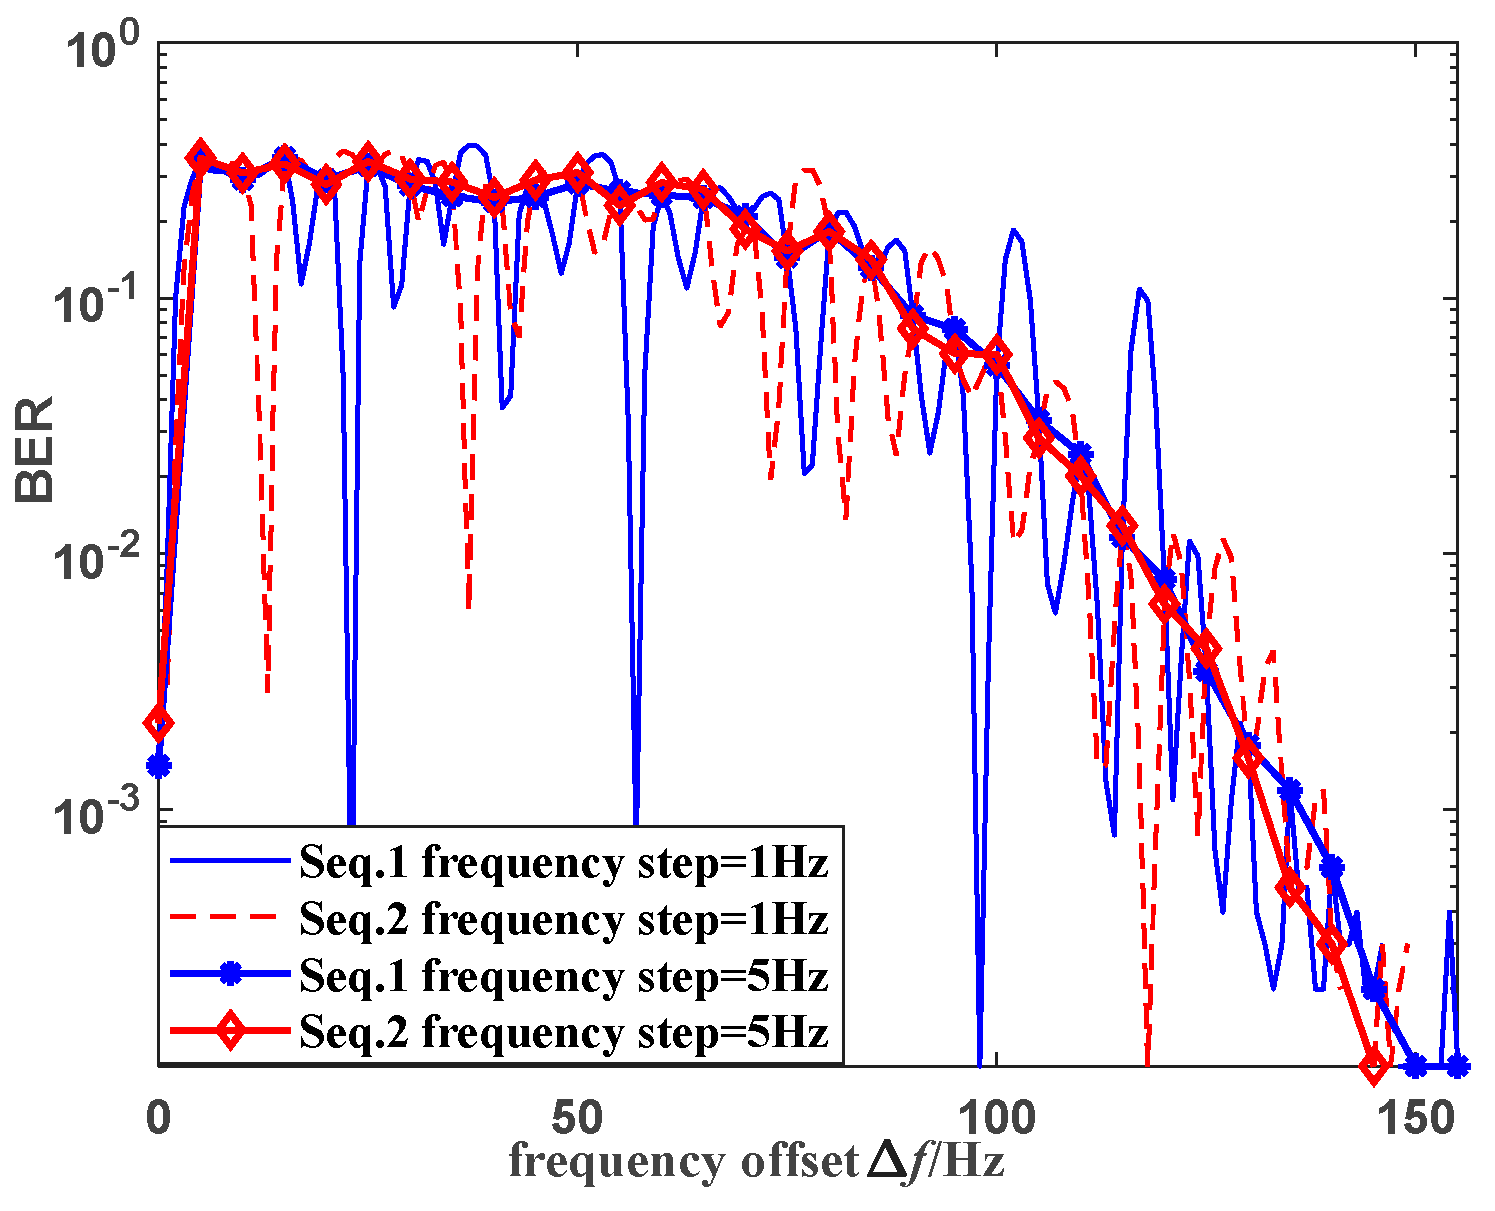
Figure 7 displays the variation curves of Bit Error Rate (BER) when there is a frequency offset in interfering signals. The short-code systems utilize spreading codes with the same length but different structures, and the simulation parameters can be found in
Table 1. It is noticeable that the BER pattern changes with the interference frequency offset for these two short-code systems, except when the offset is a multiple of the bit bandwidth. This distinction arises due to the correlation despreader’s behavior as a filter with specific frequency response characteristics. It consists of a spread spectrum code multiplier and a low-pass filter. As a result, the system’s response differs when confronted with various frequency interferences. The BERs of both systems are practically identical when the interference frequency deviation is a multiple of the bit bandwidth. However, they reach their peak when the frequency deviation becomes equal to the bit bandwidth. These findings align with the analytical results discussed in
Section 4.3.
6. Conclusions
Peterson et al. [
5,
6,
7] and Tian et al. [
8] established foundational analyses of BER under single-frequency interference for long-code systems, but their models assume infinite PN sequences, making them inapplicable to short-period PN systems. Prior works like Wei and Shen [
15] and Zhendong et al. [
21] investigated periodic sequence DSSS systems but lacked quantitative expressions for BER dependence on SIR, phase deviations, and frequency offsets. Lunayach [
19] compared long- and short-code performance but did not address frequency-dependent phase shifts or threshold SIR effects.
Advancements of this study:
We derived a quantitative BER expression for short-code systems, explicitly linking BER to SIR, interference frequency offsets (e.g., Δ
f =
kRb), and phase deviations (Δ
φ)—filling gaps in the literature [
9,
10,
11,
12,
13,
16,
17,
18,
19,
20].
We demonstrated periodic BER oscillations under non-integer frequency offsets, validated experimentally (
Figure 5,
Figure 6 and
Figure 7), a phenomenon unaddressed in long-code analyses [
5,
6,
7,
8].
We revealed the threshold SIR effect (e.g., −24 dB for
N = 15) and its phase dependency (
Figure 3), critical for practical hydroacoustic DSSS design.
We compared short- and long-code systems, showing divergent BER behaviors at Δ
f = 0 and non-integer multiples of Rb, advancing insights beyond [
19,
21].
These contributions refine existing frameworks (e.g., [
1,
3,
4]) by enabling rapid performance prediction for realistic underwater acoustic DSSS systems with short PN sequences. This expression holds importance in engineering practice. The implications of short-period systems’ sensitivity to single-frequency interference can be analyzed through two application dimensions:
Short-period systems (e.g., submarine tactical links or UUV swarm coordination) prioritize low-latency encrypted command transmission, but their vulnerability may:
- (1)
Increase interception risks: Adversaries could detect communication bands via targeted narrowband jamming.
- (2)
Demand dynamic countermeasures: Requires real-time period switching using our theoretical model to balance speed and stealth.
- 2.
Reliability-Cost Tradeoff in Civilian Deployments
For civilian applications like ocean monitoring:
- (1)
Deployment constraints: Short-period sensors should avoid common interference bands.
- (2)
Hybrid network solutions: Heterogeneous architectures combining long-period backbone nodes (monthly duty cycles) with short-period mobile units (hourly updates) achieve both timeliness and robustness.


