Article

Effective Elastic Thickness in Northern South America

Department of Geosciences, National Taiwan University, Taipei 10617, Taiwan
*
Author to whom correspondence should be addressed.
Appl. Sci. 2025, 15(9), 5163; https://doi.org/10.3390/app15095163
Submission received: 1 April 2025 / Revised: 2 May 2025 / Accepted: 3 May 2025 / Published: 6 May 2025
(This article belongs to the Section Earth Sciences)

Abstract

The strength of the lithosphere plays an important role in understanding the deformation process of the Earth. In northern South America, the convergence of three tectonic plates has resulted in a zone of active deformation. The effective elastic thickness (Te) is a parameter that serves as a proxy for the lithospheric strength. This study determined the spatial variations of Te across northern South America through a joint inversion of admittance and coherence using Bouguer gravity anomaly and topography data. The inversion reveals that Te ranges from 15 to 60 km, with high Te (>50 km) corresponding to stable cratons, whereas low Te (<20 km) is displayed in areas close to continental margins. The Colombian Andes exhibit an intermediate Te value, ranging from 20 to 40 km. The subsurface-to-surface ratio (F) indicates dominant surface loading in the region. Furthermore, a correlation was observed between Te and other proxies for lithospheric structure, such as seismic velocity.

1. Introduction

The lithosphere is the outer rigid layer of the Earth and is exposed to continuous deformation. Mechanical strength is a fundamental property of the lithosphere that controls its deformation processes in response to long-term forces [1,2,3,4,5]. The effective elastic thickness (Te) of the lithosphere corresponds to the thickness of an idealized elastic beam that would bend similarly to the actual lithosphere under the same applied loads [6]. Te can be interpreted as a proxy for the integrated strength of the lithosphere and reflects the response of the lithosphere to long-term (>105 yr) geological loads [7]. Oceanic Te is mainly controlled by the thermal age and correlates well with the 450–600 °C isotherm from a cooling plate model. In contrast, continental Te does not correspond to an isotherm or a physical boundary, and factors such as crustal thickness and flexural plate curvature also play important roles [1,6,8]. The Te provides insight into the rheology and state of stress of the lithosphere, as well as its temporal evolution and spatial configuration, and tectonic styles [2,9,10].
Various methodologies have been developed to compute Te, with the most prevalent being forward modeling and spectral methods. In forward modeling, predictions of gravity or topography are compared directly with those of elastic plate models [7]. Spectral methods, particularly admittance and coherence, find the statistical relationship between gravity and topography in the frequency domain, estimating Te by inverting these spectral measures against a theoretical plate model [11]. The admittance is a wavenumber-domain transfer function that enables gravity to be predicted from topography, whereas the coherence is a measure of the phase relationship between two signals [12]. Traditionally, the oceanic Te is calculated using the admittance method and free air anomaly. By contrast, the estimation of continental Te has been a topic of continuous debate. Initial estimations of continental Te employed the admittance method and free air gravity anomaly, assuming only surface loading, and retrieving low Te values where higher values were expected [13,14]. Forsyth [15] addressed this issue by including surface and subsurface loads (e.g., igneous intrusions, magmatic underplating) and using the Bouguer coherence function. However, McKenzie and Fairhead [16] and McKenzie [17] disputed Forsyth’s [15] approach, arguing that it provided upper bounds rather than a true estimation of continental Te. Despite the debate, the Bouguer coherence method remains widely used for Te in the continental lithosphere.
Northern South America is a tectonically complex region encompassing processes such as subduction, collision, and active volcanism. Consequently, the estimation of the Te provides information that contributes to the understanding of this tectonic setting. In the past, numerous studies on Te across northern South America have been conducted employing diverse datasets and methodologies; however, a detailed image of the spatial variation of Te in this region remains lacking. For instance, Tassara et al. [2], Pérez-Gussinyé et al. [18], and Jiménez-Díaz et al. [19] utilized the Bouguer coherence to map the spatial variations of Te in South America and surrounding areas. Stewart and Watts [20] and Galán and Casallas [21] calculated an average Te for the Colombian Cordillera system. Additionally, Ojeda and Whitman [22] employed the multitaper method to determine the average Te for three subareas in northern South America.
In this study, we determined the spatial variations of Te in northern South America following the approach of Audet [23]. For this purpose, a joint inversion of real Bouguer admittance and coherence using wavelet transform and incorporating combined loading (surface and subsurface) was performed using global gravity anomalies and topography data [23,24]. Subsequently, we interpreted the Te distribution in a tectonic context and examined the relationship between the spatial variations of Te and other proxies for lithospheric structure, contributing to the understanding of the lithosphere in this region.

2. Tectonic Setting

In northern South America, a complex interaction exists among the Caribbean, Nazca, and South American Plates (Figure 1). The Caribbean plate is converging obliquely in an east-southeastward direction at a rate of 17.0 ± 0.4 mm/yr., while the Nazca plate converges east-northeastward at a rate of 53.1 ± 0.6 mm/yr., both relative to the stable South American Plate [25]. The stress generated by this triple junction is accommodated by the Panama-Choco and North Andean Blocks [26,27]. This region is composed of a combination of terranes accreted to the Guiana Shield at various times from late Paleozoic through Middle Miocene [28].
The Panama-Choco Block (PCB) is a volcanic arc accompanied by oceanic crust, formed on the edge of the Caribbean Plate and related to the subduction of the Farallon Plate, and later the Cocos Plate [28,29]. It collides into northern South America in a E-SE direction, but without subducting it, because of its buoyancy [30,31]. This collision is considered responsible for the uplifting in the Colombian Andes which affected the three cordilleras [30,31,32]. Trenkamp et al. [33] and Suter et al. [31] proposed that PCB acts as a rigid indenter.
Figure 1. Tectonic setting and topography of northern South America. Velocity vectors from Mora-Páez et al. [25] and major faults from Veloza et al. [34]. Major tectonic structures as follows: SCDB: South Caribbean Deformation Belt, SMM: Santa Marta Massif, SSJ: Sinú-San Jacinto belts, LMVB: Lower Magdalena Valley Basin, PR: Perija Range, BR: Baudó Range, CC: Central Cordillera, MMVB: Middle Magdalena Valley Basin, SM: Santander Massif, MA: Merida Andes, SJAB: San Juan-Atrato Basin, EC: Eastern Cordillera, LLAB: Llanos Basin, TB: Tumaco Basin, WC: Western Cordillera, UMVB: Upper Magdalena Valley Basin, PB: Putumayo Basin, VAB: Vaupes-Amazonas Basin, PCB: Panama-Choco Block, NAB: North Andean Block. Red triangles represent active volcanoes.
Applsci 15 05163 g001
The North Andean Block (NAB) is an independent and distinct geologic segment of the Andean Cordillera, moving at a rate of 8.6 mm/yr. toward N60°E direction relative to the rest of South America and being compressed in an E-W direction [25,35,36,37]. In Colombia, the Andean Belt is segmented into three mountain systems: the Eastern, the Central and the Western Cordilleras. The Eastern Cordillera is an intracontinental belt, oriented NE and composed of a Precambrian and Paleozoic polymetamorphic basement, covered by a sequence of Cretaceous sedimentary rocks and bounded by major inverse faults [27]. The Central Cordillera has a low-grade polymetamorphic Triassic basement that includes oceanic and continental rocks, intruded by Cenozoic plutons generated by the subduction of the Nazca plate under the South American plate. The Central Cordillera is limited by reverse fault systems located along the foothills, which root beneath the range. The Western Cordillera is a basic Igneous complex constituted by basaltic rocks of the Caribbean-Colombian oceanic plateau, accreted during Mesozoic and early Cenozoic. The Western Cordillera is characterized by thrust and fold during late Cenozoic, associated to the Nazca subduction and the accretion of Caribbean blocks [30,38,39]. In the northernmost Andes of Colombia is the Santa Marta Massif (SMM), a triangular pyramidal isolated block, fault-bounded, and surrounded by Cenozoic basins; which is composed by Jurassic magmatic rocks, Paleozoic schists, and allochthonous Late Cretaceous amphibolites [40,41]. The bounding structures of the Santa Marta Massif represent significant structures along the southern Caribbean plate boundary [42].
The Colombian Caribbean Margin is a consequence of the E-NE migration of the Caribbean plate and its subsequent subduction beneath Colombia, resulting in the identification of three structural provinces: the Sinú Fold Belt, the San Jacinto Fold Belt, and the Lower Magdalena Valley Basin [43]. The Sinú and San Jacinto Fold belts form an accretionary wedge of sediments up to 12 km thick which has been accreted to NW Colombian margin during Cenozoic [44]. These two belts are separated by the Sinú Fault. The Sinú Fold Belt presents mud diapirism or mud volcanoes, a feature devoid in the San Jacinto Fold Belt [45]. The Lower Magdalena Valley Basin is a forearc basin situated between the Central Cordillera and the Sierra Nevada de Santa Marta [46]. The Lower Magdalena Valley Basin is composed of Permian-Triassic metasedimentary rocks and is considered the northward continuation of the basement terranes of the Northern Central Cordillera [47]. Below the Lower Magdalena Valley Basin, the subducted slab has an initial dip of 4–8° which increases to 30–50° at a distance of 200 km from the frontal thrust of the Southern Caribbean Deformation Belt. This shallow dip may serve as the mechanism for uplifting of the basin [48].
The Amazonian Craton, one of the largest cratonic areas in the world, forms a part of the crystalline core of the South American continent. It is divided into two provinces by the Amazonas sedimentary basin: Guiana Shield to the north and Central Brazilian Shield [49,50]. In Colombia, the Amazonian Craton extends from the eastern flank of the Andean Cordillera in the Llanos Foothills to the borders with Venezuela, Brazil, and Perú [51]. This region encompasses the Llanos, Putumayo, and Vaupés-Amazonas Basins. The basement of the Amazonian Craton in Colombia (mostly covered by a thick sedimentary cover) is formed by Precambrian igneous, metamorphic, and sedimentary rocks of the western Guiana Shield [52].

3. Data and Methodology

We estimate the spatial variation of Te in northern South America by a joint inversion of real Bouguer admittance and coherence [23]. The spectral admittance and coherence functions are defined by [24]:
Z k = G k H ( k ) H k H ( k )
γ 2 k = G k H ( k ) 2 G k G ( k ) H k H ( k )
where G(k) and H(k) are the gravity and topography spectra respectively. k is the two-dimensional wavenumber, and k = k = k x 2 + k y 2 , where kx, ky, are the wavenumbers in x and y directions. The asterisk indicates complex conjugation, and brackets indicate an averaging procedure. The spectra are calculated using the continuous planar wavelet transform (CWT) with a Fan wavelet [53], which is a superposition of 2D Morlet wavelets with different azimuths spanning 180° [11,54]. The central wavenumber k 0 of the Morlet wavelet governs its spatial–spectral resolution. We set k 0 = 5.336   to satisfy the zero-mean requirement of the wavelets, which provides a more accurate absolute Te estimation, but the spatial resolution decreases. In contrast, a low k 0 provides a better resolution, but the uncertainty on the estimation of Te increases [54].
The predicted admittance and coherence are calculated using the “uniform-f“ method [23], in which the subsurface-to-surface load ratio, f, and Te are independent and adjustable parameters during the inversion [55]. Following Forsyth [15], the subsurface load is emplaced at the Moho which is characterized by a marked density contrast. The ratio of the internal to the total load is defined by F = f/(1 − f) [17]. F = 0 reflects a purely surface loading, while F = 1 indicates a dominant subsurface loading and F = 0.5 equals combined loading [11,56]. The values of Te and F are estimated by jointly minimizing the misfit between observed and predicted admittance and coherence [24]. The misfit is calculated using a reduced chi-squared criterion [23]:
χ 2 F , T e = 1 ( 2 N 2 ) 2 i = 1 N d i j S i j ( F , T e ) σ i j 2
where d i j is the i t h measured sample of either real admittance or coherence with variance σ i j 2 , S i j   the analytical quantity for a given model, and N is the number of samples.
In this study, topographic data (Figure 1) were obtained from the ETOPO1 digital elevation model, which has a spatial resolution of 1 arc-minute [57]. The Bouguer anomaly data (Figure 2) were extracted from WGM2012, an earth gravity anomaly model computed at a global scale in spherical geometry that considers the contribution of most surface masses [58] and has a spatial resolution of 2′ × 2′. The thickness (Figure 3a) and density (Figure 3b) of the crust were derived from the CRUST1.0 model [59]. All geographical grids were transformed into Cartesian coordinates using the Mercator projection and gridded at a 5 × 5 km2 cell size. To mitigate the boundary effects, the grid was extended by 3° beyond the study area, which is the Colombian territory.

4. Results and Discussion

4.1. Spatial Variation of Te and Loading Ratio (F)

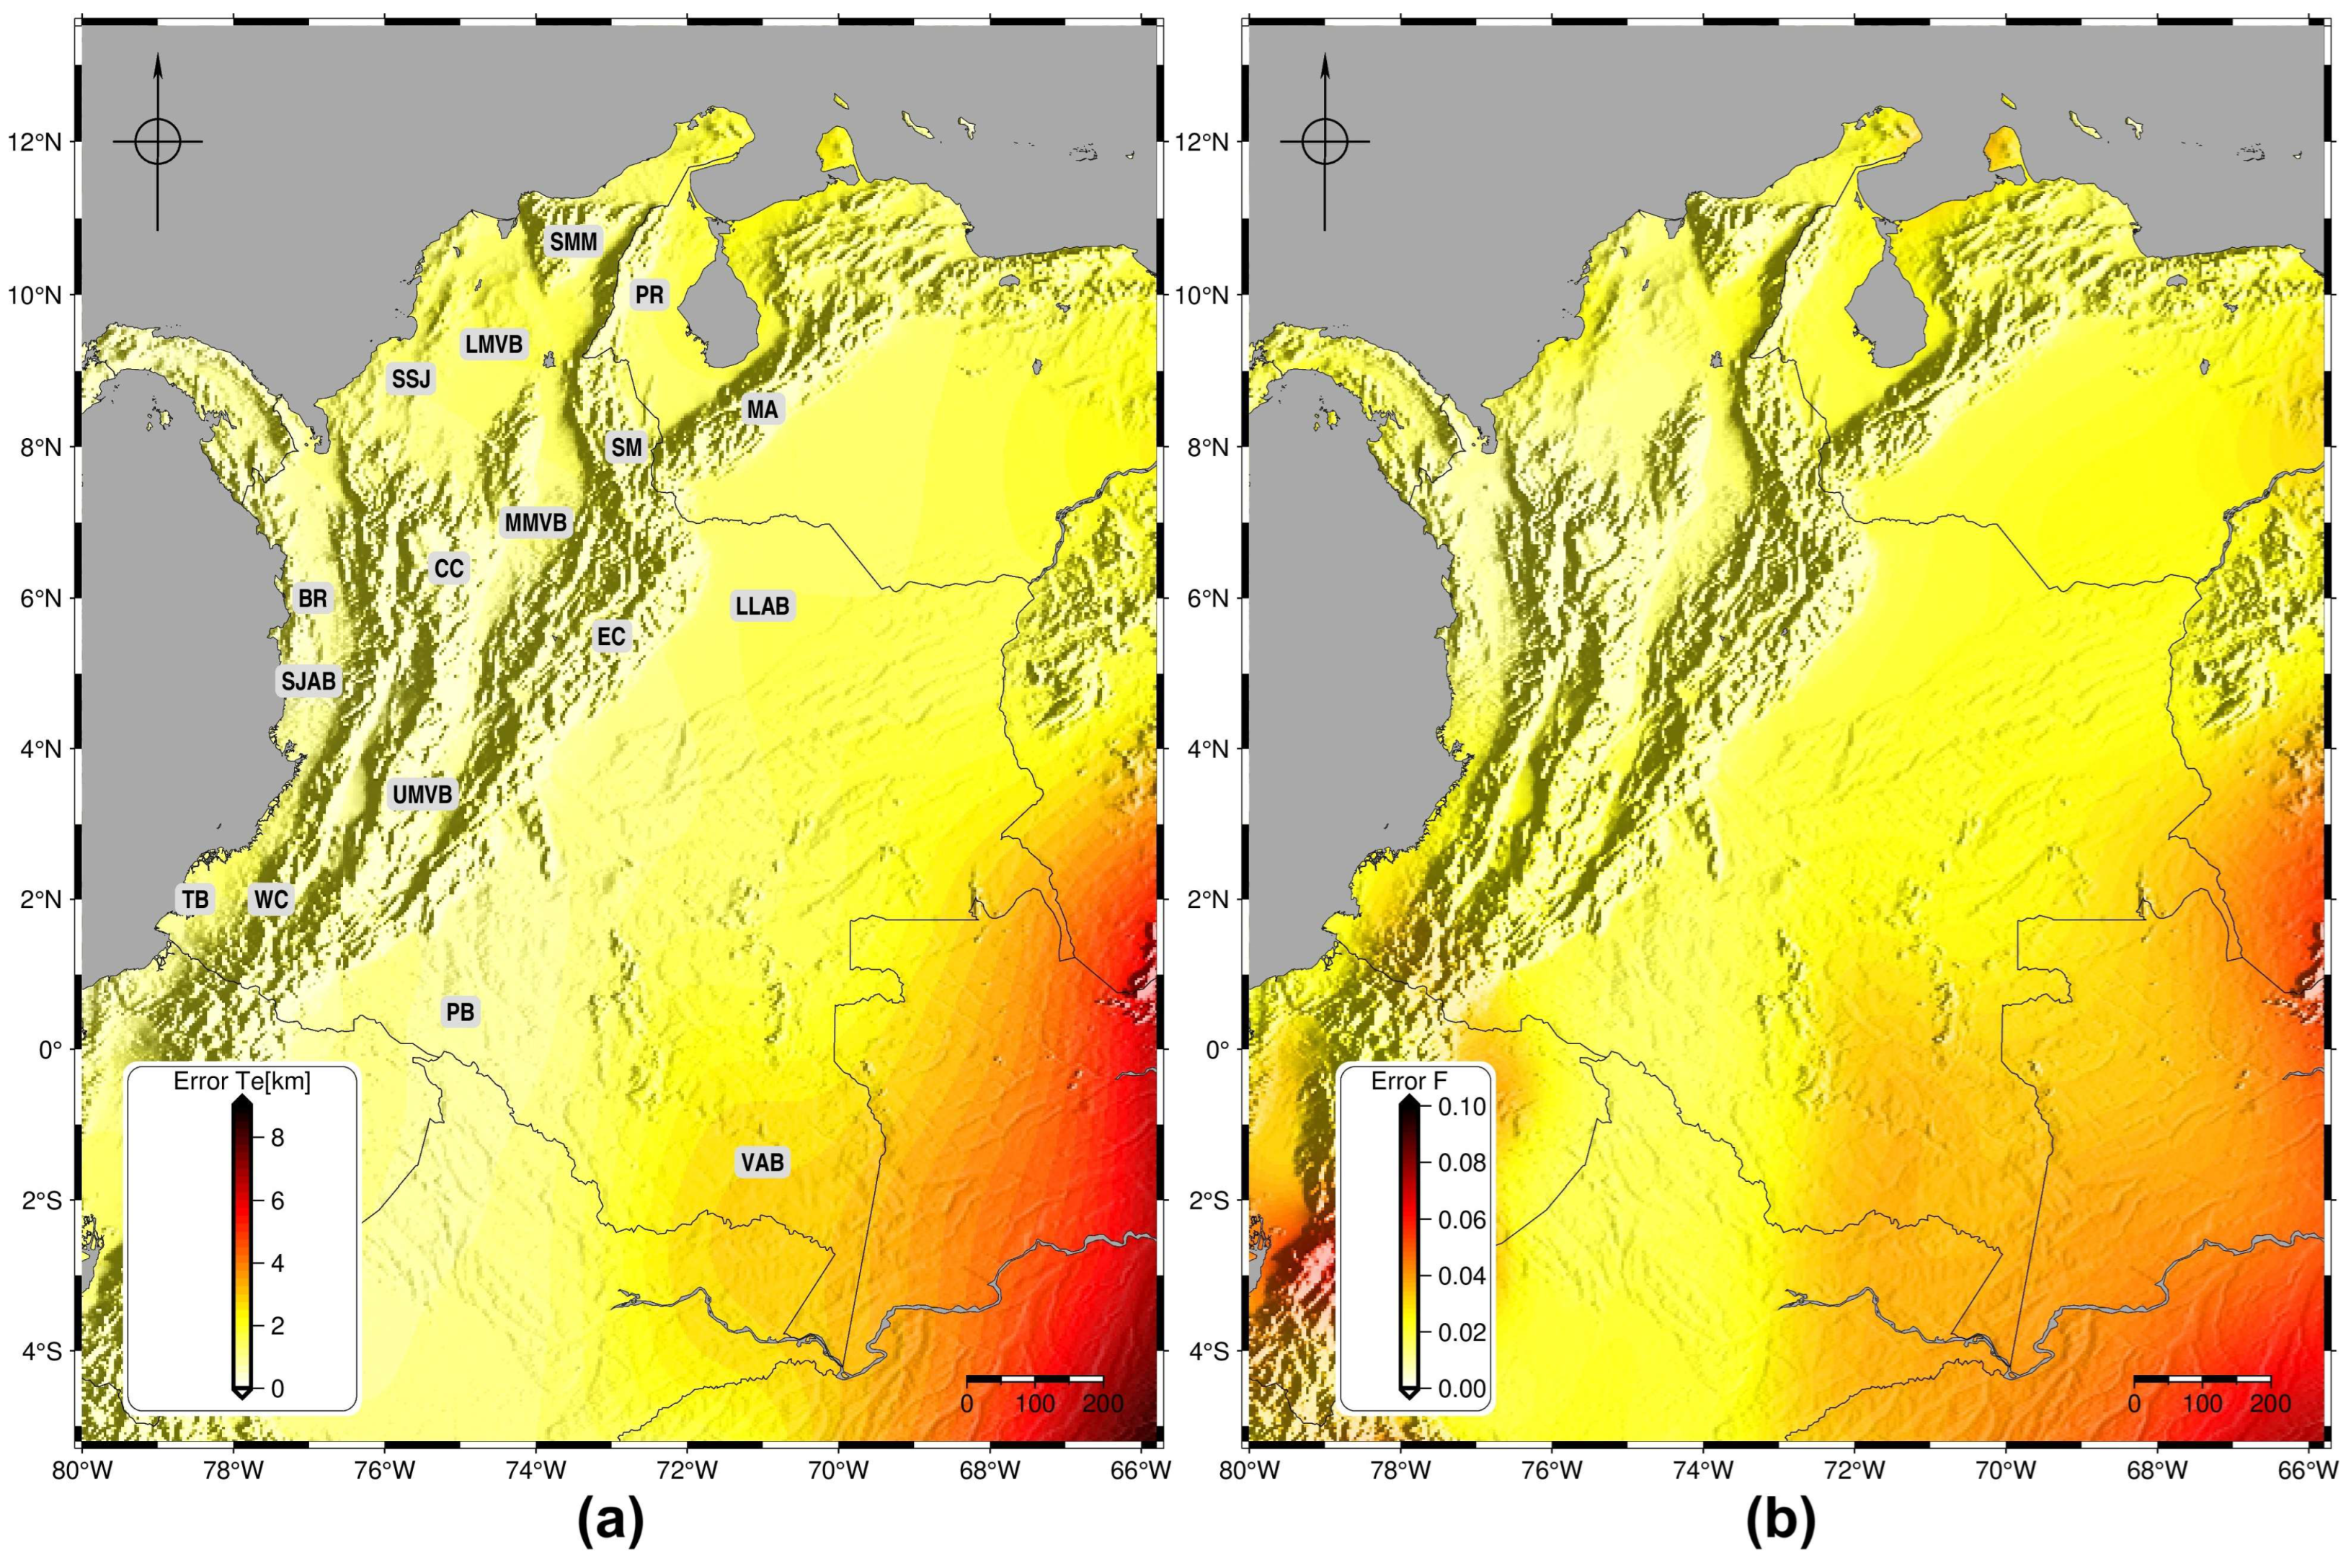
From a broad view, the map of spatial variation of Te in Colombia (Figure 4a) reveals that the Te varies between 15 km at the southern flank of the Colombian Pacific margin and 60 km in the Amazonian Craton. Additionally, an increasing trend of Te in W-E direction is observed. The F value is predominantly low (F~0.2) across the region, indicating that the surface loading is dominant (Figure 4b). This type of loading is caused by topography and large-scale variations in surface density [19]. This aligns with the tectonic setting, that is dominated by mountain ranges and sedimentary basins. The uncertainties in Te (<5 km) (Figure 5a) and F (<0.10) (Figure 5b) are small, showing the robustness of the results using the joint inversion of admittance and coherence.
The findings indicate that within the Caribbean Colombian margin, the Guajira Peninsula and the Lower Magdalena Valley Basin (LMVB) exhibit a variation in Te from 40 to 45 km, whereas beneath the Santa Marta Massif (SMM), the Te ranges from 25 (at the NW flank) to 43 km. In relation to the Sinú and San Jacinto Fold belts (SSJ), both are characterized by a Te of 30–40 km. Comparing these Te variations with seismic tomography studies, Poveda et al. [60,61] reported a lithospheric thickness of approximately 30 km under Sinú and San Jacinto belts (SSJ), approximately 35 km beneath Lower Magdalena Valley Basin (LMVB), and about 40 km under Santa Marta Massif (SMM), which indicates a positive correlation with the Te estimations. The Te lateral variations suggest a relatively strong lithosphere, reflecting the tectonic features of this area. The Te value obtained for Santa Marta Massif (SMM) supports the idea that a rigid lithosphere could provide mechanical support to the topography; nonetheless, it is unable to explain the positive Bouguer gravity anomaly meaning the lack a crustal root [62].
Over the Colombian Pacific margin, the Te ranges between 15 and 30 km in the Tumaco Basin (TB), whereas a uniform value of 35 km is observed in the San Juan and Atrato Basins (SJAB). The Baudó Range (BR), a narrow band situated to the east of the Atrato Basin, has Te of 25–35 km. The lowest value (15 km) on the southernmost flank is shared by a portion of the Tumaco Basin and the southern volcanic center of Colombia, and it continues to extend throughout the Ecuadorian territory. This volcanic center corresponds to the continuation of the Ecuadorian volcanism, which extends over a broad region from the Western Cordillera to the Subandean Zone in Ecuador [63,64]. This region is characterized by active volcanism and geothermal systems, magma reservoirs, and partial melt [64,65,66,67], and exhibits low seismic velocity [61,67,68], indicating a relatively hot lithosphere and, consequently, low flexural rigidity [18,19]. This reduction in lithospheric strength is indicative of subduction-related volcanism within the cordillera [69]. These low Te values are common in deforming regions of active subduction [70].
The Colombian Cordilleras are characterized by Te values ranging from 20 to 40 km. Overall, there is a positive correlation between crustal thickness studies using seismic tomography [60,61,71] and gravity data [72], which report crustal thickness values between 30 and 60 km. Across the entire Cordillera system, the lower Te values are located on the southern flank, increasing smoothly towards the north, where the thickest Te (40 km) is found in the Eastern Cordillera (EC), which bifurcates into the Merida Andes (MA) and Perija Range (PR) (Venezuela). Research conducted by Mojica Boada et al. [71] and Poveda et al. [60,61] also reported crustal thickening in the northern part of the Cordilleran system, particularly in the Eastern Cordillera (EC), where the crustal thickness beneath the northernmost section is approximately 60 km. This crustal thickening has been linked to a process of tectonic shortening and a more rigid lithospheric behavior in the northern segment than in the southern segment [73]. The Middle Magdalena Valley Basin Valley (MMVB), which separates the Central (CC) from the Eastern Cordillera (EC) has a Te ranging from 35 to 40 km.
The Amazonian Craton in Colombia exhibits a Te ranging from 25 to 60 km. In the Putumayo Basin (PB), the Te varies between 25 and 35 km. Further northeast, in the Llanos Basin (LLAB), the Te increases to 45 km; consistent with the presence of the Precambrian basement of the Guiana Shield along its eastern margin [74]. In the Putumayo Basin (PB), the variation in Te, results from its location within a transition zone between flat to steeper-dipping subduction slab [75]. Toward the southern Colombian territory, in the area approximately covered by the Vaupés-Amazonas Basin (VAB), the Te varies from 30 to 60 km, with the highest Te found in the southernmost tip (the boundary Colombia, Perú, and Brasil), an area potentially connected with the intracratonic Brazilian basin of Solimões [76] and characterized by high seismic velocities [77,78].
In examining the two tectonic blocks, it is observed that the Panama-Choco Block (PCB) has a Te < 30 km, whereas the adjacent North Andean Block (NAB) exhibits a Te > 40 km. This disparity in Te values is interesting, because assuming that the PCB acts as a rigid indenter [31,33] or as a broken indenter [25], causing deformation and uplift of the Northern Andes, a higher Te compared to that of NAB would be expected. The low Te value observed in PCB may be elucidated by the model proposed by Rockwell et al. [79], which characterizes this tectonic block as a soft block indenter with considerable internal deformation. Nonetheless, further comprehensive investigations are required to determine this aspect.

4.2. Comparison with Previous Results

Several estimations of Te have been conducted for northern South America. The studies by Tassara et al. [2], Pérez-Gussinyé et al. [18] and Jiménez-Díaz et al. [19] employed spectral techniques and global gravity models to generate maps of Te spatial variations across the entire South American continent, yielding values for the northern region ranging from 15 to 70 km. These studies reported the highest Te values in craton areas; which is in agreement with the findings of this study. Mantovani et al. [80,81] also determined the Te for South America using an empirical correlation between tidal gravity anomaly and Te. They reported a Te range of 60 to 70 km for northern South America. This Te value is significantly higher compared to the estimates provided by other studies. Nonetheless, Pérez-Gussinyé et al. [18] argued that the estimations by Mantovani et al. [80,81] are unlikely to be comparable with those derived from topography and gravity data, because the response of the lithosphere to this short-term cyclical stress (tidal loading) is quite different to that of long-term geological processes.
Other studies on Te have been conducted in specific places, and their findings are consistent with our results. Stewart and Watts [20] analyzed profiles of gravity to estimate the Te by forward modelling in the Colombian mountain range, obtaining a Te value of 45 km. Galán and Casallas [21] estimated a Te of 20 km for the Colombian Andes using Free air gravity anomalies profiles and the admittance technique. Ojeda and Whitmann [22] studied the Te of Eastern Cordillera (EC) using multitaper estimators (to calculate Bouguer coherence) obtaining a value of 30 km. Using flexural analysis, Cerón et al. [82] reported a Te of approximately 27 km for the Plato Basin, located north of the Lower Magdalena Valley Basin (LMVB). In the Putumayo Basin (PB), Londoño et al. [83] performed flexural modeling and found a Te of 30 km, whereas Pachón-Parra et al. [75] conducted 3D flexural modeling and obtained a Te ranging from 25 to 35 km.
Finally, comparing worldwide studies by Audet and Bürgmann [10] and Lu et al. [84], which derived Te from Bouguer coherence and admittance using the continuous wavelet transform; and the study by Tesauro et al. [85] which calculated Te based on the lithospheric strength distribution; reveals that our findings are in good agreement with these investigations.

4.3. Te, Surface Heat Flow, and Seismic Velocity

The heat flow serves as an indicator of the thermal state of the lithosphere, which in turn affects the value of Te [1,86]. Seismic velocities depend on the temperature and rock composition, factors that influence rheology, and ultimately the integrated strength of the lithosphere [18]. Several investigations have shown a correlation between the heat flow and seismic velocity with the Te [18,24,87]. In this study, these relationships are examined for northern South America. It is important to note, however, that aspects such as the resolution of the models or that the sensitivities of seismic velocities and Te differ and require careful comparison [18].
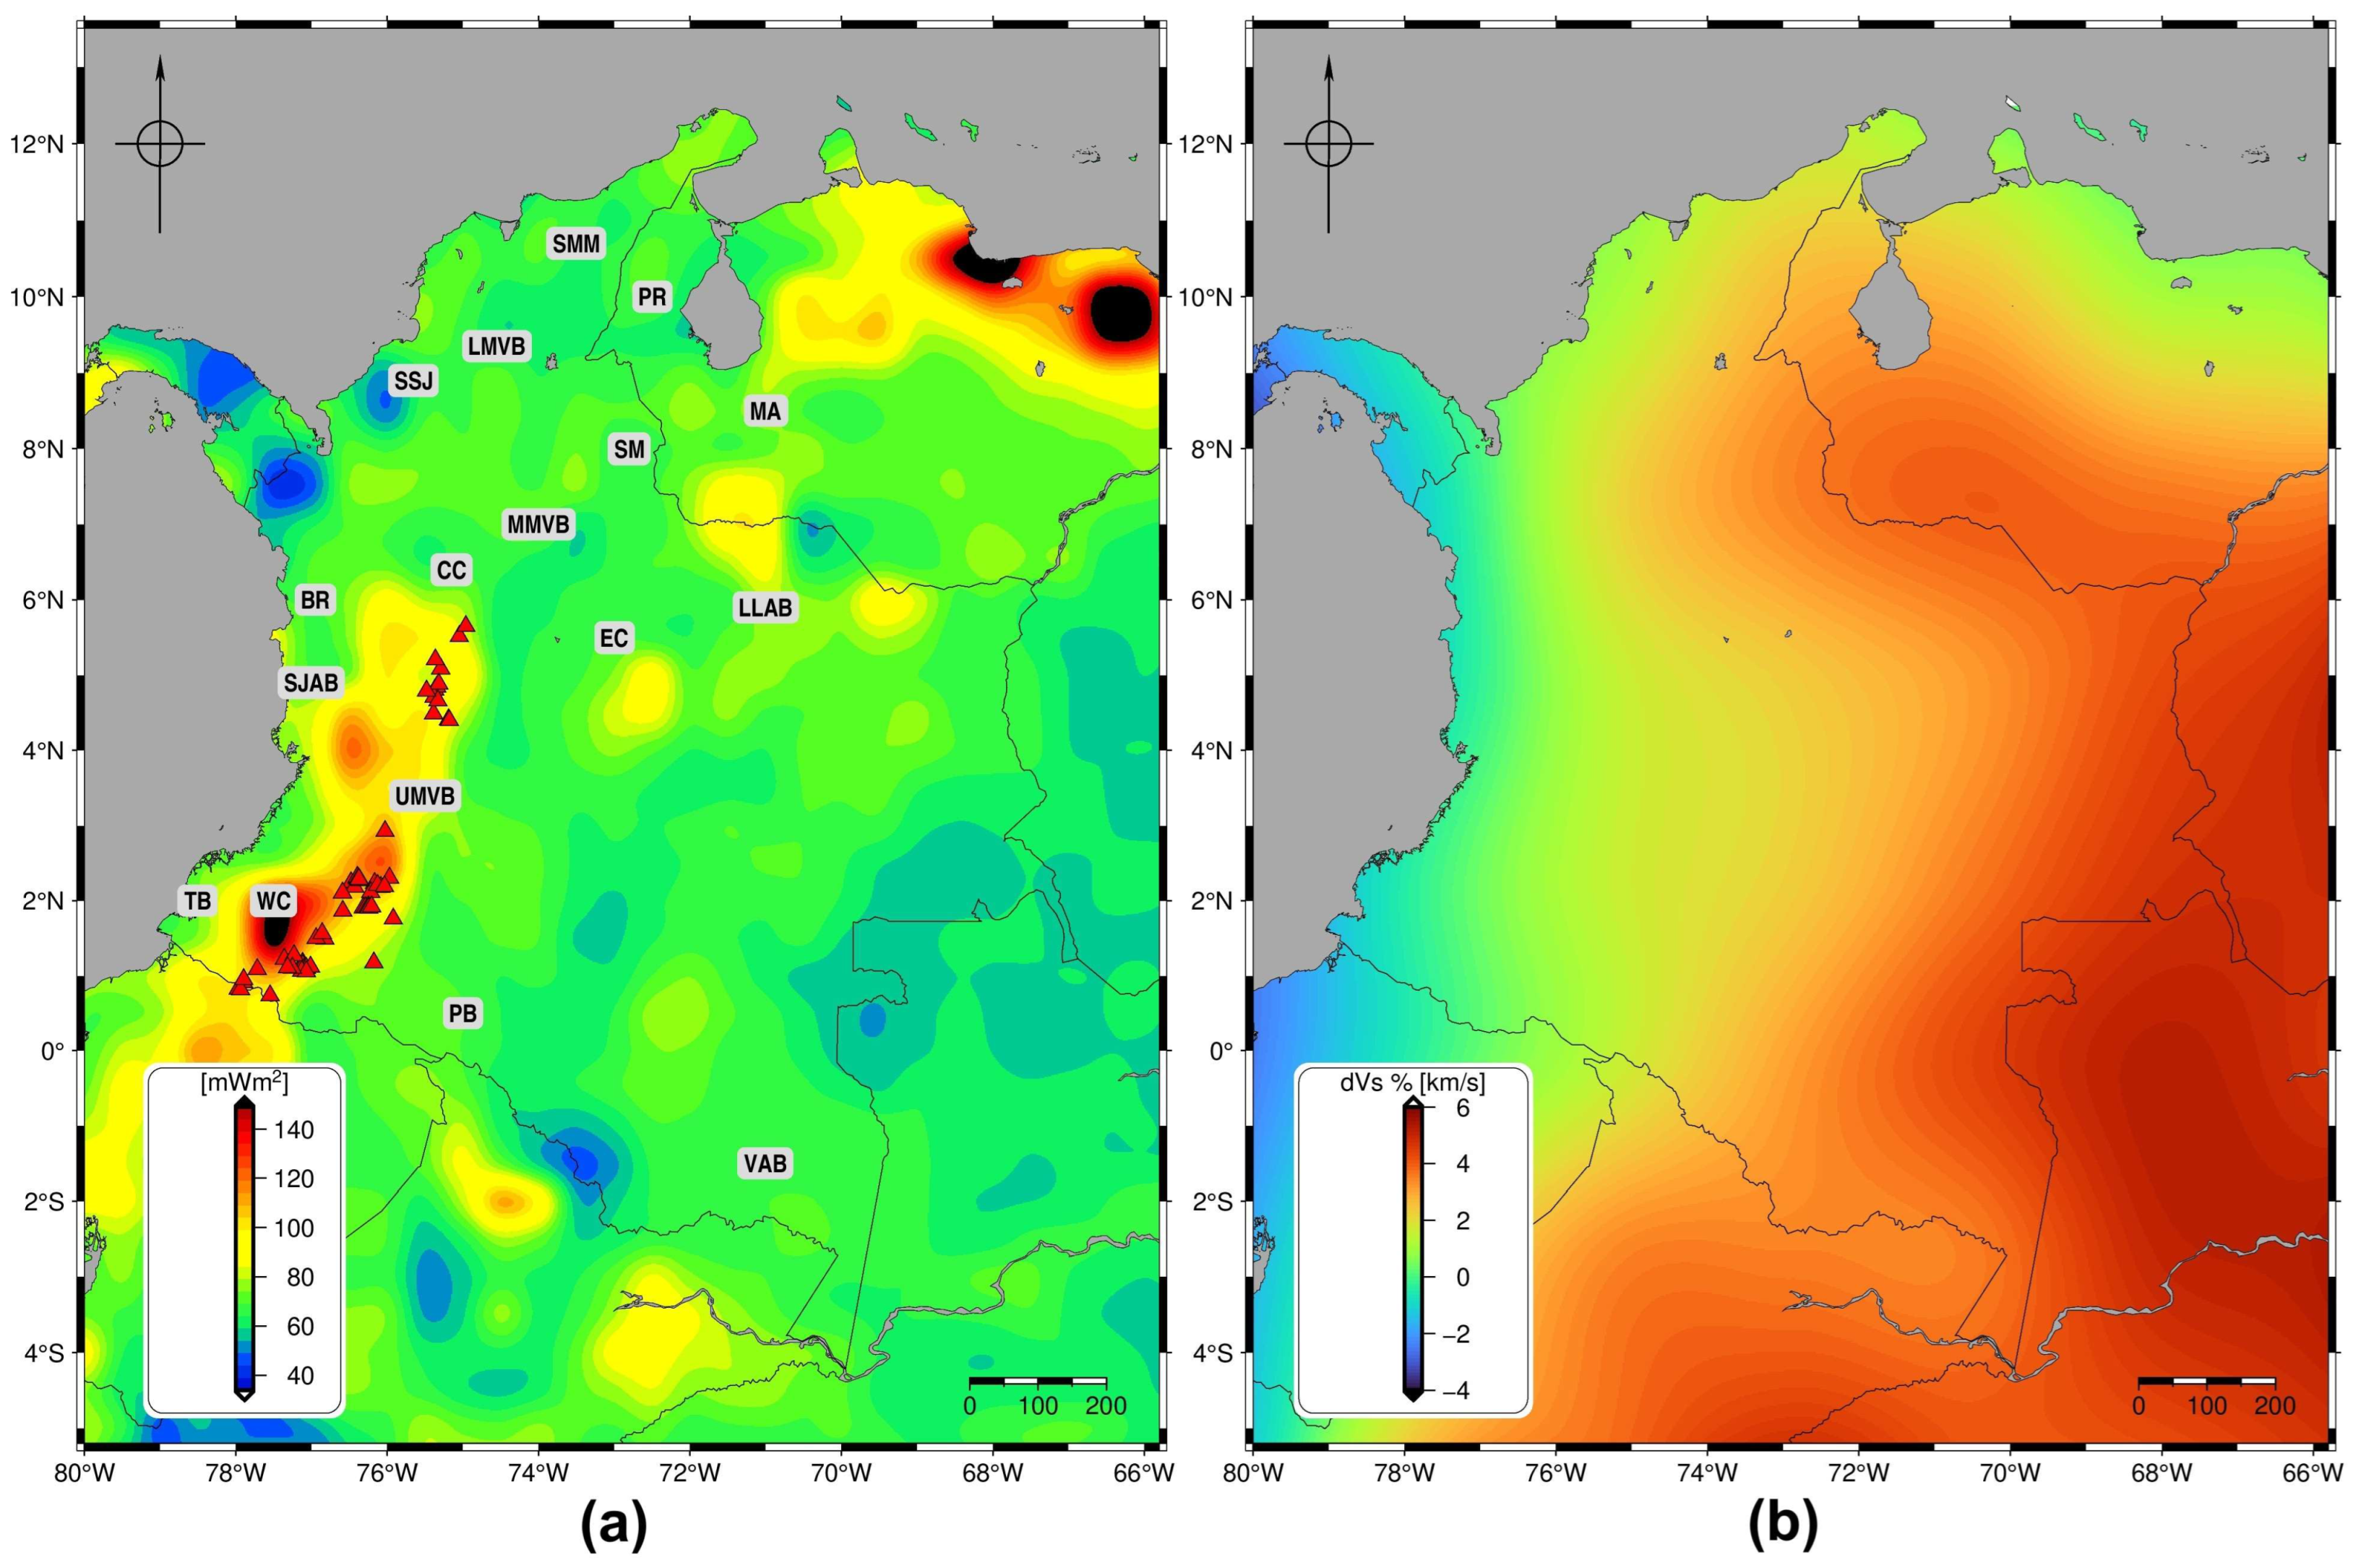
Figure 6a illustrates the variations in heat flow across northern South America obtained by Lucazeau [88]. The heat flow values range from 40 to 160 mW/m2. Generally, the highest heat flow values (≥120 mW/m2) are observed in the southern volcanic segment and certain locations within the Central (CC) and Western Cordilleras (WC). Conversely, the lowest heat flow values (~45 mW/m2) are found in some areas of Vaupés-Amazonas Basin (VAB) and the Colombia-Panamá border. The majority of the territory is dominated by relatively intermediate heat flow values (60–70 mW/m2). A comparison of the spatial heat flow distribution in relation to Te variation indicates that regions with high heat flow are associated with low and moderate Te values, whereas most areas with high Te tend to correspond to low heat flow values.
Research has demonstrated a correlation between Te and seismic velocity anomalies at 100 km [10,18,24]. We use shear wave velocity perturbations (ΔVs) at a depth of 100 km extracted from 3DLGL2022-TEPSv, a model developed by Debayle et al. [89], to compare them with the Te pattern across northern South America. Overall, the resulting map of ΔVs (Figure 6b) correlates positively with Te. Both the velocity seismic perturbations and Te seem to have a similar trend and direction of increase; regions with low Te correspond to low-velocity anomalies, whereas areas with high Te exhibit high-velocity perturbations.
In a comparative analysis of Te, heat flow and seismic velocities, it is generally observed that regions with high Te such as the southernmost point of Vaupés-Amazonas Basin (VAB), also exhibit high seismic velocity and low heat flow. However, the correlation between high heat flow, low seismic velocity, and low Te, as identified in other studies [18,70], remains unclear in the context of northern South America, as shown by the fact that in the Panama zone, the Te (Figure 4a), heat flow (Figure 6a), and seismic velocity (Figure 6b) are low.

4.4. Te and Seismicity

Studies have shown that variations in Te may be related to the spatial distribution of earthquakes [9,10]; because the strength contrast occurring in the lithosphere could control the localization of deformation resulting of tectonic forces and possibly the distribution of earthquakes [2]. It is worth noting that this potential correlation is a topic of continuous debate [7,90,91], necessitating careful analysis. By utilizing the Te map and seismic activity data, this relationship within continental lithosphere is examined in the study area.
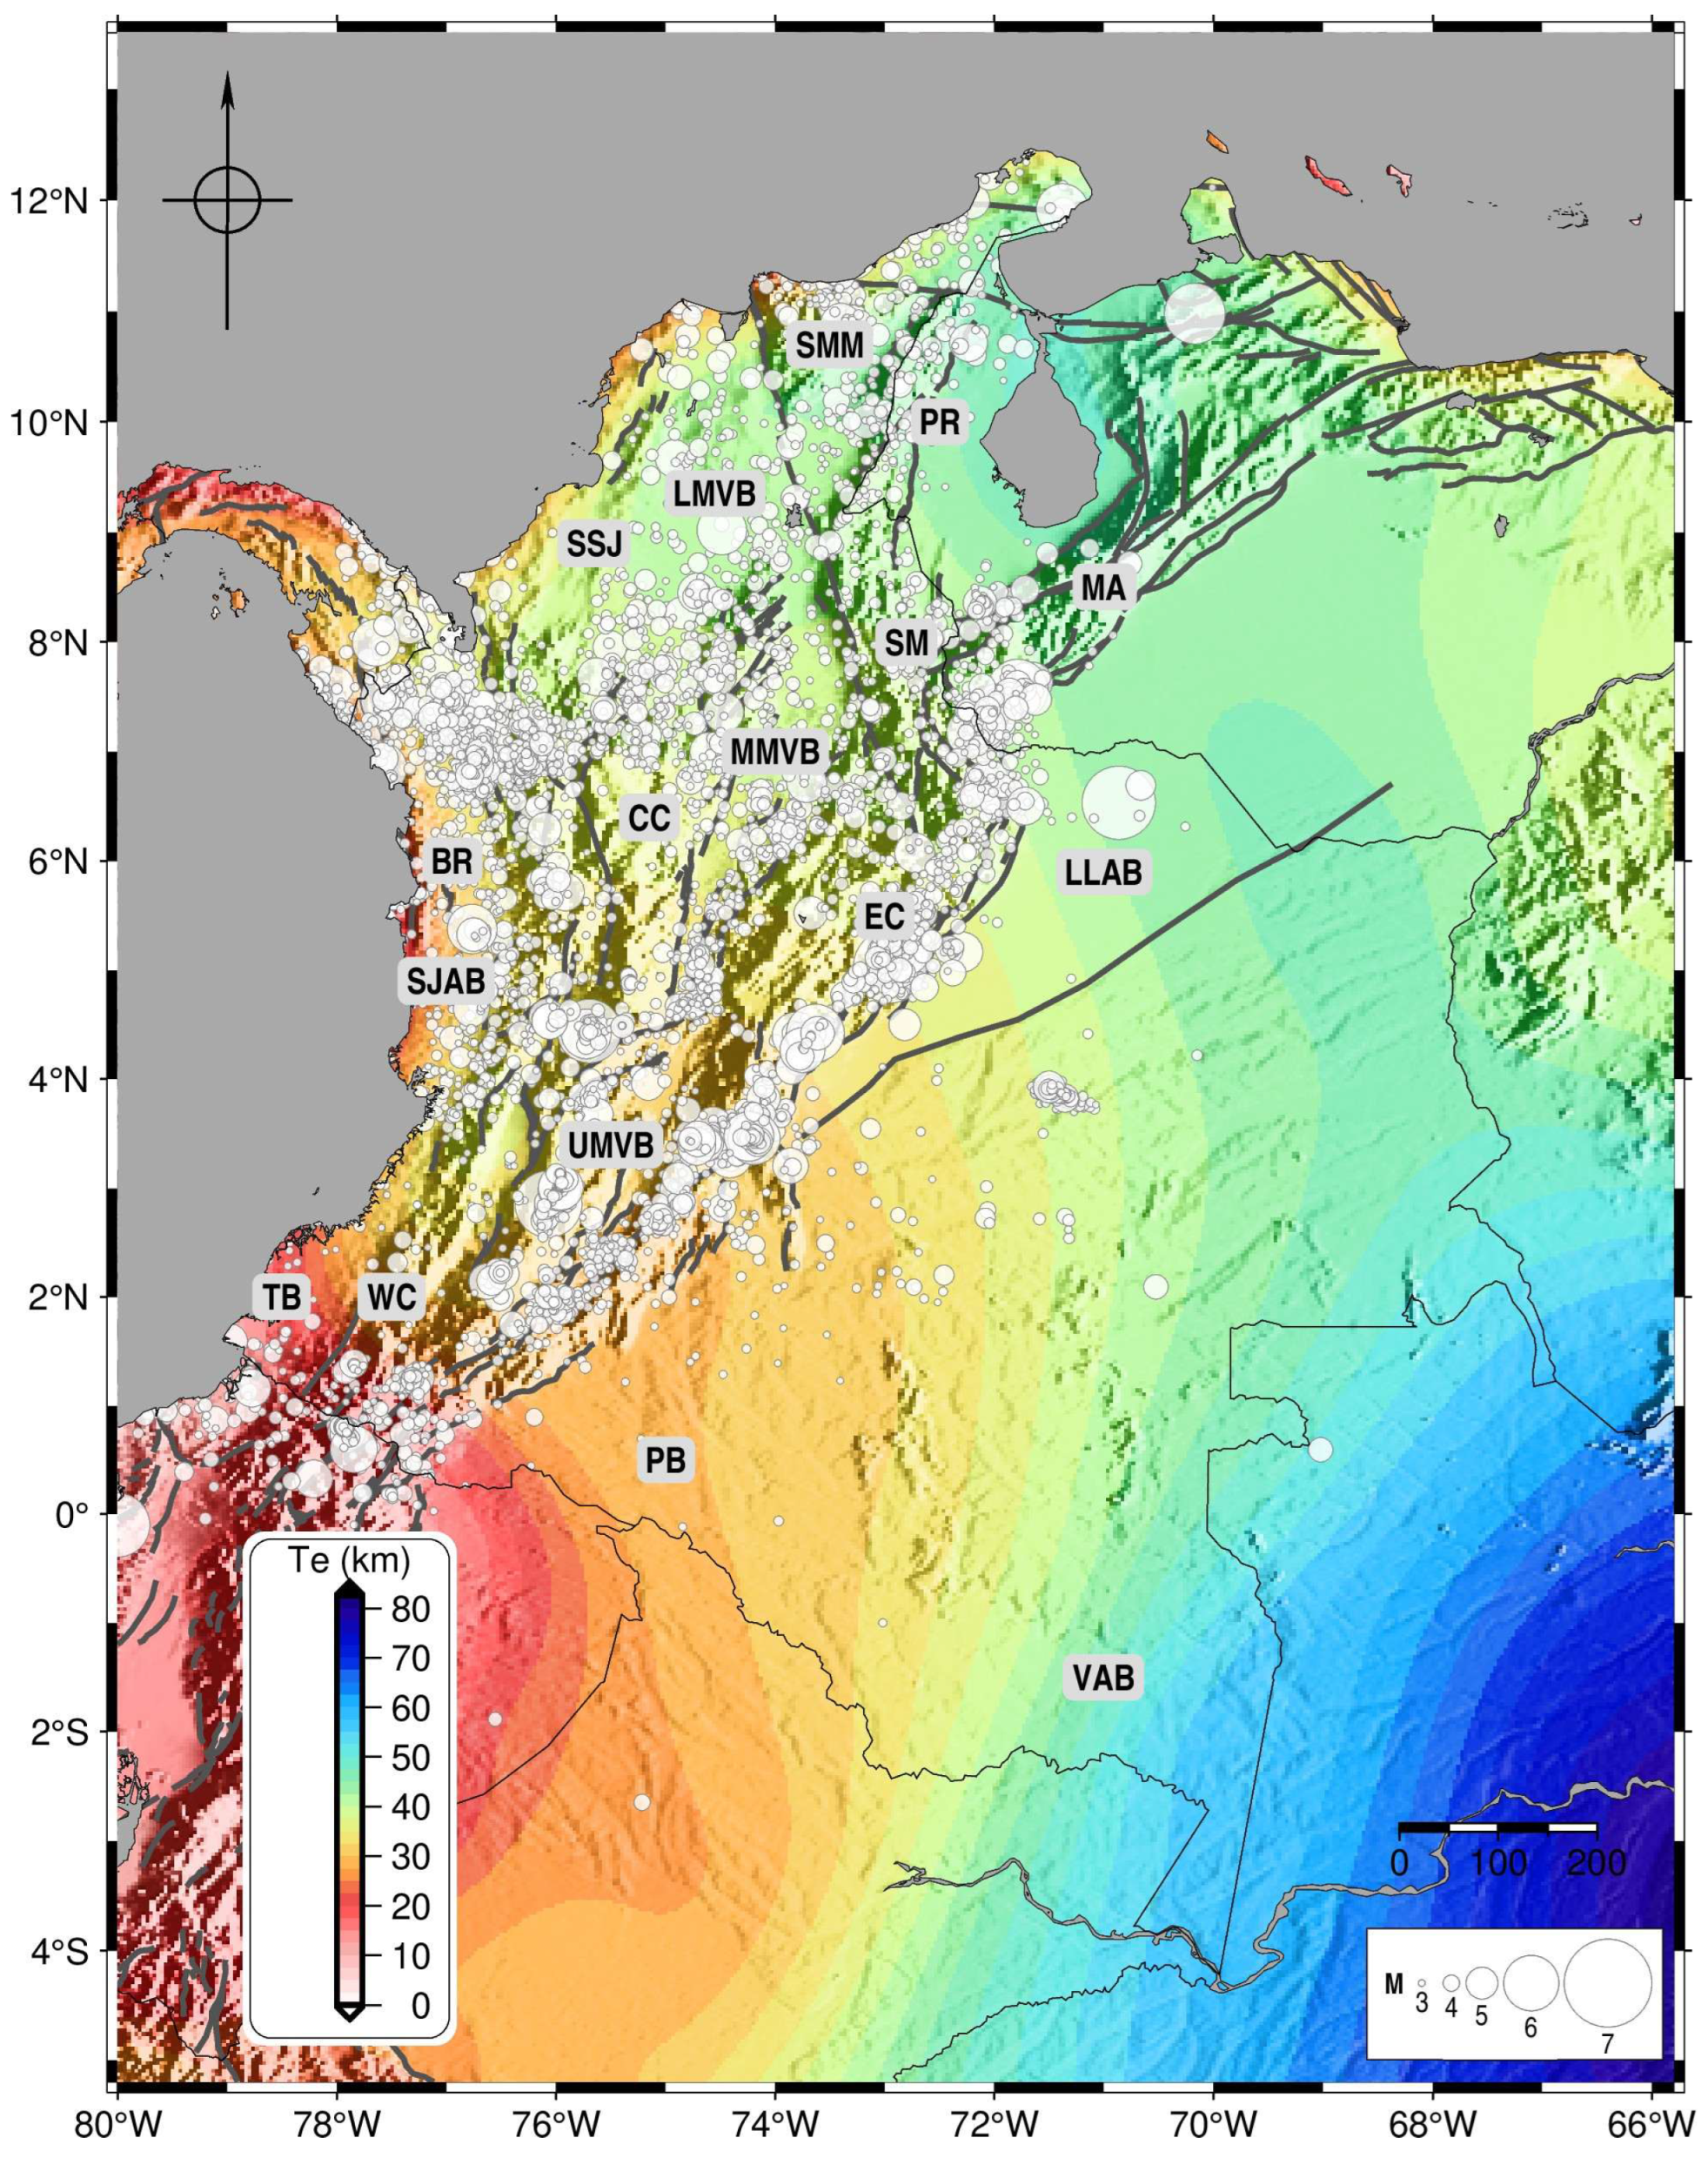
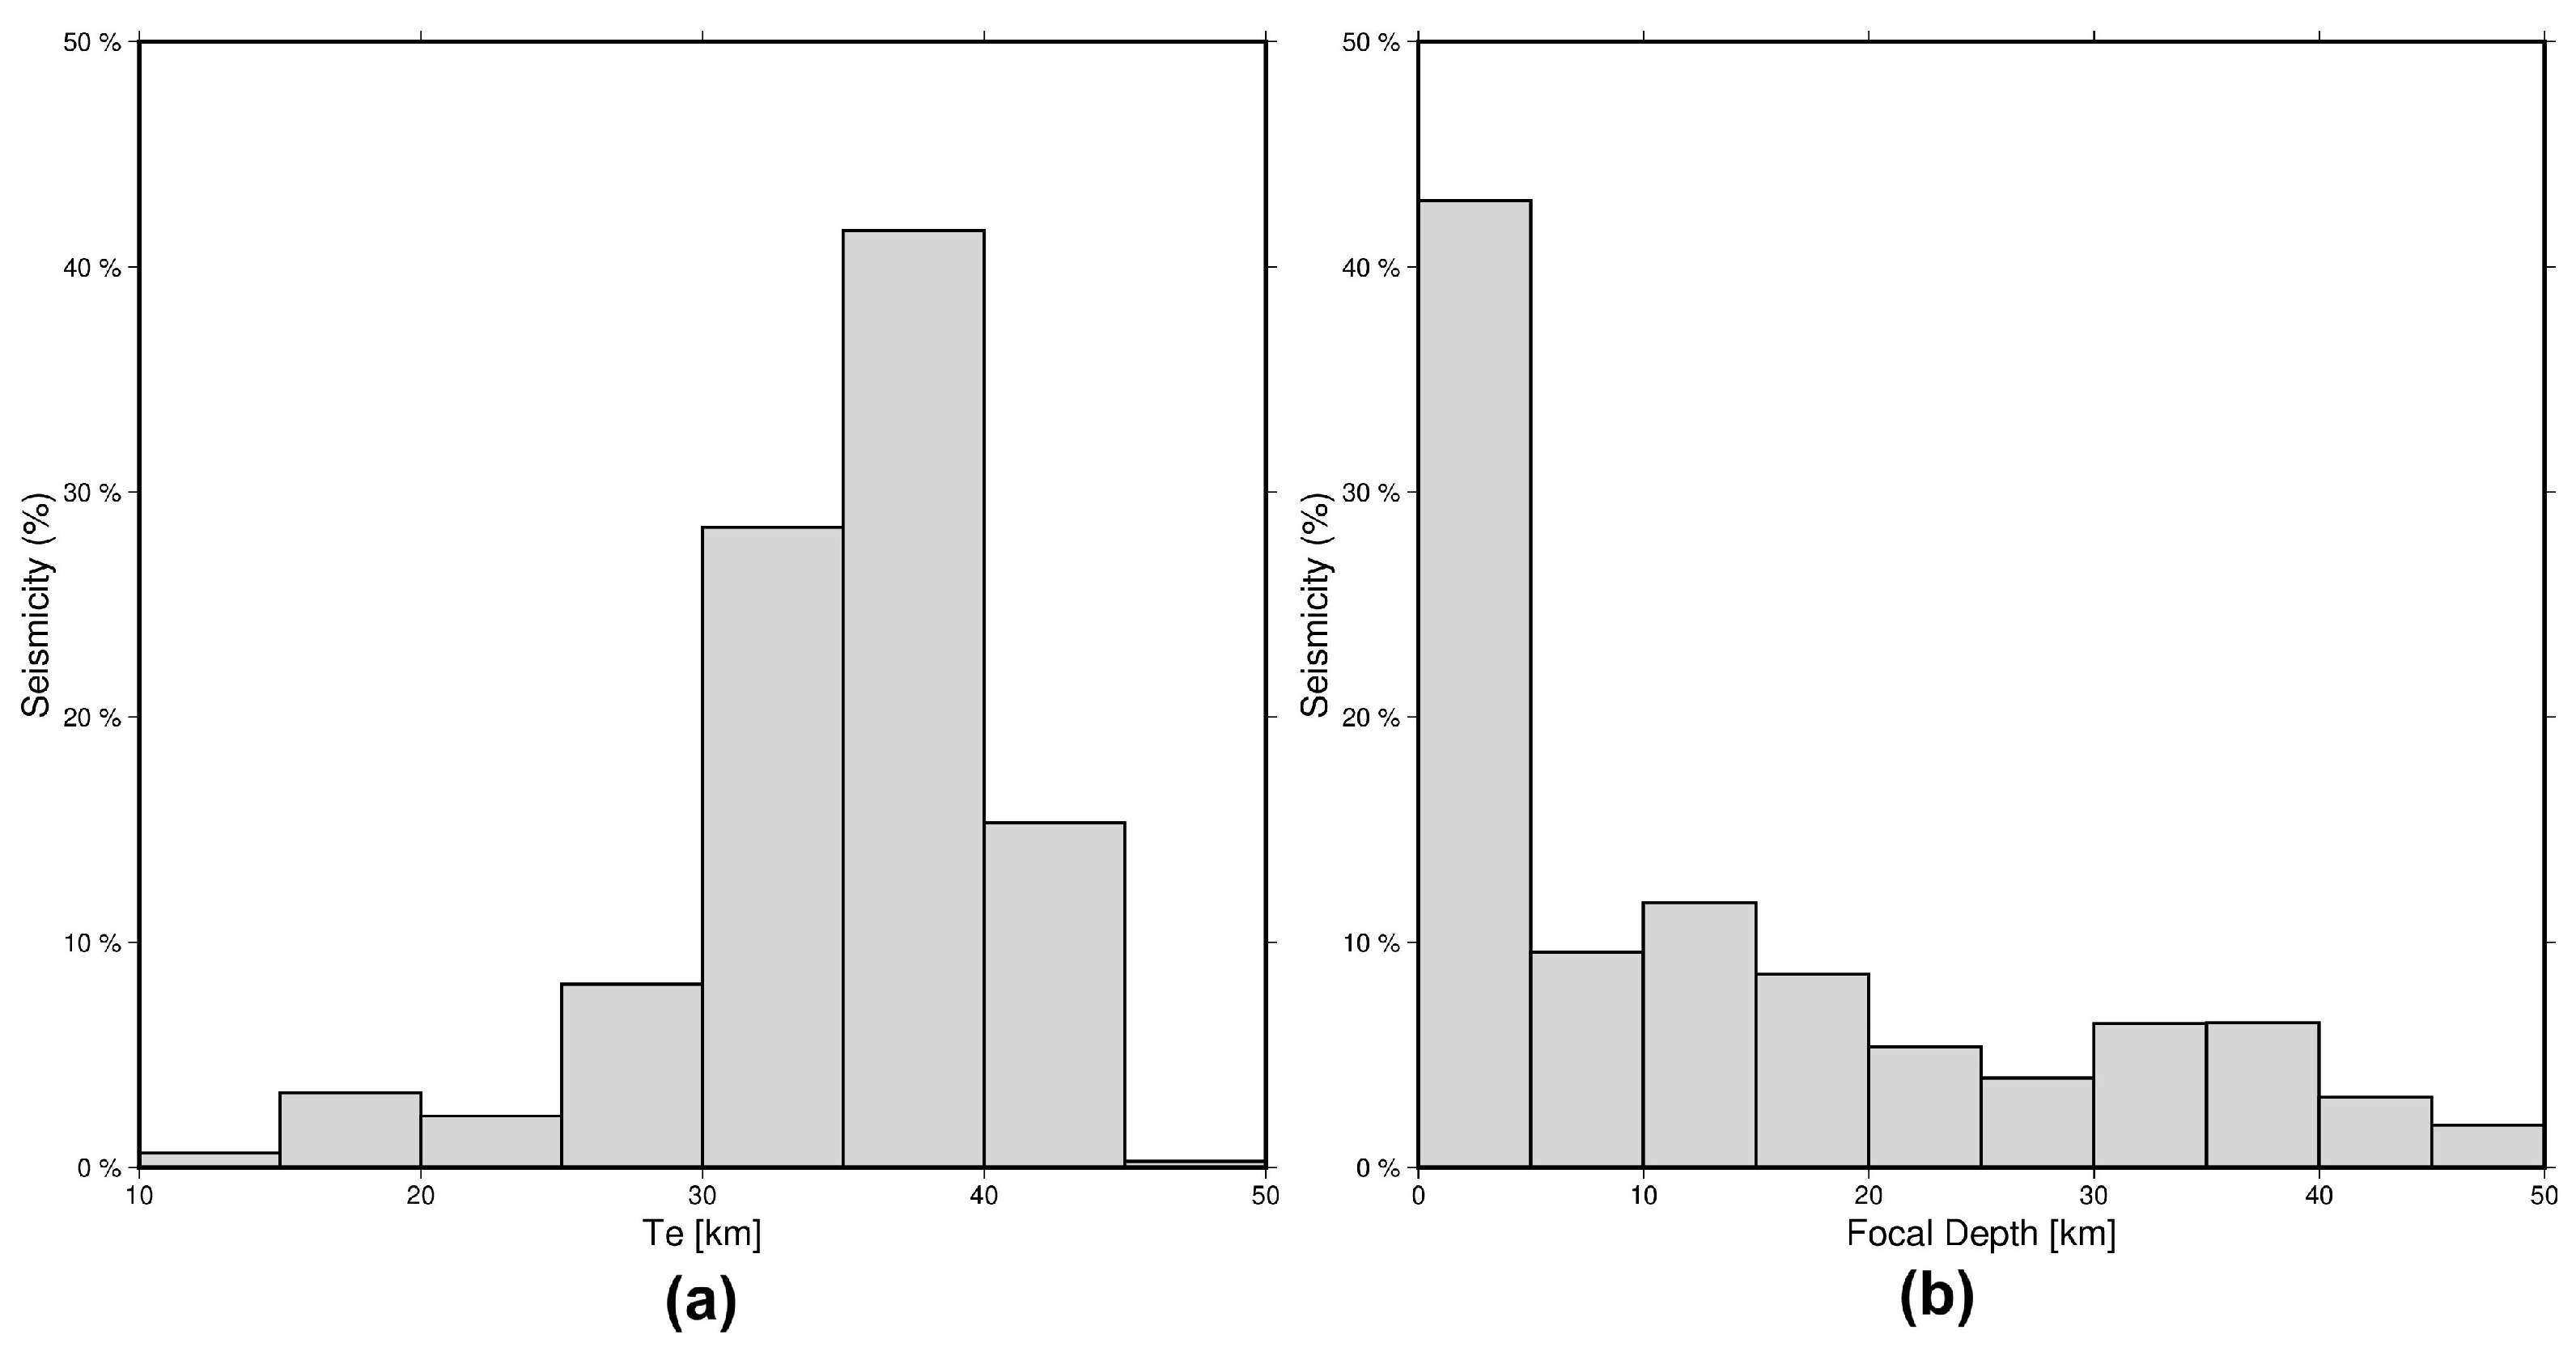
Figure 7 presents a comparison of the spatial variation of Te with the distribution of focal depths of shallow earthquakes in the continental lithosphere (≤50 km depth). The seismicity database is from the International Seismological Center Catalogue [92] for the period 1900–2023, and magnitudes between 3.0 and 7.3. We observe that seismic activity is predominantly concentrated in the Colombian Andes, with a limited number of earthquakes in the Amazonian Craton. A significant proportion of seismic activity (approximately 85%) is observed in regions where Te is less than 40 km (Figure 8a). The majority of earthquakes (approximately 70%) are generated at depths of 0–20 km (Figure 8b). These observations indicate the absence of a direct relationship between the Te values and focal depths of the earthquakes. Furthermore, seismic activity is located in areas with relatively intermediate Te values (30–40 km) (Figure 8a), contrasting with the findings of Pérez-Gussinyé et al. [70] that suggest that most seismic activity tends to occur in regions with low Te (less than 20 km). No particular relationship between Te and subsurface loading is observed, as indicated by Tassara et al. [2]. Additionally, no increase in seismic activity is detected in areas with large Te gradients, contrary to the study by Jiménez-Díaz et al. [19]. However, the results are consistent with the studies of Audet and Bürgmann [10] and Chen et al. [93], which state that most of the seismic activity is concentrated in regions where Te < 40 km, and with Tesauro et al. [85], which reported that crustal seismicity predominantly occurs in regions with topography exceeding 1000 m and Te < 30 km. Agurto-Detzel et al. [91] also investigated the relationship between Te and seismicity, revealing that in eastern South America, areas with lower elastic thickness, Te < 30 km, tend to have higher seismicity rates, whereas lower seismicity rates are associated with high Te values (Te > 100 km), which is in agreement with our findings in northern South America.
Whereas Te reflects the long-term integrated strength of the lithosphere, the seismogenic thickness (Ts) reflects the strength of the uppermost crust on historical time scales [94]. In general, Te does not correspond to a physical depth, but it is representative of the depth to the base of Mechanical Boundary layer, which can be defined by the depth to an isotherm of the brittle–ductile transition, or by the depth at which the yielding stress or its vertical gradient become less than a particular value [4]. Thus, the shallow, brittle, and seismogenic layer is enclosed in the elastic lithosphere (i.e., Ts < Te). Aligned with this, some investigations have indicated that Te is generally greater than Ts. In the continents, Ts ranging from 0 to 25 km, whereas the Te is in the range 0–80 km [6,7]. Although Ts has not been estimated for northern South America (it is beyond the scope of this study), it is noteworthy that most earthquakes in this region are confined to depths between 0 and 20 km, and the Te is predominantly constrained to values exceeding 30 km.

5. Conclusions

In this study, the lithospheric strength in northern South America is investigated. For this purpose, a joint inversion of coherence and admittance, based on topography and Bouguer gravity anomaly data, was conducted. In this region, the Te ranges from 15 to 60 km, displaying an increase in the west to east direction. The surface loading (F) is predominant in the region. The lowest Te value (15 km) is located at the North Ecuadorian-South Colombian border, whereas the highest Te value (60 km) is found in the southernmost tip of the Colombian territory. The Colombian Mountain range, as well as several basins, are characterized by intermediate Te values (20–40 km). Most of the seismic activity analyzed occurred in areas where the Te < 40 km. A correlation between Te and seismic velocity was identified. Furthermore, from the analysis of the large-scale Te pattern with heat flow and seismic velocities, it is found that tectonic stable regions are characterized by high Te and seismic velocities but low heat flows. In general, the spatial distribution of Te corresponds to the tectonic setting of northern South America.

Author Contributions

Conceptualization, I.F.C. and J.-C.H.; methodology, I.F.C. and J.-C.H.; software, I.F.C.; validation, I.F.C. and J.-C.H.; formal analysis, I.F.C.; investigation, I.F.C.; resources, J.-C.H.; data curation, I.F.C.; writing—original draft preparation, I.F.C.; writing—review and editing, I.F.C. and J.-C.H.; visualization, I.F.C.; supervision, J.-C.H.; project administration, J.-C.H.; funding acquisition, J.-C.H. All authors have read and agreed to the published version of the manuscript.

Funding

This research was supported by the National Science and Technology Council of Taiwan under Grant 112-2116-M-002-016.

Institutional Review Board Statement

Not applicable.

Informed Consent Statement

Not applicable.

Data Availability Statement

The WGM2012 gravity model [58] is available at https://bgi.obs-mip.fr/grids-and-models-2 (accessed on 25 June 2024). ETOPO1 [57] model is available at https://www.ncei.noaa.gov/products/etopo-global-relief-model (accessed on 25 June 2024). CRUST1.0 model [59] available at https://igppweb.ucsd.edu/~gabi/crust1.html (accessed on 25 June 2024). The elastic thickness estimations were performed using the open-source software PlateFlex v0.1.0 [95], available at https://github.com/paudetseis/PlateFlex (accessed on 9 July 2024).

Acknowledgments

The authors express sincerely thanks to the journal editors and anonymous reviewers for their comments that improved the manuscript. The figures were prepared by using Generic Mapping Tools software v 6.3 [96].

Conflicts of Interest

The authors declare no conflicts of interest.

References

  1. Burov, E.B.; Diament, M. The effective elastic thickness (Te) of continental lithosphere: What does it really mean? J. Geophys. Res. Solid Earth 1995, 100, 3905–3927. [Google Scholar] [CrossRef]
  2. Tassara, A.; Swain, C.; Hackney, R.; Kirby, J. Elastic thickness structure of South America estimated using wavelets and satellite-derived gravity data. Earth Planet. Sci. Lett. 2007, 253, 17–36. [Google Scholar] [CrossRef]
  3. Karato, S. Deformation of Earth Materials: An Introduction to the Rheology of Solid Earth; Cambridge University Press: Cambridge, UK, 2008. [Google Scholar] [CrossRef]
  4. Artemieva, I. The Lithosphere: An Interdisciplinary Approach; Cambridge University Press: Cambridge, UK, 2011. [Google Scholar] [CrossRef]
  5. Burov, E.B. Rheology and strength of the lithosphere. Mar. Pet. Geol. 2011, 28, 1402–1443. [Google Scholar] [CrossRef]
  6. Watts, A.B. Isostasy and Flexure of the Lithosphere|Solid Earth Geophysics, 1st ed.; Cambridge University Press: Cambridge, UK, 2001. [Google Scholar]
  7. Watts, A.B.; Burov, E.B. Lithospheric strength and its relationship to the elastic and seismogenic layer thickness. Earth Planet. Sci. Lett. 2003, 213, 113–131. [Google Scholar] [CrossRef]
  8. Audet, P.; Mareschal, J.-C. Wavelet analysis of the coherence between Bouguer gravity and topography: Application to the elastic thickness anisotropy in the Canadian Shield. Geophys. J. Int. 2007, 168, 287–298. [Google Scholar] [CrossRef]
  9. Lowry, A.R.; Smith, R.B. Strength and rheology of the western U.S. Cordillera. J. Geophys. Res. Solid Earth 1995, 100, 17947–17963. [Google Scholar] [CrossRef]
  10. Audet, P.; Bürgmann, R. Dominant role of tectonic inheritance in supercontinent cycles. Nat. Geosci. 2011, 4, 184–187. [Google Scholar] [CrossRef]
  11. Kirby, J. Spectral Methods for the Estimation of the Effective Elastic Thickness of the Lithosphere, Advances in Geophysical and Environmental Mechanics and Mathematics; Springer International Publishing: Cham, Switzerland, 2022. [Google Scholar] [CrossRef]
  12. Kirby, J.F. Estimation of the effective elastic thickness of the lithosphere using inverse spectral methods: The state of the art. Tectonophysics 2014, 631, 87–116. [Google Scholar] [CrossRef]
  13. Lewis, B.T.R.; Dorman, L.M. Experimental isostasy: 2. An isostatic model for the U.S.A. derived from gravity and topographic data. J. Geophys. Res. (1896-1977) 1970, 75, 3367–3386. [Google Scholar] [CrossRef]
  14. Banks, R.J.; Parker, R.L.; Huestis, S.P. Isostatic Compensation on a Continental Scale: Local Versus Regional Mechanisms. Geophys. J. Int. 1977, 51, 431–452. [Google Scholar] [CrossRef]
  15. Forsyth, D.W. Subsurface loading and estimates of the flexural rigidity of continental lithosphere. J. Geophys. Res. Solid Earth 1985, 90, 12623–12632. [Google Scholar] [CrossRef]
  16. McKenzie, D.; Fairhead, D. Estimates of the effective elastic thickness of the continental lithosphere from Bouguer and free air gravity anomalies. J. Geophys. Res. Solid Earth 1997, 102, 27523–27552. [Google Scholar] [CrossRef]
  17. McKenzie, D. Estimating Te in the presence of internal loads. J. Geophys. Res. Solid Earth 2003, 108, 1–21. [Google Scholar] [CrossRef]
  18. Pérez-Gussinyé, M.; Lowry, A.R.; Watts, A.B. Effective elastic thickness of South America and its implications for intracontinental deformation. Geochem. Geophys. Geosystems 2007, 8, 1–22. [Google Scholar] [CrossRef]
  19. Jiménez-Díaz, A.; Ruiz, J.; Pérez-Gussinyé, M.; Kirby, J.F.; Álvarez-Gómez, J.A.; Tejero, R.; Capote, R. Spatial variations of effective elastic thickness of the lithosphere in Central America and surrounding regions. Earth Planet. Sci. Lett. 2014, 391, 55–66. [Google Scholar] [CrossRef]
  20. Stewart, J.; Watts, A.B. Gravity anomalies and spatial variations of flexural rigidity at mountain ranges. J. Geophys. Res. Solid Earth 1997, 102, 5327–5352. [Google Scholar] [CrossRef]
  21. Galán, R.; Casallas, I. Determination of effective elastic thickness of the Colombian Andes using satellite-derived gravity data. Earth Sci. Res. J. 2010, 14, 7–16. [Google Scholar] [CrossRef]
  22. Ojeda, G.Y.; Whitman, D. Effect of windowing on lithosphere elastic thickness estimates obtained via the coherence method: Results from northern South America. J. Geophys. Res. Solid Earth 2002, 107, ETG 3-1–ETG 3-12. [Google Scholar] [CrossRef]
  23. Audet, P. Toward mapping the effective elastic thickness of planetary lithospheres from a spherical wavelet analysis of gravity and topography. Phys. Earth Planet. Inter. 2014, 226, 48–82. [Google Scholar] [CrossRef]
  24. Lu, Z.; Li, C.-F.; Zhu, S.; Audet, P. Effective elastic thickness over the Chinese mainland and surroundings estimated from a joint inversion of Bouguer admittance and coherence. Phys. Earth Planet. Inter. 2020, 301, 106456. [Google Scholar] [CrossRef]
  25. Mora-Páez, H.; Kellogg, J.N.; Freymueller, J.T.; Mencin, D.; Fernandes, R.M.S.; Diederix, H.; LaFemina, P.; Cardona-Piedrahita, L.; Lizarazo, S.; Peláez-Gaviria, J.-R.; et al. Crustal deformation in the northern Andes—A new GPS velocity field. J. S. Am. Earth Sci. 2019, 89, 76–91. [Google Scholar] [CrossRef]
  26. Cortés, M.; Angelier, J. Current states of stress in the northern Andes as indicated by focal mechanisms of earthquakes. Tectonophysics 2005, 403, 29–58. [Google Scholar] [CrossRef]
  27. Cortés, M.; Colletta, B.; Angelier, J. Structure and tectonics of the central segment of the Eastern Cordillera of Colombia. J. S. Am. Earth Sci. Tecton. Evol. Colomb. Andes 2006, 21, 437–465. [Google Scholar] [CrossRef]
  28. Restrepo, J.J.; Toussaint, J.F. Terranes and Continental Accretion in the Colombian Andes. Epis. J. Int. Geosci. 1988, 11, 189–193. [Google Scholar] [CrossRef]
  29. Redwood, S.D. The Geology of the Panama-Chocó Arc. In Geology and Tectonics of Northwestern South America: The Pacific-Caribbean-Andean Junction; Cediel, F., Shaw, R.P., Eds.; Springer International Publishing: Cham, Switzerland, 2019; pp. 901–932. [Google Scholar] [CrossRef]
  30. Taboada, A.; Rivera, L.A.; Fuenzalida, A.; Cisternas, A.; Philip, H.; Bijwaard, H.; Olaya, J.; Rivera, C. Geodynamics of the northern Andes: Subductions and intracontinental deformation (Colombia). Tectonics 2000, 19, 787–813. [Google Scholar] [CrossRef]
  31. Suter, F.; Sartori, M.; Neuwerth, R.; Gorin, G. Structural imprints at the front of the Chocó-Panamá indenter: Field data from the North Cauca Valley Basin, Central Colombia. Tectonophysics 2008, 460, 134–157. [Google Scholar] [CrossRef]
  32. Cortés, M.; Angelier, J.; Colletta, B. Paleostress evolution of the northern Andes (Eastern Cordillera of Colombia): Implications on plate kinematics of the South Caribbean region. Tectonics 2005, 24, TC1008. [Google Scholar] [CrossRef]
  33. Trenkamp, R.; Kellogg, J.N.; Freymueller, J.T.; Mora, H.P. Wide plate margin deformation, southern Central America and northwestern South America, CASA GPS observations. J. S. Am. Earth Sci. 2002, 15, 157–171. [Google Scholar] [CrossRef]
  34. Veloza, G.; Styron, R.; Taylor, M.; Mora, A. Open-source archive of active faults for northwest South America. GSAT 2012, 22, 4–10. [Google Scholar] [CrossRef]
  35. Pennington, W.D. Subduction of the Eastern Panama Basin and seismotectonics of northwestern South America. J. Geophys. Res. Solid Earth 1981, 86, 10753–10770. [Google Scholar] [CrossRef]
  36. Cediel, F.; Shaw, R.P.; Cáceres, C. Tectonic Assembly of the Northern Andean Block. In The Circum-Gulf of Mexico and the Caribbean: Hydrocarbon Habitats, Basin Formation and Plate Tectonics; Bartolini, C., Buffler, R.T., Blickwede, J.F., Eds.; American Association of Petroleum Geologists: Tulsa, OK, USA, 2003. [Google Scholar] [CrossRef]
  37. Backé, G.; Dhont, D.; Hervouët, Y. Spatial and temporal relationships between compression, strike-slip and extension in the Central Venezuelan Andes: Clues for Plio-Quaternary tectonic escape. Tectonophysics 2006, 425, 25–53. [Google Scholar] [CrossRef]
  38. Grösser, J.R. Geotectonic evolution of the Western Cordillera of Colombia: New aspects from geochemical data on volcanic rocks. J. S. Am. Earth Sci. 1989, 2, 359–369. [Google Scholar] [CrossRef]
  39. Gómez, J.; Núñez–Tello, A.; Mateus–Zabala, D.; Alcárcel–Gutiérrez, F.A.; Lasso–Muñoz, R.M.; Marín–Rincón, E.; Marroquín–Gómez, M.P. Physiographic and geological setting of the Colombian territory. In The Geology of Colombia, Volume 1 Proterozoic–Paleozoic; Gómez, J., Mateus–Zabala, D., Eds.; Publicaciones Geológicas Especiales 35; Servicio Geológico Colombiano: Bogotá, Colombia, 2020; pp. 1–16. [Google Scholar] [CrossRef]
  40. Cardona, A.; Valencia, V.A.; Bayona, G.; Duque, J.; Ducea, M.; Gehrels, G.; Jaramillo, C.; Montes, C.; Ojeda, G.; Ruiz, J. Early-subduction-related orogeny in the northern Andes: Turonian to Eocene magmatic and provenance record in the Santa Marta Massif and Rancheria Basin, northern Colombia. Terra Nova 2011, 23, 26–34. [Google Scholar] [CrossRef]
  41. Parra, M.; Echeverri, S.; Patiño, A.M.; Ramírez, J.C.; Mora, A.; Sobel, E.R.; Almendral, A.; Pardo–Trujillo, A. Cenozoic evolution of the Sierra Nevada de Santa Marta, Colombia. In The Geology of Colombia, Volume 3 Paleogene–Neogene; Gómez, J., Mateus–Zabala, D., Eds.; Publicaciones Geológicas Especiales 37; Servicio Geológico Colombiano: Bogotá, Colombia, 2020; pp. 185–213. [Google Scholar] [CrossRef]
  42. Montes, C.; Guzman, G.; Bayona, G.; Cardona, A.; Valencia, V.; Jaramillo, C. Clockwise rotation of the Santa Marta massif and simultaneous Paleogene to Neogene deformation of the Plato-San Jorge and Cesar-Ranchería basins. J. S. Am. Earth Sci. Sierra Nev. Santa Marta Adjac. Basins 2010, 29, 832–848. [Google Scholar] [CrossRef]
  43. Mantilla-Pimiento, A.M.; Jentzsch, G.; Kley, J.; Alfonso-Pava, C. Configuration of the Colombian Caribbean Margin: Constraints from 2D Seismic Reflection data and Potential Fields Interpretation. In Subduction Zone Geodynamics; Lallemand, S., Funiciello, F., Eds.; Springer: Berlin/Heidelberg, Germany, 2009; pp. 247–272. [Google Scholar] [CrossRef]
  44. Toto, E.A.; Kellogg, J.N. Structure of the Sinu-San Jacinto fold belt—An active accretionary prism in northern Colombia. J. S. Am. Earth Sci. 1992, 5, 211–222. [Google Scholar] [CrossRef]
  45. Duque-Caro, H. Major Structural Elements and Evolution of Northwestern Colombia. In Geological and Geophysical Investigations of Continental Margins; Watkins, J.S., Montadert, L., Dickerson, P.W., Eds.; American Association of Petroleum Geologists: Tulsa, OK, USA, 1979. [Google Scholar] [CrossRef]
  46. Mora-Bohórquez, J.A.; Ibánez-Mejia, M.; Oncken, O.; de Freitas, M.; Vélez, V.; Mesa, A.; Serna, L. Structure and age of the Lower Magdalena Valley basin basement, northern Colombia: New reflection-seismic and U-Pb-Hf insights into the termination of the central andes against the Caribbean basin. J. S. Am. Earth Sci. 2017, 74, 1–26. [Google Scholar] [CrossRef]
  47. Mora–Bohórquez, J.A.; Oncken, O.; Le Breton, E.; Ibañez–Mejia, M.; Veloza, G.; Mora, A.; Vélez, V.; De Freitas, M. Formation and evolution of the Lower Magdalena Valley Basin and San Jacinto fold belt of northwestern Colombia: Insights from Upper Cretaceous to recent tectono–stratigraphy. In The Geology of Colombia, Volume 3 Paleogene–Neogene; Gómez, J., Mateus–Zabala, D., Eds.; Publicaciones Geológicas Especiales 37; Servicio Geológico Colombiano: Bogotá, Colombia, 2020; pp. 21–66. [Google Scholar] [CrossRef]
  48. Bernal-Olaya, R.; Mann, P.; Vargas, C.A. Earthquake, Tomographic, Seismic Reflection, and Gravity Evidence for a Shallowly Dipping Subduction Zone beneath the Caribbean Margin of Northwestern Colombia. In Petroleum Geology and Potential of the Colombian Caribbean Margin; Bartolini, C., Mann, P., Eds.; American Association of Petroleum Geologists: Tulsa, OK, USA, 2015. [Google Scholar] [CrossRef]
  49. de Almeida, F.F.M.; Hasui, Y.; de Brito Neves, B.B.; Fuck, R.A. Brazilian structural provinces: An introduction. Earth-Sci. Rev. 1981, 17, 1–29. [Google Scholar] [CrossRef]
  50. Tassinari, C.C.G.; Macambira, M.J.B. Geochronological provinces of the Amazonian Craton. Epis. J. Int. Geosci. 1999, 22, 174–182. [Google Scholar] [CrossRef]
  51. Moyano-Nieto, I.E.; Prieto, G.A.; Ibañez-Mejia, M. Tectonic domains in the NW Amazonian Craton from geophysical and geological data. Precambrian Res. 2022, 377, 106735. [Google Scholar] [CrossRef]
  52. Ibañez–Mejia, M.; Cordani, U.G. Zircon U–Pb geochronology and Hf–Nd–O isotope geochemistry of the Paleo– to Mesoproterozoic basement in the westernmost Guiana Shield. In The Geology of Colombia, Volume 1 Proterozoic–Paleozoic; Gómez, J., Mateus–Zabala, D., Eds.; Publicaciones Geológicas Especiales 35; Servicio Geológico Colombiano: Bogotá, Colombia, 2020; pp. 65–90. [Google Scholar] [CrossRef]
  53. Kirby, J.F. Which wavelet best reproduces the Fourier power spectrum? Comput. Geosci. 2005, 31, 846–864. [Google Scholar] [CrossRef]
  54. Kirby, J.F.; Swain, C.J. Improving the spatial resolution of effective elastic thickness estimation with the fan wavelet transform. Comput. Geosci. 2011, 37, 1345–1354. [Google Scholar] [CrossRef]
  55. Kirby, J.F.; Swain, C.J. An accuracy assessment of the fan wavelet coherence method for elastic thickness estimation. Geochem. Geophys. Geosyst. 2008, 9, 1–27. [Google Scholar] [CrossRef]
  56. Kirby, J.F.; Swain, C.J. A reassessment of spectral T estimation in continental interiors: The case of North America. J. Geophys. Res. Solid Earth 2009, 114, 1–36. [Google Scholar] [CrossRef]
  57. Amante, C.; Eakins, B.W. ETOPO1 1 Arc-Minute Global Relief Model: Procedures, Data Sources and Analysis; NOAA Technical Memorandum NESDIS NGDC-24; NOAA National Centers for Environmental Information: Asheville, NC, USA, 2009; 19p. [Google Scholar]
  58. Bonvalot, S.; Briais, A.; Kuhn, M.; Peyrefitte, A.; Vales, N.; Biancale, R.; Gabalda, G.; Moreaux, G.; Reinquin, F.; Sarrailh, M. Global Grids: World Gravity Map (WGM2012); Bureau Gravimetrique International: Toulouse, France, 2012. [Google Scholar] [CrossRef]
  59. Laske, G.; Masters, G.; Ma, Z.; Pasyanos, M. Update on CRUST1.0—A 1-degree Global Model of Earth’s Crust. Geophys. Res. Abstr. 2013, 15, 2658. [Google Scholar]
  60. Poveda, E.; Monsalve, G.; Vargas, C.A. Receiver functions and crustal structure of the northwestern Andean region, Colombia. J. Geophys. Res. Solid Earth 2015, 120, 2408–2425. [Google Scholar] [CrossRef]
  61. Poveda, E.; Julià, J.; Schimmel, M.; Perez-Garcia, N. Upper and Middle Crustal Velocity Structure of the Colombian Andes from Ambient Noise Tomography: Investigating Subduction-Related Magmatism in the Overriding Plate. J. Geophys. Res. Solid Earth 2018, 123, 1459–1485. [Google Scholar] [CrossRef]
  62. Quiroga, D.E.; Currie, C.A.; Pearse, J. Lithosphere Removal in the Sierra Nevada de Santa Marta, Colombia. J. Geophys. Res. Solid Earth 2024, 129, e2023JB027646. [Google Scholar] [CrossRef]
  63. Monsalve–Bustamante, M.L. The volcanic front in Colombia: Segmentation and recent and historical activity. In The Geology of Colombia, Volume 4 Quaternary; Gómez, J., Pinilla–Pachon, A.O., Eds.; Publicaciones Geológicas Especiales 38; Servicio Geológico Colombiano: Bogotá, Colombia, 2020; pp. 97–159. [Google Scholar] [CrossRef]
  64. Koch, C.D.; Delph, J.; Beck, S.L.; Lynner, C.; Ruiz, M.; Hernandez, S.; Samaniego, P.; Meltzer, A.; Mothes, P.; Hidalgo, S. Crustal thickness and magma storage beneath the Ecuadorian arc. J. S. Am. Earth Sci. 2021, 110, 103331. [Google Scholar] [CrossRef]
  65. Ebmeier, S.K.; Elliott, J.R.; Nocquet, J.-M.; Biggs, J.; Mothes, P.; Jarrín, P.; Yépez, M.; Aguaiza, S.; Lundgren, P.; Samsonov, S.V. Shallow earthquake inhibits unrest near Chiles–Cerro Negro volcanoes, Ecuador–Colombian border. Earth Planet. Sci. Lett. 2016, 450, 283–291. [Google Scholar] [CrossRef]
  66. Bloch, E.; Ibañez-Mejia, M.; Murray, K.; Vervoort, J.; Müntener, O. Recent crustal foundering in the Northern Volcanic Zone of the Andean arc: Petrological insights from the roots of a modern subduction zone. Earth Planet. Sci. Lett. 2017, 476, 47–58. [Google Scholar] [CrossRef]
  67. Rodríguez, E.E.; Beck, S.L.; Meltzer, A.; Segovia, M.; Ruíz, M.; Hernández, S.; Roecker, S.; Lynner, C.; Koch, C.; Hoskins, M.C.; et al. Seismic imaging of the Ecuadorian forearc and arc from joint ambient noise, local, and teleseismic tomography: Catching the Nazca slab in the act of flattening. Geophys. J. Int. 2025, 241, 1552–1571. [Google Scholar] [CrossRef]
  68. Vargas, C.A.; Pujades, L.G.; Montes, L. Seismic structure of South-Central Andes of Colombia by tomographic inversion. Geofísica Int. 2007, 46, 117–127. [Google Scholar] [CrossRef]
  69. Marín-Cerón, M.I.; Leal-Mejía, H.; Bernet, M.; Mesa-García, J. Late Cenozoic to Modern-Day Volcanism in the Northern Andes: A Geochronological, Petrographical, and Geochemical Review. In Geology and Tectonics of Northwestern South America: The Pacific-Caribbean-Andean Junction; Cediel, F., Shaw, R.P., Eds.; Springer International Publishing: Cham, Switzerland, 2019; pp. 603–648. [Google Scholar] [CrossRef]
  70. Pérez-Gussinyé, M.; Lowry, A.R.; Phipps Morgan, J.; Tassara, A. Effective elastic thickness variations along the Andean margin and their relationship to subduction geometry. Geochem. Geophys. Geosystems 2008, 2, 1–21. [Google Scholar] [CrossRef]
  71. Mojica Boada, M.J.; Poveda, E.; Tary, J.B. Lithospheric and Slab Configurations from Receiver Function Imaging in Northwestern South America, Colombia. J. Geophys. Res. Solid Earth 2022, 127, e2022JB024475. [Google Scholar] [CrossRef]
  72. Avellaneda-Jiménez, D.S.; Monsalve, G.; León, S.; Gómez-García, A.M. Insights into Moho depth beneath the northwestern Andean region from gravity data inversion. Geophys. J. Int. 2022, 229, 1964–1977. [Google Scholar] [CrossRef]
  73. Montes, C.; Hatcher, R.D.; Restrepo-Pace, P.A. Tectonic reconstruction of the northern Andean blocks: Oblique convergence and rotations derived from the kinematics of the Piedras–Girardot area, Colombia. Tectonophysics 2005, 399, 221–250. [Google Scholar] [CrossRef]
  74. Nie, J.; Horton, B.K.; Saylor, J.E.; Mora, A.; Mange, M.; Garzione, C.N.; Basu, A.; Moreno, C.J.; Caballero, V.; Parra, M. Integrated provenance analysis of a convergent retroarc foreland system: U–Pb ages, heavy minerals, Nd isotopes, and sandstone compositions of the Middle Magdalena Valley basin, northern Andes, Colombia. Earth-Sci. Rev. 2012, 110, 111–126. [Google Scholar] [CrossRef]
  75. Pachón-Parra, L.F.; Mann, P.; Cardozo, N. Regional subsurface mapping and 3D flexural modeling of the obliquely converging Putumayo foreland basin, southern Colombia. Interpretation 2020, 8, ST15–ST48. [Google Scholar] [CrossRef]
  76. Kroonenberg, S.B.; Reeves, C.V. Geology and petroleum potential, Vaupés-Amazonas Basins, Colombia. In Petroleum Geology of Colombia; Cediel, F., Ed.; Universidad EAFIT, Medellín, Colombia, 2011; 92p.
  77. Feng, M.; van der Lee, S.; Assumpção, M. Upper mantle structure of South America from joint inversion of waveforms and fundamental mode group velocities of Rayleigh waves. J. Geophys. Res. Solid Earth 2007, 112, 1–16. [Google Scholar] [CrossRef]
  78. Chagas de Melo, B.; Lebedev, S.; Celli, N.L.; Gibson, S.; de Laat, J.I.; Assumpção, M. The lithosphere of South America from seismic tomography: Structure, evolution, and control on tectonics and magmatism. Gondwana Res. 2025, 138, 139–167. [Google Scholar] [CrossRef]
  79. Rockwell, T.K.; Bennett, R.A.; Gath, E.; Franceschi, P. Unhinging an indenter: A new tectonic model for the internal deformation of Panama. Tectonics 2010, 29, 1–10. [Google Scholar] [CrossRef]
  80. Mantovani, M.S.M.; de Freitas, S.R.C.; Shukowsky, W. Tidal gravity anomalies as a tool to measure rheological properties of the continental lithosphere: Application to the South American Plate. J. S. Am. Earth Sci. 2001, 14, 1–14. [Google Scholar] [CrossRef]
  81. Mantovani, M.S.M.; Shukowsky, W.; de Freitas, S.R.C.; Brito Neves, B.B. Lithosphere mechanical behavior inferred from tidal gravity anomalies: A comparison of Africa and South America. Earth Planet. Sci. Lett. 2005, 230, 397–412. [Google Scholar] [CrossRef]
  82. Cerón, J.F.; Kellogg, J.N.; Ojeda, G.Y. Basement configuration of the northwestern South America-Caribbean margin from recent geophysical data. CT&F-Cienc. Tecnol. Futuro 2007, 3, 25–49. [Google Scholar] [CrossRef]
  83. Londono, J.; Lorenzo, J.M.; Ramirez, V. Lithospheric Flexure and Related Base-Level Stratigraphic Cycles in Continental Foreland Basins: An Example from the Putumayo Basin, Northern Andes. In Tectonics and Sedimentation: Implications for Petroleum Systems; Gao, D., Ed.; American Association of Petroleum Geologists: Tulsa, OK, USA, 2013. [Google Scholar] [CrossRef]
  84. Lu, Z.; Audet, P.; Li, J.; Zhang, T.; Li, C.-F. Strength of continental lithosphere governed by the time since the last orogeny. Earth Planet. Sci. Lett. 2024, 643, 118894. [Google Scholar] [CrossRef]
  85. Tesauro, M.; Kaban, M.K.; Cloetingh, S.A.P.L. Global strength and elastic thickness of the lithosphere. Glob. Planet. Change 2012, 90–91, 51–57. [Google Scholar] [CrossRef]
  86. Mareschal, J.C.; Jaupart, C.; Rolandone, F.; Gariépy, C.; Fowler, C.M.R.; Bienfait, G.; Carbonne, C.; Lapointe, R. Heat flow, thermal regime, and elastic thickness of the lithosphere in the Trans-Hudson Orogen. Can. J. Earth Sci. 2005, 42, 517–532. [Google Scholar] [CrossRef]
  87. Zamani, A.; Samiee, J.; Kirby, J.F. The effective elastic thickness of the lithosphere in the collision zone between Arabia and Eurasia in Iran. J. Geodyn. 2014, 81, 30–40. [Google Scholar] [CrossRef]
  88. Lucazeau, F. Analysis and Mapping of an Updated Terrestrial Heat Flow Data Set. Geochem. Geophys. Geosystems 2019, 20, 4001–4024. [Google Scholar] [CrossRef]
  89. Debayle, E.; Dubuffet, F.; Durand, S. An automatically updated S-wave model of the upper mantle and the depth extent of azimuthal anisotropy. Geophys. Res. Lett. 2016, 43, 674–682. [Google Scholar] [CrossRef]
  90. Maggi, A.; Jackson, J.A.; McKenzie, D.; Priestley, K. Earthquake focal depths, effective elastic thickness, and the strength of the continental lithosphere. Geology 2000, 28, 495–498. [Google Scholar] [CrossRef]
  91. Agurto-Detzel, H.; Assumpção, M.; Bianchi, M.; Pirchiner, M. Intraplate seismicity in mid-plate South America: Correlations with geophysical lithospheric parameters. Geol. Soc. Lond. Spec. Publ. 2017, 432, 73–90. [Google Scholar] [CrossRef]
  92. International Seismological Centre. ISC-GEM Earthquake Catalogue. 2023. Available online: https://www.isc.ac.uk/iscgem/download.php. (accessed on 25 January 2025).
  93. Chen, B.; Chen, C.; Kaban, M.K.; Du, J.; Liang, Q.; Thomas, M. Variations of the effective elastic thickness over China and surroundings and their relation to the lithosphere dynamics. Earth Planet. Sci. Lett. 2013, 363, 61–72. [Google Scholar] [CrossRef]
  94. Burov, E.B.; Watts, A.B. The long-term strength of continental lithosphere: “Jelly sandwich” or “crème brûlée”? GSA Today 2006, 16, 4–10. [Google Scholar] [CrossRef]
  95. Audet, P. PlateFlex: Software for Mapping the Elastic Thickness of the Lithosphere. 2019. Available online: https://zenodo.org/records/3576803 (accessed on 9 July 2024).
  96. Wessel, P.; Luis, J.F.; Uieda, L.; Scharroo, R.; Wobbe, F.; Smith, W.H.F.; Tian, D. The Generic Mapping Tools Version 6. Geochem. Geophys. Geosystems 2019, 20, 5556–5564. [Google Scholar] [CrossRef]
Figure 2. Bouguer gravity anomaly over northern South America. Data from WGM2012 global gravity model [58]. The annotations are the same as in Figure 1.
Applsci 15 05163 g002
Figure 3. Crustal structure over northern South America. (a) Crustal thickness. (b) Density crustal. Data from CRUST1.0 [59]. The annotations are the same as in Figure 1.
Applsci 15 05163 g003
Figure 4. Results obtained from the joint inversion of real Bouguer admittance and coherence over northern South America. (a) Effective elastic thickness (Te). (b) Load ratio F. The annotations are the same as in Figure 1.
Applsci 15 05163 g004
Figure 5. Errors obtained from the joint inversion of real Bouguer admittance and coherence over northern South America. (a) Effective elastic thickness (Te). (b) Load ratio F. The annotations are the same as in Figure 1.
Applsci 15 05163 g005
Figure 6. (a) Heat flow map [88] and (b) shear wave velocity anomaly (at 100 km depth) [89] map for northern South America. The annotations are the same as in Figure 1.
Applsci 15 05163 g006
Figure 7. Distribution of the shallow seismicity (≤50 km depth) and Te for northern South America. Seismicity from International Seismological Center Catalogue [92] for the period 1900–2023. The annotations are the same as in Figure 1.
Applsci 15 05163 g007
Figure 8. (a) Histogram showing seismicity versus Te in northern South America. (b) Histogram showing seismicity versus focal depths, for the same region. Seismicity from International Seismological Center Catalogue [92] for the period 1900–2023.
Applsci 15 05163 g008
Disclaimer/Publisher’s Note: The statements, opinions and data contained in all publications are solely those of the individual author(s) and contributor(s) and not of MDPI and/or the editor(s). MDPI and/or the editor(s) disclaim responsibility for any injury to people or property resulting from any ideas, methods, instructions or products referred to in the content.