Article

Integrated SOM Multi-Attribute Optimization and Seismic Waveform Inversion for Thin Sand Body Characterization: A Case Study of the Paleogene Lower E3d2 Sub-Member in the HHK Depression, Bohai Bay Basin

by
Jing Wang
1,
Dayong Guan
2,
Xiaobo Huang
2,
Youbin He
1,*,
Hua Li
1,
Wei Xu
2,
Rui Liu
2 and
Bin Feng
1
1
School of Geosciences, Yangtze University, Wuhan 430100, China
2
CNOOC China Limited Tianjin Branch, Tianjin 300450, China
*
Author to whom correspondence should be addressed.
Appl. Sci. 2025, 15(9), 5134; https://doi.org/10.3390/app15095134
Submission received: 19 March 2025 / Revised: 21 April 2025 / Accepted: 28 April 2025 / Published: 5 May 2025

Abstract

:
Thin-bedded beach-bar reservoirs in the continental faulted basins of eastern China hold significant potential, yet pose challenges for unconventional hydrocarbon development due to their thin-layer characteristics and heterogeneity. This study focuses on the Paleogene Lower E3d2 Sub-member in the HHK Depression, Bohai Bay Basin as a case study. We propose an innovative technical framework integrating Self-Organizing Map (SOM) multi-attribute optimization with seismic waveform inversion. Petrophysical analysis demonstrates that waveform-indicated inversion can detect 1.8–3.0 m thin sandstones, achieving a 90.2% mean match rate (95% CI: 87.5–92.7%, n = 12; bootstrap resampling) for training wells and 81.5% (95% CI: 76.8–85.3%, n = 11) for validation wells. By integrating SOM seismic attribute clustering with seismic waveform inversion, we were able to delineate microfacies boundaries with precision, enhancing the visibility of beach-bar sand body distributions. This methodology establishes a new paradigm for thin-bed sandstone prediction in low-well-control areas, providing critical support for geological interpretation and resource evaluation in complex depositional systems.

1. Introduction

As the exploration of structural hydrocarbon reservoirs in continental basins becomes increasingly challenging and the issue of reserve succession grows more severe, the focus of oil and gas exploration in these basins has gradually shifted and expanded from structural traps to lithostratigraphic traps, from shallow targets to deep exploration objectives, and from conventional to unconventional domains [1,2]. Among these, thin-bedded beach-bar sand bodies have emerged as a key focus for research and exploration in lithologic and unconventional hydrocarbon reservoirs. To date, numerous clastic beach-bar deposits have been identified in China’s continental basins, with significant breakthroughs in hydrocarbon exploration [3,4]. Thin-bedded sand bodies are significant types of sedimentary deposits found in the gentle slope zones of continental rift lake basins. They are characterized by their thin thickness, extensive lateral distribution, diverse sedimentary origins, complex diagenetic features, and unpredictable development patterns. The exploration of unconventional oil and gas resources in China has now entered a meticulous phase, with massive petroleum reserves residing within these thin-bedded sand bodies (defined as having a thickness of less than 10 m) located in subsurface strata [5,6]. The Bohai Bay Basin, a typical continental sedimentary basin in China, serves as a crucial area for unconventional hydrocarbon exploration [7,8]. Focusing on the Paleogene system in the HHK Depression of this basin, this study discusses the fine characterization of the boundaries of thin-bedded beach-bar sand bodies, which hold important implications for expanding exploration frontiers in unconventional hydrocarbon reservoirs within continental basins [9,10].
Currently, identifying thin-bedded sand bodies using conventional geological theories and methods poses considerable challenges. However, through comprehensive seismic sedimentology analysis [11], it is possible to study the lithological characteristics of the sedimentary rocks, identify thin-bedded sand bodies, and determine their sedimentary types and evolutionary processes [12,13], thereby providing new pathways for the exploration and development of deep unconventional oil and gas resources.
The fine characterization of thin-bedded sand body boundaries has become a focal point and a challenge in both oil and gas geological research and applied geophysics. With advancements and the widespread adoption of horizontal well technology and drilling fracturing techniques [14], the previously overlooked thin beds and interbedded reservoirs are garnering increasing attention from the oil and gas exploration and development community.
From the perspective of seismic exploration principles, thin sand layers are considered to be strata that strictly fall within the defined tuning thickness. Conventional seismic interpretation methods are insufficient for exploring these thin strata. To effectively predict such layers, it is essential to acquire wideband impedance signals during the inversion process. Furthermore, seismic attribute analysis has emerged as a reliable and efficient technique for interpreting seismic data, particularly in the context of thin-bedded sand body predictions, consistently yielding favorable results [15,16,17].
Traditional inversion methods acquire high-frequency components through two primary approaches. The first method utilizes deterministic interpolation models, typically employing techniques such as inverse distance weighting, natural neighbor interpolation, and Kriging [18,19,20]. While these models produce deterministic interwell interpolation results, they are inherently constrained by their model assumptions, resulting in low confidence levels [21,22]. Consequently, their application is primarily limited to reservoirs demonstrating stable lateral continuity and significant stratigraphic thickness. The alternative approach employs stochastic simulation, wherein variogram analysis quantifies spatial variability to guide optimal correlated sample selection for interwell reservoir parameter estimation, generating probabilistic outputs [23]. While this technique enhances vertical resolution, it inherently compromises lateral resolution and introduces significant stochasticity [24,25,26]. Additionally, the methodology requires evenly distributed sampling points to ensure statistical validity.
A critical limitation inherent in both seismic inversion methodologies lies in their over-reliance on well-derived data for high-frequency component estimation, while inadequately exploiting seismic information through integrated interpretation. Although seismic data’s narrow effective bandwidth inherently prevents direct high-frequency signal acquisition, its lateral amplitude variations systematically encode depositional environment evolution. Congenetic depositional systems manifest analogous stratigraphic architectures whose spatial transitions exhibit intrinsic correlations with waveform morphologies [27,28]. This causal relationship enables high-frequency component estimation through the systematic analysis of seismic waveform lateral variability.
Attribute fusion technology enables enhanced extraction of latent information within datasets, significantly improving the reliability of complex reservoir characterization. This methodology bifurcates into two fundamental paradigms: (1) algorithmic synthesis through mathematical transformations including composite attribute generation, principal component analysis (PCA), multivariate linear regression [29,30], and cluster analysis; (2) visual transformation techniques employing chroma-luminance binarization or RGB trichromacy to decode reservoir heterogeneity through enhanced data visualization [31,32]. The mathematical fusion approach, alternatively conceptualized as attribute optimization, frequently incorporates a priori well-derived constraints. In contrast, image-based visualization techniques operate independently of well data, proving particularly effective in highlighting reservoir anomalies through spatial pattern recognition—a capability exceeding conventional mathematical frameworks [33,34,35]. Intelligent seismic fusion fundamentally extends linear fusion principles through machine learning-driven nonlinear operators, implementing PCA and cluster analysis as essential preprocessing steps for dimensionality reduction [36,37,38].
Optimal algorithm selection requires a systematic evaluation of reservoir characterization objectives against available sample density. Current methodologies are stratigraphically categorized into supervised (well-constrained) and unsupervised (data-driven) fusion architectures [39]. Supervised techniques demonstrate superior performance through seismic-well log co-learning mechanisms, though their efficacy remains spatially constrained to well-penetrated zones and exhibits a positive correlation with well density. While seismic attributes effectively amplify specific geophysical signatures to enhance lithofacies discrimination, this spectral emphasis paradoxically induces information attenuation in complementary domains. Such inherent selectivity fundamentally limits their capacity for holistic stratigraphic representation, as substantiated in seismic interpretative practice [40].
Moreover, seismic attributes face a pervasive challenge in seismic interpretation, namely the inherent ambiguity associated with these attributes [41]. This ambiguity predominantly manifests in two aspects. First, distinct geological phenomena can present highly similar seismic attribute responses. For instance, strong amplitude responses may indicate the presence of unconformities, carbonate rocks, igneous intrusions, coal seams, and other geological features, leading to uncertainties in interpreting seismic attributes [42,43]. Second, factors such as resolution limitations, interference from adjacent formations, and tuning effects on amplitude and frequency further contribute to the ambiguity in the geological interpretation of seismic attributes [44,45]. For example, tuning effects can result in sand bodies of varying thicknesses displaying similar amplitude and frequency values across seismic attributes. Additionally, a pronounced amplitude response may originate from the target sand body or may be influenced by interference from neighboring geological formations [46].
Given the limitations and ambiguities associated with seismic attributes, numerous scholars have consistently focused their research efforts on two key areas aimed at improving the interpretive accuracy of these attributes. The first area emphasizes the development of novel seismic attributes [47], while the second explores methodologies for integrating multiple seismic attributes [48,49].
In regions lacking drilling data, the combination of seismic waveform inversion techniques with intelligent analysis of multiple seismic attributes—constrained by sedimentary models—proves advantageous. Artificial intelligence approaches are particularly effective for addressing nonlinear challenges, such as the quantitative relationships between petrophysical parameters and seismic attributes.
In the field of seismic waveform inversion and multimodal intelligent analysis, researchers have proposed a data-model co-driven seismic impedance inversion method [50]. Leveraging deep learning techniques, this approach identifies concealed fluvial channels in seismic images, overcoming the limitations of traditional model-driven methods. The inversion resolution is improved by 30% and the identification accuracy of hidden geological features (e.g., channels) exceeds 85% [51]. By integrating AI-generated initial impedance models with nonlinear modeling capabilities and physical constraints, the method optimizes low-frequency information in conventional inversion, achieving high-resolution seismic imaging [52]. Another study developed a multimodal deep learning framework for predicting reservoir parameters by fusing multimodal logging data (e.g., conventional logs and dynamic resistivity imaging) [53]. Applied to carbonate reservoirs in the Gaoshiti-Moxi block (Sichuan Basin), this method enhances porosity and permeability prediction accuracy by 25% compared to traditional approaches, addressing challenges in heterogeneous reservoir characterization [54]. AI-driven advancements including data-driven modeling, multimodal fusion, and automation significantly improve the precision and efficiency of geophysical exploration [55]. Applications span seismic inversion, reservoir prediction, and complex hydrocarbon reservoir development, offering innovative solutions for subsurface resource exploration [56].
In the field of computer science, artificial intelligence technologies, particularly those advancing through deep learning, are evolving rapidly. By actively employing machine learning methods to probe into the inherent complex features and patterns of seismic attributes, researchers can attain a more comprehensive and nuanced understanding of seismic data. The application of deep learning in geophysical research demonstrates significant potential for future advancements [57]. As a result, the integration of these attributes provides an objective and holistic depiction of the variations in geophysical responses and patterns across diverse lithological strata [58,59].
Self-Organizing Maps (SOM), an unsupervised learning technique for clustering and high-dimensional visualization, is an artificial neural network inspired by the human brain’s signal processing characteristics. This method, introduced by Professor Teuvo Kohonen of the University of Helsinki, Finland [60,61], has become the most widely utilized self-organizing neural network approach. Known for its robust self-organization and visualization capabilities, the SOM algorithm has gained widespread application and extensive research interest.
In the realm of petroleum geology, the SOM algorithm demonstrates its efficacy in attribute synthesis and unsupervised clustering analysis. By extracting multi-dimensional attribute volumes that characterize geological features, the SOM approach clusters attributes exhibiting similar data patterns. This methodology facilitates the generation of high-resolution three-dimensional visualizations with hollowing effects, significantly enhancing the clarity of sand body geometries and boundary identification [62,63].
Beach-bar deposits are characterized by their thin reservoir thickness and rapid lateral variability. The current demand for precision in reservoir identification has escalated to 3–8 m, surpassing the vertical resolution limits of seismic data. This study addresses these challenges by guiding geological insights and seismic sedimentology. In regions with well control, we introduce well logs that possess high vertical resolution. By utilizing seismic waveforms to drive these well logs, high-resolution inversion is attained [64]. We have established a seismic waveform indicative inversion technique which employs efficient dynamic clustering analysis of seismic waveforms to create a mapping relationship between the structures of seismic waveforms and high-frequency well log data. This approach enhances both the vertical and lateral resolution of the inversion results, ultimately improving the predictive accuracy when identifying thin sand bodies.
In areas with limited well control, the Self-Organizing Map (SOM) seismic attribute clustering method compensates for the inversion accuracy limitations caused by a scarcity of wells [65,66]. This method clusters attributes with similar significance for thorough analysis and evaluation, resulting in a clearer representation of the spatial distribution of sand bodies. The integration of these two methodologies addresses the challenges of low vertical resolution in seismic data and the inherent multiplicity of interpretations in seismic analysis from different perspectives, thereby providing novel insights for predicting thin-layered sandstone and delineating boundaries in sparsely sampled regions.
This paper systematically elucidates the principles underlying the SOM seismic attribute clustering method and seismic waveform indicative inversion technique. In addition, it conducts a thorough analysis of the feasibility and reliability of their integrated application, facilitating high-precision prediction research for thin reservoirs in well-scarce areas. Through a case study analyzing the microfacies characterization of thin-layer beach-bar deposits in the lower E3d2 member of the Paleogene in the HHK Depression of the Bohai Bay Basin, we conclude that, guided by geological understanding and sedimentary models, the integration of SOM multi-attribute optimization and seismic waveform inversion effectively addresses the challenge of predicting thin-layer sand bodies in continental regions with few wells.

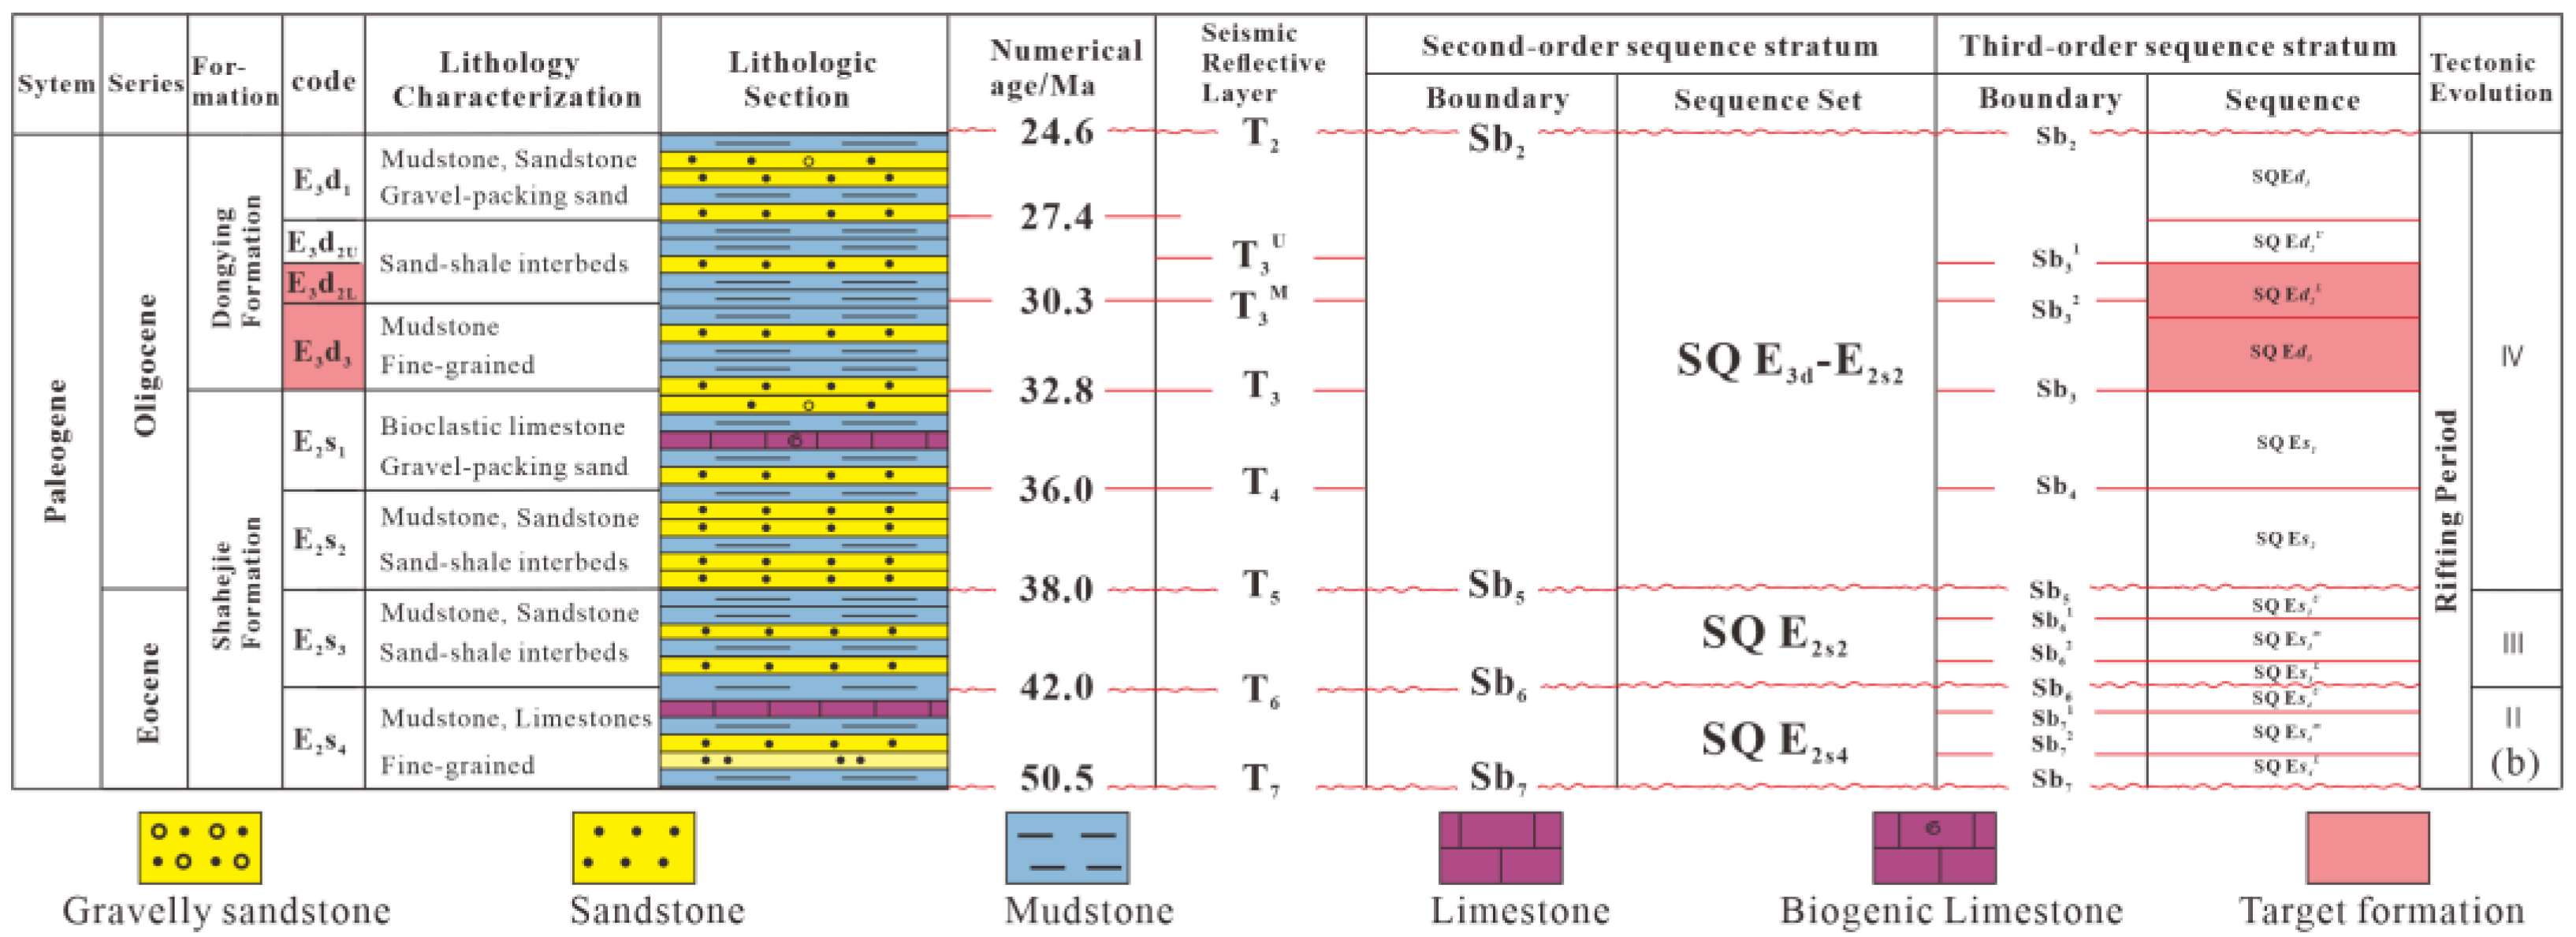
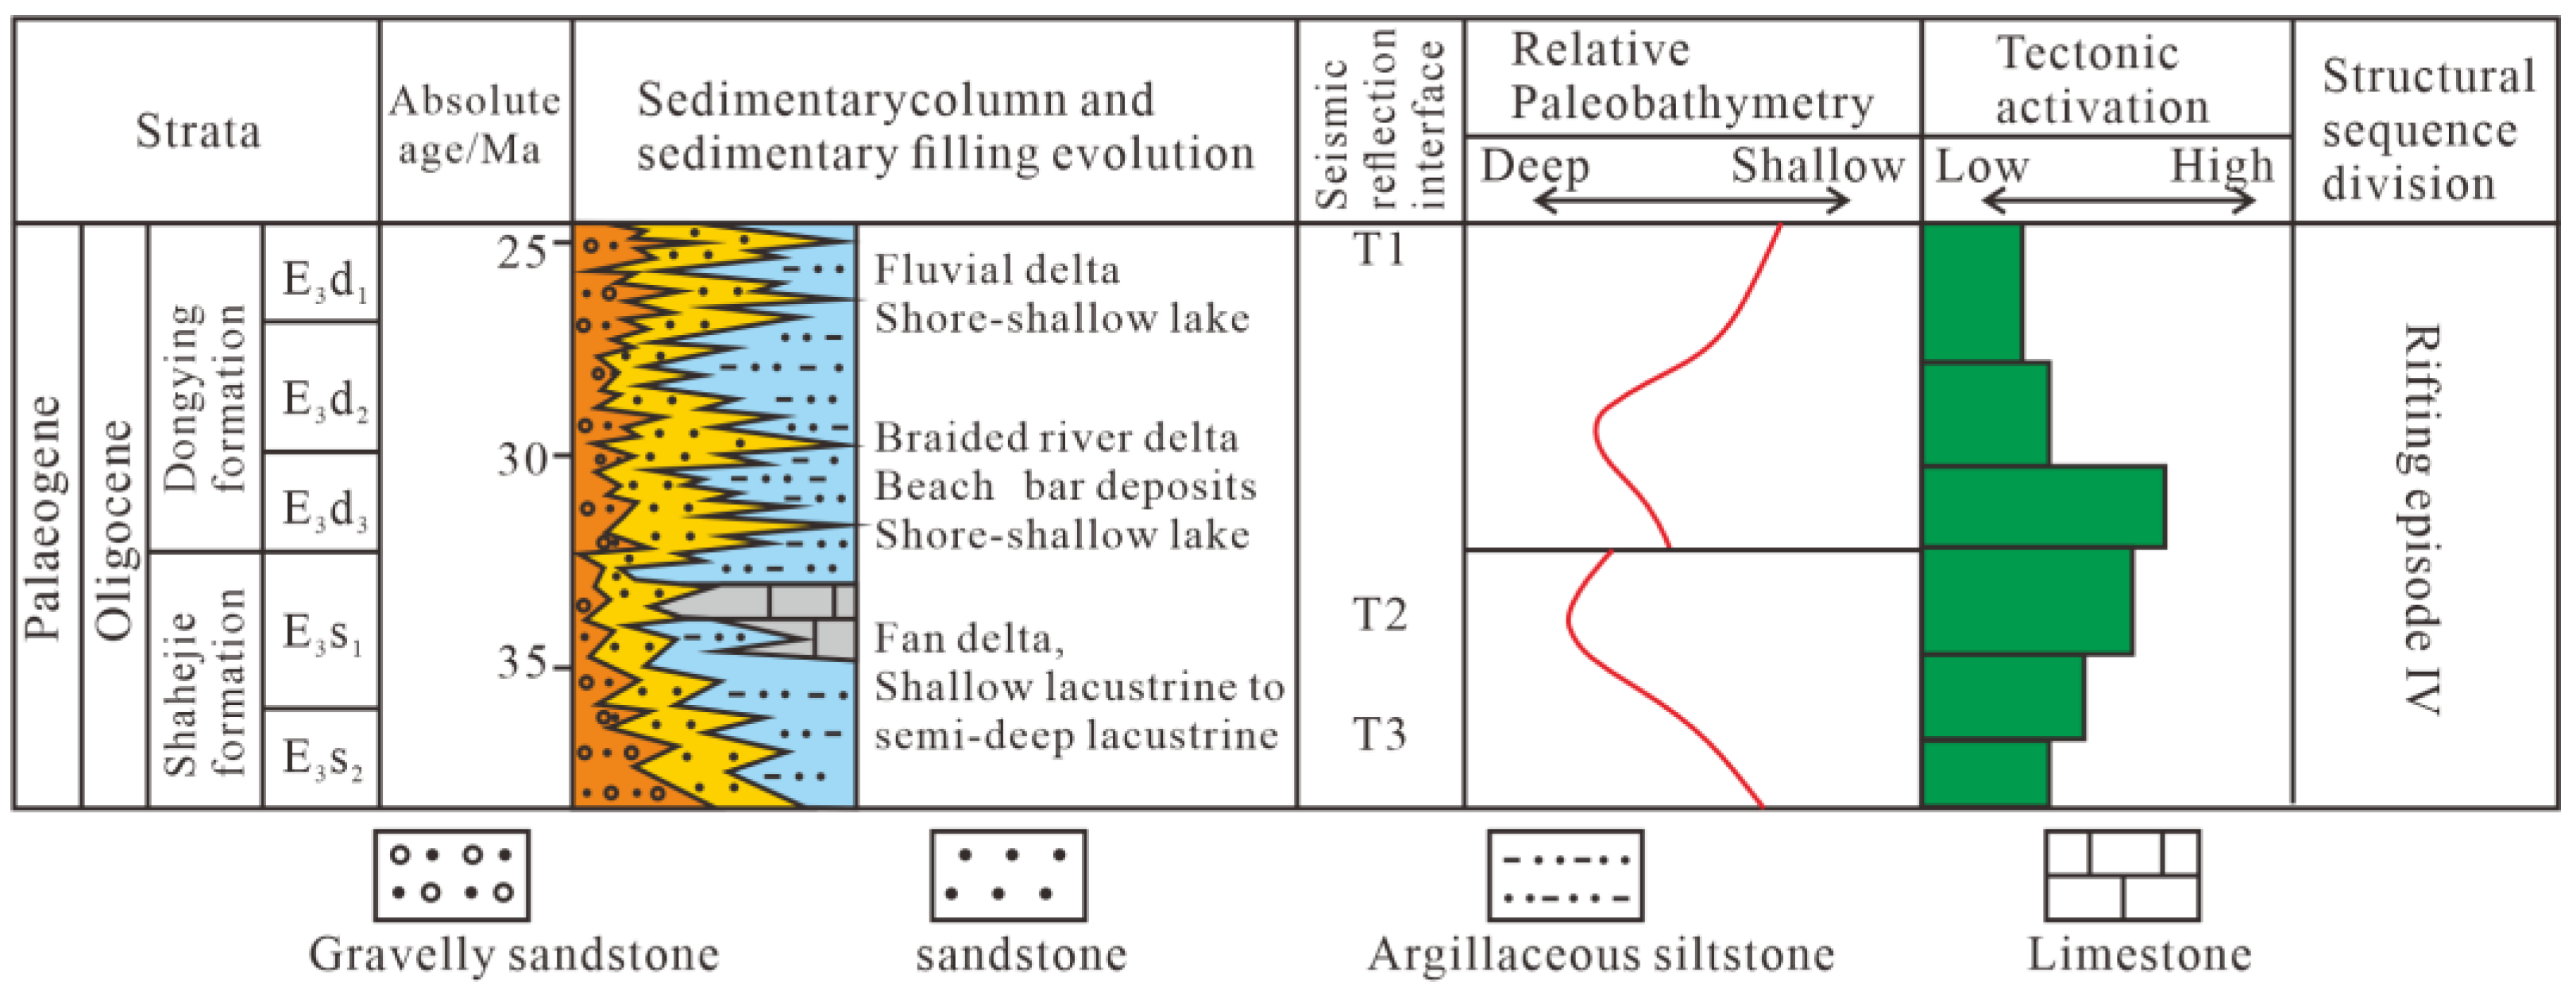
2. Regional Geological Background

The HHK Depression in the study area is located in the southern part of Bohai Bay Basin, which can be further divided into the northern steep slope zone (east and west segments), the southern slope zone (east and west segments), the central strike-slip zone, and the central uplift zone (Figure 1).
The Kongdian Formation (E1–2k), the fourth member of the Shahejie Formation (E2s4), the third member of the Shahejie Formation (E2s3), the second member of the Shahejie Formation (E3s2), the first member of the Shahejie Formation (E3s1), the third member of the Dongying Formation (E3d3), the second member of the Dongying Formation (E3d2), and the first member of the Dongying Formation (E3d1) developed successively from top to bottom in the Paleogene in this area [31]. The E3d2 member can be further subdivided into the lower E3d2 sub-member and the upper E3d2 sub-member. The corresponding seismic reflective layer interfaces for members from E2s4 to E3d1 are as follows: T7 (E2s4), T6 (E2s3), T5 (E3s2), T4 (E3s1), T3 (E3d3), T3m (E3d2l-the lower E3d2 sub-member), T3u (E3d2u-the upper E3d2 sub-member), and T2 (E3d1) (Figure 2).
In terms of tectono-sedimentary evolution, the E3s2 to E3d1 stages of the HHK Depression are in the rifting stage of basin tectonic evolution, with an average tectonic subsidence rate ranging from 11.54 to 54.7 m/Ma. The E3d3 shows a higher tectonic subsidence rate. The intensity of rifting activity gradually weakens and rifting action attenuates in the later period, which marks the beginning of the transition to a post-rift depression [64]. Macroscopically, the HHK Depression Paleogene segments have certain differences in lithology combination characteristics and sedimentary facies distribution. They also have inheritance characteristics. In the study area, E3s2 to E3d2 are in the fault-depression period during the development of the Bohai Bay Basin. The geomorphology tends to be flat in the E3s1 period, and the overall thickness of strata in the area is thin and stable. During the sedimentary period of the Dongying Formation, the intensity of fault activity increased, and a set of thick lacustrine mudstone developed in the early stage of E3d3 [65]. The HHK Sag was affected by tectonic activities during the E3d3 period, resulting in fault activation and large-scale lake invasion. The HHK Depression is dominated by thick mudstone with thin sandstone and siltstone and locally developed braided river delta and beach-bar deposits. During the lower E3d2 Sub-member, the basin tectonic subsidence rate gradually weakened, the paleowater depth changed from deep to shallow, and the delta sediment advanced to the lake, which was significantly affected by the transformation of lake waves. The beach-bar scale gradually increased, and braided river delta and beach-bar sediments developed. This study focuses on the beach-bar sedimentary characteristics of the lower E3d2 Sub-member of the Paleogene HHK Depression (Figure 3).

3. Materials and Methods

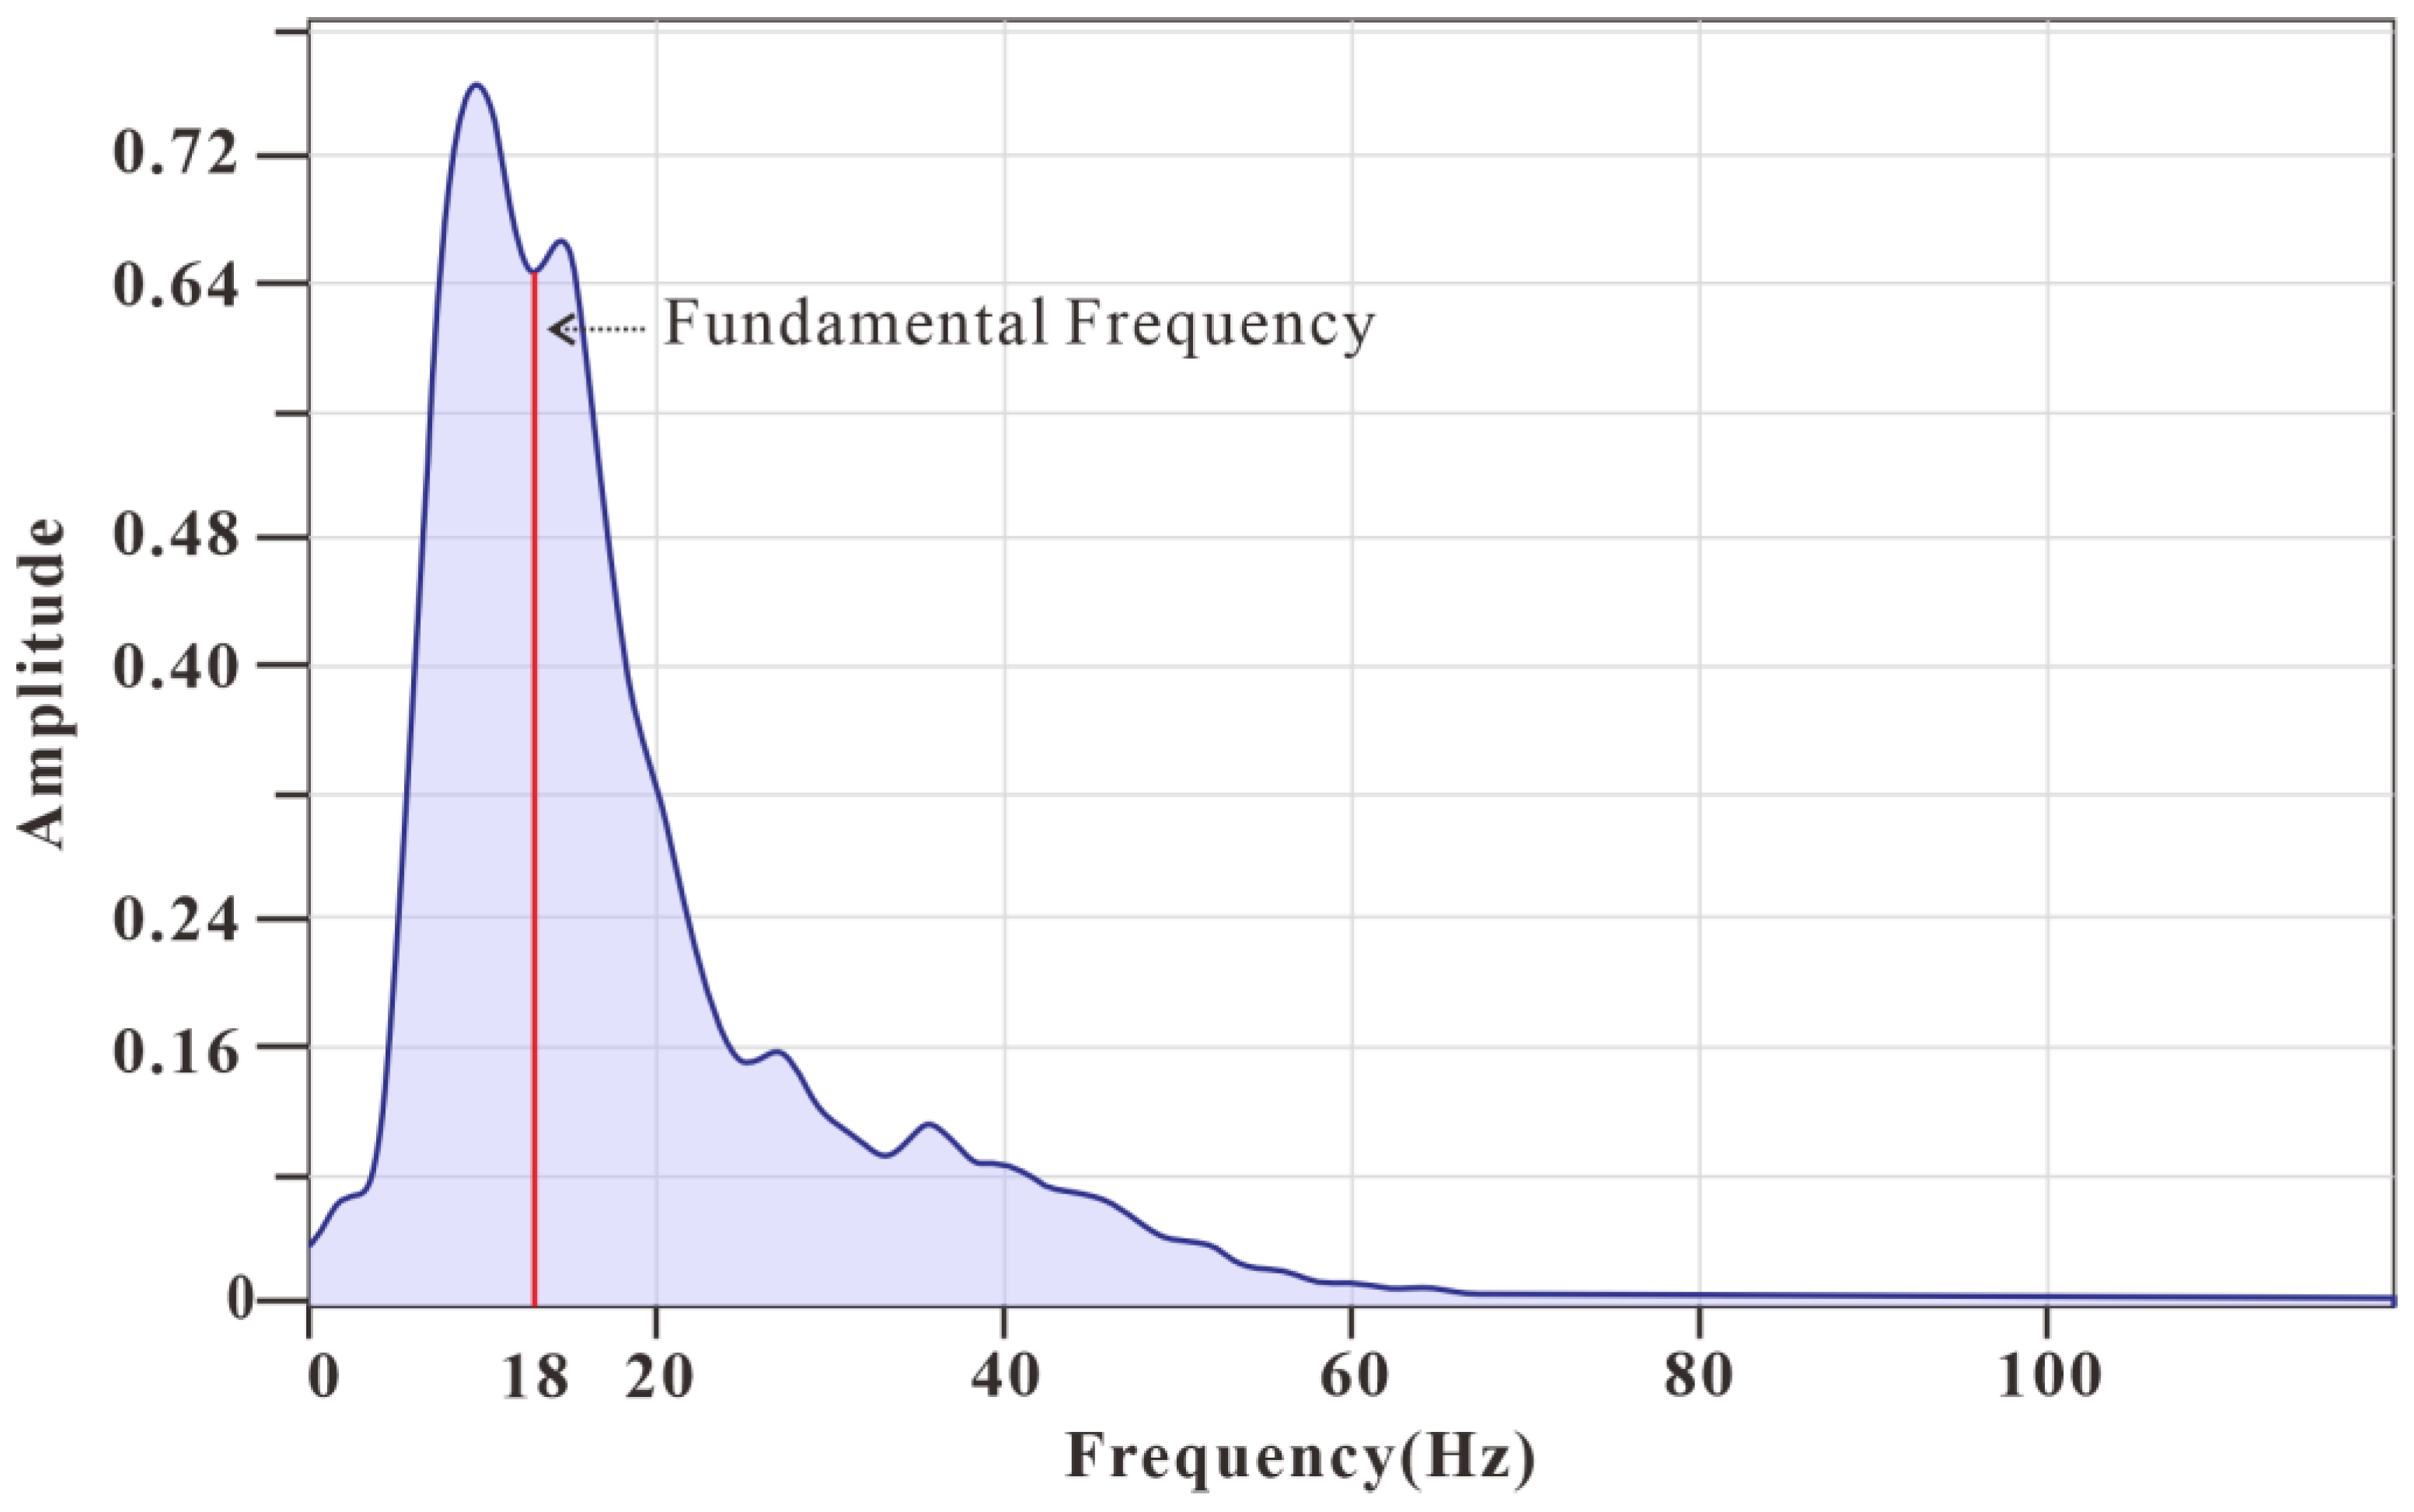
3.1. Seismic Data Quality Analysis

The seismic resolution analysis was conducted using two independent methodologies: detuning analysis and acoustic travel-time calculation, based on the dominant frequency (18 Hz, Time = 1/18) and characteristic interval velocity (V = 3700 m/s) of the target layer in the study area. The tuning thickness was determined through the wavelength equation:
λ = V T 4
λ: Wavelength, m
V: Velocity, m/s
T: Time, s
This establishes the theoretical vertical resolution threshold for deterministic inversion at 52 m. The inherent resolution limitation poses significant challenges in characterizing thin sand layers of below 10 m thickness. Conventional acoustic impedance inversion demonstrates suboptimal predictive accuracy for these sub-resolution thin beds, particularly in delineating vertical compartmentalization and lateral continuity. To address these technical constraints, we developed an integrated workflow combining rock physics analysis, SOM multi-attribute optimization, and seismic waveform inversion. This methodological framework effectively leverages the spatial predictive capabilities of seismic data while maintaining strong geological constraints through depositional pattern recognition and petrophysical calibration (Figure 4).

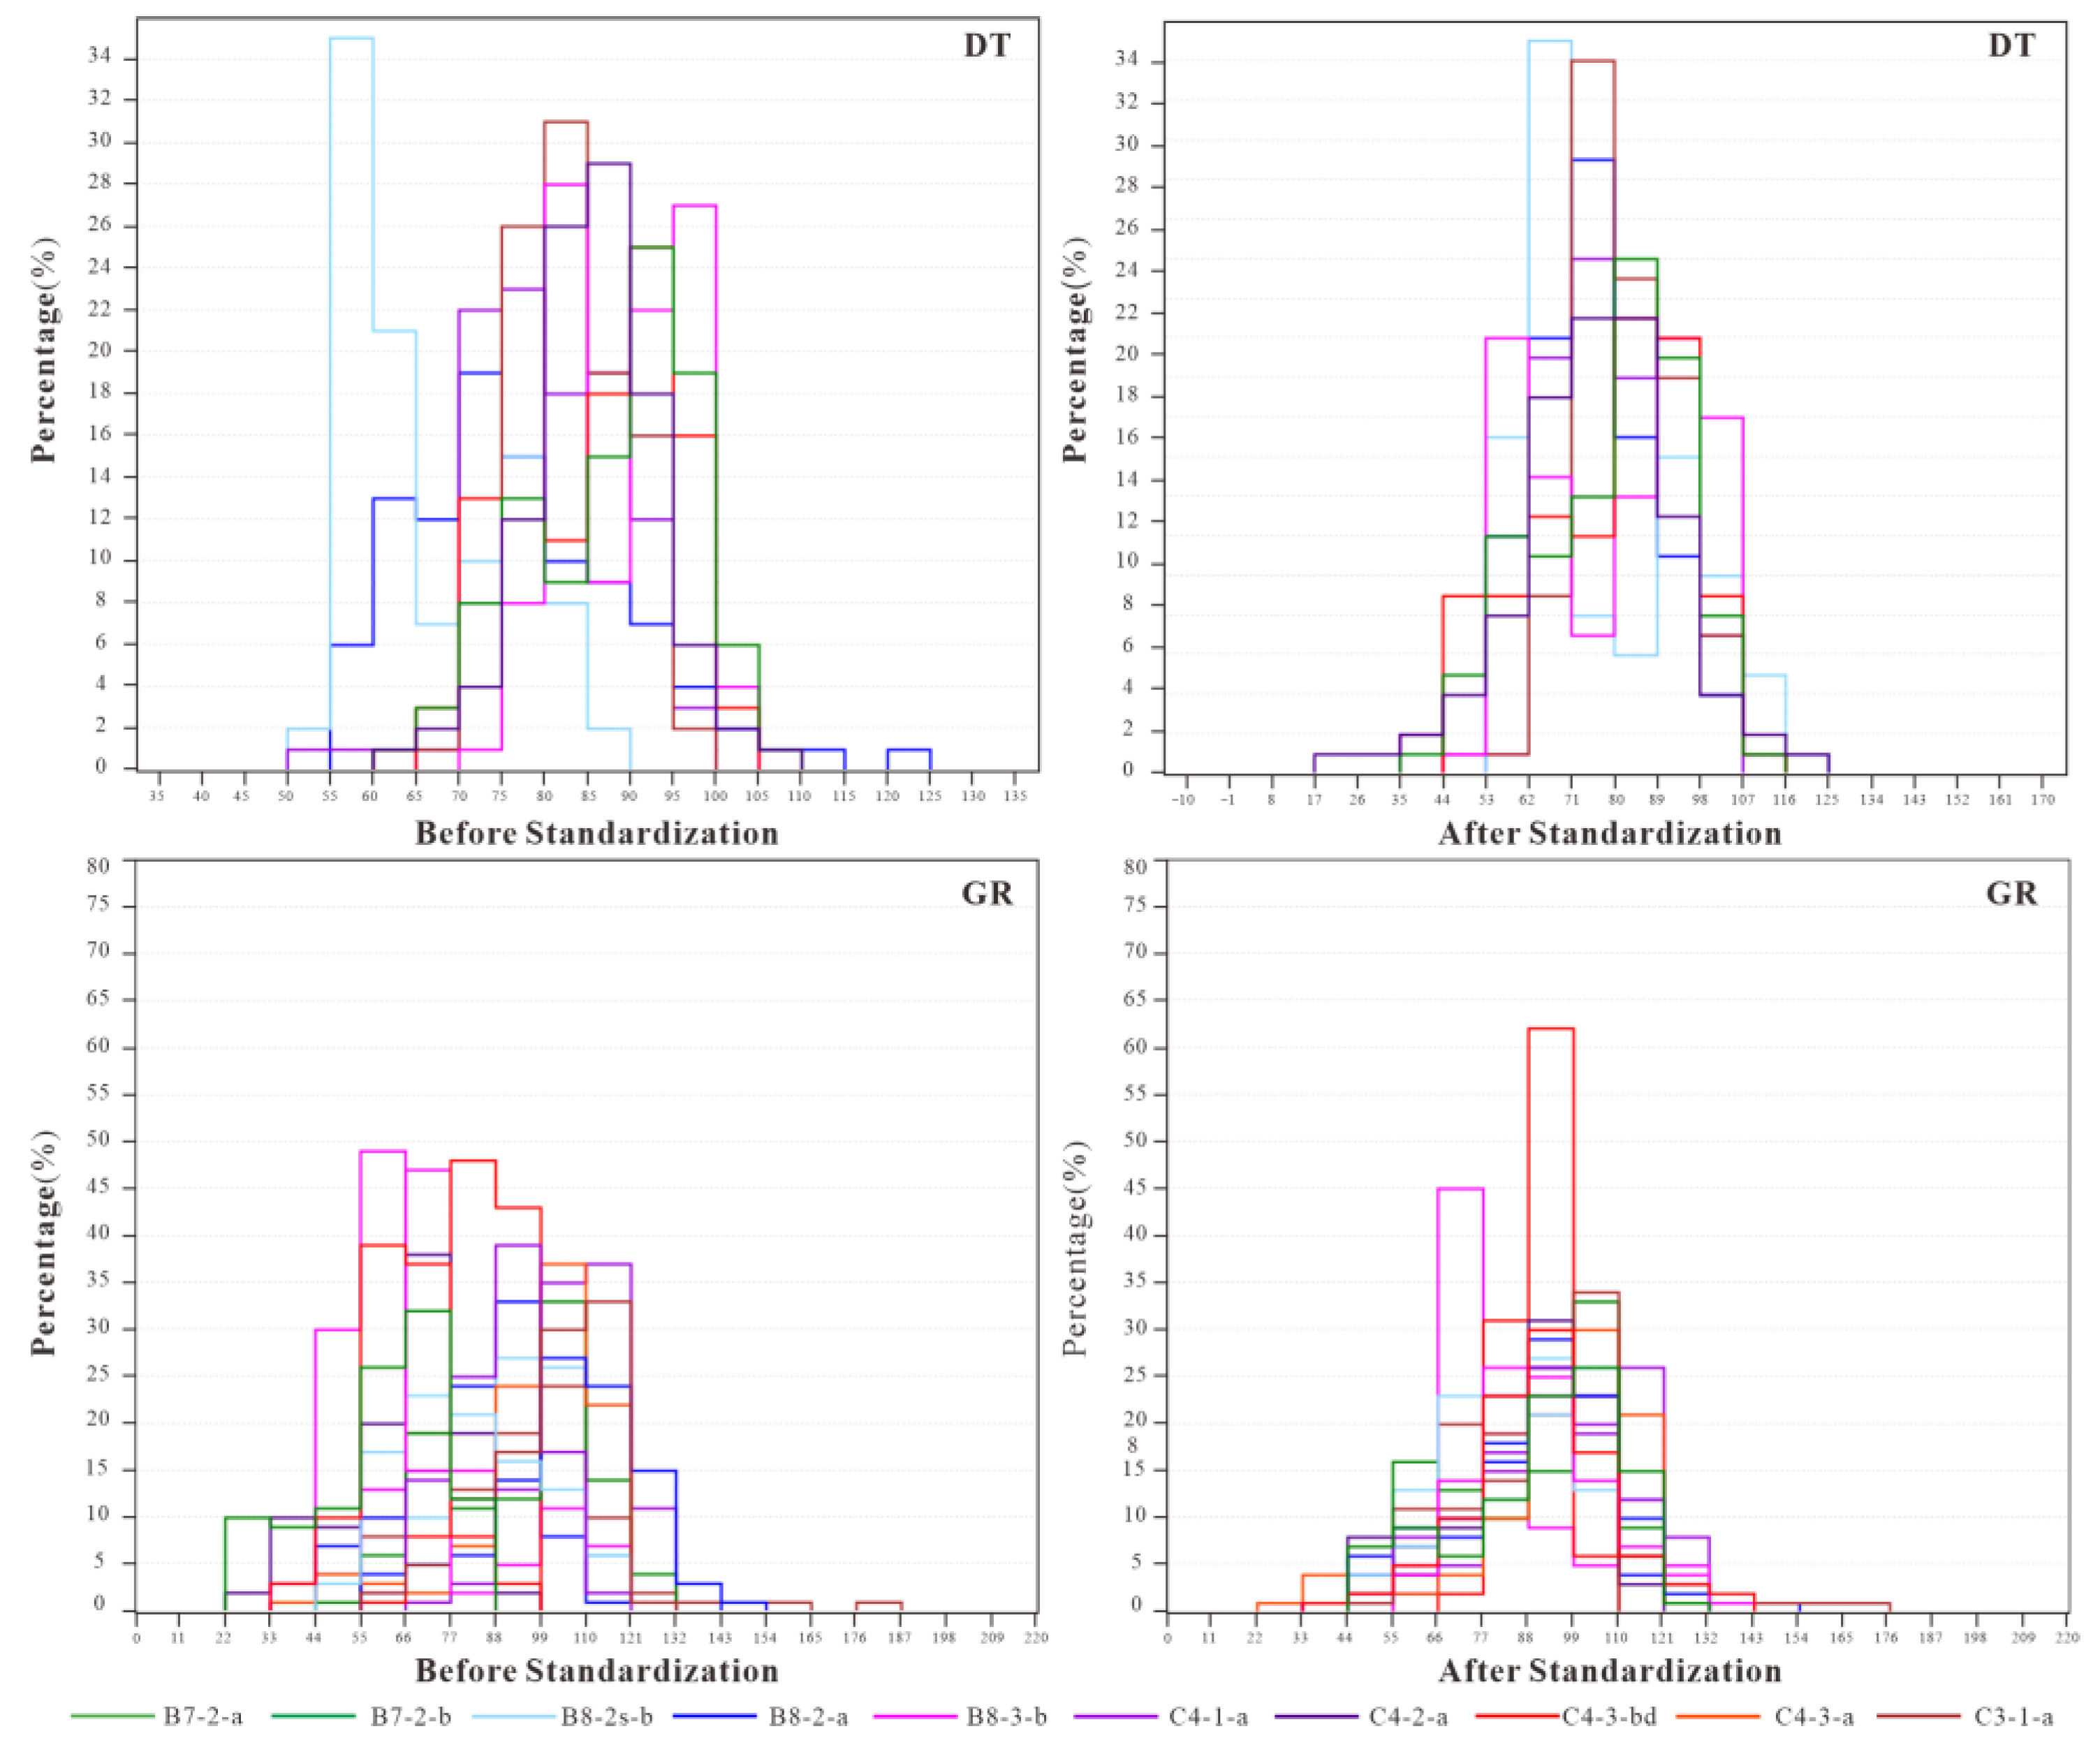
3.2. Well Logging Data Preprocessing

Quality control of logging data from individual wells, as well as consistency checks of logging data from multiple wells, are integral components of the log data analysis process. This is crucial for establishing reliable rock physics models and ensuring high-quality seismic inversion. The preprocessing of the logging data in this study primarily encompasses environmental correction, outlier management, and curve standardization.
Consistency checks of multi-well logging data are a vital quality control step in the seismic-constrained inversion process with well calibration. Systematic errors may arise from different generations of logging instruments, variations in the properties of the mud utilized in each well, and influences from wellbore conditions. These factors can result in significant discrepancies in the logging responses of identical logging curves at standard layers across different wells [66].
The presence of such discrepancies suggests that seismic synthetic records calibrated using well data and seismic lithology inversions constrained by multiple wells may involve various uncertainties [67]. Consequently, building upon the quality control of single-well data, the standardization and correction of multi-well data represent essential quality control measures in the integration of well and seismic information [68].
The specific procedure is as follows: A histogram of logging response frequencies or a frequency intersection graph is constructed for the standard layer of the well in question and compared in detail with the corresponding graph for the same standard layer from a key well [69]. If the two sets of values are identical and exhibit similar shapes, this indicates that the curve calibration for the well is accurate. Conversely, if discrepancies are noted, it suggests an error in the calibration of the logging curve for that well [70]. In such instances, the difference between the characteristic values of the standard layer logging curves across each well and the characteristic values from the key well’s standard layer is utilized as the correction value for the well’s logging curve [71].
Building on this foundation and integrating research requirements with the practical conditions of well logging data, a stable mudstone interval from the lower Dong-2 Member was selected as the reference layer. The core of the mudstone-referenced gamma ray (GR) and density (DEN) curve standardization method lies in establishing a normalization baseline based on the radioactive and density characteristics of mudstone, thereby eliminating the effects of instrumentation, environmental conditions, and lithological variations on logging data [72]. This mudstone interval exhibits lateral stability and distinct logging response features, including high natural gamma ray (GR > 100 API), high density (DEN: 2.0–2.5 g/cm3), moderate neutron porosity, and acoustic transit time. Using the GR values of pure mudstone layers as the baseline (120–130 API), the GR offsets for other wells were calculated. Simultaneously, systematic errors in the density curves were corrected based on the average mudstone density (2.3 g/cm3). Subsequently, standardization procedures were applied to all of the wells within the study area involved in the inversion analysis.
Following the standardization process, the probability histogram matching method was employed for multi-well consistency checks. Probability distribution histograms for natural gamma, density, and other log curves were generated for each well in the study area (Figure 5). These histograms demonstrated good interwell consistency within the region, making them suitable for subsequent rock physics analysis. The environmental correction of the original logging data and the rationality correction of reservoir parameters ensure that we obtained a relatively accurate and reasonable series of key logs. This, in turn, guaranteed a high correlation in the well-seismic relationships during subsequent inversion processes.

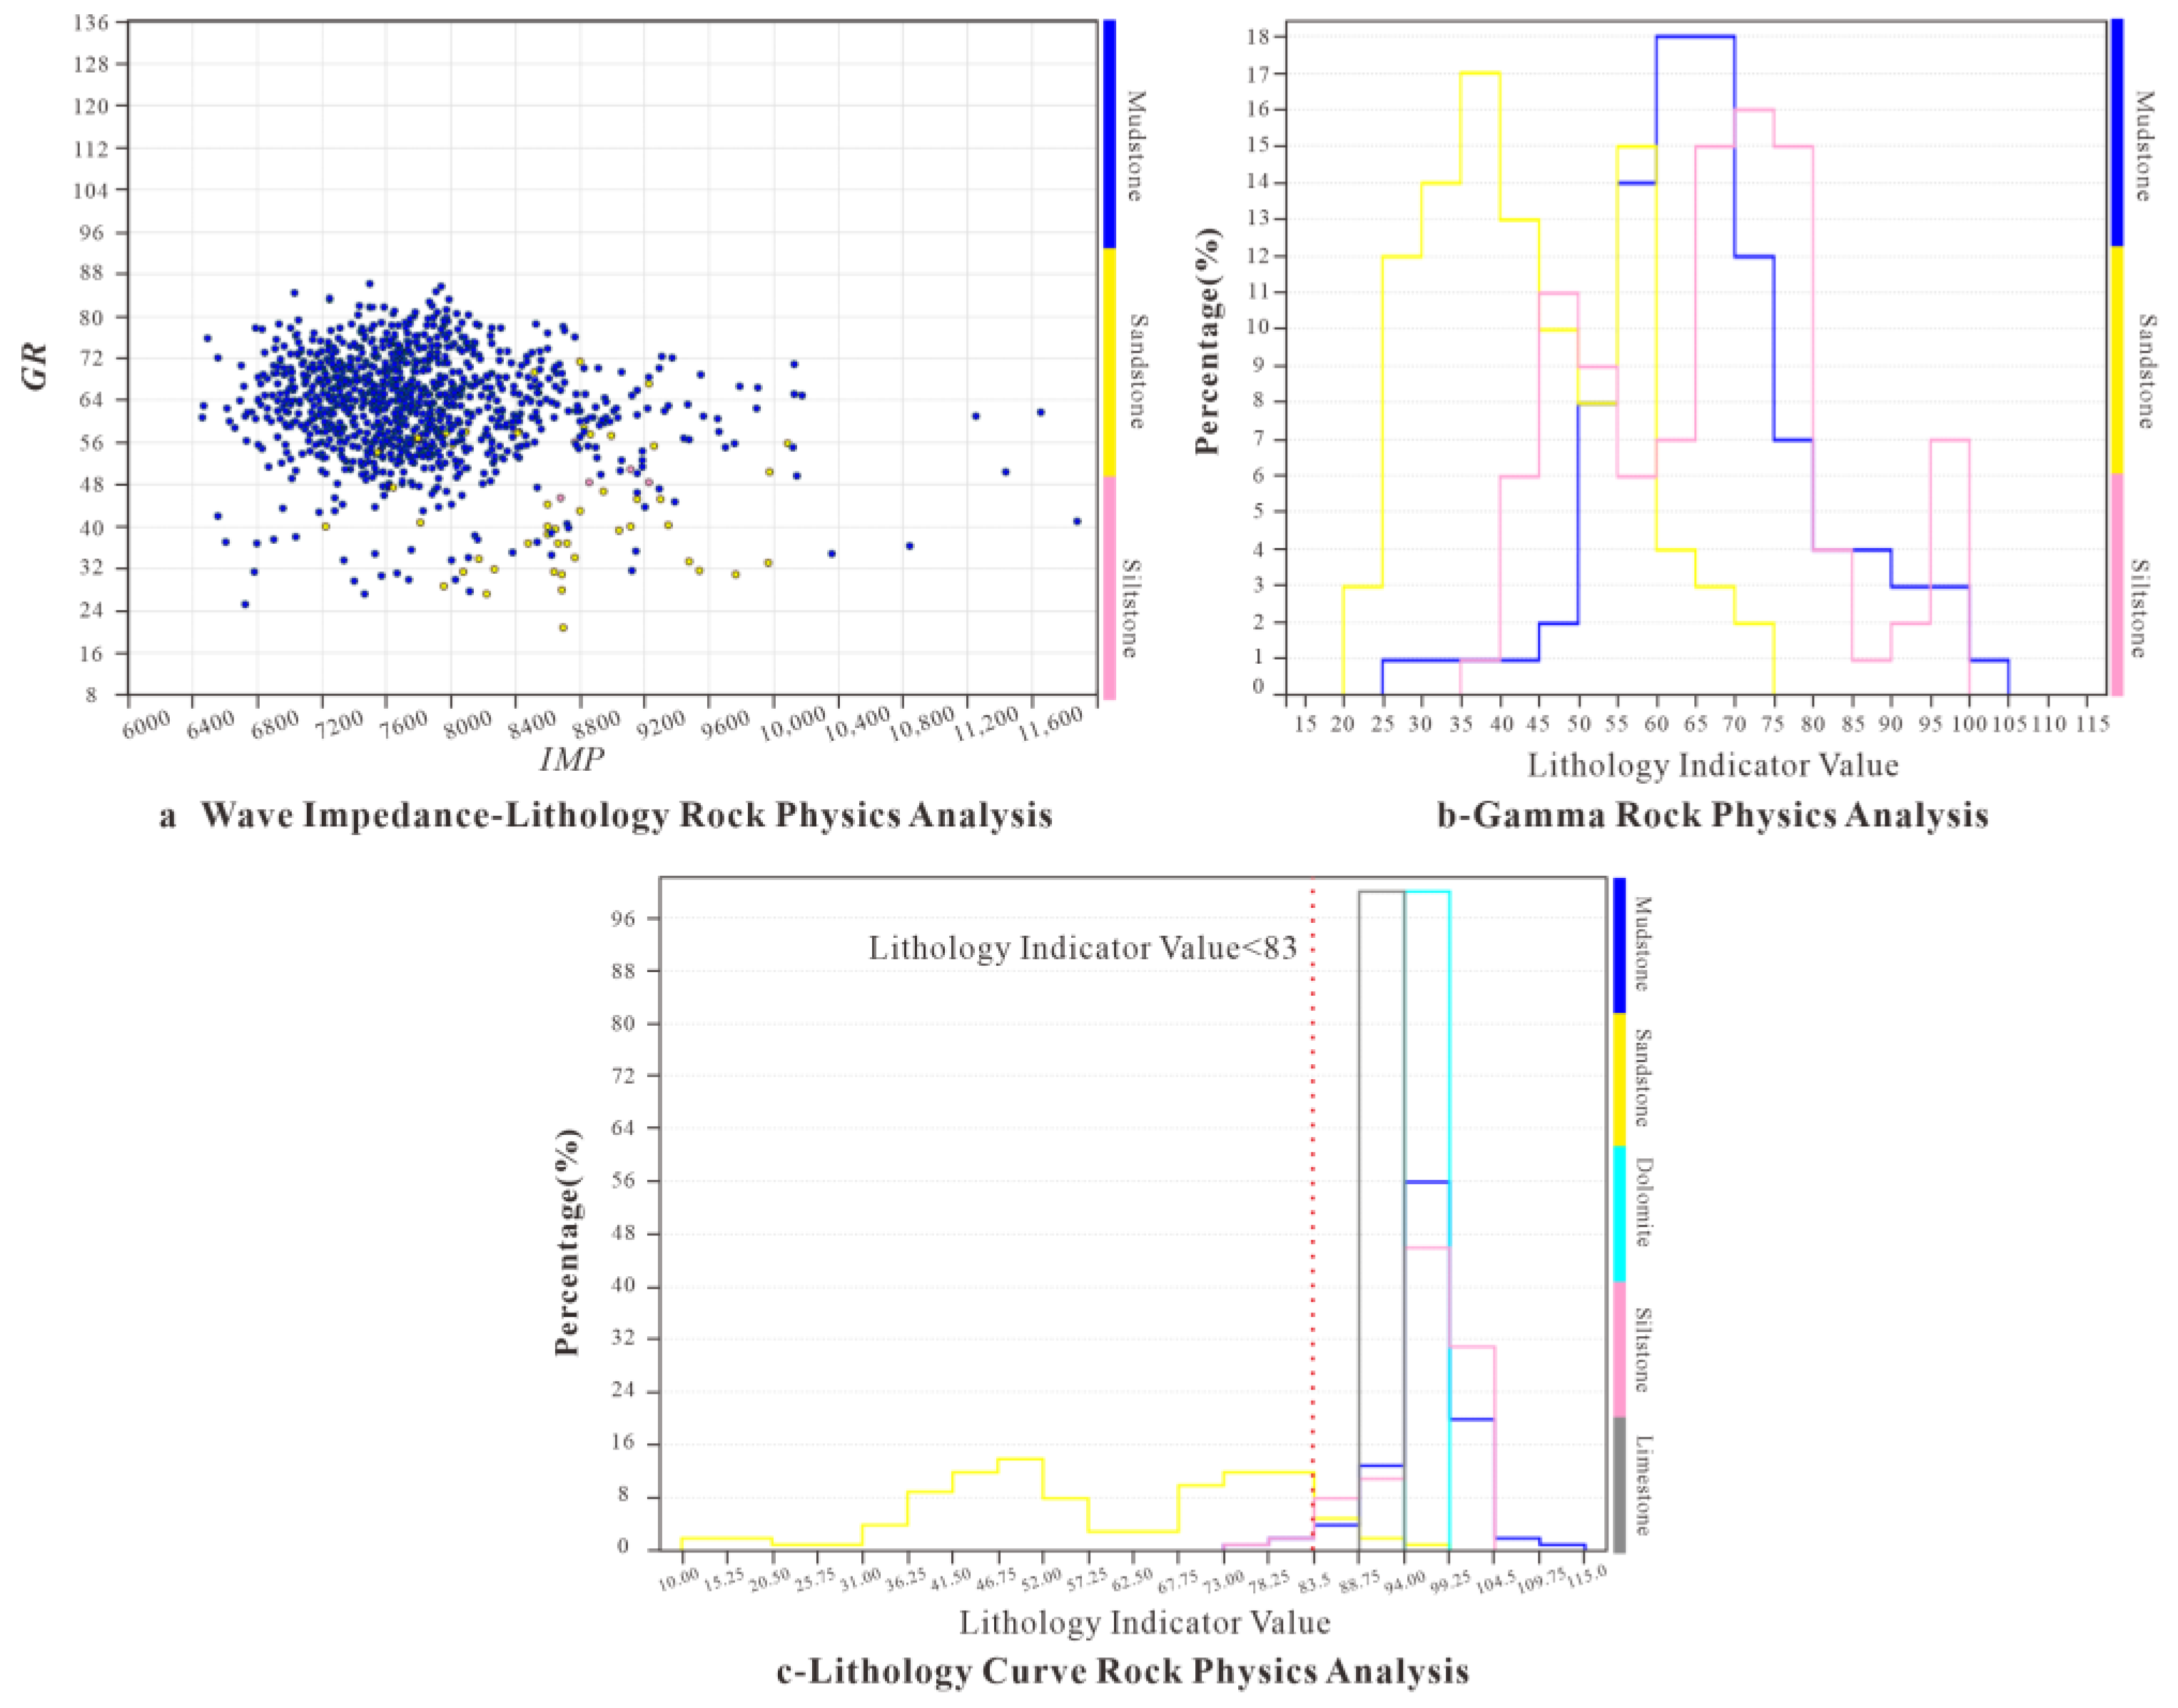
3.3. Petrophysical Analysis

Petrophysical analysis, also known as reservoir sensitivity parameter analysis, aims to identify one or more logging parameters that can effectively distinguish reservoirs by analyzing the distinct features displayed by different lithofacies on logging curves [73]. This provides geological guidance for the selection of pseudo-wave impedance reconstruction and well-seismic combined reservoir inversion methods, serving as an essential foundational task for reservoir prediction. Due to the myriad types of logging curves, it is crucial to conduct sensitivity analyses to determine which curve is the most effective at differentiating between reservoir and non-reservoir zones. This is typically accomplished using techniques such as histograms and cross-plots [74,75].
The lithological types prevalent in the study area include sandstone, siltstone, mudstone, limestone, and dolomite, among others. A single log curve is often insufficient for effective reservoir identification. Therefore, a combination of multiple logging parameters is necessary for the comprehensive identification of high-quality reservoirs [76]. Analysis of a single well reveals that the thin-layered sandstone in the lower second sub-member of the Dongying Formation is characterized by low acoustic wave velocity, low gamma radiation, and relatively high resistivity. Petrophysical analysis indicates that the resistivity and gamma measurements for the Dongying Formation do not effectively identify sandstone (Figure 6a,b). In contrast, the constructed lithology indicator curve successfully identifies sandstone, with a sandstone cutoff value of less than 83 (Figure 6c).
Based on the results from the petrophysical crossplot analysis, the reconstructed lithology curve can effectively differentiate sandstone from other lithologies. Vertically, it can resolve sand bodies as thin as 5 to 10 m (or even thinner), while horizontally, it clearly delineates the boundaries and stacking relationships of sand bodies. The reconstructed curve is capable of distinguishing between sandstone and mudstone effectively [77,78]. Building on this, seismic waveform-based inversion mechanisms are employed for predictions. By incorporating the concept of well-seismic integration, high-frequency information from the well is extracted to enhance the predictive accuracy for thin layers. This method facilitates the quantitative prediction of the distribution of thin-layer sandstones [79].

4. Principles of Technical Methods

By comparing major methods in geophysical-seismic waveform inversion, Self-Organizing Maps (SOM), traditional deterministic impedance inversion, Kriging, and single-attribute thresholding, this study summarizes their core principles, characteristics, and applicable domains (Table 1) [80]. The analysis highlights the inherent limitations of conventional approaches. Deterministic inversion and Kriging rely heavily on physical or statistical assumptions, while single-attribute thresholding suffers from over-simplification. These limitations make these techniques inadequate for addressing complex geological challenges [81,82]. In contrast, SOM leverages unsupervised learning to achieve multi-attribute integration and nonlinear modeling, rendering it particularly effective for automated seismic facies classification and reservoir prediction [83,84]. Integrating SOM with seismic waveform inversion demonstrates potential in resolving the delineation of thin-bedded beach-bar sand body boundaries in the study area, offering a hybrid approach that combines data-driven pattern recognition with physics-based constraints [85,86].

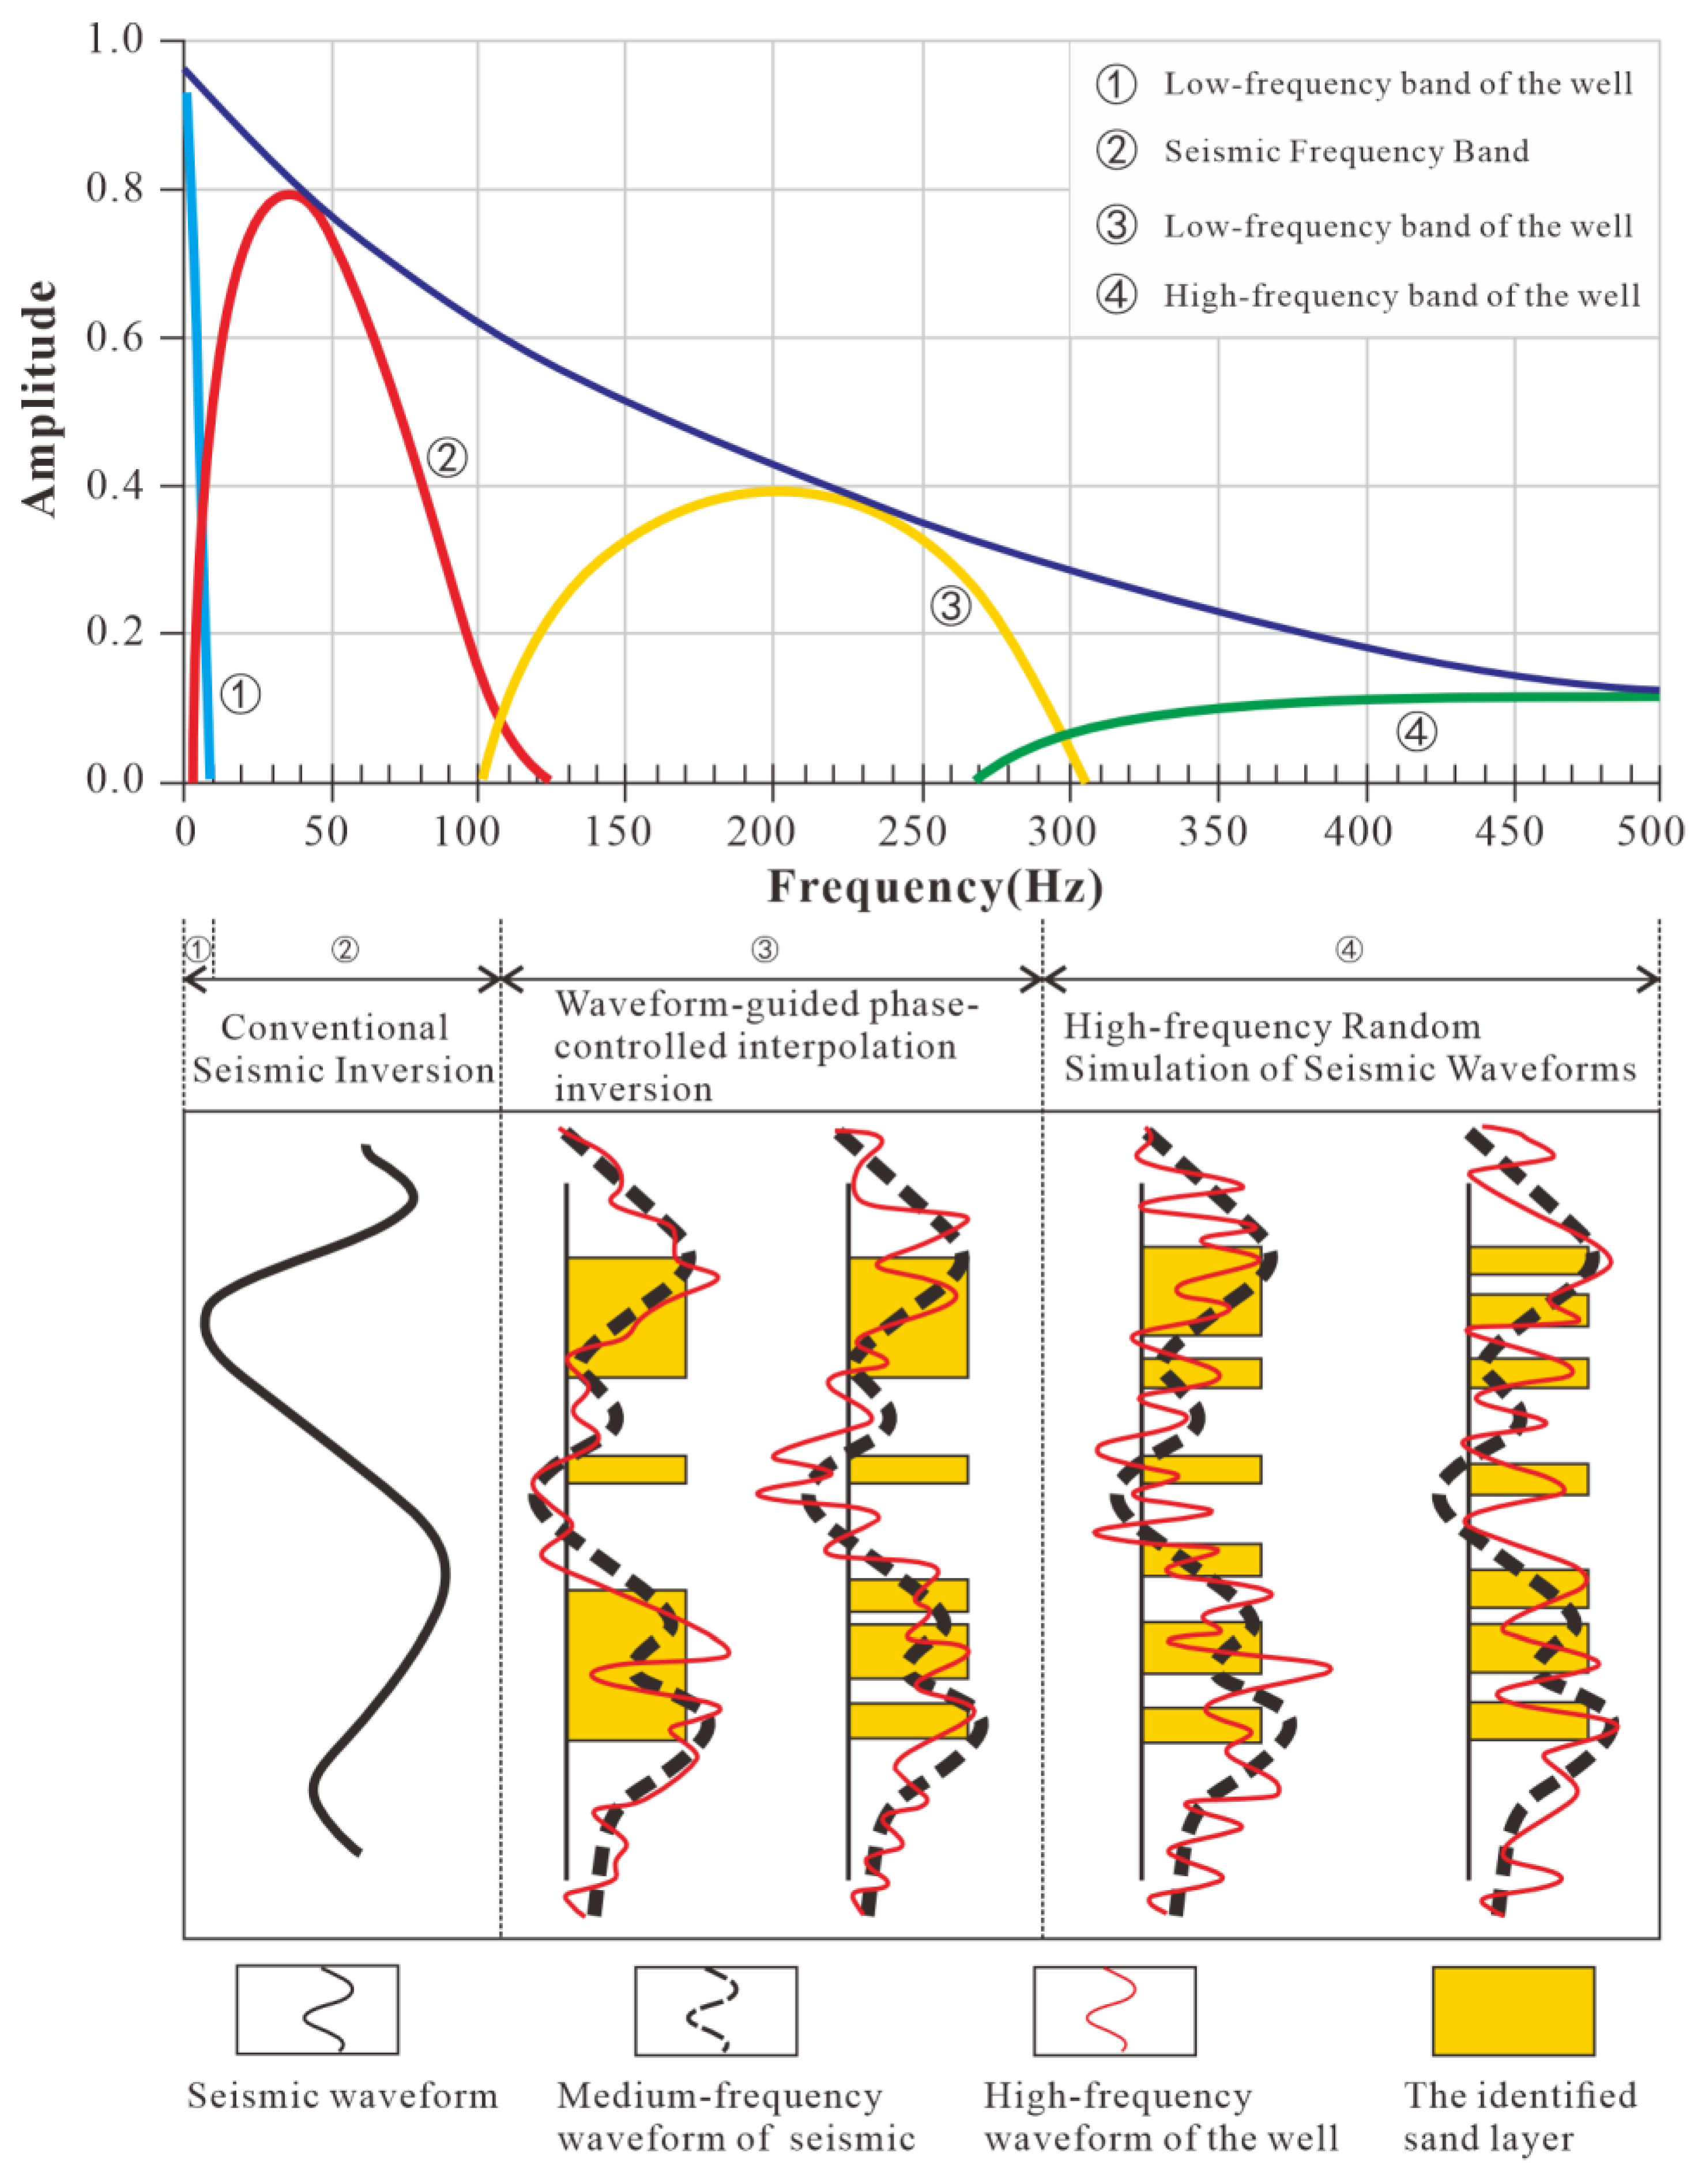
4.1. Seismic Waveform Inversion

Seismic resolution is divided into two aspects: vertical resolution and lateral resolution. Rayleigh was the first to introduce the concept of vertical resolution, which is the resolution limit for two adjacent reflective interfaces at one-quarter of a wavelength. Geological bodies with thicknesses less than one-quarter of a wavelength can be defined as thin layers and cannot be distinguished using seismic data. Logging curves corresponding to similar waveforms exhibit a higher degree of similarity over a broad frequency band. Therefore, by utilizing the lateral similarity of seismic waveforms to drive high-frequency logging information, a high-resolution inversion is achieved [87]. This has led to the establishment of the Seismic Waveform Inversion.
The methodology employs systematic analysis of lateral seismic waveform variations to estimate high-frequency components, characterizing structural patterns in vertical lithological assemblages within reservoir formations. By integrating facies-controlled constraints into lateral dimension interpretation, this technique establishes an integrated well-seismic simulation framework that transitions inversion results from stochastic estimations to constrained solutions [88]. The approach achieves progressive determinism in subsurface modeling without requiring uniform well distribution configurations. Operational advantages include enhanced inversion precision and extended applicability to complex depositional environments with sparse well control.
Under isochronous stratigraphic framework constraints, lateral variations of seismic waveforms replace variograms to characterize reservoir spatial heterogeneity [89]. The fundamental principle leverages the dense spatial distribution of seismic data and the intrinsic correlation between waveform characteristics and depositional environments. By utilizing lateral waveform variations as spatial variability indicators, the approach enhances the representation of sedimentary controls, enabling facies-constrained stochastic inversion.
Within the Bayesian theoretical framework, the method integrates prior model parameter distributions with observed data to formulate posterior probability density functions. The inversion solution is obtained through posterior distribution optimization, accompanied by uncertainty quantification to validate the result’s reliability. This process establishes rigorous mathematical foundations for objective function construction [90].
The workflow implements iterative model perturbation techniques to progressively approximate sample data distributions, ultimately yielding high-resolution inversion results. Under Bayesian constraints, optimal statistical sampling prioritizes wells with high similarity metrics and spatial proximity to build initial models [91]. High-resolution well-seismic joint simulation achieves interwell reservoir prediction with seismic waveform constraints, simultaneously improving vertical and lateral resolution (Figure 7).

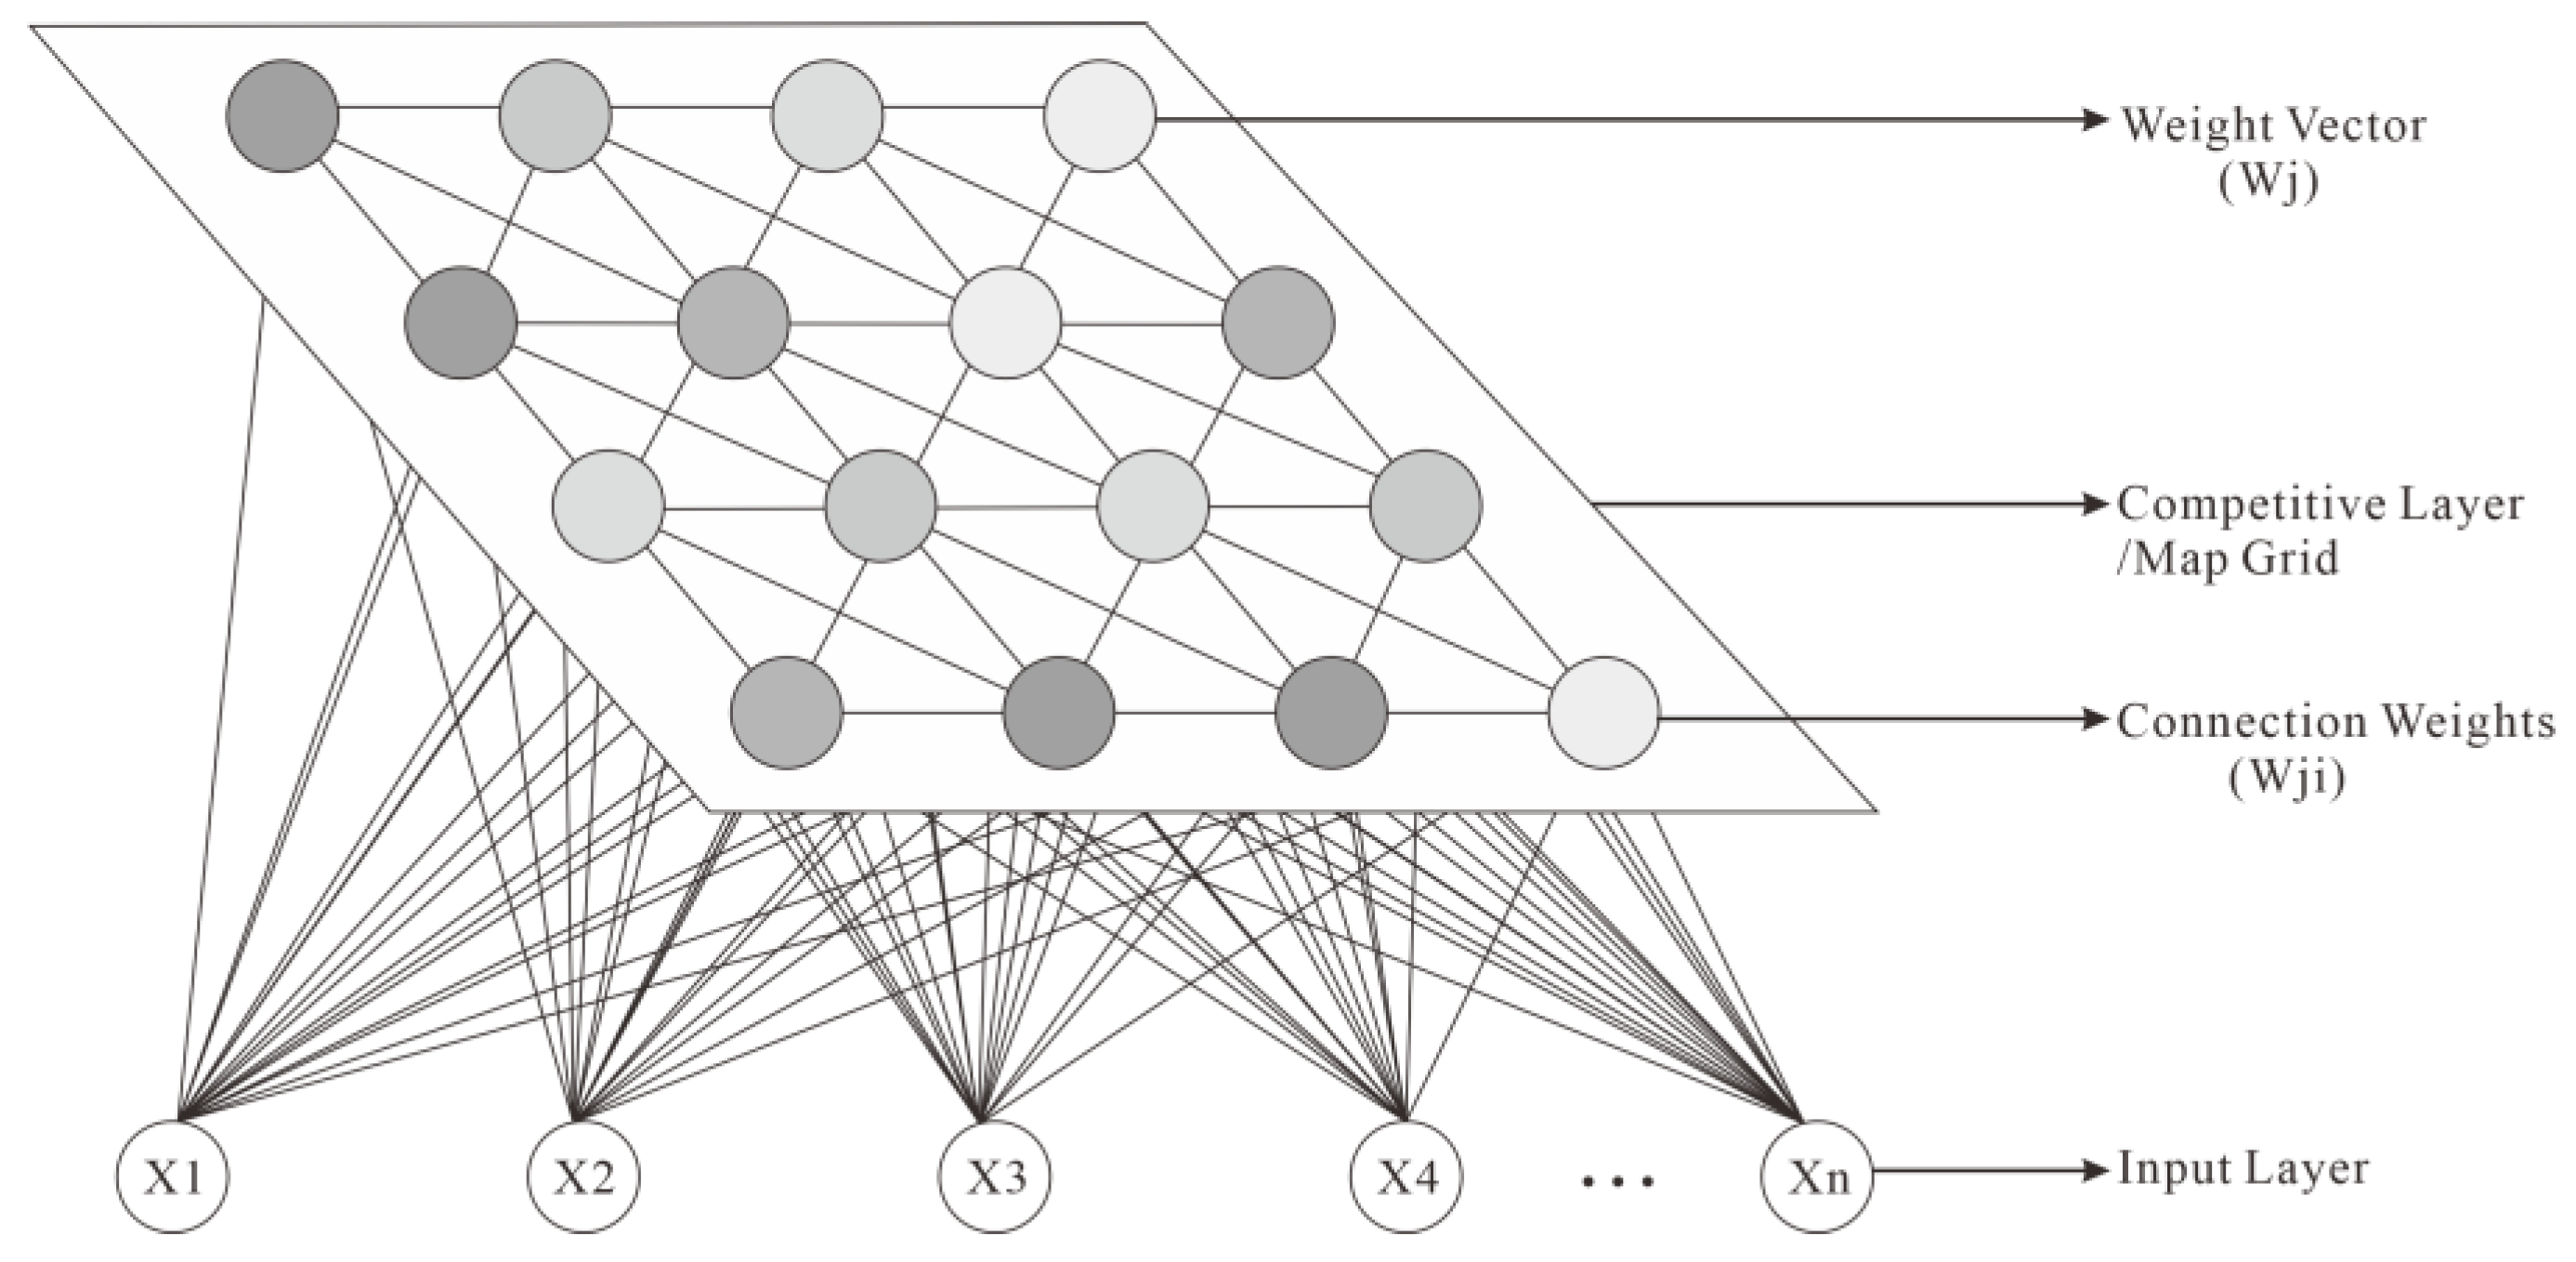
4.2. SOM-Based Seismic Attribute Clustering Analysis

Seismic attribute analysis can effectively predict sandbody distribution, but numerous studies have demonstrated that single seismic attributes exhibit low correlation coefficients with drilled sandstone thickness, making it challenging to achieve precise interpretations for thin-layer sandbodies. To address this limitation, an optimized fusion approach for seismic attributes is adopted to enhance their correlation with sandstone thickness [92].
The key to thin-layer sandbody characterization lies in effective sandbody identification. Self-Organizing Maps (SOM), an unsupervised neural network method, is widely utilized in seismic attribute analysis for feature extraction, clustering, and visualization. By extracting multiple attributes representing geological characteristics and applying SOM to cluster attributes with similar data features, a three-dimensional spatial visualization of attribute “hollow maps” can be generated, significantly improving sandbody boundary identification [93]. Combined with high-resolution seismic inversion techniques, this approach reduces the interpretative ambiguity in seismic inversion, thereby enhancing the precision of sandbody boundary delineation [94].
The primary workflow involves seismic attribute optimization and SOM network configuration. In this study, five interbedded seismic attributes were extracted from the 2nd sand layer of the Dong’erxia Subsection in the Huanghekou Sag: Root Mean Square Amplitude (RMS), Total Energy (TE), Average Energy (AE), Amplitude Envelope (ENV), and Peak Amplitude (PA). These attributes exhibit strong correlations with sandstone thickness [95]. A rectangular network structure was selected for SOM, comprising two neural layers: an input layer and a competitive layer. The competitive layer adopted a 10 × 10 grid structure, containing 100 neurons. Each neuron in the grid occupies a specific spatial position [96]. The five optimized attributes were assigned as inputs to the network, with each neuron receiving a five-dimensional input vector corresponding to the five seismic attributes. When an input is presented, the neuron with the smallest Euclidean distance to the input vector is designated as the winner (WTU) (Figure 8) [97]. This is determined by calculating the distance between the weight vectors (W) of all neurons and the input vector (X):
d j = i = 1 N ( W j i X i ) 2
dj: The distance between the weight vectors (Wji) and input vectors (Xi)
Wji = (W11, W22, ..., Wpn), j = 1, 2, ..., p,i=1, 2, ..., n (where p is the total number of neurons in the network) represents an ordered sequence of weight values, forming an internal representation of the neural network
Xi = (x1, x2, ..., xn),i=1, 2, ..., n denotes an ordered input sequence, where each seismic attribute can be viewed as an independent coordinate axis in the data space.
The competitive learning mechanism ensures that the winning neuron and its neighboring neurons adjust their weights iteratively, thereby preserving the topological relationships within the input data. The two-dimensional grid of the competitive layer represents the topological structure after dimensionality reduction, with Wji serving as the corresponding image of Xi [98]. The winning neuron and its neighboring neurons adjust their weight vectors to approach the input data, a process controlled by a neighborhood function (typically implemented using the Mexican Hat Wavelet, also known as the Ricker wavelet) [99]. The mathematical expression of this neighborhood function is as follows.
Λ ( r ) = e d 2 2 σ 2
ʌ: Neighborhood weight
r: Neighborhood radius
σ: Controls the decay rate (larger σ results in smoother weight distribution)
d: Distance function (Manhattan distance is adopted due to its sparse dimensionality independence, strong robustness, and emphasis on local abrupt features).
Based on the distribution of each attribute across SOM neurons, the correlations between attributes are analyzed and optimized, where adjacent neurons represent regions with similar attribute combinations [100]. The color patterns and clustering results on the two-dimensional grid can indicate seismic facies associated with sand body boundaries, with each seismic facies possessing clear physical and geological significance [101].

4.3. Technical Workflow for Thin-Bedded Sandbody Boundary Delineation

For the Lower E3d2 Sub-member, an optimized analysis was conducted by integrating seismic facies characteristics and well logging data. Earthquake attributes insensitive to seismic facies were excluded, and those with similar data features were evaluated using correlation and clustering analysis to select optimal seismic attributes. Three types of seismic attributes capable of characterizing the distribution of thin sand bodies were extracted: envelope attributes, main peak attributes, and amplitude energy (Figure 9a). By examining individual attributes, boundaries were delineated using artificial intelligence-based SOM (Self-Organizing Map) clustering to group data with consistent features. Subsequently, well-seismic calibration was employed to determine the threshold for sand body distribution (Figure 9b). After hollowing out non-sand bodies, the spatial distribution of the Lower Member of the Second East Sandstone Formation was sculpted (Figure 9(c-1)). This approach enhances the visibility of beach-bar sand body distribution and provides clearer identification and delineation of sand body edges compared to using single attributes alone.
The attribute hollowing-out map of the Lower E3d2 Sub-member (Figure 9(c-1)) reveals that the study area can be primarily divided into three regions: red, yellow, and green. The number of colors corresponds to the identified clustering types. Based on potential sedimentary environments, green is defined as areas with thin sand bodies near the sandstone pinch-out boundaries, red represents thicker sand bodies marking the main body of the beach-bar, and yellow indicates a transition zone where sand body thickness gradually decreases. Sandstones are concentrated in the southern part of the central strike-slip zone, the central uplift zone, and the development of the northwestern sub-sag, exhibiting sheet-like and domal distributions overall.
SOM-based seismic multi-attribute clustering and waveform inversion analysis reveal significant amplitude anomalies on both the east and west sides of the key area, with the anomalies extending in a north-south direction. The central and northern parts exhibit weak amplitudes. Inversion slices show high-resistance anomaly features in the northern parts of well areas C3-1-a and C4-3-a, as well as in the northern part of well area C4-3-a, with irregular dome-shaped boundaries of the anomaly zones. Combining single-well data and geological understanding, waveform inversion was used to predict the cumulative thickness of the Lower E3d2 Sub-member, resulting in a thickness map of sandbody distribution (Figure 9(c-2)). Sandstone layers have developed in the southern part of the central strike-slip zone, the central uplift zone, and the northwestern sub-sag, with thicknesses ranging from 4 m to 12 m. Thick sandbodies are concentrated near wells B8-2-a and C4-4-b in the eastern part of the study area, extending in a near NE-SW direction, while the southwestern part has a large sandbody distribution area with thinner thicknesses (4–8 m) and a sheet-dome shape. The sandbody distribution range is consistent with the structural highs on the top surface map of the Lower E3d2 Sub-member, indicating the potential for oil and gas exploration in the target area.
The inversion thickness map shows that the sandbody thicknesses in well areas C3-1-a, C4-3-a, and B8-2-a are relatively thick and gradually thin out toward the surrounding areas. The pinch-out lines of the sandstone thickness and the boundaries of the high-amplitude anomaly regions of the attributes show a high degree of coincidence. Based on the prediction of sandbody thickness, combined with litho-electric characteristics and seismic response features, three microfacies types of the beach-bar system in the HHK Sag are identified: bar body, beach body, and beach edge. The bar body has a sandbody thickness of approximately 8–14 m, the beach body 3–8 m, and the beach edge 0–3 m. The specific characteristics are shown in Figure 9d.
The integration of Self-Organizing Maps (SOM) machine learning theory and Seismic Meme Inversion (SMI) waveform inversion methodology addresses the limitations of low vertical resolution in seismic data volumes and multi-solution ambiguity in seismic interpretation. This fusion enables the precise delineation and identification of thin-layer sandbody boundaries under conditions of sparse well data.

5. Applications and Discussion

5.1. Geological and Geophysical Characteristics

During the Paleogene sedimentary period of the lower E3d2 Formation in the HHK Depression, the study area was situated within a lacustrine transgressive system tract (TST) characterized by braided-river delta-bar depositional systems. Quantitative analysis of individual sandbody dimensions (thickness and frequency) reveals that the thin-bedded beach-bar facies in the lower Ed2 Formation predominantly consist of gray, fine-grained feldspathic litharenite, lithic feldspathic sandstone, feldspathic sandstone, and litharenite, with localized siltstone interbeds (Figure 10a). The lower Ed2 member of the Paleogene succession in the study area exhibits a distinctive stratigraphic architecture characterized by thin-bedded sandstone packages intercalated within thick mudstone sequences (Figure 10a). Individual sandstone beds range from 3 to 8 m in thickness, typically comprising 1–2 discrete layers vertically separated by mudstone intervals exceeding 100 m in cumulative thickness. This vertical stacking pattern manifests a “thin-bedded sandstone-thick mudstone” alternation, indicative of low accommodation/sediment supply conditions.
The quartz content within the sand bodies ranges from 29.0% to 46.0% (average: 36.2%), while feldspar content varies from 29.0% to 41.0% (average: 34.8%). The proportion of lithic fragments falls between 25.0% and 33.0% (average: 29.75%). The cumulative probability curve exhibits a segmented pattern of two to three segments, with an average particle size (Mz) of 0.474 mm and a skewness (Sk) of 0.922. The saltation fraction content ranges from 30% to 50%, while the suspension fraction content exceeds 50%. The phi (ϕ) value at the intersection between the saltation and suspension fractions ranges from 2.5 to 3.5, indicating that the fine cutoff point skews toward finer sizes. This suggests a reduced proportion of the saltation fraction and a greater overall content of suspension, indicative of pronounced suspension sedimentation and wave action (Figure 10b). The sorting of particles is classified as good to moderate, while the roundness ranges from moderate to sub-rounded, with grains primarily exhibiting point-to-line contacts (Figure 10c).
Thick-layered beach-bar sand bodies typically display natural potential (SP) and natural gamma (GR) curves characterized by large amplitude and exhibiting funnel-shaped or boxy profiles. Conversely, thin-layered beach-bar sand bodies present natural potential (SP) curves with medium to low amplitudes, displaying finger-like profiles, while the natural gamma (GR) curves reveal a fine-toothed, finger-like configuration (Figure 10d). The seismic facies of the beach-bar deposits within the study area are characterized by moderate to good continuity, with parallel to subparallel reflector configurations and medium to strong amplitude reflections. Thicker sand bodies exhibit seismic facies distinguished by high continuity and strong amplitude reflections, whereas thinner sand bodies demonstrate seismic facies characterized by moderate continuity and medium strength amplitude reflections (Figure 10e).

5.2. Results of Rock Physics Analysis

This study investigates a 3D seismic survey area (400 km2) with 23 wells distributed unevenly. To assess the validity of the waveform indicator inversion algorithm under sparse-well conditions, we conducted an inversion experiment using an uneven well network: 12 wells were selected for inversion (training set), while 11 wells served as independent validation data (Table 2, Figure 11c).
Pearson’s correlation coefficient was used to separately compute correlation values between well log-derived and inversion-predicted sandstone thicknesses for both the participant and verification wells (Figure 11a). The P-wave impedance inversion results (Figure 11b) demonstrate strong consistency with both the training and validation wells, yielding high correlation coefficients (R2 = 0.927 for training wells, R2 = 0.821 for validation wells).
The inversion successfully resolves thin sandstone layers (3–8 m) and accurately captures their lateral variations, as evidenced by the clear identification of layer boundaries in the impedance profile, consistency between predicted sandstone thickness (from inversion) and log-derived measurements, and effective delineation of lateral facies transitions matched by seismic reflectivity patterns. These results confirm that the waveform indicator inversion method provides reliable lateral resolution (≥3 m) for lithological characterization in complex reservoirs with sparse well coverage.
To further validate the precision of the waveform-based inversion method in identifying thin sandstone layers, we extracted well-site curves using well C4-3-a as an example (Figure 12). The first purple curve in Figure 12 represents the measured DT curve, the second blue curve corresponds to the measured GR curve, and the third curve (IMP) is the inversion result. The inversion-derived wave impedance profile (waveform indicator inversion result) shows high consistency with the measured curves. By applying a sandstone discrimination threshold, the lithological interpretation of the inversion results aligns well with the actual well logging interpretations, accurately identifying sandstones with thicknesses of 1.8–3.0 m (Figure 12).

5.3. Cross-Section Inversion Results

A comparative analysis of well-linked cross-sections and inversion profiles in the Lower Second Member of the Dongying Formation reveals that, due to boundary constraints in the study area, sandbody boundaries extend outward, and thin sand layers (3–8 m) are stably distributed. The inversion profile clearly delineates effective sandbodies in individual wells, with accurate prediction of sandbody pinchouts (Figure 13).
Petrophysical analysis and application results demonstrate that the seismic waveform-indicated inversion technique can identify 1.8–3.0 m-thick thin sandstone layers, with a mean match rate of 90.2% (95% CI: 87.5–92.7%, n = 12) for participating wells and 81.5% (95% CI: 76.8–85.3%, n = 11) for validation wells, based on bootstrap resampling with 1000 iterations. Additionally, the waveform-based facies-controlled constrained inversion exhibits robustness to well distribution constraints, as evidenced by spatial cross-validation results, while maintaining geological consistency.
To address the uncertainty in thin-layer sand body prediction, this study attempts to integrate waveform-indicated inversion with SOM. By employing facies-controlled inversion and uncertainty propagation analysis, the goal is to control reservoir prediction errors within 10%, enhance vertical resolution, improve thin-layer identification accuracy, and reduce ambiguity in thin-layer predictions. However, significant room for innovation remains. Future efforts could further explore deep learning domains and real-time uncertainty feedback mechanisms to enhance exploration reliability under complex geological conditions.

5.4. Planar Sedimentary Microfacies

Through the integrated application of geological understanding with SOM multi-attribute optimization and waveform-indicated inversion techniques, a detailed characterization of beach-bar sedimentary microfacies in the Lower E3d2 Sub-member of the study area was conducted, identifying three microfacies types: bar body, beach body, and beach edge. Two distinct patterns emerge in microfacies boundary delineation: a sparsely drilled area in the western sector and a relatively well-drilled region in the eastern sector of the focus area.
Based on geological characteristics and depositional system analysis, the eastern sector primarily employs well-controlled waveform-indicated inversion for microfacies boundary characterization. This approach involves: determining microfacies types at well locations through single-well facies analysis combined with logging facies characteristics, supported by sandstone core samples and lithological analysis; delineating sandbody extension boundaries using inversion profiles to objectively represent sedimentary microfacies distribution.
For the western low-well-density area, a comprehensive methodology was implemented. Geological–seismic attribute analysis guided the creation of SOM-processed attribute hollow maps for the Lower E3d2 Sub-member. Seismic characteristics from drilled areas were analogously applied to undrilled zones. Integrated analysis incorporating geological data, acoustic impedance inversion, and SOM multi-attribute optimization established micro-facies assemblage relationships of beach-bar sandbodies, enabling effective sedimentary microfacies characterization in the undrilled western sector.
The planar distribution characteristics of the beach-bar sedimentary microfacies are as follows:
Eastern Beach-bar: Near the B8-2-a well at the northern boundary, the sandbody is relatively thick and the bar body is well-developed, with the same extension direction as the western beach-bar. The outer beach body extends in the SW-NE direction along the direction of lake wave reworking. One large-scale and two small-scale beach bodies develop to the south, with the beach edge surrounding the beach body in a south-north strip-like distribution (Figure 14).
Western Beach-bar: Near the C3-1-a well, the sandbody is relatively thick and the bar body is well-developed, showing an enhanced northward extension trend. A large-scale beach body is present in the form of a wide strip, and a smaller-scale beach body is developed in the north in the form of a narrow strip. The beach edge develops around the beach body, showing a near-NS strip-like distribution (Figure 14).

6. Conclusions

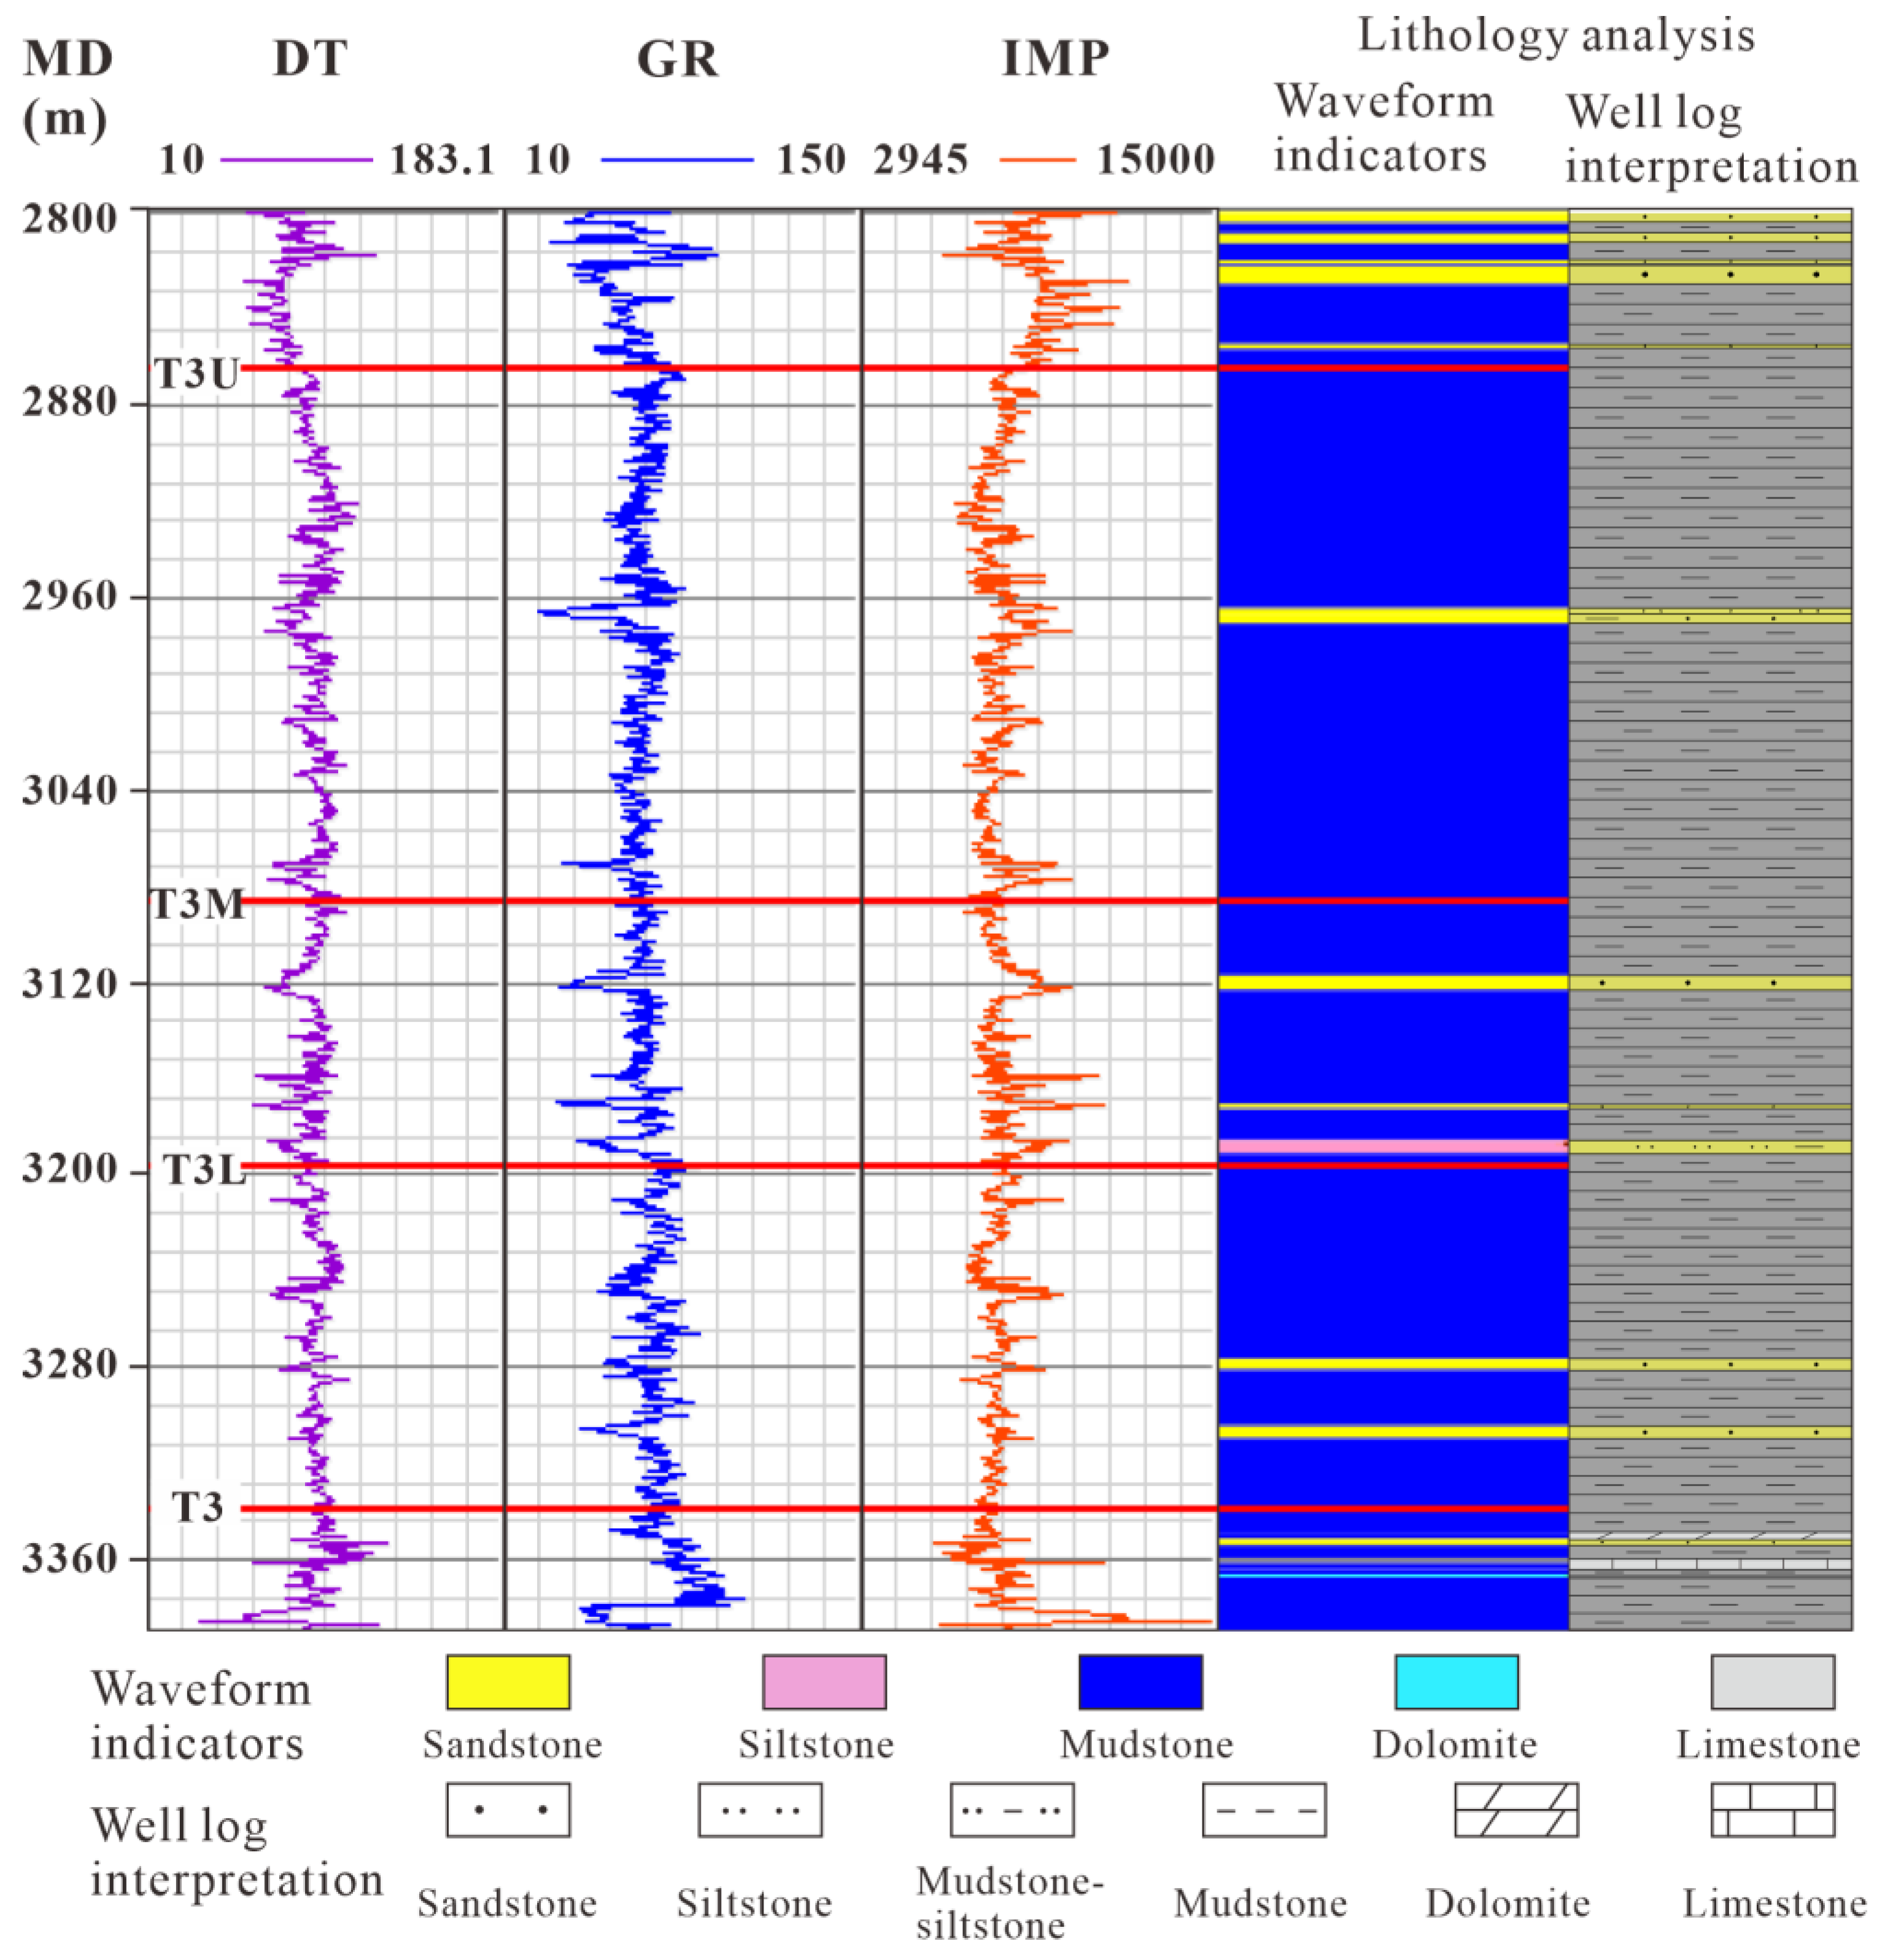
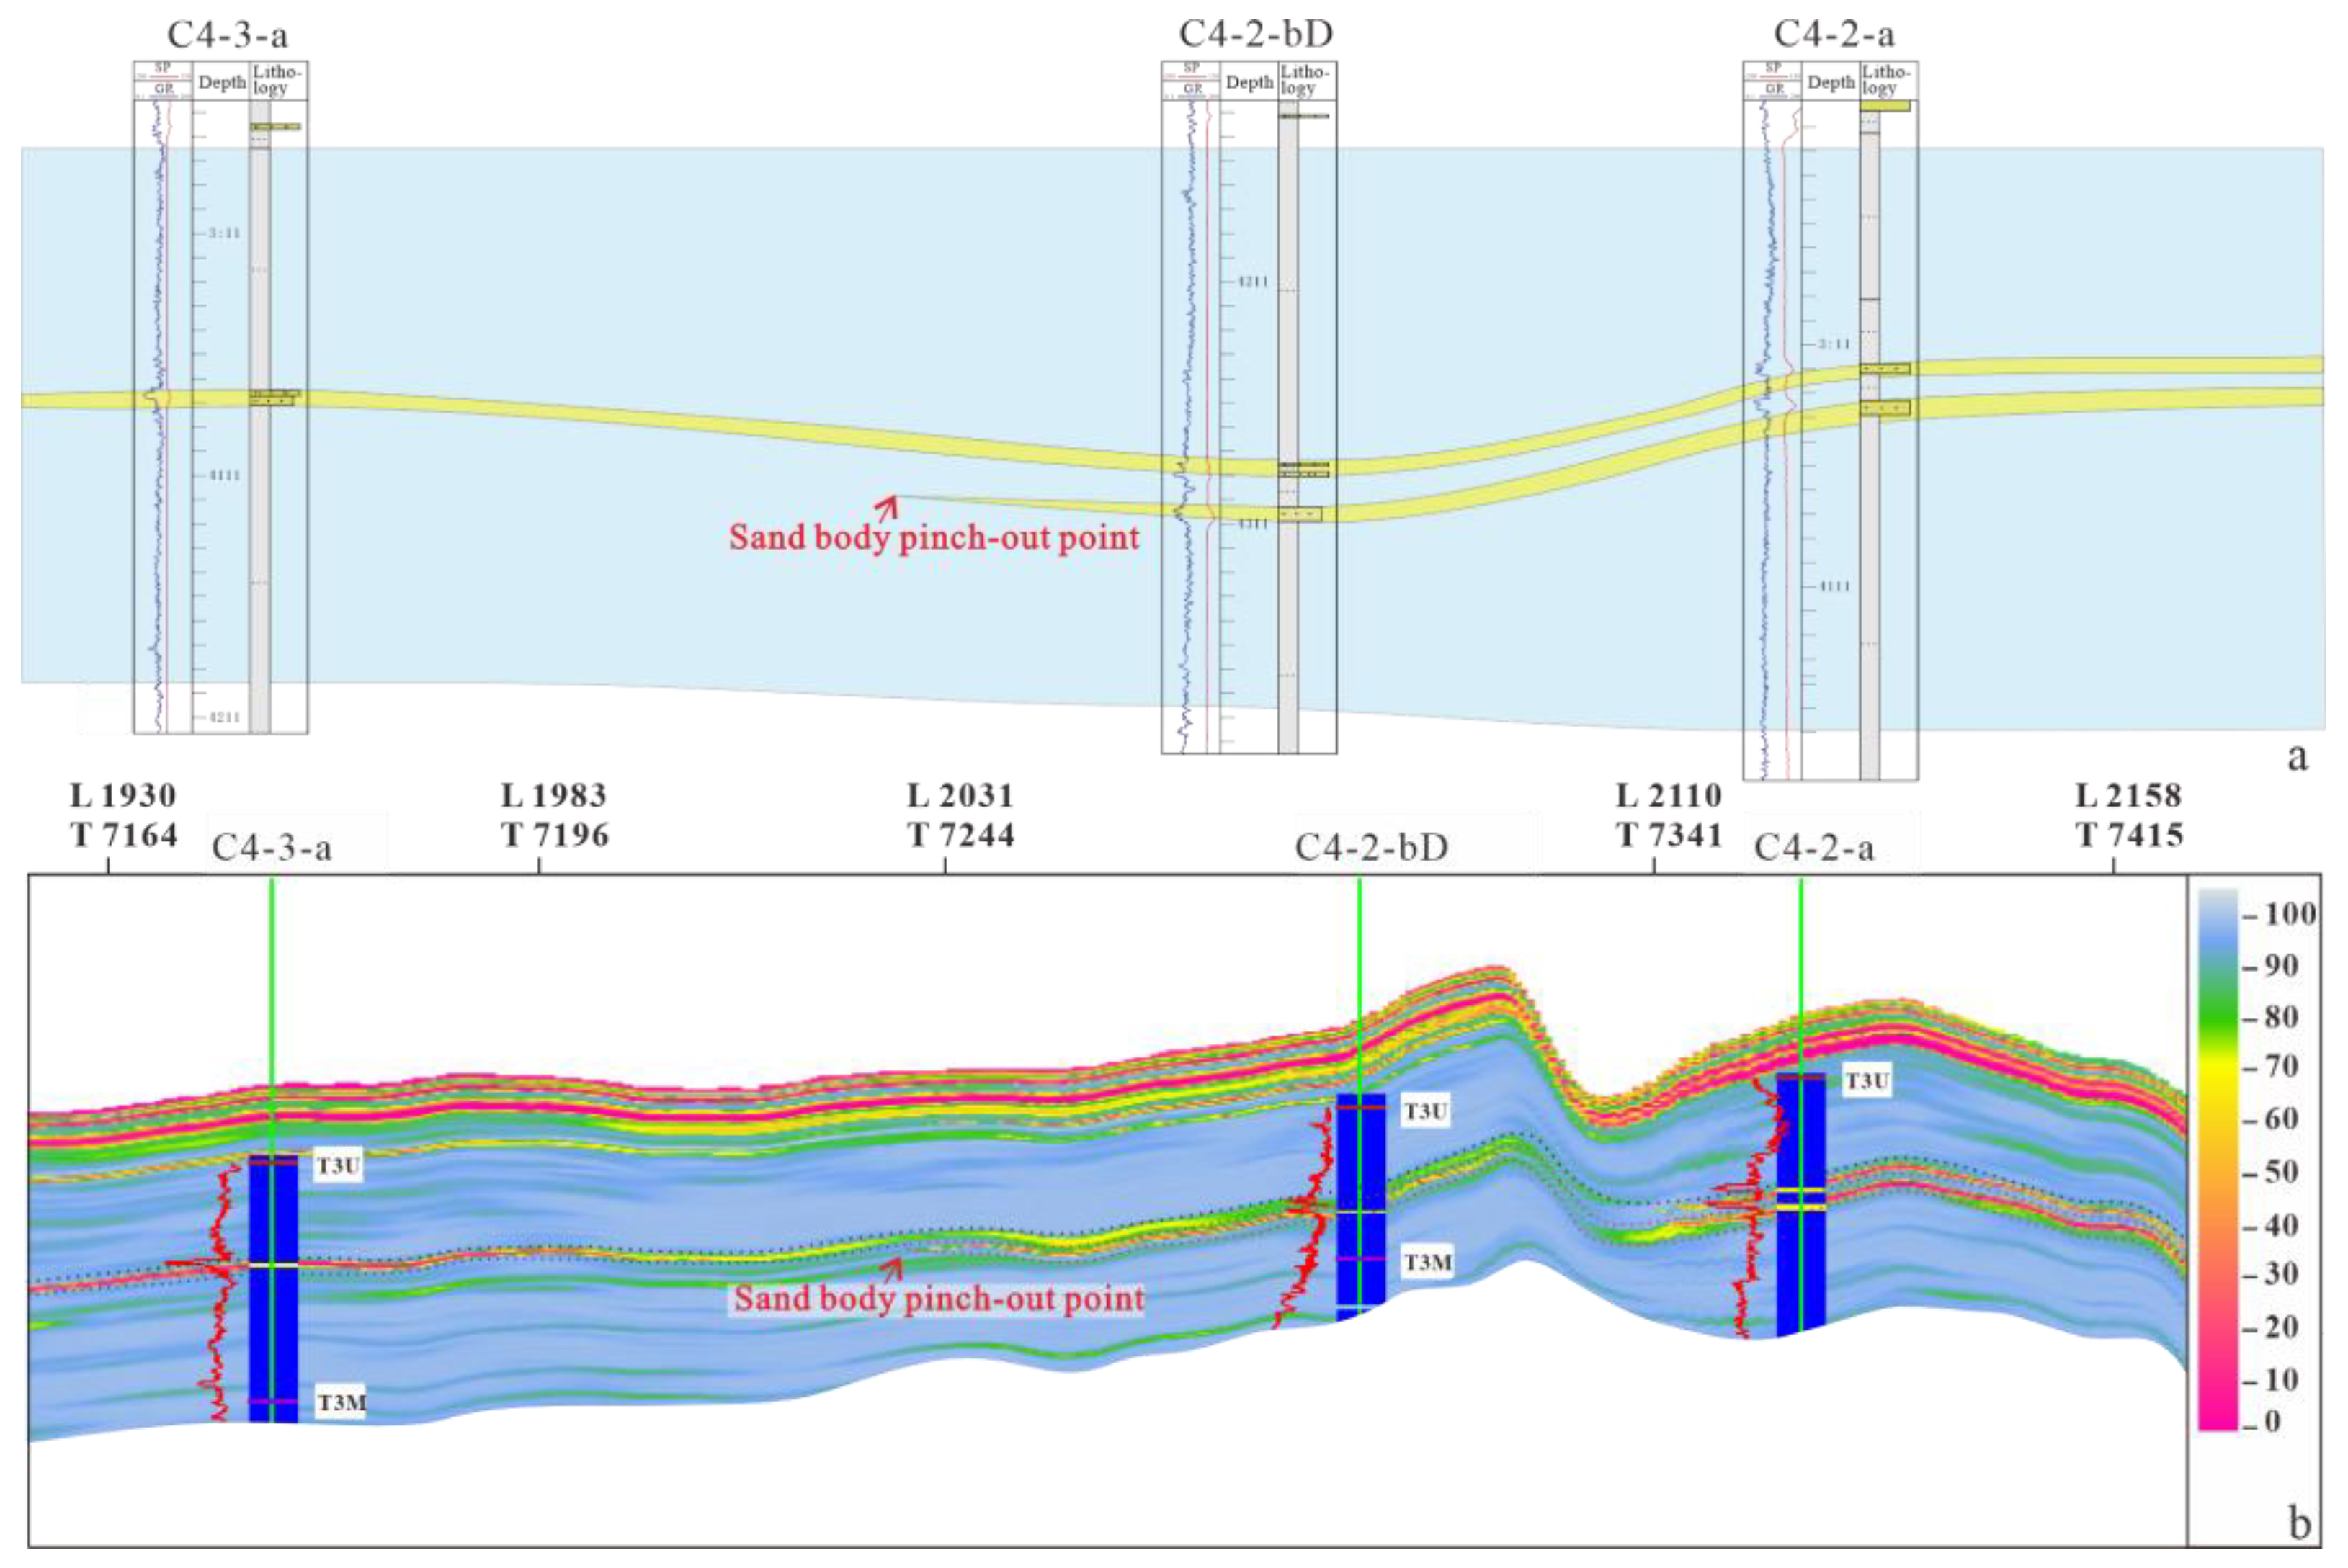
  • The lithological types in the study area predominantly consist of sandstone, siltstone, mudstone, limestone, and dolomite. A single logging curve is inadequate for reservoir identification. Therefore, a lithology indicator curve was developed to effectively identify sandstone, utilizing a cutoff value of less than 83. Subsequently, seismic waveform inversion was employed to predict thin sand bodies, which can be identified vertically at depths of 3 to 8 m and laterally with distinct boundaries. The validation results of the inversion demonstrate a coincidence rate exceeding 90% with the participating wells and over 80% with the verification wells.
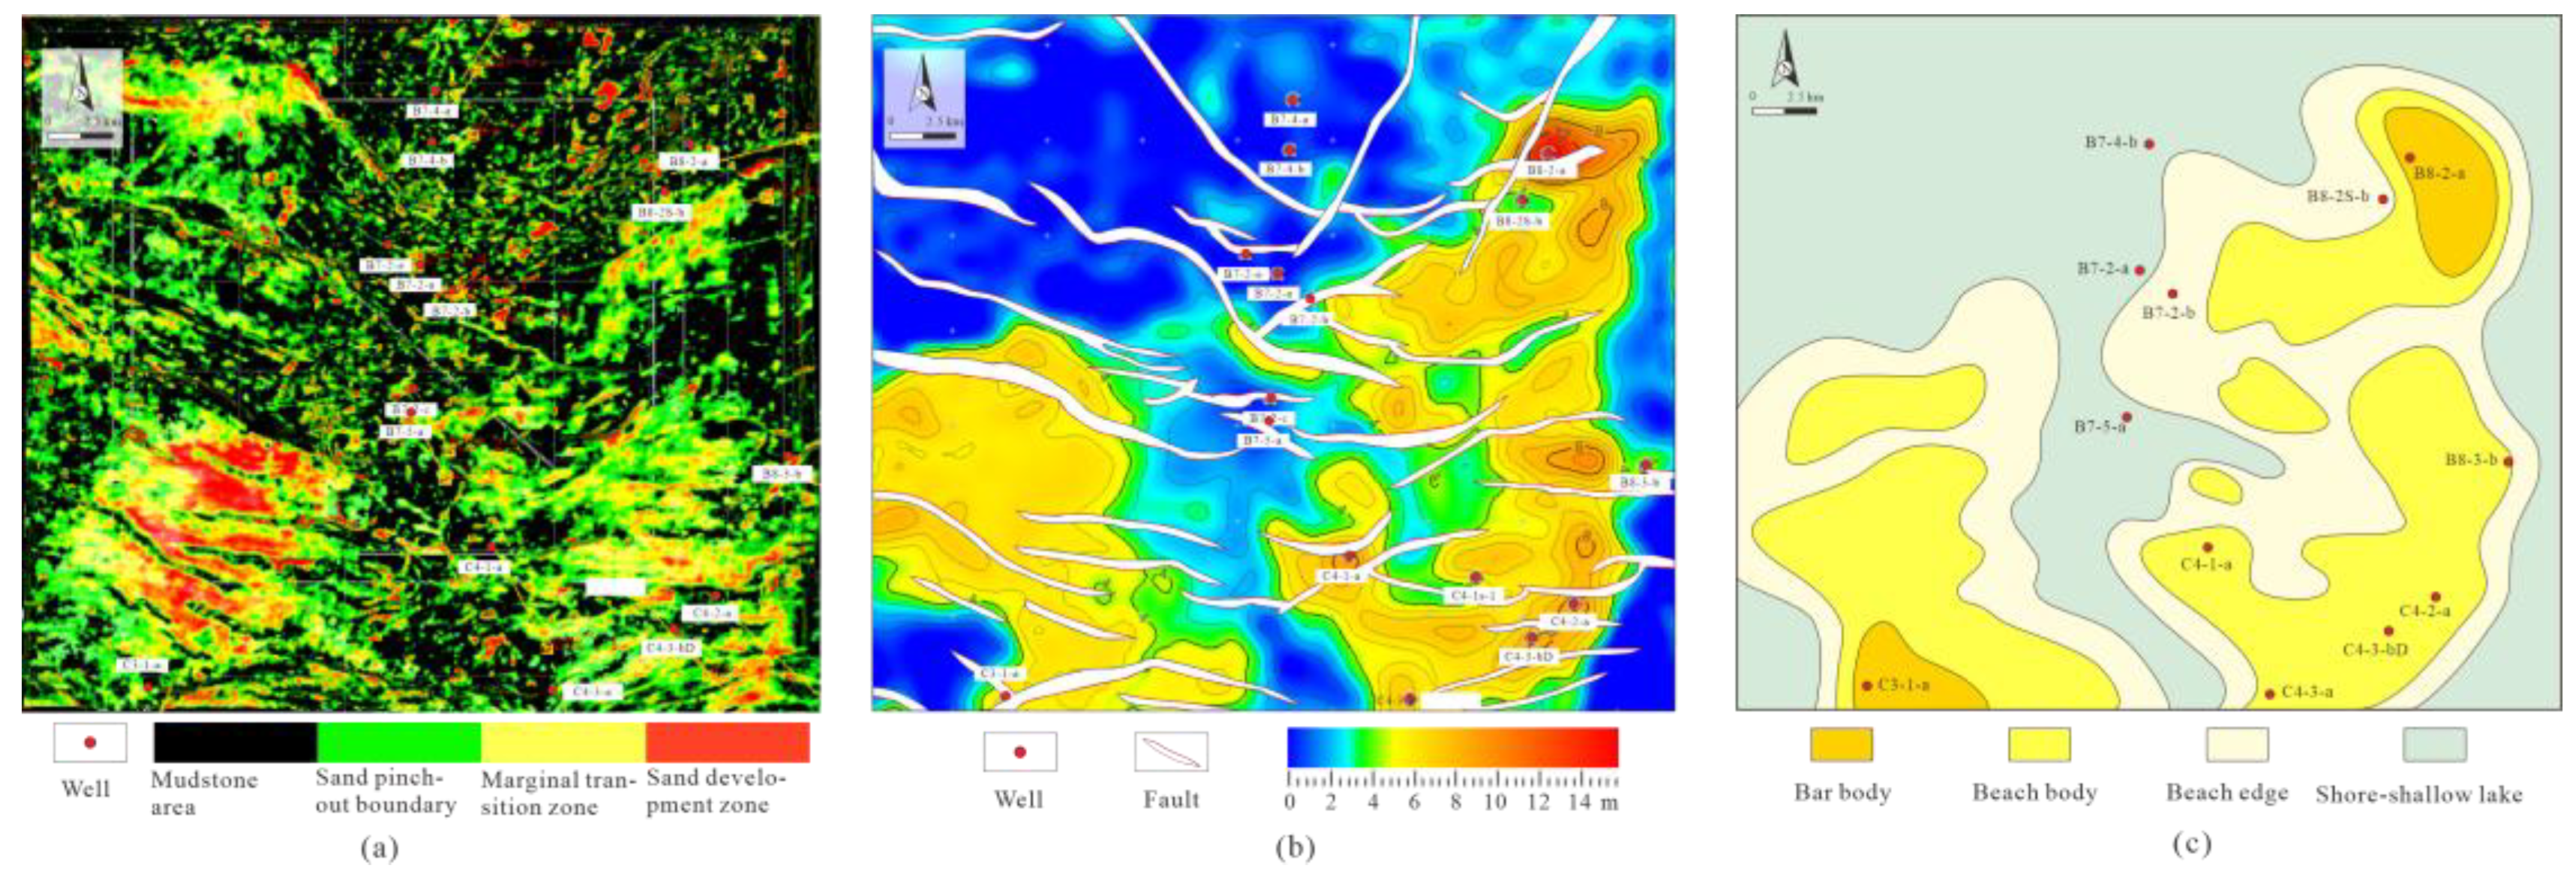
  • Guided by seismic sedimentary theory, a Self-Organizing Map (SOM)-based multi-attribute optimization analysis was conducted utilizing three seismic attributes sensitive to lithological characteristics: Root Mean Square Amplitude (RMS), Total Energy (TE), Average Energy (AE), Amplitude Envelope (ENV), and Peak Amplitude (PA). SOM operations were employed for correlation and clustering analyses to identify a subset of data that reflects lithological features. In conjunction with well-seismic calibration, a threshold for sandstone distribution was established, non-sandstone areas were excluded, and a spatial hollowing-out map of the Lower Member of the Second East Sandstone Formation was produced. The visual representation of this map, in comparison to single attributes, emphasizes the distribution of beach-bar sand bodies and facilitates clearer identification and delineation of the sandbody edges.
  • Seismic waveform inversion, which embodies phase-controlled principles, operates independently of the quantity and distribution of wells. The Self-Organizing Map (SOM) algorithm is effectively employed for comprehensive attribute clustering analysis. The integration of these two techniques in the study of beach-bar microfacies within the Lower Member of the Second East Sandstone Formation in the HHK Depression reveals a strong correlation between sandstone thickness pinch-out lines and the boundaries of attribute amplitude anomalies. By predicting sandbody thickness through waveform inversion and integrating litho-electric characteristics with seismic responses, three microfacies types are delineated: bar body, beach body, and beach edge. The thickness of the bar body sandbody is approximately 8 to 14 m, the beach body ranges from 3 to 8 m, and the beach edge measures between 0 and 3 m.
  • Guided by geological principles and seismic sedimentology theory, high-resolution waveform indicator inversion is employed in well-controlled areas to enhance the accuracy of thin-sandstone predictions. In regions lacking well control, Self-Organizing Map (SOM) based seismic attribute clustering mitigates the limitations of inversion precision by clarifying the spatial distribution of sand bodies. This integrated methodology addresses two critical challenges in seismic interpretation: the low vertical resolution of seismic data and the complexities associated with lithological identification. By combining the high-resolution capabilities of waveform inversion with the pattern recognition advantages of SOM clustering, this approach offers a novel solution for predicting thin sandstones and delineating boundaries in sparsely sampled areas.

Author Contributions

J.W.: Contribution roles: Resources, Writing-original draft and writing-review and editing. J.W. is a main author responsible for the overall coordination and organization of the paper. He arranged the requirements of the case study, ensuring that all necessary information and data were captured. D.G.: Contribution roles: Resources, Supervision. D.G. is a senior field engineer in oilfield operations who provided on-site technical supervision throughout the research process. He offered his experience and ensured the academic approach was followed in the study. X.H.: Contribution roles: Resources, Supervision. X.H. is a field data management specialist who supervised the standardization and quality control of datasets. He implemented robust data governance frameworks compliant with petroleum engineering practices. Y.H.: Contribution roles: Investigation, supervision and writing-original draft. Y.H. is the academic supervisor who provided guidance and oversight throughout the research process. He offered his experience and ensured the academic approach is followed in the study. H.L.: Contribution roles: Investigation, Resources, Formal analysis. H.L. a core researcher and was responsible for technical analysis of the project. W.X.: Contribution roles: Investigation and Resources. W.X. contributed through the application of proprietary diagnostic tools for in-situ petrophysical parameter evaluation. R.L.: Contribution roles: Investigation and Data curation. R.L.’s industry experience provided operational insights for data interpretation and validated technical assumptions against practical engineering constraints. B.F.: Contribution roles: Investigation, Resources, Writing-Review and Editing. B.F. conducted a systematic literature review and revised the manuscript to ensure compliance with academic standards in content and formatting. All authors have read and agreed to the published version of the manuscript.

Funding

This research was funded in part by a grant from the National Key Technologies R & D Program of China during the 14th Five-Year Plan Period (No. CCL2022TJT0NST1867) and The National Natural Science Foundation of China (grants No. 42272115 and 42272113).

Institutional Review Board Statement

Not applicable.

Informed Consent Statement

Not applicable.

Data Availability Statement

The original contributions presented in the study are included in the article, further inquiries can be directed to the corresponding author.

Acknowledgments

We would like to extend our gratitude to CNOOC (China) Tianjin Branch Bohai Petroleum Research Institute for their invaluable administrative and technical support, which facilitated the completion of this study. Additionally, we appreciate the kind donations of experimental materials provided by School of Geosciences, Yangtze University, without which the research would not have been possible.

Conflicts of Interest

Author D.G.; X.H; W.X.; R.L. was employed by the company CNOOC China Limited Tianjin Branch. The remaining authors declare that the re-search was conducted in the absence of any commercial or financial relationships that could be construed as a potential conflict of interest.

References

  1. Pan, S.; Chen, B.; Liu, H.; Li, X.; Zhao, Z.; Lin, T.; Zhang, Q. Deepwater Bottom Current Rework Sand (BCRS) in Lacustrine Basins:Sedimentary Characteristics, Identification Criterion, Formation Mechanism and Its Significance for Unconventional Oil/Gas Exploration. Nat. Gas. Geosci. 2014, 25, 1577–1585. [Google Scholar]
  2. Zhu, R.; Sun, L.; Zhang, T.; Zhang, Z.; Shen, A.; Mao, Z.; Wang, Z.; Ren, Y.; Jiang, H.; Zhang, S.; et al. Advances and Trends in Sedimentological Research in Oil and Gas Exploration and Development in China. Acta Sedimentol. Sin. 2025, 43, 1–19. [Google Scholar]
  3. Zou, C.N.; Zhang, G.S.; Yang, Z.; Tao, S.Z.; Hou, L.H.; Zhu, R.K.; Yuan, X.J.; Ran, Q.Q.; Li, D.H.; Wang, Z.P. Geological concepts, characteristics, resource potential and key techniques of unconventional hydrocarbon:on unconventional petroleum geology. Pet. Explor. Dev. 2013, 40, 385–399. [Google Scholar] [CrossRef]
  4. Jia, C.; Zhang, M.; Zhang, Y. Unconventional hydrocarbon resources in China and the prospect of exploration and development. Pet. Explor. Dev. 2012, 39, 129–136. [Google Scholar] [CrossRef]
  5. Peng, B.; Han, J.; Xie, X.; Wang, L. Sedimentary succession and recognition marks of lacustrine gravel beach-bars, a case study from the Qinghai Lake, China. Open Geosci. 2020, 12, 59–70. [Google Scholar] [CrossRef]
  6. Karlonienė, D.; Pupienis, D.; Jarmalavičius, D.; Dubikaltinienė, A.; Žilinskas, G. The Impact of Coastal Geodynamic Processes on the Distribution of Trace Metal Content in Sandy Beach Sediments, South-Eastern Baltic Sea Coast (Lithuania). Appl. Sci. 2021, 11, 1106. [Google Scholar] [CrossRef]
  7. Tissot, B.P.; Durand, B.; Espitalie, J. Influence of nature and diagenesis of organic matter in formation of petroleum. AAPG Bull. 1974, 58, 499–506. [Google Scholar]
  8. Zhao, X.; Pu, X.; Zhou, L.; Jin, F.; Han, G.; Shi, Z.; Han, W.; Ding, Y.; Zhang, W.; Wang, G.; et al. Enrichment theory, exploration technology and prospects of shale oil in lacustrine facies zone of deep basin:a case study of the Paleogene in Huanghua depression, Bohai Bay Basin. Acta Pet. Sin. 2021, 42, 143–162. [Google Scholar]
  9. Li, M.; Ma, M.; Jin, Z.; Li, Z.; Jiang, Q.; Wu, S.; Li, Z.; Xu, Z. Diversity in the lithofacies assemblages of marine and lacustrine shale strata and significance for unconventional petroleum exploration in China. Oil Gas Geol. 2022, 43, 1–25. [Google Scholar]
  10. Hou, D.; Han, G.; Chen, S.; Zhang, S.; Liang, X. A Study on a Novel Production Forecasting Method of Unconventional Oil and Gas Wells Based on Adaptive Fusion. Processes 2024, 12, 2515. [Google Scholar] [CrossRef]
  11. Xu, X.; Feng, Q.; Wei, Q.; Yang, S.; Zhang, J.; Pang, Q.; Zhu, Y. Sedimentary characteristics and reservoir origin of the mound and shoal microfacies of the Ma51+2 submember of the Majiagou Formation in the Jingbian area. J. Pet. Sci. Eng. 2021, 196, 108041. [Google Scholar] [CrossRef]
  12. Li, Q.; You, X.; He, Y.; Zhou, Y.; Tang, R.; Li, J. The Sequence Stratigraphy and Sedimentary Evolution of the Guantao Formation in the Binxian Uplift Area, Bohai Bay Basin, China. Appl. Sci. 2024, 14, 2518. [Google Scholar] [CrossRef]
  13. Casey, J.S.; Shuhab, D.K.; Janok, P.B.; Craig, G.; Darsel, S. Thin-bedded reservoir analogs in an ancient delta using terrestrial laser scanner and high-resolution ground-based hyperspectral cameras. Sediment. Geol. 2016, 342, 154–164. [Google Scholar]
  14. Peng, B.; Ye, S. Sedimentary Succession and Model of Gravel Beach-Bars in The Southeastern Qinghai Lake. IOP Conf. Ser. Earth Environ. Sci. 2019, 300, 022156. [Google Scholar] [CrossRef]
  15. Gan, L.; Dai, X. Seismic Characterization Technology and Practice in the Hydrocarbon Reservoirs. Petroleum industry press: Beijing, China, 2023; pp. 1–20. [Google Scholar]
  16. Huang, X. Review on extension of geophysical technology to reservoir development and road ahead. Geophys. Prospect. Pet. 2025, 64, 15–31. [Google Scholar]
  17. Pei, J.; Guo, L.; Liu, G.; Liu, F.; Wu, Q. Reservoir characteristics and seismic identification techniques for shallowgas reservoirs in the South China Sea. Comput. Tech. Geophys. Geochem. Explor. 2025, 47, 222–231. [Google Scholar]
  18. Wang, X.; Wang, J.; Chen, F.; Ren, G.; Liu, L.; Du, Y.; Lin, J. Overview and Analysis of Several Common Spatial Interpolation Analysis Methods in Watershed Ecological Environment Analysis. Territ. Nat. Resour. Study 2025, 76–80. [Google Scholar]
  19. Lin, X.; Cheng, G.; Lu, L. Comparison of spatial interpolation methods. Adv. Earth Sci. 2000, 260–265. [Google Scholar]
  20. Langer, P.; Sepahvand, K.; Guist, C.; Bär, J.; Peplow, A.; Marburg, S. Matching experimental and three dimensional numerical models for structural vibration problems with uncertainties. J. Sound Vib. 2018, 417, 294–305. [Google Scholar] [CrossRef]
  21. Song, F.; Su, N.; Yang, S.; Yao, R.; Chu, S. Sedimentary characteristics of thick layer lacustrine beach-bars in the Cenozoic Banqiao Sag of the Bohai Bay Basin, East China. J. Asian Earth Sci. 2018, 151, 73–89. [Google Scholar] [CrossRef]
  22. He, J.; Wang, H.; Jiang, T.; Liu, E.; Chen, S.; Jiang, P. Sedimentary Characteristics of Lacustrine Beach-Bars and Their Formation in the Paleogene Weixinan Sag of Beibuwan Basin, Northern South China Sea. Energies 2022, 15, 3391. [Google Scholar] [CrossRef]
  23. Yang, Y.; Kra, K.L.; Qiu, L.; Yang, B.; Ahmed, K.S.; Donald, K.K.A.; Qiao, Y.; Habulashenmu, Y. Elaborated Porosity and High-Quality Reservoirs in Deeply Buried Coarse-Grained Sediment: Insight of the Sublacustrine Sandy Conglomerates in the Eocene Shehejie Formation (Es4), Dongying Subbasin, Bohai Bay Basin, China. Appl. Sci. 2023, 13, 1347. [Google Scholar] [CrossRef]
  24. Ran, J.; Zhang, M.; Li, H.; Chen, J.; Zhu, Z.; Xing, H. Vertical resolution of broadband, wide-azimuth and high-density seismic data. Oil Geophys. Prospect. 2018, 53, 520–527. [Google Scholar]
  25. Ling Yun Study Group. Application of amplitude tuning in surveying geologic target thickness less than1/4wavelength. Oil Geophys. Prospect 2003, 38, 268–274. [Google Scholar]
  26. Li, P.; Wang, H.; Li, W.; Liu, S. Analysis on the spatial resolution in common offset gather of seismic data. Geophys. Prospect. Pet. 2013, 52, 452–456. [Google Scholar]
  27. Ajanaku, B.S.; Akintorinwa, O.J. Determination of gas reservoir (s) using AVO inversion within “XY” field offshore Niger Delta. Pet. Res. 2019, 4, 52–58. [Google Scholar] [CrossRef]
  28. Bashir, Y.; Kemerli, D.B.; Yılmaz, T.; Saral, M.; Göknar, E.C.; Korkmaz, E. Reconstruction of subsurface potential hydrocarbon reservoirs through 3D seismic automatic interpretation and attribute analysis. Phys. Chem. Earth 2024, 136, 103751. [Google Scholar] [CrossRef]
  29. Rangel Gavidia, J.C.; Furlan Chinelatto, G.; Basso, M.; da Ponte Souza, J.P.; Soltanmohammadi, R.; Campane Vidal, A.; Goldstein, R.H.; Mohammadizadeh, S.M. Utilizing integrated artificial intelligence for characterizing mineralogy and facies in a pre-salt carbonate reservoir, Santos Basin, Brazil, using cores, wireline logs, and multi-mineral petrophysical evaluation. Geoenergy Sci. Eng. 2023, 231, 212303. [Google Scholar]
  30. Wang, C.; Xue, Q.; He, Y.; Wang, Y.; Li, Y.; Qu, J. Lithological identification based on high-frequency vibration signal analysis. Measurement 2023, 221, 113534. [Google Scholar] [CrossRef]
  31. Dong, X.; Yang, D.; Zhu, H. Optimal Transport Map with Prescribed Direction Indicator for Seismic Full-Waveform Inversion. J. Geophys. Res. 2024, 129, e2023JB027342. [Google Scholar] [CrossRef]
  32. Huang, M.; Xu, L.; Zhu, Y.; He, Y.; Li, Z.; Lin, Y. Stochastic inversion method based on compressed sensing frequency division waveform indication prior. Front. Earth Sci. 2025, 12, 1505682. [Google Scholar] [CrossRef]
  33. Huang, M.; Xu, L.; Zhu, Y.; He, Y.; Li, Z.; Lin, Y. Analysis of seismic inversion imaging and its technical core issues. Geophys. Prospect. Pet. 2015, 54, 115–125. [Google Scholar]
  34. Chen, L.; Bai, X.; Li, J.; Ding, Y. 3D visualization and attribute analysis applied in seismic data interpretationof Doshan Area. Oil Geophys. Prospect. 2018, 53, 256–260. [Google Scholar]
  35. Xu, Y.; He, Y.; Bu, G.; Chen, L.; Liu, L.; Zhu, Y. Establishment of classification and evaluation criteria for tight reservoirs based on characteristics of microscopic pore throat structure and percolation: A case study of Chang 7 reservoir in Longdong area, Ordos Basin. Pet. Geol. Exp. 2019, 41, 451–460. [Google Scholar]
  36. Matilda, T.D.; Alba, M.R.; Pablo, L.H. Functional PCA and cluster analysis for determining temperature patterns in Chile. Theor. Appl. Climatol. 2025, 156, 186. [Google Scholar]
  37. Mohamed, H.E.; Mustafa, E.; Essam, A.M.; Hatem, S.R.; György, C.; Attila, K.; Péter, S. Application of stable isotopes, mixing models, and K-means cluster analysis to detect recharge and salinity origins in Siwa Oasis. Egypt Groundw. Sustain. Dev. 2024, 25, 101124. [Google Scholar]
  38. Yu, P. Applications of hierarchical cluster analysis (CLA) and principal component analysis (PCA) in feed structure and feed molecular chemistry research, using synchrotron-based Fourier transform infrared (FTIR) microspectroscopy. J. Agric. Food Chem. 2005, 53, 7115–7127. [Google Scholar] [CrossRef] [PubMed]
  39. Ma, J.; Liu, L.; Qi, Y.; Gong, F. Recognition of Sand Bodies Based on Their Characteristics and Lithology. Chem. Technol. Fuels Oils 2023, 59, 569–576. [Google Scholar] [CrossRef]
  40. Mahmoud, L.; Ahmed, A.R.; Amir, I.; Emad, A.E. Evidence for active generation and seepage of sub-salt natural gas/condensate blend in the east offshore Nile Delta, Egypt: Integrated geochemical, petrophysical and seismic attribute approaches. Pet. Sci. 2025, 22, 130–150. [Google Scholar]
  41. Qiu, L.; Wang, Y.; Hu, Y.; Zhao, H.; Chen, L. Modern sedimentation in the wave-dominated delta beach bar sedimentary system of the Fenghe River in Jiaonan, Qingdao. Arab. J. Geosci. 2020, 13. [Google Scholar] [CrossRef]
  42. Mohammed, A.M.; Szabó, P.N.; Abdelrhim, E.; Péter, S. An integrated workflow combining machine learning and wavelet transform for automated characterization of heterogeneous groundwater systems. Sci. Rep. 2025, 15, 4973. [Google Scholar] [CrossRef]
  43. Vahid, N.; Seyed, R.M.; Mohammad, R.R. Integrating physics of the problem into data-driven methods to enhance elastic full-waveform inversion with uncertainty quantification. Phys. D Nonlinear Phenom. 2025, 472, 134518. [Google Scholar]
  44. Northrup, C.J.; Royden, L.H.; Burchfiel, B.C. Motion of the Pacific plate relative to Eurasia and its potential relation to Cenozoic extension along the eastern margin of Eurasia. Geology 1995, 23, 719–722. [Google Scholar] [CrossRef]
  45. Peng, Y.; Fu, Y.; Chen, S.; Wang, E. Sedimentary Environment Reconstruction and Organic Matter Enrichment Mechanisms in Various Lithofacies of the Lacustrine Shale: A Case Study of the Da’anzhai Member, Central Sichuan Basin, China. Appl. Sci. 2024, 14, 10192. [Google Scholar] [CrossRef]
  46. Krampe, V.; Edme, P.; Maurer, H. Optimized experimental design for seismic full waveform inversion: A computationally efficient method including a flexible implementation of acquisition costs. Geophys. Prospect. 2020, 69, 152–166. [Google Scholar] [CrossRef]
  47. Wang, J.; Li, Z.; Chen, C.; Meng, C. Predicting gas content in coalbed methane reservoirs using seismic waveform indication inversion: A case study from the Upper Carboniferous Benxi Formation, eastern Ordos Basin, China. Acta Geophys. 2022, 70, 1–16. [Google Scholar] [CrossRef]
  48. Wang, J.; Lei, C.; Yin, Y.; Xu, Z. Sedimentary architecture of thin-layer beach bar sand bodies in the G. oilfield, Niger. Front. Earth Sci. 2024, 12, 1394612. [Google Scholar] [CrossRef]
  49. Wang, Y. Application of Seismic Motion Inversion in the Third Member of the Shahejie Formation in the Northeastern Kenli. J. Phys. Conf. Ser. 2019, 1176, 042078. [Google Scholar] [CrossRef]
  50. Wang, S.; Yuan, S. Artificial Intelligence in Geophysical Exploration. Science Press: Beijing, China, 2025; pp. 103–130. [Google Scholar]
  51. Lin, L.; Huang, H.; Zhang, P.; Yan, W.; Wei, H.; Liu, H.; Zhong, Z. A deep-learning framework for borehole formation properties prediction using heterogeneous well-logging data: A case study of a carbonate reservoir in the Gaoshiti-Moxi area, Sichuan Basin, China. Geophysics 2024, 89, WA295–WA308. [Google Scholar] [CrossRef]
  52. Wakeel, H.; Miao, L.; Muhammad, A.; Syed, N.R.R.; Harith, F.K.; Nafees, A.; Salah, A.A. Advanced Permeability Prediction Through Two-Dimensional Geological Feature Image Extraction with CNN Regression from Well Logs Data. Math. Geosci. 2025, 1–46. [Google Scholar]
  53. Gao, Y.; Jiang, X.; Liu, F.; Wang, X.; Liu, R. Sedimentary characteristics and formation mechanisms of lacustrine beach-bars in the fourth member of the Shahejie Formation in the Shubei area, western depression of the Liaohe Oilfield, China. J. Earth Sci. 2017, 28, 1178–1190. [Google Scholar] [CrossRef]
  54. Sun, Z. Application of Seismic Waveform Indication Inversion in Fluvial Facies Sand Body Prediction. J. Res. Sci. Eng. 2022, 4. [Google Scholar]
  55. Bian, B. Application of Seismic Attribute Clustering Method Based on PCA-SOM in Identification of Paleochannels. J. Phys. Conf. Ser. 2024, 2834, 012059. [Google Scholar] [CrossRef]
  56. Chen, Z.; Wang, R.; Xu, B.; Zhu, J. Prediction of the petroliferous area in WZ6–1 structure of Beibu Gulf Basin in the South China Sea based on PCA-SOM model. Earth Sci. Inform. 2025, 18, 257. [Google Scholar] [CrossRef]
  57. Chen, X.; Fan, K.; Wang, C.; Zheng, R.; Wu, Y.; Mi, X. Seismic Sequence and Source Analysis of Typical Sandstone Reservoirs. Chem. Technol. Fuels Oils 2024, 60, 461–470. [Google Scholar] [CrossRef]
  58. Albarbary, Z.; Bassiouni, M.E.A.A.; Boukhary, M.; Spieß, V.; El-Barkooky, A.N.; Ewida, H.F. Integrating seismic attributes, post-stack seismic inversion, and static modeling for assessing the Pliocene-Pleistocene hydrocarbon potentialities, Offshore North Sinai Field, Egypt. J. Afr. Earth Sci. 2023, 206, 105026. [Google Scholar] [CrossRef]
  59. Wu, Z.; Hu, Z.; Shi, P.; Dai, L.; LI, S.; Li, F.; Wang, Z.; Hu, Z. Meso-Cenozoic tectonic evolution and geomorphologic restoration of the west section of Bonan low uplift, Bohai Bay basin. Acta Geol. Sin. 2025, 1–19. [Google Scholar] [CrossRef]
  60. Kohonen, T. Self-Organized Formation of Topologically Correct Feature Maps. Biol. Cybern. 1982, 43, 59–69. [Google Scholar] [CrossRef]
  61. Kohonen, T. Self-Organizing Maps, 3rd ed.; Springer: Berlin/Heidelberg, Germany, 2001. [Google Scholar]
  62. Shao, C.; Song, P.; Zhang, S.; Wang, Q. Architectural characteristics of beach-bar reservoirs in the lower submember of the 2nd member of the Paleogene Dongying Formation in block SC7, Huanghekou Sag, Bohai Bay Basin. Oil Gas Geol. 2024, 45, 486–501. [Google Scholar]
  63. Ahmed, A.K.; Heping, P.; Sinan, F.; Shazia, A.; Yao, Y.Z.; Chengxiang, D.; Nasir, K. Capability of self-organizing map neural network in geophysical log data classification: Case study from the CCSD-MH. J. Appl. Geophys. 2015, 118, 37–46. [Google Scholar]
  64. He, W.; Pei, M. Seismic waveform based sequence framework and study on shale lithofacies characteristics: A case study of No. 5 test zone of Gulong shale oil in Songliao Basin. China Pet. Explor. 2024, 29, 123–133. [Google Scholar]
  65. Li, M.; Zhu, H.; Yang, X.; Zhou, X.; Li, J.; Wang, D. Sedimentary system analysis using seismic multi-attribute techniques in areas lacking well data: An example from the Shahajie Formation in the BZ3–1 Block of the western slope of the Bozhong Sag. Mar. Geol. Quat. Geol. 2012, 32, 151–157. [Google Scholar] [CrossRef]
  66. Guo, S.; Chen, Y.; Yang, H.; Zeng, Q.; Han, Y.; Zhao, Z.; Wang, L.; Huang, X. Sedimentary facies analysis using seismic attributes via k-means clustering algorithm in low-exploration areas: A case study of Wenchang Formation in Baiyun Sag. Mar. Geol. Front. 2018, 34, 48–55. [Google Scholar]
  67. Xu, J.; Song, J.; Yu, Q.; Kong, F. Generalized distribution reconstruction based on the inversion of characteristic function curve for structural reliability analysis. Reliab. Eng. Syst. Saf. 2023, 229, 108768. [Google Scholar] [CrossRef]
  68. Wang, W.; Yin, C.; Fu, Z. Standardization method of logging curves based on petrophysical model of clastic rock. Oil Geophys. Prospect. 2025, 2, 1–7. [Google Scholar]
  69. Yu, W.; Feng, L.; Du, Y. Application of the wave impedance inversion based on the characteristic curve reconstruction in the complex reservoir prediction. Sci. Technol. Eng. 2019, 19, 58–65. [Google Scholar]
  70. Fan, X.; Meng, F.; Deng, J.; Zhao, P.; Liao, S.; Chen, Y.; Zhang, Q. Well logs reconstruction based on automatic machine learning technology. Nat. Gas. Ind. 2024, 44, 38–54. [Google Scholar]
  71. Zhang, S.; Yin, C.; Peng, W.; Li, A.; Cao, D. Research and application of porosity inversion method based on elastic impedance statistical petrophysical model. Comput. Tech. Geophys. Geochem. Explor. 2025, 47, 50–58. [Google Scholar]
  72. Ohakwere, E.M.; Igboekwe, M.; Chukwu, G. Petrophysical evaluation and lithology delineation usingcross-plots analysis from some onshore wellsin the Nigerian-delta, west Africa. Int. J. Adv. Geosci. 2018, 6, 99. [Google Scholar] [CrossRef]
  73. Zhang, J.; Rao, Y. Seismic Full Waveform Inversion Accelerated by Overlapping Data Input and Computation. Pure Appl. Geophys. 2023, 180, 3517–3526. [Google Scholar] [CrossRef]
  74. Mohammed, O.; Syed, I.; Adel, M.J.; Amer, A. Boosting Reservoir Prediction Accuracy: A Hybrid Methodology Combining Traditional Reservoir Simulation and Modern Machine Learning Approaches. Energies 2025, 18, 657. [Google Scholar] [CrossRef]
  75. Zhao, C.; Jiang, Y.; Yang, H.; Wang, L. The genesis of authigenic minerals and the porosity evolution of various lithologies and their implications for identifying high-quality reservoirs in the fourth member of Xujiahe Formation (Northeast-Sichuan Basin, China). J. Pet. Sci. Eng. 2022, 212. [Google Scholar] [CrossRef]
  76. Mohammed, A.M.A.; Ahmed A., M.; Sohaib R., A. RockDNet: Deep Learning Approach for Lithology Classification. Appl. Sci. 2024, 14, 5511. [Google Scholar] [CrossRef]
  77. Chen, L.; Romanowicz, B. Accelerating full-waveform inversion using source stacking: Synthetic experiments at the global scale in a realistic 3-D earth model. Geophys. J. Int. 2024, 236, 644–658. [Google Scholar] [CrossRef]
  78. Liu, P.; Li, R.; Yue, Y.; Liao, S.; Qian, F. Qian F.Robust prestack seismic facies analysis using shearlet transform-based deep learning. J. Geophys. Eng. 2022, 19, 521–533. [Google Scholar] [CrossRef]
  79. Hessam, M.S.; Mohammad, A.R.; Majid, N.B.; Seyedmohsen, S. Integrating Bayesian classification and ANN for lithofacies classification using well and seismic data: Bahregansar case study. Discov. Appl. Sci. 2025, 7, 238. [Google Scholar]
  80. Jia, C.; Pang, X.; Song, Y. Whole petroleum system and ordered distribution pattern of conventional and unconventional oil and gas reservoirs. Pet. Sci. 2023, 20, 1–19. [Google Scholar] [CrossRef]
  81. Han, S.; Du, X.; He, Y.; Wang, C.; Huo, M.; Mu, X.; Wang, Y.; Huang, J.; Zhang, C. Sedimentary Paleoenvironment and Organic Matter Enrichment Characteristics of Lacustrine Shahezi Shale in Songliao Basin: Insights from Continental Scientific Drilling. ACS Omega 2024, 9, 21097–21115. [Google Scholar] [CrossRef]
  82. Tang, Y.; Cao, J.; He, W.; Liu, Y.; Qin, Z.; Huang, L. The whole petroleum system with ordered coexistence of conventional and unconventional hydrocarbons: Case from the Junggar Basin, China. AAPG Bull. 2024, 108, 1261–1290. [Google Scholar] [CrossRef]
  83. Sun, B.; Liu, X.; Liu, J.; Wang, G.; Shu, H.; Luo, Y.; Liu, T.; Hua, Z. The heterogeneity of lithofacies types, combination modes, and sedimentary model of lacustrine shale restricted by high-frequency sequence. Geol. J. 2022, 57, 3720–3735. [Google Scholar] [CrossRef]
  84. Vikara, D.; Khanna, V. Application of a Deep Learning Network for Joint Prediction of Associated Fluid Production in Unconventional Hydrocarbon Development. Processes 2022, 10, 740. [Google Scholar] [CrossRef]
  85. Liu, K.; Liu, J. Application of basin modeling method coupling sedimentary filling evolution with petroleum system in simulating ultra-deep oil-gas accumulations:a case study of Sinian Dengying Formation in central Sichuan Basin. Acta Pet. Sin. 2023, 44, 1445–1458. [Google Scholar]
  86. Antonietta, M.E.; Walter, D.C.; Giovanni, M.; Flora, G. Efficient SOM’s Application to Seismic Fumarolic Tremor for the Detection of Anomalous Hydrothermal Activity in Campi Flegrei Volcano (Italy). Appl. Sci. 2023, 13, 5505. [Google Scholar] [CrossRef]
  87. Chen, K.; Liu, L.; Xu, L.; Hu, F.; Yang, Y.; Zuo, J.; Zhang, L.; Zhao, Y. Linearized waveform inversion for vertical transversely isotropic elastic media: Methodology and multi-parameter crosstalk analysis. Pet. Sci. 2024, 21, 252–271. [Google Scholar] [CrossRef]
  88. Dhara, A.; Sen, M.K.; Biswas, R. Facies-constrained transdimensional amplitude versus angle inversion using machine learning assisted priors. Geophys. Prospect 2023, 71, 1321–1343. [Google Scholar] [CrossRef]
  89. Meng, J.; Wang, S.; Cheng, W.; Wang, Z.; Yang, L. AVO Inversion Based on Transfer Learning and Low-Frequency Model. IEEE Geosci. Remote Sens. Lett. 2021, 19, 3004605. [Google Scholar] [CrossRef]
  90. Kumar, A.; Tiwari, G. An efficient Bayesian multi-model framework to analyze reliability of rock structures with limited investigation data. Acta Geotech. 2023, 19, 3299–3319. [Google Scholar] [CrossRef]
  91. Yang, H.; Qian, G.; Xu, C.; Gao, Y.; Kang, R. Sandstone Distribution and Reservoir Characteristics of Shahejie Formation in Huanghekou Sag, Bohai Bay Basin. Earth Sci. 2023, 48, 3068–3080. [Google Scholar]
  92. Jiang, R.; Fan, S.; Wang, X.; Xu, Y. Clustering algorithm based on improved SOM model. Comput. Sci. 2024, 1–15. Available online: http://kns.cnki.net/kcms/detail/50.1075.TP.20241101.1447.032.html (accessed on 20 April 2025).
  93. Janina, H.; Szabolcs, B.; János, G. Cluster defined sedimentary elements of deep-water clastic depositional systems and their 3D spatial visualization using parametrization: A case study from the Pannonian-basin. Geol. Croat. 2017, 70, 73–78. [Google Scholar]
  94. Ronen, S.; Schultz, P.S.; Hattori, M. Seismic-guided estimation of log properties. Part 2: Using artificial neural networks for nonlinear attribute calibration. Lead. Edge 1994, 13, 674–678. [Google Scholar] [CrossRef]
  95. Yin, Z.; Li, Y.; Zhang, J.; Zhang, Z.; Hou, D.; Chen, B. Fine Characterization of Braided River Reservoir Architecture with Sparse Well Patterns Based on Intelligent Fusion of Multiple Seismic Attributes: A Case Study of the Guantao Formation from C-6 oilfield, Bohai Bay Basin. Acta Sedimentol. Sin. 2024, 1–15. [Google Scholar] [CrossRef]
  96. Zhu, Z.; Chen, X.; Ren, H.; Tao, L.; Jiang, J.; Wang, T.; Cheng, M.; Ding, S.; Du, R. Seismic Facies Analysis Using the Multiattribute SOM-K-Means Clustering. Comput. Intell. Neurosci. 2022, 1, 1688233. [Google Scholar]
  97. Zhang, L.; Quieren, J.; Schuelke, J. Chapter 10 Self-Organizing Map (SOM) network for tracking horizons and classifying seismic traces. Handb. Geophys. Explor. Seism. Explor. 2001, 30, 155–170. [Google Scholar]
  98. Hu, Q.; Wang, C.; Zhang, X.; Fan, J. Application of SOM Neural Network in Lithology Recognition. Appl. Mech. Mater. 2015, 3744, 2169–2172. [Google Scholar] [CrossRef]
  99. Song, C.; Liu, Z.; Wang, Y.; Li, X.; Hu, G. Multi-waveform classification for seismic facies analysis. Comput. Geosci. 2016, 101, 1–9. [Google Scholar] [CrossRef]
  100. Mirzanejad, M.; Tran, K.T.; McVay, M.; Horhota, D.; Wasman, S.J. Deep void detection with 3D full waveform inversion of surface-based and in-depth source seismic wavefields. Eng. Geol. 2021, 294, 106407. [Google Scholar] [CrossRef]
  101. Cavur, M.; Moraga, J.; Duzgun, H.S.; Soydan, H.; Jin, G. Displacement Analysis of Geothermal Field Based on PSInSAR And SOM Clustering Algorithms A Case Study of Brady Field, Nevada—USA. Remote Sens. 2021, 13, 349. [Google Scholar] [CrossRef]
Figure 1. Location of Bohai Bay Basin and HHK Depression (red dotted box) [64,65].
Applsci 15 05134 g001
Figure 2. Generalized Paleogene Lithostratigraphic sequence stratigraphy and tectonic evolution of HHK Depression, Bohai Bay Basin, China [64,65].
Applsci 15 05134 g002
Figure 3. Sequence Stratigraphic Architecture and Depositional Infill Patterns of the Paleogene System in the HHK Depression.
Applsci 15 05134 g003
Figure 4. Seismic spectrum characteristics of the Lower E3d2 Sub-member in HHK Depression.
Applsci 15 05134 g004
Figure 5. Consistency processing of DT/GR Density and Gamma logging curves.
Applsci 15 05134 g005
Figure 6. Petrophysical analysis of the Lower E3d2 Member in HHK Depression. (Testing wells: B7-2-a, C4-2-a, C4-3-a, C4-3-bD, C4-1S-a).
Applsci 15 05134 g006
Figure 7. Frequency component analysis and thin Layer identification workflow of Waveform Indication Inversion.
Applsci 15 05134 g007
Figure 8. The structure of a Self-Organizing Map (SOM) network [61,86].
Applsci 15 05134 g008
Figure 9. Detailed characterization of Beach-bar Sedimentary Microfacies in the Lower E3d2 Sub-member, HHK Depression, via SOM Multi-Attribute Optimization and Seismic Waveform Inversion Fusion.
Applsci 15 05134 g009
Figure 10. Geological and Geophysical characteristics of the Lower E3d2 Sub-member in HHK Depression. (a) Sandstone, reverse sequence, C4-2-a, 3167–3168 m; (b) Three-segmented structure, C4-4-e (3043 m), C4-4-a (2850.1 m), C4-4-a (2887.7 m); (c) Fine-grained lithic feldspathic sandstone, cast thin section, C4-6-a, 3167.43 m; (d) Funnel-shaped, finger-shaped, box-shaped, and box-leak composite structures, C4-1-a; (e) Parallel-to-subparallel strong seismic reflections.
Applsci 15 05134 g010
Figure 11. Verification cross-section and sandy thickness conformity analysis of Paleogene Series Dongying Member in HHK Depression. (a) Inversion Validation Profile; (b) Comparative Analysis of Inversion-Predicted Sand Body Thickness and Logging-Interpreted Sandstone Thickness; (c) Profile Location Map.
Applsci 15 05134 g011
Figure 12. Verification of Waveform Indication Inversion results against Log-Interpreted Lithology for well C4-3-a (T3u-T3 seismic reflection horizons).
Applsci 15 05134 g012
Figure 13. Composite SW-NE well sections and inversion sections for the Lower E3d2 Submember in HHK Depression (Selection of well logging curves: SP-Spontaneous Potential Log (unit mV); GR-Gamma Ray Log (unit API). (a) Logging Interpretation Profile; (b) Seismic Inversion Profile.
Applsci 15 05134 g013
Figure 14. Detailed characterization of beach-bar sedimentary microfacies in the Lower E3d2 Sub-member of the study area. (a) SOM-processed attribute hollow map; (b) Inversion-predicted sandbody thickness map; (c) Characteristics of Beach-Bar Depositional Facies Distribution.
Applsci 15 05134 g014
Table 1. Comparative Analysis of Geophysical Methods [80,81,82,83,84,85,86].
MethodCore AdvantagesLimitationsApplicable Scenario
Traditional deterministic impedance inversionHigh vertical resolution, fast computationLow lateral resolution, multiple solutionsPreliminary exploration of well-controlled areas
Seismic Waveform InversionHigh resolution, multi-data integrationComplex computation, data sensitivityDetailed prediction of complex reservoirs
SOMUnsupervised clustering, low computational demandLimited capability in handling nonlinear structuresAttribute classification and real-time processing
KrigingSpatial modeling, uncertainty quantificationComplex computation, model dependencyHeterogeneous attribute interpolation
Single-attribute thresholdingSimple and fastSingular information, poor adaptabilityRapid screening and simple environments
Table 2. Sandstone thickness values of the Lower E3d2 Sub-member for the Participant Well and Verification Well, calculated through well log interpretation and inversion prediction.
Participant WellSandstone Thickness/mVerification WellSandstone Thickness/m
Well Log InterpretationInversion PredictionWell Log InterpretationInversion Prediction
B7-2-b1.30.5B8-2S-b1.82.3
B7-2-d1.53.2C4-2-a87.6
B7-2-a2.41.1C-5-b4.53.9
C4-3-bD2.93.4B7-2-e4.62.6
C4-4-e2.93.3C4-1-a5.35.6
C4-3-a3.05B6-5-a5.67.1
B7-2-c3.11.8B7-4-a7.36
C4-5-a3.64.6B7-4-b7.78.5
B8-3-b4.35.8B8-2-a8.810.0
C3-1-a16.514.3C4-4-c10.19.1
C4-4-a5.76.8C4-2-bA12.38
B7-5-a8.86.3
Disclaimer/Publisher’s Note: The statements, opinions and data contained in all publications are solely those of the individual author(s) and contributor(s) and not of MDPI and/or the editor(s). MDPI and/or the editor(s) disclaim responsibility for any injury to people or property resulting from any ideas, methods, instructions or products referred to in the content.

