Article

Influence of NaCl Concentration on Compression Characteristics of Marine Soil and Micro-Mechanism Analysis

1
College of Civil Engineering, Zhejiang University of Technology, Hangzhou 310023, China
2
China Institute of Water Resources and Hydropower Research, Beijing 100048, China
3
China Construction Fifth Engineering Bureau Corporation Limited, Changsha 410004, China
4
Power China Huadong Engineering Corporation Limited, Hangzhou 311122, China
*
Author to whom correspondence should be addressed.
Appl. Sci. 2025, 15(9), 5110; https://doi.org/10.3390/app15095110
Submission received: 7 April 2025 / Revised: 29 April 2025 / Accepted: 30 April 2025 / Published: 4 May 2025
(This article belongs to the Section Marine Science and Engineering)

Abstract

:
The salt concentration of the pore solution can alter the micro-pore and particle structure of soil, thereby affecting its engineering properties. To investigate the compression characteristics of marine soil under different salt concentrations, one-dimensional compression and SEM scanning tests were conducted on marine reconstituted clay from the Yellow Sea with varying NaCl concentrations (0–5%). The effects of NaCl concentration on the compression characteristics and microstructure of marine sedimentary clay were analyzed. The results indicate that: (1) Compressibility increases up to a NaCl concentration of 2.5%, after which it declines. At 2.5% NaCl threshold concentration, the coefficient of compression, compressibility index, and consolidation coefficient reach their peak values, and the response becomes more pronounced with increasing compression pressure. During the secondary compression stage, as pore water is expelled, the impact of NaCl concentration on compressibility diminishes, while the rebound characteristics remain unaffected by NaCl concentration; (2) SEM analysis reveals that at a NaCl threshold concentration of 2.5%, the pore fractal dimension, particle fractal dimension, pore anisotropy, and particle anisotropy reach their maximum values, with the most complex shape and pores and particles aligning in the same direction. When the concentration is less than 2.5%, the soil exhibits narrow pores and rounded particles upon compression. When the concentration exceeds 2.5%, the microstructure changes in the opposite direction, confirming the particle rearrangement mechanism driven by surface contact under moderate salinity. At the threshold concentration of 2.5%, a balance between electrostatic forces and attractive forces enables stable surface-to-surface contacts, maximizing compressibility. The findings of this study provide valuable references for the foundation design of marine geotechnical engineering in specific sea areas, thereby enhancing the safety and reliability of related projects.

1. Introduction

As a distinct type of soil, marine sedimentary soil is widely distributed in the foundations of marine engineering structures. With the extensive construction of offshore infrastructure and the rapid development of reclamation projects, engineering challenges related to the properties of marine soils continue to emerge. The compressibility of marine sedimentary, a critical soil property for evaluating foundation settlement, is influenced by a variety of factors, including mineral composition, soil structure, and pH value of seawater. Among these factors, the pore water salt concentration is noteworthy and cannot be neglected [1,2,3,4].
Marine soil has long been subjected to a high-salinity seawater environment, with the chemical composition of its pore water solution closely resembling that of seawater. However, due to fluctuations in climate, topography, ocean currents, and other factors, the actual salt concentration of seawater can vary between 0.2% and 7% [5], rather than remaining constant. Therefore, it is of significant practical importance to investigate the influence of pore water salt concentration on the compression characteristics of marine soils. It has been reported that variations in pore water salinity can significantly influence the compression parameters of reconstituted marine clay [6]. Among different types of clays, montmorillonite-based mineral clays exhibit a particularly pronounced response to changes in pore water salt concentration. Studies have shown that as the pore water NaCl concentration increases, the liquid limit [7,8] and water-holding capacity [9] of clays primarily composed of montmorillonite decrease. Consequently, the soil’s and compressibility are also reduced [10,11,12].
Sridharan et al. [13] and Maio et al. [7] employed X-ray diffraction technology to reveal that, under the influence of chemical solutions, the development of the double-electron layer of soil particles is inhibited. The thickness of the adsorption double-electron layer becomes thinner [14], the repulsive forces between particles are reduced, the gaps between soil particles gradually decrease [15], and particle flocculation is promoted [16]. Ultimately, these changes lead to a reduction in the soil’s water-holding capacity. However, for inactive clays dominated by illite and kaolinite, their physical and mechanical properties are relatively less affected by pore water salinity [17,18], and they may even exhibit the opposite trend [19,20]. The double-electron layer theory, being an idealized model, does not account for the mechanical structure of soil particles, making it unsuitable for this type of clay.
To address this, some researchers have proposed alternative clay models. Bayesteh et al. [21] and Collins et al. [22] suggest that the negative charge on the surface of clay minerals is influenced by the solution concentration. Under low and high salinity pore water conditions, clay particles form edge-to-edge and edge-to-surface structures, respectively. However, in pore water with moderate salinity, clay particles exhibit a surface-to-surface structure. This arrangement increases the pore size between aggregates while decreasing the pore size within the aggregates. In this clay model, the compression process primarily involves the reduction of pores between aggregates.
Existing research on the salt effect primarily focused on how salt concentration impacts the engineering properties of clays with specific mineral compositions. However, studies examining the salt response of real marine sedimentary clays are relatively scarce [6,7,8,9,10,11,12]. Moreover, the changes in the physical and mechanical properties of clay due to variations in pore water chemistry are not consistent across different studies, and the explanations for these phenomena remain inconclusive [21,22,23,24]. Given these gaps, it is essential to explore the salt response laws that are applicable to the engineering characteristics of marine sedimentary soils.
In this study, the mechanism by which pore water salt affects the compression characteristics of marine sedimentary soils from the Yellow Sea, China, is explored through a combination of oedometer experiments and Scanning Electron Microscope (SEM) observations. Reconstituted soil samples were prepared in NaCl solutions of varying concentrations to simulate the dynamic salt conditions found in marine environments. The study analyzes the impact of one-dimensional compression deformation on the microstructure of marine soil, thereby revealing the underlying mechanism of how pore water salt concentration affects the compression characteristics of marine sedimentary soils.

2. Soil Sample and Test Scheme

2.1. Soil Sample

The soil sample in this test comes from an offshore wind farm project in the Yellow Sea. The seabed level at the drilling sampling site is located at the underwater depth of 30~33 m, and the sampling depth is 67~68 m below the seabed level. The basic physical properties of the soil sample are shown in Table 1, and the particle gradation of the soil sample is determined by the densitometer method, as shown in Figure 1.
X-ray diffraction (XRD) analysis was conducted to characterize the mineralogical composition of the soil samples. The XRD patterns of both whole-rock and clay fractions are presented in Figure 2, with the quantitative mineral composition summarized in Table 2. The analysis indicates that clay minerals account for 34.8% of the total mineral content. Among the clay fraction, illite-smectite mixed-layer minerals (I/S) were identified as the dominant component, representing 62% of the clay mineral assemblage. This mixed-layer mineralogy is particularly significant as the expandable smectite layers strongly influence the soil’s swelling and compressibility behavior, while the illite layers contribute to the overall structural stability. The non-clay mineral fraction (65.2%) consists primarily of Quartz, which play an important role in determining the soil’s mechanical properties. The high proportion of I/S mixed-layer minerals suggests that the soil’s electrochemical behavior and sensitivity to pore fluid chemistry would be particularly pronounced, consistent with the observed concentration-dependent compressibility characteristics.

2.2. Chemical Composition Analysis of Seawater

Take an appropriate amount of ocean water near the soil sample, seal it in cans, transport it stably and keep it at constant temperature, and take 500 mL for chemical composition analysis, as shown in Table 3. Compared with pure water with a single component, seawater is mainly composed of many anions (Cl, Br, SO42−, etc.) and cations (Na+, K+, Mg2+, Ca2+, etc.). The chemical composition is complex, and the pH value is 8.13, which is alkaline, and the contents of Na+ and Cl are relatively high, close to 25%.

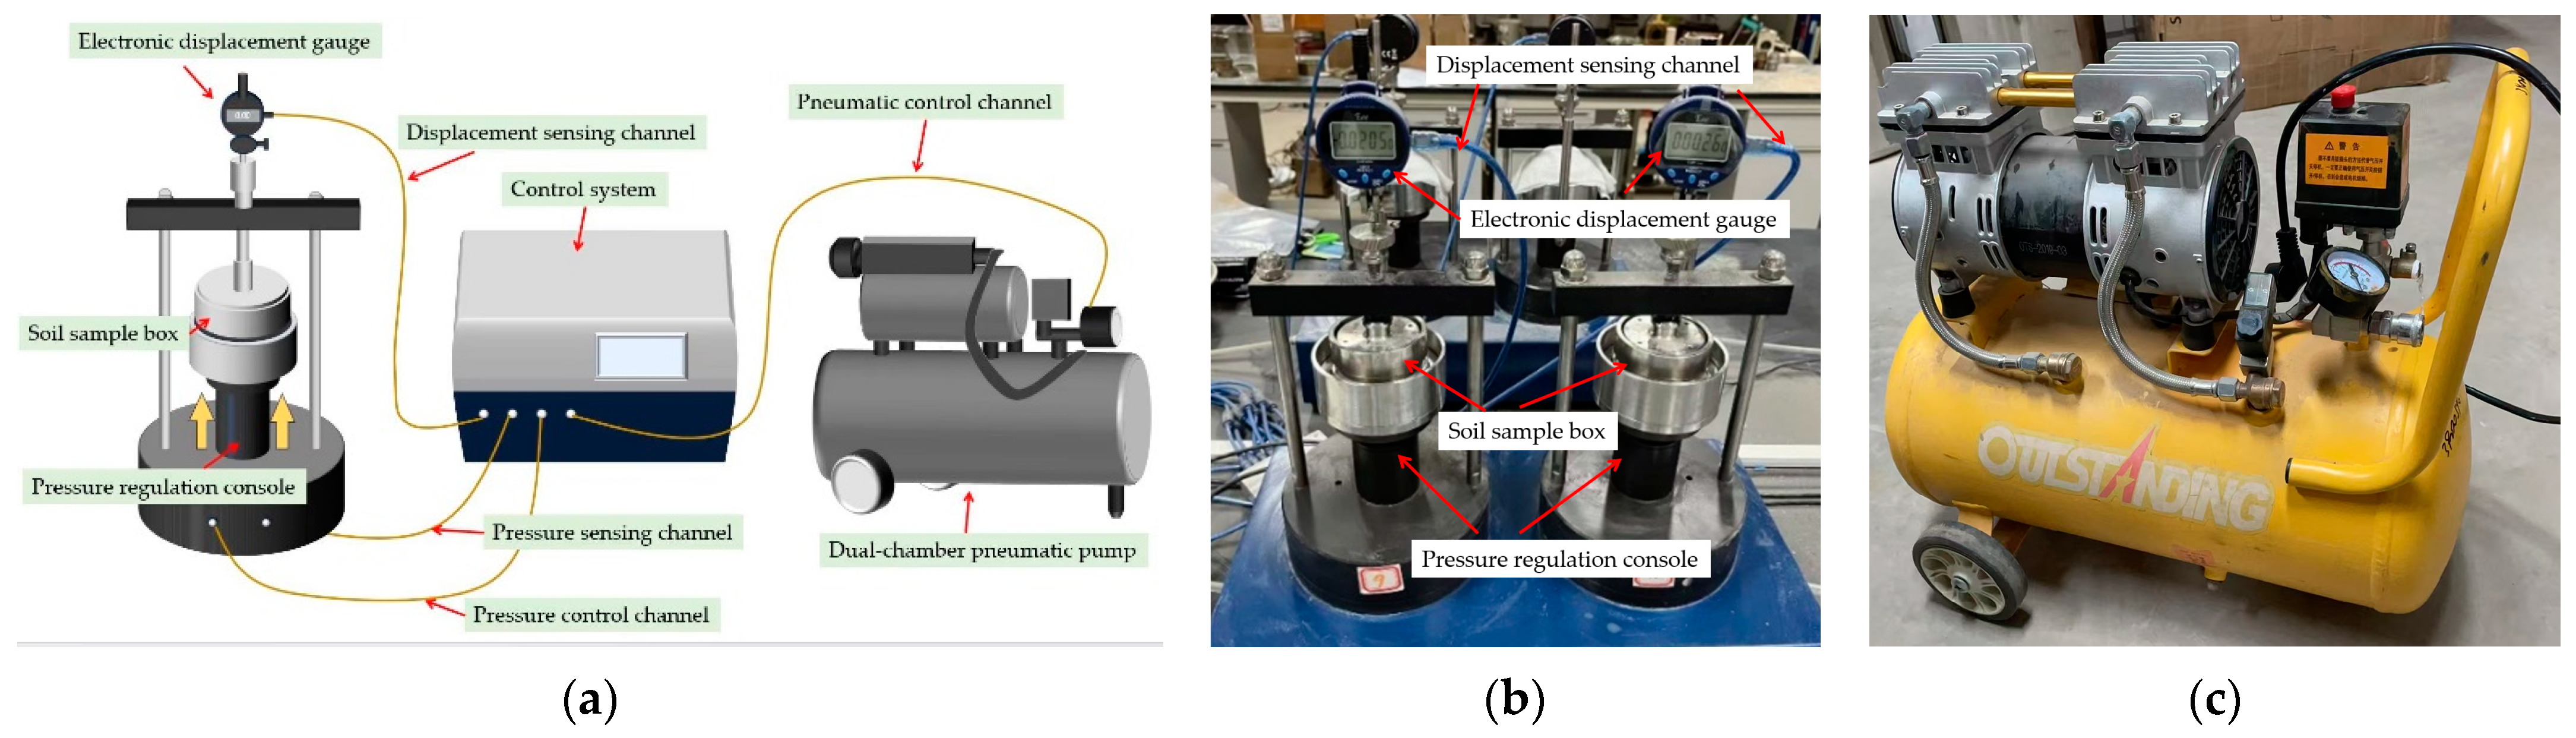
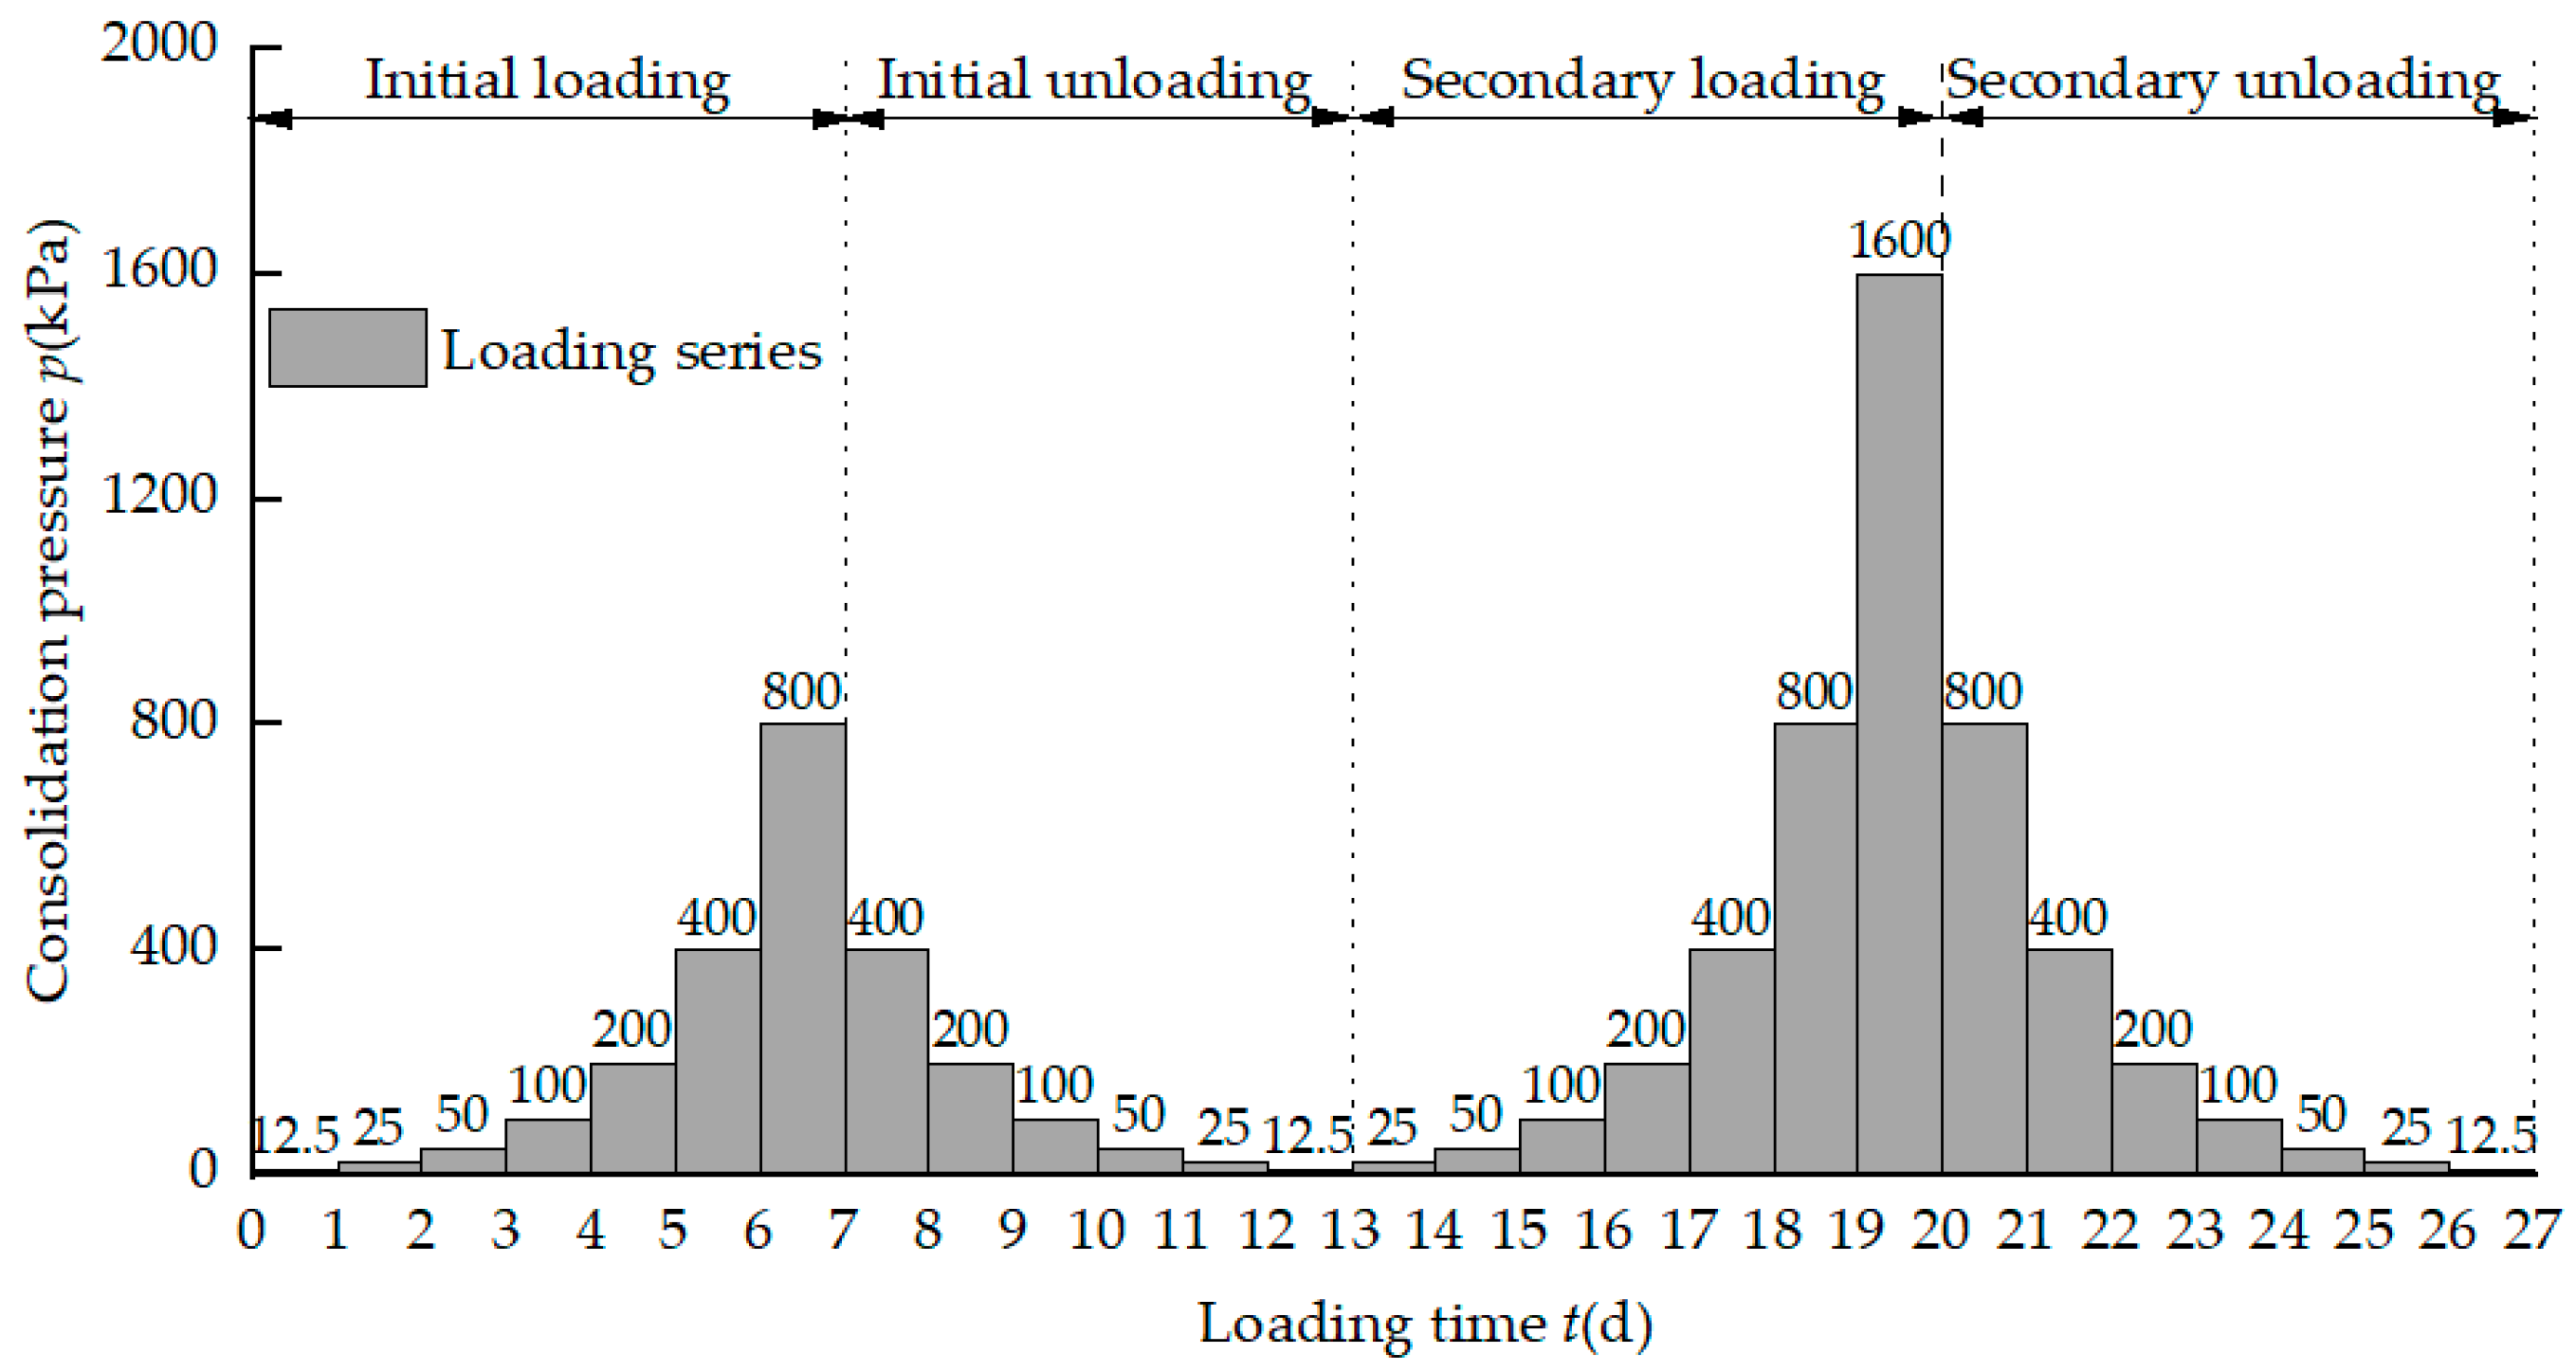
2.3. One-Dimensional Compression Test Plan

To investigate the compression characteristics of marine soil under varying salinity conditions, a series of one-dimensional compression tests were performed on samples prepared with NaCl solutions at concentrations of 0% (deionized water), 1.0%, 2.5%, 3.5%, and 5.0%.
The reconstituted samples were prepared to replicate the in-situ soil conditions, matching both the natural moisture content (w = 23.74%) and wet density (ρ = 1.93 g/cm³). The specimens were formed in a standard cutting ring (61.8 mm diameter × 20 mm height). Saturation was achieved through vacuum saturation at controlled NaCl concentrations, with a minimum saturation duration of 8 h to ensure complete pore fluid replacement. Following saturation, all specimens underwent ionic equilibration in their respective salt solutions for a minimum 7-day period [3,7], with solution renewal every 48 h to maintain constant concentration. This protocol ensured both chemical equilibrium and microstructural stability prior to mechanical testing.
The one-dimensional compression test on reconstituted marine soil was conducted using an STK.YJZQG16-1 dual-chamber pneumatic oedometer (Figure 3). This system applies vertical loads to the soil specimen by regulating air pressure via an automated control system while simultaneously recording displacement data. The oedometer operates within a loading range of 0–1600 kPa, with a relative error of less than 1.0% and an accuracy of 0.3% of full scale (F.S.). The instrument is factory-certified and undergoes annual calibration to ensure measurement reliability.
During the test, a loading ratio of 1.0 was maintained, initial loading from 12.5 kPa to 800 kPa, followed by unloading to the initial value of 12.5 kPa. Secondary compression was then conducted, involving gradual loading to 1600 kPa before final unloading. The stable compression time of each load is 24 h, and the specific loading scheme is shown in Figure 4.

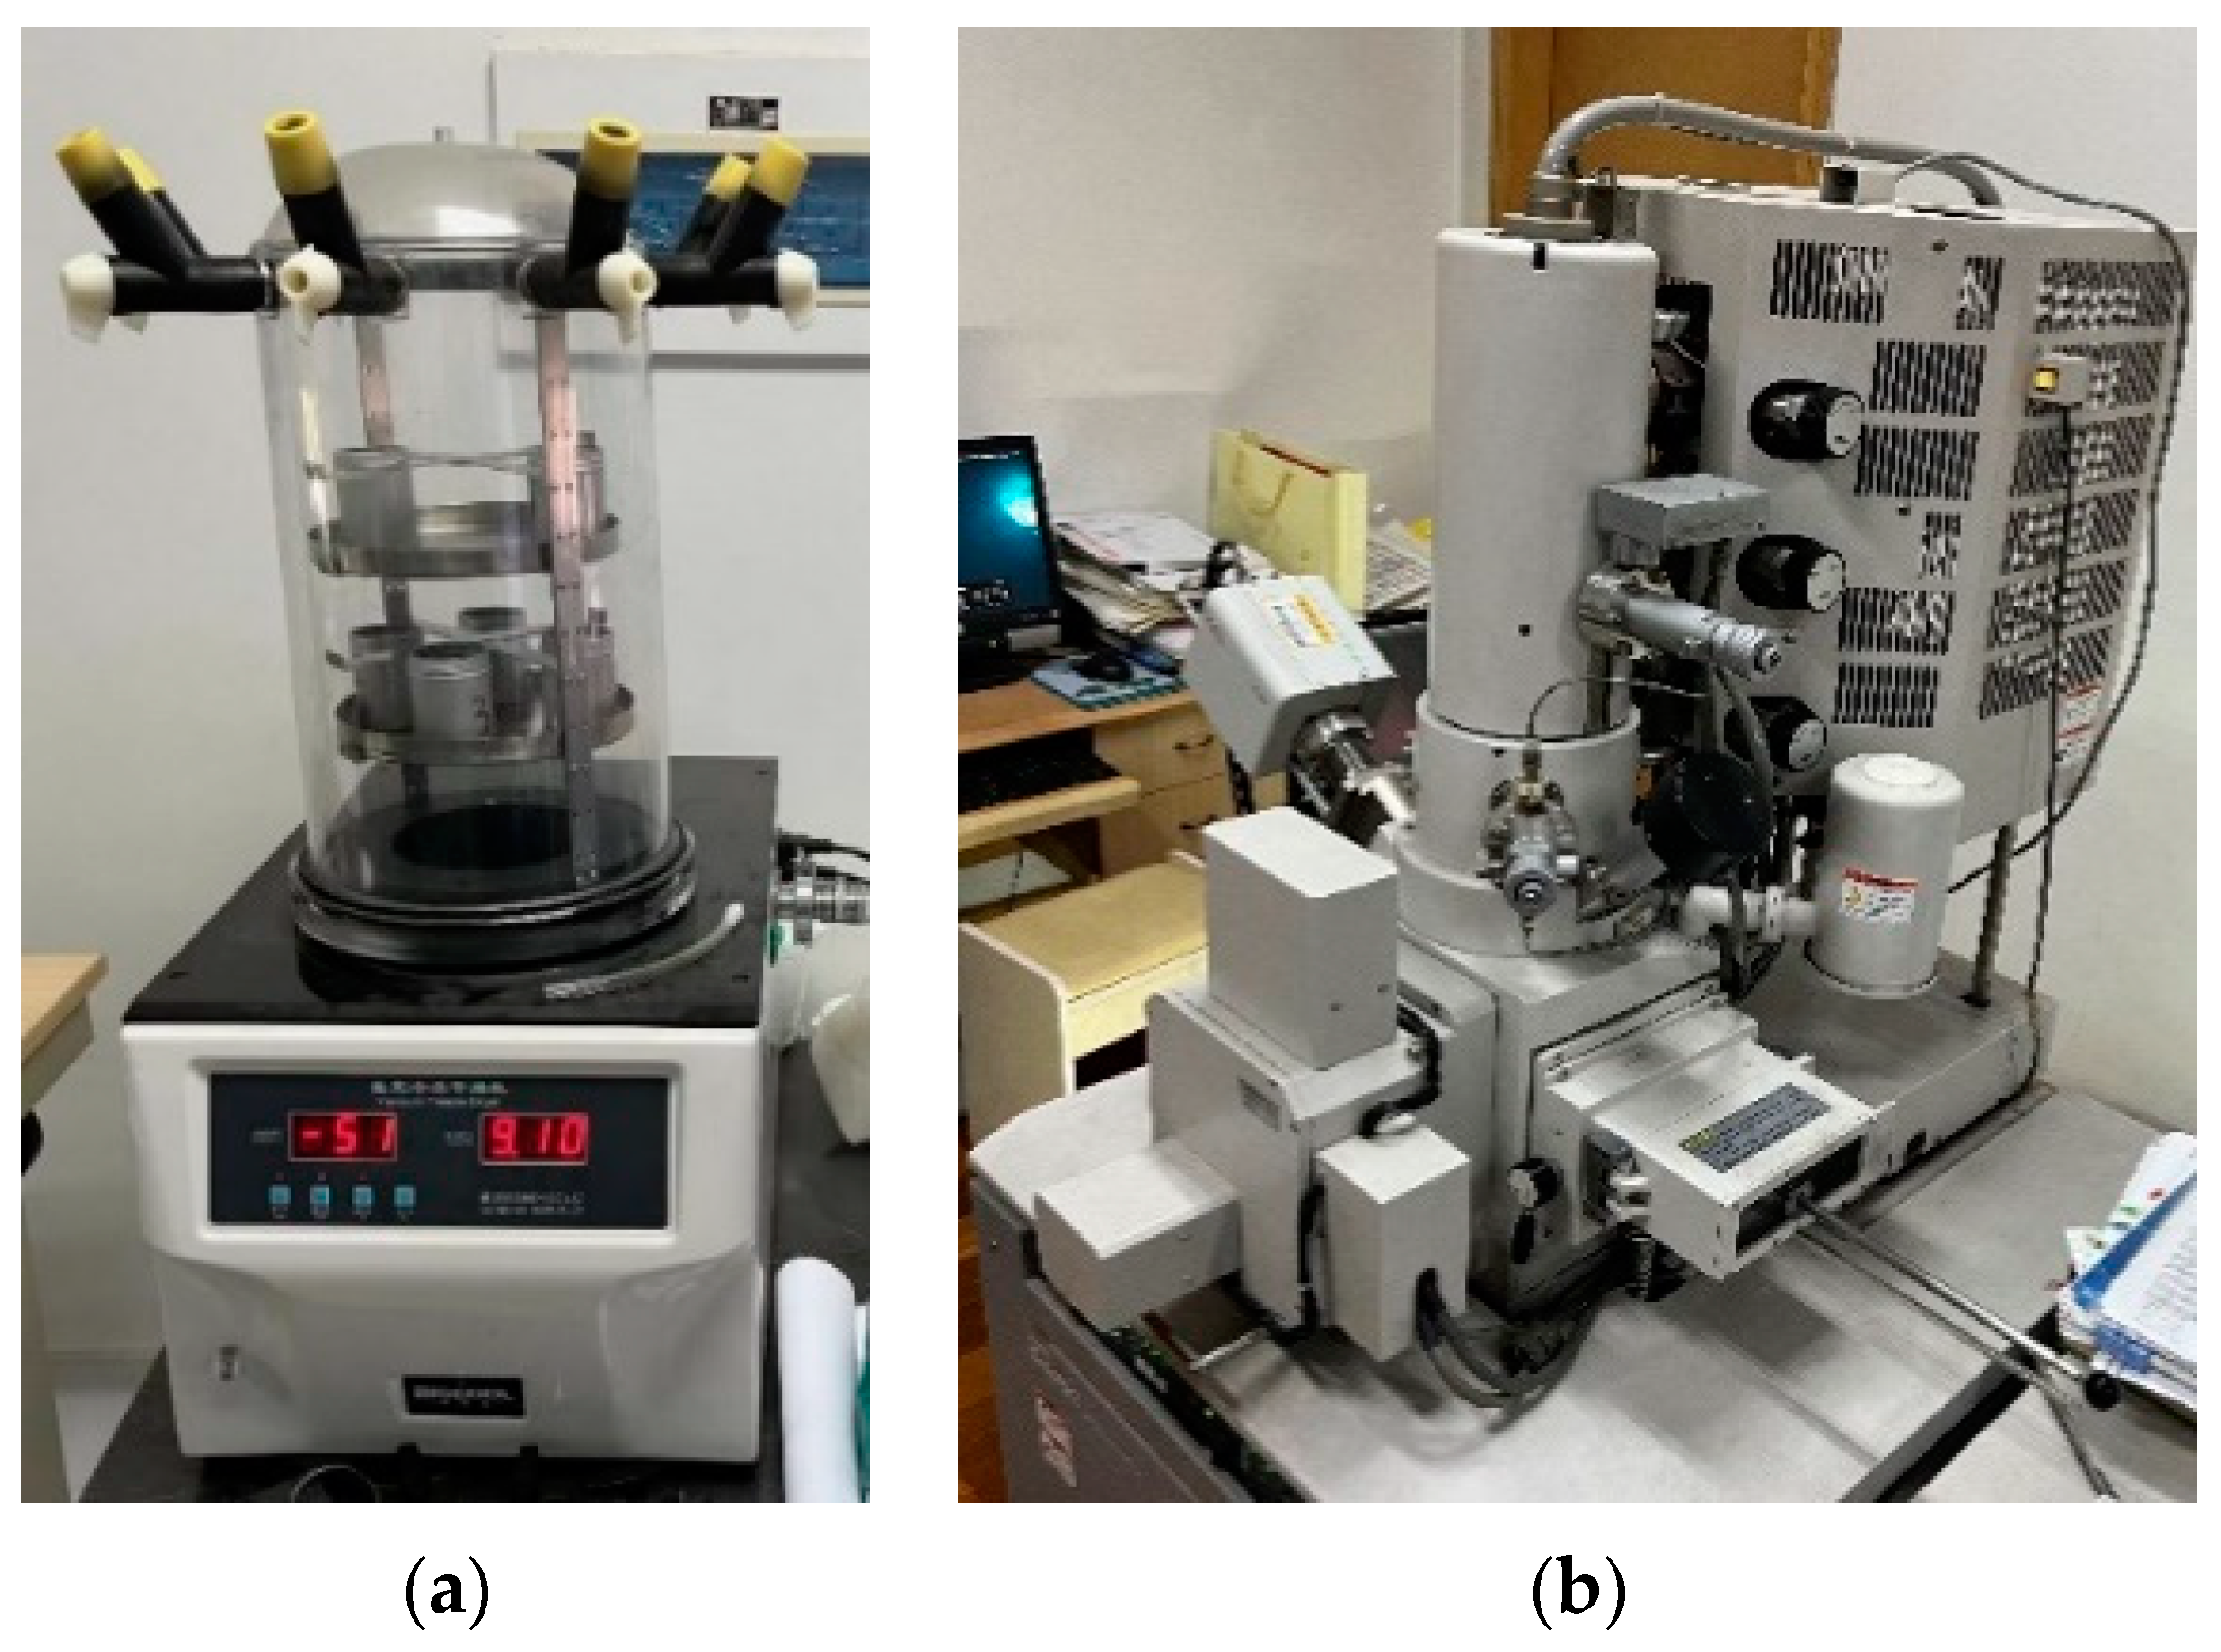
2.4. SEM Test Scheme

The change of internal structure of soil is the essential reason for its macro-mechanical properties and deformation, and the microstructure of soil can be analyzed by SEM scanning test. In order to avoid the disturbance of drying treatment on the structure of soil samples, the freeze-drying method with minimal impact prepared the dried samples. The collected samples must be kept undisturbed by other external factors. Take the uncompressed samples before the test and the compressed soil samples after the loading and unloading of the compression test, cut them into clods of about 1.0 cm × 1.0 cm with a fine hacksaw. The freeze-drying method rapidly froze soil samples in liquid nitrogen (boiling point: −196 °C) for 15 min, transforming pore liquid into non-expansive, non-crystalline ice. The FD-1-50 vacuum freeze drier (Figure 5a) then sublimated the ice at −50 °C under vacuum for over 8 h. After gold-coating specimens of varying concentrations, the analysis maintained parallel alignment between observation surfaces and the loading direction. The electron microscope scanner (Figure 5b) observed differences in internal structural changes.

3. One-Dimensional Compression Test Results and Analysis

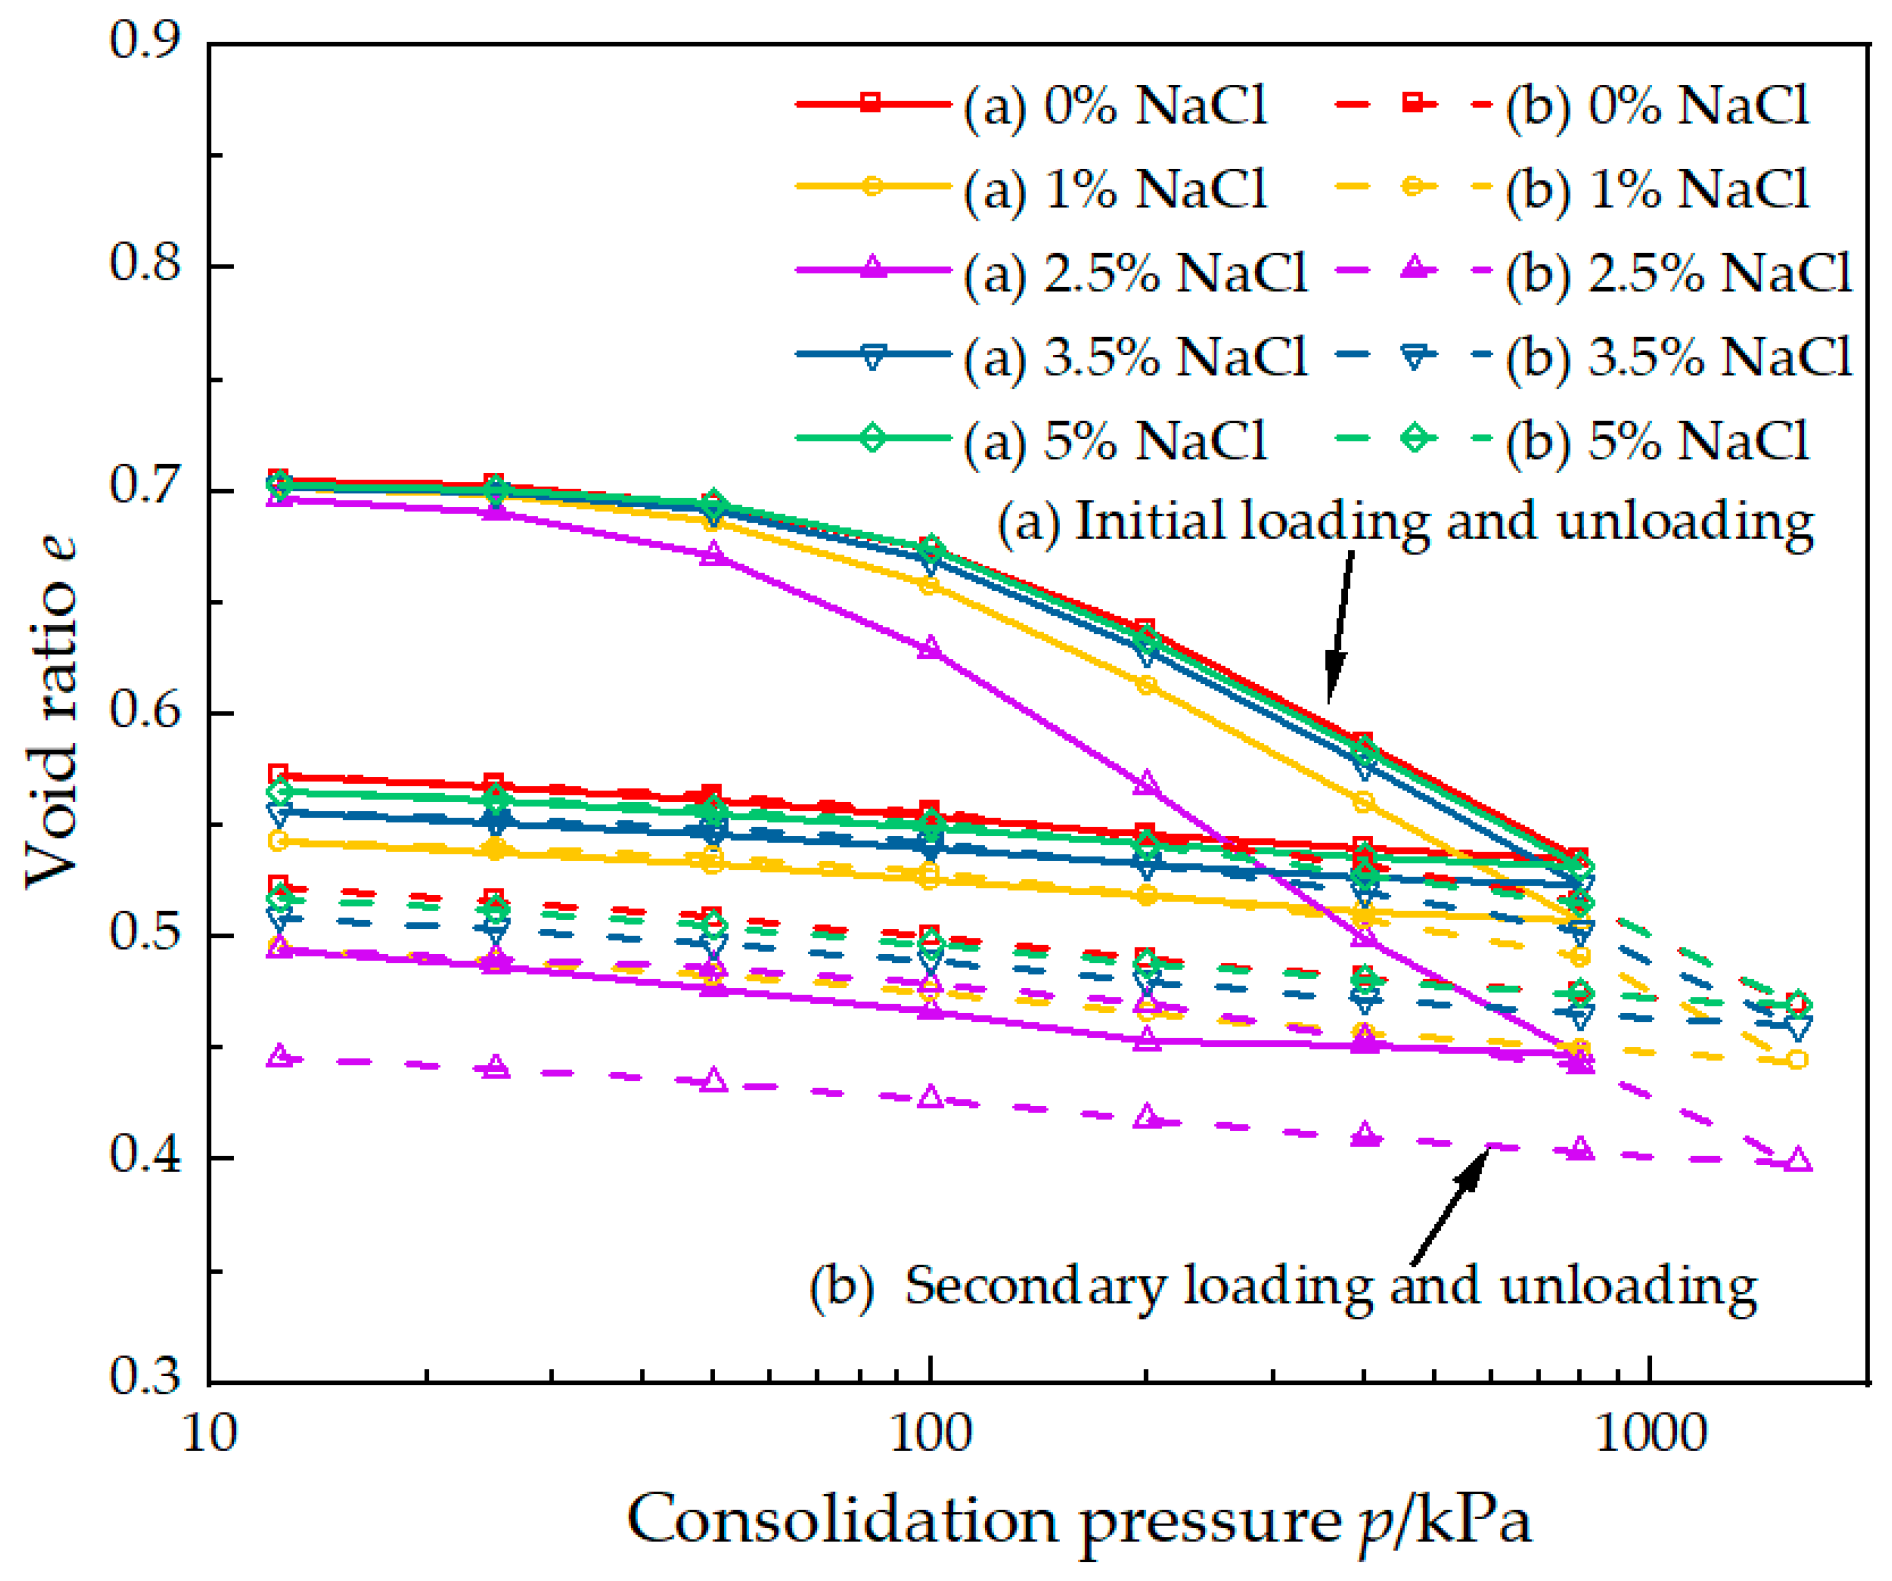
3.1. Compression Rebound Curve

Figure 6 shows the e-log p curve of soil samples. It can be seen from the figure that NaCl concentration has a significant influence on the compression rebound curve of soil samples. Compared with other concentration values of NaCl solution, when the solution concentration is 2.5%, under the same compression pressure, the soil sample has the smallest void ratio, the largest compressive deformation and the most obvious compressibility, which shows that the compressibility of marine soil is the largest when the NaCl solution concentration in pore water is 2.5%.

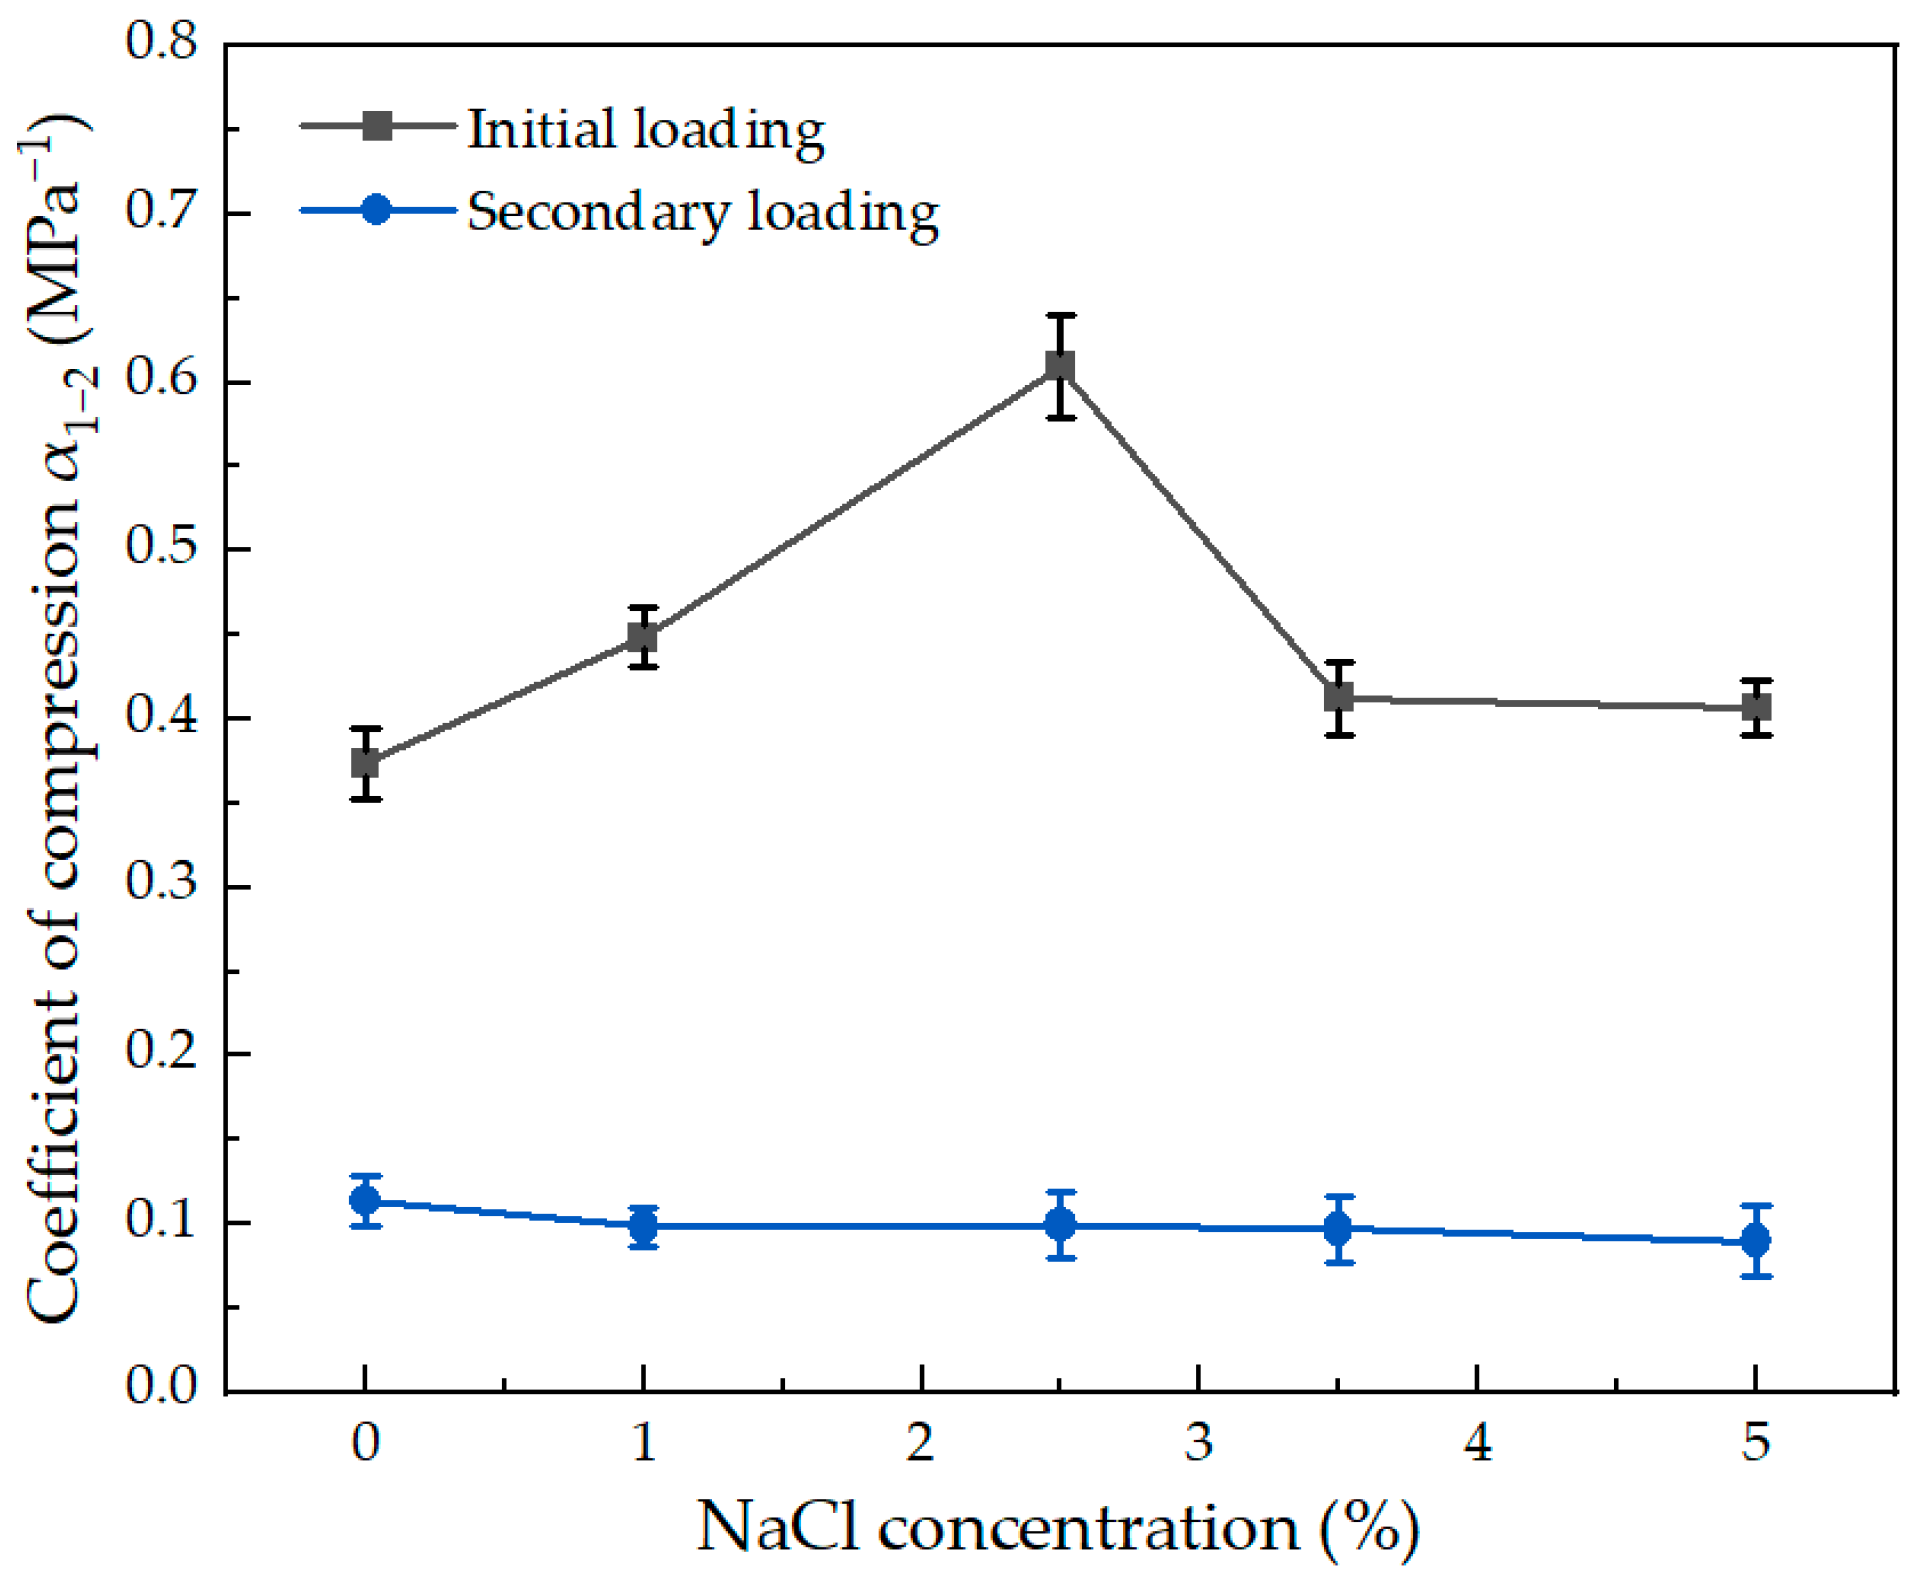
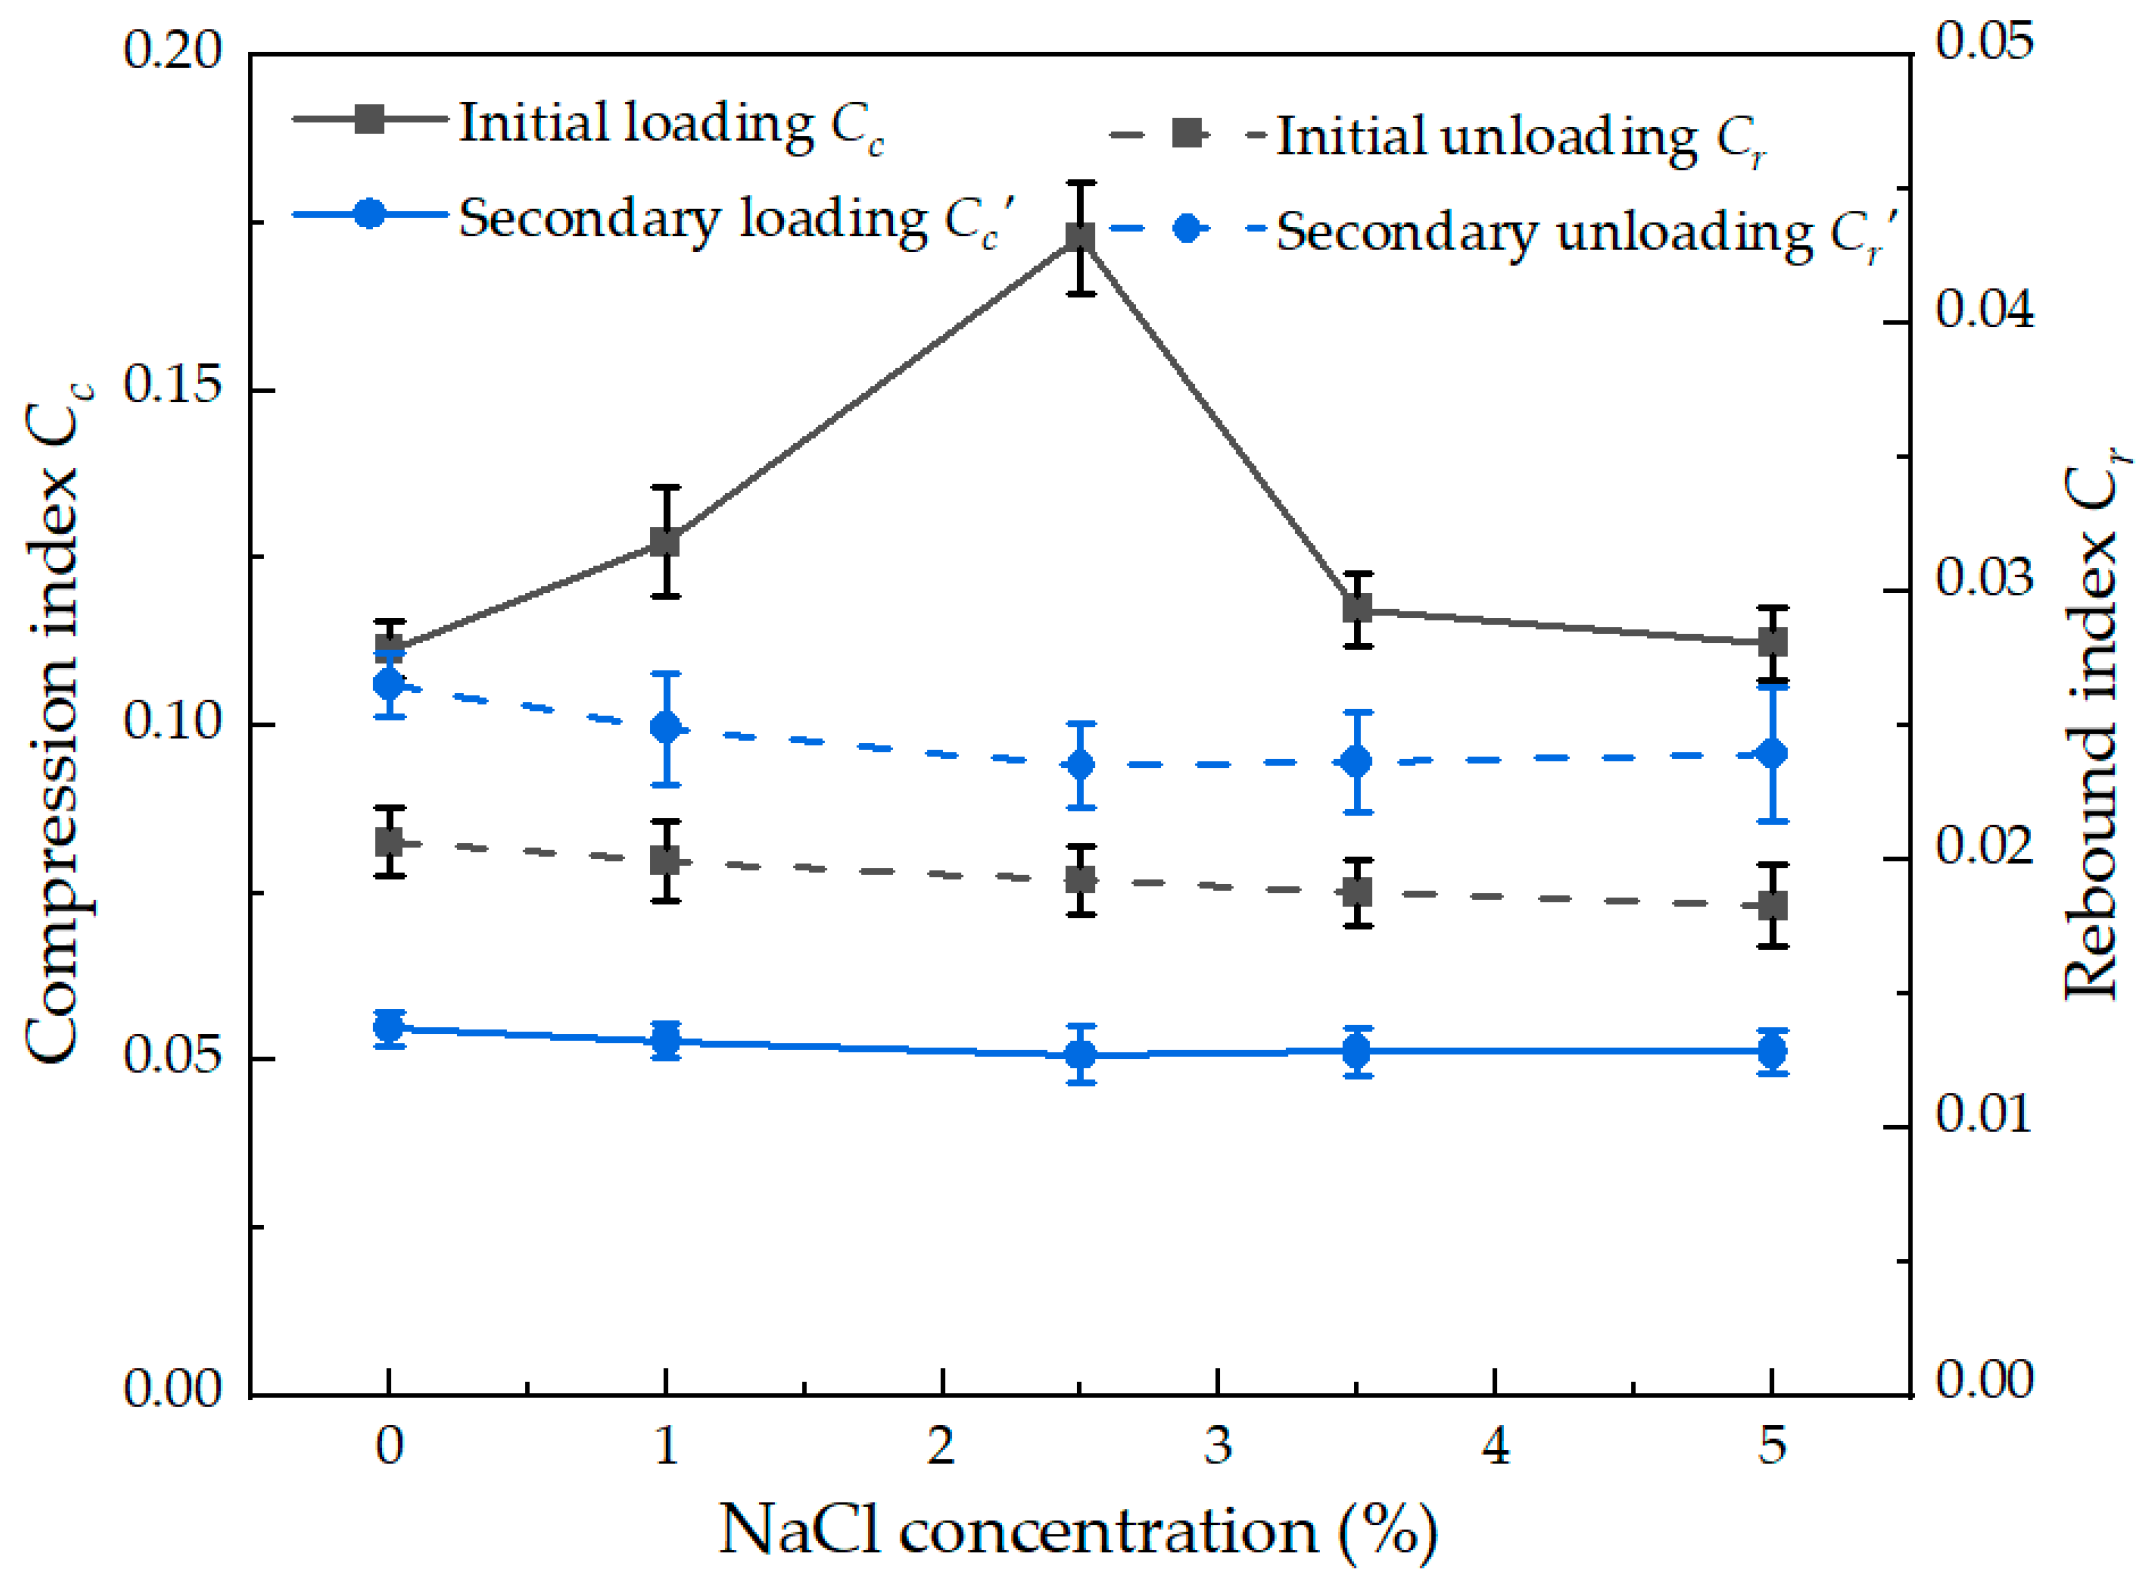
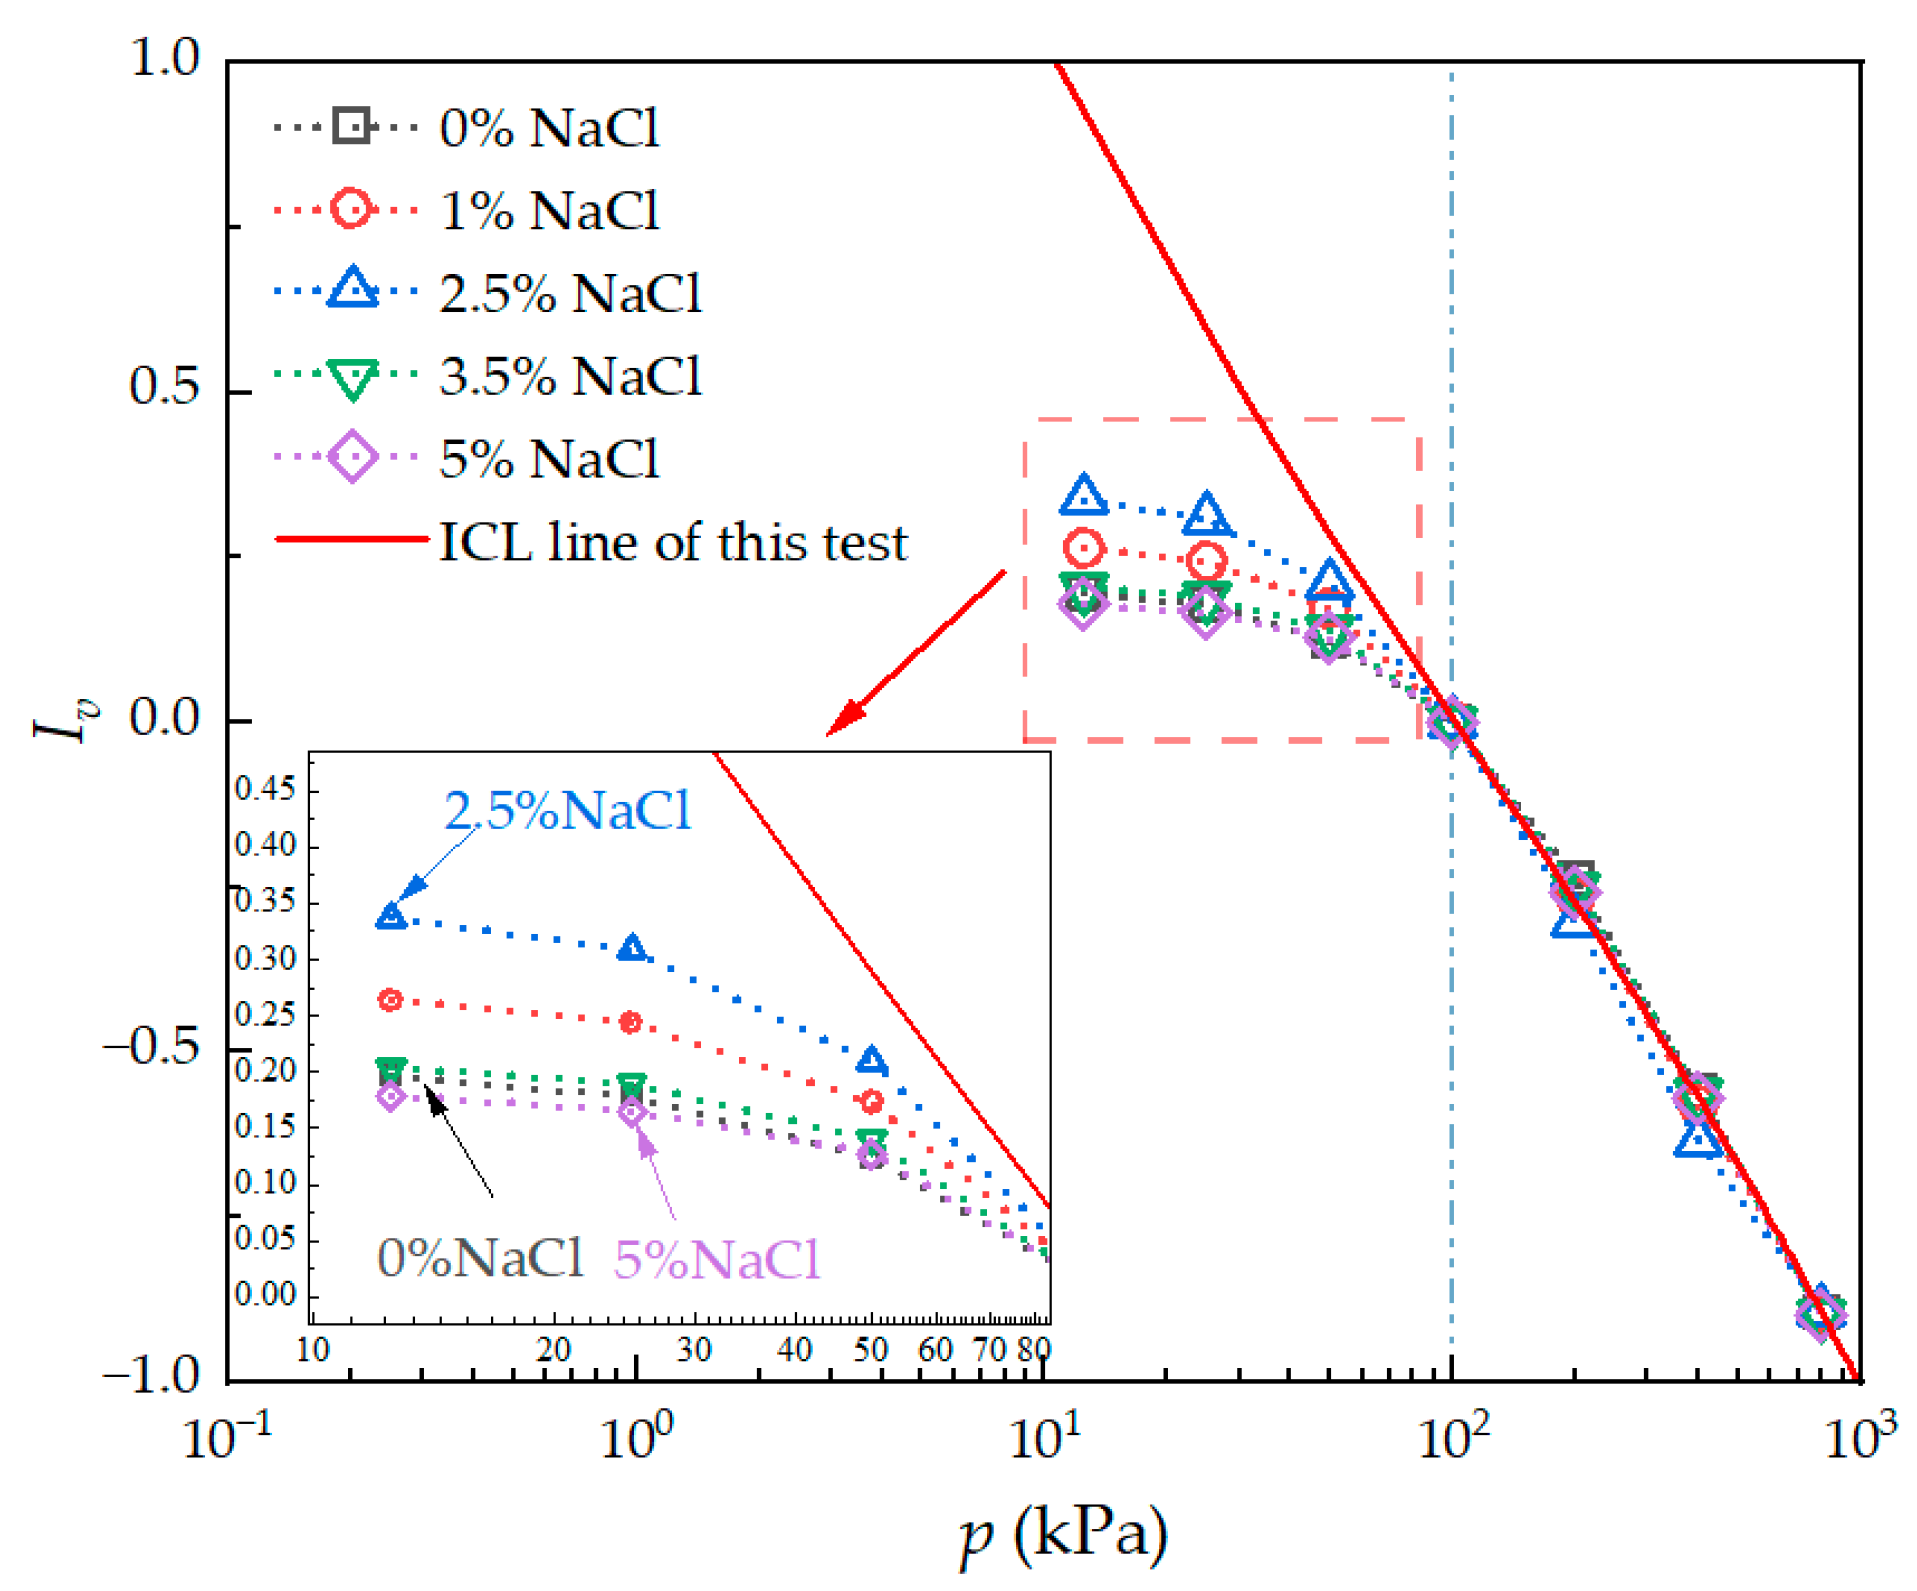
3.2. Effect of NaCl Concentration on Compressibility Index

Coefficient of compression α1–2 at compression pressure of 100~200 kPa can directly reflect soil compressibility. Figure 7 shows the relationship between α1–2 and NaCl concentration. It can be seen from the figure that in the first loading stage, the compressibility of soil samples basically increases first and then decreases with the increase of NaCl concentration, and reaches the peak value of 0.609 MPa−1 when NaCl concentration is 2.5%, showing high compressibility, while the compressibility is 0.35~0.45 MPa−1 at other NaCl concentrations, showing medium compressibility. In the second reloading stage, the compressibility of soil samples is not affected by NaCl concentration, and it is stable at 0.1 MPa−1. Pore water in the soil is discharged with the deformation of the soil, and the influence of salt in the pores on the compressibility of the soil is obviously weakened.
Compression index and rebound index are important parameters to describe the volume change characteristics of soil during loading and unloading. Figure 8 shows Variation curves of compression index and rebound index of soil samples with NaCl concentration. It can be seen from the figure that the compression index in the loading stage is similar to the compression coefficient, while the rebound index does not change with NaCl concentration, indicating that the rebound of compressed soil is not affected by the salt in pore water.
Figure 9 shows the relationship curve between consolidation coefficient and NaCl concentration of soil samples. It can be seen from Figure 9a that in the first loading stage, with the increase of NaCl concentration, the consolidation coefficient of soil samples first decreases and then increases. When NaCl concentration is 2.5%, the consolidation coefficient of soil samples is the smallest, and with the increase of compression pressure, the consolidation coefficient of soil samples changes more obviously. NaCl concentration in pore water of soil samples will affect the compression process of marine sedimentary soil. It can be seen from Figure 9b that the consolidation coefficient of soil samples is less affected by NaCl concentration at different compression pressures in the secondary loading stage, and reaches the maximum value of 6.5 × 10⁻⁴~7.5×10⁻⁴ m2/s at the compression pressure of 200 kPa, which reflects that the compression speed of soil is the fastest at the compression pressure of 200 kPa. For marine soil, if the NaCl concentration of pore water is not considered, the characteristic parameters of consolidation coefficient obtained by one-dimensional compression test are unsafe for practical engineering calculation. Due to the instability of actual seawater composition, the compression characteristics of marine sedimentary soil with 2.5% NaCl salt sensitivity should also be considered.
Burland [25] put forward the concept that the intrinsic compressibility index C c * , which is equal to e 100 * e 1000 * . Respectively, e 100 * and e 1000 * are the pore ratios of soil samples with compression pressures of 100 kPa and 1000 kPa. As can be seen from Figure 10, with the increase of pore water concentration, C c * first increases and then decreases, while e 100 * first decreases and then increases, both of which reach the maximum at 2.5% NaCl concentration. Void index I v is an important parameter to describe the change behavior of compression volume under different stresses p during soil compression. Normalize the void index Iv under different compression pressures, and get the Equation (1). Interestingly, as shown in Figure 11, the reconstituted marine sedimentary soil with different salt concentrations can finally fall on this curve after the compression pressure is greater than 100 kPa. At low pressure, the curve of soil sample with 2.5%NaCl concentration is closer to the curve, while the low and high concentrations are farther away.
I v = 2.65 2.102 ( log p ) + 0.582 ( log p ) 2 0.096 ( log p ) 3

4. SEM Scanning Test Results and Analysis

4.1. SEM Image Results and Processing

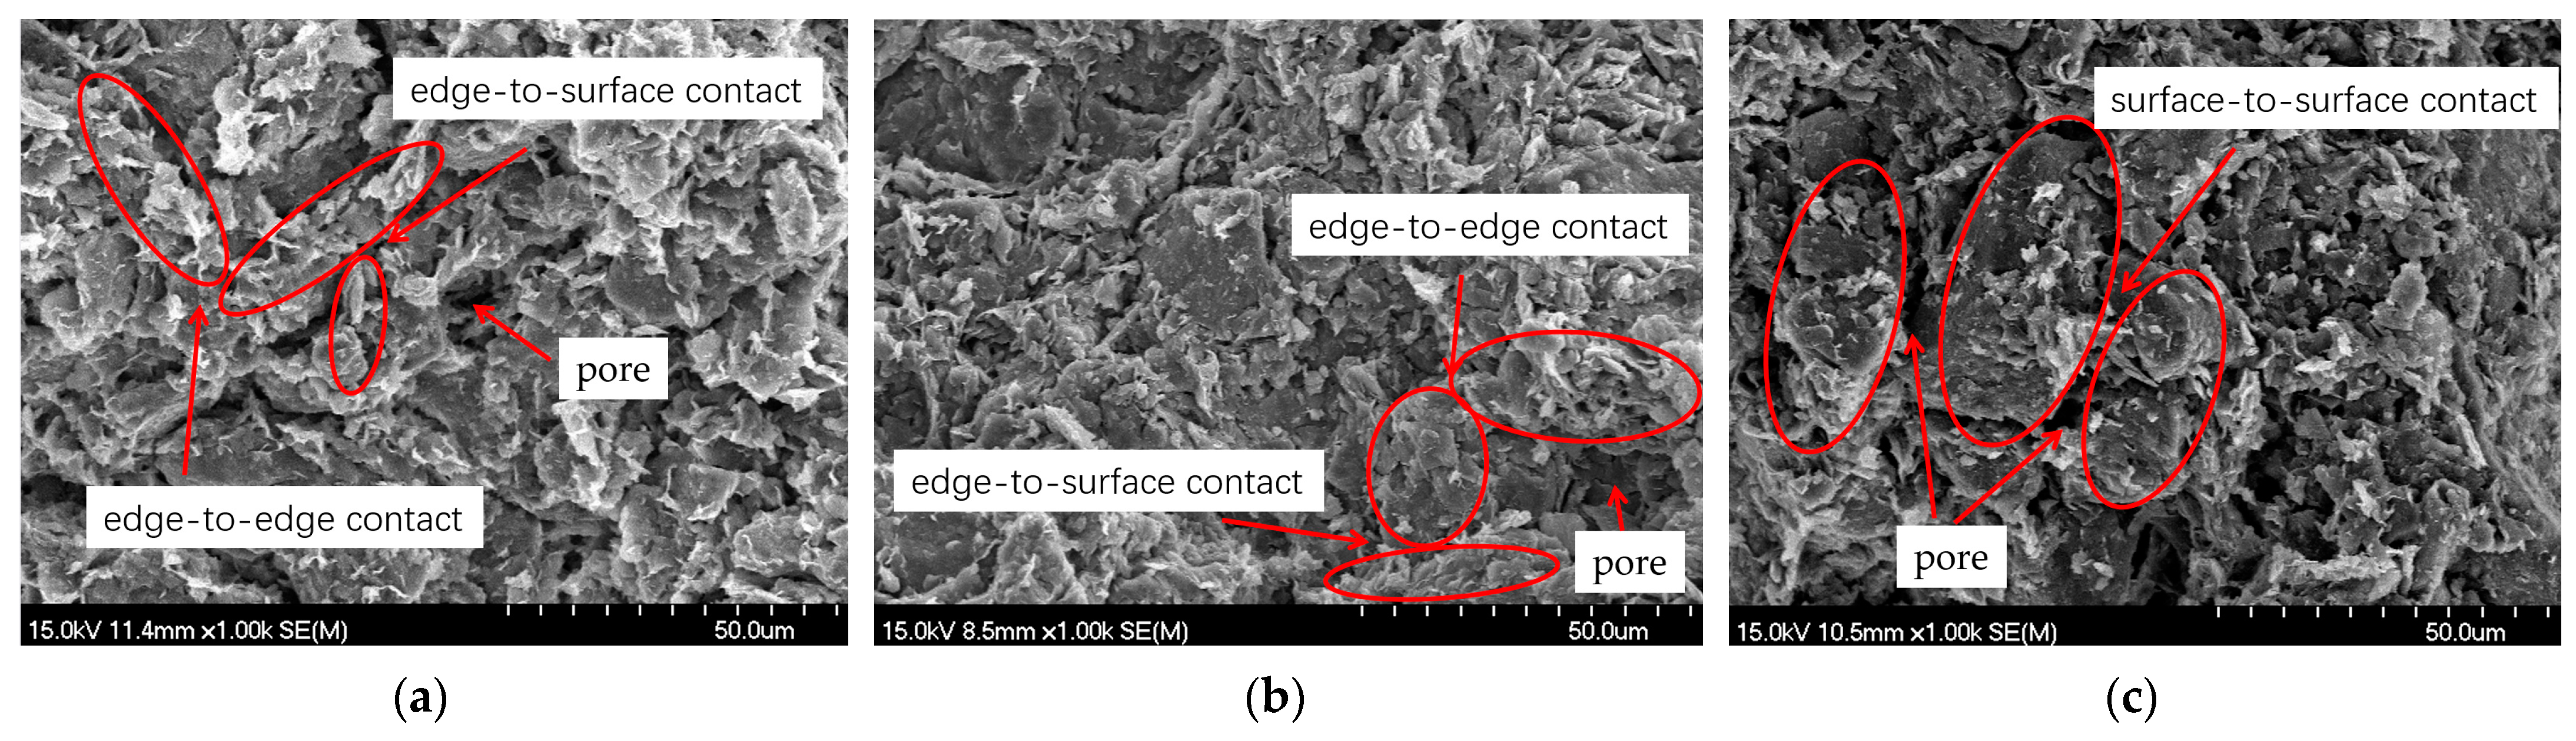
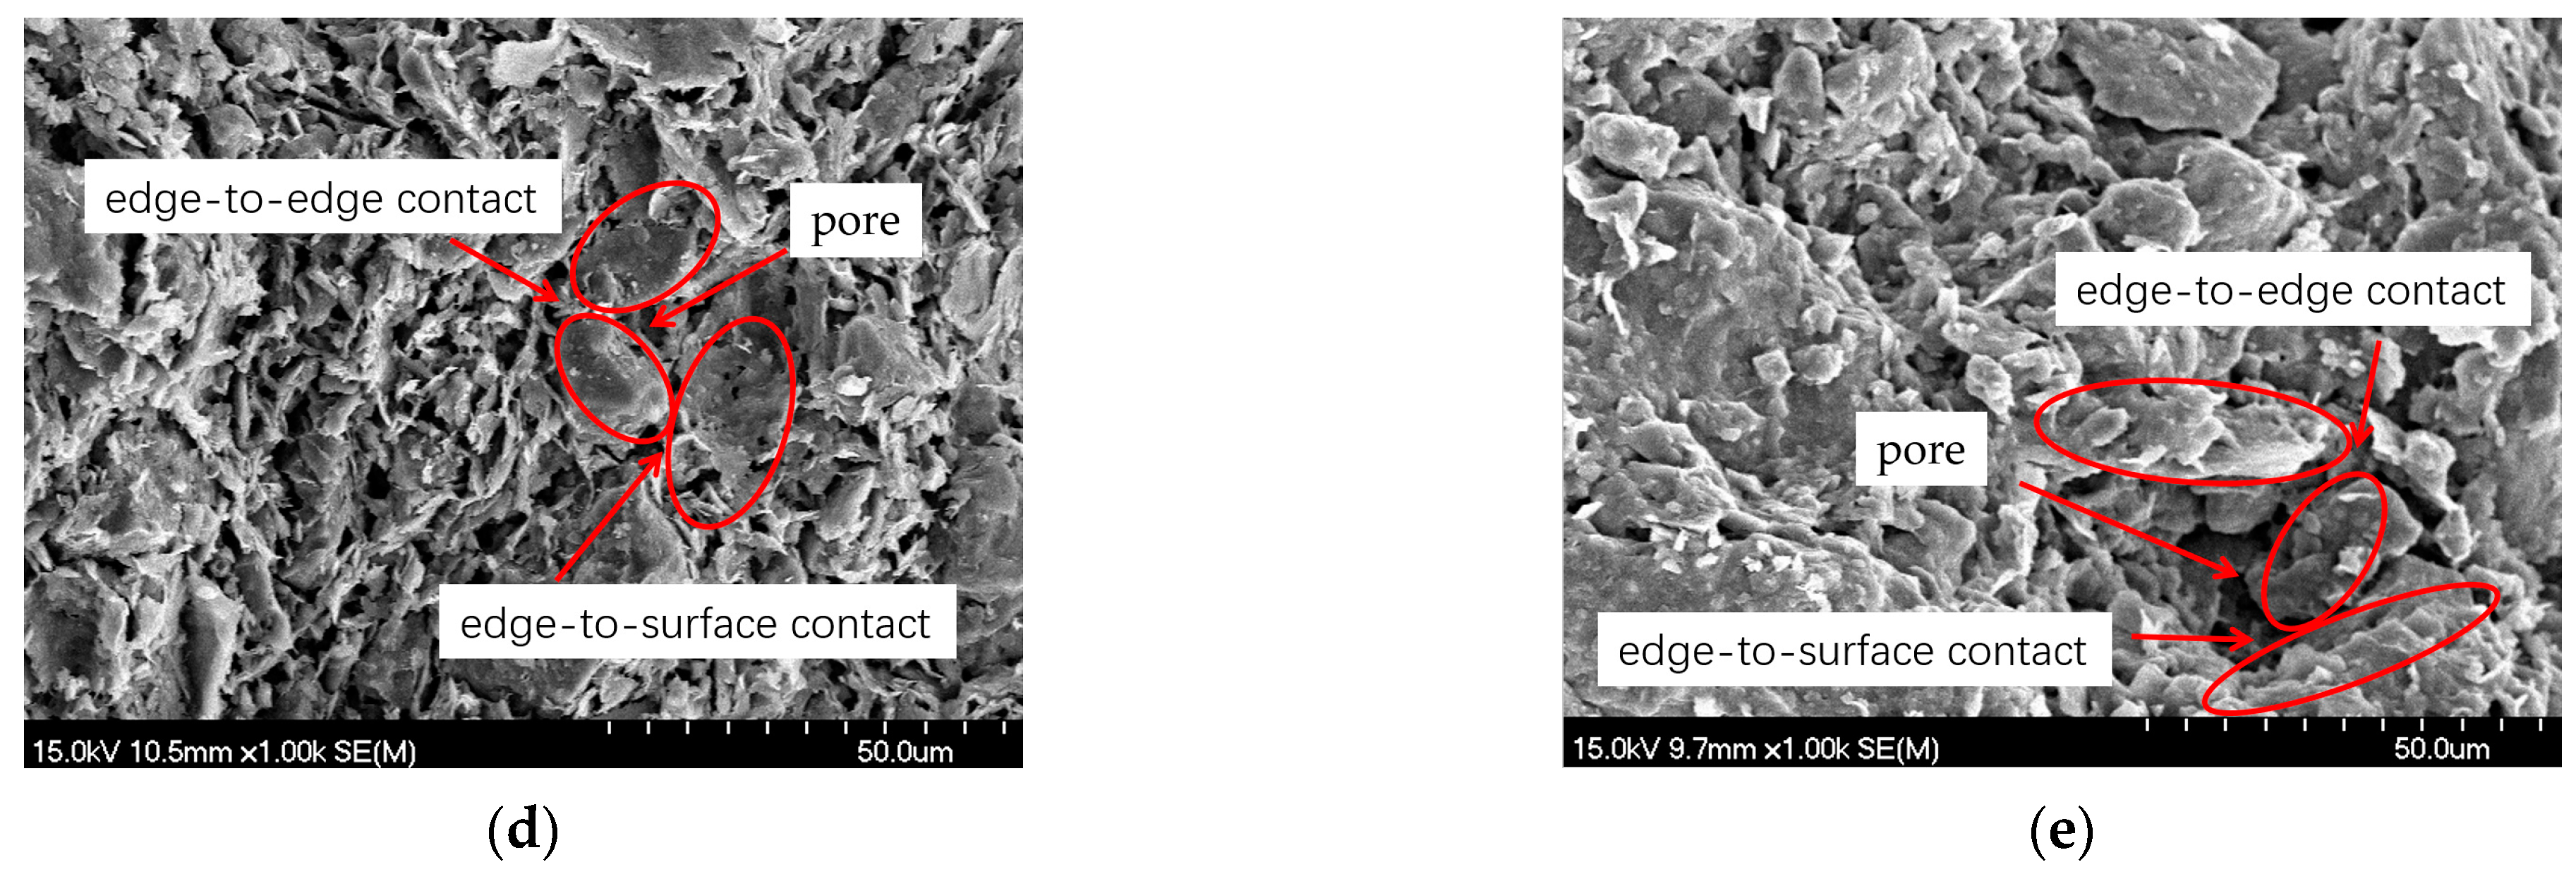
4.1.1. Preliminary Observation of SEM Image

The soil skeleton and pore morphology of SEM images with different concentrations were observed by naked eyes. All kinds of soil samples show consistent laws under different pore NaCl concentrations. Taking the 1000-fold enlarged image of pre-compressed soil samples as an example, as shown in Figure 12 below, it can be found that the soil skeleton particles unaffected by salt are mainly agglomerated, and the flocculated shape is obvious. With the increase of pore NaCl concentration, floc-like particles become more and more obvious, even showing granular shapes, and the skeleton links gradually change from edge-to-surface contact and edge-to-edge contact to surface contact; When the NaCl concentration in pores is 2.5%, the aggregate particles of soil skeleton are obviously reduced, and the connection of skeleton gradually changes back to edge-to-surface contact and edge-to-edge contact [21].

4.1.2. Binary Segmentation Method

Image processing and quantitative analysis are carried out by image analysis software. The depth of a pixel in an image can be regarded as the linear distance from the point to the lens. After processing the image with filters, a certain gray value Zi (0~255) is taken as the threshold, the area with gray value higher than the threshold is taken as soil particles, and the area below the threshold is taken as pores, and then the two-dimensional image is binarized, and a binary image under this threshold condition can be obtained.
To ensure accurate quantification of microstructural parameters, we established a grayscale threshold selection protocol. The threshold was determined by calibrating binarized SEM image porosity against experimentally measured values. Through systematic analysis of multiple SEM images from the same sample, we confirmed the consistency and reproducibility of our threshold selection approach (Figure 13). For instance, in the sample with 2.5% NaCl concentration, where initial porosity measured 0.4136, a threshold value of Zi = 68 produced a calculated porosity of 0.4138-representing less than 1% deviation (Figure 13). This validated threshold was subsequently applied for all microstructural parameter analyses. Notably, due to inherent variations in SEM imaging conditions across specimens, we implemented sample-specific threshold determination to maintain measurement accuracy.

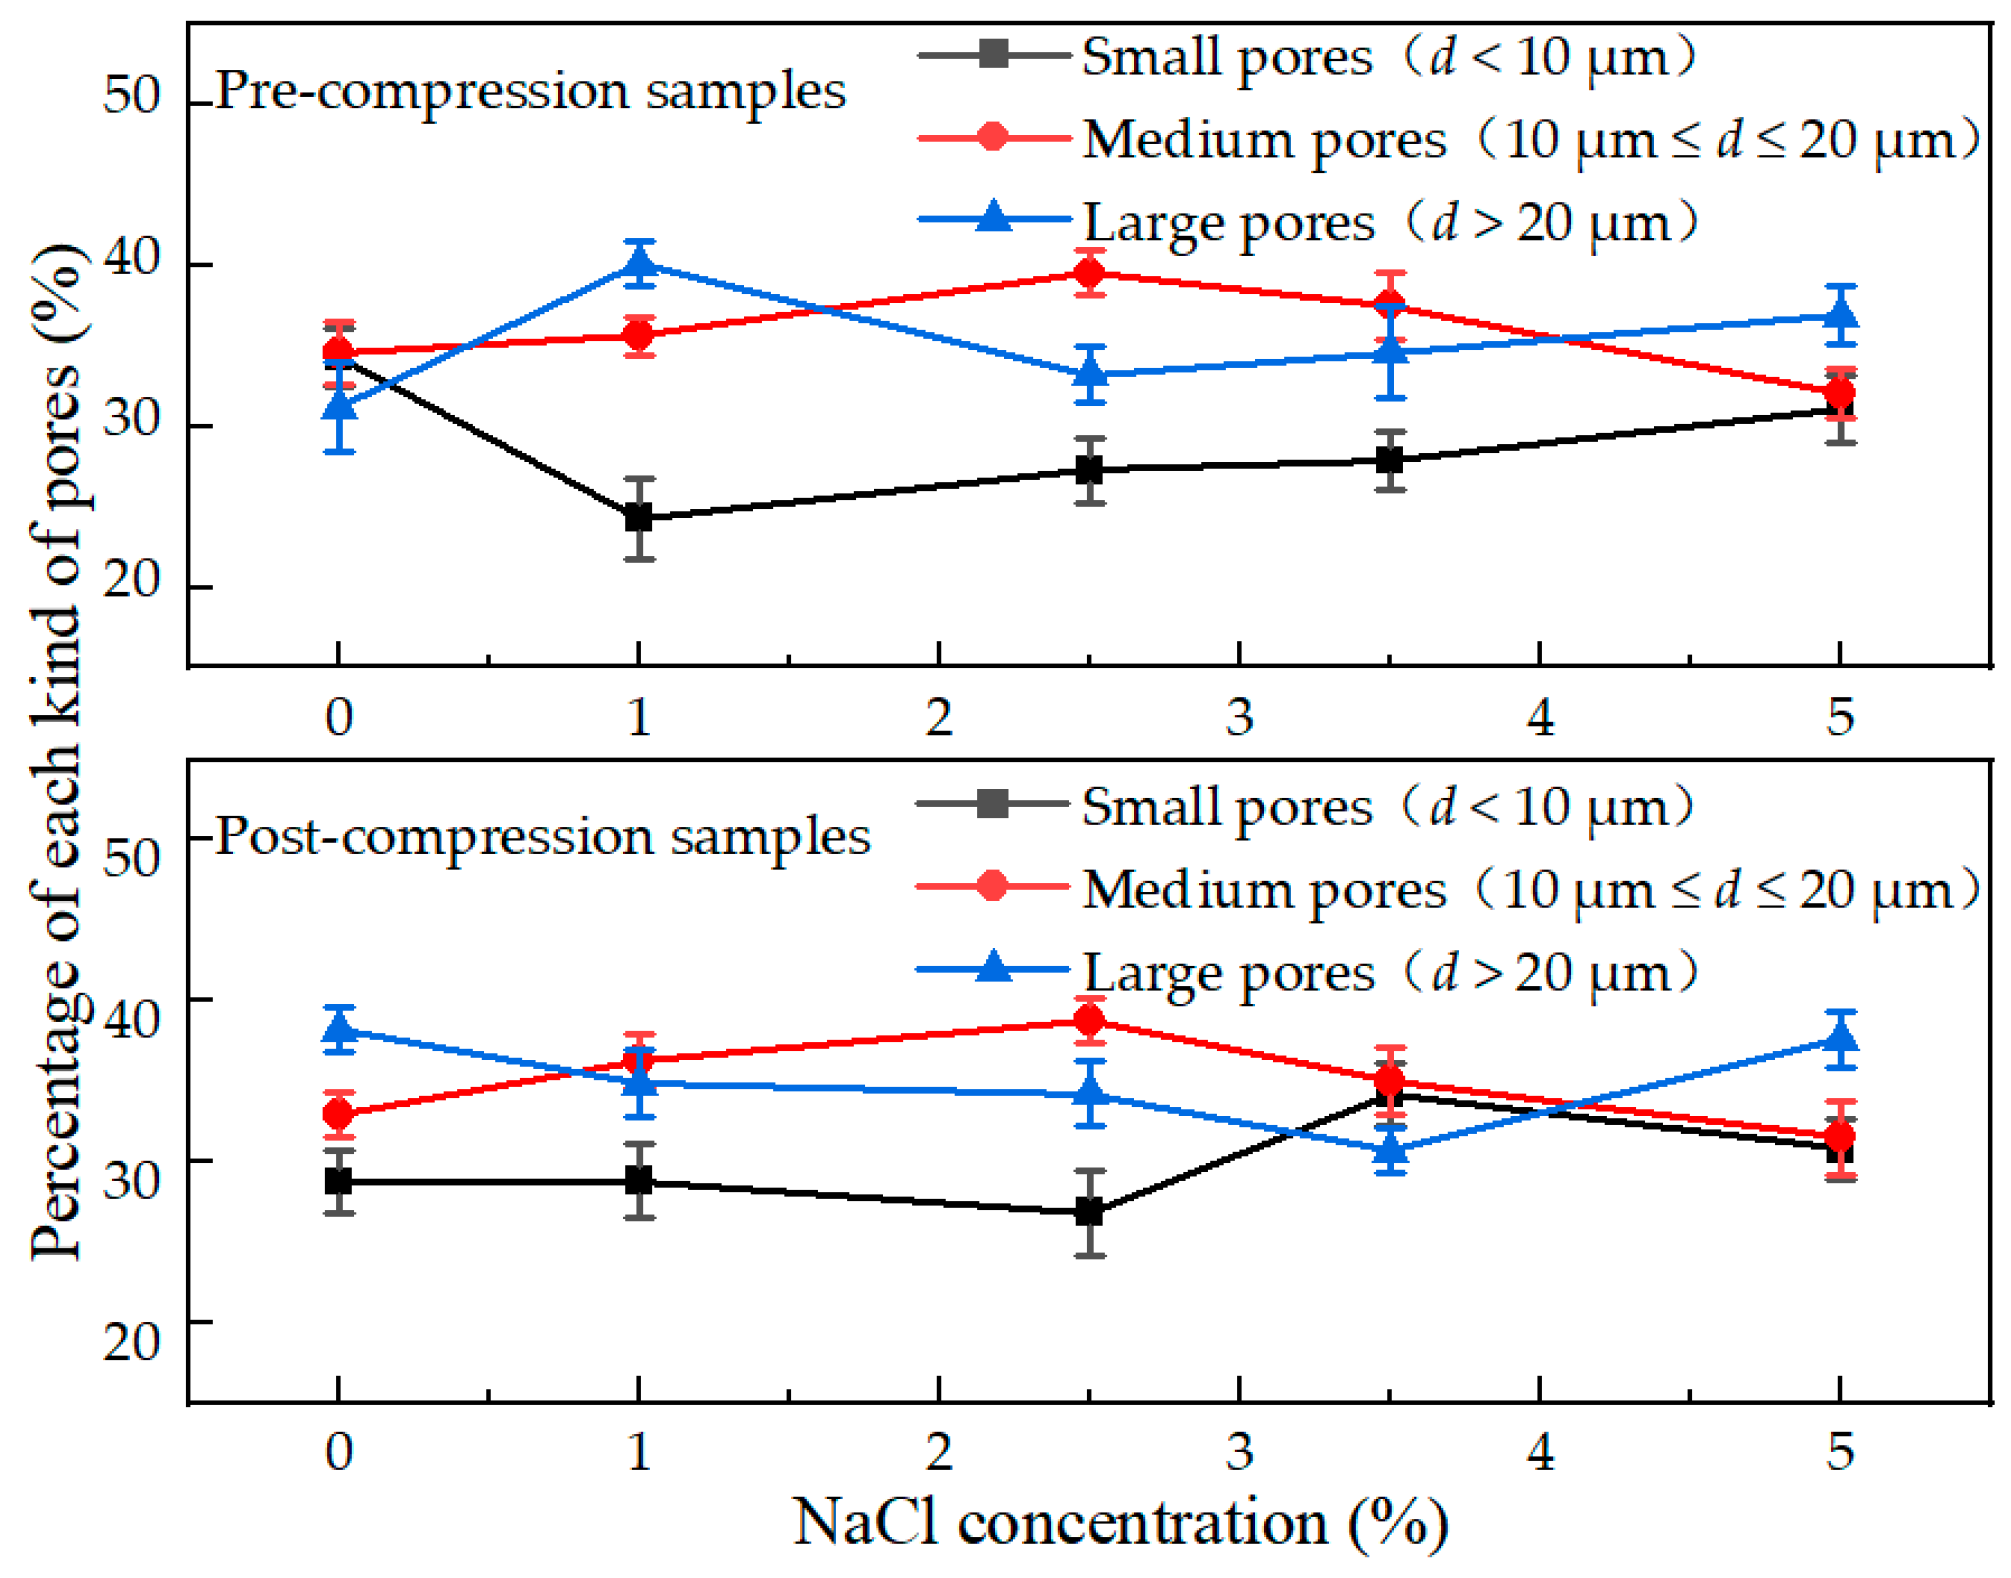
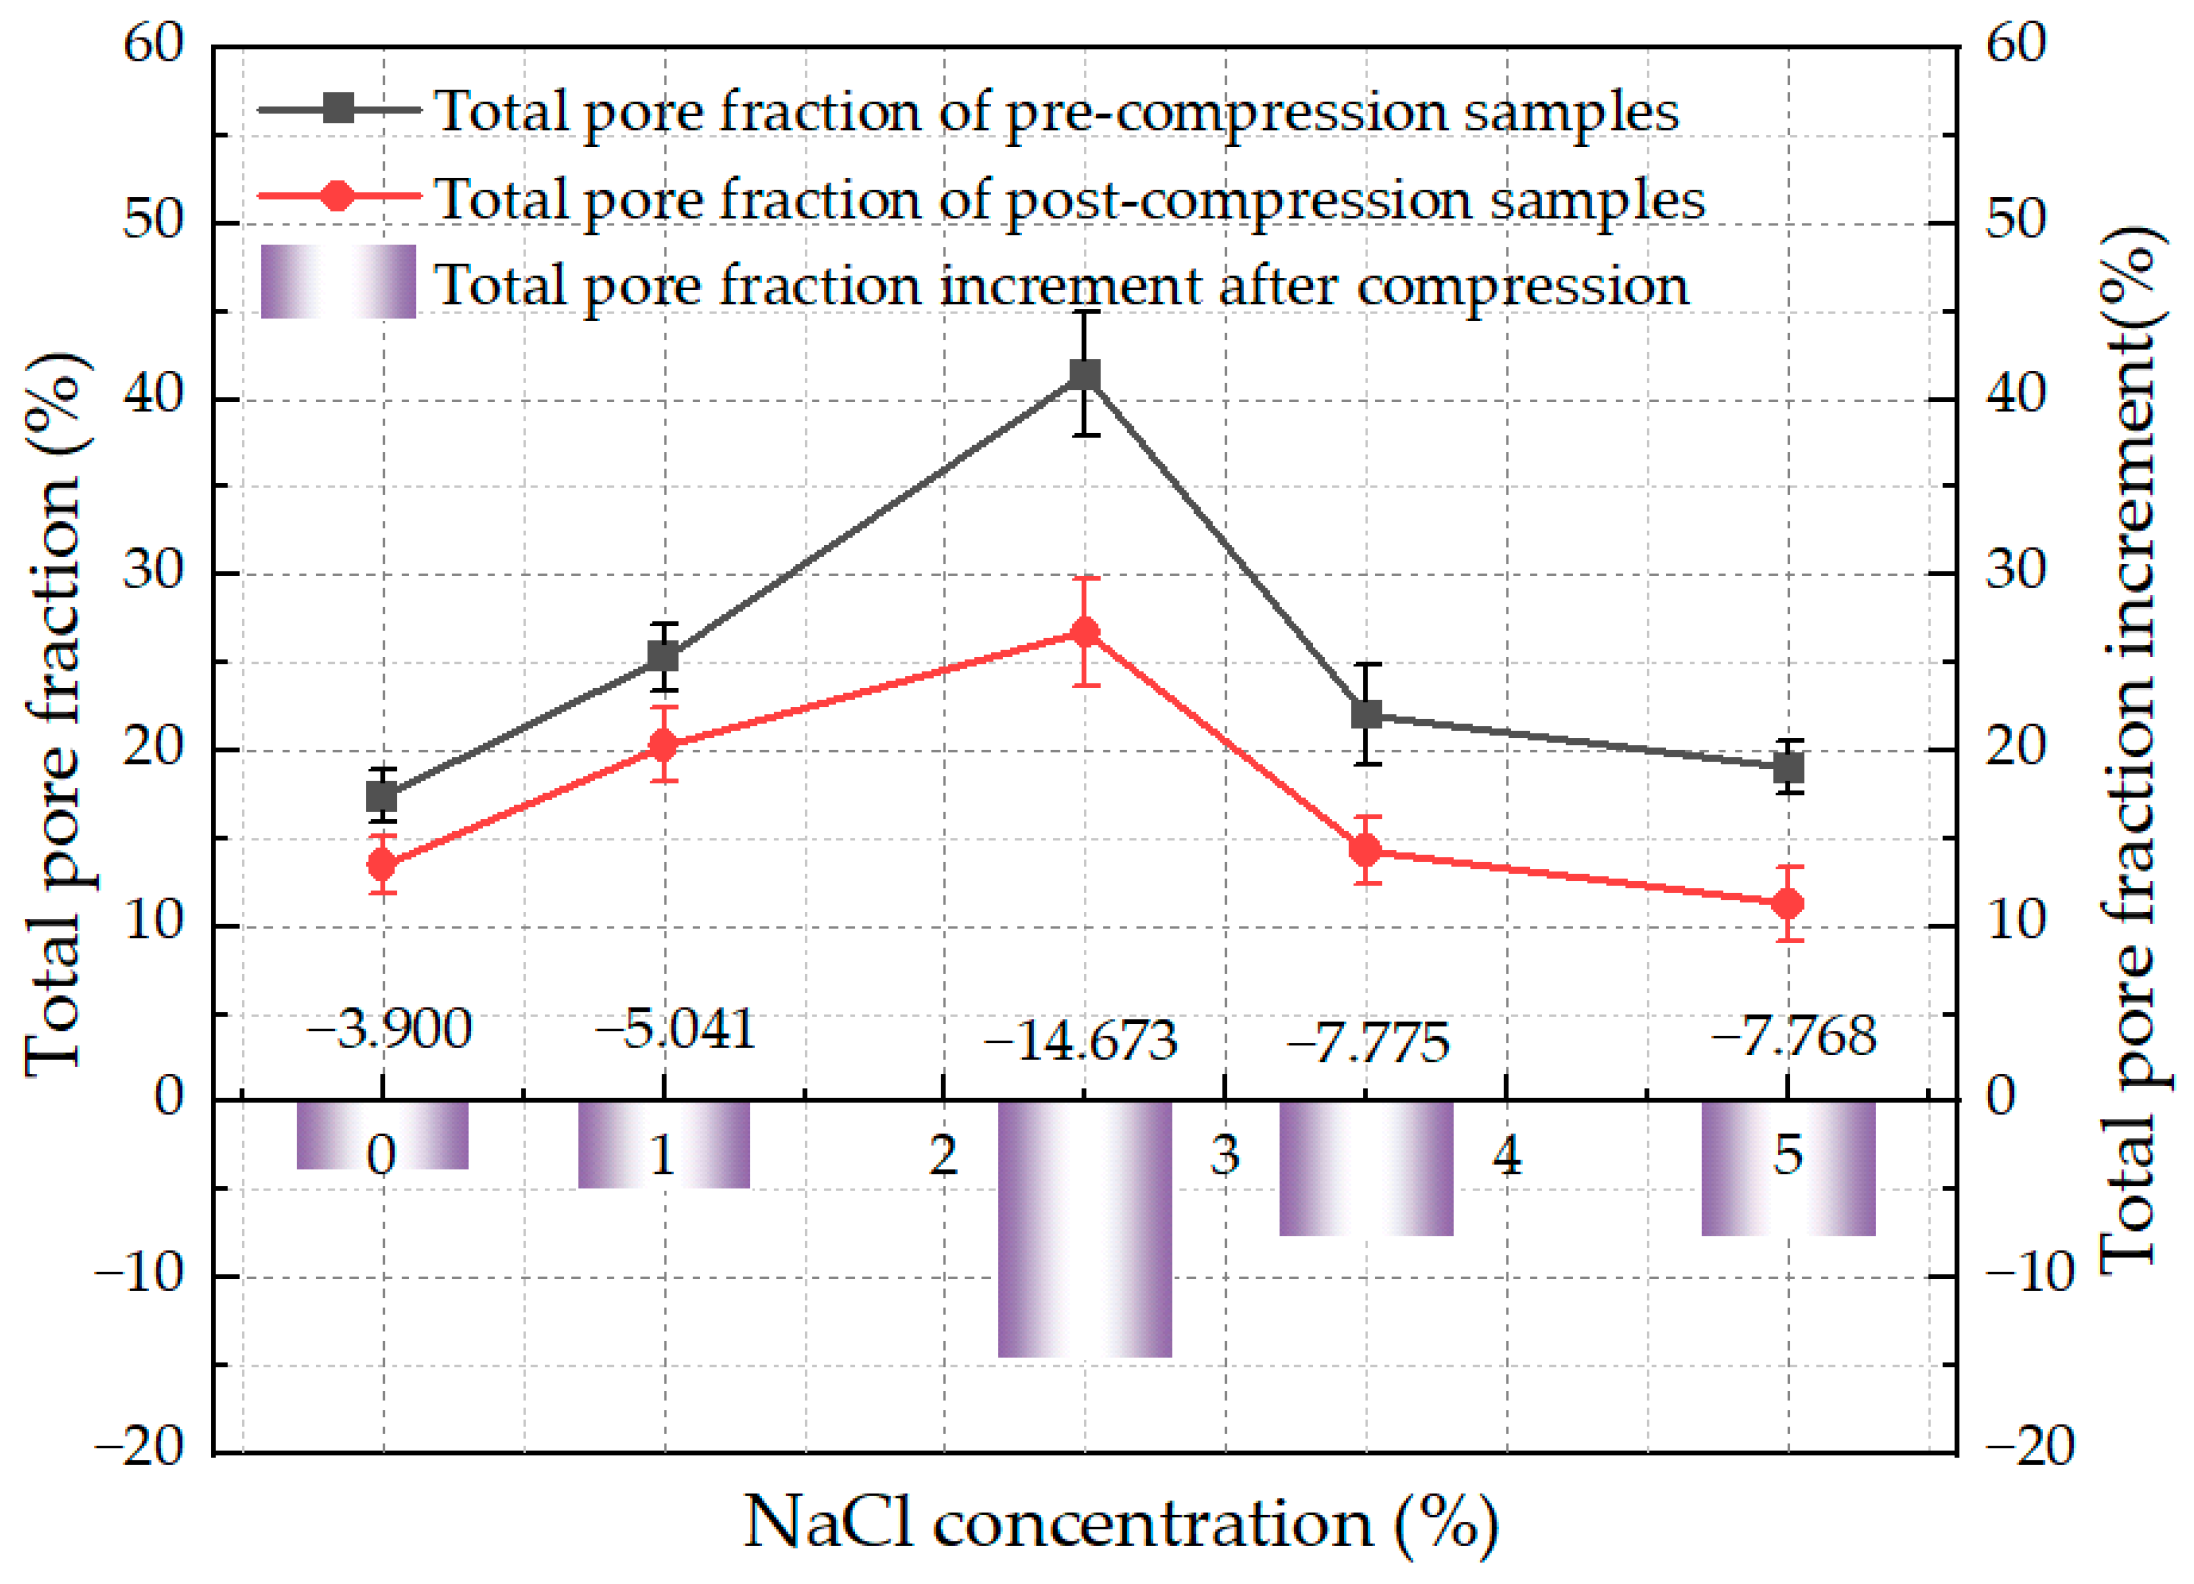
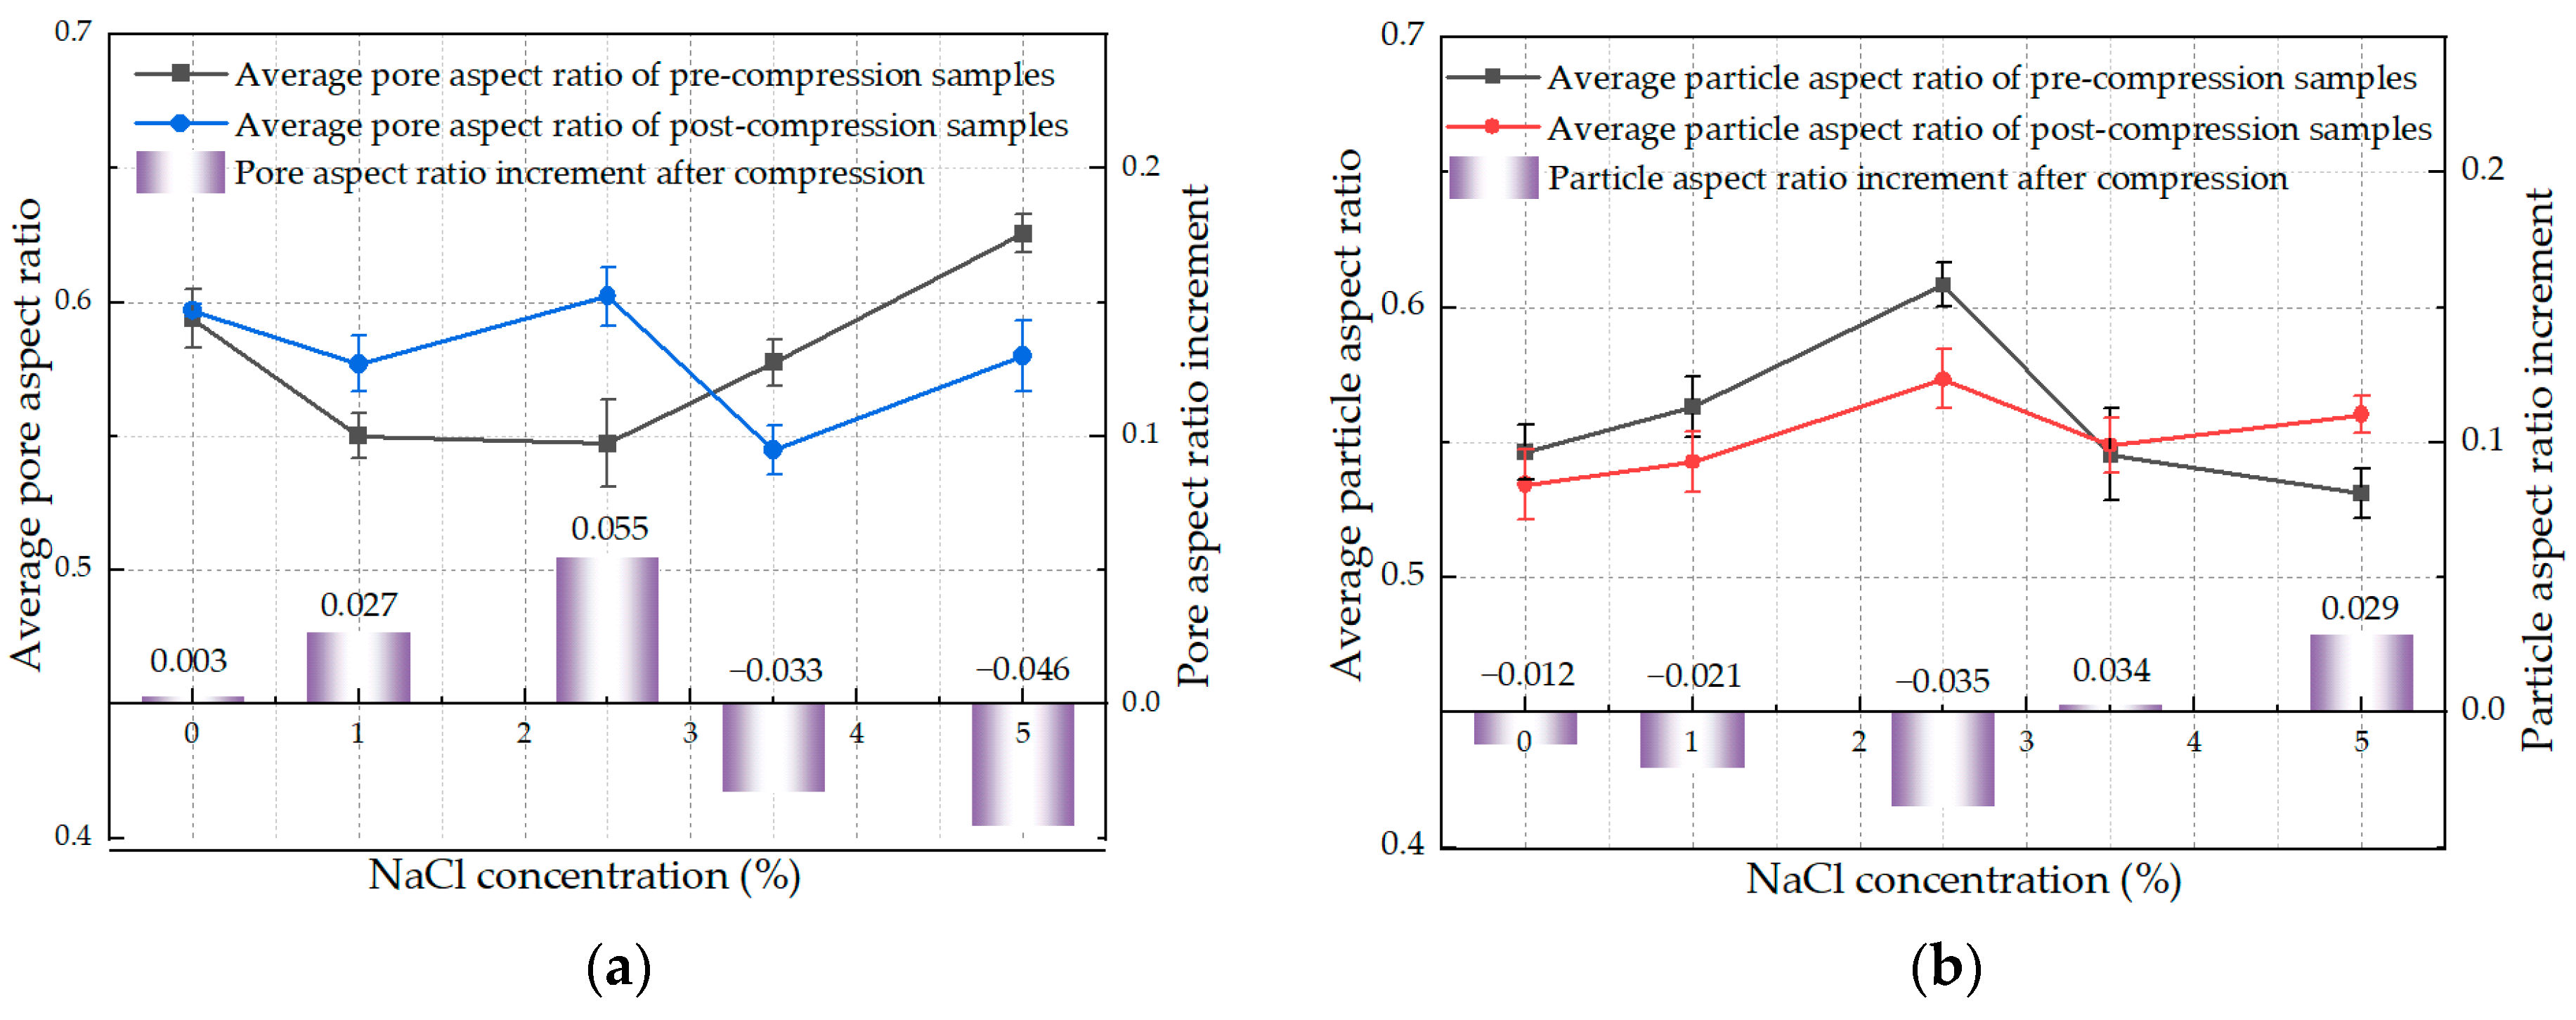
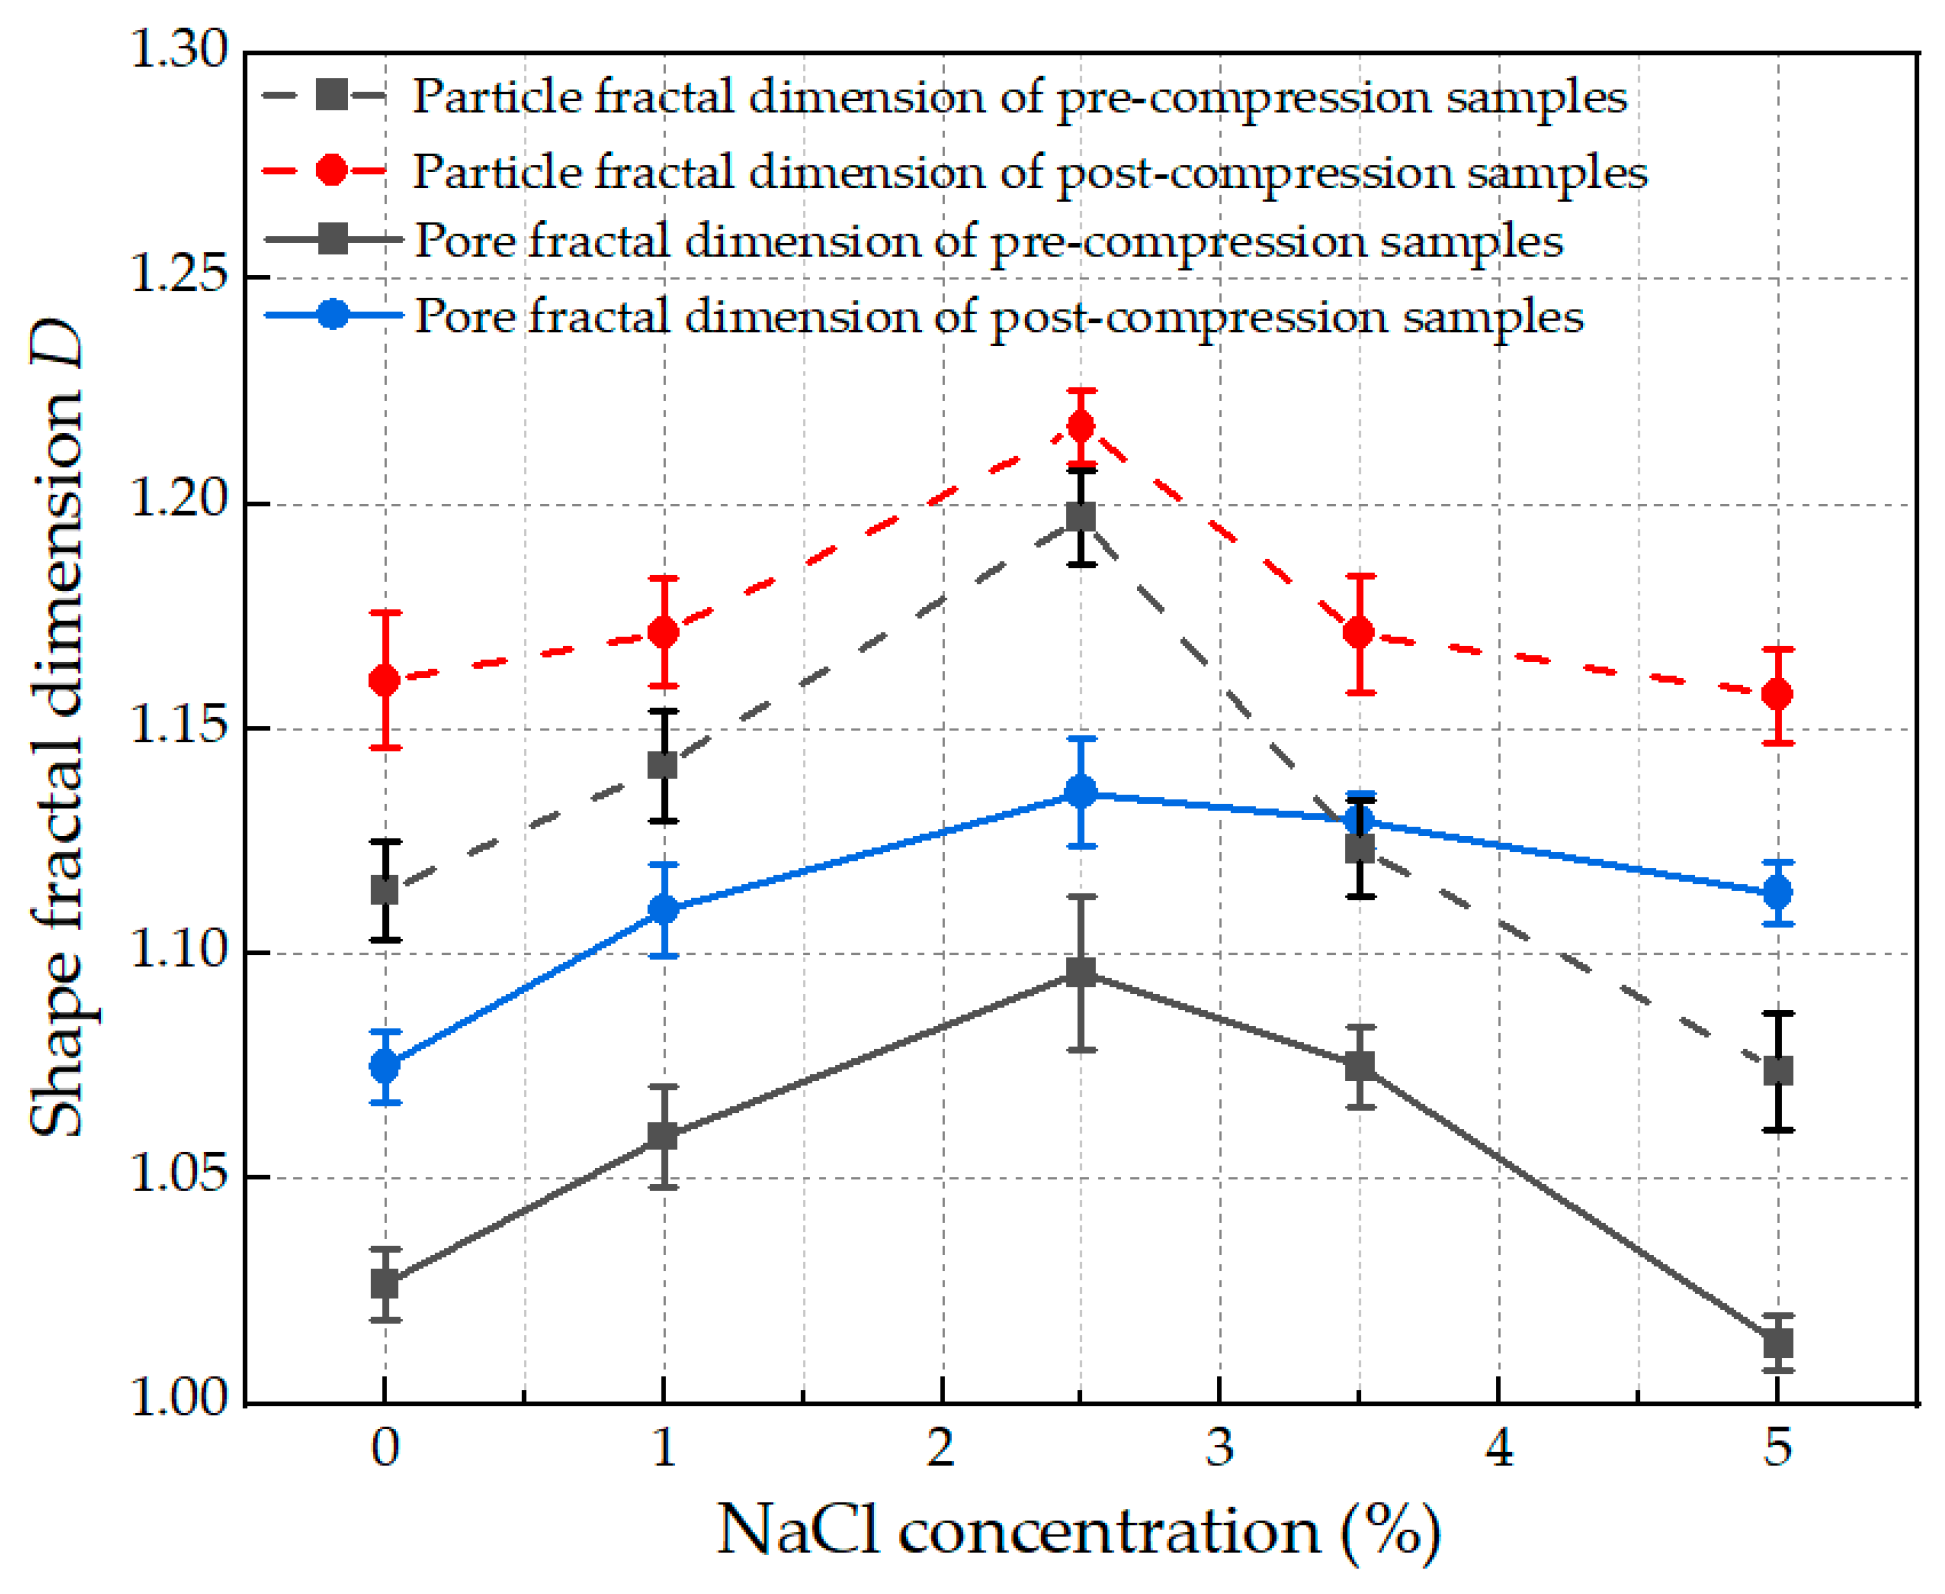
4.2. Effect of NaCl Concentration on Microstructure

Figure 14 shows the percentage of pores in soil samples before and after compression under different NaCl concentrations. It can be seen from the figure that the total number of small pores (d < 10 mm), medium pores (10 mm ≤ d ≤ 20 mm) and large pores (d > 20 mm) [26] in each soil sample is close to one third, and the proportion of small pores and macropores in soil samples fluctuates with NaCl concentration, and the proportion of medium pores first increases and then decreases with the increase of NaCl concentration, reaching a maximum of nearly 40 at 2.5% NaCl concentration. Some small pores and large pores are transformed into medium pores, and the transformation increases with the increase of NaCl concentration, and weakens after exceeding the threshold of 2.5%, and is not obvious until 5%.
Total pore fraction is the ratio of the pore area of soil samples to the area of the whole SEM image. Figure 15 shows the variation of total pore fraction of each soil sample and its increment before and after compression with NaCl concentration. It can be seen from the figure that the total pore fraction of pre-compression soil samples first increases and then decreases with the increase of NaCl concentration, and the maximum value is 41.385% near 2.5% NaCl concentration, while the total pore fraction of post-compression soil samples has no clear correlation with NaCl concentration; The decrease of total pore fraction of soil samples before and after compression first decreases with the increase of NaCl concentration, and reaches the maximum value of 14.673% at 2.5% NaCl concentration, which shows that the existence of pore water salt has an influence on the change of pore area of soil during compression deformation, and its promoting effect increases rapidly in the range of 2.5% NaCl concentration, and then decreases after exceeding 2.5% NaCl concentration. Therefore, it can be inferred that the effect of pore water salt in the middle concentration can be concentrated to the middle pore by changing the diameter of some pores, and it can also affect the narrowing of pores during compression, but its effect is not obvious at the lower or higher pore water salt concentration.
Figure 16 shows the relationship between soil porosity and particle aspect ratio (the ratio of short axis B to long axis L) and NaCl concentration. As can be seen from the figure, the porosity and particle aspect ratio of each soil sample are mainly concentrated in the range of 0.52~0.65, and the structures are mostly oblate, with few elongated and equiaxed pores. After compression, compared with before compression, the increment of pore aspect ratio first decreases and then increases with the increase of NaCl concentration, while the increment of particle aspect ratio first increases and then decreases, all of which reach the maximum value at 2.5% NaCl concentration, which shows that when the NaCl concentration is less than 2.5%, the pore water salinity promotes the development of soil particles to round shape under compression, and the pores develop to long and narrow shape under compression, showing a reverse evolution after exceeding the NaCl concentration threshold of 2.5%.
Fractal dimension of shape is one of the important parameters to comprehensively characterize the regularity of internal pores or particles and the complexity of external contour of soil, and its formula (2) is as follows:
lg P = D 2 lg A + C
P-equivalent perimeter of pores or particles; A-the area of soil particles or pores; C-constant; D-fractal dimension of the shape of pores or particles.
Figure 17 shows the relationship between fractal dimension of pore and particle shape and NaCl concentration. It can be seen from the figure that the fractal dimensions of both pore and particle structures rise continuously until 2.5% NaCl concentration, attaining maximum values of 1.09–1.14 for pores and 1.18–1.23 for particles, followed by a sustained decrease at higher salinity levels. The results show that at 2.5% NaCl concentration, the geometric complexity of soil particles and pores is high, the deviation from smooth surface is far, the distortion is high, and the morphology of soil particles and pores is complex. Salinity promotes the roughness and distortion of soil particles and pore surfaces, and its effect increases with the increase of NaCl concentration, and gradually weakens when the NaCl concentration exceeds 2.5%. Due to the large amount of negative charge on the soil surface, Na+ in the solution adsorbs the surface of soil particles. When the ion concentration is small, the adsorbed Na+ is dispersed on the soil surface, which never increases the roughness of the particle surface. However, with the increase of the solution concentration, the adsorbed Na+ gradually forms a saturated covering [2], and the surface of soil particles tends to be smooth.

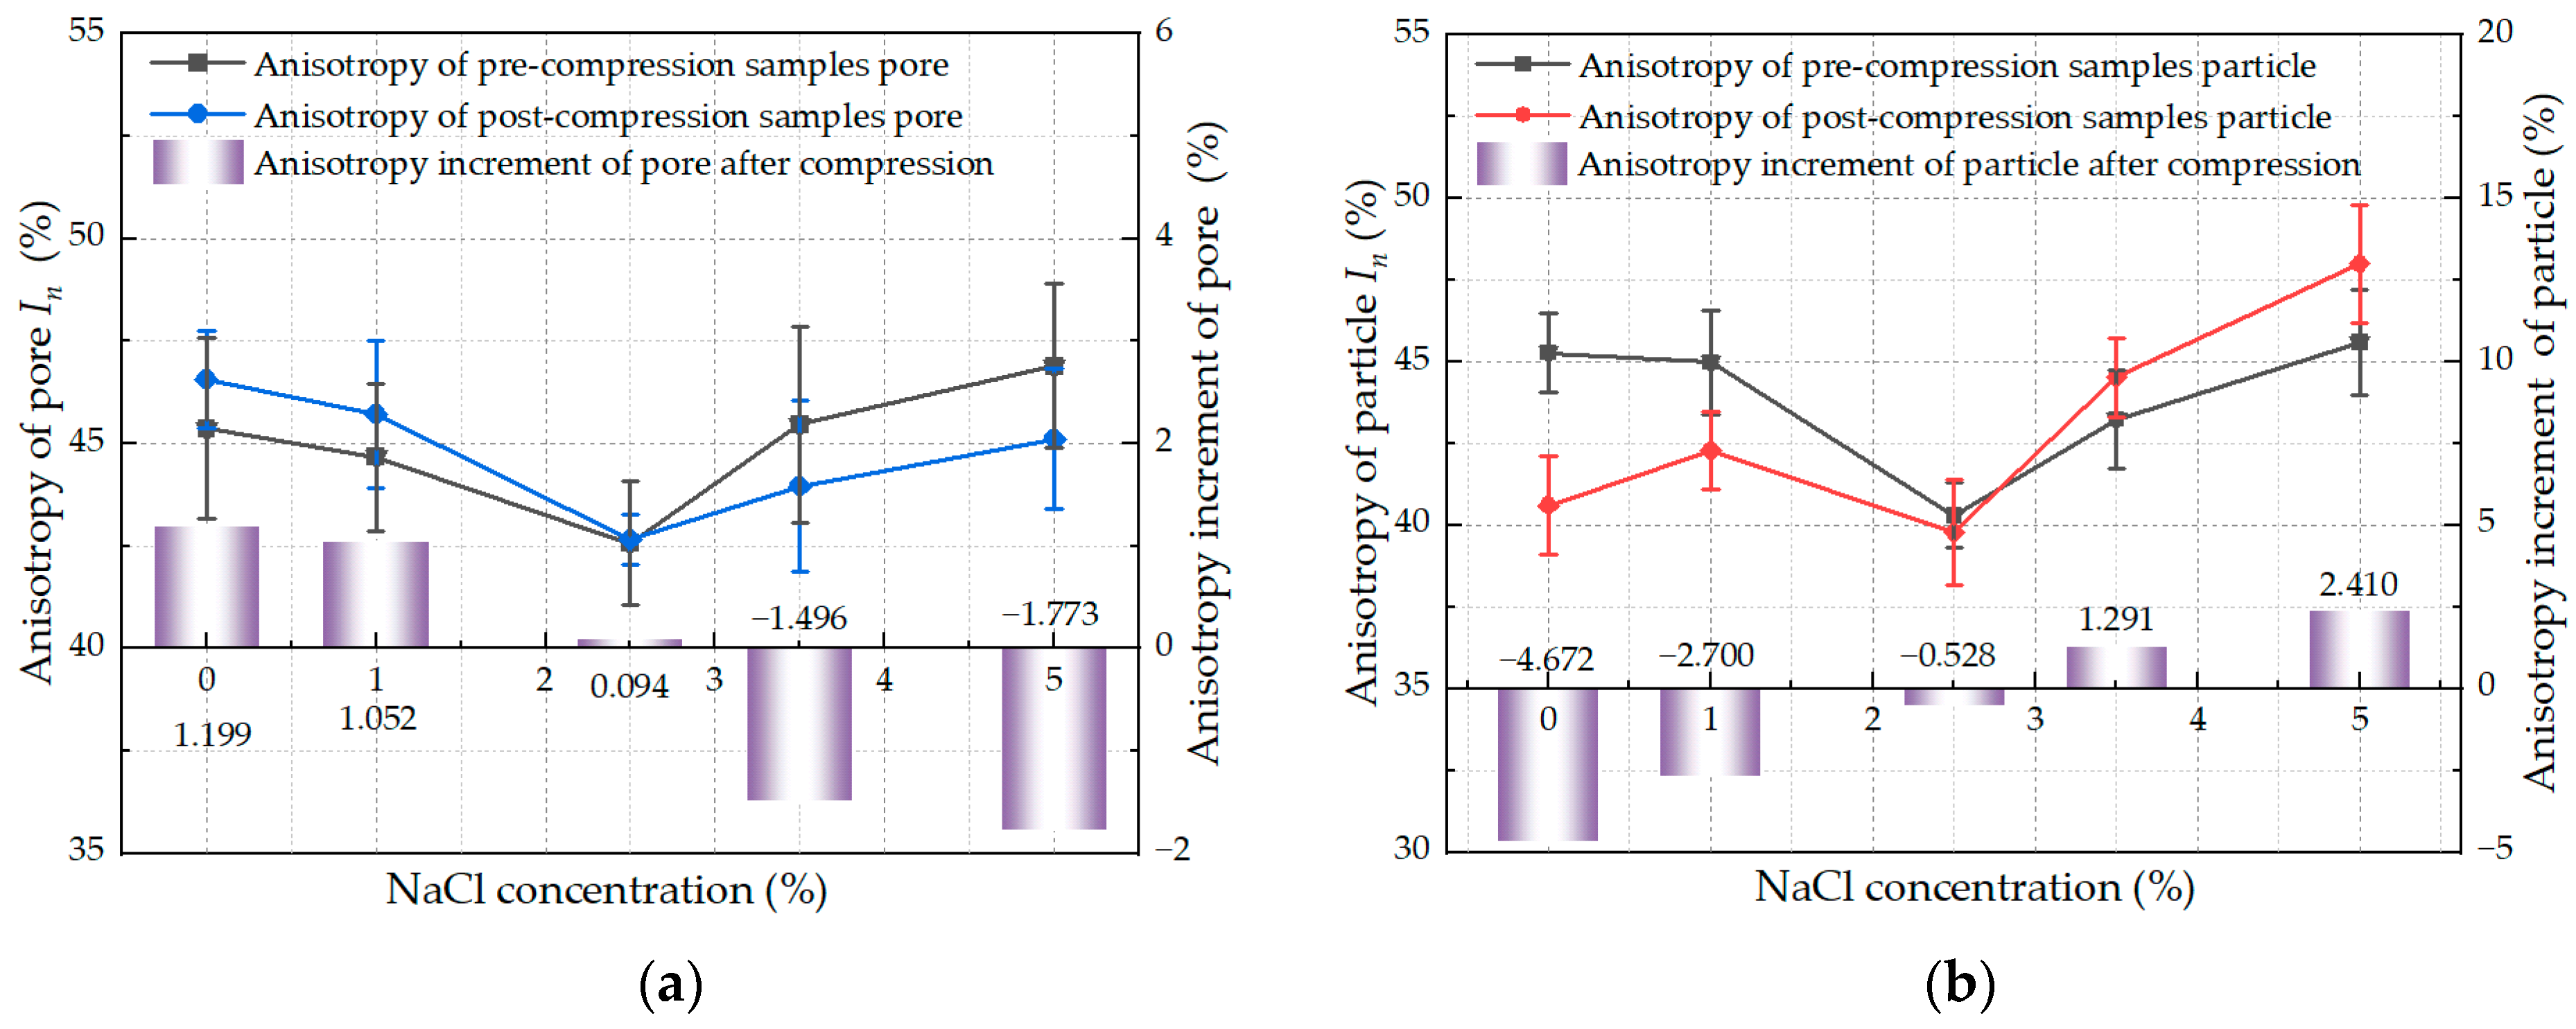
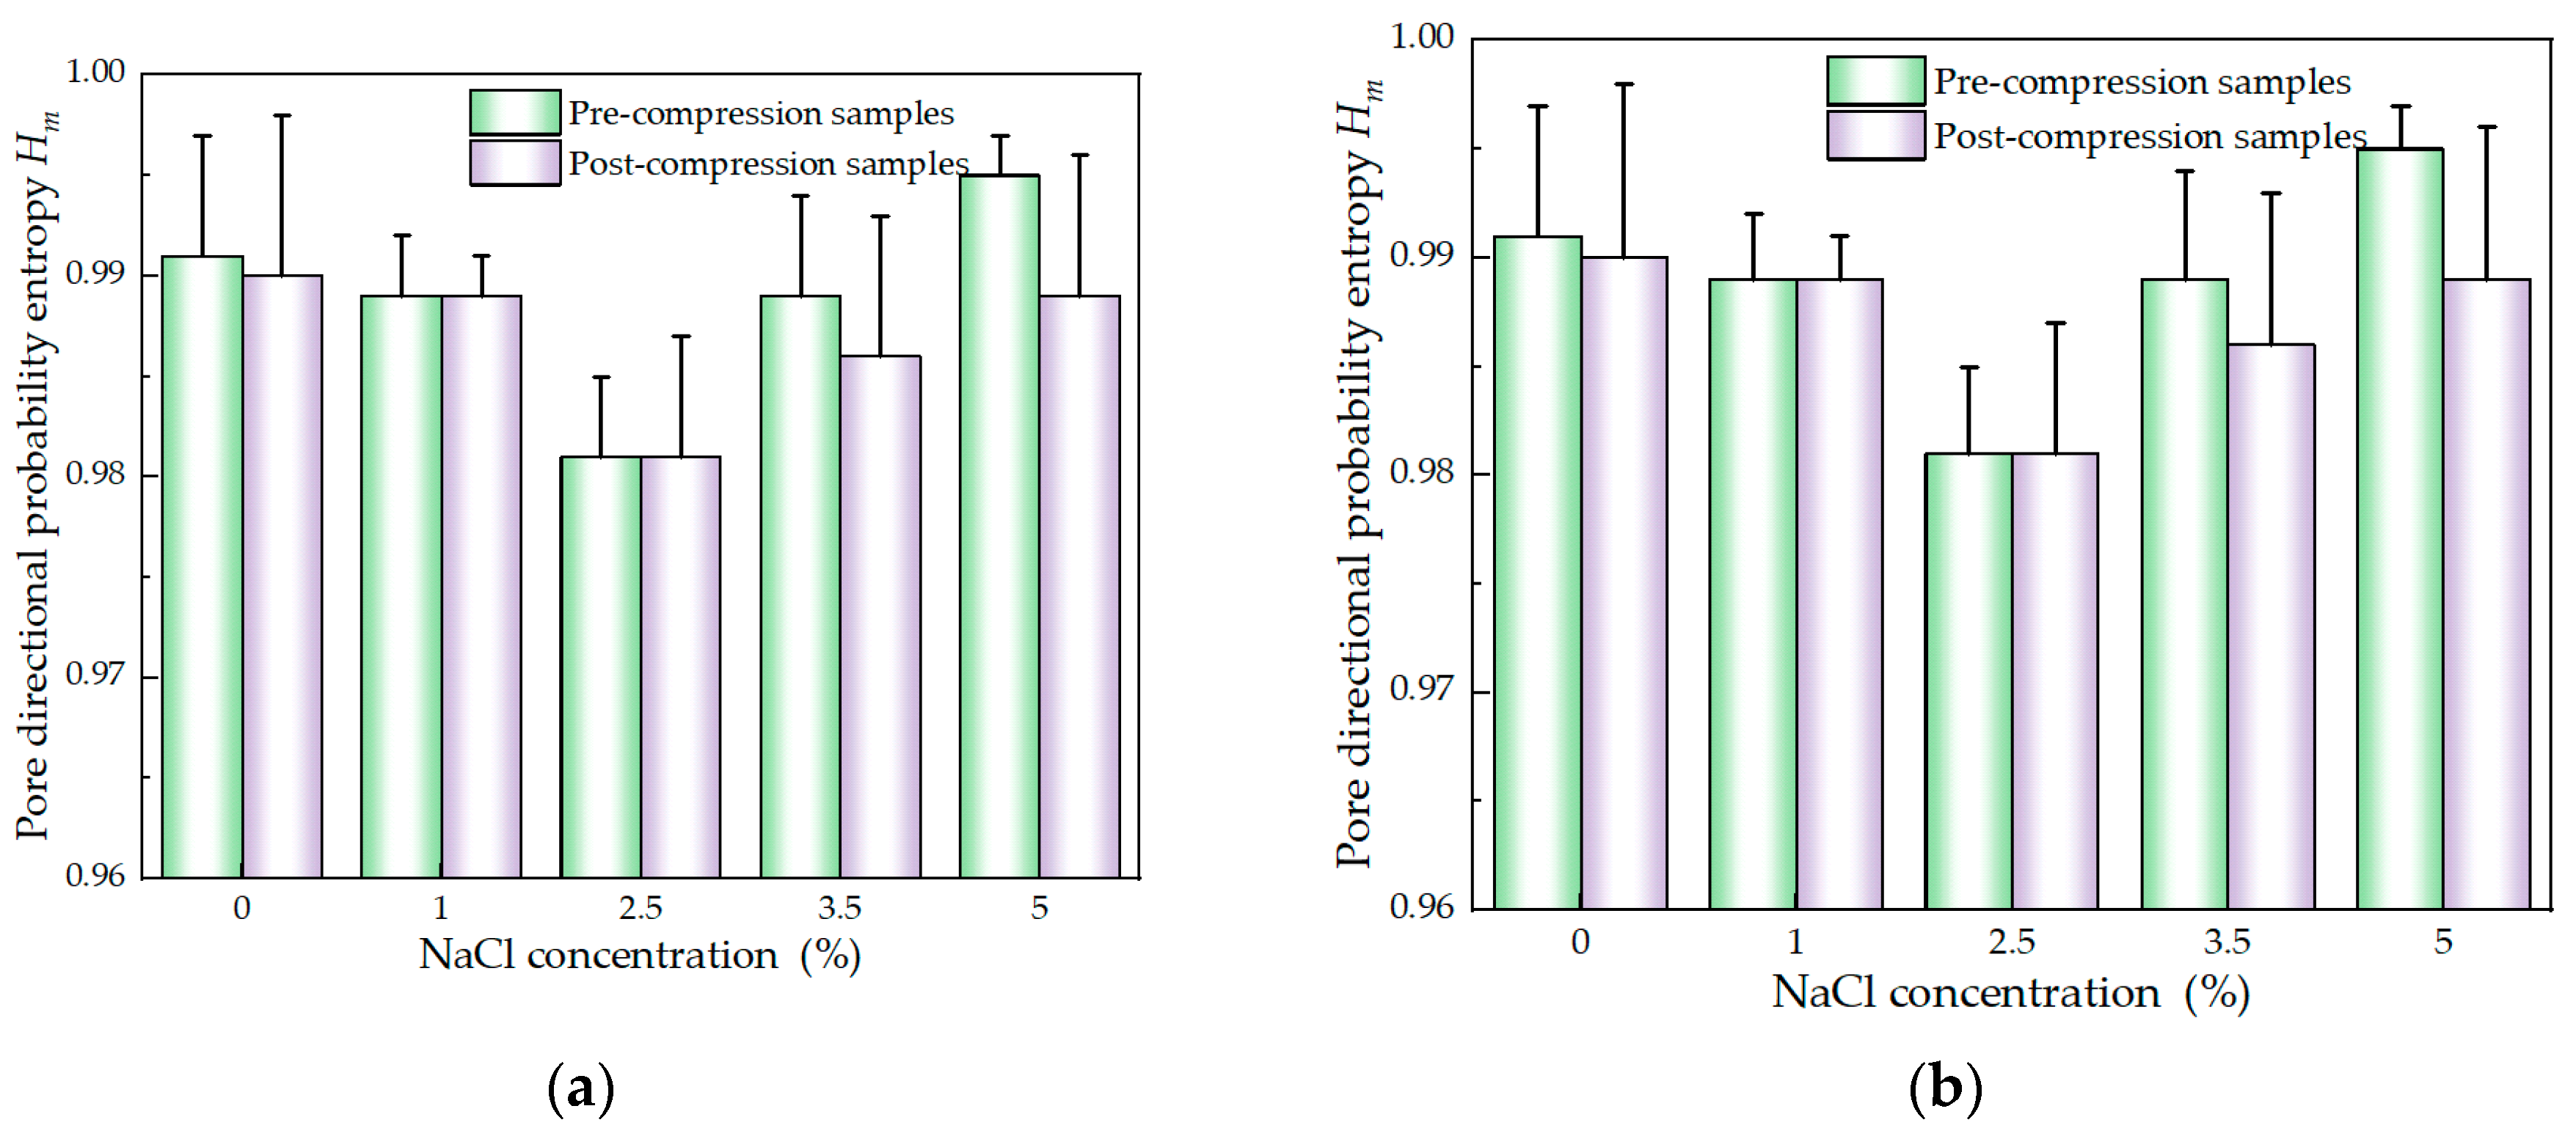
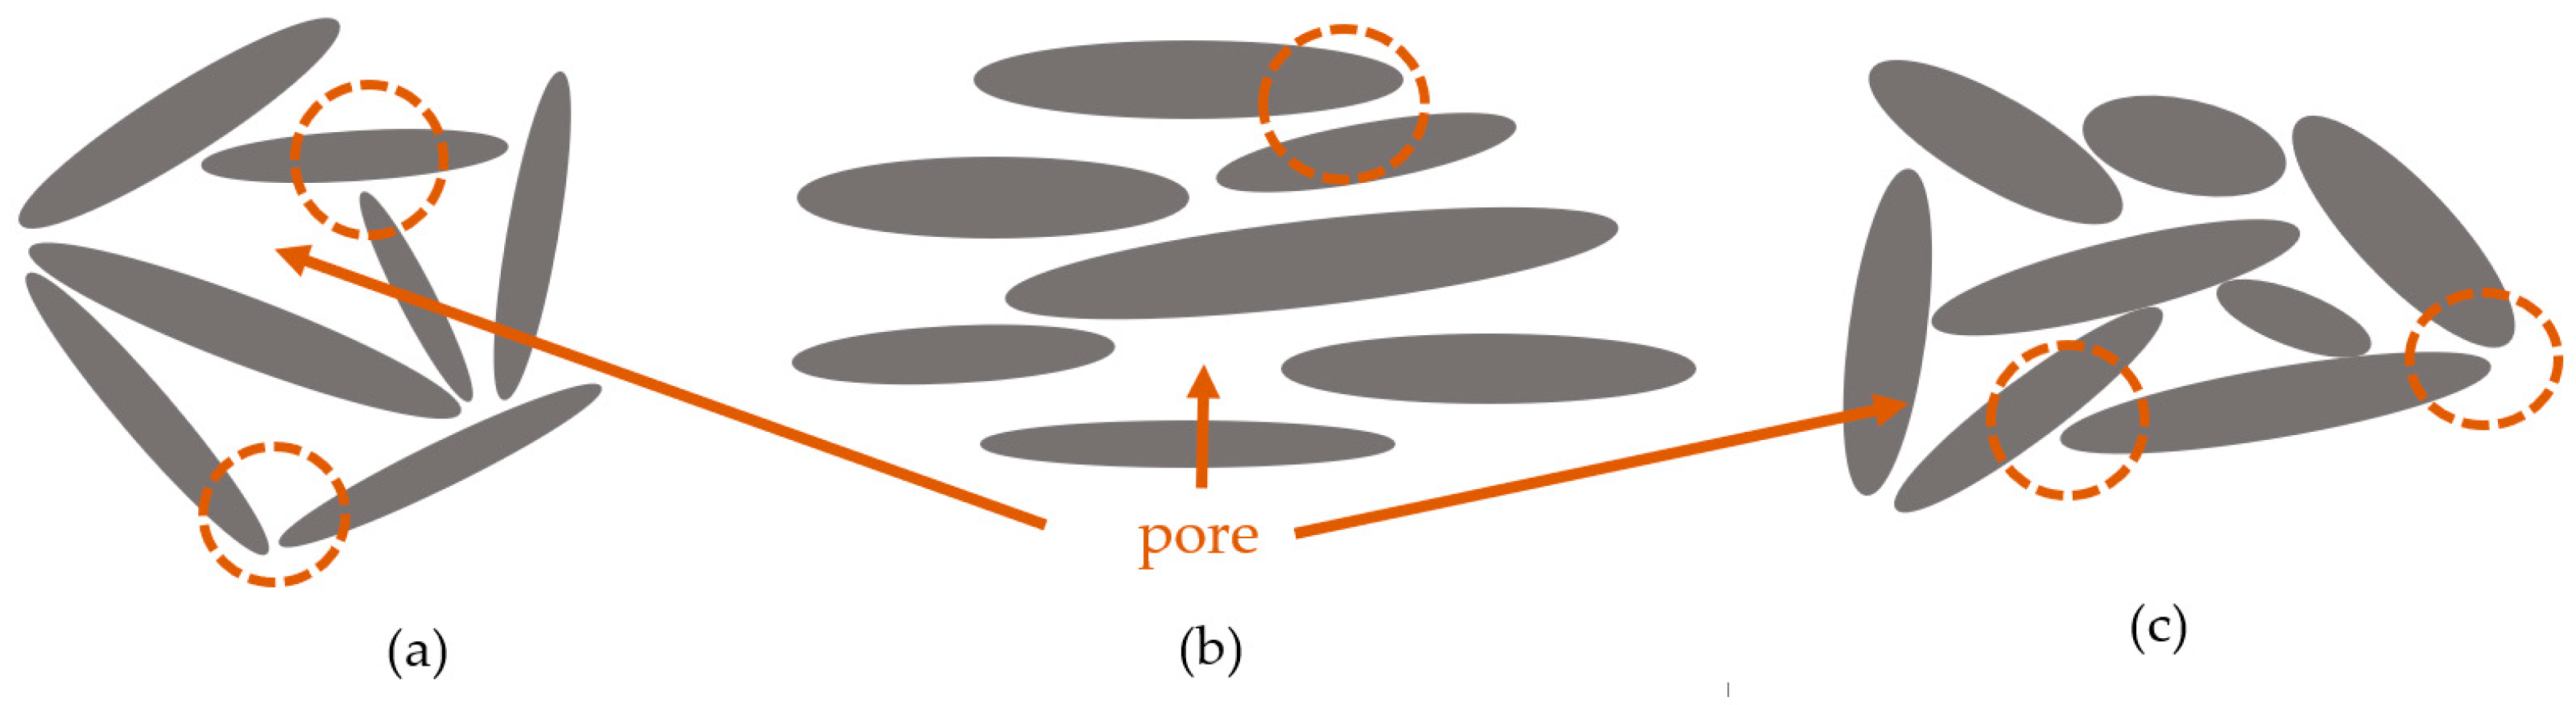
4.3. Effect of NaCl Concentration on Micro-Arrangement

Anisotropy describes the isotropic identity of pores or particle units, and its formula is shown in (3):
I n = L B L × 100 %
L is the longest axis of particles or pores; B is the shortest axis of a particle or pore.
According to Formula (3), when the anisotropy is 0, it indicates that the particles or pores are randomly distributed, that is, isotropic. A value of 100% indicates that the particles or pores are distributed in the same direction, that is, completely anisotropic. Figure 18 shows the variations in anisotropy and its increment for pores and particles with NaCl concentration.
It can be seen from the figure that the anisotropy of pores and particles in pre-compression samples first decrease and then increase with the increase of NaCl concentration, and the minimum values are 43% and 40% at 2.5% NaCl concentration, respectively, indicating that they tend to be isotropic under the condition of 2.5%NaCl. After compression, the pore increment decreases with the increase of NaCl concentration, while the particles increase, indicating that NaCl promotes the co-directional arrangement trend of particles when soil is pressed, and inhibits the co-directional arrangement trend of pores.
Directional probability entropy Hm is introduced to describe the degree of directional arrangement of pores. The larger the value, the worse the arrangement order, and the smaller the probability entropy, the more regular the arrangement, the stronger the order and orientation, and the more stable the structure. Divide 0~180 into n locations, and the calculation formula is shown in Formula (4):
H m = i = 1 n m i M ln ( m i M ) ln ( n )
mi is the i number of particles or pores with the long axis direction within the range of 0~180; M is the total number of particles or pores.
Figure 19 shows the relationship between the directional probability entropy of pores and particles and the change of NaCl concentration. As can be seen from the figure, the orientation probability entropy value of pores and particles in soil samples without the influence of salt is close to 1, indicating that the directions of pores and particles are highly random; With the increase of NaCl concentration, the Hm numerical values of pores and particles in soil samples decreased, and the Hm numerical variation range of particles was nearly 18 times that of pores, and the order and orientation of pore and particle arrangement increased, reaching the minimum value at 2.5% concentration. After 2.5% NaCl concentration, with the increase of salt concentration in pore water, the porosity and particles of soil samples all rebounded, the Hm of pores and particles weakened, and the arrangement became more and more chaotic. It can be shown that the change of NaCl concentration in pore water mainly affects the arrangement of soil skeleton particles.

5. Discussion

5.1. Effect of Pore Water Salinity on Clay Compressibility

The influence of pore water salinity on the compressibility of marine clay exhibits significant variability depending on the dominant clay mineralogy. Previous studies (Zhang T. W., 2018 [27]; Chen, 2021 [12]; Zhang F., 2016 [28]; Deng, 2015 [29]; Yin, 2022 [6]; Bayesteh, 2021 [21]) have reported contrasting behaviors, which can be attributed to differences in mineral composition. Montmorillonite-rich clays demonstrate high sensitivity to salinity, where increasing NaCl concentration compresses the double layer, enhances particle reorientation, and reduces both the compression index (Cc) and rebound index (Cr) (Zhang T. W., 2018 [27]; Chen, 2021 [12]; Zhang F., 2016 [28]). Similarly, illite-dominated clays exhibit decreased compressibility and swelling indices under elevated salinity, while their oedometer modulus and consolidation coefficient increase (Deng, 2015 [29]). In contrast, kaolinite clays, due to their stable lattice structure, show negligible changes in Cc and Cr with varying salinity (Zhang T. W., 2018 [27]). Yin (2022) [6] further observed a nonlinear (quadratic polynomial) relationship between salinity and compression index in multi-mineral mudstone, suggesting a threshold effect governed by chemical-mechanical interactions.
Interestingly, while most studies indicate that higher salinity reduces compressibility—particularly in active clays like montmorillonite—Bayesteh (2021) [21] observed a different trend in low-activity clays (illite and kaolinite), where a peak salinity concentration induced maximum compression. This finding aligns with the present study, highlighting that the role of salinity is not universally compressing but rather mineral-dependent.
The discrepancies among existing studies underscore the necessity of microstructural analysis (e.g., SEM) to clarify the mechanisms by which pore water salinity influences clay behavior. Additional investigations into the relationships between mineralogical composition, pore fluid chemistry, and mechanical behavior would help establish a more complete understanding of salinity’s role in marine clay compressibility.

5.2. Effect of NaCl Concentration on Particle Rearrangement

The results of the one-dimensional compression tests and SEM scans indicate that NaCl concentration significantly influences the compressibility and microstructure of marine sedimentary soils. Previous studies have shown that the salinity of pore water plays a critical role in affecting the mechanical properties of marine soils, such as compressibility and particle arrangement. In particular, the significant increase in compressibility at a NaCl concentration of 2.5% can be attributed to the flocculation and particle rearrangement mechanisms that occur at this threshold. Interestingly, the study also reveals that the microstructural changes observed at a NaCl concentration of 2.5%, such as an increase in pore fractal dimension and particle anisotropy rate, correspond with the maximum compressibility.
The dependent compressibility of clay on pore water NaCl concentration is due to the interplay between inter-particle forces and microstructural evolution. At low NaCl concentrations (<1.5%), clay particles maintain abundant unsaturated ion adsorption sites, allowing free interaction between electrolyte ions (Na⁺ and Cl⁻) and particle surfaces. This condition promotes the development of an extended double electric layer (∼10–100 nm thickness) where electrostatic repulsive forces dominate. As a result, particles maintain larger interparticle distances and form an open, anisotropic fabric characterized by predominant edge-to-edge and edge-to-surface contacts (Figure 20a). This loose microstructure exhibits high resistance to compression due to strong interparticle repulsion and structural anisotropy.
As NaCl concentration increases into the intermediate range (1.5–3.5%), several concurrent changes occur in the clay-water system. The rising electrolyte concentration progressively saturates ion adsorption sites, leading to compression of the double layer (reduced to ∼1–10 nm thickness). This results in weakened electrostatic repulsion coupled with enhanced van der Waals attraction between particles. The changing force balance causes particle reorganization into denser configurations dominated by surface-to-surface contacts (Figure 20b). This microstructural transition significantly increases the soil’s compressibility, reaching a maximum at the critical concentration of 2.5% NaCl, which represents an optimal balance between residual repulsive forces and growing attractive forces.
At high NaCl concentrations (>3.5%), the system undergoes further transformation. The ion adsorption sites on particle surfaces become completely saturated, leaving insufficient negative charges to maintain stable inter-particle repulsion. With the near-complete collapse of the double layer (<1 nm thickness) and the virtual disappearance of electrostatic repulsion, attractive forces become overwhelmingly dominant. This condition triggers particle aggregation into flocculated structures primarily governed by edge-to-edge and edge-to-surface contacts (Figure 20c). Paradoxically, this microstructural reorganization leads to reduced compressibility as the rigid particle networks resist deformation more effectively than the transitional surface-to-surface configurations.
The relationship between clay compressibility and NaCl concentration displays a distinct nonlinear characteristic, following a bell-shaped curve. The compressibility initially increases with rising NaCl concentration (0–2.5% range), peaks at the critical concentration of 2.5%, and subsequently decreases at higher concentrations (>2.5%). This nonmonotonic behavior underscores NaCl’s dual role in clay behavior: while compressing the double electric layer facilitates particle rearrangement and increases compressibility at moderate concentrations, excessive ionic strength induces particle aggregation through ionic shielding effects, ultimately reducing compressibility at high concentrations.
This concentration-dependent behavior has been observed in previous studies by Yin [6] and Bayesteh [21], though the reported critical concentrations vary significantly across studies (typically ranging from 1% to 5% NaCl). The variation in threshold values likely reflects differences in clay mineral composition (particularly smectite versus kaolinite content), particle size distribution, pore fluid chemistry, and testing conditions such as consolidation pressure. These comparative findings highlight the importance of considering material-specific characteristics when evaluating the electrochemical behavior of clay soils.

5.3. Limitation and Prospect of Test Method

While this study provides robust evidence of salinity’s influence on marine soil behavior, certain limitations should be acknowledged. The use of reconstituted samples, though necessary for controlled experimentation, may not fully replicate natural depositional structures and cementation effects. Furthermore, while SEM analysis offers valuable microstructural insights, the required freezing and drying procedures inevitably introduce some sample alteration. Our focus on NaCl solutions also represents a simplification of actual marine chemistry, excluding potential interactions from other prevalent ions like Mg²⁺ and SO₄²⁻. These limitations suggest important directions for future research, including investigations across diverse marine environments with varying sedimentology and salinity regimes, systematic studies of multi-ionic solutions, and long-term examinations of salinity fluctuation effects under cyclic loading conditions. Ultimately, this work establishes the fundamental salinity sensitivity of marine soils and underscores the critical need to incorporate porewater chemistry considerations in offshore geotechnical design for infrastructure safety and longevity.

6. Conclusions

This study reveals the influence of salt concentration on the compression characteristics and microstructure of marine sedimentary soil through one-dimensional compression tests and SEM microscopic analysis of reconstituted clay from the Yellow Sea with different NaCl concentrations, which in the range of 0~5%. The main conclusions are as follows:
(1) At a NaCl concentration of 2.5%, the compressibility of the soil is significantly enhanced, with the maximum compression coefficient of 0.609 MPa−1, the maximum compression index of 0.17, and the minimum compression coefficient of 6.5 × 10⁻⁴~7.5 × 10⁻⁴ cm2/s. The response becomes more pronounced with increasing compression pressure. In the secondary compression stage, the salt effect gradually weakens, and the rebound characteristics are unaffected by the NaCl concentration.
(2) SEM scanning test results show that at a NaCl concentration of 2.5%, the soil particles are angular, the pore fractal dimension reaches its maximum value of 1.09~1.14, and the particle fractal dimension reaches its maximum value of 1.18~1.23. The pores and particles tend to be arranged in the same direction. The pore anisotropy rate reaches its minimum value of 43%, and the particle anisotropy rate reaches its minimum value of 40%, corresponding to the lowest pore and particle orientation probability entropy. When the pore solution concentration is less than 2.5%, the soil sample develops narrow pores and rounded particles during one-dimensional compression. When the concentration of the pore solution exceeds 2.5%, the microstructure shows reverse evolution, confirming that the particle structure of the soil sample conforms to the particle rearrangement mechanism dominated by surface-to-surface contact under medium salinity conditions.
(3) At the threshold concentration of 2.5%, a balance between electrostatic forces and attractive forces enables stable surface-to-surface contacts, maximizing compressibility. This nonmonotonic behavior underscores NaCl’s dual role in both compressing the double electric layer to facilitate particle rearrangement and inducing aggregation through ionic shielding. Variations in NaCl concentration significantly influence the compressibility of marine clays. It is recommended that the influence of salinity sensitivity on the compression characteristics of marine sedimentary soil be considered in the design of marine foundations, with particular attention to the critical threshold effect of 2.5% NaCl concentration in Yellow Sea marine sedimentary soils to enhance the safety and reliability of the project.
(4) Conventional geotechnical testing using deionized water significantly underestimates the compressibility of marine soils under fluctuating salinity conditions. The lack of saline ions in such tests alters soil microstructure and fabric development, leading to substantial deviations in key compression parameters (e.g., compression index Cc) from in-situ behavior. These artifacts compromise the reliability of marine clay assessments for engineering design. Therefore, maintaining in-situ salinity conditions during sample preparation and testing is crucial. Further studies should investigate marine soil behavior through additional testing protocols, particularly triaxial shear and isotropic compression tests.

Author Contributions

Conceptualization, Y.Z., X.W. and M.H.; methodology, H.X., X.W., S.W. and M.S.; software, H.X., T.L. and S.W.; validation, Y.Z., X.W., M.H. and M.S.; formal analysis, H.X., X.W. and T.L.; investigation, M.S.; resources, M.S.; data curation, Y.Z. and M.H.; writing—original draft preparation, H.X., M.H. and S.W.; writing—review and editing, Y.Z. and T.L.; visualization, H.X. and S.W.; supervision, M.H. and M.S; project administration, M.S.; funding acquisition, M.S. All authors have read and agreed to the published version of the manuscript.

Funding

This research was funded by “Pioneer” R&D Program of Zhejiang (No.2022C03009).

Institutional Review Board Statement

Not applicable.

Informed Consent Statement

Not applicable.

Data Availability Statement

Data is contained within the article.

Conflicts of Interest

Author Xinghu Wang was employed by the company China Construction Fifth Engineering Bureau Corporation Limited. Author Miaojun Sun was employed by the company Power China Huadong Engineering Corporation Limited. The remaining authors declare that the research was conducted in the absence of any commercial or financial relationships that could be construed as a potential conflict of interest.

References

  1. Ying, Z.; Cui, Y.-J.; Benahmed, N.; Duc, M. Investigating the salinity effect on water retention property and microstructure changes along water retention curves for lime-treated soil. Constr. Build. Mater. 2021, 303, 124564. [Google Scholar] [CrossRef]
  2. Hou, C.-L.; Ma, X.-Y.; Kang, X. Effects of salt and pH on microstructure and physico-mechanical behaviors of clay sediments: A references review. Mar. Georesources Geotechnol. 2024, 42, 736–766. [Google Scholar] [CrossRef]
  3. Rout, S.; Singh, S.P. Effect of Inorganic Salt Solutions on Physical and Mechanical Properties of Bentonite Based Liner. J. Hazard. Toxic Radioact. Waste 2020, 24, 04020053. [Google Scholar] [CrossRef]
  4. Scelsi, G.; Abed, A.A.; Della Vecchia, G.; Musso, G.; Sołowski, W.T. Modelling the behaviour of unsaturated non-active clays in saline environment. Eng. Geol. 2021, 295, 106441. [Google Scholar] [CrossRef]
  5. Zhan, L.; Xin, P.; Chen, J. Subsurface salinity distribution and evolution in low-permeability coastal areas after land reclamation: Field investigation. J. Hydrol. 2022, 612, 128250. [Google Scholar] [CrossRef]
  6. Yin, J.; Lu, Z.; Geng, W.; Han, W.; Hudu, A.A. Effect of porewater salinity on compression behaviors and hydraulic conductivity of soft marine clay. Mar. Georesources Geotechnol. 2022, 40, 813–822. [Google Scholar] [CrossRef]
  7. Di Maio, C.; Santoli, L.; Schiavone, P. Volume change behaviour of clays: The influence of mineral composition, pore fluid composition and stress state. Mech. Mater. 2004, 36, 435–451. [Google Scholar] [CrossRef]
  8. Ying, Z.; Cui, Y.-J.; Duc, M.; Benahmed, N.; Bessaies-Bey, H.; Chen, B. Salinity effect on the liquid limit of soils. Acta Geotech. 2021, 16, 1101–1111. [Google Scholar] [CrossRef]
  9. Wang, L.; Zhou, F.; Zhou, L.; Liang, Y. Stress-dependent properties of physicochemical interaction of unsaturated saline clay. Chin. J. Geotech. Eng. 2024, 46, 814–822. (In Chinese) [Google Scholar] [CrossRef]
  10. Song, M.-M.; Zeng, L.-L.; Hong, Z.-S. Pore fluid salinity effects on physicochemical-compressive behaviour of reconstituted marine clays. Appl. Clay Sci. 2017, 146, 270–277. [Google Scholar] [CrossRef]
  11. Horpibulsuk, S.; Yangsukkaseam, N.; Chinkulkijniwat, A.; Du, Y.J. Compressibility and permeability of Bangkok clay compared with kaolinite and bentonite. Appl. Clay Sci. 2011, 52, 150–159. [Google Scholar] [CrossRef]
  12. Chen, Y.-G.; Dong, X.-X.; Zhang, X.-D.; Ye, W.-M.; Cui, Y.-J. Oedometric compression and thermal volume behavior of compacted Gaomiaozi bentonite saturated with salt solution. Geomech. Energy Environ. 2021, 25, 100186. [Google Scholar] [CrossRef]
  13. Sridharan, A.; Prakash, K. Influence of clay mineralogy and pore-medium chemistry on clay sediment formation. Can. Geotech. J. 1999, 36, 961–966. [Google Scholar] [CrossRef]
  14. Jadda, K.; Bag, R. Variation of swelling pressure, consolidation characteristics and hydraulic conductivity of two Indian bentonites due to electrolyte concentration. Eng. Geol. 2020, 272, 105637. [Google Scholar] [CrossRef]
  15. Jha, A.K.; Jain, A.K.; Akhtar, M.P. Evaluating the Behavior of Marble Dust–Bentonite as an Alternative to Sand–Bentonite Mixes Permeated with Electrolyte Concentrations. J. Hazard. Toxic Radioact. Waste 2023, 27, 04022035. [Google Scholar] [CrossRef]
  16. Hu, S.-J.; Chen, P.; Wei, C.-F.; Yi, P.; Wang, Y. Effect of NaCl solution on primary physical-mechanical behaviors of deep-sea sediments. Chin. J. Geotech. Eng. 2021, 43, 142–145. (In Chinese) [Google Scholar] [CrossRef]
  17. Deng, Y.F.; Cui, Y.J.; Tang, A.M.; Nguyen, X.P.; Li, X.L.; Van Geet, M. Investigating the pore-water chemistry effects on the volume change behaviour of Boom clay. Phys. Chem. Earth Parts A/B/C 2011, 36, 1905–1912. [Google Scholar] [CrossRef]
  18. Deng, Y.; Zhang, T.; Cui, Y.; Chen, Y.; Deng, T.; Zhou, X. Pore water salinity effect on the intrinsic compression behaviour of artificial soft soils. Appl. Clay Sci. 2018, 166, 299–306. [Google Scholar] [CrossRef]
  19. Moore, R. Discussion: The chemical and mineralogical controls upon the residual strength of pure and natural clays. Geotechnique 1992, 42, 151–153. [Google Scholar] [CrossRef]
  20. Abu Zeid, M.M.; El-Aal, A.K.A. Effect of salinity of groundwater on the geotechnical properties of some Egyptian clay. Egypt. J. Pet. 2017, 26, 643–648. [Google Scholar] [CrossRef]
  21. Bayesteh, H.; Bayat, A. Volume change behavior of reconstituted marine clay: Effect of initial and leaching pore fluid salinity. Environ. Earth Sci. 2021, 80, 235.1–235.14. [Google Scholar] [CrossRef]
  22. Collins, K.; McGown, A. The form and function of microfabric features in a variety of natural soils. Geotechnique 1974, 24, 223–254. [Google Scholar] [CrossRef]
  23. Stawiński, J.; Wierzchoś, J.; Garoa-Gonzalez, M.T. Influence of Calcium and Sodium Concentration on the Microstructure of Bentonite and Kaolin. Clays Clay Miner. 1990, 38, 617–622. [Google Scholar] [CrossRef]
  24. Kang, X.; Zou, X.; Sun, H.-M.; Ma, X.-Y.; Chen, R.-P. Molecular dynamics simulations of microstructure and dynamic shearing behaviors of kaolinite-water-salt system. Appl. Clay Sci. 2022, 218, 106414. [Google Scholar] [CrossRef]
  25. Burland, J.B. On the compressibility and shear strength of natural clays. Geotechnique 1990, 40, 329–378. [Google Scholar] [CrossRef]
  26. Zhang, Y.; Bing, H.; Yang, C. Influences of freeze-thaw cycles on mechanical porperties of silty clay based on SEM and MIP test. Chin. J. Rock Mech. Eng. 2015, 34, 3597–3603. (In Chinese) [Google Scholar] [CrossRef]
  27. Zhang, T.-W.; Deng, Y.-F.; Wu, Z.-L.; Liu, S.-Y.; Liu, Y. Engineering behavior and constitutive model of artificial soft clay considering pore water salinity effect. Chin. J. Geotech. Eng. 2018, 40, 1690–1697. (In Chinese) [Google Scholar] [CrossRef]
  28. Zhang, F.; Ye, W.-M.; Chen, Y.-G.; Chen, B.; Cui, Y.-J. Influences of salt solution concentration and vertical stress during saturation on the volume change behavior of compacted GMZ01 bentonite. Eng. Geol. 2016, 207, 48–55. [Google Scholar] [CrossRef]
  29. Deng, Y.-F.; Yue, X.-B.; Zhang, T.-W.; Liu, S.-Y.; Yang, Z.-C. Consolidation behaviors of soft marine clay in Lianyungang under desalination environment of pore water. Chin. J. Geotech. Eng. 2015, 37, 47–53. (In Chinese) [Google Scholar] [CrossRef]
Figure 1. Grain size distribution of marine clay.
Applsci 15 05110 g001
Figure 2. X-ray diffraction pattern of the soil samples. (a) X-ray diffraction pattern of whole rock non-clay minerals; (b) X-ray diffraction pattern of clay minerals.
Applsci 15 05110 g002
Figure 3. STK.YJZQG16-1 dual-chamber pneumatic oedometer. (a) Pneumatic oedometer system; (b) Pressure regulation console of STK.YJZQG16-1; (c) Dual-chamber of STK.YJZQG16-1.
Applsci 15 05110 g003
Figure 4. Loading scheme of one-dimensional compression test.
Applsci 15 05110 g004
Figure 5. Instruments needed for SEM scanning. (a) FD-1-50 vacuum freeze drier. (b) Electron microscope scanner.
Applsci 15 05110 g005
Figure 6. e-log p relation curve of soil sample’s twice compression resilience.
Applsci 15 05110 g006
Figure 7. Variation curve of the coefficient of compression and standard deviation of soil samples varies with NaCl concentration.
Applsci 15 05110 g007
Figure 8. The compression index and rebound index of soil samples change with NaCl concentration.
Applsci 15 05110 g008
Figure 9. Relationship between consolidation coefficient and NaCl concentration of soil samples. (a) Initial loading; (b) Secondary loading.
Applsci 15 05110 g009
Figure 10. Variation of soil samples C c * and e 100 * with NaCl concentration.
Applsci 15 05110 g010
Figure 11. Normalized curve of Iv of soil samples under different NaCl concentrations.
Applsci 15 05110 g011
Figure 12. SEM images (1000× magnification) of marine samples at varying NaCl concentrations. (a) 0% NaCl; (b) 1% NaCl; (c) 2.5% NaCl; (d) 3.5% NaCl; (e) 5% NaCl.
Applsci 15 05110 g012aApplsci 15 05110 g012b
Figure 13. Binarization threshold based on porosity (2.5% NaCl reconstituted soil). (a) Original image; (b) Binary image when Zi = 68.
Applsci 15 05110 g013
Figure 14. Percentage of small, medium, and large pores in pre-compression and post-compression soil samples under varying NaCl concentrations.
Applsci 15 05110 g014
Figure 15. Variation curve of total pore fraction, standard deviation and its increment with NaCl concentration.
Applsci 15 05110 g015
Figure 16. Variations in average aspect ratio and its increment for pores and particles with NaCl concentration. (a) Average pore aspect ratio, standard deviation and increment after compression; (b) Average particle aspect ratio, standard deviation and increment after compression.
Applsci 15 05110 g016
Figure 17. Variation curves of pore and particle shape fractal dimensions and standard deviation with NaCl Concentration.
Applsci 15 05110 g017
Figure 18. Variations in anisotropy and its increment for pores and particles with NaCl concentration. (a) Anisotropy, standard deviation and increment after compression of pore; (b) Anisotropy, standard deviation and increment after compression of particle.
Applsci 15 05110 g018
Figure 19. Bar Charts of directional probability entropy and Standard Deviation for Pores and Particles with NaCl Concentration. (a) Pore directional probability entropy and standard deviation; (b) Particle directional probability entropy and standard deviation.
Applsci 15 05110 g019
Figure 20. Effect of pore-fluid salinity on arrangement of particles. (a) Low salinity edge-to-surface structure and edge-to-edge structure (b) Medium salinity surface-to-surface structure; (c) High salinity edge-to-surface structure and edge-to-edge structure.
Applsci 15 05110 g020
Table 1. Basic physical properties of soil samples.
Depth (m)Pore Water Salt Concentration (%)Natural Water Content (%)Natural Density (g·cm−3)Specific Gravity Void RatioLiquid Limit
(%)
Plastic Limit (%)Plasticity Index
67.0–68.00.20423.741.932.660.7138.2115.7622.45
Table 2. Mineral composition of whole rock and clay in soil sample.
Whole Rock MineralContent (%)Clay MineralContent (%)
Quartz52.2I/S62
Potassium feldspar1.8It26
Plagioclase10.5Kao5
Hornblende0.7C7
Clay mineral34.8
Table 3. Composition of the sea water.
AnionContent (mg·L−1)CationContent (mg·L−1)Total SalinitypH Value
F1.41Li+0.3434,1208.13
Cl13,416.62Na+8502.19
Br10.80NH4+0
NO34.48K+354.47
SO42−16.4Mg2+1022.2
Ca2+362.38
Total13,449.71Total10,241.57
Disclaimer/Publisher’s Note: The statements, opinions and data contained in all publications are solely those of the individual author(s) and contributor(s) and not of MDPI and/or the editor(s). MDPI and/or the editor(s) disclaim responsibility for any injury to people or property resulting from any ideas, methods, instructions or products referred to in the content.

