Article

Shear Strength of Coarse-Grained Soil: Effects of Scaling Methods and Moisture Content with In Situ Comparison

1
School of Geology Engineering and Geometrics, Chang’an University, Xi’an 710054, China
2
Northwest Engineering Corporation Limited, Xi’an 710065, China
3
School of Water Conservancy and Hydroelectric Power, Hebei University of Engineering, Handan 056038, China
*
Author to whom correspondence should be addressed.
Appl. Sci. 2025, 15(9), 5101; https://doi.org/10.3390/app15095101
Submission received: 25 March 2025 / Revised: 30 April 2025 / Accepted: 2 May 2025 / Published: 4 May 2025

Abstract

:
Coarse-grained soil (CGS) is a vital geotechnical material extensively used in engineering projects. Scale effects pose challenges to accurately assessing its shear strength, and the influences of scaling methods and moisture content remain underexplored. This study investigates the effects of maximum particle size ( d max ), scaling techniques, and moisture content on the shear strength of CGS through large-scale direct shear tests and in situ direct shear tests. CGS samples from the Jilangtan platform in Qinghai Province, originally with a d max of 60 mm, were scaled to 30 mm using the Equivalent Substitution Method (ESM) and Similar Gradation Method (SGM). Tests were conducted at moisture contents of 0.91% (air-dried), 2.45% (natural), and 7.66% (saturated). Results show that ESM consistently yields higher shear strength than SGM across all moisture levels. Scale effects are minimal under air-dried conditions but become pronounced at higher moisture contents. While all large-scale laboratory test results deviate somewhat from in situ findings, shear strength parameters derived from SGM align more closely with field observations.

1. Introduction

Coarse-grained soil (CGS) is widely used in geotechnical engineering for foundations, embankments, retaining walls, breakwaters, and earth-rock dams due to its excellent mechanical properties [1]. These properties, especially shear strength, critically influence the stability of engineering structures. Accurately measuring the shear strength of CGS is thus critical for safety assessments. To assess shear strength, current research employs in situ direct shear tests, laboratory direct shear tests, and triaxial tests. In situ tests provide minimal disturbance and reliable results but are complex and costly [2,3,4,5]. Laboratory direct shear tests are simpler and more common; however, they often use remolded samples, which disturb the soil’s natural structure. Furthermore, equipment size limitations necessitate scaling techniques to adjust the maximum particle size ( d max ), defined as the largest grain diameter, to reduce scale effects [6,7,8,9,10,11,12,13,14,15].
International standards differ in their minimum ratios of specimen width (W) and thickness (T) to d max , as shown in Table 1. These variations affect the shear strength of gravelly soils, which depends heavily on d max and the scaling techniques applied, such as the Scalping Method, Equivalent Substitution Method (ESM), Similar Gradation Method (SGM), and Comprehensive Method, each influencing test outcomes differently.
Numerous studies have investigated these challenges. Girumugisha et al. (2024) [20] compared laboratory triaxial tests with in situ direct shear tests, finding that the Scalping Method accurately predicts the critical shear strength of mine waste rock under high normal stress. However, under medium-to-low stress, current d max specifications may systematically overestimate shear strength. MotahariTabari (2021) [21] proposed a modified particle size distribution method for small-scale direct shear tests, demonstrating reduced maximum shear strength, peak dilation, and friction angle. This suggests that small-scale equipment can effectively measure the CGS friction angle. Li et al. (2022) [22] conducted 24 direct shear tests and found that shear strength increases logarithmically with d max but decreases as gradation uniformity declines. Deiminiat et al. (2022) [14] reviewed scaling techniques for rockfill shear strength, observing that all methods have limitations and cannot fully replicate in situ test results. Collectively, these findings underscore scale effects as a persistent challenge in determining CGS shear strength.
Although prior studies elucidate how scale effects and scaling methods affect CGS shear strength, accurately determining the shear strength parameters of in situ materials via laboratory direct shear tests remains challenging. This study addresses this gap by integrating large-scale laboratory direct shear tests with in situ tests to investigate the effects of d max , scaling methods, and moisture content. Using undisturbed specimens with natural d max and scaled specimens obtained from two common scaling techniques, we evaluate these samples in a large-scale direct shear apparatus and compare the results with in situ data. This approach elucidates how d max , scaling, and moisture content influence CGS shear properties, providing insights to improve scaling techniques and engineering design accuracy.

2. Materials and Methods
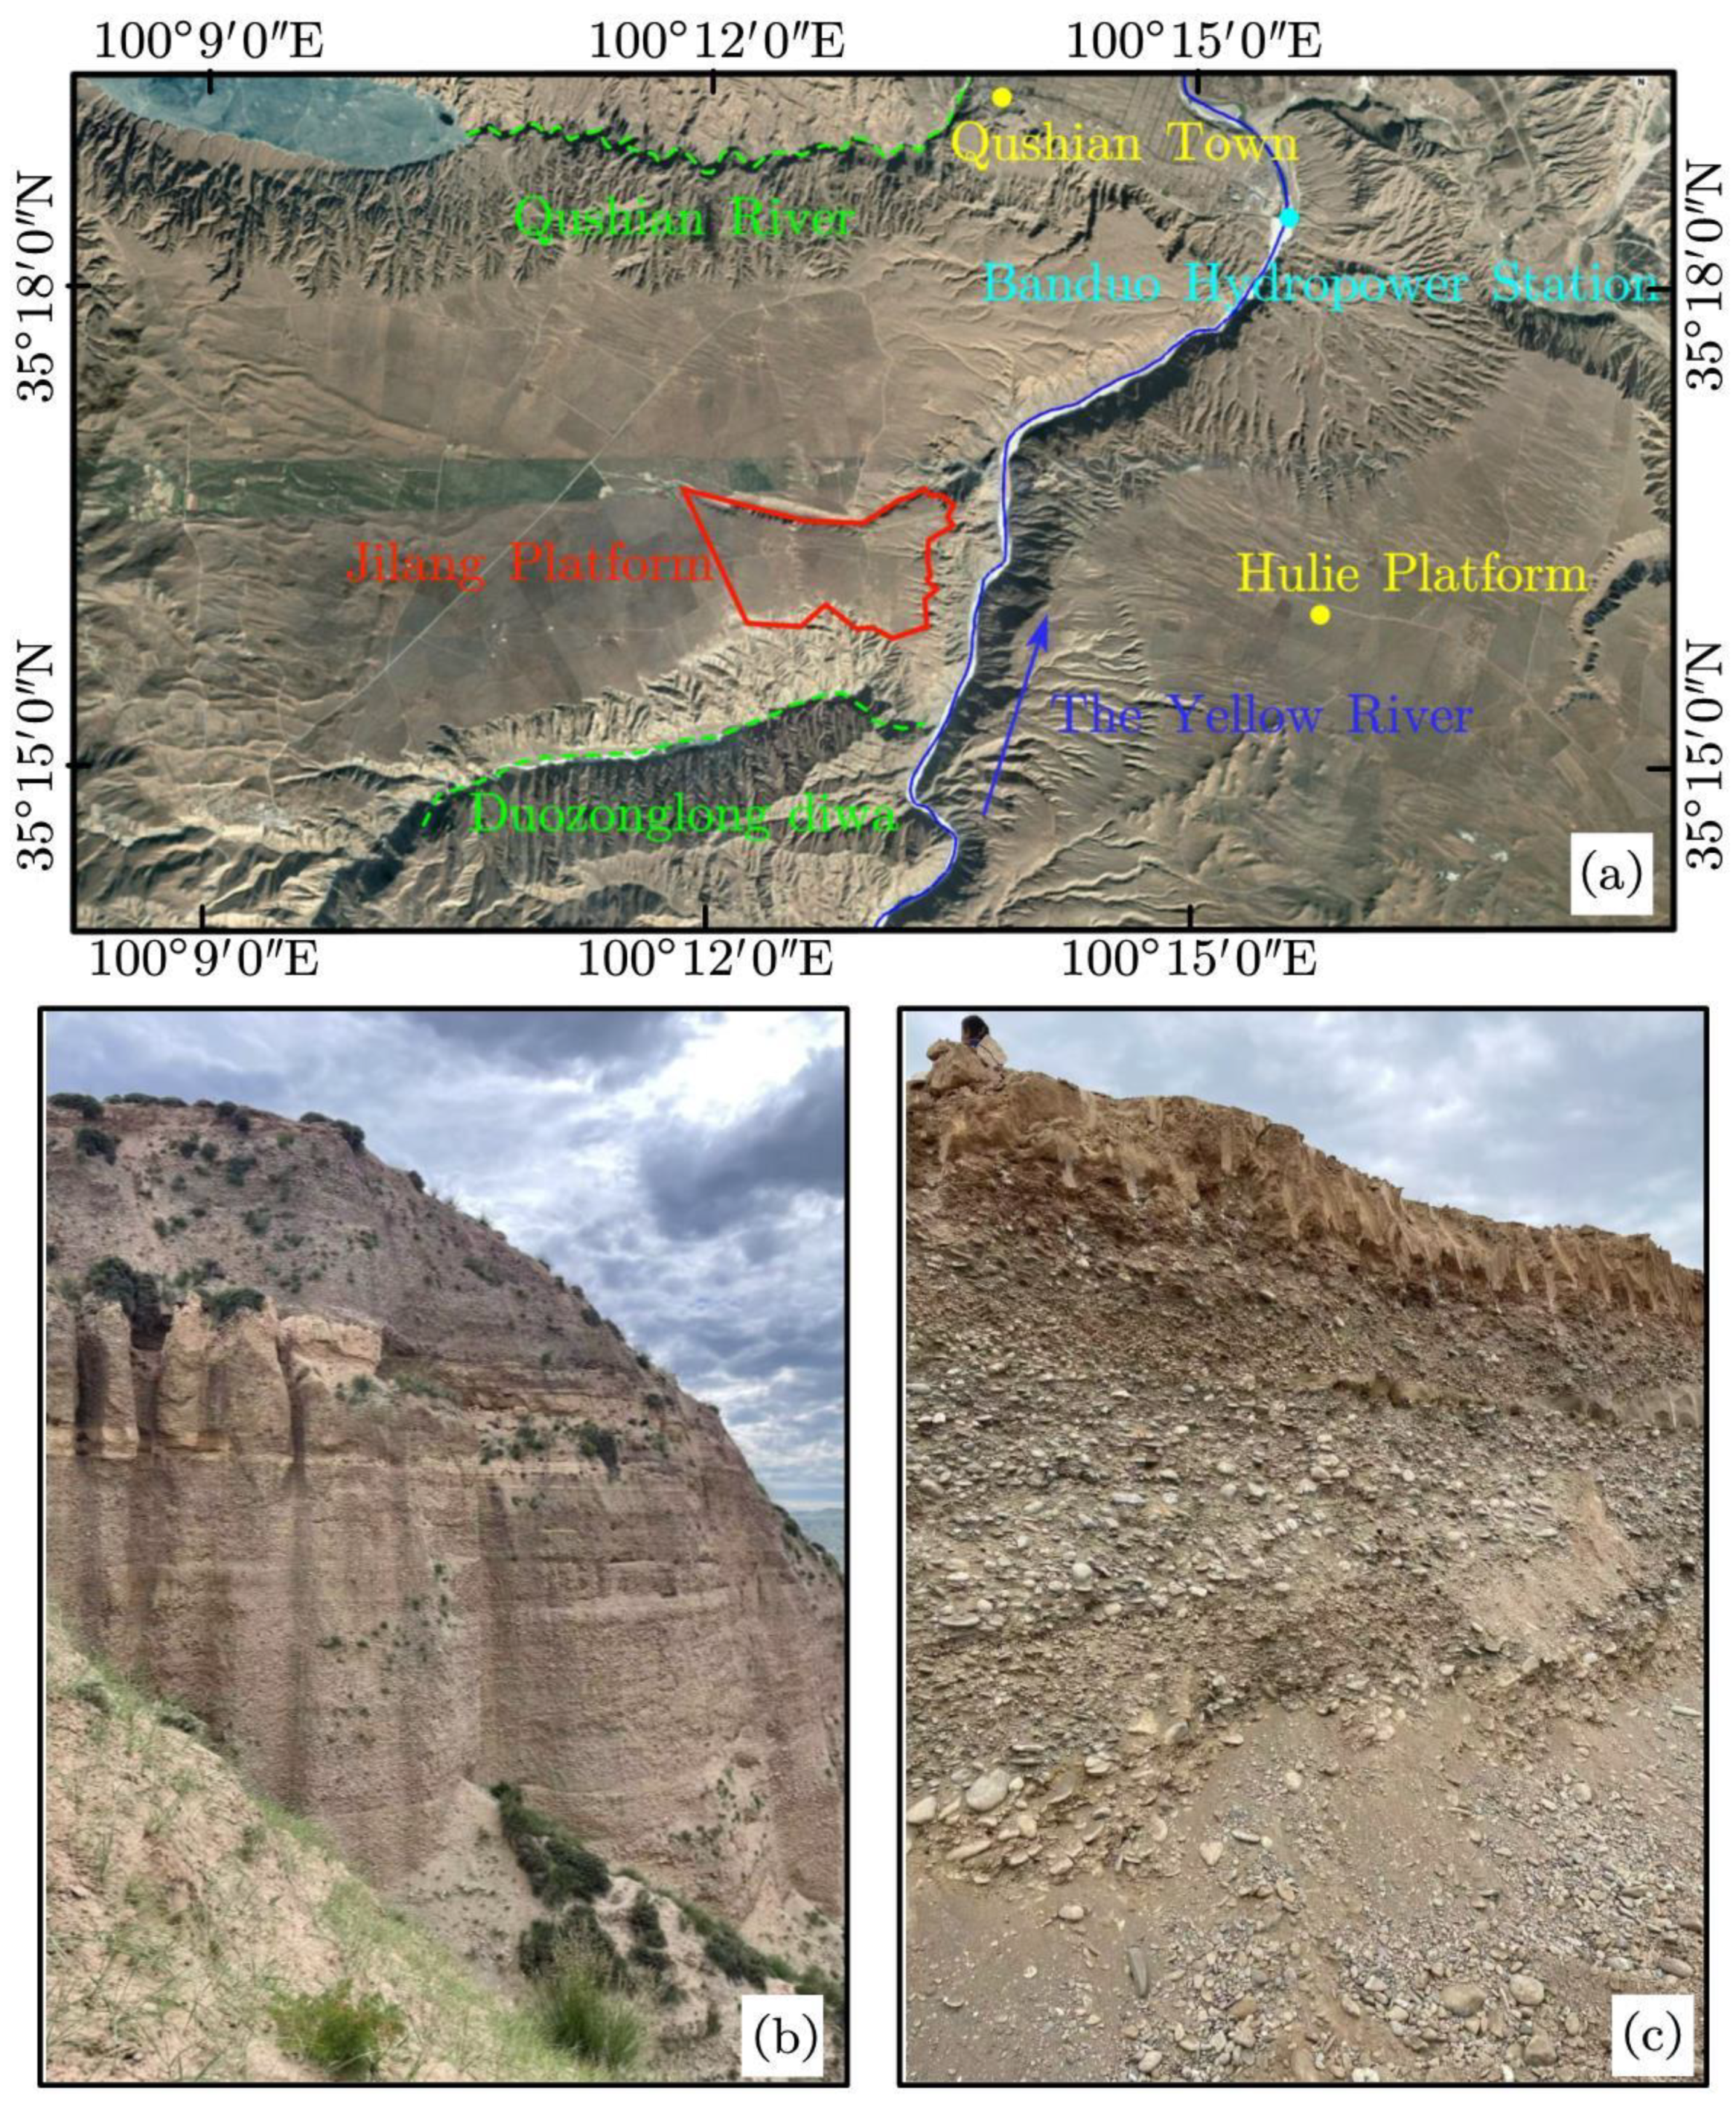
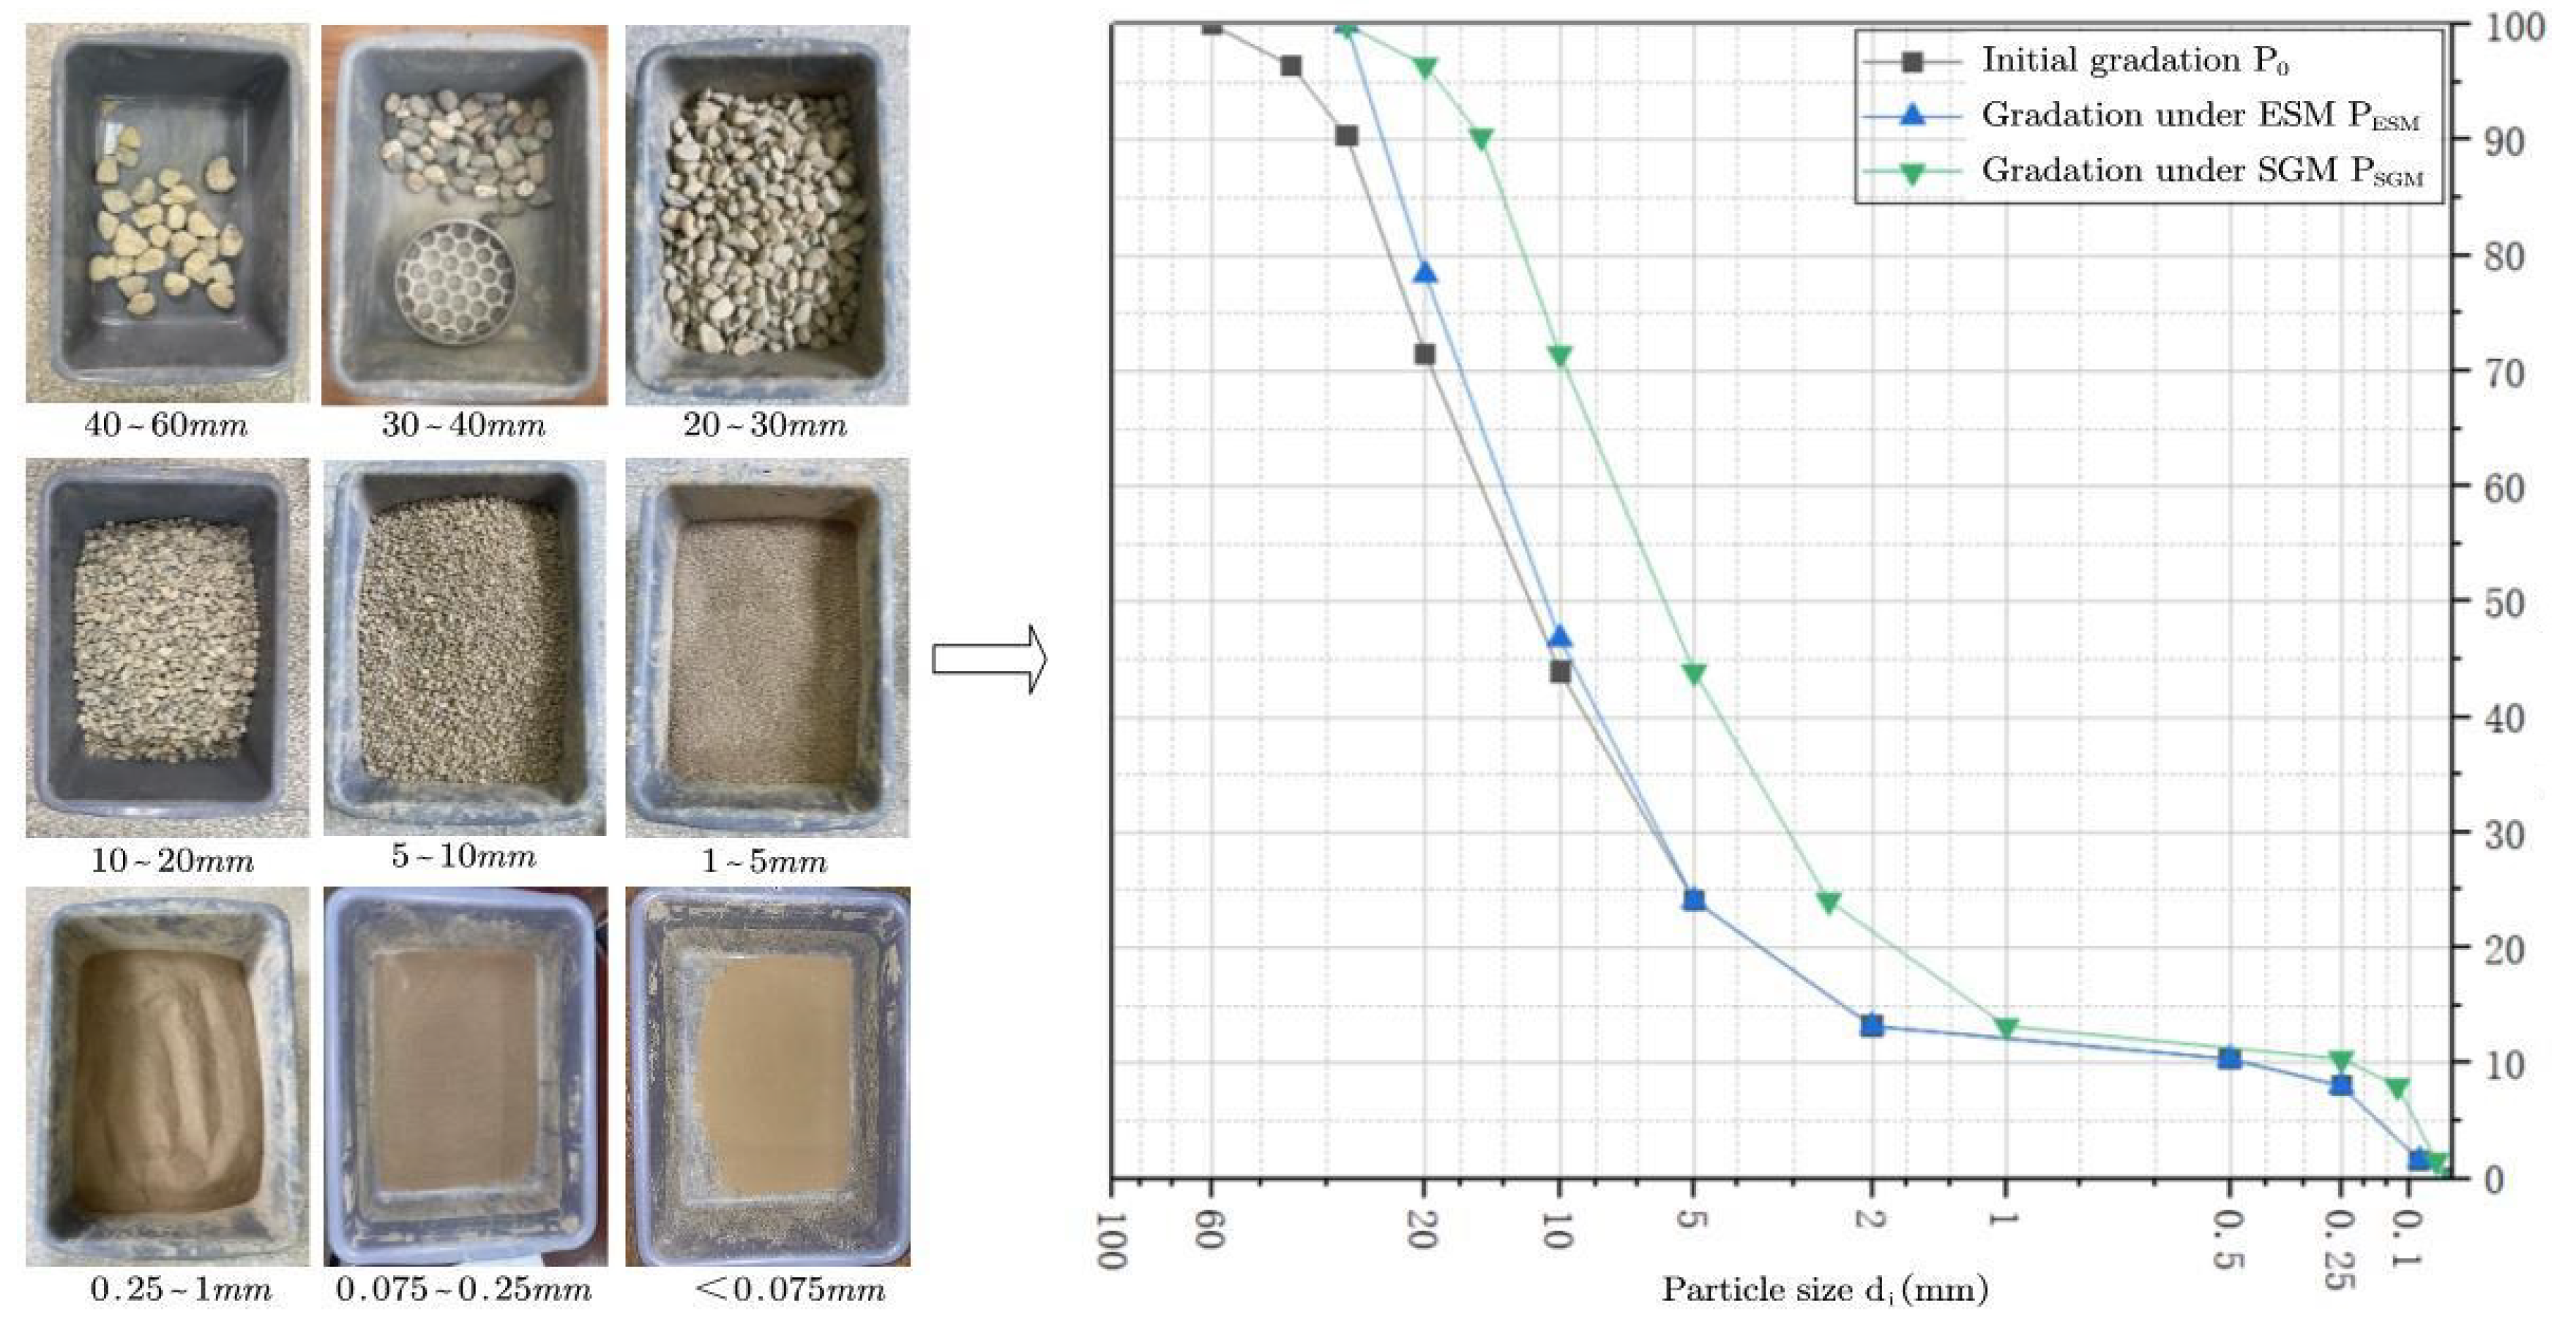
2.1. Test Materials

Test soil samples were collected from the gravelly sand layer of the Jilangtan platform on the left bank of the Yellow River in Xinghai County, Qinghai Province (Figure 1). The sampling and testing process adhered strictly to the Chinese National Standard, ‘Standard for Geotechnical Testing Methods’ (GB/T 50123-1999) [23]. The in situ soil, identified as sandy gravel, exhibited a maximum particle size of 60 mm and a natural moisture content of 2.45%. The basic physical properties of the soil samples are listed in Table 2.

2.2. Test Apparatus

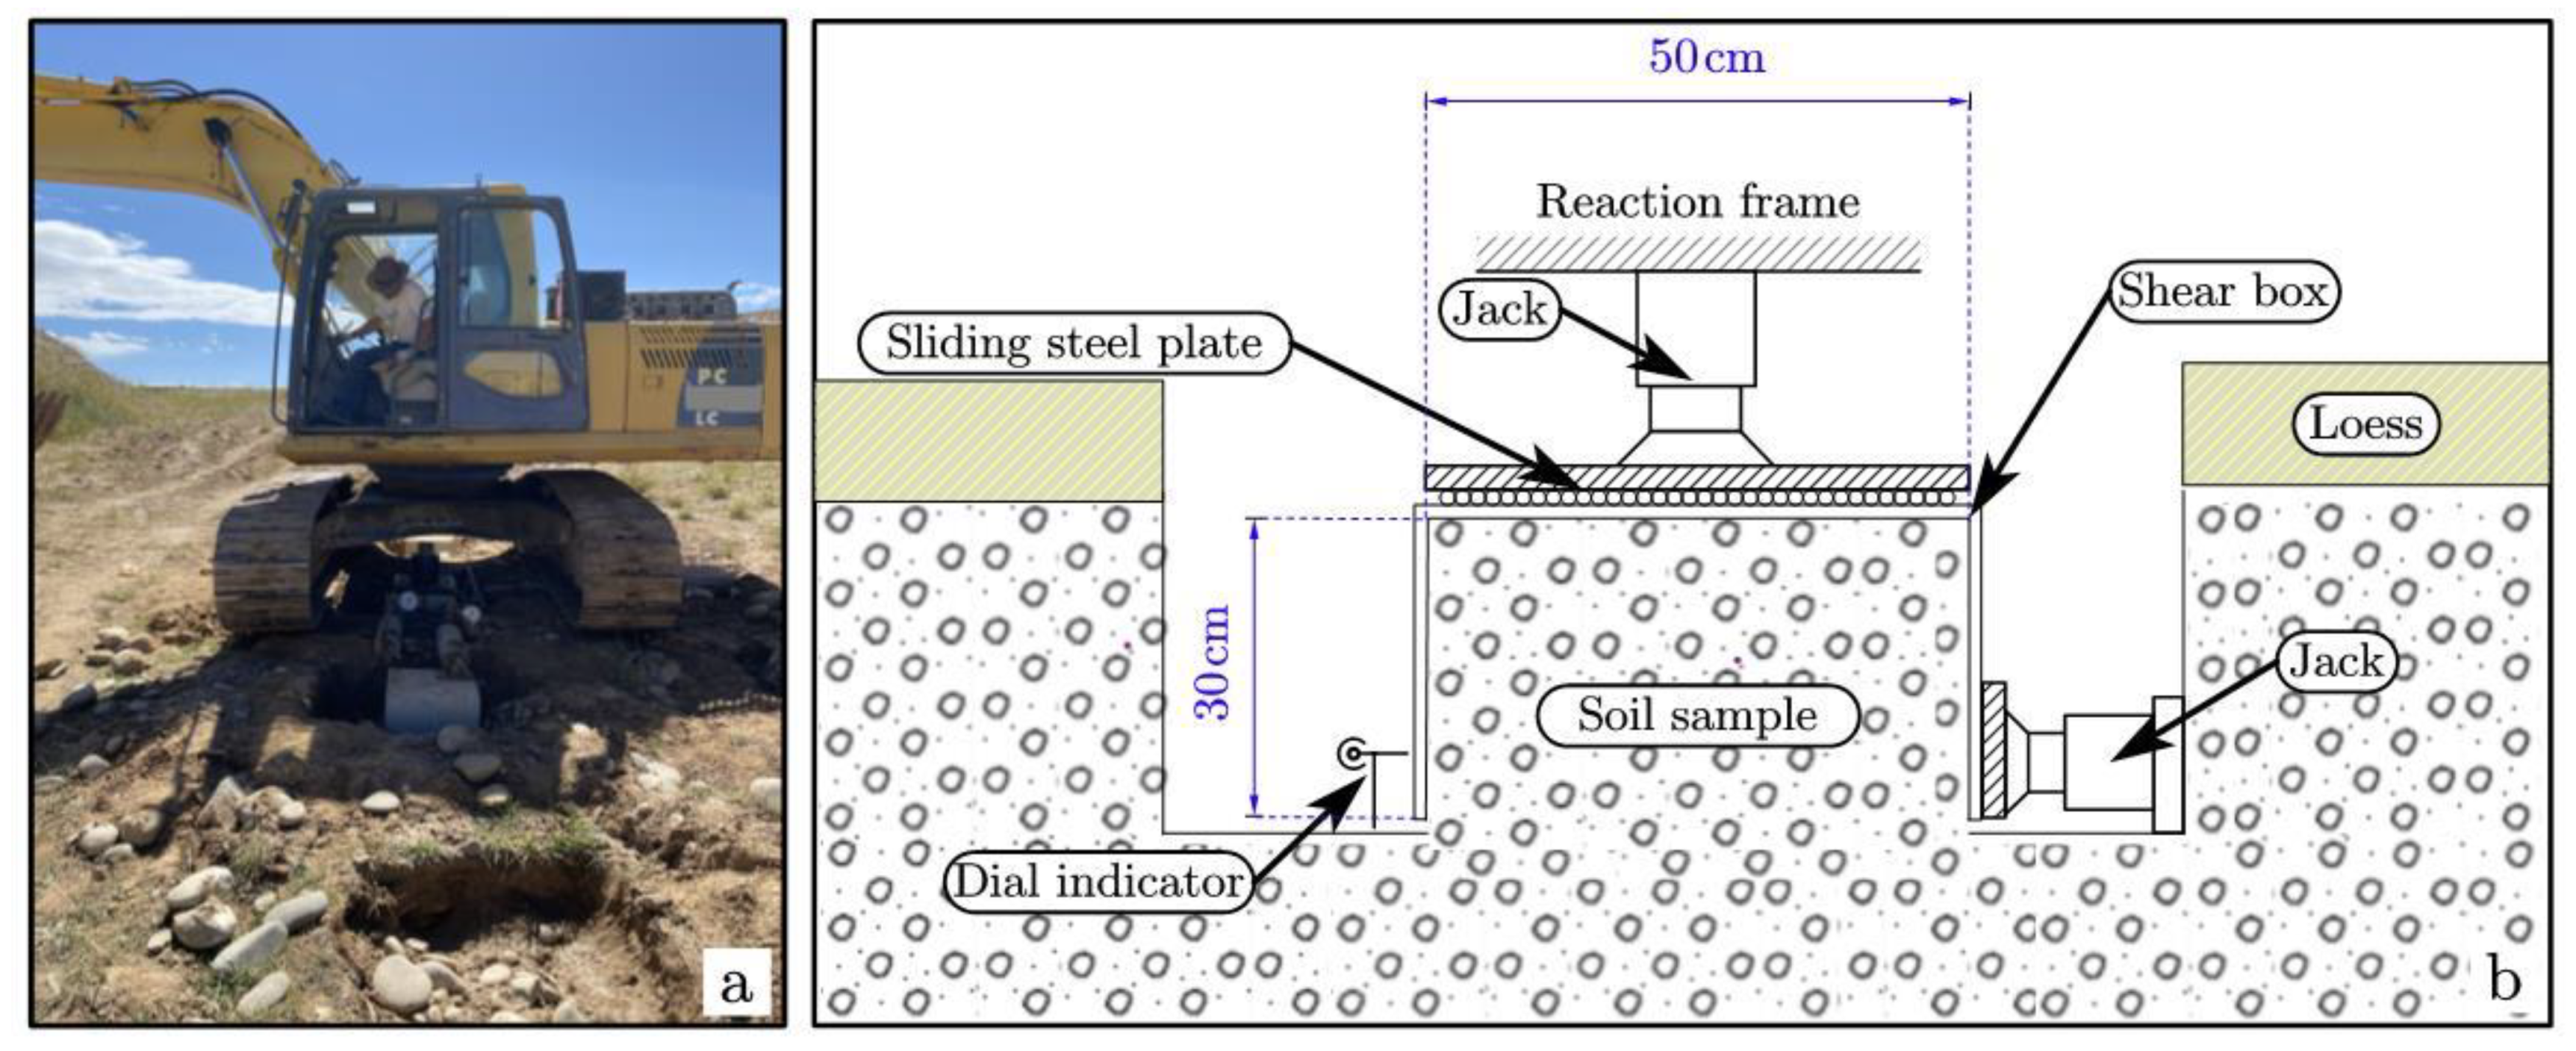
2.2.1. In Situ Direct Shear Test

The in situ direct shear test was conducted in accordance with the “Code for In-situ Direct Shear Test of Geotechnical Materials” (HG/T 20693-2006) [24], with the experimental setup illustrated in Figure 2. An excavator base provided a rigid reaction frame, while vertical hydraulic jacks applied normal stress and horizontal hydraulic jacks delivered shear force and measured shear strength.
Specimen preparation began with excavating a 1 m × 1 m × 0.5 m test pit at the summit of the Jilangtan platform. After clearing the surface loess layer, a square soil column (0.5 m × 0.5 m × 0.3 m) was sculpted at the pit’s center, meeting the code’s requirement that the height be at least four times d max . The column’s surface was then stabilized with poured concrete, leaving a 2 cm gap at the base to mimic the shear plane. To explore the shear strength of in situ CGS under varying moisture conditions, the test was split into two groups of four specimens each: one group retained its natural state, while the other was saturated by full submersion in water for 48 h.

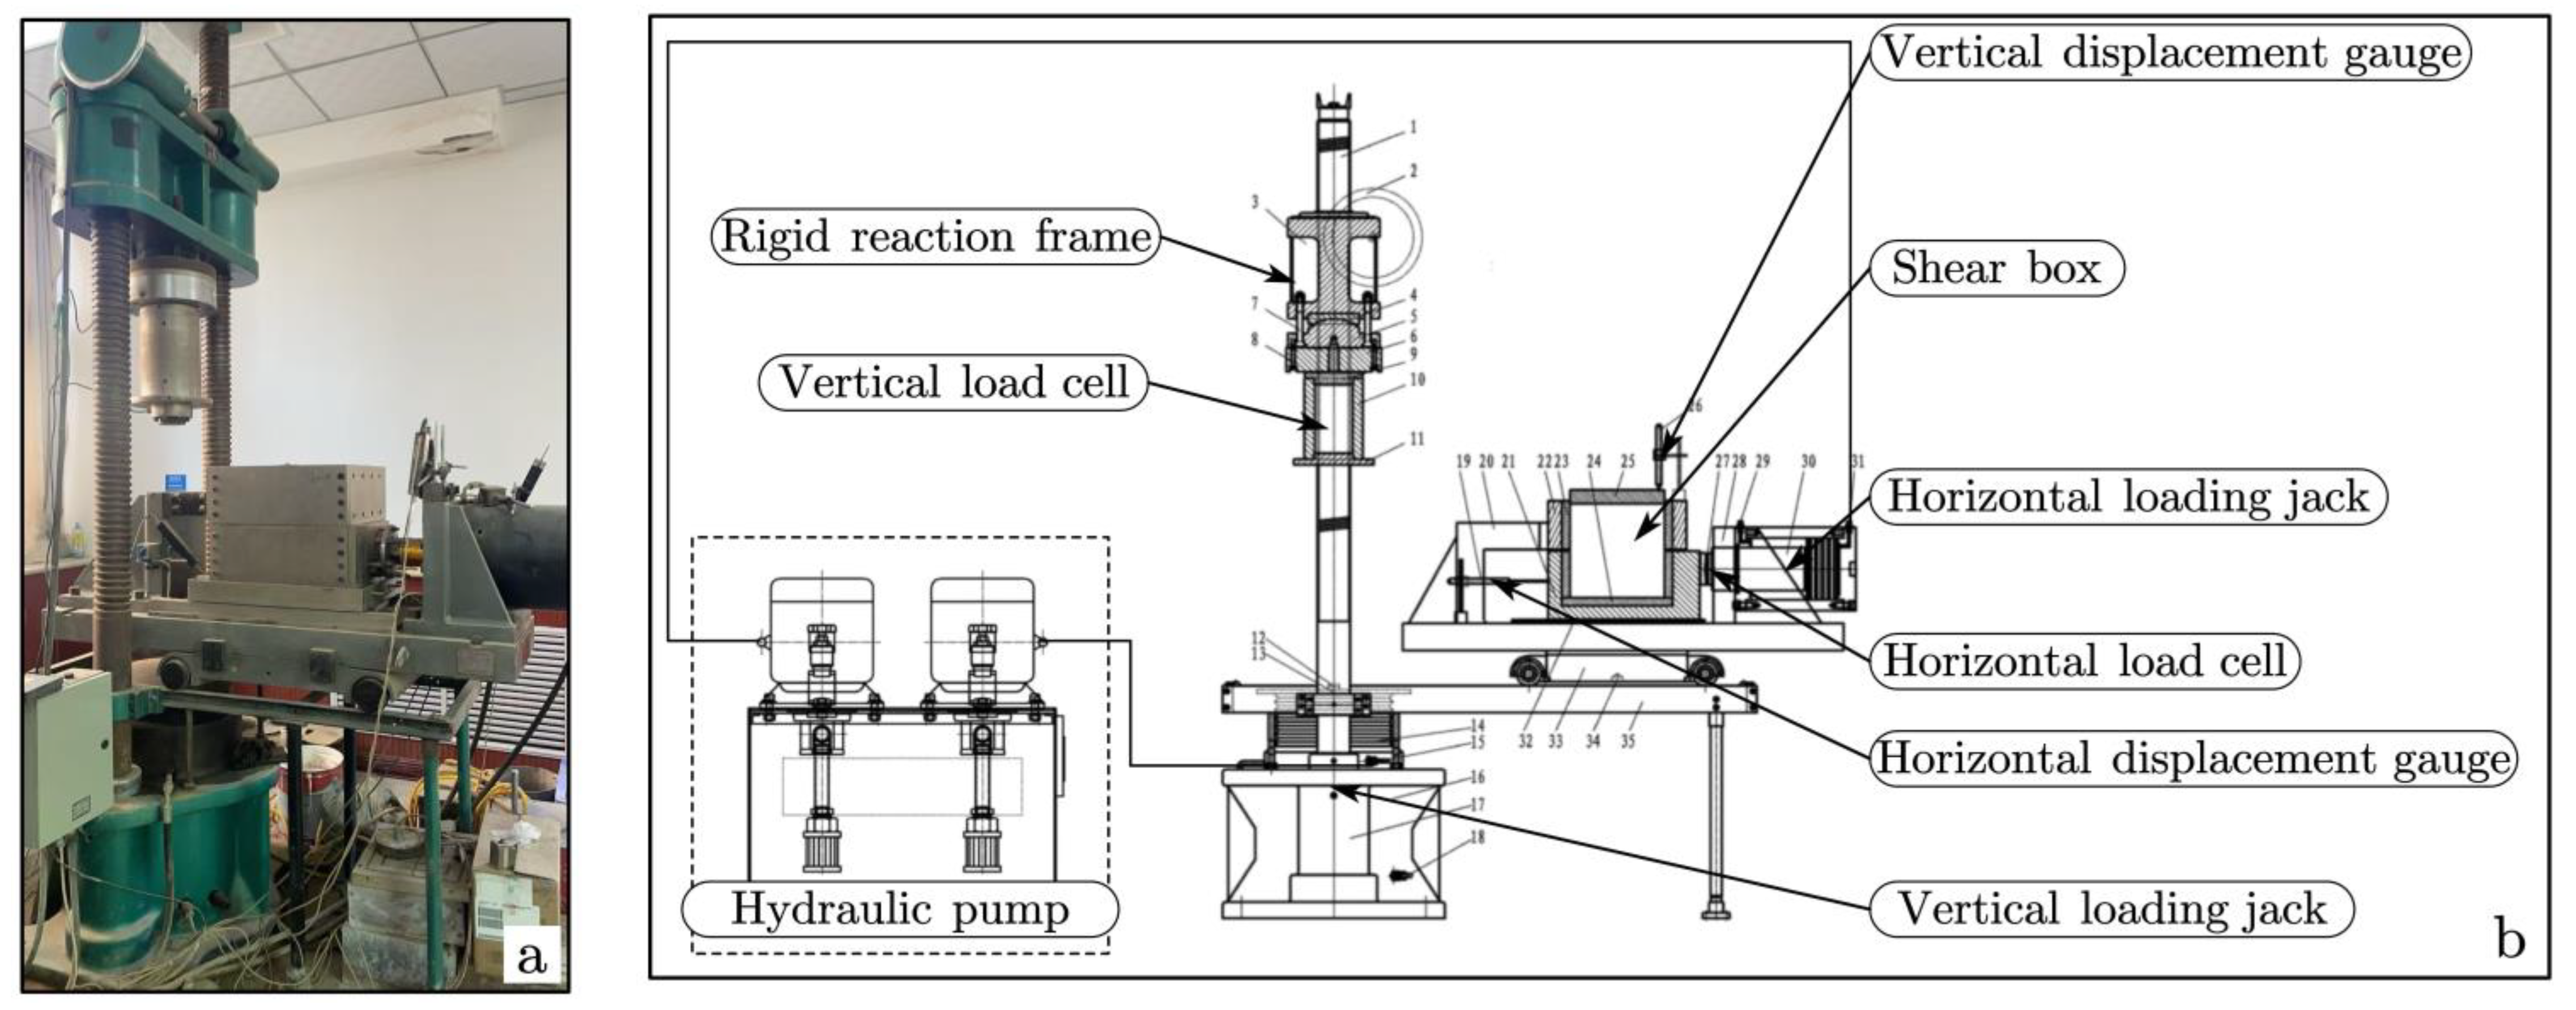
2.2.2. Laboratory Large-Scale Direct Shear Test

The laboratory direct shear test utilized a large-scale direct shear apparatus (see Figure 3), featuring a rigid frame, servo-hydraulic system, vertical and horizontal loading mechanisms, and displacement sensors. The shear box dimensions were 350 mm × 350 mm × 250 mm, supporting a maximum vertical stress of 16 MPa, a maximum horizontal stress of 8 MPa, and an adjustable shear rate ranging from 0.001 to 10 mm/min. Uniform shearing was achieved by anchoring the upper shear box and displacing the lower one.

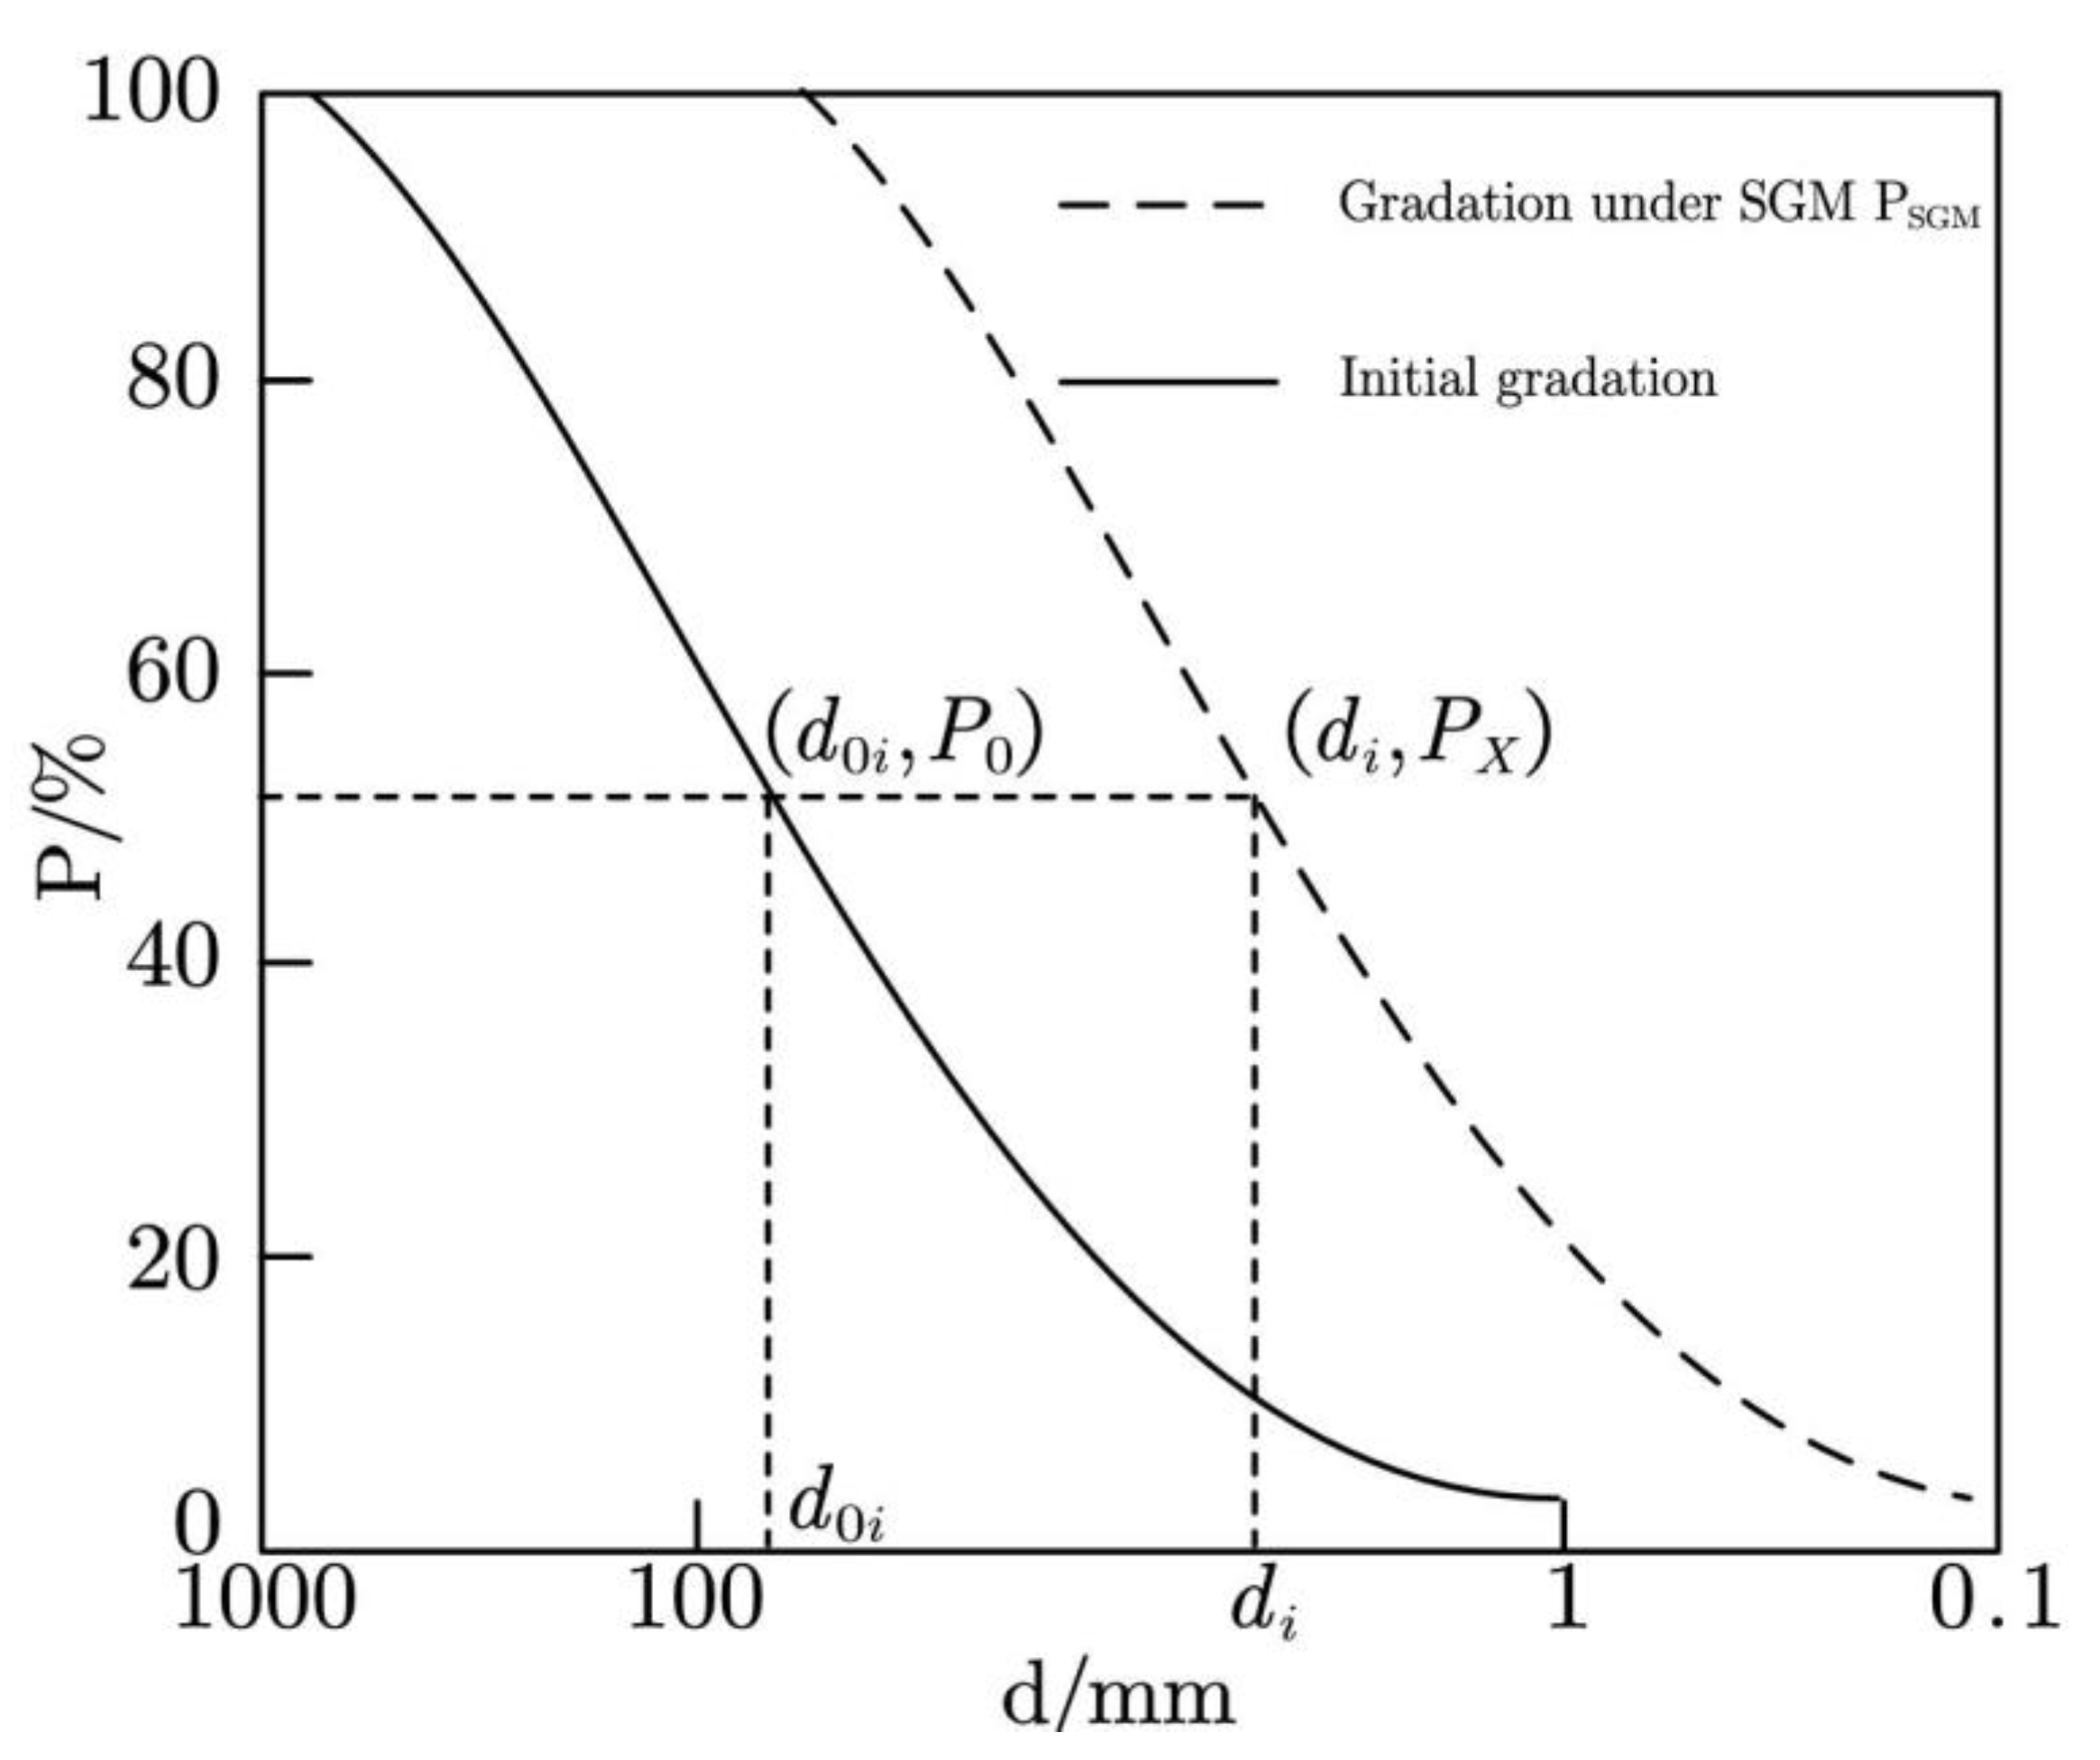
2.3. Maximum Particle Size and Specimen-Scaling Methods

Given the shear box dimensions (350 mm × 250 mm) for the large-scale laboratory shear test, international standards diverge notably in their d max stipulations: ASTM D3080 mandates d max 35 mm (1/10 of the specimen length), whereas DL/T 5356-2019 permits d max 70 mm (1/5 of the specimen length). Per DL/T 5356-2019, the original CGS gradation ( d max = 60 mm ) is suitable for direct testing in the large-scale apparatus. In contrast, ASTM D3080 necessitates scaling to comply with its criteria. To systematically assess the influence of d max values and scaling techniques on CGS shear strength, this study employs two prevalent methods—the Equivalent Substitution Method (ESM) and the Similar Gradation Method (SGM)—to adjust the original gradation ( d max = 60 mm ) to ASTM’s requirement ( d max = 30 mm ), followed by large-scale direct shear testing.
The ESM, depicted in Figure 4, replaces oversized particles with coarse ones (5–60 mm) to keep the scaled gradation’s mechanical properties as similar as possible to the original by regulating fine particle content. The formula for calculating each particle group’s content in ESM is
Δ P i = P > 5 P > 5 P > d max 0 Δ P 0 i
where Δ P i is the content of a particle group after scaling (%), Δ P 0 i is the content of a particle group in the original gradation (%), P > d max 0 is the content of oversized particles (%), and P > 5 is the content of particles larger than 5 mm (%). Δ P i , Δ P 0 i , and P > d max 0 are illustrated in Figure 4.
The SGM, outlined in Figure 5, scales down particle sizes of the original gradation using geometric similarity principles, preserving the gradation curve’s shape while reducing d max to the target value. The scaling formulas are
d i = d 0 i B
B = d 0 max d max
P x = P 0
where d 0 i is a certain particle size in the original gradation (mm), d i is the particle size after scaling the original gradation by a factor of B (mm), B is the particle size reduction coefficient, d0max is the maximum particle size of the original gradation (mm), d max is the allowable maximum particle size of the specimen (mm), P 0 is the percentage of particles smaller than a certain size in the original gradation (%), and P X is the percentage of particles smaller than a certain size after scaling by B (%).

2.4. Test Program

To mitigate the effects of uneven particle distribution on test outcomes, in situ gravelly sand was sieved and reconstituted into CGS specimens reflecting the original gradation, equivalent substitution gradation, and similar gradation (gradation curves are presented in Figure 6). All specimens were standardized to a relative density of D r = 0.85 and tested under three moisture content conditions: 0.91% (air-dried), 2.45% (natural), and 7.66% (saturated). During preparation, the air-dried moisture content (0.91%) served as the reference for determining the soil mass and water needed for each condition. Post-mixing, specimens were sealed and rested for 6 h to ensure even moisture distribution (specimen states under different moisture contents are shown in Figure 7).
Specimen preparation complied strictly with standard protocols: samples were placed into the shear box in five layers via the layered filling method, with each layer’s surface roughened and compacted to a predetermined height. The test program is outlined in Table 3.

3. Results and Discussion

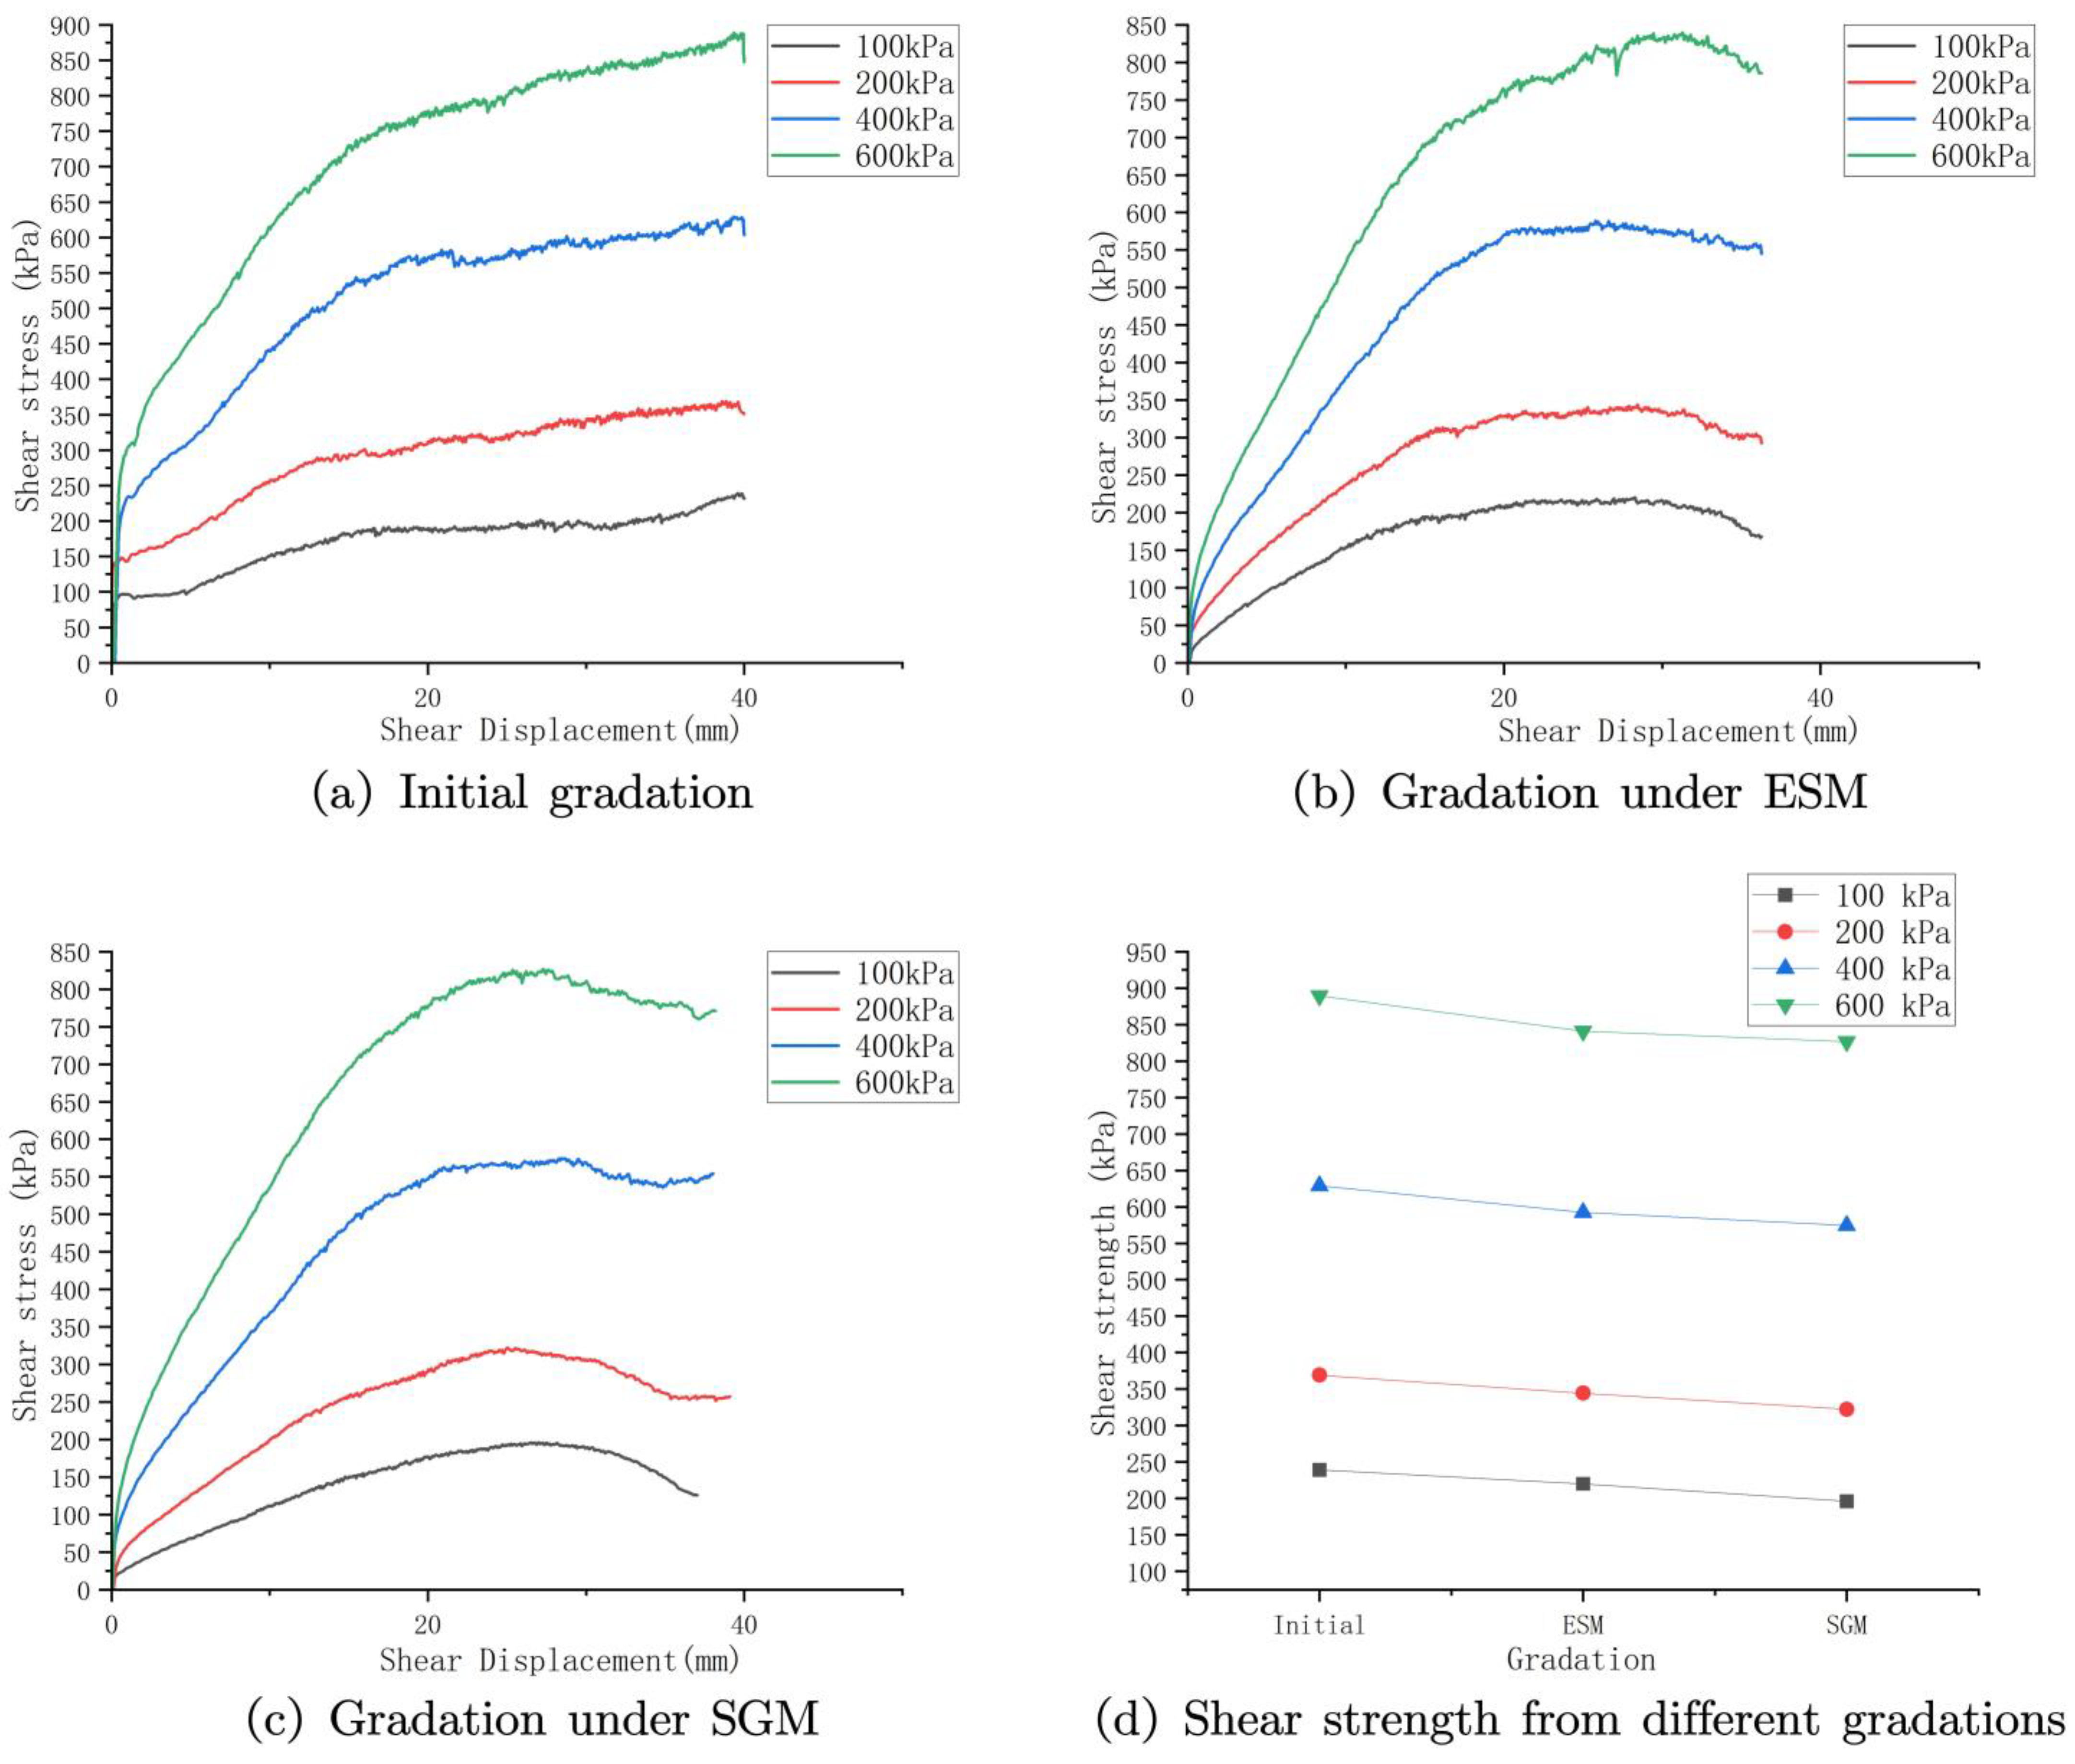
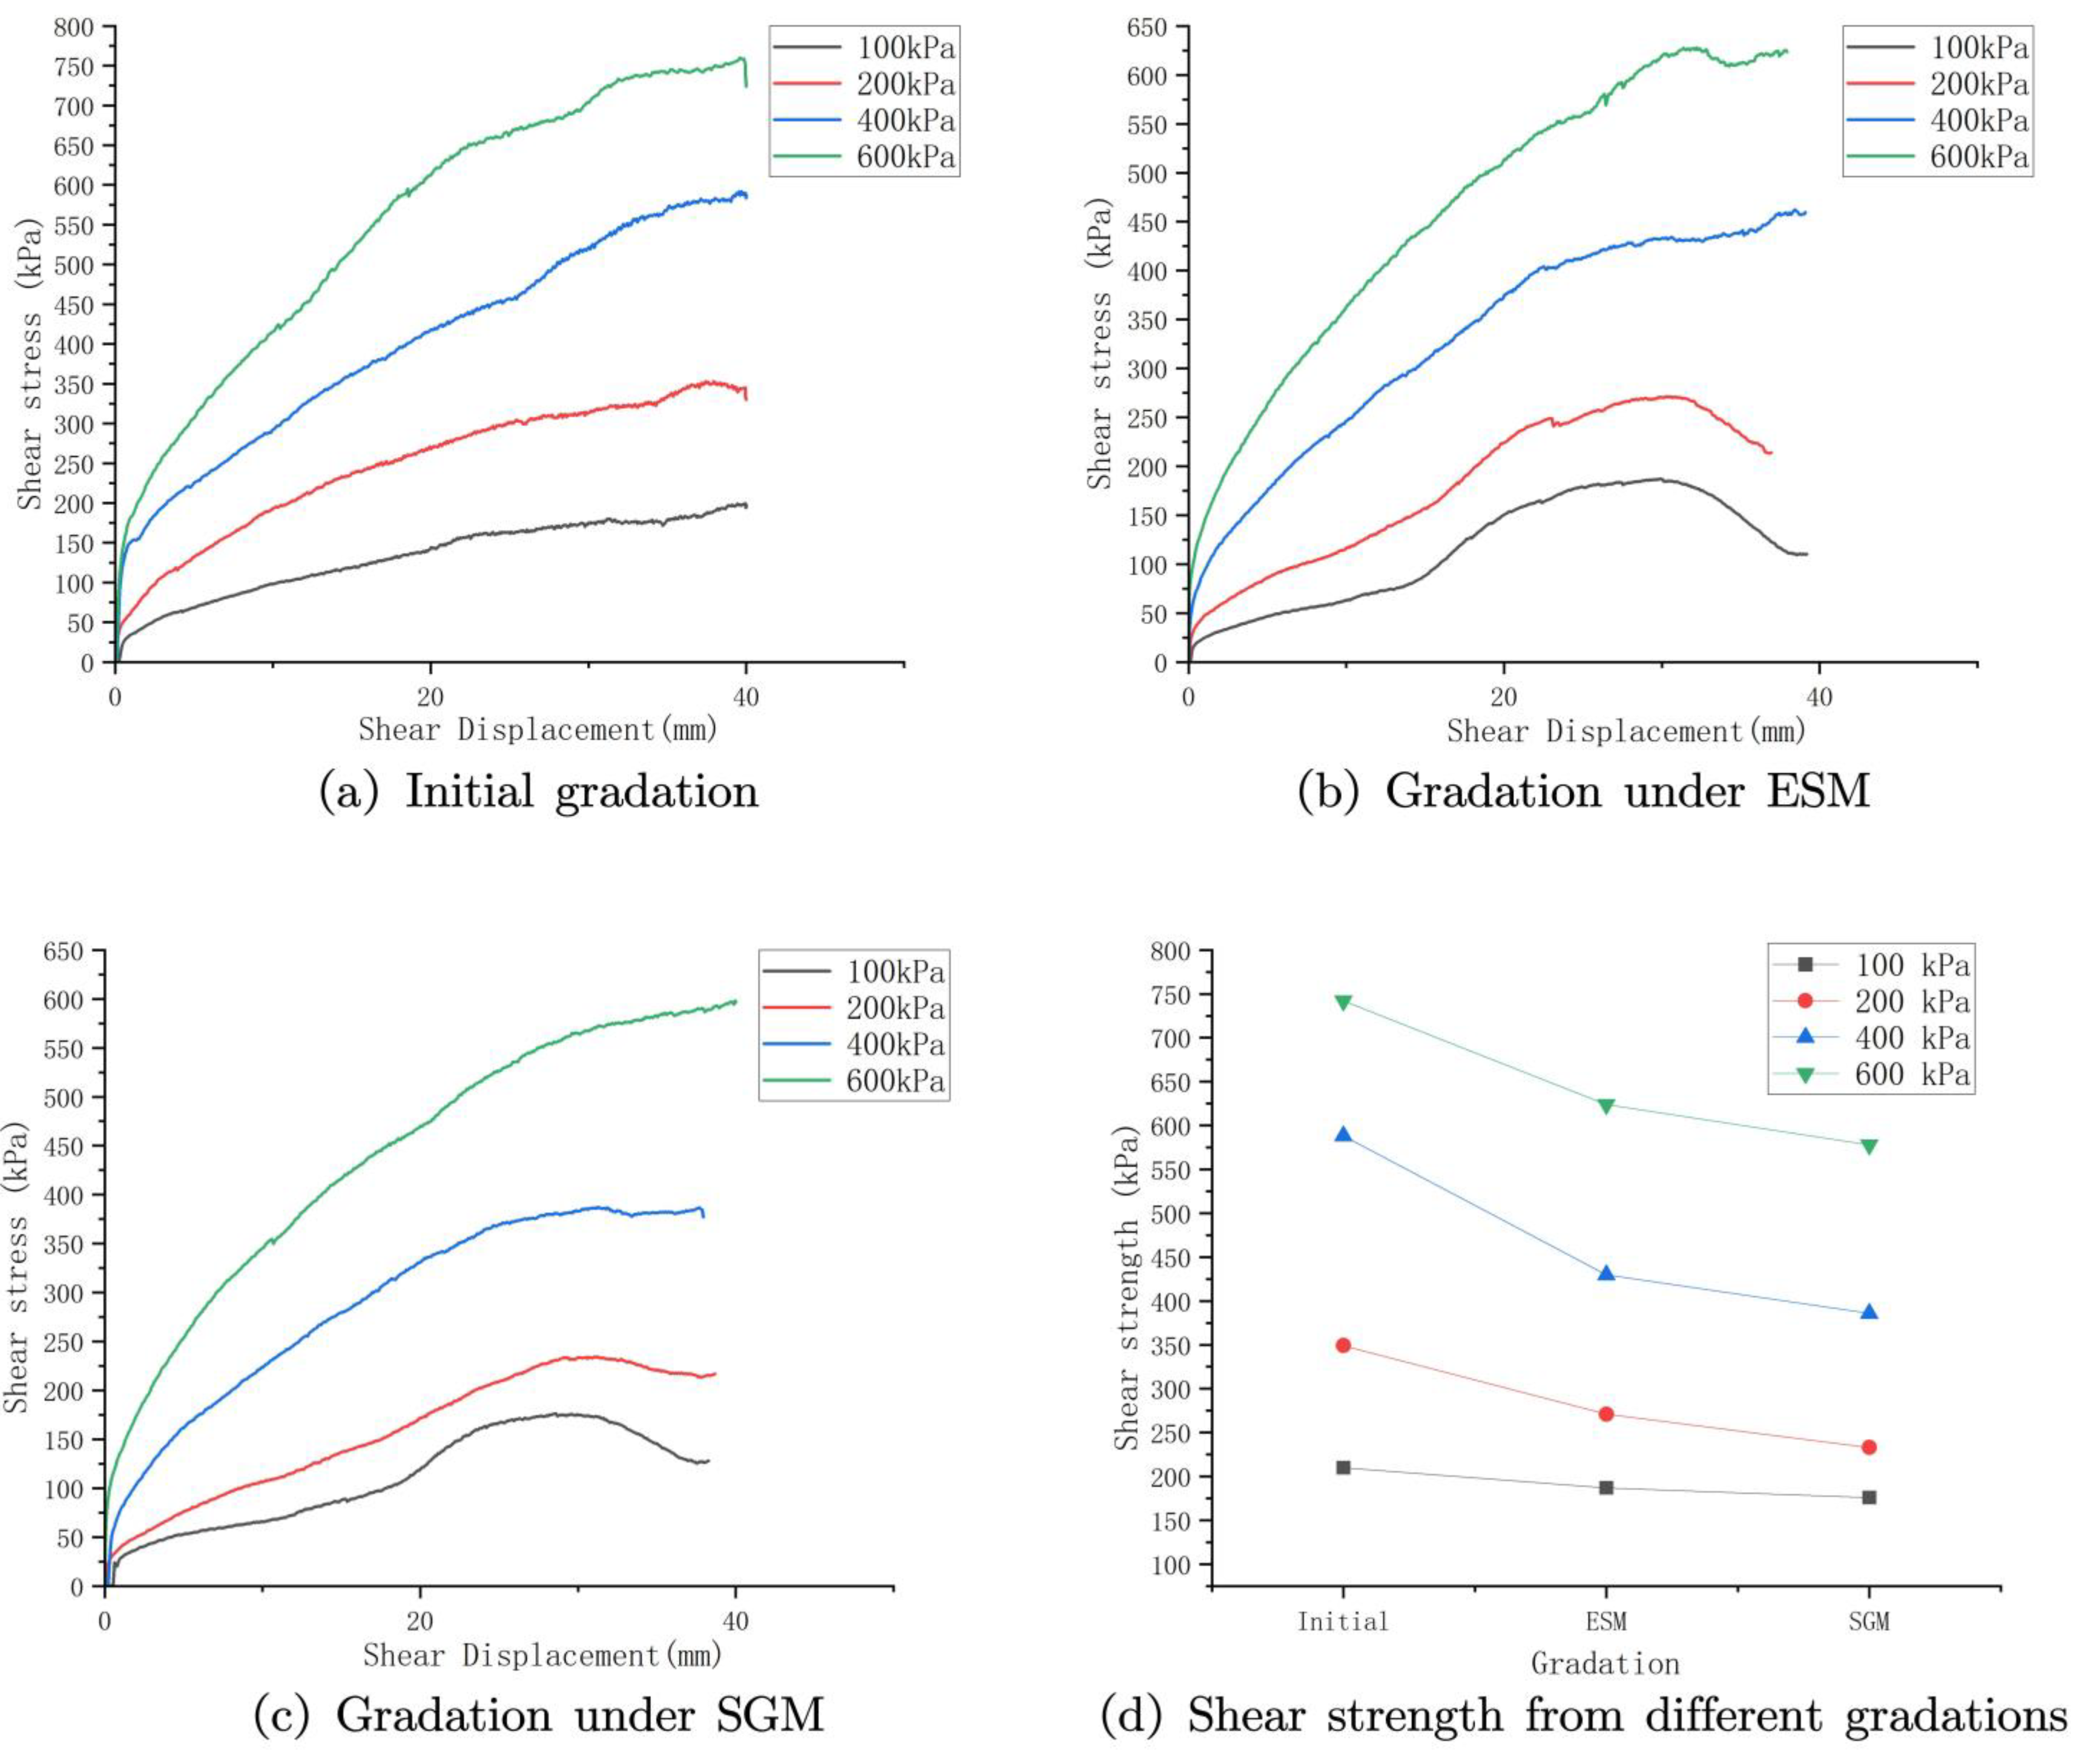
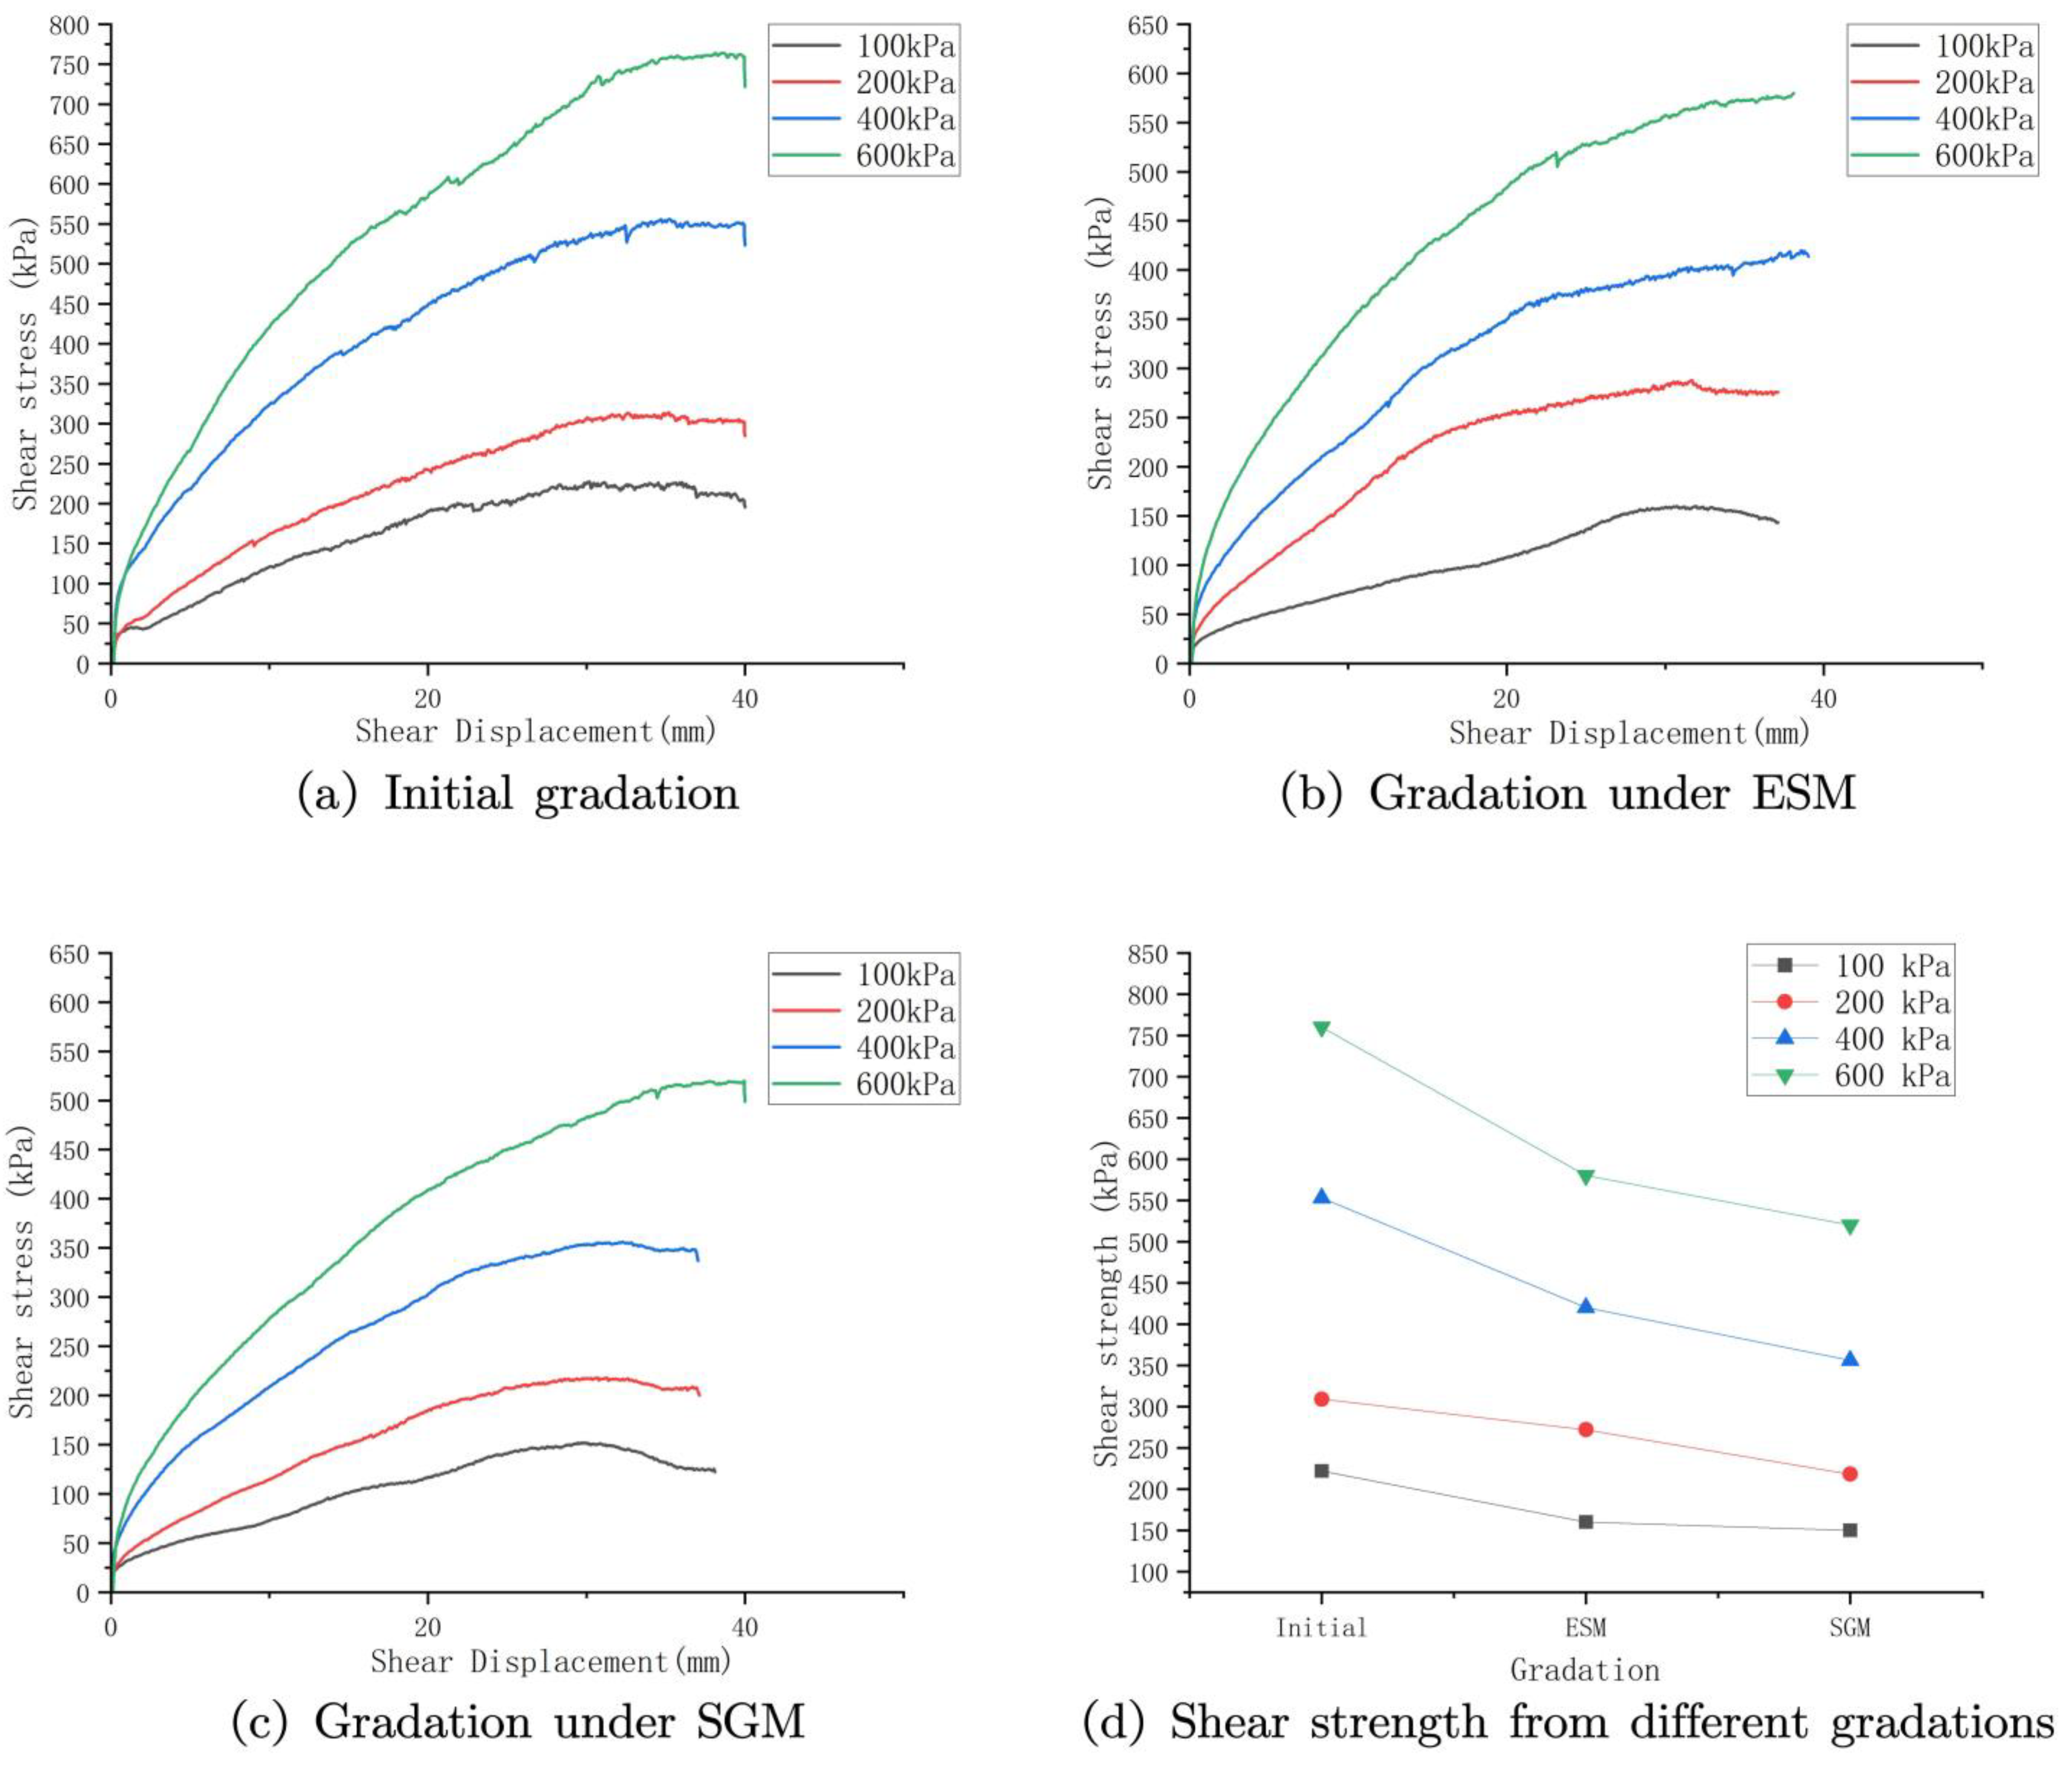
3.1. Effect of Scaling on Shear Strength of CGS

Figure 8 presents shear test results for soil samples of varying gradations under normal stresses of 100 kPa, 200 kPa, 400 kPa, and 600 kPa at a moisture content of w = 0.91 % . Analysis of Figure 8a reveals that the shear stress of the original gradation CGS sample rises steadily with shear displacement, lacking a distinct peak, and displays characteristic strain-hardening behavior. Figure 8b,c illustrates the shear stress–shear displacement curves for samples scaled by the ESM and SGM at w = 0.91 % , respectively. These scaled samples exhibit mild strain-softening, with peak shear stress occurring at displacements of approximately 25–30 mm, followed by a modest decline.
Figure 8d depicts the shear strength of specimens across gradations, measured per the “Standard for Geotechnical Testing Methods” (GB/T 50123-1999). This standard defines peak shear strength as the maximum value on the shear stress–shear displacement curve or, in the absence of a clear peak, the stress at 1/10 to 1/15 of the shear displacement range. Results consistently show the original gradation yielding the highest shear strength under all normal stresses, followed by ESM and SGM. At lower stresses, the strength difference among the three is about 40 kPa, rising to roughly 60 kPa at higher stresses, averaging 50 kPa. This suggests that variations in maximum particle size ( d max ) and scaling methods exert a limited influence on CGS shear strength at w = 0.91 % , with peak strength reductions from the original gradation to ESM and SGM remaining modest.
Figure 9 displays shear test outcomes at w = 2.45 % . As shown in Figure 9a, the original gradation sample mirrors its w = 0.91 % counterpart, exhibiting strain-hardening behavior. Figure 9b,c indicates that scaled specimens display slight strain-softening at 100 kPa and 200 kPa normal stresses but transition to strain-hardening at 400 kPa and 600 kPa. Figure 9d highlights a marked reduction in shear strength for scaled specimens, particularly at higher stresses: at 600 kPa, ESM and SGM specimens show reductions of 118 kPa and 165 kPa, respectively, compared to the original gradation, while at 100 kPa, reductions are 23 kPa and 34 kPa.
Figure 10a illustrates the shear stress–shear displacement curve for the original gradation at w = 7.66 % , where shear stress increases gradually, peaks around 36 mm, and then stabilizes, reflecting strain-hardening traits. Figure 10b,c shows ESM and SGM specimens, respectively, with slight strain-softening at low normal stresses and strain-hardening at higher ones, consistent with trends at w = 2.45 % . Figure 10d reveals substantial shear strength reductions in scaled specimens under saturated conditions: at 600 kPa, ESM and SGM exhibit drops of 180 kPa and 240 kPa, respectively, relative to the original gradation, with scaling effects more pronounced than at w = 2.45 % .
A comprehensive analysis confirms that, under identical conditions, the original gradation consistently achieves the highest shear strength, followed by ESM and SGM. Strength differences are minimal at w = 0.91 % first but grow significantly with increasing moisture content (e.g., w = 2.45 % and w = 7.66 % )

3.2. Effects of Scaling and Moisture Content on the Shear Strength Parameters of CGS

To further investigate the impact of scaling and moisture content on the CGS shear strength, this study analyzed peak failure strengths and shear stress relationships using the Mohr–Coulomb (M-C) criterion. Table 4 compiles the cohesion ( c ) and internal friction angle ( ϕ ) for each specimen group. The data indicate that reducing d max lowers both c and ϕ , with the extent of this effect varying by moisture content and scaling method. At w = 0.91 % , scaling causes only a slight drop in cohesion, while ϕ remains largely stable. In air-dried conditions, where moisture is minimal, CGS shear strength stems primarily from interparticle friction and interlocking—driven by particle strength, shape, roughness, and contact distribution—factors minimally affected by size. Thus, scaling preserves these mechanisms, keeping ϕ steady, with the small cohesion decrease likely due to reduced contact areas, an effect diminished by the lack of moisture-induced bonding.
At natural ( w = 2.45 % ) and saturated ( w = 7.66 % ) moisture levels, reducing d max markedly lowers both c and ϕ . Relative to the original gradation, ESM specimens show average reductions of 20 kPa in c and 5° in ϕ , while SGM specimens exhibit drops of 35 kPa in c and 7° in ϕ . This is tied to coarse particle content (see Figure 6), highest in the original gradation, followed by ESM and SGM. Higher moisture enhances particle sliding, rolling, and displacement, particularly in specimens with fewer coarse particles, which are more susceptible to movement. During shearing, the shear box’s constraints hinder particle realignment in high-coarse-content specimens, boosting shear strength.

3.3. Comparative Analysis of In Situ and Laboratory Direct Shear Results

Figure 11 presents shear stress–shear displacement relationships from in situ direct shear tests, conducted only at natural ( w = 2.45 % ) and saturated ( w = 7.66 % ) moisture levels due to field constraints. Differing normal stress settings between in situ and laboratory tests prevent direct strength comparisons, so this study focuses on shear strength parameters ( c and ϕ ) derived from the Mohr–Coulomb criterion, summarized in Figure 12 for both conditions.
The original gradation specimens in laboratory tests exhibit notably higher peak strengths than in situ results at both w = 2.45 % and w = 7.66 % . This gap widens at higher normal stresses, with laboratory-derived c and ϕ also exceeding in situ values. For a 350 mm × 250 mm shear box, using original gradation specimens with d max = 60 mm thus overestimates shear strength parameters due to size effects. Scaled specimens yield peak strengths closer to in situ outcomes: ESM specimens’ ϕ aligns well with in situ results, though their c is overestimated, while SGM specimens show slightly lower ϕ and higher c . Overall, laboratory and in situ results differ regardless of d max or scaling method, but SGM outcomes most closely match in situ peak strengths and parameters.

4. Conclusions

The principal findings of this study can be summarized as follows:
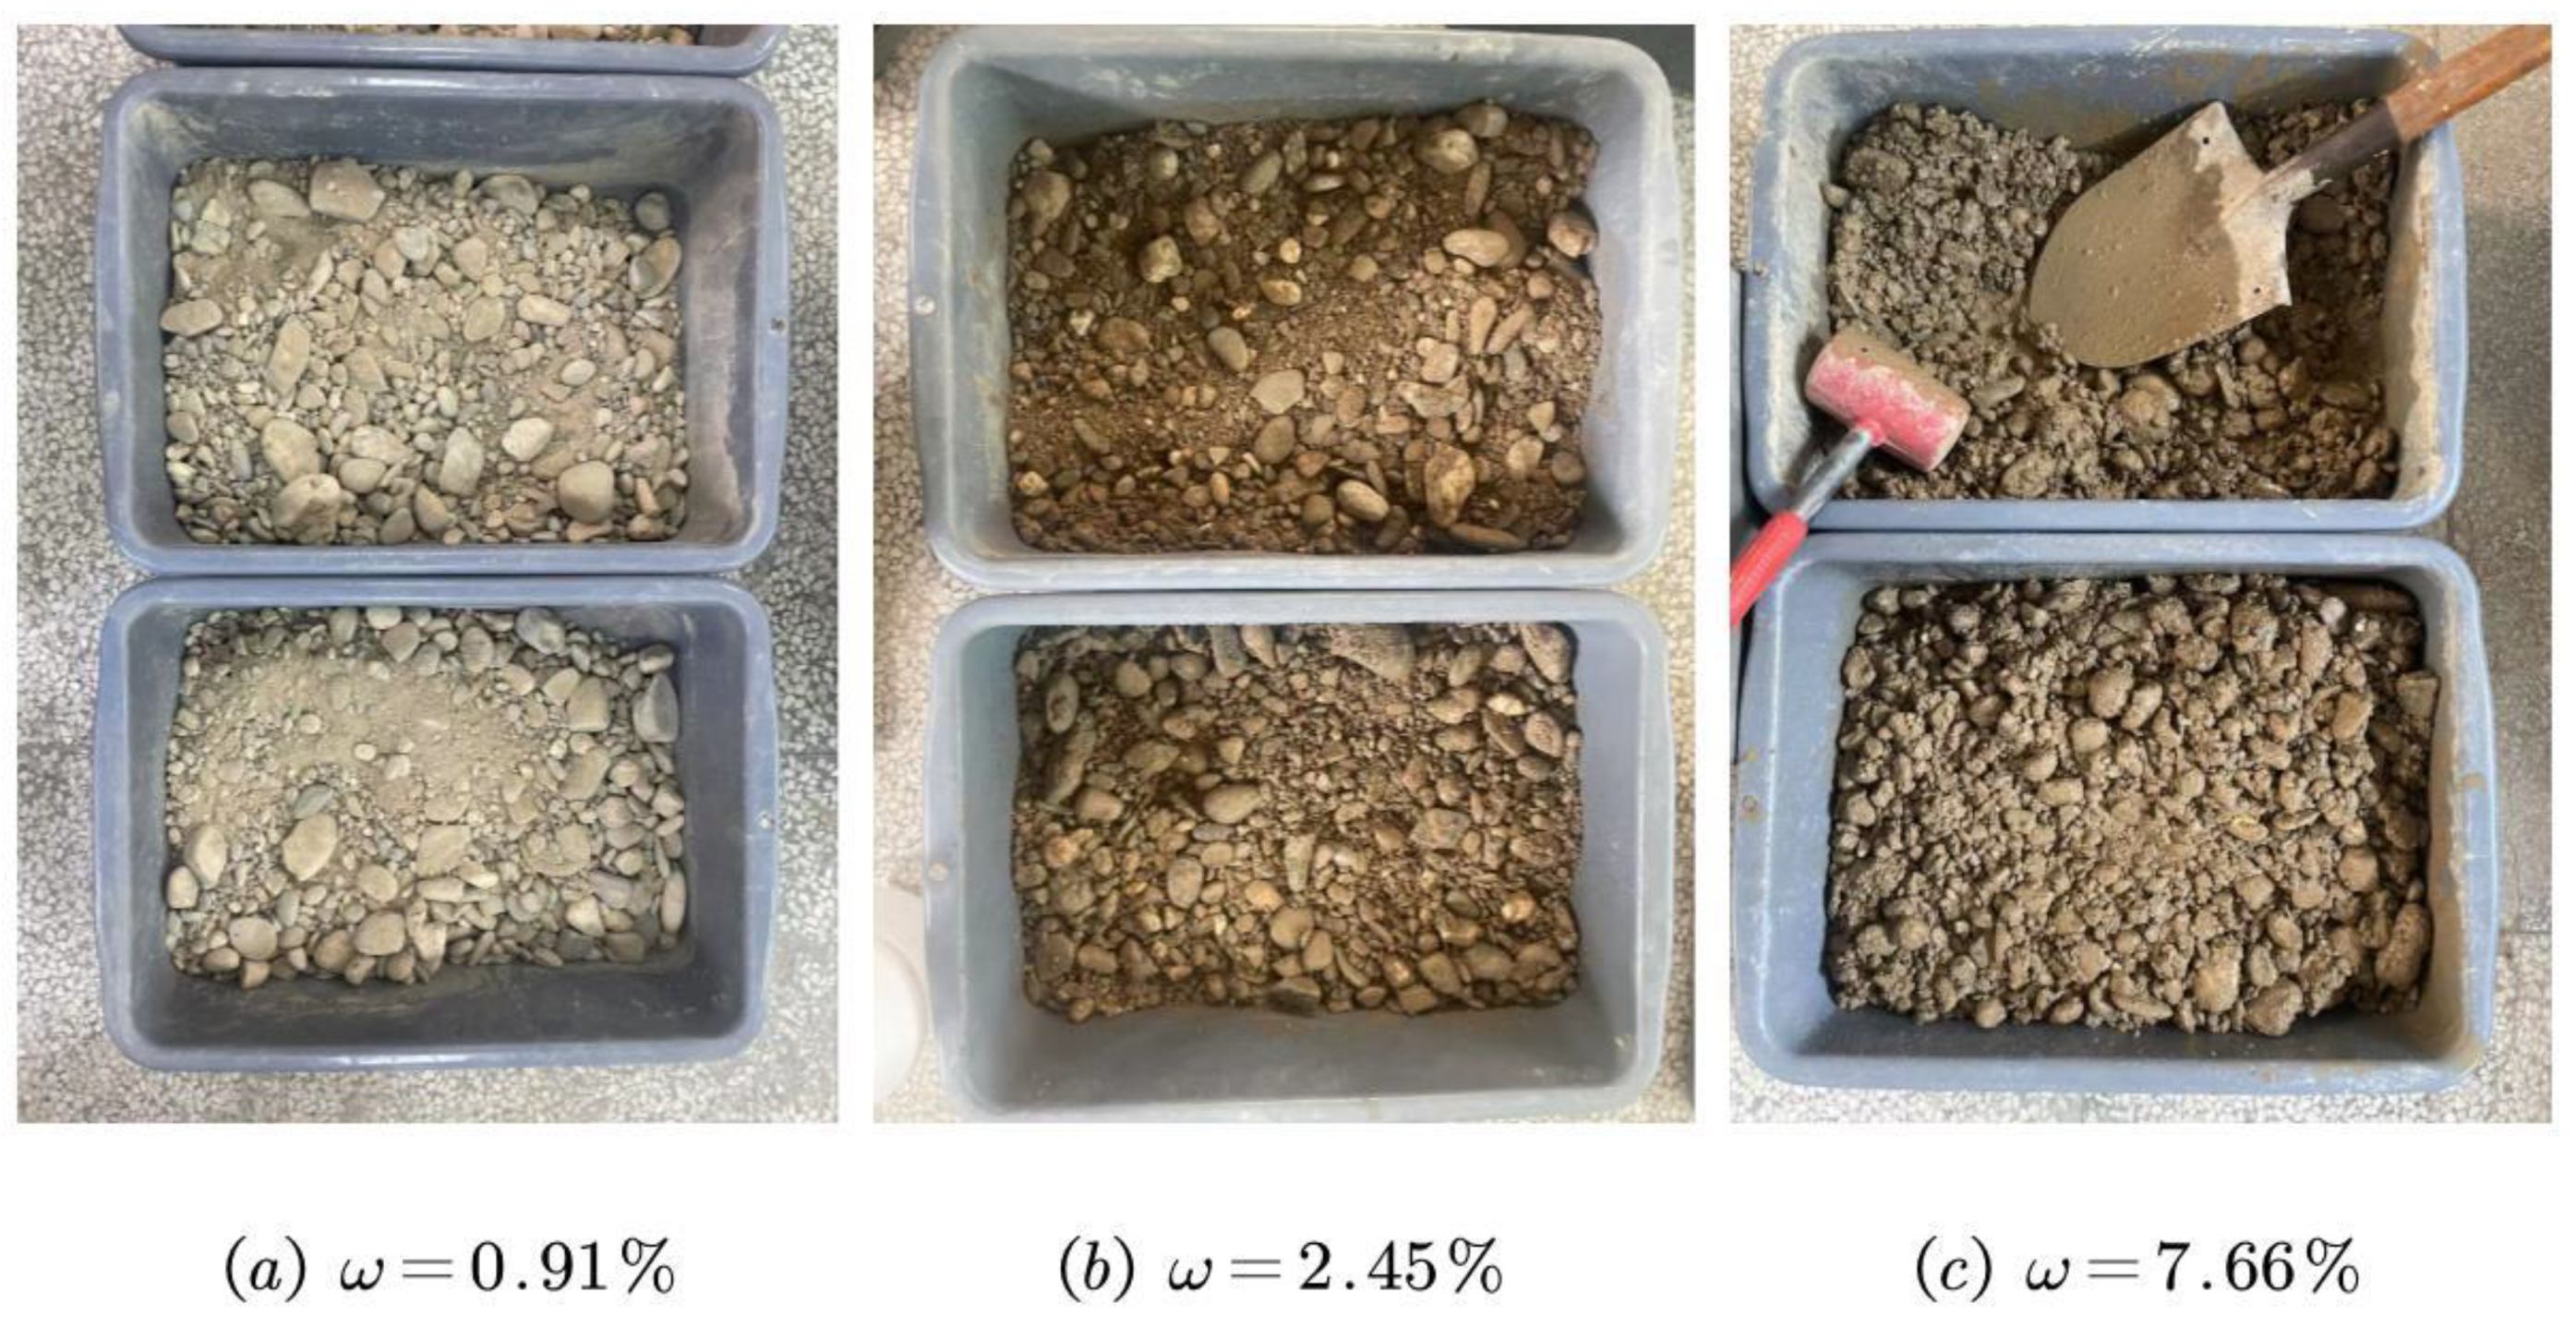
  • Moisture content affects shear strength differently depending on gradation. At air-dried moisture content ( w = 0.91 % ), the original gradation, ESM, and SGM exhibit similar strengths, with weak scaling effects. Under natural ( w = 2.45 % ) and saturated ( w = 7.66 % ) conditions, scaled specimens show significant strength reductions.
  • For a shear box of 350 mm × 250 mm, original gradation specimens with d max = 60 mm exhibit significantly higher shear strength in laboratory tests than in situ results, with cohesion ( c ) and internal friction angle ( ϕ ) also overestimated. This suggests that using specimens with d max W / 5 may lead to overestimated strength values, necessitating caution in engineering applications. For specimens scaled to d max W / 10 , the shear strength parameters are closer to those from in situ direct shear tests, suggesting that such scaling better reflects field conditions.
  • Scaled specimens ( d max W / 10 ) demonstrate distinct differences in shear strength depending on the scaling method. ESM specimens show internal friction angles ( ϕ ) close to in situ values but overestimated cohesion ( c ), while SGM specimens exhibit slightly lower ϕ and higher c . Overall, SGM results align most closely with in situ tests in peak strength and shear strength parameters, providing more reliable data for engineering design by better reflecting the mechanical behavior of field soil.
Given the expense and time constraints associated with in situ direct shear tests, laboratory direct shear tests remain the primary method for evaluating CGS shear strength. The accuracy of shear strength parameters derived from laboratory tests can be significantly influenced by different scaling methods under varying moisture conditions. Through the comparison of in situ and laboratory results, this study offers valuable insights and guidance for achieving accurate CGS shear strength measurements in laboratory settings. It is important to note that the scaling methods discussed in this paper are limited to two commonly used approaches, and the particle size range considered is confined to the gradation of the Jilangtan platform CGS. Future work will concentrate on refining these methods by broadening the particle size range and considering additional scaling methods.

Author Contributions

M.F. wrote the first draft of the paper and carried out the laboratory large-scale direct shear test. H.X. and J.C. did the in situ direct shear test. Y.S. checked and improved the paper. All authors have read and agreed to the published version of the manuscript.

Funding

This research received no external funding.

Institutional Review Board Statement

Not applicable.

Informed Consent Statement

Not applicable.

Data Availability Statement

The original contributions presented in this study are included in the article. Further inquiries can be directed to the corresponding author.

Acknowledgments

The authors’ gratitude goes to the reviewers for their helpful comments and constructive suggestions in improving this paper.

Conflicts of Interest

The authors declare no conflicts of interest.

References

  1. Alonso, E.E.; Tapias, M.; Gili, J. Scale Effects in Rockfill Behaviour. Geotech. Lett. 2012, 2, 155–160. [Google Scholar] [CrossRef]
  2. Matsuoka, H.; Liu, S.; Sun, D.A.; Nishikata, U. Development of a New In-situ Direct Shear Test. Geotech. Test. J. 2001, 24, 92–102. [Google Scholar] [CrossRef]
  3. Zou, Z.; Zhang, Q.; Xiong, C.; Tang, H.; Fan, L.; Xie, F.; Yan, J.; Luo, Y. In Situ Shear Test for Revealing the Mechanical Properties of the Gravelly Slip Zone Soil. Sensors 2020, 20, 6531. [Google Scholar] [CrossRef] [PubMed]
  4. Kucova, E.; Frankovska, J. Determination of shear and deformation parameters of coarse-grained soils. In Smart Geotechnics for Smart Societies; CRC Press: Boca Raton, FL, USA, 2023; pp. 407–412. [Google Scholar]
  5. Jin, J.; Jin, Q.; Li, M.; Liu, B.; Zhao, S.; Wei, Y. Analysis of Large-Scale In Situ Shear Tests of Sandy Gravel with Cobbles. Int. J. Civ. Eng. 2024, 22, 2031–2040. [Google Scholar] [CrossRef]
  6. Rathee, R.K. Shear Strength of Granular Soils and Its Prediction by Modeling Techniques. J. Inst. Eng. 1981, 62, 64–70. [Google Scholar]
  7. Palmeira, E.M.; Milligan, G.W.E. Scale Effects in Direct Shear Tests on Sand. In Proceedings of the 12th International Conference on Soil Mechanics and Foundation Engineering, Rio de Janeiro, Brazil, 13–18 August 1989; Volume 1, pp. 739–742. [Google Scholar]
  8. Cerato, A.; Lutenegger, A. Specimen Size and Scale Effects of Direct Shear Box Tests of Sands. Geotech. Test. J. 2006, 29, 507–516. [Google Scholar] [CrossRef]
  9. Wu, P.-K.; Matsushima, K.; Tatsuoka, F. Effects of Specimen Size and Some Other Factors on the Strength and Deformation of Granular Soil in Direct Shear Tests. Geotech. Test. J. 2008, 31, 45–64. [Google Scholar] [CrossRef]
  10. Mirzaeifar, H.; Abouzar, A.; Abdi, M.R. Effects of Direct Shear Box Dimensions on Shear Strength Parameters of Geogrid-Reinforced Sand. In Proceedings of the GeoMontreal 2013, Montreal, QC, Canada, 29 September–3 October 2013. [Google Scholar]
  11. Omar, T.; Sadrekarimi, A. Effect of Triaxial Specimen Size on Engineering Design and Analysis. Int. J. Geo-Eng. 2015, 6, 1–17. [Google Scholar] [CrossRef]
  12. Moayed, R.Z.; Alibolandi, M.; Alizadeh, A. Specimen Size Effects on Direct Shear Test of Silty Sands. Int. J. Geotech. Eng. 2016, 11, 198–205. [Google Scholar] [CrossRef]
  13. Zahran, K.; Naggar, H.E. Effect of Sample Size on TDA Shear Strength Parameters in Direct Shear Tests. Transp. Res. Rec. 2020, 2674, 1110–1119. [Google Scholar] [CrossRef]
  14. Deiminiat, A.; Li, L.; Zeng, F.; Pabst, T.; Chiasson, P.; Chapuis, R. Determination of the Shear Strength of Rockfill from Small-Scale Laboratory Shear Tests: A Critical Review. Adv. Civ. Eng. 2020, 2020, 8890237. [Google Scholar] [CrossRef]
  15. Deiminiat, A.; Li, L.; Zeng, F. Experimental study on the minimum required specimen width to maximum particle size ratio in direct shear tests. CivilEng 2022, 3, 66–84. [Google Scholar] [CrossRef]
  16. ASTM D3080/D3080M-23; Standard Test Method for Direct Shear Test of Soils under Consolidated Drained Conditions. ASTM International: West Conshohocken, PA, USA, 2023.
  17. AS 1289.6.2.2; Soil Strength and Consolidation Tests—Determination of the Shear Strength of a Soil—Direct Shear Test Using a Shear Box. Standards Australia: Sydney, Australia, 1998.
  18. Research Institute of Highway Ministry of Transport. JTG 3430-2020 Test Methods of Soil for Highway Engineering; China Communications Press: Beijing, China, 2020. [Google Scholar]
  19. DL/T 5356-2024; Code for Coarse-Grained Soil Tests for Hydropower and Water Conservancy Engineering. National Development and Reform Commission (NDRC) of the People’s Republic of China, China Electric Power Press: Beijing, China, 2024.
  20. Girumugisha, G.; Ovalle, C.; Ouellet, S. Grading Scalping and Sample Size Effects on Critical Shear Strength of Mine Waste Rock through Laboratory and In-situ Testing. Int. J. Rock Mech. Min. Sci. 2024, 183, 105915. [Google Scholar] [CrossRef]
  21. MotahariTabari, S.A.; Shooshpasha, I. Evaluation of Coarse-Grained Mechanical Properties Using Small Direct Shear Test. Int. J. Geotech. Eng. 2021, 15, 667–679. [Google Scholar] [CrossRef]
  22. Li, S.; Wang, T.; Wang, H.; Jiang, M.; Zhu, J. Experimental Studies of Scale Effect on the Shear Strength of Coarse-Grained Soil. Appl. Sci. 2022, 12, 447. [Google Scholar] [CrossRef]
  23. GB/T 50123-1999; National Standard of the People’s Republic of China. Standard for Geotechnical Test Methods. Ministry of Water Resources of the People’s Republic of China: Bejing, China, 1999.
  24. HG/T 20693-2006; Specification for Field Direct Shear Test of Rock and Soil Mass. National Development and Reform Commission: Beijing, China, 2007.
  25. Guo, W.L.; Zhu, J.G.; Wen, Y.F. Unified Description for Four Grading Scale Methods for Coarse Aggregate. Chin. J. Geotech. Eng. 2016, 38, 1473–1480. (In Chinese) [Google Scholar] [CrossRef]
Figure 1. (a) Location map of Jilangtan; (b) photograph of the Jilangtan platform; (c) photograph of the sampling site.
Applsci 15 05101 g001
Figure 2. (a) Field photos of the test equipment; (b) schematic view of the in situ direct shear test.
Applsci 15 05101 g002
Figure 3. (a) Large-scale laboratory direct shear test apparatus; (b) schematic diagram.
Applsci 15 05101 g003
Figure 4. Diagram of the Equivalent Substitution Method (modified from Guo et al. [25]).
Applsci 15 05101 g004
Figure 5. Diagram of the Similar Gradation Method (modified from Guo et al. [25]).
Applsci 15 05101 g005
Figure 6. Sieved soil sample and gradation curves for different scaling methods.
Applsci 15 05101 g006
Figure 7. Original gradation specimens under different moisture contents.
Applsci 15 05101 g007
Figure 8. Relationship of shear stress and shear displacement under w = 0.91 % .
Applsci 15 05101 g008
Figure 9. Relationship of shear stress and shear displacement under w = 2.45 % .
Applsci 15 05101 g009
Figure 10. Relationship of shear stress and shear displacement under w = 7.66 % .
Applsci 15 05101 g010
Figure 11. Shear stress vs. shear displacement curves from in situ direct shear tests.
Applsci 15 05101 g011
Figure 12. Fitted shear strength parameters for CGS with different gradations under varying moisture contents.
Applsci 15 05101 g012
Table 1. Specifications for d max in Direct Shear Tests according to international standards.
StandardSpecimen WidthSpecimen Thickness Allowed   d max
ASTM D3080 [16]≥50 mm≥13 mmMin{T/6,W/10}
AS 1289.6.2.2 [17]Not specifiedNot specifiedMin{T/8}
JTG 3430—2020 [18]Not specifiedNot specifiedMin{T/4,W/8}
DL/T 5356-2024 [19]≥300 mmNot specifiedMin{W/5}
Table 2. Basic physical properties of the test CGS.
ParameterNatural Moisture Content (%)Natural Density (g/cm3)Dry Density (g/cm3)Void RatioPorosity (%)
Value2.452.222.170.24819.9
Table 3. Direct shear test scheme.
Gradation Type d max (mm)Relative Density Dr (%)Moisture Content (%)Normal Stress (kPa)
Initial gradation60850.91%, 2.45%, 7.66%100, 200, 400, 600
Gradation under ESM30850.91%, 2.45%, 7.66%100, 200, 400, 600
Gradation under GSM30850.91%, 2.45%, 7.66%100, 200, 400, 600
Table 4. Shear strength parameters.
Specimen GradationMaximum Particle Size (mm)Moisture Content (%)Cohesion (kPa)Internal Friction Angle (°)
Initial Gradation600.08%109.2252.43
2.45%125.7146.86
7.66%107.0244.71
ESM Gradation300.08%96.0951.14
2.45%96.1840.93
7.66%81.0039.45
SGM Gradation300.08%70.0951.58
2.45%80.6638.94
7.66%71.5336.39
Disclaimer/Publisher’s Note: The statements, opinions and data contained in all publications are solely those of the individual author(s) and contributor(s) and not of MDPI and/or the editor(s). MDPI and/or the editor(s) disclaim responsibility for any injury to people or property resulting from any ideas, methods, instructions or products referred to in the content.

