1. Introduction
Canine Hip Dysplasia (CHD) is a hereditary orthopedic disorder that predominantly affects large and rapidly growing dog breeds. It is characterized by abnormal development of the hip joint, resulting in laxity (looseness) of the joint, where the femoral head (the rounded top part of the thigh bone) does not fit securely within the acetabulum (hip socket), leading to instability [
1]. Over time, this instability promotes abnormal joint wear, which often progresses to degenerative joint disease (DJD), commonly known as osteoarthritis, a condition where the joint becomes inflamed, painful, and stiff due to the breakdown of cartilage and the development of bone spurs. In milder cases, instability causes subluxation (partial dislocation of the femoral head from the acetabulum), while in more severe cases, it can progress to luxation (complete dislocation) [
1]. The development of CHD is influenced by a complex interaction of genetic predisposition and environmental factors, such as diet and exercise. Radiographic imaging remains the cornerstone of CHD diagnosis, with the ventrodorsal hip-extended (VDHE) view serving as the standard imaging technique for evaluating hip joint conformation, in which the dog lies on its back with its hind legs stretched out to provide a clear view of the hip joints. This approach is vital for guiding clinical management and informing breeding practices to reduce CHD prevalence [
1].
The screening process for CHD follows standardized radiographic scoring systems developed by major international organizations such as the Fédération Cynologique Internationale (FCI), British Veterinary Association/Kennel Club (BVA/KC), and Orthopedic Foundation for Animals (OFA). The FCI classifies hips into five grades (A–E) and has historically relied on the Norberg Angle (NA) to assess joint subluxation and acetabular morphology. The BVA/KC system evaluates multiple morphological parameters, incorporating the NA, subluxation, and DJD criteria. In contrast, the OFA applies a categorical grading based on hip joint congruency without numerical scoring [
1,
2]. Building upon these methodologies, Mark Flückiger introduced a refined scoring system in 1993 to enhance CHD assessment objectivity while aligning with FCI standards. This system incorporated six radiographic parameters, prominently including the NA and the position of the femoral head center relative to the dorsal acetabular edge (FHC/DAE), alongside signs of DJD, to provide a holistic view of hip joint health [
3,
4].
The NA has traditionally been used as a key metric for CHD scoring according to FCI criteria, assessing the angular positioning of the femoral head relative to the acetabulum, thereby reflecting the extent of subluxation and acetabular depth [
5]. An NA of ≥105° is typically viewed as indicative of sufficient hip joint integrity, implying a lower risk of developing DJD. However, studies have revealed limitations in using the NA alone to predict DJD susceptibility [
6,
7,
8]. Culp et al. demonstrated that an NA of ≥105° may fail to identify dogs at risk for DJD, as it can overlook joint laxity, a critical risk factor that becomes apparent only under stress or outside the standard VDHE radiographic view [
6]. Consequently, some dogs with an NA ≥ 105° may have underlying hip laxity, predisposing them to diagnostic inaccuracies and resulting in false negatives, allowing dysplastic genes to persist in breeding populations. Additionally, NA thresholds can vary by breed; for instance, Australian Shepherds and Borzois may exhibit NA values < 105° due to unique pelvic structures rather than true joint laxity [
6,
9,
10].
Further complicating the issue, studies have demonstrated significant variability in inter-rater agreement for NA measurements. Verhoeven et al. observed an average inter-rater agreement rate of 72% when distinguishing between “normal” and “dysplastic” hips using the NA [
11]. Similarly, Geissbühler et al. reported a poor-to-fair level of agreement, with an intraclass correlation coefficient (ICC) of 0.47 and a Cohen’s kappa value of 0.29, indicating substantial inconsistency among examiners [
12]. The inherent variability observed in these findings, likely stemming from the high level of technical proficiency required for precise NA measurement, including ambiguities in defining the effective craniolateral acetabular rim (CrAR) [
12,
13], highlights why the NA should not serve as the primary or most heavily weighted metric within CHD scoring protocols.
The FHC/DAE distance directly evaluates the horizontal positioning of the femoral head relative to the edge of the acetabulum, indicating whether the femoral head is sufficiently covered by the acetabulum or if it is positioned outward [
4], which would signal joint laxity and potential instability. Even though it seems to share functional overlap with the NA, this redundancy can help address the limitations of the NA, especially in cases where it may not detect dogs at risk for DJD. While it may not have the same widespread recognition as the NA, Skurková et al. showed that excluding FHC/DAE from the Flückiger system resulted in a 21.24% increase in false negatives, indicating that more cases of CHD were under-diagnosed when FHC/DAE was omitted. By contrast, omitting NA increased false negatives by only 11.06%, underscoring the critical role of FHC/DAE in capturing lateral femoral head displacement, which NA alone might overlook. Furthermore, the study found that concordance with the original Flückiger system was higher when NA was omitted (84.96%) compared to FHC/DAE (78.32%) [
7]. This suggests that FHC/DAE provides unique insights into hip joint conformation, adding specificity to CHD diagnosis that NA cannot fully replace.
Advances in technology have enabled the development of computer-aided detection (CAD) systems for medical imaging, significantly enhancing diagnostic precision [
14]. While early CAD systems often struggled with low precision, deep learning (DL) algorithms have demonstrated remarkable improvements, achieving near-human performance in many imaging tasks [
14]. This progress has spurred interest in using DL techniques to address diagnostic challenges in veterinary medicine. McEvoy et al. initially utilized a partial least squares discriminant analysis model and a nonlinear neural network to classify VDHE radiographs as either “hip” or “not hip”, resulting in classification errors of 6.7% and 8.9%, respectively [
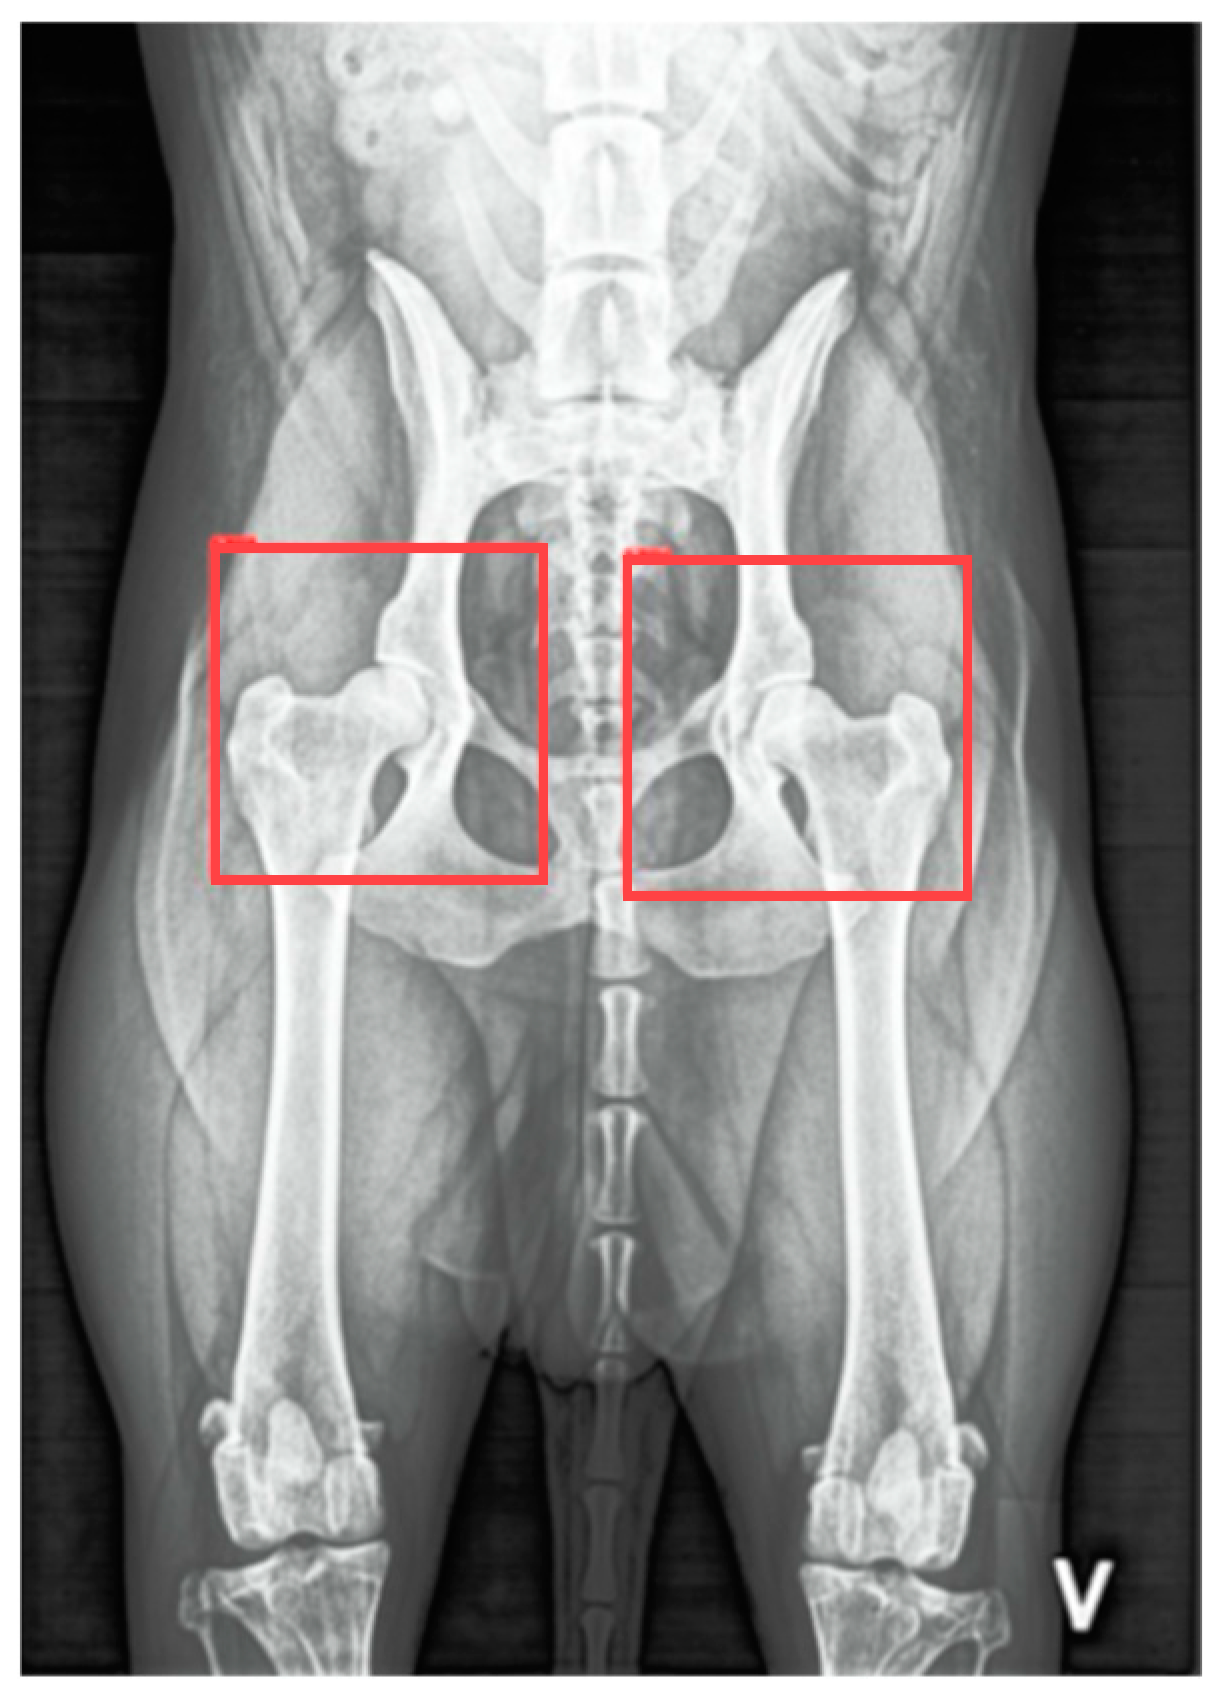
15]. Building upon this foundation, they later developed a two-step method using a YoloV3 Tiny, a convolutional neural network (CNN), to detect and isolate regions of interest for each hip joint, achieving an intersection over union (IoU) score of 0.85, indicating strong agreement with ground truth data. In the second step, another YoloV3 Tiny CNN was trained for binary classification of CHD (i.e., distinguishing healthy from dysplastic hips). Despite reducing computational complexity by focusing on the regions of interest, this approach achieved a sensitivity of only 53% for identifying dysplastic cases. Subsequently, they applied a YoloV3 Tiny CNN to detect and categorize hip joints using FCI criteria, achieving a sensitivity of 53% and a specificity of 92% [
16]. Similarly, Gomes et al. applied a pre-trained Inception-V3 model for binary classification, attaining 83% sensitivity for dysplastic cases but encountering specificity challenges, with a rate of 66% due to false positives [
17]. Wang et al. used a DL model known as EfficientNet to classify CHD in radiographic images, achieving an area under the receiver operating characteristic curve (AUC) of 0.964 and 89.1% accuracy in binary classification, and an AUC of 0.913 for FCI grading [
18]. Conversely, Akula et al. explored a different approach, utilizing a 3D CNN trained on magnetic resonance imaging scans, attaining 89.7% accuracy in binary classification and highlighting the potential of volumetric analysis for comprehensive CHD assessment [
19]. While convolutional layers are well suited for extracting visual features from images and fully connected layers typically handle the final classification task, the “black-box” nature of these models complicates interpretation and validation of predictions, potentially undermining clinical trust and reliability [
20]. Therefore, there is a pressing need for more interpretable approaches that clarify model reasoning and enhance prediction transparency. In our view, incorporating objective numeric feature analysis into CHD scoring systems is crucial for precise and reliable assessment of hip joint conformation.
Recent research has focused on applying DL systems to precisely measure key objective metrics such as the Hip Congruency Index (HCI) [
21,
22] and Femoral Neck Thickness Index (FNTi) [
23,
24], both valuable for assessing hip joint health. A multidisciplinary team developed a DL-based approach using transfer learning to segment and delineate the femoral head and acetabulum from VDHE images, enabling accurate HCI calculations to quantify how well the femoral head fits within the acetabulum. Built on a U-Net architecture with EfficientNet modules, the model achieved high segmentation accuracy, with Dice scores (DS) of 0.98 for the femur and 0.93 for the acetabulum. This strong performance closely matched manual expert evaluations, demonstrating potential to reduce subjectivity and improve consistency in CHD assessments [
22]. Building on this framework, researchers applied DL to measure the FNTi, an indicator of biomechanical stress and adaptation in dysplastic hips. The system combined a YOLOv4 network for joint detection with a ResNetv2 backbone for anatomical landmark prediction. Integrated with the segmentation framework used for HCI, this approach enabled precise extraction of femur border coordinates and femoral head circumferences to compute the FNTi, achieving an IoU score of 0.96 [
24]. The resulting index showed a significant correlation with CHD severity according to FCI grading [
23], and automated FNTi measurements demonstrated strong agreement with expert manual evaluations, with an ICC of 0.88, underscoring its reliability [
23,
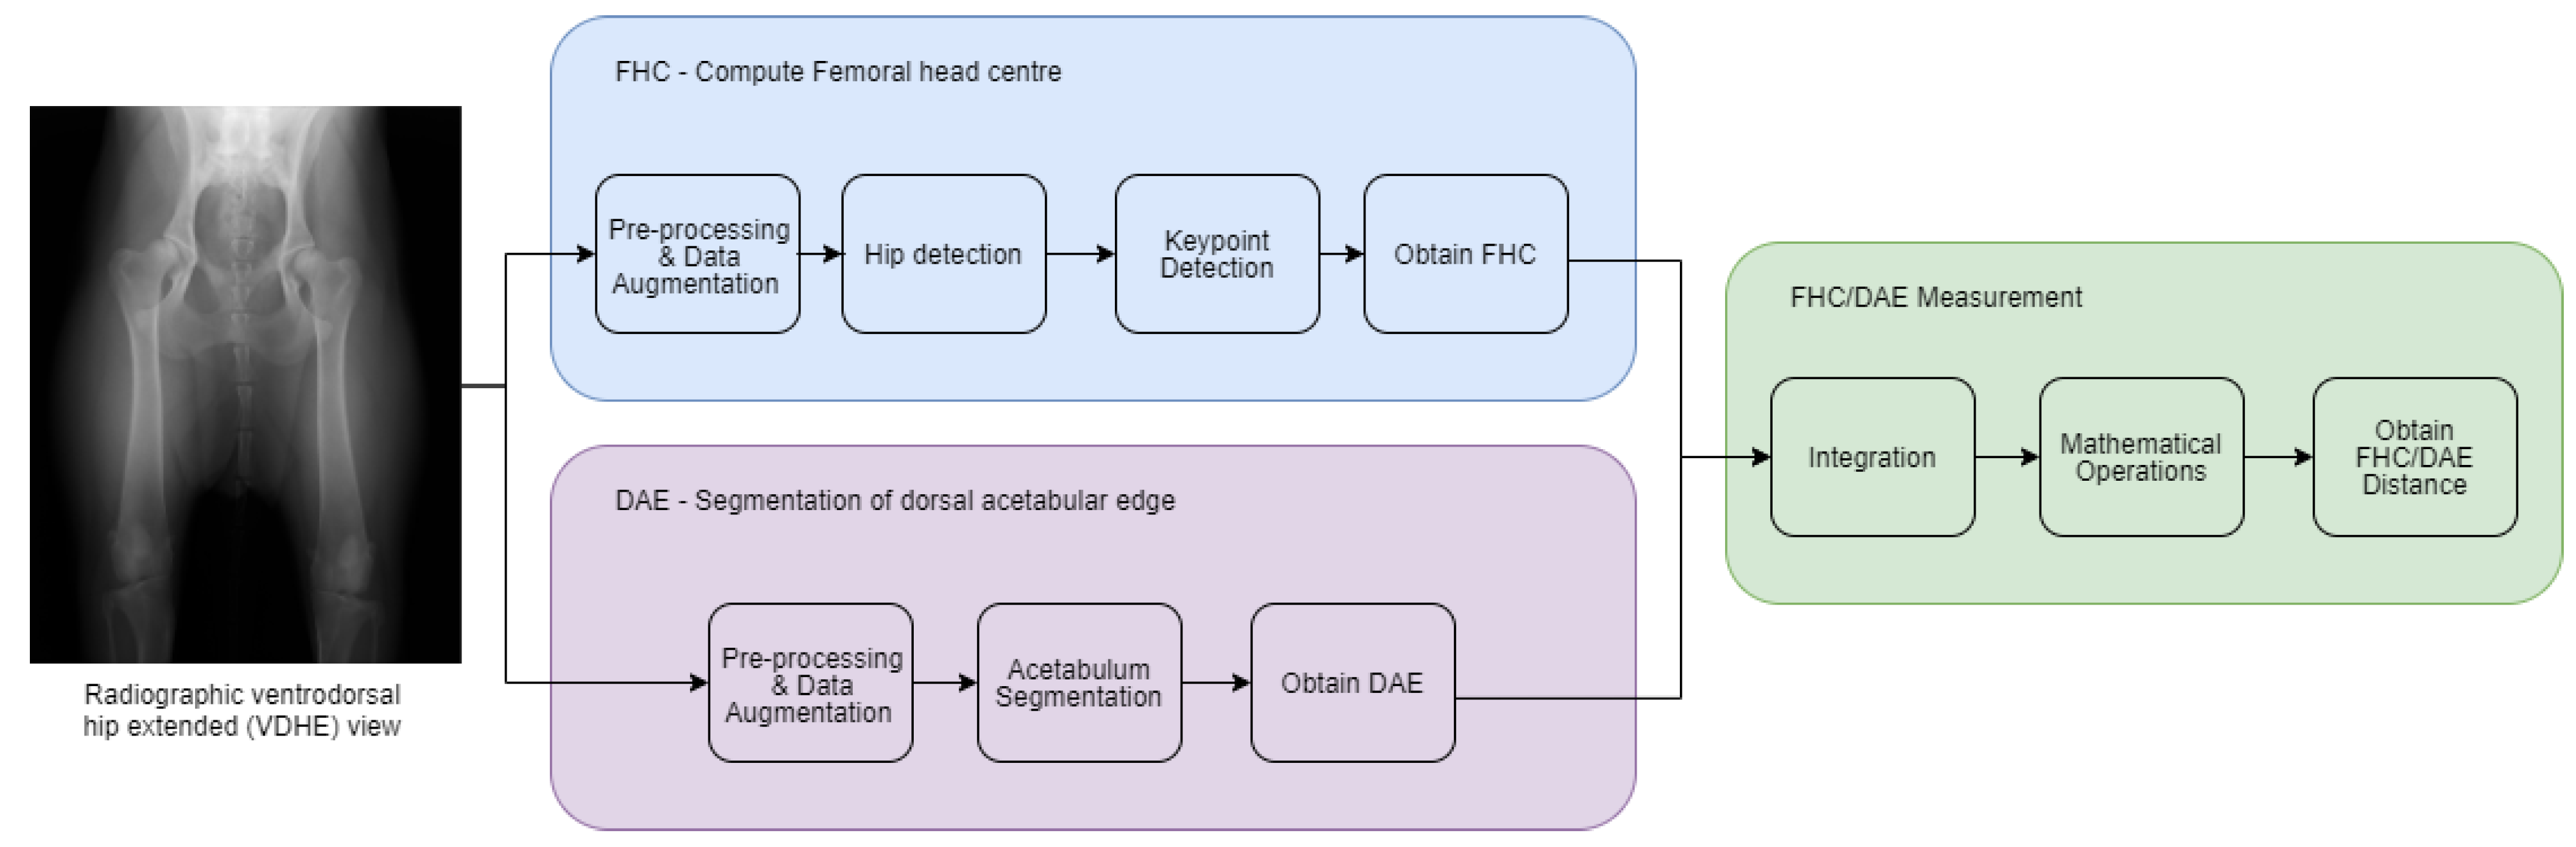
24]. Together, these automated systems for HCI and FNTi highlight the transformative potential of DL-driven approaches to enhance objectivity, reliability, and transparency in CHD screening, paving the way for more precise and reliable assessments within veterinary orthopedics. As another step in this direction, this study introduces a system for automated measurement of the FHC/DAE distance. Unlike previous AI models focused on direct CHD classification, this approach emphasizes transparency by providing a quantifiable feature to support multimetric CHD radiographic assessment.
The primary objectives of this study were to develop the FHC/DAE system and evaluate its agreement and reliability with experienced examiners (P.F-G. and M.G.) to validate its clinical applicability. Our null hypothesis is that there is no agreement beyond chance in the FHC/DAE classifications made by the two examiners and between the examiners and the automated system.
4. Discussion
The development of an automated system for FHC/DAE measurement represents a significant step toward improving the objectivity and reliability of CHD assessments. This study evaluated the system’s agreement with expert human examiners to determine its clinical applicability, ensuring that automated classifications align with established methodologies. The results demonstrated strong inter-rater agreement and reliability between the two human examiners (E1 and E2), as well as high concordance between the system and E1, who served as the reference standard. These findings allow us to reject the null hypothesis, which stated that there is no agreement beyond chance in the FHC/DAE classifications made by the two examiners and between the examiners and the automated system. Additionally, the system exhibited consistent performance across both frequent and less common classification categories, supporting its potential as a robust tool to assist in CHD scoring. However, some classification tendencies were noted, particularly a slight shift toward less severe categories, which may have implications for clinical decision-making. The system also demonstrated strong performance, with precise keypoint detection by the FHC model and accurate acetabular segmentation by the DAE model. The following discussion explores the key findings in depth, addressing the strengths and limitations of our automated FHC/DAE measurement system.
Beyond automation, the reliability of CHD assessment is ultimately limited by the diagnostic metrics that define it. While the NA has been a longstanding reference, its methodological limitations and susceptibility to anatomical variability challenge its role as a universal standard [
6,
9]. These concerns warrant a closer examination of complementary approaches, particularly the FHC/DAE metric, which offers distinct advantages.
A primary limitation of the NA is its dependence on acetabular morphology, which varies considerably across breeds. Studies have shown that using a universal NA cutoff of ≥105° leads to inconsistencies and a high rate of false positives, potentially excluding genetically valuable dogs from breeding populations [
6,
9]. Tomlinson et al. highlighted that the prominence of the CrAR directly influences the NA, with more pronounced rims leading to larger angles [
9]. Conversely, structural irregularities such as CrAR notching, characterized by indentations along the rim that disrupt its continuity, steepen the cranial curvature, and result in a flattened appearance, can lower the NA [
2,
9]. Additionally, osteophyte formation, which refers to localized new bone formation, on the cranial aspect of the acetabular margin can create the appearance of a double rim in the VDHE view, making the CrAR more difficult to identify [
34,
35]. Furthermore, variations in acetabular depth contribute to breed-dependent differences [
9], introducing additional inconsistencies.
Both the NA and the FHC/DAE metrics require precise definition of the femoral head and its center. However, they differ in the other anatomical landmarks upon which they rely. While the NA depends on the CrAR, the FHC/DAE is determined by the DAE. In this context, we believe that the FHC/DAE metric offers distinct practical advantages. The DAE, representing the outermost part of the acetabulum where the femoral head’s articulation terminates dorsally, is a more geometrically consistent landmark compared to the CrAR. The DAE’s greater length and continuity make it easier to identify radiographically, even in cases of moderate DJD. The DAE remains visible along most of its length, even though it appears dorsal to the femoral neck in the VDHE view, becoming difficult to define only in extreme cases of significant abnormal bone growth on the femoral head, femoral neck, or acetabulum, or in cases of severe joint deformation [
34,
35]. This robustness makes the DAE a more practical and reliable reference point for assessing femoral head coverage, particularly in the scope of DL models that rely on precise pixel-level detection to define anatomical structures through semantic segmentation.
Beyond the inherent anatomical variability of the NA, additional inconsistencies result from its categorization within the FCI and Flückiger’s CHD scoring protocols. The classification relies on predefined NA thresholds, but overlapping criteria, such as cases where an NA of 105° or greater is classified differently depending on slight variations in joint space [
3], introduce ambiguity. This lack of strict boundary distinctions, combined with subjective interpretation of anatomical features, can lead to misclassification, particularly in borderline cases. In contrast, the FHC/DAE metric offers a clear advantage by providing well-defined category boundaries, minimizing overlap and improving classification clarity.
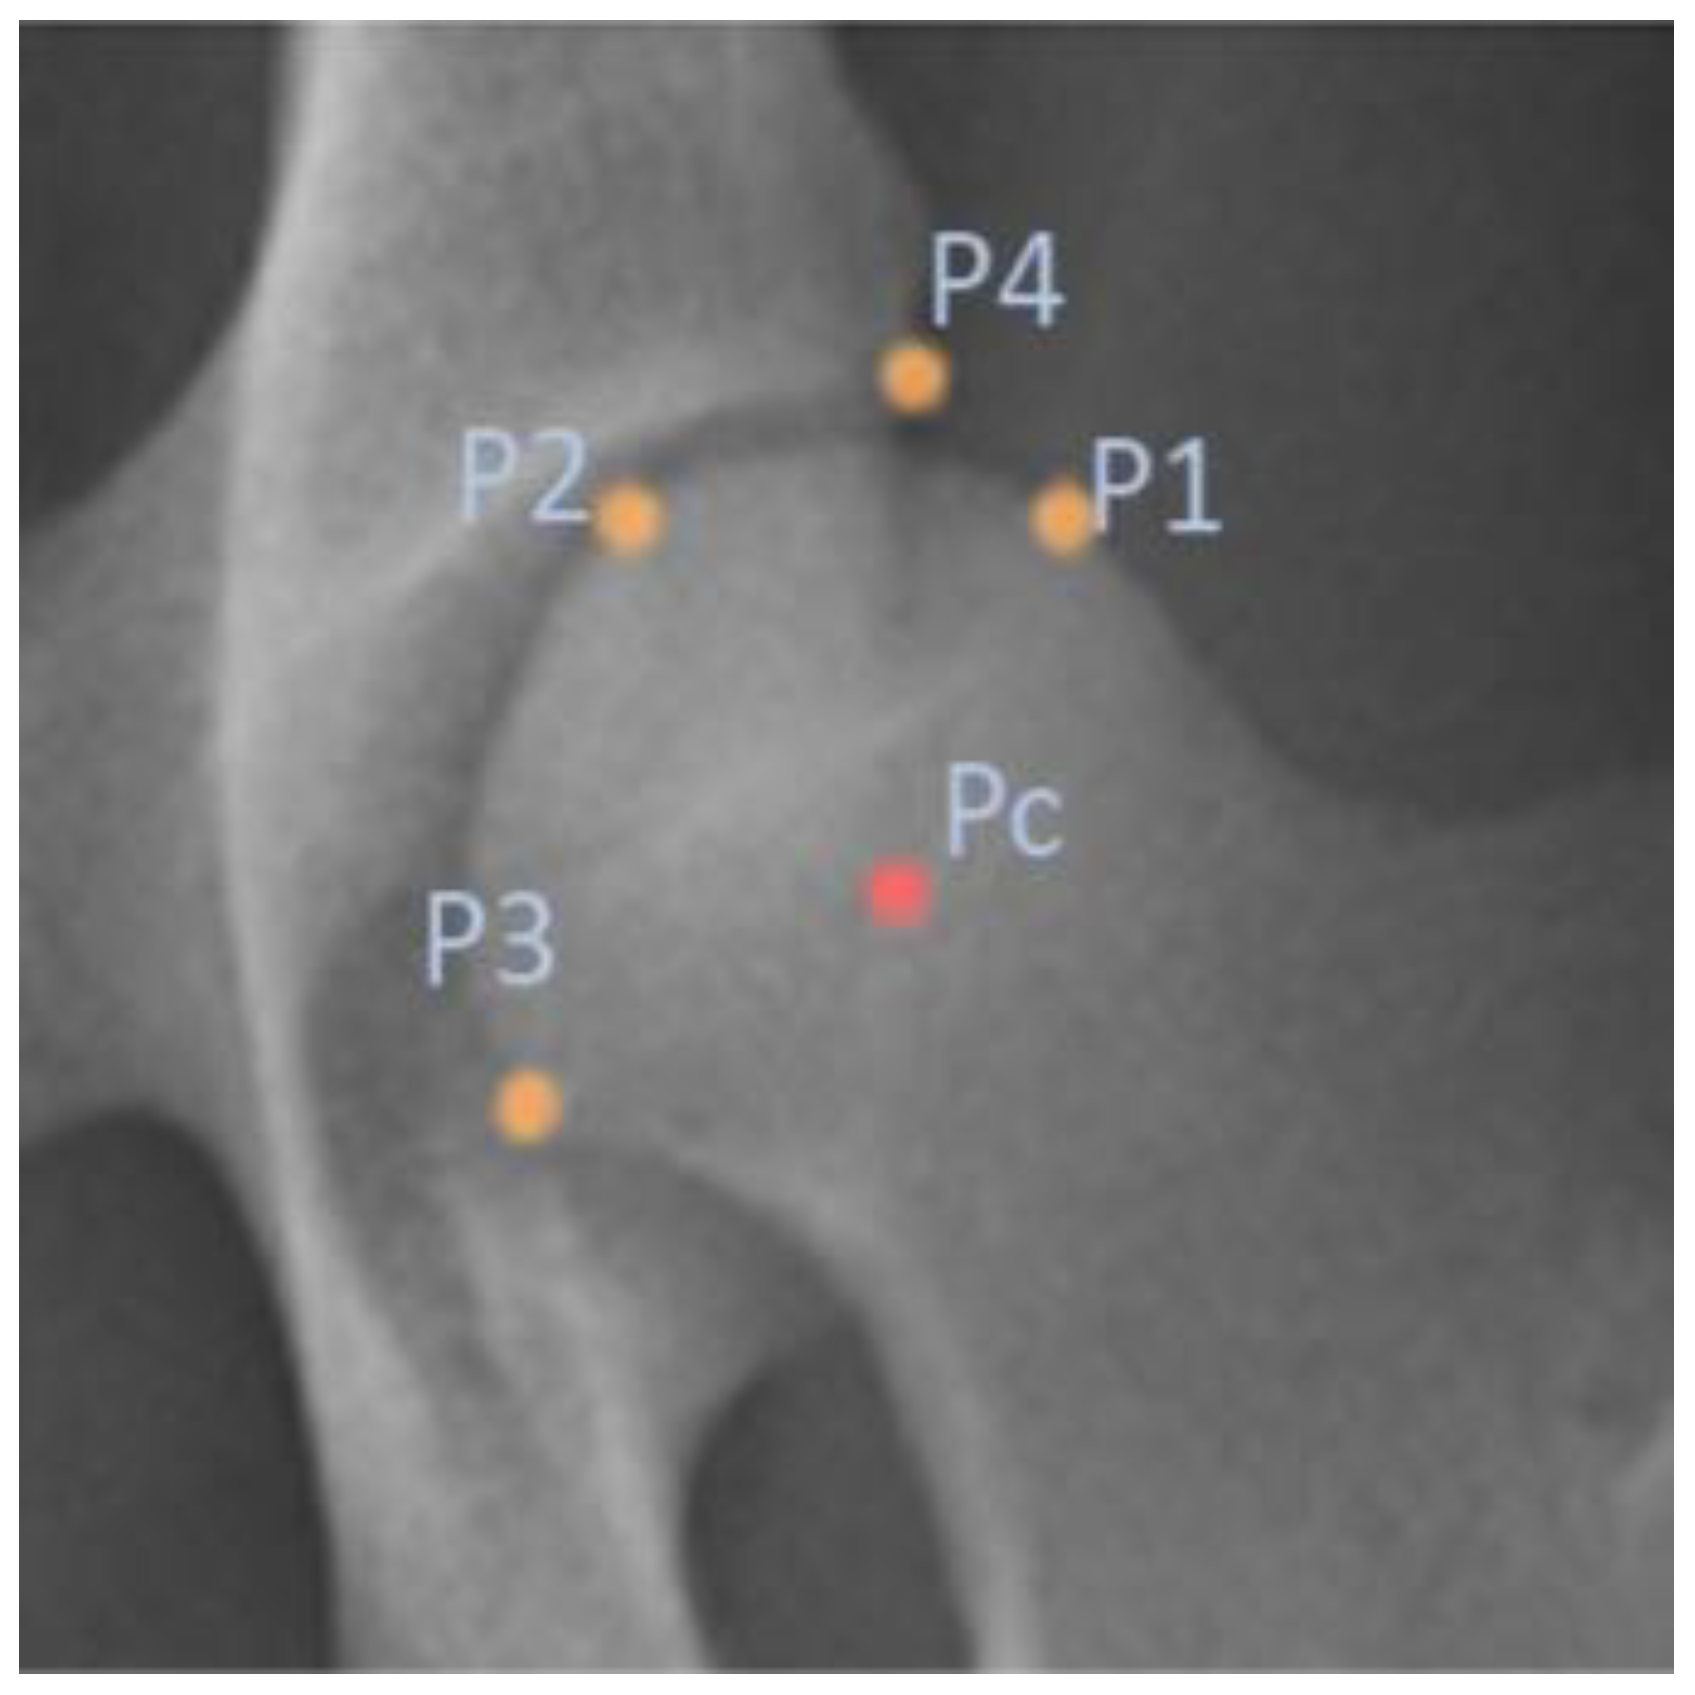
Accurate localization of anatomical landmarks on the femoral head is crucial for the automated FHC/DAE measurement system, as the precision of the FHC depends on the exact placement of the predicted keypoints. The results indicate that the FHC detection model achieved highly precise localization, with evaluation metrics such as ED, MAE, and MSE confirming minimal deviations from ground truth annotations.
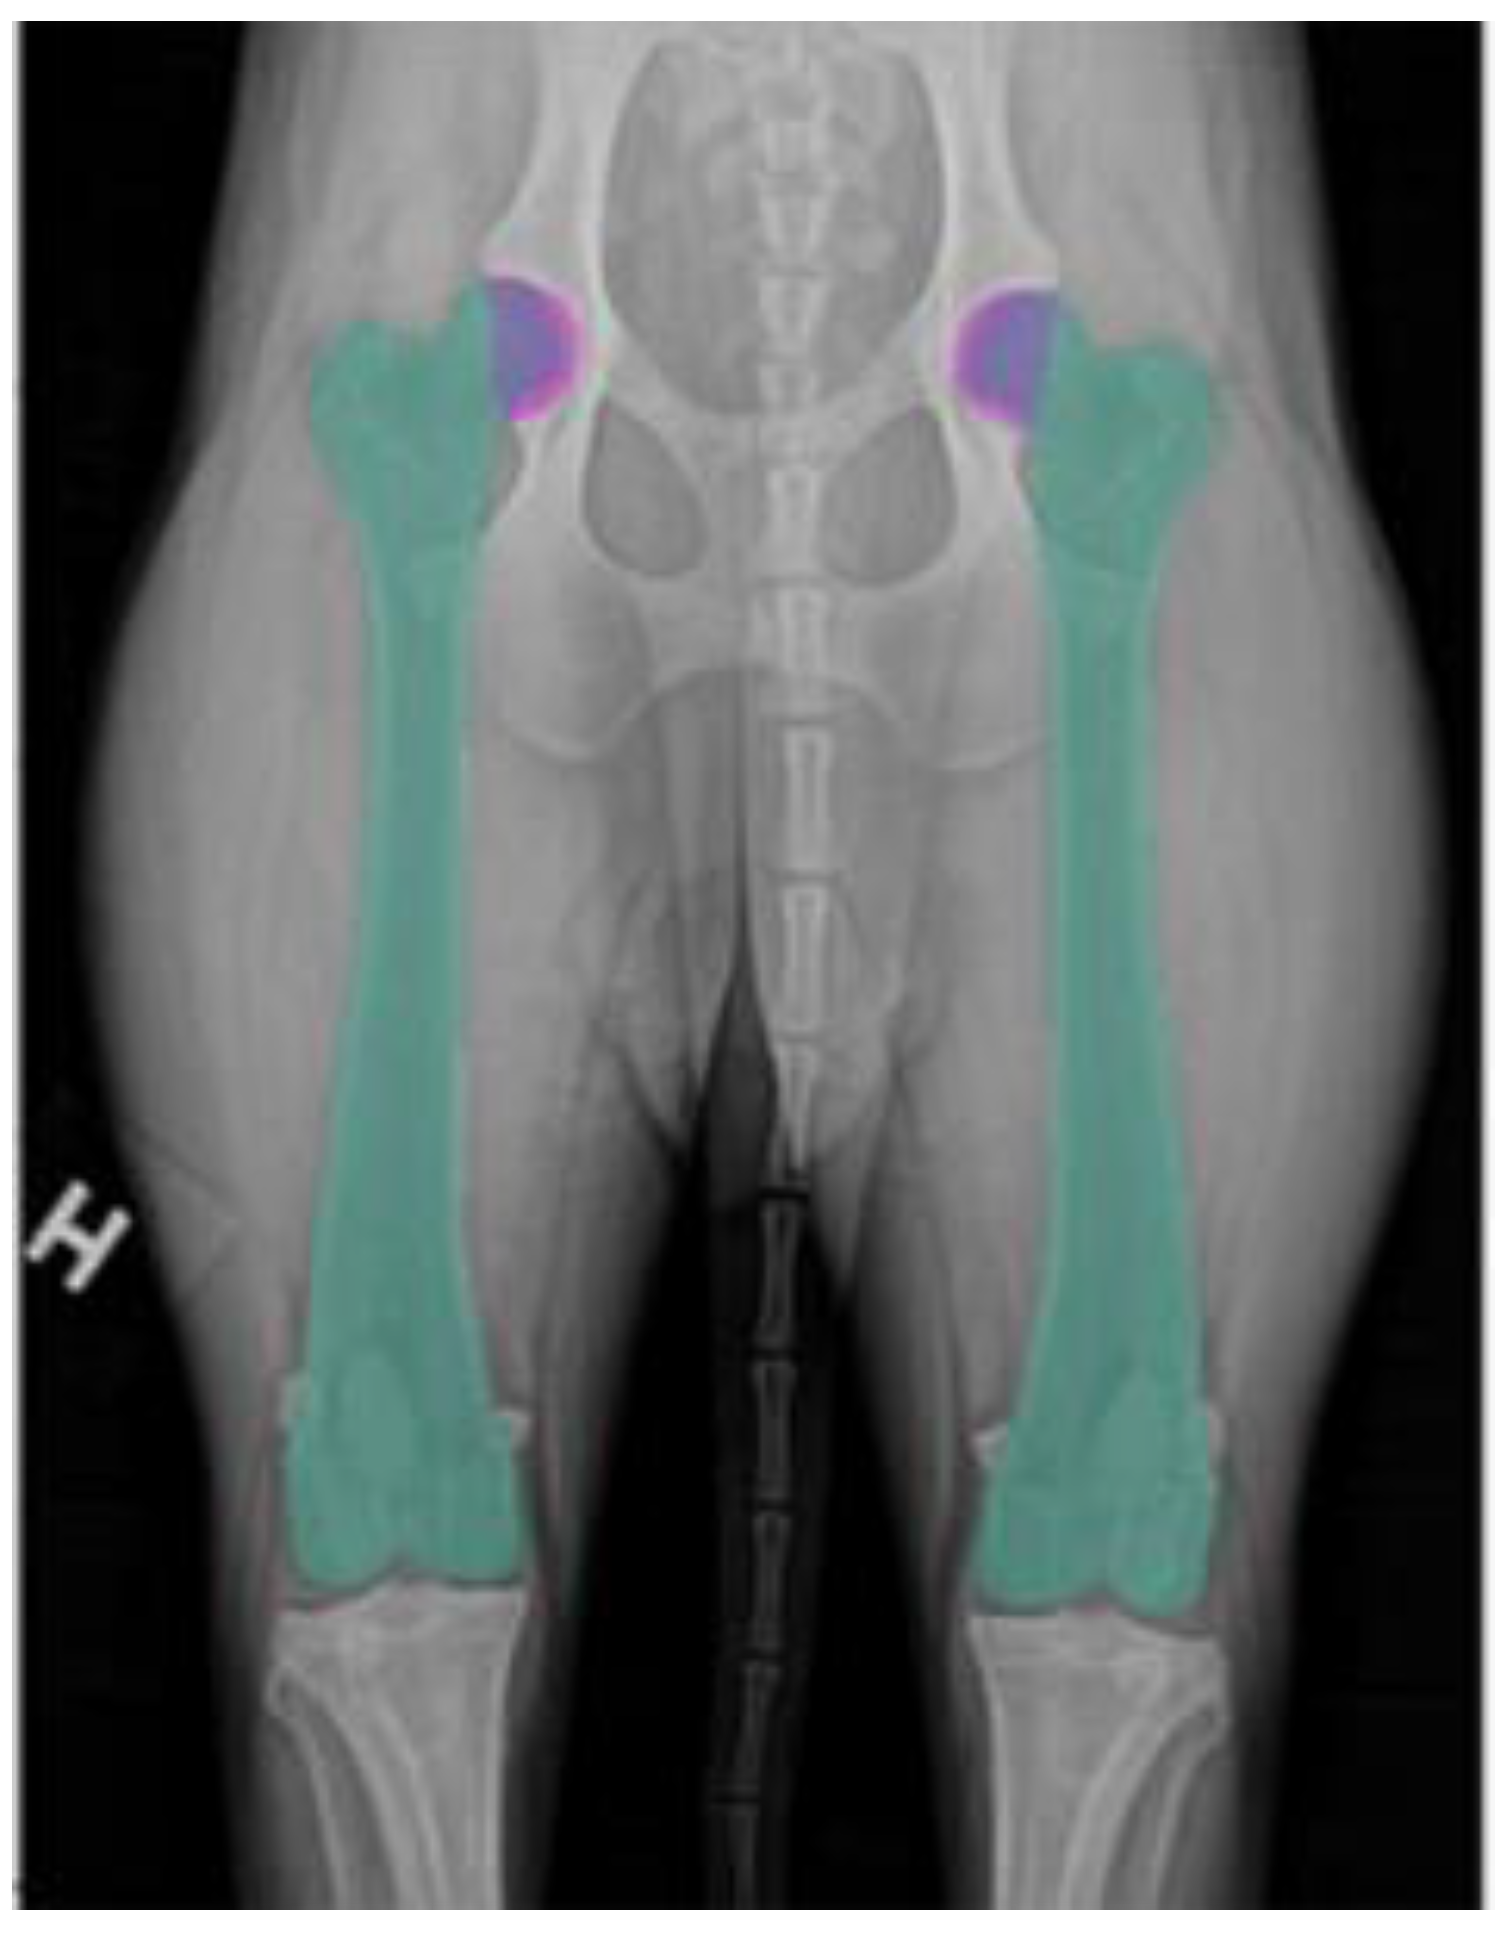
In medical imaging, segmentation plays a fundamental role in accurately delineating anatomical structures, facilitating precise identification and isolation of regions critical for measurement [
36]. In this study, the DAE segmentation model demonstrated strong performance in acetabulum delineation, ensuring accurate identification of the DAE for FHC/DAE measurement calculations. The DS and IoU scores further validated the segmentation process, confirming a high degree of overlap with expert-annotated ground truth masks.
Compared to our previous acetabulum segmentation models, the current model demonstrated improved performance, benefiting from a significantly larger training dataset. In earlier studies [
22,
24], a DS of 0.93 and an IoU of 0.88 were achieved using a training set of only 138 images. By contrast, the current model, trained on 624 images, achieved a DS of 0.96 and an IoU of 0.92, reflecting a notable improvement in segmentation accuracy.
Beyond our prior work, this model also outperformed other AI-based radiographic segmentation models, such as those developed by Rouzrokh et al. for measuring acetabular component angles in total hip arthroplasty in humans. Their system, which focused on surgical outcomes and implant positioning, reported a DS of 0.90 for acetabular component segmentation in their anteversion angle model, the highest among their tested models [
37]. The superior segmentation accuracy of our model highlights its potential to enhance diagnostic precision and streamline workflows, not only in veterinary medicine but possibly in future applications for human medicine.
In addition to its overall performance, the automated FHC/DAE system offers a substantial advantage in processing time. On a workstation equipped with an NVIDIA RTX 3090 GPU with 24 GB of VRAM, the average processing time per radiograph was 264.8 milliseconds for segmentation and 99.2 milliseconds for keypoint detection, allowing the system to generate FHC/DAE measurements for both hip joints in under 0.5 s. Although performance may vary with different hardware configurations, the system remains significantly faster than manual assessment. In comparison, an experienced examiner typically requires between 1 and 1.5 min per radiograph using Dys4Vet’s manual annotation tools, depending on image quality and complexity. By dramatically reducing annotation time, the automated system improves workflow efficiency and offers clear practical benefits for clinical use, particularly in large-scale screening scenarios or research environments.
To validate the FHC/DAE system, its classifications and measurements were compared with expert examiners and their agreement with each other. Agreement between E1 and E2 was almost perfect (κ = 0.90 (95% CI [0.84, 0.95], p < 0.001). The contingency table shows that 80.7% of classifications fell within in the “Superimposed” (67 cases) and “Lateral” (46 cases) categories. Although this distribution could suggest that the high observed agreement (P0) of 90% is influenced by prevalence, the weighted kappa value and narrow confidence interval confirm that agreement extends beyond chance. Importantly, disagreements were minimal (14 cases) and primarily confined to adjacent categories such as “Superimposed” versus “Lateral”, which are less penalized in the linear weighting scheme. Clinically significant categories such as “Lateral+” (10 out of 11 agreements) and “Luxation” (1 out of 1 agreement) also demonstrated strong concordance. For continuous FHC/DAE measurements, inter-rater reliability between E1 and E2 was excellent (ICC = 0.97, 95% CI [0.96, 0.98], p < 0.001), with a SEM of 0.91 mm, indicating that approximately 68% of E2’s measurements would fall within ±0.91 mm of E1’s, reinforcing the precision and consistency of the measurements.
Agreement between E1 and the system was almost perfect (κ = 0.86 95% CI [0.80, 0.92],
p < 0.001). The contingency table shows that 72.1% of classifications fell within the “Superimposed” (62 cases) and “Lateral” (39 cases) categories. Although this distribution reflects a common pattern in the dataset, it does not appear to overly inflate the kappa value, as demonstrated by the narrow confidence interval [
28]. Importantly, disagreements were minimal (18 cases) and primarily confined to adjacent categories, limiting their clinical impact. Clinically significant categories such as “Lateral+” (9 out of 11 agreements) and “Luxation” (1 out of 1 agreement) also demonstrated strong concordance, supporting the system’s ability to replicate E1’s classifications across both frequent and less common categories, thus reinforcing its clinical applicability. For continuous FHC/DAE measurements, inter-rater reliability between E1 and the system was excellent (ICC = 0.97, 95% CI [0.95, 0.98],
p < 0.001), with an SEM of 0.92 mm, indicating that approximately 68% of the system’s measurements would fall within ±0.92 mm of E1’s. Given that categories such as “Lateral” (−5 to <−1 mm) and “Lateral+” (−10 to −6 mm) each have a 4 mm range, this small error margin remains well within acceptable limits, reducing the likelihood of clinically significant misclassifications and supporting the system’s ability to replicate expert assessments with minimal variability.
The comparison between E2 and the system showed substantial agreement (κ = 0.79, 95% CI [0.72, 0.86], p < 0.001), with an observed agreement (Po) of 80%. Although this was slightly lower than the agreement observed with E1, it aligns with the study design, as E1 provided the ground truths used to train the system. This likely shaped the system’s classification tendencies to align more closely with E1’s methodology for the FHC/DAE metric. The contingency table shows that most classifications were again concentrated in the “Superimposed” (56 cases) and “Lateral” (37 cases) categories, which together accounted for 66.4% of the observations. Disagreements were more frequent than in the E1 comparison (25 cases).
Notably, the contingency tables, along with the mean ± standard deviation values of continuous FHC/DAE measurements, indicate that the system tends to assign slightly less severe classifications than both E1 and E2. The mean ± standard deviation was −1.32 ± 2.70 mm for E1, −1.53 ± 2.70 mm for E2, and −1.12 ± 2.59 mm for the system, reflecting a modest upward shift. This trend was more apparent in the comparison with E2, where some cases classified as “Lateral+” by E2 were assigned to “Lateral” by the system, and cases classified as “Lateral” were occasionally assigned to “Superimposed”. Although these discrepancies were mostly limited to adjacent categories, which generally carry limited clinical consequence, the system’s slightly conservative bias could increase the risk of false negatives in screening contexts. In particular, misclassifications near the boundary between “Superimposed” and “Lateral”, which likely represents the division between normal and dysplastic hips, may result in early CHD cases being overlooked. Despite this trend, the system maintained strong agreement in less frequent but clinically important categories, with 8 out of 12 agreements for “Lateral+” and full agreement for the single “Luxation” case.
For continuous FHC/DAE measurements, inter-rater reliability between E2 and the system was excellent (ICC = 0.93, 95% CI [0.88, 0.96], p < 0.001), with an SEM of 1.34 mm, indicating that approximately 68% of the system’s measurements would fall within ±1.34 mm of E2’s. Although this SEM is higher than that observed in the E1 comparison, it remains acceptable for most categories. However, in narrower thresholds such as “Superimposed” (−1 to <1 mm), which spans 2 mm, and “Medial” (1 to ≤2 mm), which spans just 1 mm, this level of variability could affect classifications in borderline cases.
The inclusion of a second examiner in this study helped evaluate the system’s consistency with expert methodologies, ensuring conformity with established FHC/DAE classification standards. While E1’s involvement in training the system understandably led to closer agreement between E1 and the system, the high agreement and reliability observed between E1 and E2 reflect consistent judgment among experienced examiners. This strong inter-rater reliability ensures that the methodologies of both examiners can be used interchangeably for FHC/DAE assessments, providing confidence that their ratings are robust and unbiased [
27]. Furthermore, this consistency strengthens the validity of the system’s classifications, as its performance aligns with experts whose methodologies are both reliable and consistent. Even when the system’s classifications diverge slightly, particularly from those of E2, the robust examiner agreement supports the system’s broader applicability.
However, it is important to note that the FHC/DAE system is not intended to function as a standalone diagnostic tool for assessing CHD. While it addresses some limitations of NA-centric scoring, it also shares certain biomechanical constraints. Like the NA, its accuracy may be affected by artificial tightening of the joint capsule in the VDHE position, which can mask subluxation and potentially lead to underestimation of CHD severity. Therefore, although FHC/DAE offers objective spatial information on the femoral head’s position relative to the acetabulum, it should be interpreted alongside complementary metrics to provide a more complete picture of hip joint integrity. This integrated approach ensures a more thorough and reliable evaluation of CHD, reducing the potential impact of variability of any single metric. Looking ahead, the development of comprehensive AI-assisted diagnostic platforms that integrate multiple automated metrics may further enhance the objectivity, reproducibility, and clinical utility of CHD radiographic evaluation. The Dys4Vet software, currently under development, is one such initiative that aims to consolidate interpretable metrics, including the FHC/DAE measurement, into a unified framework for decision support. In this context, the FHC/DAE system serves as a foundational component, contributing precise and standardized data to a broader diagnostic strategy.
Importantly, these technologies are not intended to replace expert clinical judgment. While AI can assist by offering consistent and quantifiable assessments, it does not replicate the contextual understanding, ethical reasoning, or empathetic engagement that are central to veterinary practice. Sensitivity to animal behavior, nuanced clinical interpretation, and compassionate care remain uniquely human competencies. As such, platforms like the Dys4Vet software should be viewed as tools to support and inform veterinary decision-making, not substitutes for professional expertise.
A key strength of this study is the diversity of the dataset, which includes dogs from two distinct geographical regions, Portugal and Denmark. While the specific breeds of all dogs used in model development were not fully available due to metadata limitations, the inclusion of animals from different regions inherently introduces breed variation. Additionally, the test set, for which breed data were available, consisted of a diverse range of breeds, further supporting the system’s ability to generalize. Furthermore, the use of different X-ray equipment introduced natural variations in image quality and anatomical presentation, enhancing the robustness of the automated system. This variability reduces the risk of overfitting to specific acquisition parameters and reinforces its applicability across different clinical settings and animal populations. However, since breed-specific biases could not be fully assessed for the training set, further studies with fully annotated breed metadata would be beneficial for a more comprehensive evaluation of potential breed-related effects.
A key limitation of this study is that the system does not account for uncertainty in its classifications, leading it to provide definitive predictions even in cases where its confidence is low. This was particularly evident in the slight divergence observed between E2 and the system, which highlights the potential for variability in classifications, especially in borderline cases. While overall agreement remained strong, this discrepancy suggests that the model may struggle with ambiguous cases where even expert judgment varies, introducing potential inconsistencies in classification. These discrepancies appear to be more closely associated with technical image quality, such as poor contrast, blurred anatomical edges, or low image resolution. It is worth noting that the model was trained on resized, lower-resolution images, and the resulting predictions were subsequently upscaled to the original resolution. Although a smoothing filter was applied after prediction, this process may still lead to some inaccuracies. On the other hand, the FHC/DAE system demonstrated consistent performance across mild-to-severe CHD cases, suggesting that inaccuracies are not strongly influenced by disease-related anatomical variation. Without a mechanism to assess and indicate uncertainty, the system may misclassify difficult cases instead of flagging them for expert review. To address this, future improvements could incorporate uncertainty quantification methods, allowing the system to assess its confidence in each classification. By flagging low confidence cases for expert evaluation instead of making definitive predictions in uncertain situations, the system could improve reliability and reduce misclassification rates [
38]. Additionally, implementing confidence-aware training strategies, where the model is trained to recognize and adapt to uncertain cases, could enhance its ability to handle borderline scenarios more effectively, further refining its classification performance [
39].


 ,
, 


