Article

Multi-Source Information Fusion Diagnosis Method for Aero Engine

1
AECC Commercial Aircraft Engine Co., Ltd., Shanghai 200241, China
2
School of Mechanical Engineering, Shanghai Jiao Tong University, Shanghai 200240, China
*
Author to whom correspondence should be addressed.
Appl. Sci. 2025, 15(9), 5083; https://doi.org/10.3390/app15095083
Submission received: 16 February 2025 / Revised: 27 April 2025 / Accepted: 30 April 2025 / Published: 2 May 2025

Abstract

:
Aero engines are complex coupled systems in which faults in one subsystem can propagate and affect the performance of others. Relying on single-source performance parameters is often insufficient for accurately assessing component degradation. Although multi-source fusion diagnosis methods, such as those based on Bayesian networks, have been widely applied, their diagnostic performance remains limited when prior knowledge is scarce. To address this challenge, this paper proposes a multi-source information fusion diagnosis method for aero engine fault detection based on Dempster–Shafer (D-S) evidence theory. Data from gas path and vibration subsystems are separately processed to extract fault features, and a decision-level fusion strategy is employed to achieve comprehensive diagnoses. A case study based on real operational data from a two-shaft aero engine demonstrates that the proposed method significantly improves diagnostic performance. Specifically, the Bayesian-network-based fusion method achieves a diagnostic confidence of 87.2% without prior knowledge and 91.2% with prior knowledge incorporated, whereas D-S evidence theory attains a higher fault confidence of 99.6% without requiring any prior information.

1. Introduction

Aero engine operating conditions are harsh, with complex structures, high model nonlinearity, and high failure rates. Its function will inevitably deteriorate throughout its useful life cycle, which consequently causes anomalies, unexpected malfunctions, degradation, and faults, which seriously threaten the reliability and operational safety of the engine [1,2,3]. Recent advances in multi-sensor fusion technology have significantly contributed to the development of fault diagnosis methodologies. Compared with a single source of information, utilizing multi-source information fusion technology for aero engine fault diagnosis can more accurately assess the health status of the engine and improve diagnostic efficiency [4].
In the past decades, various fault diagnosis methods have been developed extensively, which can be generally divided into model-based methods and data-driven methods [5]. Model-based methods rely on detailed physics-based mathematical models to characterize engine behavior. Gas path analysis (GPA) [6] and Kalman filtering (KF) [7] are the two most representative model-based methods. Long et al. [8] proposed the concept of distributed flame tube health state parameters and the Kalman filtering technique for engine combustion chamber fault detection and health state monitoring. Lu et al. [9] developed a novel distributed extended Kalman filter with a data buffer bank (DEKF) and combined the DEKF with a self-tuning buffer strategy of recursive fusion estimation to form the self-tuning DEKF (SDEKF) algorithm for improving state estimation performance. With the advancement of sensor technologies and intelligent algorithms, data-driven methods have attracted increasing attention, such as artificial neural networks (ANNs), support vector machines (SVMs), and deep learning, which do not require detailed mechanical knowledge of the engine [10,11,12]. Wang et al. [13] proposed a multivariate health estimation model and a multivariate multistep-ahead long-term degradation prediction model to estimate the remaining useful life of aero engines. Hu et al. [14] proposed a continuous domain distribution adversarial network based on a deep domain adversarial network. Yang et al. [15] proposed a new compound fault diagnosis framework, the Lightweight Spatial-Temporal Model Fusion Self-Attention Mechanism (LST-SATM-Net), for aero engine hydraulic pipeline systems. Wang et al. [16] proposed a dynamic threshold method for aero engine fault detection based on Isolation Forest, which only uses normal aero engine data for training to build the fault detection model. These methods rely on single-source fault information to estimate the engine’s behavior and condition and are not comprehensive. As the volume of acquired information increases, single-source diagnostic methods face growing challenges in completing the inference process.
Aero engine fault diagnosis is divided into gas path fault systems, vibration fault systems, and lubricating oil fault systems [17]. However, most current research studies generally conduct fault diagnosis using information from a single physical source. On the one hand, diagnosis based on single physical sources can be lopsided. On the other hand, as a way to protect information confidentiality and integrity, the operating data of an engine are impossible to share for model training. Information fusion technology can deal with complex multi-source information effectively and improve the accuracy and reliability of diagnosis. More and more attention has been paid to the field of fault diagnosis [18,19]. Huang et al. [20] proposed a deep multimodal fusion structure suitable for multi-source information, which provides a new solution for fusing real physical data and virtual simulation data in the aero engine digital twin scheme. The Bayesian network, due to its ability to integrate heterogeneous information sources, has been widely employed in multi-source fusion diagnosis. Mack et al. [21] proposed learning tree-augmented naïve Bayesian networks from flight data to augment aircraft diagnostic models, improving fault detection through data mining combined with expert input. Ademujimi et al. [22] proposed a fusion-learning approach that builds Bayesian networks separately from sensor data and maintenance logs, extracting causal relationships through natural language processing and human-assisted annotations to achieve multi-source information fusion. However, Bayesian networks inherently rely on prior knowledge, and their diagnostic performance can be compromised when such prior information is limited.
To address this challenge, we developed a structured decision-level multi-source fusion framework based on Dempster–Shafer (D-S) evidence theory. First, diagnostic features are independently extracted from the gas path and vibration subsystems, and initial fault judgments are made based on predefined physical criteria. Then, a Bayesian network is constructed to perform decision-level fusion by integrating prior knowledge and capturing probabilistic dependencies among fault events. Finally, to mitigate the reliance on prior information, D-S evidence theory is applied to further optimize the fusion diagnosis process. A case study based on dual-shaft aero-engine experimental data demonstrates that the proposed method enables earlier fault detection and achieves higher diagnostic confidence levels compared to Bayesian-network-based approaches.

2. Methodology

The multi-source information fusion diagnosis method proposed in this paper is shown in Figure 1. The sensor data are divided into gas path parameters and vibration parameters according to the information sources. At present, the information fusion methods are divided into data layer, feature layer, and decision layer. In terms of data and features, it is difficult to directly integrate the information types and qualities of different aero engine subsystems. For instance, the gas path parameters and vibration signals differ considerably in data density and format. Thus, this paper adopts decision-level fusion. The frame of proposed information fusion method is shown as Figure 1. The fault features of each subsystem are obtained by the response fault feature extraction method based on the original data. According to the fault criteria of various systems, corresponding fault decisions are obtained. Finally, the decision fusion algorithm is used to fuse the decision level and output the diagnosis result after fusion.

2.1. Subsystem Analysis Method

2.1.1. Gas Path Analysis Method

The gas path system evaluates the performance of each engine component by utilizing a combination of mechanism-based and data-driven models. Sensor measurements, including temperature, pressure, and rotational speed, are used as inputs for feature extraction. In this study, the gas path analysis (GPA) method is employed to characterize the gas path behavior. The structure of the model-based GPA approach is illustrated in Figure 2. This simulation model estimates the thermodynamic parameters by incorporating both boundary conditions and component degradation states. Mathematically, the model is formulated as follows:
y = f ( x , D )
where x denotes the boundary condition inputs. D represents the fault features of gas path. y is the simulated thermodynamic outputs. The function f(·) is a nonlinear steady-state simulation model derived from energy and mass balance equations of the engine. It is solved iteratively under given inputs x and D to match measured outputs, enabling engine performance evaluations and degradation diagnoses.
The GPA method evaluates five critical engine components—namely, the fan, high-pressure compressor (HPC), low-pressure compressor (LPC), high-pressure turbine (HPT), and low-pressure turbine (LPT). Based on these components, ten gas path fault features are extracted to quantify the degradation level induced by gas path faults. The gas path fault features D = {DEF, DGF, DEHC, DGHC, DELC, DGLC, DEHT, DGHT, DELT, DGLT} are summarized in Table 1. The boundary conditions x = {pt1, Tt1, Wf, n1, n2} include the air inlet total pressure pt1, air inlet total temperature Tt1, fuel flow rate Wf, low-pressure rotor speed n1, and high-pressure rotor speed n2. These represent the engine’s external state, provide sufficient constraints for the simulation model, and are standard measurable inputs in practice. The measurement parameters are y = {pt13, Tt125, pt25, Tt25, pt3, Tt3, pt45, Tt45, Tt5}, where pt denotes total pressure and Tt is total temperature. The numeric subscripts indicate specific measurement locations along the engine: 13 and 125 correspond to the fan outlet and the fan outlet after mixing, 25 and 3 represent the inlet and outlet of the high-pressure compressor, and 45 and 5 refer to the inlet and outlet of the low-pressure turbine.
Model-based diagnosis is typically regarded as the inverse process of simulation modeling. It involves comparing simulated thermodynamic parameters with actual measurements under given operating conditions. According to the comparison results, the health condition of the gas turbine is adjusted, and the calculation is iterated repeatedly until the deviation between the simulation results and the measured parameters meets the requirements.

2.1.2. Vibration Analysis Method

Vibration analysis is conducted in both the time and frequency domains to extract relevant fault features. Aero engine vibration arises from structural responses to multiple simultaneous excitation forces acting on the engine. The characteristics of each exciting force, strength, role, and mode of action determine the vibration characteristics of the engine. It is impossible to thoroughly study the characteristics of each exciting force through the vibration sensor; during actual work, it can only determine the dominant excitation components, the main excitation sources, and the main parts reflecting the vibration performance of the whole engine. Below are several typical vibration faults and their characteristics [23].
(1)
Rotor unbalance
Rotor unbalance is a fault caused by mass eccentricity of rotor components or defects of rotor components. Engine vibration caused by rotor unbalance is quite common. The reasons for rotor unbalance are as follows: unreasonable structure design, manufacturing and assembly errors, uneven material, uneven heating, corrosion, wear and scaling of the rotor during operation, etc. The time-domain waveform is a periodic single-frequency signal, typically sinusoidal in shape, reflecting the rotational nature of the excitation force. The frequency domain characteristic of the unbalanced rotor is that the energy is concentrated in the fundamental frequency; in addition, some other low-frequency components will be excited, such as 1/2 frequency and 2 frequency [24].
(2)
The rotor is not centered
Misalignments between rotor and support are divided into two types: angular misalignment and parallel misalignment. Angular misalignment refers to an inclined angle between the shaft and support axes, while parallel misalignment means their axes are parallel but offset. Both types generate dynamic axial and radial forces during rotation. Parallel misalignment predominantly excites second-harmonic radial vibrations, whereas angular misalignment induces both synchronous axial vibrations and second-harmonic radial vibrations. Axial vibrations are more pronounced in angular misalignment due to imposed bending moments.
(3)
Foreign inhalation
Foreign objects first damage the rotor blades of the primary compressor. Metallic foreign objects will rebound after ingestion, repeatedly striking inlet guide vanes and rotor blades, causing cascading damage to multiple compressor stages. The broken foreign matter and the broken blade will also pass through the first stage rotor and further damage the subsequent levels of the blade. Foreign object ingestion triggers severe engine vibration, characterized by transient impact-induced amplitude spikes in vibration signals, and the vibration characteristics are related to the damage form and degree of foreign objects.
(4)
Oil film oscillation
When the bearing is working, an oil film is formed in the gap between the journal and the bearing bush. When the bearing capacity of the oil film is balanced with the external load, the journal is in a balanced position. When the rotating shaft is subjected to some external disturbance, the center of the journal will vortex near the static equilibrium position. When the tangential force exceeds damping capacity, the whirl motion diverges, leading to journal instability and ultimately oil whip phenomenon.

2.2. Information Fusion Algorithm

2.2.1. Bayesian Network

In aero engine fault diagnosis, features from gas path, vibration, and lubrication subsystems often differ in scale, structure, and diagnostic uncertainty. These differences pose challenges for direct fusion. Bayesian networks provide an effective solution by modeling the conditional dependencies between subsystem features and component-level faults. Their graphical structure enables clear representation of causality, while the probabilistic framework supports uncertainty reasoning and prior knowledge integration [25].
A Bayesian network, structured as a directed acyclic graph (DAG), consists of nodes representing random variables, including potential fault hypotheses and measurable diagnostic features. Directed edges between nodes indicate conditional dependencies, with arrows pointing from parent nodes to child nodes. Each node has a conditional probability table (CPT). The conditional probability table can be described by  p V i P a V i , which is used to describe the occurrence probability of the event of this node when other node events are in different states. For any node without parent nodes in a Bayesian network, its conditional probability is reduced to a prior probability. The network determines the conditional probability distribution of child nodes by propagating evidence through the network using the probability chain rule:
p V 1 , V 2 , , V k = i = 1 k p V i P a V i
where  P a V i  indicates the parent node of Vi. The diagnostic capability of Bayesian network-based information fusion can be significantly improved by incorporating prior knowledge into the network architecture [26]. Reliable prior knowledge can come from expert experience, physical models, statistical information, etc. [27]. The fusion diagnosis results based on Bayesian network can be optimized by relying on prior knowledge, and the difficulty of obtaining prior knowledge is also a factor restricting Bayesian network.

2.2.2. D-S Evidence Theory

D-S evidence theory was proposed in 1967 to deal with the relations between propositions and sets [28]. Compared with probabilistic methods, D-S evidence theory does not require precise prior probabilities, making it especially suitable for applications in which reliable prior knowledge is difficult to obtain or incomplete—such as in real-world aero engine monitoring scenarios.
In D-S evidence theory, the discrete value range of the research object is called the frame of discernment, which is defined as  Ω = ω 1 , ω 2 , , ω n . For a specific fault diagnosis problem,  ω  corresponds to the possible failure modes, and the identification framework corresponds to the union of all possible failure modes.
As for a frame of discernment  Ω , the basic probability assignment function m can be defined as a mapping of power-set  2 Ω  to closed interval [0, 1]. A is a non-empty subset of  A Ω  and satisfies the following conditions:
m Ø = 0 A Ω m A = 1
where  m Ø = 0  indicates that if A is a null set, no belief will be assigned.  A Ω m A = 1  means that the total probability for non-empty subset A must equal 1.
Composition rules are the key to evidence theory. Let frame of discernment  Ω  have two sets of evidence E1 and E2. The corresponding basic probability assignment functions are m1 and m2. The non-empty subsets are B and C. The rule according to D-S theory for integrating the two sets of evidence is as follows:
m 1 m 2 ( A ) = 1 K B C = A m 1 ( B ) m 2 ( C )
K = B C Ø m 1 ( B ) m 2 ( C ) = 1 B C = Ø m 1 ( B ) m 2 ( C )
where K represents the basic probability mass associated with conflicts among the sources of evidence.

3. Case Study

To validate the proposed method, a case study is conducted on a two-shaft turbofan aero engine, focusing on performance degradation. Figure 3 shows the sectional structure diagram of the turbofan engine. The main components include the air inlet, fan, low-pressure compressor (LPC), high-pressure compressor (HPC), combustion chamber, high-pressure turbine (HPT), low-pressure turbine (LPT), bypass, mixing chamber, and exhaust nozzle. To obtain vibration signals, two sensors are placed on the bearing housing and two sensors are placed on the intermediate case. The temperature and pressure measurement points are the same as in the introduction in Table 1. In addition, four vibration points are set. The meanings of the vibration measurement points in Figure 3 are indicated in Table 2. As shown in Figure 4, the trends of the rotational speed of the low-pressure system ( N 1 ) and high-pressure system ( N 2 ) after 1000 s of operation are presented.
The values in the graph are relative to the rated speed.  N 1  is 0.36 times the rated speed at 1000 s. It reaches its peak (0.92 times the rated speed) at 1759.8 s, then rapidly drops to zero as the engine shuts down.  N 2  is 0.80 times the rated speed at 1000 s. It reaches its peak (1.02 times the rated speed) at 1759.8 s. The rapid drop to zero after 1759.8 s coincides with the engine failure, suggesting a sudden and complete loss of power.
In the case study, the vibration and gas path parameters are analyzed, respectively, and fault features are extracted. Then, D-S evidence theory and a Bayesian network are used to carry out information fusion diagnosis, so as to compare the effect of different information fusion algorithms.

3.1. Vibration Fault Feature Analysis

The original vibration data are normalized by their peak absolute values to obtain relative amplitudes, which are then used for plotting. The relative vibration amplitude of the four measurement points arranged on the engine are shown in Figure 5. The relative vibration amplitude of all four sensors reached its peak at 1759.8 s. The aircraft engine also experiences a sudden failure and shuts down at 1759.8 s. The relative amplitude of the two sensors placed on the bearing housing is much smaller than that of those placed on the intermediate case. The intermediate case is located near the fan and compressor, which are two major rotating components and sources of airflow disturbances. During operation, it is subjected to significant dynamic forces, resulting in large vibrations. The maximum relative vibration amplitudes measured by the sensors  V ic 1  and  V ic 2  on the intermediate case are 0.84 and −1.0, respectively. Meanwhile, the maximum relative vibration amplitudes measured by the sensors  V 11  and  V 12  on the bearing housing are 0.11 and −0.15, respectively. The relative vibration amplitude at measurement point  V ic 2  on the intermediate case increased from 0.10 to 0.19 after 1754 s. This nearly doubles and continues to show an increasing trend until it reaches a peak of −1.0 at 1759.8 s. The vibration signals of the other three sensors are not as significant as those at  V ic 2  before the shutdown.

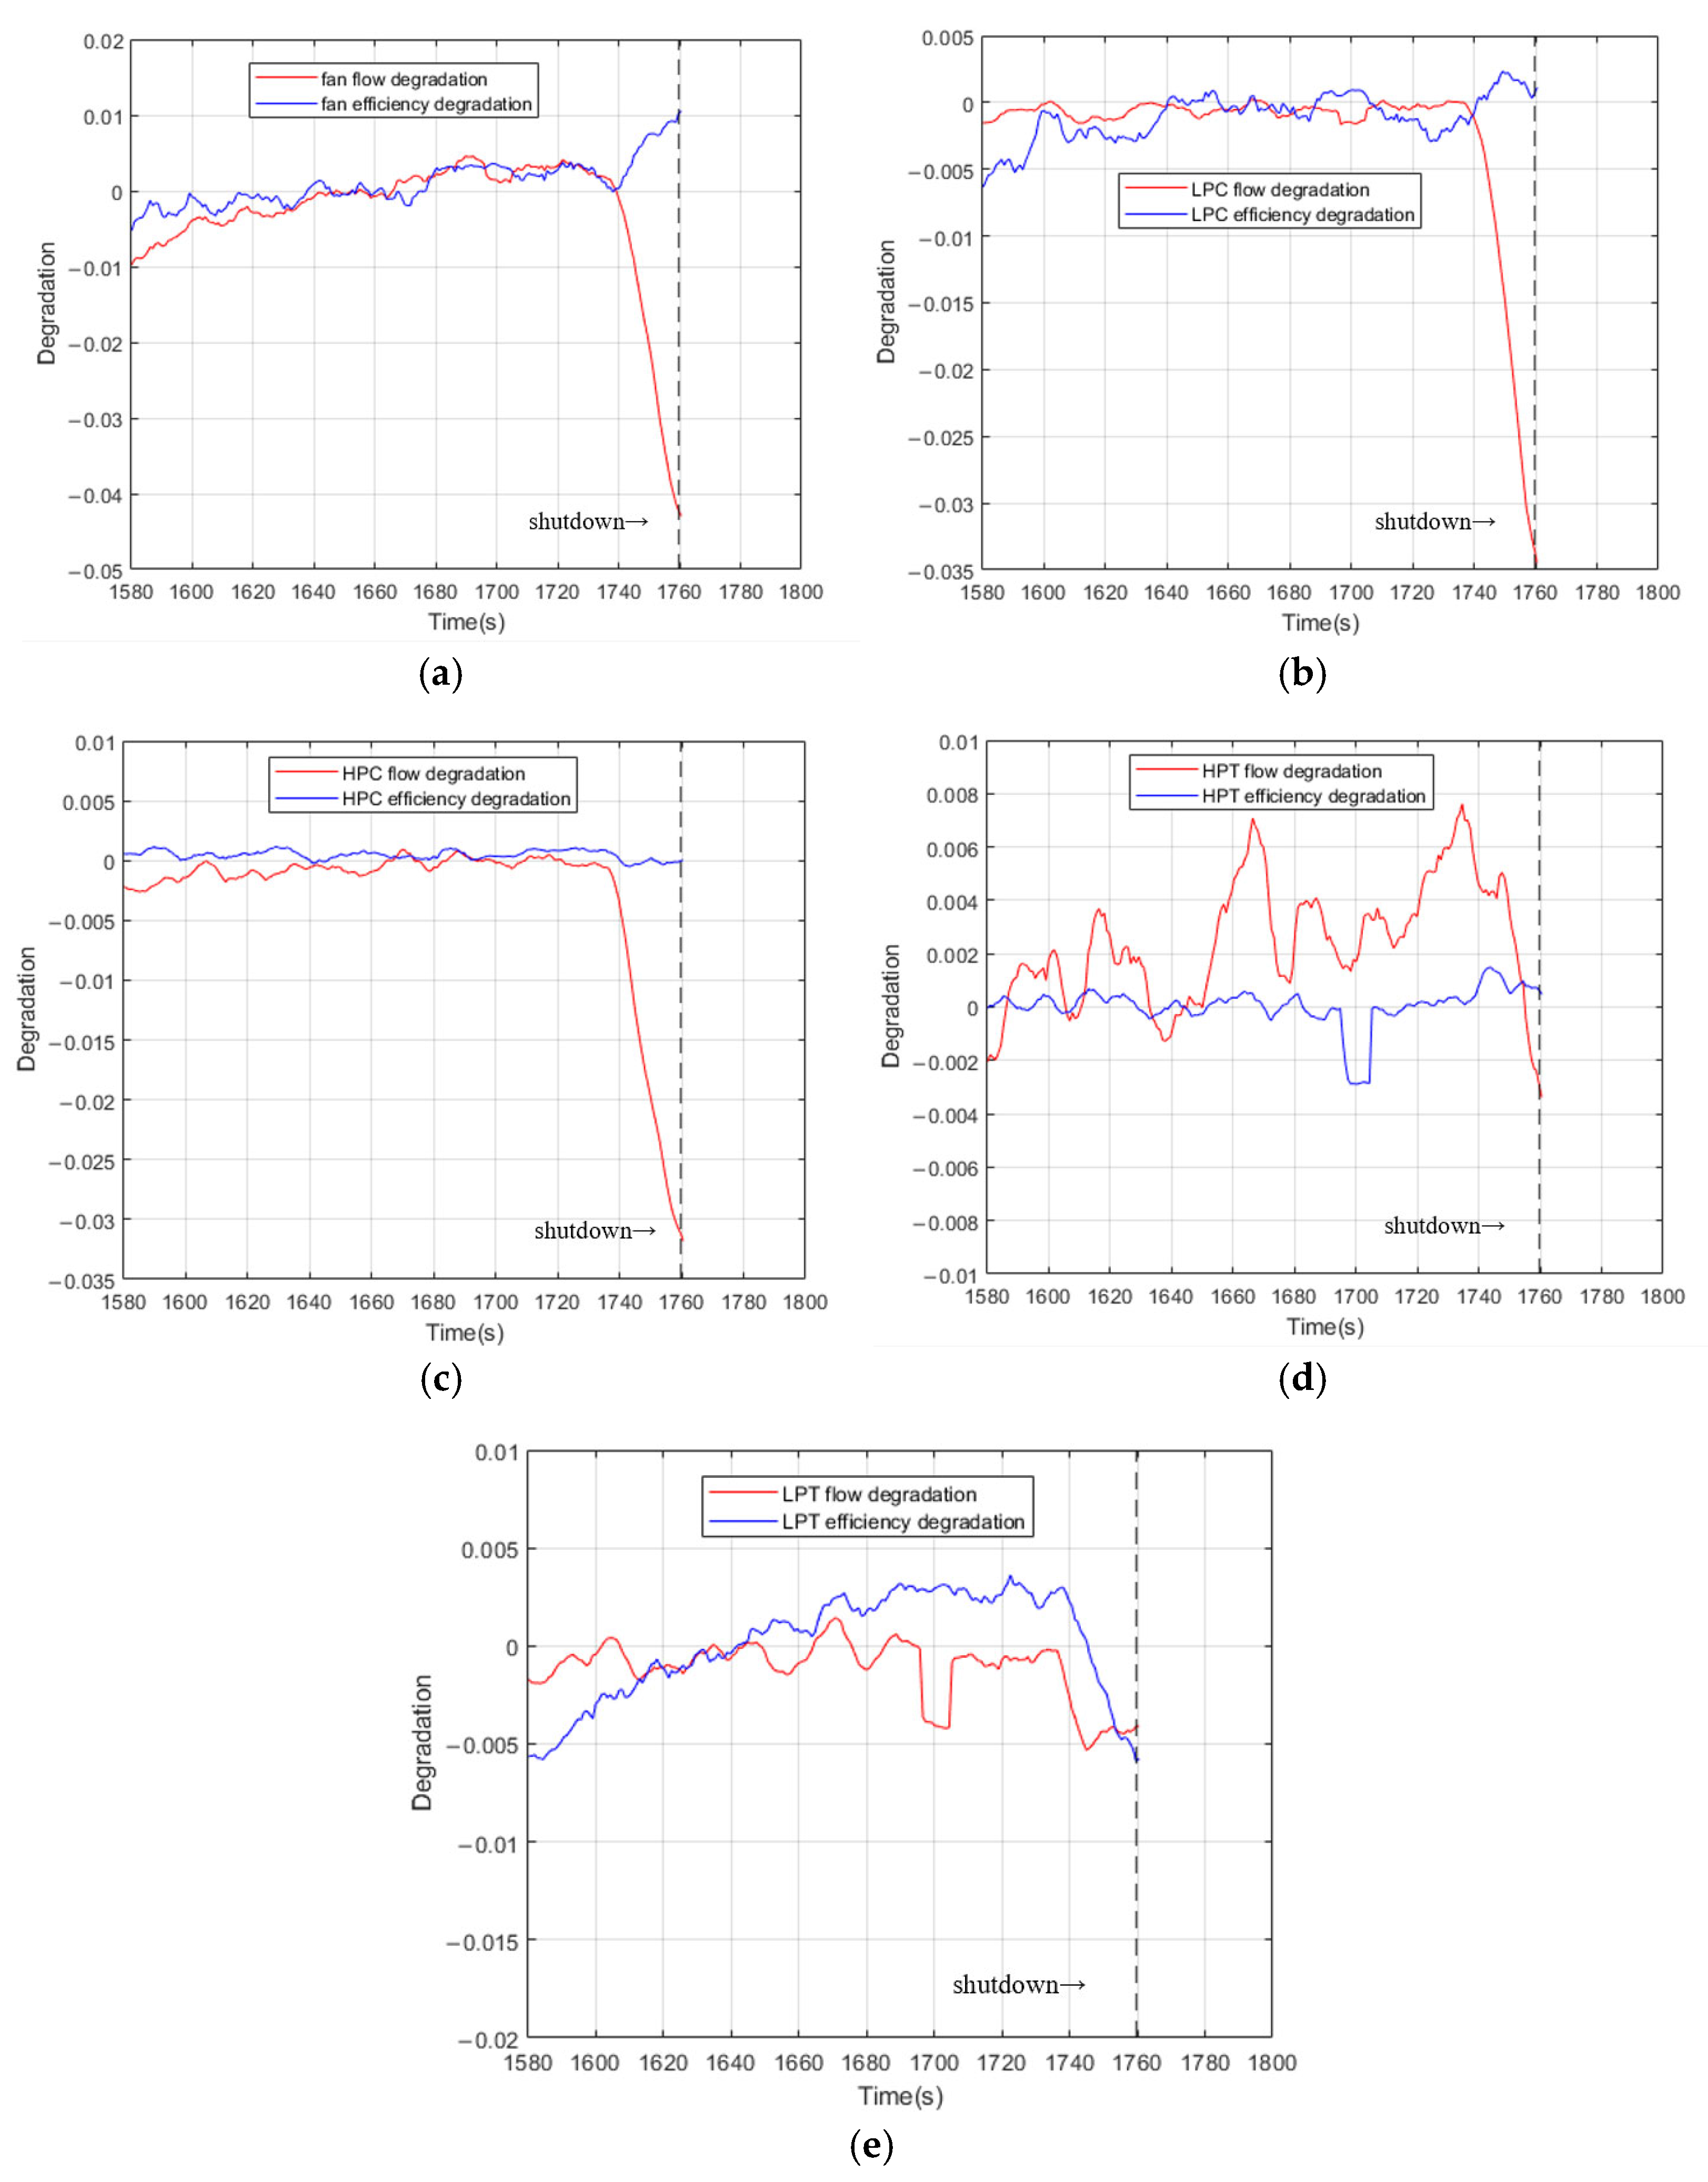
3.2. Gas Path Fault Feature Analysis

Based on the GPA method introduced in the methodology, the degradation calculation of flow rate and efficiency is carried out. Figure 6 shows the flow and efficiency degradation results of the fan, low-pressure compressor, high-pressure compressor, high-pressure turbine, and low-pressure turbine. In Figure 6a, the fan flow rate degradation remains relatively stable until around 1736 s, after which it drops sharply to −4.78% due to the shutdown. The efficiency degradation is smaller in magnitude but still noticeable, peaking at 0.94%. This sudden decline is indicative of a critical failure, later confirmed to be a fan baffle detachment. Figure 6b illustrates the LPC degradation. Following the fan failure, its flow rate also declines rapidly, reaching −4.00%. The efficiency degradation is limited in magnitude, with transient fluctuations that reflect sensitivity to upstream flow disturbances. As shown in Figure 6c, the HPC experiences a similar pattern. The flow degradation reaches −3.29% with a slight time delay compared to the LPC. The efficiency degradation remains relatively stable, indicating the compressor maintained operational integrity despite upstream disruptions. Figure 6d presents the HPT degradation. While the flow and efficiency curves are generally stable, they display noticeable oscillations. These fluctuations result from dynamic changes in pressure and thermal conditions propagating downstream, yet no catastrophic drop is observed. Figure 6e shows that the LPT experiences the most gradual and minimal changes. The flow degradation remains under −0.45%, and the efficiency degradation is approximately 0.02%. As a downstream component, the LPT is indirectly affected by upstream failures and exhibits a delayed and attenuated degradation response.
Comparing the overall degradation patterns, it is clear that the fault originated at the fan, then propagated through the compression system and gradually reached the turbines with decreasing intensity. This confirms the role of airflow disruption in fault propagation. In addition, comparing with the vibration measurement results in Figure 5, gas path degradation signals appear earlier, making them more suitable for early-stage fault diagnosis. These degradation characteristics provide strong evidence of a fault propagation mechanism starting from the fan and moving downstream, with the severity of impact diminishing across the system.

3.3. Information Fusion Diagnosis Analysis

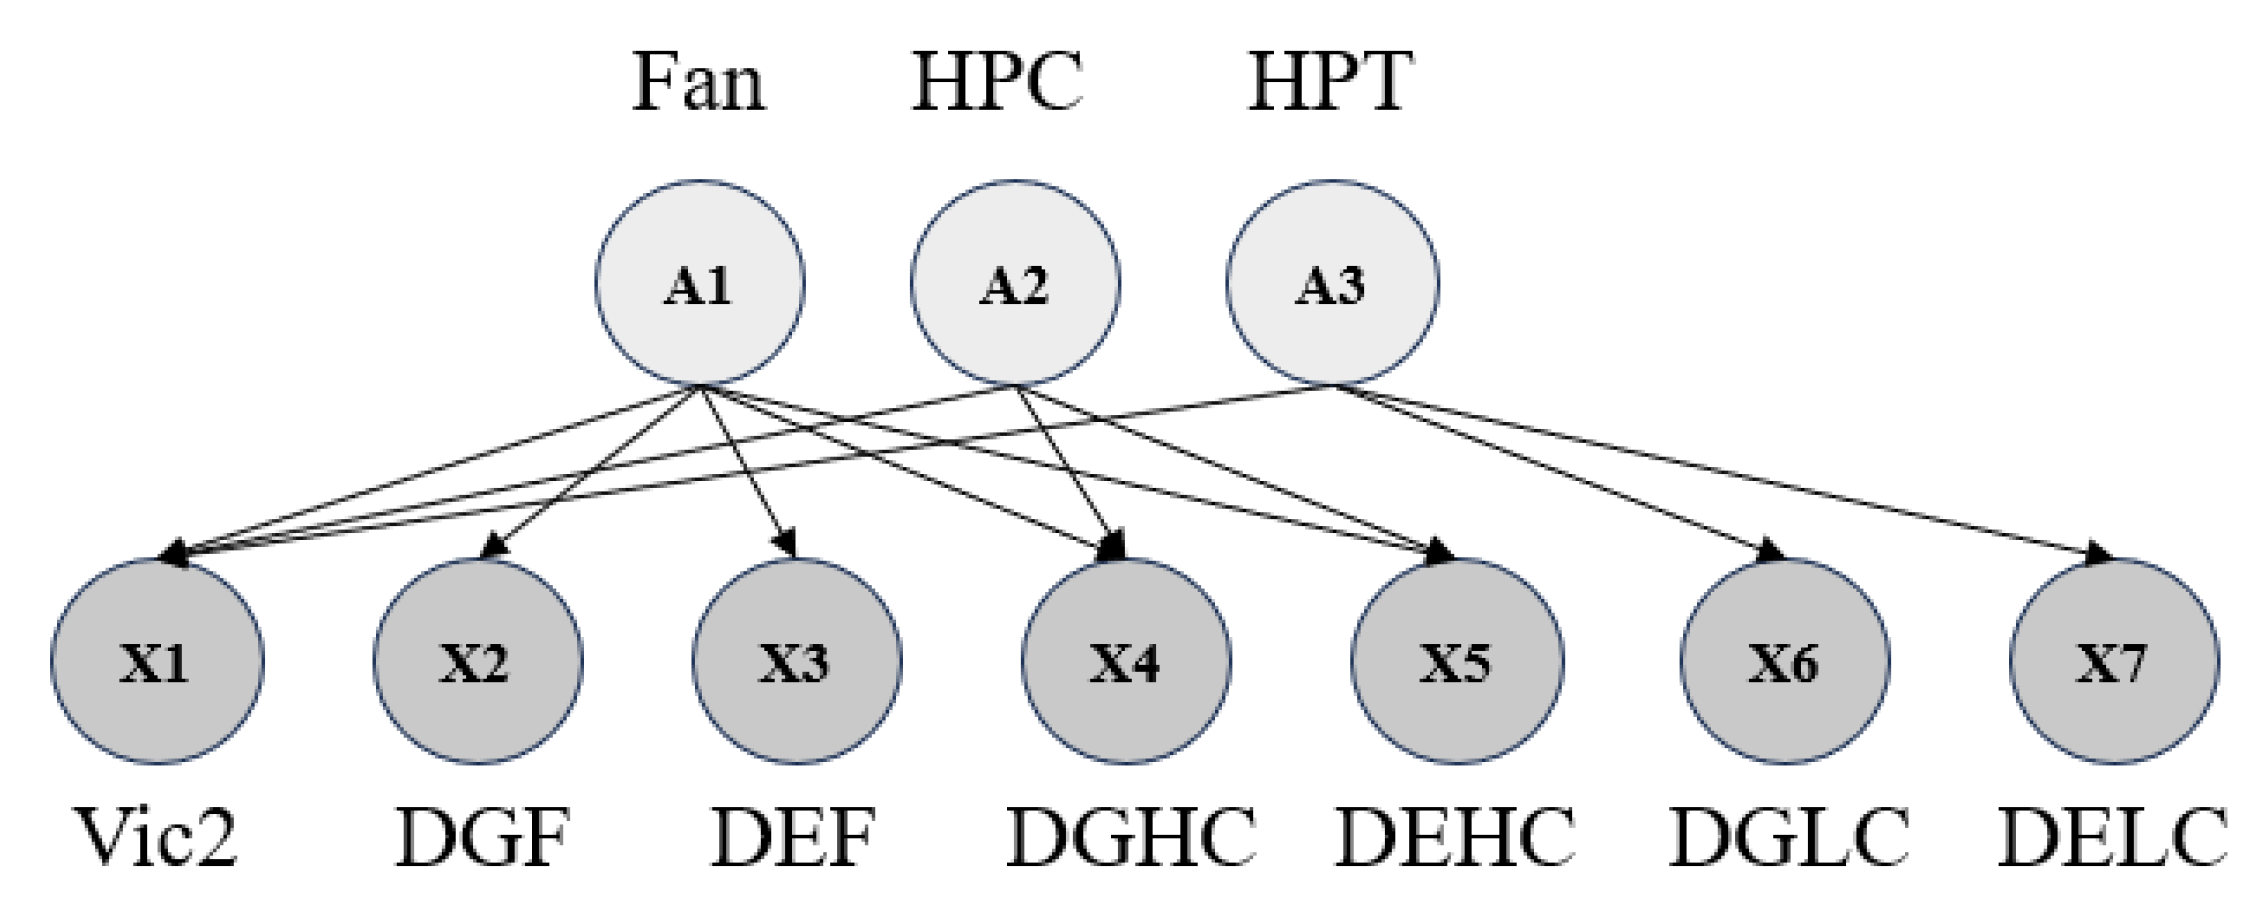
3.3.1. Information Fusion Based on Bayesian Network

Bayesian network parameter tuning is divided into two parts: DAG and CPT. The Bayesian network used in this case is constructed as shown in Figure 7. The failures of different components are regarded as independent events. The child nodes of the network are eight fault characteristic nodes, and the parent nodes are three fault cause nodes. The structure of Bayesian networks is derived from prior knowledge. Because the fault in this case occurred at the fan component, HPC and LPC are selected as the system components that indicate the cause of the fault. To simplify the modeling process, only one vibration feature and the gas path degradation parameters related to these components are included as child nodes in the diagnostic layer.
The construction of CPT is critical to the Bayesian network. Reference [29] provides the construction method of CPT, including two cases without prior information and with prior information. First, the prior conditional probability should be defined, that is, the probability of occurrence of nodes A1, A2, and A3. Reference [30] provided a probabilistic failure analysis method, which can obtain the probability of failure of each component according to the probability of the occurrence of the bottom events. These bottom events can be regarded as the class of failure that occurs in the component. The resulting prior probabilities for the parent nodes are listed in Table 3.
The child node parameters in Figure 7 represent continuous variables rather than discrete binary values (0 or 1). These continuous variables are modeled using Gaussian distributions to characterize their conditional probability distributions. This hybrid approach combining discrete and continuous variables constitutes what is formally termed a hybrid Bayesian network (HBN). In this paper, a Gaussian distribution is used for nodes X1–X7 to represent their continuous distribution probabilities.
Considering that this case is mainly a fan failure, the relevant Gaussian distribution functions are listed as shown in Table 4. The vibration signal uses the amplitude as input, and the gas path uses the degradation parameter as input. According to the fault criteria knowledge from previous works [31,32,33], the mean value of flow rate degradation in a gas path system can be set as −0.05, which means a 5% increase in flow rate is considered a failure. As for vibration systems, in order to improve the speed of solutions, the amplitude of vibration in the time domain can be used as evidence of the need for fusion. Based on the existing research [34,35], blade failure can greatly affect the time domain characteristics of vibration. The mean value of the child node probability distribution of the vibration system is set to 220 μm according to the existing research results and the data characteristics of the sensor. According to reference [30], without considering prior knowledge, the same standard deviation (0.5) is obtained when the A1 state is 0 or 1. When the prior knowledge is taken into account, the probability distribution function is adjusted, enlarging the standard deviation at A1 = 0 and shrinking the standard deviation at A1 = 1. The purpose of this adjustment is to obtain the result of the component failure only if the parameter is very close to the mean value of A1 = 1. Such an adjustment is consistent with the data characteristics in Figure 5 and Figure 6; that is, the parameter changes faster when the fault occurs.
The diagnosis results for information fusion based on a Bayesian network are shown in Figure 8. It can be seen from the figure that the probability of diagnosis results after the fusion changes and increases quickly about 1756 s afterwards. Without prior knowledge, the highest probability is 87.22% at 1760 s. In the case of prior knowledge, due to the adjustment of the standard deviation, the probability of fan failure in the few seconds before shutdown is generally higher than that without prior knowledge. In addition, the highest probability of failure with prior knowledge also occurs in the last second, which is 91.16%. This shows that the introduction of prior knowledge and the adjustment of the probability distribution can improve the reliability of diagnosis. Compared with the characteristic diagnosis result of a simple gas path fault, the information fusion diagnosis method of the Bayesian network can eliminate the fluctuation when the fault does not occur by considering the vibration signal. However, in practical engineering applications, the acquisition of prior knowledge is more difficult, which may lead to obstacles in applications based on Bayesian networks.

3.3.2. Information Fusion Based on D-S Evidence Theory

Based on the basic principle of D-S evidence theory, the gas path and vibration information are fused. The actual diagnosis requires the membership function for the initial basic probability assignment. The construction method of the membership function varies depending on the situation. According to [23], a normal-type function is adopted in this paper considering the requirement for a high sensitivity in sensor fault diagnosis.
m ( A ) = e ( z μ σ ) 2
where μ represents the mean value, σ represents the standard deviation, and Z represents the vibration amplitude signal or gas path degradation results. The mean value of m(A) of the gas path system is set as −0.05, the same as the probability distribution in the Bayesian network. The mean value of m(A) of the vibration system is also set to 220 μm.
The diagnostic results of different systems and fusion diagnoses are shown in Figure 8. For single-source diagnosis, the gas path fault probability exhibits significant fluctuations during the early stage. Due to the fan flow degradation occurring before engine shutdown, gas path monitoring is able to detect the fault in advance, achieving a fault probability of up to 95%. In contrast, the vibration-based diagnosis shows a substantial delay: no alarm is triggered before shutdown, and only when the vibration amplitude exceeds 200 does the fault probability rise sharply, reaching a maximum of 97%.
Bayesian network-based fusion methods, calculated following the model in [29,30], achieve a diagnostic confidence of 87.2% without prior knowledge and 91.2% when prior knowledge is incorporated. However, Bayesian network diagnosis relies heavily on the availability and quality of prior information; under insufficient prior conditions, the fault confidence rises later and exhibits fluctuations near the decision threshold, indicating limited robustness. In contrast, D-S evidence theory effectively integrates gas path and vibration fault features without prior knowledge, achieving a higher fault confidence of 99.6%. Moreover, D-S fusion retains the early warning capability of gas path parameters while significantly suppressing diagnostic volatility during normal operation. Compared to Bayesian network, the D-S-based method demonstrates better stability, faster fault probability growth, and a higher final confidence level, making it more suitable for practical aero engine fault diagnosis under uncertain and variable conditions.
Figure 8. Fusion diagnosis results based on Bayesian network.
Applsci 15 05083 g008

4. Conclusions

This paper proposes a multi-source information fusion diagnosis method for aero engine fault detection. By integrating diagnostic information from gas path and vibration subsystems at the decision level and validating this through calculations and an analysis based on real operational data from a two-shaft aero engine, the study demonstrates the effectiveness and applicability of the proposed method. The main conclusions are as follows:
(1)
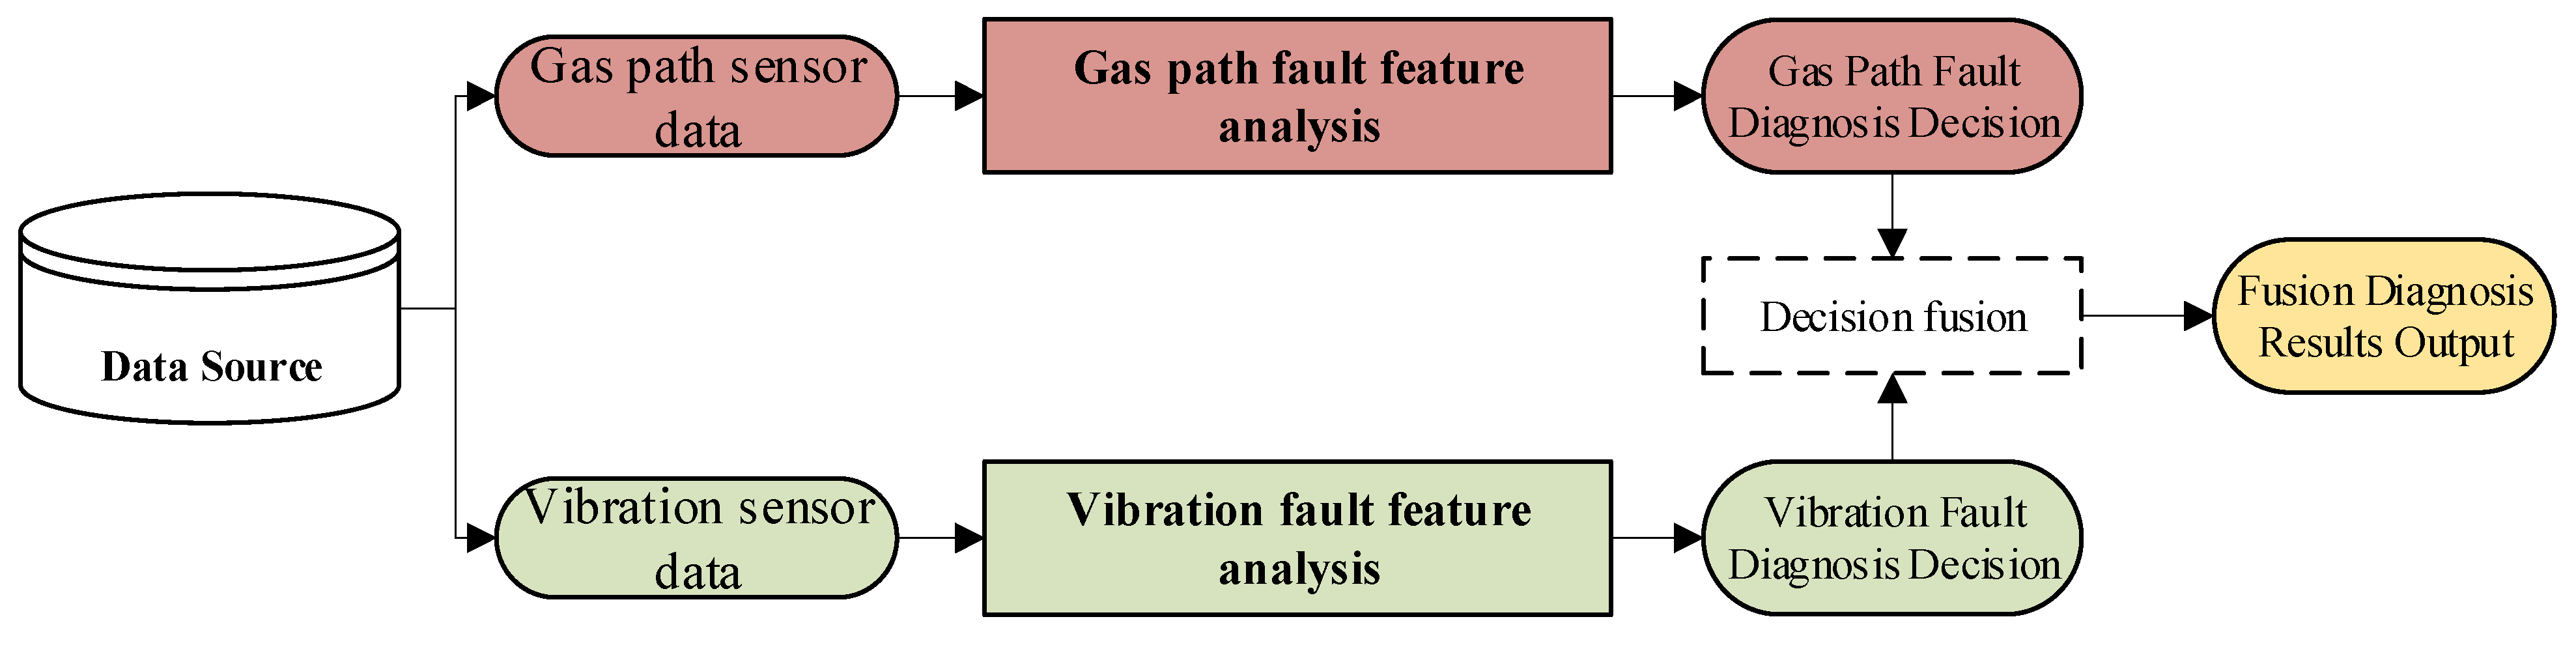
This study builds a decision-level fusion framework integrating diagnostic features independently extracted from gas path, vibration, and lubrication subsystems. A GPA and vibration signal analysis are employed for fault characterization. Preliminary decisions are made based on subsystem-specific criteria, enabling effective fusion across heterogeneous data sources;
(2)
A two-layer Bayesian network is developed to capture dependencies between fault features and component-level failures. Without prior knowledge, it achieves a diagnostic confidence of 87.2%, increasing to 91.2% with prior knowledge. While Bayesian fusion improves diagnostic reliability, its application is constrained by the need for accurate prior knowledge and complex CPT construction;
(3)
To mitigate the dependence on prior knowledge, Dempster–Shafer (D-S) evidence theory is introduced for decision fusion. By incorporating Gaussian-type membership functions, the D-S-based method effectively handles uncertainty caused by sensor signal fluctuations. The fusion result achieves a diagnostic confidence of 99.6%, significantly reducing volatility in fault probability trends and demonstrating superior robustness and early fault detection capability compared to Bayesian-based fusion.
By utilizing real engine operational data, the proposed method achieves a high diagnostic confidence level and demonstrates good adaptability to practical aero engine fault diagnosis tasks. In future work, the fusion framework can be extended by incorporating additional diagnostic sources, such as lubrication system monitoring, to further enhance diagnostic coverage and accuracy.

Author Contributions

Conceptualization, K.Y., Y.S. and H.Z.; Methodology, K.Y., Y.S. and Y.C.; Software, K.Y., Y.S. and Y.C.; Investigation, Y.C. and H.Z.; Writing—original draft preparation, K.Y. and Y.S.; Writing—review and editing, Y.C. and H.Z. All authors have read and agreed to the published version of the manuscript.

Funding

This research received no external funding.

Institutional Review Board Statement

Not applicable.

Informed Consent Statement

Not applicable.

Data Availability Statement

The data are not publicly available due to privacy and ethical restrictions. Requests for access to the data should be directed to the corresponding author at zhslm@sjtu.edu.cn.

Conflicts of Interest

Authors Kai Yin and Yawen Shen were employed by the company AECC Commercial Aircraft Engine Co., Ltd. The remaining authors declare that the research was conducted in the absence of any commercial or financial relationships that could be construed as a potential conflict of interest.

Nomenclature

ANNArtificial neural network
CPTConditional probability table
DAGDirected acyclic graph
DEFEfficiency degradation of fan
DEHCEfficiency degradation of high-pressure compressor
DEHTEfficiency degradation of high-pressure turbine
DEKFExtended Kalman filter with the data buffer bank
DELCEfficiency degradation of low-pressure compressor
DELTEfficiency degradation of low-pressure turbine
DGFFlow rate degradation of fan
DGHCFlow rate degradation of high-pressure compressor
DGHTFlow rate degradation of high-pressure turbine
DGLCFlow rate degradation of low-pressure compressor
DGLTFlow rate degradation of low-pressure turbine
D-SDempster–Shafer
GPAGas path analysis
HBNHybrid Bayesian networks
HPCHigh-pressure compressor
HPTHigh-pressure turbine
KFKalman filter
LPCLow-pressure compressor
LPTLow-pressure turbine
LST-SATM-NetLightweight Spatial-Temporal Model Fusion Self-Attention Mechanism
N1Low-pressure rotor speed
N2high-pressure rotor speed
pt1Air inlet total pressure
pt13Fan outlet total pressure
pt25High-pressure compressor inlet pressure
pt3High-pressure compressor outlet pressure
pt45Low-pressure turbine inlet pressure
SDEKFSelf-tuning extended Kalman filter with the data buffer bank
SVMSupport vector machine
Tt1Air inlet temperature
Tt125Fan outlet total temperature
Tt25High-pressure compressor inlet temperature
Tt3High-pressure compressor outlet temperature
Tt45Low-pressure turbine inlet temperature
Tt5Low-pressure turbine outlet temperature
V11Vibration measurement point 1 of the bearing housing
V12Vibration measurement point 2 of the bearing housing
Vic1Vibration measurement point 1 of the intermediate case
Vic2Vibration measurement point 2 of the intermediate case
WfFuel flow

References

  1. Shen, Y.; Khorasani, K. Hybrid multi-mode machine learning-based fault diagnosis strategies with application to aircraft gas turbine engines. Neural Netw. 2020, 130, 126–142. [Google Scholar] [CrossRef]
  2. Xu, M.; Liu, J.; Li, M.; Geng, J.; Wu, Y.; Song, Z. Improved hybrid modeling method with input and output self-tuning for gas turbine engine. Energy 2022, 238, 121672. [Google Scholar] [CrossRef]
  3. Lu, J.; Huang, J.; Lu, F. Kernel extreme learning machine with iterative picking scheme for failure diagnosis of a turbofan engine. Aerosp. Sci. Technol. 2020, 96, 105539. [Google Scholar] [CrossRef]
  4. Kibrete, F.; Woldemichael, D.E.; Gebremedhen, H.S. Multi-Sensor data fusion in intelligent fault diagnosis of rotating machines: A comprehensive review. Measurement 2024, 232, 114658. [Google Scholar] [CrossRef]
  5. Tang, S.; Yuan, S.; Zhu, Y. Deep learning-based intelligent fault diagnosis methods toward rotating machinery. IEEE Access 2019, 8, 9335–9346. [Google Scholar] [CrossRef]
  6. Zhang, H.; Long, L.; Dong, K. Detect and evaluate dependencies between aero-engine gas path system variables based on multiscale horizontal visibility graph analysis. Phys. A Stat. Mech. Its Appl. 2019, 526, 120830. [Google Scholar] [CrossRef]
  7. Togni, S.; Nikolaidis, T.; Sampath, S. A combined technique of Kalman filter, artificial neural network and fuzzy logic for gas turbines and signal fault isolation. Chin. J. Aeronaut. 2021, 34, 124–135. [Google Scholar] [CrossRef]
  8. Long, Z.; Bai, M.; Ren, M.; Liu, J.; Yu, D. Fault detection and isolation of aeroengine combustion chamber based on unscented Kalman filter method fusing artificial neural network. Energy 2023, 272, 127068. [Google Scholar] [CrossRef]
  9. Lu, F.; Gao, T.; Huang, J.; Qiu, X. A novel distributed extended Kalman filter for aircraft engine gas-path health estimation with sensor fusion uncertainty. Aerosp. Sci. Technol. 2019, 84, 90–106. [Google Scholar] [CrossRef]
  10. Pang, S.; Li, Q.; Feng, H. A hybrid onboard adaptive model for aero-engine parameter prediction. Aerosp. Sci. Technol. 2020, 105, 105951. [Google Scholar] [CrossRef]
  11. Zhou, D.; Yao, Q.; Wu, H.; Ma, S.; Zhang, H. Fault diagnosis of gas turbine based on partly interpretable convolutional neural networks. Energy 2020, 200, 117467. [Google Scholar] [CrossRef]
  12. Lan, G.; Cheng, N.; Li, Q. Comparison and fusion of various classification methods applied to aero-engine fault diagnosis. In Proceedings of the 2017 29th Chinese Control and Decision Conference (CCDC), Chongqing, China, 28–30 May 2017; pp. 4754–4759. [Google Scholar] [CrossRef]
  13. Wang, C.; Lu, N.; Cheng, Y.; Jiang, B. A data-driven aero-engine degradation prognostic strategy. IEEE Trans. Cybern. 2019, 51, 1531–1541. [Google Scholar] [CrossRef]
  14. Hu, J.; Chen, M.; Tang, H.; Zhang, J. An adversarial transfer learning method based on domain distribution prediction for aero-engine fault diagnosis. Eng. Appl. Artif. Intell. 2024, 133, 108287. [Google Scholar] [CrossRef]
  15. Yang, T.; Li, G.; Yuan, S.; Qi, Y.; Yu, X.; Han, Q. The LST-SATM-net: A new deep feature learning framework for aero-engine hydraulic pipeline systems intelligent faults diagnosis. Appl. Acoust. 2023, 210, 109436. [Google Scholar] [CrossRef]
  16. Wang, H.; Jiang, W.; Deng, X.; Geng, J. A new method for fault detection of aero-engine based on isolation forest. Measurement 2021, 185, 110064. [Google Scholar] [CrossRef]
  17. Liu, X.; Chen, Y.; Xiong, L.; Wang, J.; Luo, C.; Zhang, L.; Wang, K. Intelligent fault diagnosis methods toward gas turbine: A review. Chin. J. Aeronaut. 2023, 37, 93–120. [Google Scholar] [CrossRef]
  18. Foo, P.H.; Ng, G.W. High-level information fusion: An overview. J. Adv. Inf. Fusion 2013, 8, 33–72. [Google Scholar]
  19. Hang, J.; Zhang, J.; Cheng, M. Fault diagnosis of wind turbine based on multi-sensors information fusion technology. IET Renew. Power Gener. 2014, 8, 289–298. [Google Scholar] [CrossRef]
  20. Huang, Y.; Tao, J.; Sun, G.; Wu, T.; Yu, L.; Zhao, X. A novel digital twin approach based on deep multimodal information fusion for aero-engine fault diagnosis. Energy 2023, 270, 126894. [Google Scholar] [CrossRef]
  21. Mack, L.; Biswas, G.; Koutsoukos, D.; Mylaraswamy, D. Learning bayesian network structures to augment aircraft diagnostic reference models. IEEE Trans. Autom. Sci. Eng. 2016, 14, 358–369. [Google Scholar] [CrossRef]
  22. Ademujimi, T.; Prabhu, V. Fusion-Learning of Bayesian network models for fault diagnostics. Sensors 2021, 21, 7633. [Google Scholar] [CrossRef]
  23. Xiong, H.; Peng, Y.; Hu, Y.; Zhang, L.; Li, Y. Vibration fault signal analysis and diagnosis of flue gas turbine. Eng. Fail. Anal. 2022, 134, 105981. [Google Scholar] [CrossRef]
  24. Chen, G. Vibration modelling and verifications for whole aero-engine. J. Sound Vib. 2015, 349, 163–176. [Google Scholar] [CrossRef]
  25. Stephenson, T.A. An Introduction to Bayesian Network Theory and Usage; IDIAP: Martigny, Switzerland, 2000; Available online: https://infoscience.epfl.ch/handle/20.500.14299/227920 (accessed on 16 February 2025).
  26. Xu, J.-G.; Zhao, Y.; Chen, J.; Han, C. A structure learning algorithm for Bayesian network using prior knowledge. J. Comput. Sci. Technol. 2015, 30, 713–724. [Google Scholar] [CrossRef]
  27. Pei, B.; Shin, D.-G. Reconstruction of biological networks by incorporating prior knowledge into Bayesian network models. J. Comput. Biol. 2012, 19, 1324–1334. [Google Scholar] [CrossRef]
  28. Wu, Y.; Ren, Z.; Zeng, Z. Fault diagnosis method based on DS evidence theory. In Proceedings of the 2010 Prognostics and System Health Management Conference, Macao, China, 12–14 January 2010; pp. 1–4. [Google Scholar] [CrossRef]
  29. Sun, J.; Zuo, H.; Liang, K.; Chen, Z. Bayesian network-based multiple sources information fusion mechanism for gas path analysis. J. Propuls. Power 2016, 32, 611–619. [Google Scholar] [CrossRef]
  30. Mirhosseini, A.M.; Adib Nazari, S.; Maghsoud Pour, A.; Etemadi Haghighi, S.; Zareh, M. Probabilistic failure analysis of hot gas path in a heavy-duty gas turbine using Bayesian networks. Int. J. Syst. Assur. Eng. Manag. 2019, 10, 1173–1185. [Google Scholar] [CrossRef]
  31. Zhou, D.; Huang, D.; Hao, J.; Wu, H.; Chang, C.; Zhang, H. Fault diagnosis of gas turbines with thermodynamic analysis restraining the interference of boundary conditions based on STN. Int. J. Mech. Sci. 2021, 191, 106053. [Google Scholar] [CrossRef]
  32. Diakunchak, I.S. Performance deterioration in industrial gas turbines. J. Eng. Gas Turbines Power 1992, 114, 161–168. [Google Scholar] [CrossRef]
  33. Li, Y.G. Gas turbine performance and health status estimation using adaptive gas path analysis. J. Eng. Gas Turbines Power 2010, 132, 041701. [Google Scholar] [CrossRef]
  34. Hadroug, N.; Hafaifa, A.; Alili, B.; Iratni, A.; Chen, X. Fuzzy diagnostic strategy implementation for gas turbine vibrations faults detection: Towards a characterization of symptom–fault correlations. J. Vib. Eng. Technol. 2021, 10, 225–251. [Google Scholar] [CrossRef]
  35. Saadat, B.; Kouzou, A.; Hafaifa, A.; Guemana, M. Gas Turbine Supervision Based on Vibration Analysis and Measurement: Gas Compression Station Investigation. In Advances in Technical Diagnostics, Proceedings of the 6th International Congress on Technical Diagnostic, ICDT2016, Gliwice, Poland, 12–16 September 2016; Springer: Berlin/Heidelberg, Germany, 2018; pp. 1–14. [Google Scholar] [CrossRef]
Figure 1. Multi-source information fusion diagnosis method.
Applsci 15 05083 g001
Figure 2. Model-based GPA method.
Applsci 15 05083 g002
Figure 3. The sectional structure diagram of the turbofan engine.
Applsci 15 05083 g003
Figure 4. The speed of the turbofan engine. (a) The relative value of  N 1 . (b) The relative value of  N 2 .
Applsci 15 05083 g004
Figure 5. The vibration amplitude of the four measuring points. (a) Amplitude of the measuring point  V 11 . (b) Amplitude of the measuring point  V 12 . (c) Amplitude of the measuring point  V ic 1 .  (d) Amplitude of the measuring point  V ic 2 .
Applsci 15 05083 g005
Figure 6. The results of the degradation of each component. (a) Fan degradation; (b) low-pressure compressor degradation; (c) high-pressure compressor degradation; (d) high-pressure turbine degradation; (e) low-pressure turbine degradation.
Applsci 15 05083 g006
Figure 7. Bayesian network structure.
Applsci 15 05083 g007
Table 1. Description of gas path fault features.
Gas Path Fault FeaturesDescription
DEFEfficiency degradation of fan
DGFFlow rate degradation of fan
DEHCEfficiency degradation of high-pressure compressor
DGHCFlow rate degradation of high-pressure compressor
DELCEfficiency degradation of low-pressure compressor
DGLCFlow rate degradation of low-pressure compressor
DEHTEfficiency degradation of high-pressure turbine
DGHTFlow rate degradation of high-pressure turbine
DELTEfficiency degradation of low-pressure turbine
DGLTFlow rate degradation of low-pressure turbine
Table 2. Information of vibration measurement points.
Symbolic MeaningSymbolic Representation
Vibration measurement point 1 of the bearing housing   V 11
Vibration measurement point 2 of the bearing housing   V 12
Vibration measurement point 1 of the intermediate case   V ic 1
Vibration measurement point 2 of the intermediate case   V ic 2
Table 3. The prior probability setting of the parent nodes.
ComponentNodeStates
0 (Healthy)1 (Faulted)
FanA10.970.03
HPCA20.990.01
HPTA30.990.01
Table 4. Child nodes’ probability distribution settings.
Fault FeatureWithout Prior KnowledgeWith Prior Knowledge
A1 = 0A1 = 1A1 = 0A1 = 1
VicN(0, 0.5)N(220, 0.5)N(0, 0.8)N(220, 0.01)
DGFN(0, 0.5)N(−0.05, 0.5)N(0, 0.8)N(−0.05, 0.01)
Disclaimer/Publisher’s Note: The statements, opinions and data contained in all publications are solely those of the individual author(s) and contributor(s) and not of MDPI and/or the editor(s). MDPI and/or the editor(s) disclaim responsibility for any injury to people or property resulting from any ideas, methods, instructions or products referred to in the content.

