Article

Vibration Characteristics Analysis and Structural Optimization of a Volute-Less Centrifugal Fan Frame

1
College of Vehicle and Traffic Engineering, Henan University of Science and Technology, Luoyang 410305, China
2
Corporation of Zhejiang Yilida Ventilator Co., Ltd., Taizhou 331004, China
*
Authors to whom correspondence should be addressed.
Appl. Sci. 2025, 15(9), 5069; https://doi.org/10.3390/app15095069
Submission received: 10 March 2025 / Revised: 27 April 2025 / Accepted: 28 April 2025 / Published: 2 May 2025

Abstract

:
This paper uses modal analysis and harmonic response analysis to study the vibration characteristics and vibration response of the frame of a volute-less centrifugal fan. The accuracy of the finite element model is verified by comparing the experimental results with the numerical simulation results. Our focus is on the resonance behavior of the fan frame under the maximum operating conditions. Therefore, the structural parameters are taken as design variables, and the maximum axial amplitude at 2600 rpm and its corresponding axial modal frequencies are taken as target parameters for research. A combination of response surface methodology and multi-objective optimization is used to optimize the structure parameters and solve for the Pareto solution set. Three feasible solutions were selected to verify the method’s accuracy. The results show that the optimized fan frame structure enhances the axial modal frequencies to 52.3 Hz, reflecting a 24% improvement over the baseline. Furthermore, we reduce the maximum vibration velocity at resonance to 2.15 mm/s, effectively minimizing vibration responses and preventing excitation and resonance issues at peak speeds.

1. Introduction

Fans are power equipment used to transport gases. They are widely used in fields such as the national economy, chemical industry, medical care, power, and civil construction. As a ventilation device, the octave frequency excitation generated when the fan operates surely triggers vibration. A resonance phenomenon will occur when the fan’s excitation frequency approaches the structure’s modal frequency. In general, resonance is harmful to the structure because resonance causes friction in the fan casing [1,2], structural looseness, and fatigue failure, leading to safety accidents and generating issues such as abnormal noise. It is necessary to reduce structural vibration, ensuring the safety and reliability of the equipment through design optimization.
Many scholars have found in the study of structural vibration that resonance is the main cause of abnormal structural vibration. Researchers typically conduct experimental tests to analyze the vibration characteristics of the structure [3]. This analysis is of great help for vibration research and vibration reduction design. The common method of vibration reduction design is to strengthen the structure, increase the stiffness and modal frequencies of the structure, avoid the resonance range, and achieve vibration reduction. Guo et al. [4] investigated the effects of different rib forms on the vibration characteristics of cantilever plates. The results indicate that the presence of ribs increases the torsional stiffness of the structure. However, different forms of ribs have different effects on the quality and stiffness of the structure. Ngu [5] investigated axial vibration suppression in fan wall structures by implementing fixed beams on wall surfaces and incorporating additional fixed constraints on cantilever components. The results indicate that reinforcing the cantilevered structures, setting a wall thickness of 3 mm, and installing elongated crossbeams suppressed maximum axial structural vibrations significantly. Yumurtacı et al. [6] demonstrated that relief processes on motor mounting frames significantly improved modal frequencies, with frequency enhancement correlated to the relief’s height but independent of feature density. Modal analysis shows that under uniform height constraint, the modal frequencies of free-form relief configuration are 15–20% higher than that of regular geometry (trapezoid, circle, etc.).
The reinforcement designs of structures have limited effectiveness in enhancing frequency and cannot be applied to some specific components. Many scholars have designed structures through topology optimization. Unlike strengthening the structure, topology optimization eliminates unnecessary parts without affecting the structure’s mechanical properties, reducing the structure’s mass while increasing the modal frequency. Talay et al. [7] conducted topology optimization on the installation frame, industrial design, and fabrication of the optimized structure. After optimization, the first natural frequency of the structure increased by 10.2%, and the mass decreased by 37%, indicating that the optimization potential of the load-bearing components was not fully exploited. Castro et al. [8] have topologically optimized the structure whilst maintaining the shape of specific regions. This optimized design slightly increased the overall deformation but effectively reduced the deformation of specific regions, significantly increasing the structure’s natural frequency. This morphology preservation optimization method is useful for the design of specific engineering components. Yeşilçimen [9] researched the vibration of liquid storage systems and improved the system’s natural frequency through structural optimization of frames and beams. The analysis demonstrated that optimizing the support beams and frames increased natural frequencies by 78% and reduced random vibration amplitude. The structure’s lifespan enhanced from 242 to 2297 cycles. Ramesh et al. [10] achieved a 17.9% reduction in mass and a 2% reduction in vibration response by the lightweight design of the structure based on stress distribution, modal, and vibration response studies of the structure. The frame structure studied in this paper makes it difficult to make shape modifications due to the limitations of rotating components. These two methods are not applicable.
Some structures are unsuitable for modification and can only be analyzed in terms of their structural and damping materials. Structures made of different materials will show different modal frequencies. Therefore, without changing the shape of the structure, the modal frequencies of the structure will be significantly different from the excitation frequency to avoid resonance. Damping materials achieve a reduction in vibration response by absorbing vibration energy. Zhang et al. [11] studied the impact of the structure and material of compressor mounting frames on vibration. Their results indicated that the modal frequency of the mounting frame is greatly influenced by its structure. Additionally, overall vibration performance has improved under the combined effects of the structure and material. Naghate [12], Adkine [13,14], and their colleagues emphasized that substituting materials in specific structural components effectively modulates modal frequencies. A comprehensive analysis of the elastic damping mechanism has shown that viscoelastic damping materials can enhance the rate of amplitude attenuation and improve vibration response characteristics. However, these materials have a minimal impact on the modal frequency of the structure [15,16,17]. Although changing materials and damping has a good vibration reduction effect, it increases production costs.
The above scholars have researched vibration reduction through reinforcement design, topology optimization, and using different materials and damping. Some scholars have also studied the vibration characteristics of a single structure through parameter optimization methods [18,19,20,21]. However, the research difficulty has increased due to the complexity of the connection of structural components in the coupled system and the coupled vibration of multiple excitation sources. These challenges have resulted in a scarcity of studies within the current literature that explore the key factors affecting the structural vibration response and the interactions within the coupled system. Therefore, there is relatively little research on the vibration of the volute-less centrifugal fan frame. This paper focuses on the significant problem of axial resonance in fan frames, studies the fan frame coupling system’s vibration characteristics, and improves the fan frame’s vibration response through size optimization. A hybrid approach integrating finite element analysis (FEA) simulations and experimental measurements is implemented to characterize structural vibration behavior. Parametric modeling combined with response surface methodology (RSM) systematically analyzed the influence of structural parameters on vibrational performance. Subsequently, the structural search for excellent vibration characteristics is carried out using the multi-objective optimization method. The optimization results improved the vibration performance of the frame structure, reduced the vibration response, and avoided resonance under high-speed operating conditions. The optimization improves operational reliability and provides a theoretical basis for the structural design of a volute-less centrifugal fan frame.

2. Structural Description and Numerical Modeling

2.1. Frame Construction

The fan uses a DC brushless motor, and the centrifugal impeller has five blades. The volute-less centrifugal fan frame is used to install the whole machine, as shown in Figure 1. The connecting tube, connection block, and the motor plate are welded to form a cantilever structure for fixing the installation position of the motor and centrifugal impeller. The mounting plate connects the cantilever structure and fixes the whole. The current collector is connected to the installation base plate to improve airflow loss. The structural design was created using SolidWorks software 2020, and the finite element model was built and structurally analyzed using Ansys Workbench 2022R1.
The volute-less centrifugal fan typically operates within a rotational speed range of 1800–2600 rpm. According to Equation (1), it can be inferred that the excitation shaft frequency range is 30–43.3 Hz, where n is the rotation speed. The calculation method for blade passing frequency is to multiply the number of blades by the rotational speed shaft frequency, and the harmonic order is obtained by dividing the vibration frequency of the fan by the shaft frequency.
f = n 60
In practical application, the centrifugal impeller and the motor comprise all the excitation sources on the fan frame. The unbalanced force affects the low-frequency range, and the electromagnetic force affects the high-frequency range. When the fan runs, the excitation force is transmitted to the whole frame through the motor plate. The frame structure consists of components made from different materials: the connecting tubes are made of Q195 steel, while the motor plate, connection block, current collector, and mounting plates are made from SS400 steel. The properties of these materials are detailed in Table 1.

2.2. Static Analysis

When studying the vibration characteristics of the fan frame, the focus is on the vibration characteristics of the frame structure. The mass and rotational inertia of the motor and the centrifugal impeller produce a prestressing influence in the structural modal calculations, which cannot be ignored. So, the mass point is used to attach the mass characteristics to the frame [22,23] and is coupled at the frame connection position. The motor plate, connecting tube, and connection block are connected by welding, and welding points are used in the finite element model to simulate structural welding. The mounting plate, connection block, and current collector are connected by rigid bolts [24,25]. The fan frame is only subjected to gravity and provides fixed constraints on the installation holes of the base plate. The numerical model is defined as shown in Figure 2, where the x-axis is vertical, the y-axis is axial, and the z-axis is lateral.
According to Equation (2), the moment of inertia of the mass point can be calculated,
A = I x x I x y I x z I y x I y y I y z I z x I z y I z z
In Equation (2), A is the inertia tensor; I x x , I y y , and I z z are the moments of inertia. The non-diagonal values in the equation are changed to 0, and the diagonal matrix is calculated.
Static analysis of the structure can yield equivalent stress and total deformation results through post-processing. The fourth strength theory calculates the equivalent stress, and the equivalent stress σ must be less than the allowable stress σ of the material, where σ s is the yield strength, and γ s is the safety factor:
σ = 1 2 σ 1 σ 2 2 + σ 2 σ 3 2 + σ 3 σ 1 2 σ = σ s γ s
Tetrahedral mesh partitioning is performed in Workbench finite element calculations, and mesh independence is verified. In order to verify that the finite element model does not exhibit stress singularities, mesh independence verification was performed on the maximum equivalent stress, and the results are shown in Table 2.
According to Table 2, the results meet the accuracy requirements when the mesh number is 1,141,436.
The stress cloud map and deformation cloud map are shown in Figure 3. From Figure 3, it can be seen that the maximum equivalent stress is 48.5 MPa, and the maximum deformation is 0.75 mm. According to Equation (3), the safety factor is 4.8, and the strength meets the requirements.

2.3. Modal Analysis

As with other mechanical systems, the frame can be seen as a system with a constant of multiple degrees. This frame has the characteristics of an n-degree-of-freedom system, and the corresponding vibration control equation is represented by Equation (4):
M X ¨ + C X ˙ + K X = F
From Laplace transformation:
s 2 M + s C + K X s = F s
In Equations (4) and (5): M , C , and K denote the mass, damping, and stiffness matrices, respectively; X ¨ , X ˙ , and X represent the acceleration vectors, velocity vectors, and displacement vectors; F indicates the external force vector; X s corresponds to the displacement response in the Laplace domain. Such that s = j ω , the following is the case:
ω 2 M + j ω C + K ϕ q = F ω
In Equation (6), the orthogonality relation among the stiffness matrix K , mass matrix M , and vibration mode ϕ is satisfied; then, the vibration mode ϕ is reversible. After correlation transformation and independent decoupling the following is the case:
k i ω 2 M i + j ω C i q i = i = 1 n ϕ j i f i j = 1 , 2 , 3 , , n
Meanwhile, the response under l coordinate can be expressed as
X l = i = 1 n ϕ l i q i
The structural resonance of the fan is mainly manifested in the low-frequency domain, so the first six-order modal frequencies and corresponding modal vibration modes of the fan frame are extracted through modal analysis under prestress conditions, as shown in Table 3 and Figure 4. Notably, only the third-order 41.4 Hz falls within the shaft frequency excitation range among the first six modal frequencies.
The first and second vibration modes are caused by the cantilever structure of the connecting tube, which carries a large force and reduces its stiffness, resulting in the motor board and connecting tube translating together. The lateral constraint is weaker than the vertical constraint, so it exhibits lateral deformation first and then vertical deformation. Since both sides of the motor plate are constrained by the connecting tube, the third- and fifth-order vibration modes show the fluctuation state of the motor plate. It should be noted that the fan frame only fixes the mounting plate, so these six modes of vibration are caused by the cantilever structure.

2.4. Harmonic Response Analysis

During fan operation, the dynamic imbalance of the rotating components induces a time-dependent harmonic load with sinusoidal characteristics on the frame structure, significantly affecting its stability. By applying the predefined harmonic load to the support structure, we can determine the steady-state response of the frame under this load excitation [26,27]. Due to the small damping of the fan frame structure, the resonance frequency is like the modal frequency, and the axial modal frequency mentioned below is the axial resonance frequency.
The modal analysis reveals that the critical speeds corresponding to the modal frequencies of the frame structure are 700, 1100, and 2600 rpm. The excitation frequency spectrum of these three speeds is shown in Figure 5. Using the frequency spectrum data obtained from the excitation source vibration experiment as the load for harmonic response analysis, the vibration response was calculated within the range of 0~150 Hz, and the frequency velocity response curve was plotted, as shown in Figure 6. The results showed that the maximum amplitude occurred at 11.2 Hz laterally at 700 rpm, 17.9 Hz vertically at 1100 rpm, and 42.2 Hz axially at 2600 rpm, all exceeding 5 mm/s. These resonance frequencies are consistent with the first three modal frequencies.
The modal frequencies of the frame structure should be as far away from the shaft frequency excitation near 2600 rpm as possible to ensure the safe use of the structure. Therefore, the third-order modal frequencies should be greater than 43.3 Hz. From the modal vibration mode in Figure 4, it can be seen that the axial vibration modes appearing on the motor board are related to the constraints of the cantilever structure. Therefore, the axial modal frequencies can be increased by increasing the rigidity of the motor plate, connecting tube, and mounting plate to avoid the axial resonance caused by the highest speed. This method still needs to be validated and analyzed.

3. Vibration Experimental

The vibration test was conducted in the laboratory of the corporation Zhejiang Yilida Ventilator Co., Ltd. (Taizhou, China), which has obtained AMCA certification from the United States. A volute-less centrifugal fan’s frame and excitation source are tested using the electrical method. The experimental equipment apparatus comprised a data acquisition instrument from the China Orient Institute of Noise & Vibration (Beijing, China), a three-way vibration sensor, and DASP measurement and control v3.0 software for data acquisition and processing. The experimental equipment and parameters are in Figure 7 and Table 4.

3.1. Vibration Sweep Frequency Experiment of the Fan Frame

This experiment follows the vibration testing specifications specified in the international standard for the fan industry (ISO 14694:2003 [28]). It uses a cantilever installation configuration to fix the fan frame to the vibration test bench. The motor plate is selected as the vibration response monitoring point, and the layout plan of the vibration sensor is detailed in Figure 8a. Vibration testing was implemented in the speed range of 700–2600 rpm and the experimental dataset was recorded and standardized in real-time through a high-precision data acquisition system. Given that the structure exhibits significant resonance characteristics in the low-frequency domain, this study focuses on presenting the analysis results of vibration spectrum characteristics within the effective bandwidth to 200 Hz, as shown in Figure 8b–d.
As demonstrated in Figure 8b–d, experimental test results indicate the presence of resonance bands at 18.3 Hz in the vertical direction, 43.1 Hz in the axial direction, and 12.3 Hz and 63.8 Hz in the lateral direction. When the shaft frequency and resonance frequency of the speed are consistent, significant resonance is observed, and the transverse resonance at 63.8 Hz is due to the fifth harmonic. Despite the existence of harmonic order vibrations [29], their vibration response is negligible and can be disregarded. This finding suggests that shaft frequency excitation is the primary factor contributing to significant resonance.
Figure 8c shows how at 2600 rpm in the axial direction resonance has not yet reached the peak, and the amplitude has a clear tendency to continue to increase. To avoid this resonance phenomenon, the modal frequency of the structure should increase as much as possible.
As illustrated in Figure 9a, a comparison is made between the first six-order modal frequencies obtained from the finite element analysis and the resonance frequencies derived from the vibration experiment. Since the experimental tests were carried out while the wind turbine was in operation, the resonance phenomenon could not be shown because of the insufficient arrangement of the vibration test points or because the vibration speed was low. Therefore, these two resonance bands did not appear in the experimental results. When conducting further research, vibration tests will be conducted on other positions of the fan frame based on the modal analysis results to improve the study.
Figure 9b presents the error comparison between the harmonic response analysis results and the vibration experimental test results regarding the maximum vibration response at 700 rpm, 1100 rpm, and 2600 rpm. At 2600 rpm, there is a maximum harmonic amplitude error of 1.07 mm/s. The simulation analysis and experimental detection results are in good agreement, proving the simulation results’ reliability and providing a basis for fitting the response surface model.

3.2. Excitation Source Vibration Test

The excitation source of the volute-less centrifugal fan is derived from the motor and centrifugal impeller. The motor and centrifugal impeller are affixed to the test bench in a cantilever configuration, with the vibration measurement point strategically positioned at the bolt holes of the motor (where the motor is connected to the frame), as illustrated in Figure 10.
As demonstrated in Figure 11, the vibration of the excitation source is substantial at 300 Hz and 600 Hz, which can be attributed to resonance caused by electromagnetic excitation of the motor. The vibration acceleration increases with an increase in rotational speed and decreases with an increase in frequency. The excitation data of these rotational speeds serve as the foundation for the subsequent harmonic response analysis, providing a quantitative framework for understanding the system’s dynamic behavior.
As demonstrated in Figure 11a–c, the excitation experiment yielded findings that vibration excitation is relatively large in the low-frequency range. However, no substantiated vibration of the frame was observed within these frequency and speed ranges, indicating that the excitation did not induce significant forced vibration, and resonance had the greatest impact on the fan frame. As shown in Figure 11d, the vibration of the excitation source initially increases and subsequently decreases with the rise in rotational speed. This phenomenon can be attributed to the predominant vibration originating from the unbalanced force exerted by the centrifugal impeller.

4. Multi-Objective Optimization of Frame Structures

4.1. Design of Experiments

The frame structure is composed of interconnected components, and the size changes of each component have different effects on the modal and vibration response. Therefore, the thickness of the mounting plate P1, the inner diameter of the connecting tube P2, the outer diameter of the connecting tube P3, the height of the connecting tube P4, the outer diameter of the connection block P5, the thickness of the motor plate P6, and the width of the motor plate P7 were selected as the parameter variables of the design to study the correlation effects of each component parameter on the vibration characteristics. The range of the values is shown in Table 5. The inner diameter of connecting tube P2 in the variables is always smaller than the outer diameter of connecting tube P3.
The selection of spatial sample points employs the optimal spatial filling design [30,31,32] and is refined using Latin hypercube design [33,34]. Sample point sampling is shown in Figure 12.
The response surface model uses the Kriging method [35,36]. This method uses a predictive regression algorithm that combines a polynomial model with the biased form of a specific Gaussian process and correlates covariance with spatial features.
Y = μ + 1 2 π γ e x u 2 2 γ 2 f u d u
C Y , Y = C o v Z Y , Z Y
In Equation (9), Y represents the predicted value, μ denotes the average predicted value, γ represents the mutation parameter, f u corresponds to the Gaussian kernel function, and u represents the spatial point.
The analysis of variance to determine the lack of fit P between the design variables and the objectives, which are both less than 0.05, indicates that the fitting model has good fitness. The coefficient of determination R 2 and relative root mean square error R r determines the reliability of the Kriging response surface.
R 2 = 1 i = 1 n ( y i y ^ i ) 2 i = 1 n ( y i y ¯ i ) 2
R r = 1 n i = 1 n y i y ^ i y i 2
In Equations (11) and (12), y i is the value of the output parameter at the i-th sampling point, y ¯ i denotes the arithmetic mean of the values y i , y i ^ signifies the value of the regression model at the i-th sampling point, and n is the number of sampling points. The closer the coefficient of determination R 2 is to 1, the higher that the fitting response surface accuracy is; the smaller the relative root mean square error R r , the better the response surface.
The response surface model is fitted based on experimental design data and analyzes the optimization objectives. The coefficients of different optimization objectives are shown in Table 6. The coefficient of determination for all optimization objectives is greater than 0.9, and the relative root mean square error is within 10%, which indicates that the fitted response surface meets the accuracy requirements.

4.2. Response Surface Analysis

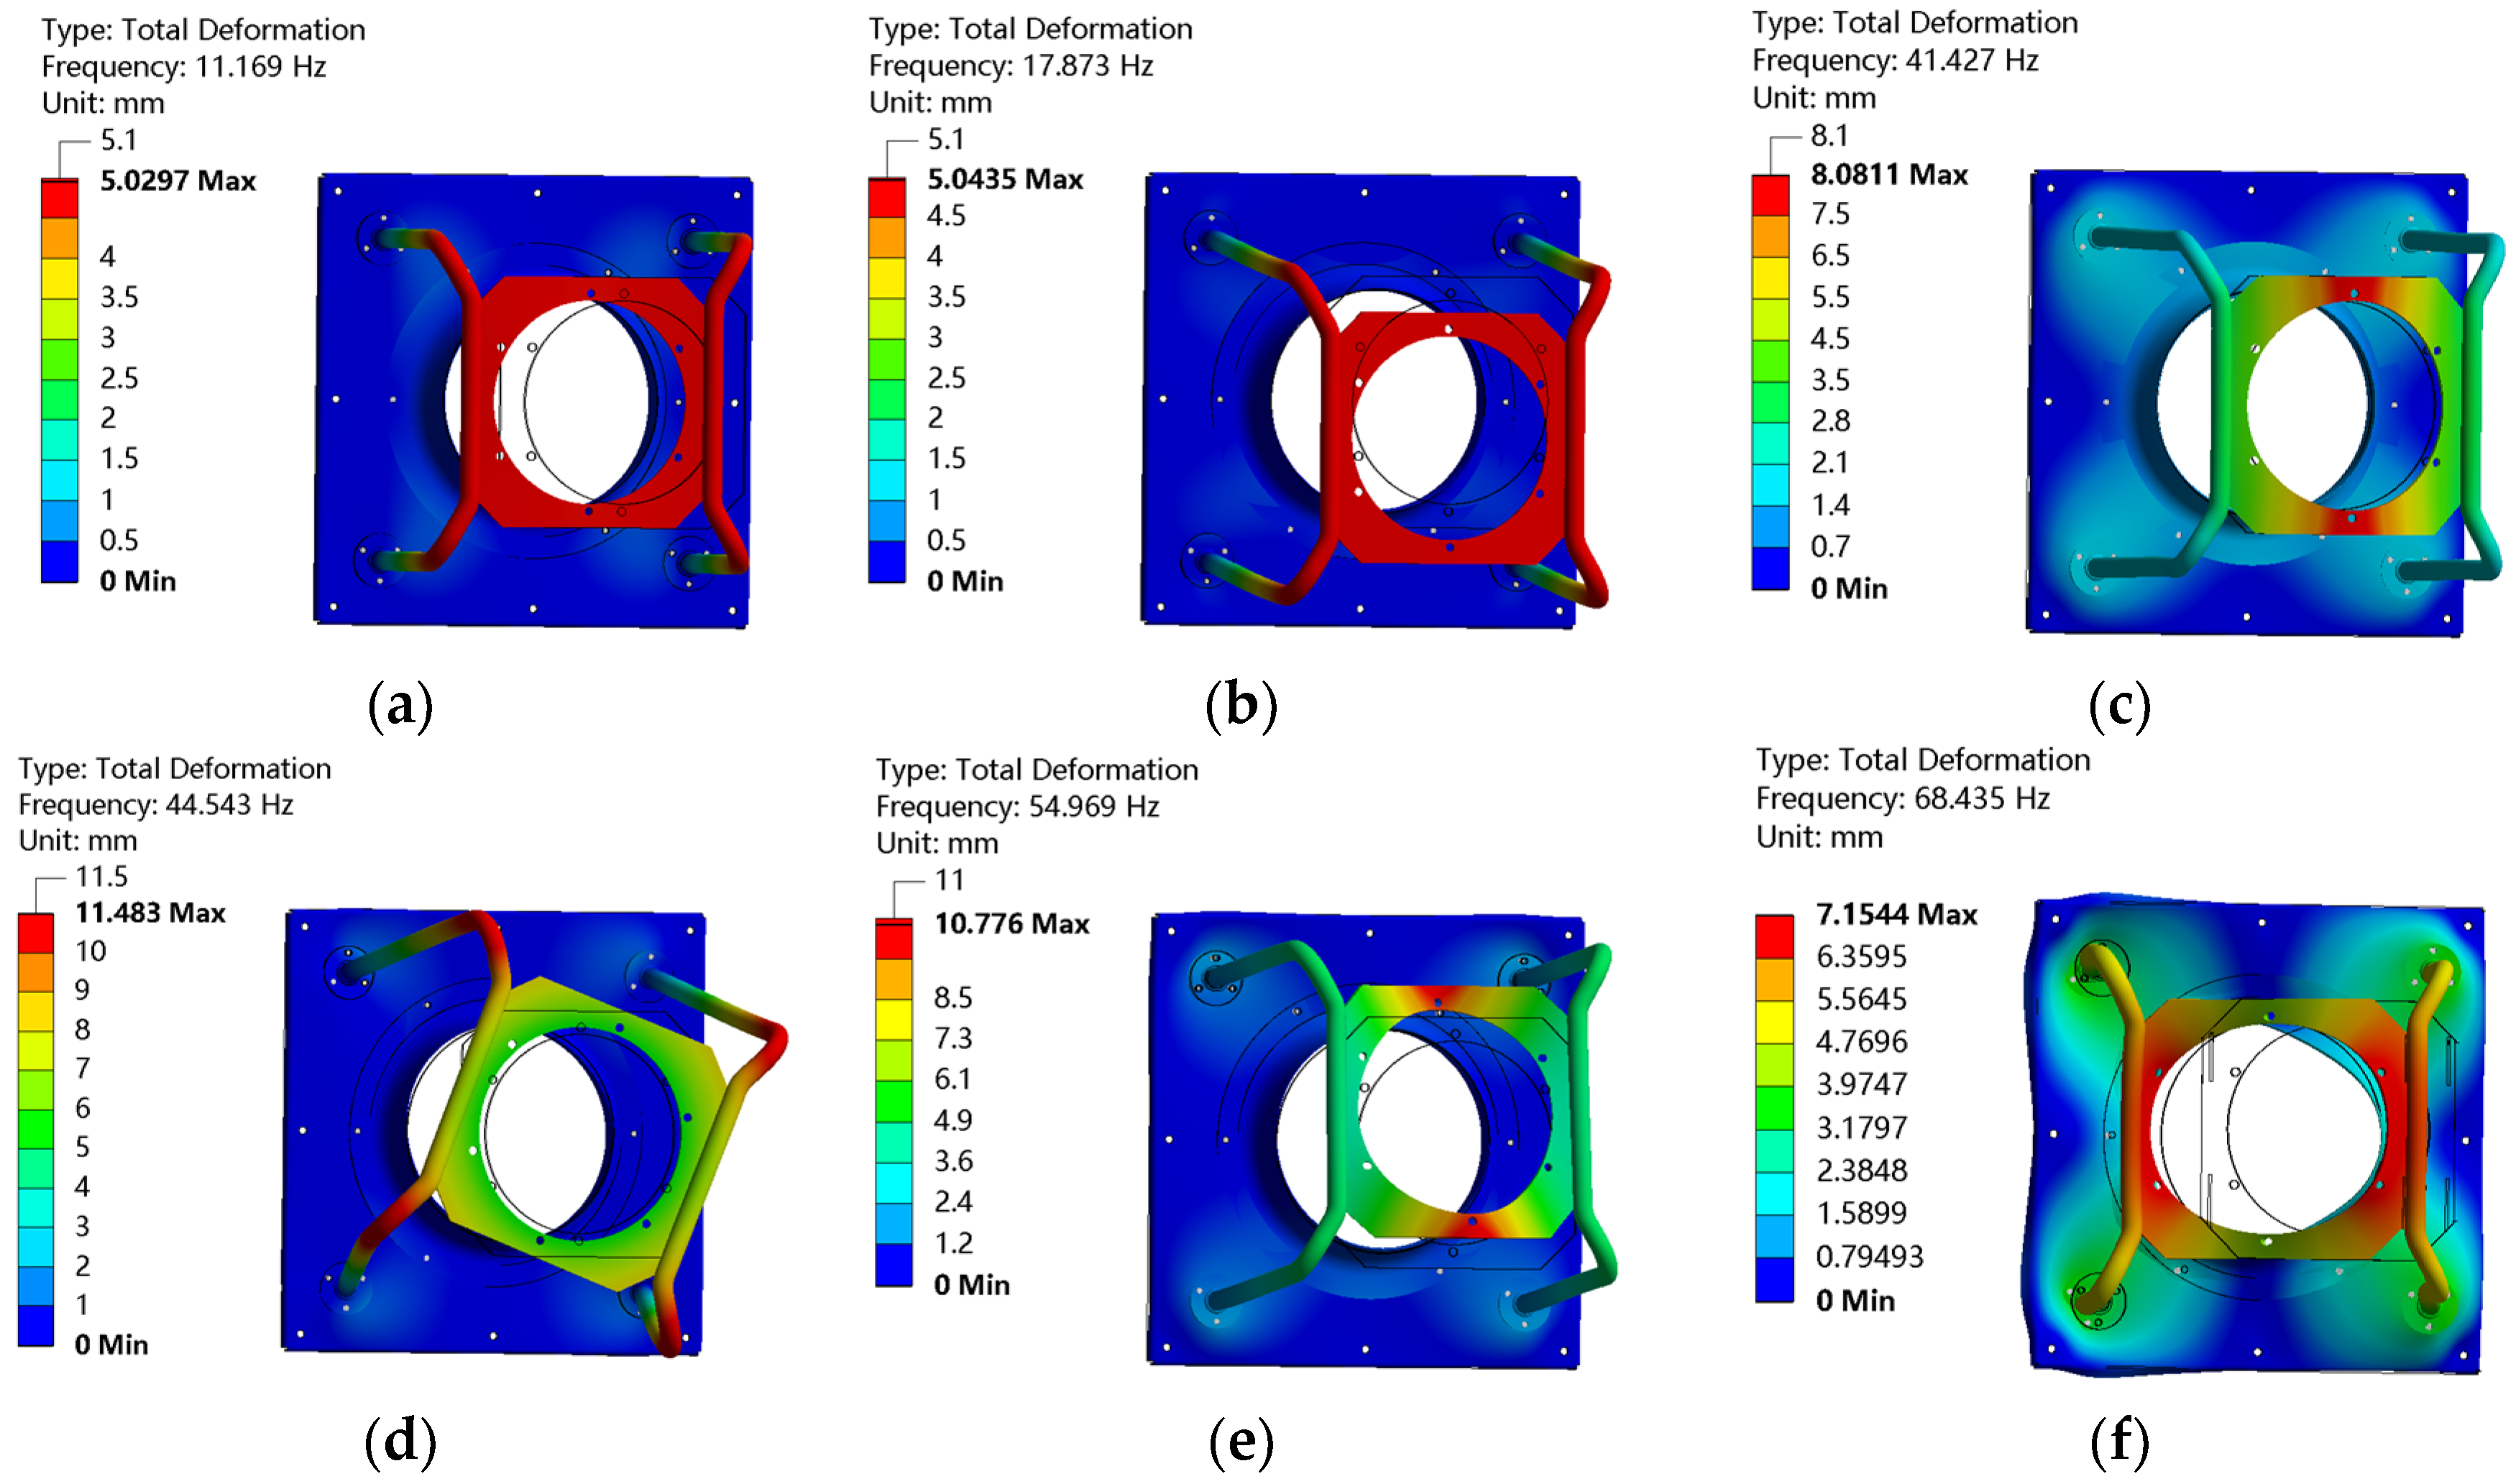
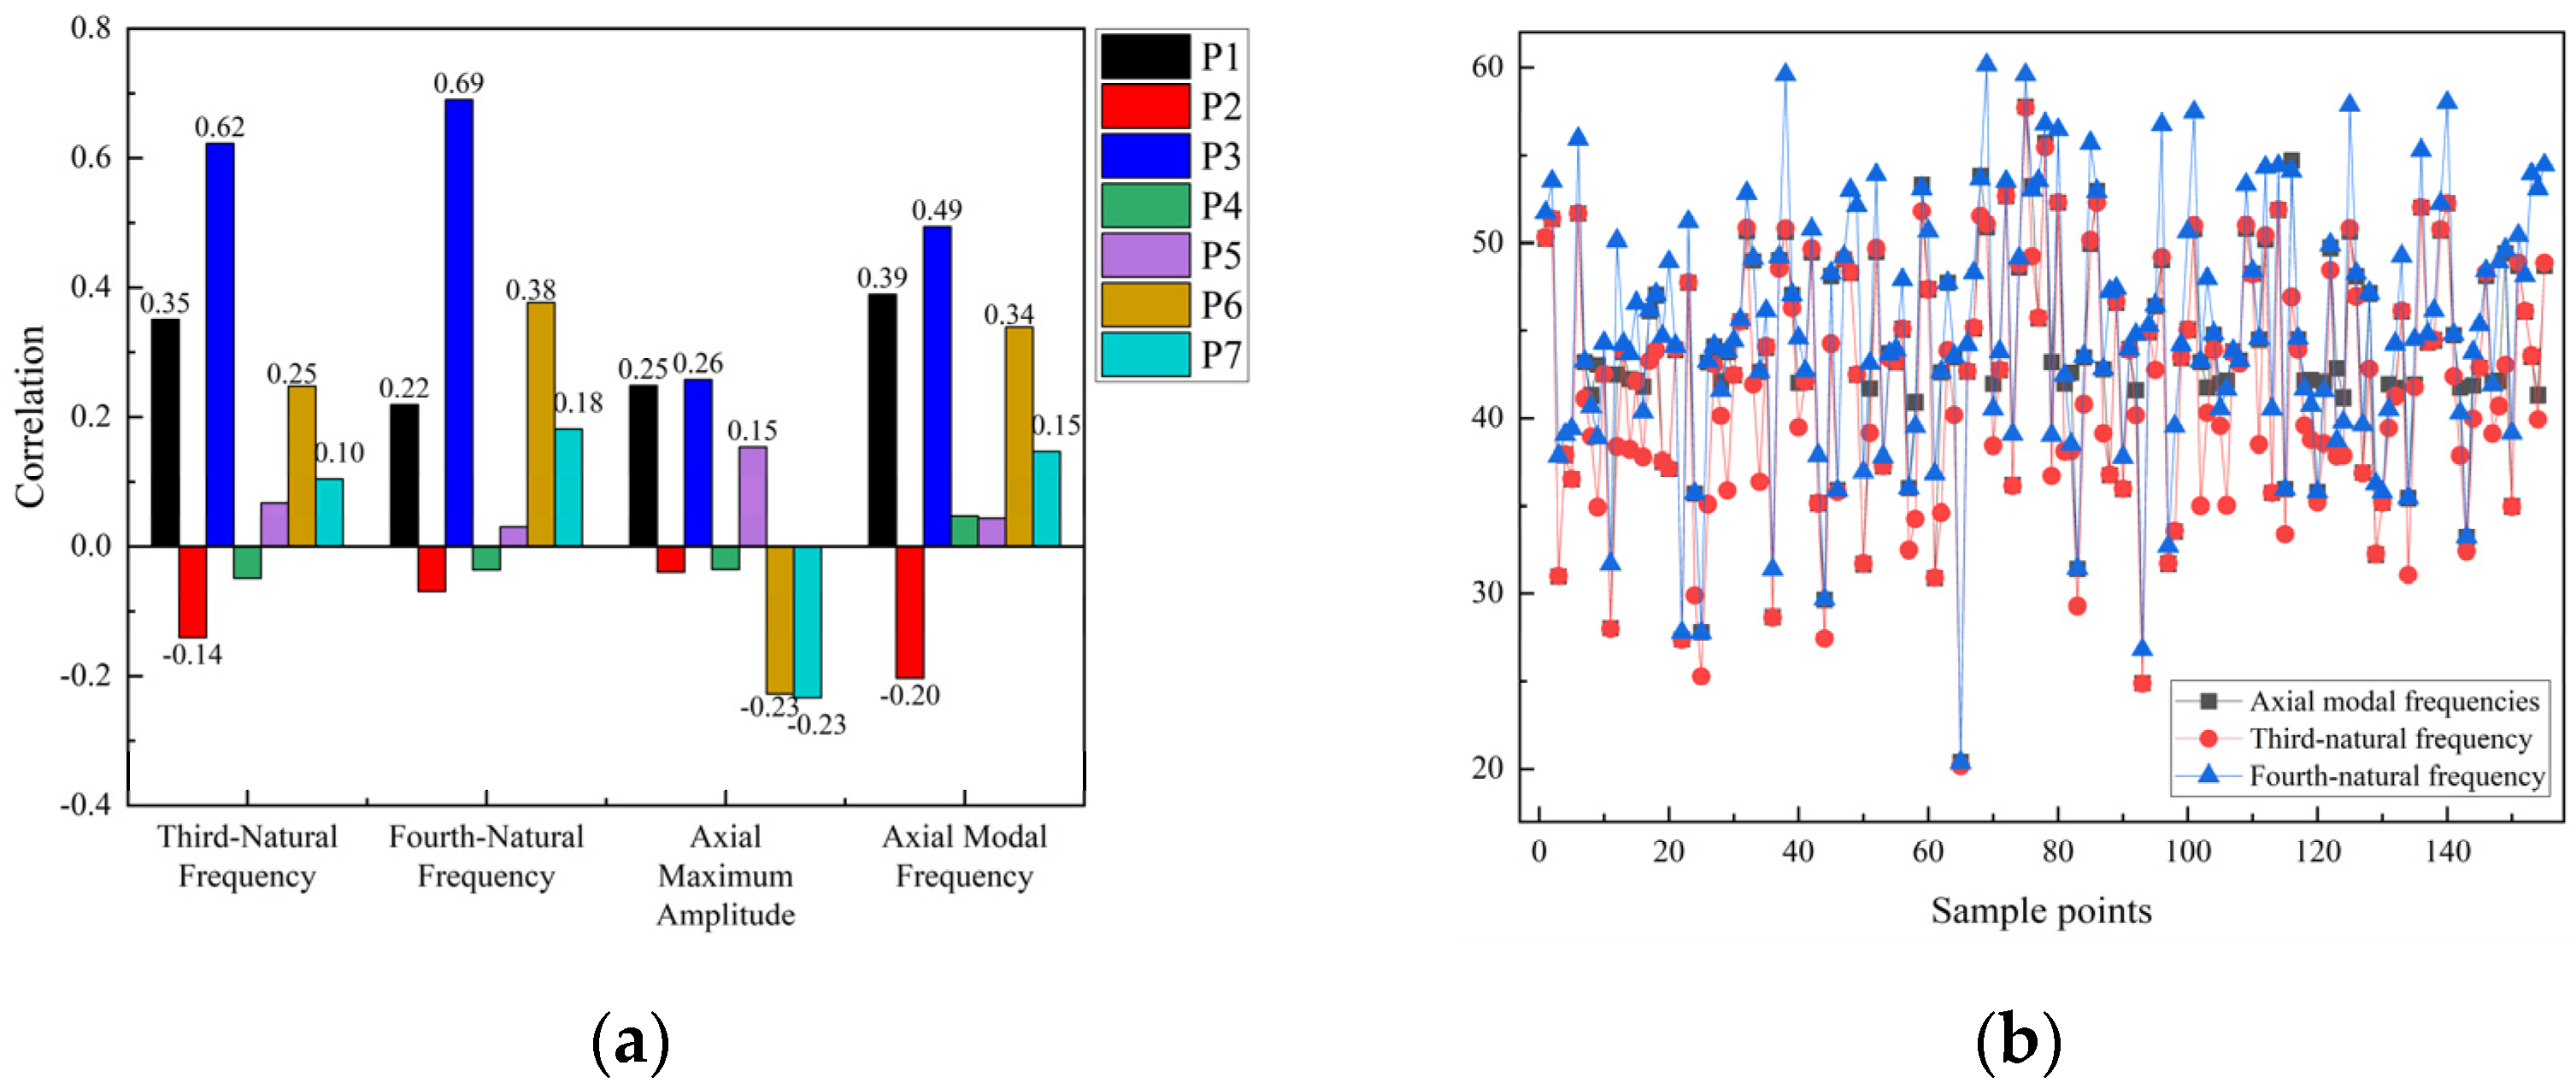
The results of the correlation analysis for the selected frame structure parameters, including their effects on the third-order modal frequency, fourth-order modal frequency, maximum axial amplitude, and corresponding axial modal frequency, are shown in Figure 13. As shown in Figure 13a, parameters P6 and P7 have a negative correlation with the maximum axial amplitude and a positive correlation with the axial modal frequency. It shows that increasing the thickness of the motor plate (P6) enhances the axial modal frequency and consequently reduces the axial vibration amplitude.
The test calculation shows that the axial modal frequencies are consistent with the third- or fourth-order modal frequencies, as shown in Figure 13b. Since the axial wave modes of different structures are consistent with the third- or fourth-order modal frequencies, the third-order modal frequencies can be increased to avoid shaft frequency excitation and reduce vibration response.
From the correlation, Figure 13a indicates that the mounting plate thickness P1, connecting tube inner diameter P2, connecting tube outer diameter P3, motor plate thickness P6, and motor plate width P7 are more correlated. So, four of them are selected for response surface analysis.
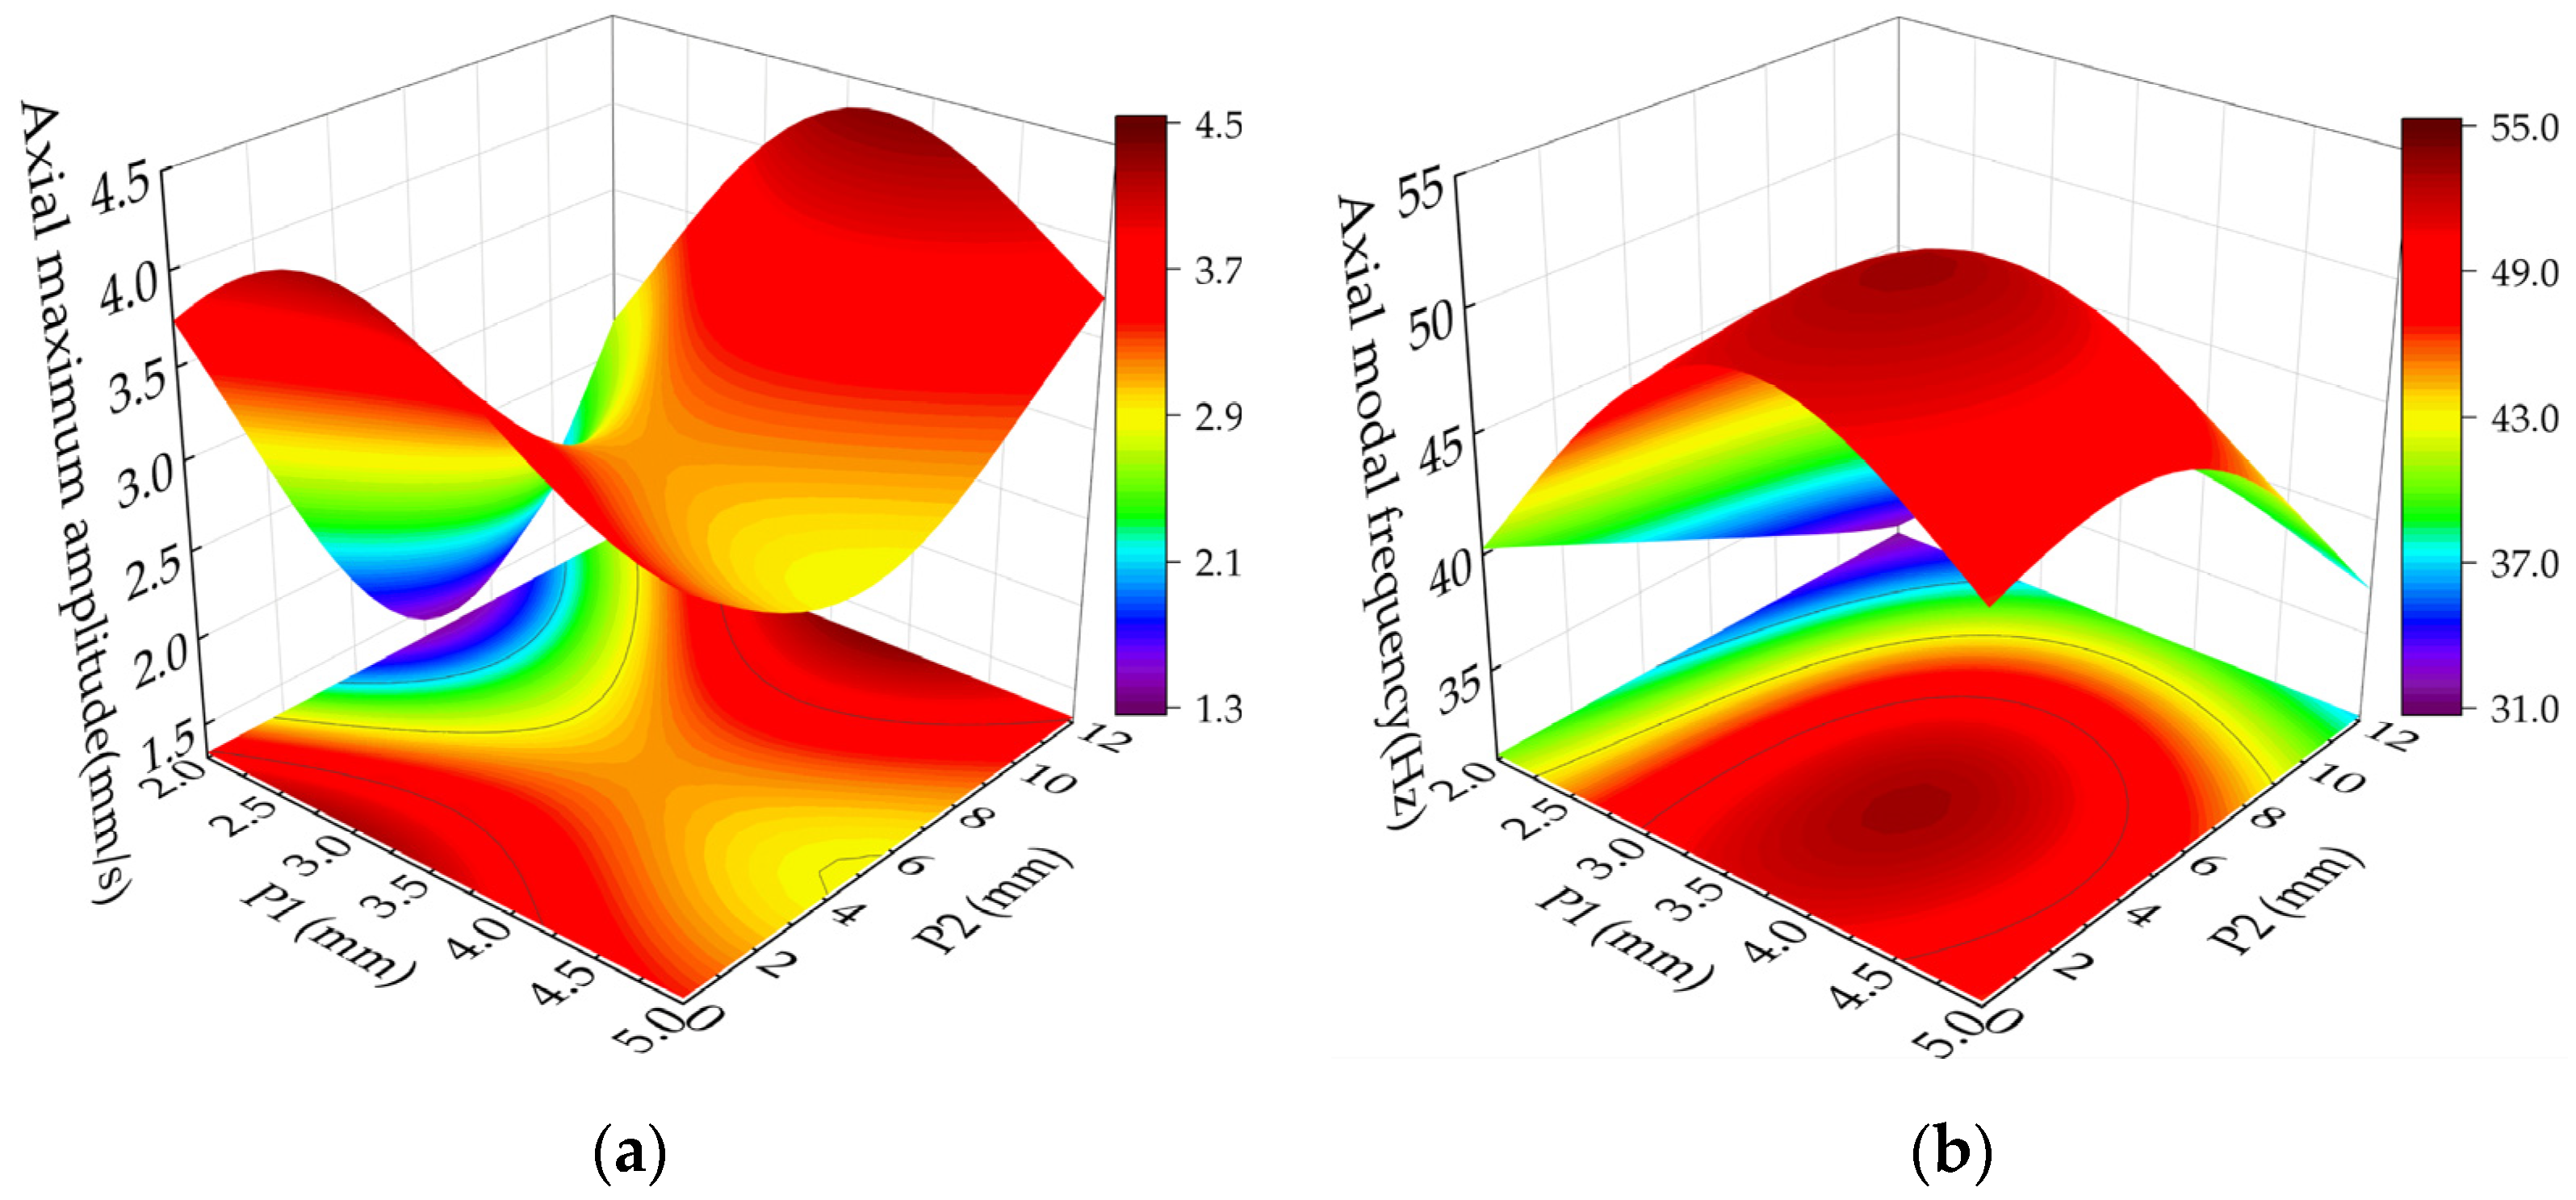
Figure 14 shows the response surface of the interaction between the mounting plate thickness P1 and the inner diameter of the connecting tube P2. Figure 14a shows that the maximum axial amplitude increases first and then decreases with the increase in the installation plate thickness P1. That is because the mounting plate thickness P1 increases, and the axial modal frequencies approach the excitation frequency, resulting in resonance. As the thickness of the mounting plate P1 continues to increase, the axial modal frequencies increase, and the difference between the excitation frequency increases, thereby hindering the ability to stimulate the resonance.
The inner diameter of the connecting tube P2 increases, and the axial maximum amplitude first decreases and then increases. That is because the connecting tube’s inner diameter P2 changes in the connecting tube with the quality of weakening the structural rigidity of the impact of the increase, and the axial modal frequencies increase. The connecting tube inner diameter P2 continues to increase, the connecting tube thickness is too small, resulting in a lack of stiffness, and the axial modal frequency decreases, increasing the maximum amplitude of the axial component.
As shown in Figure 14b, the axial modal frequencies first increase and then decrease with the increasing mounting plate thickness P1 and the inner diameter P2 of the connecting tube. That indicates that increasing the structure’s thickness has a limited effect on improving the rigidity.
Increasing the thickness of the components in the structure always increases the stiffness first, thus increasing the axial modal frequencies. Then, the influence of the mass on the structure increases so that the axial modal frequencies decrease.
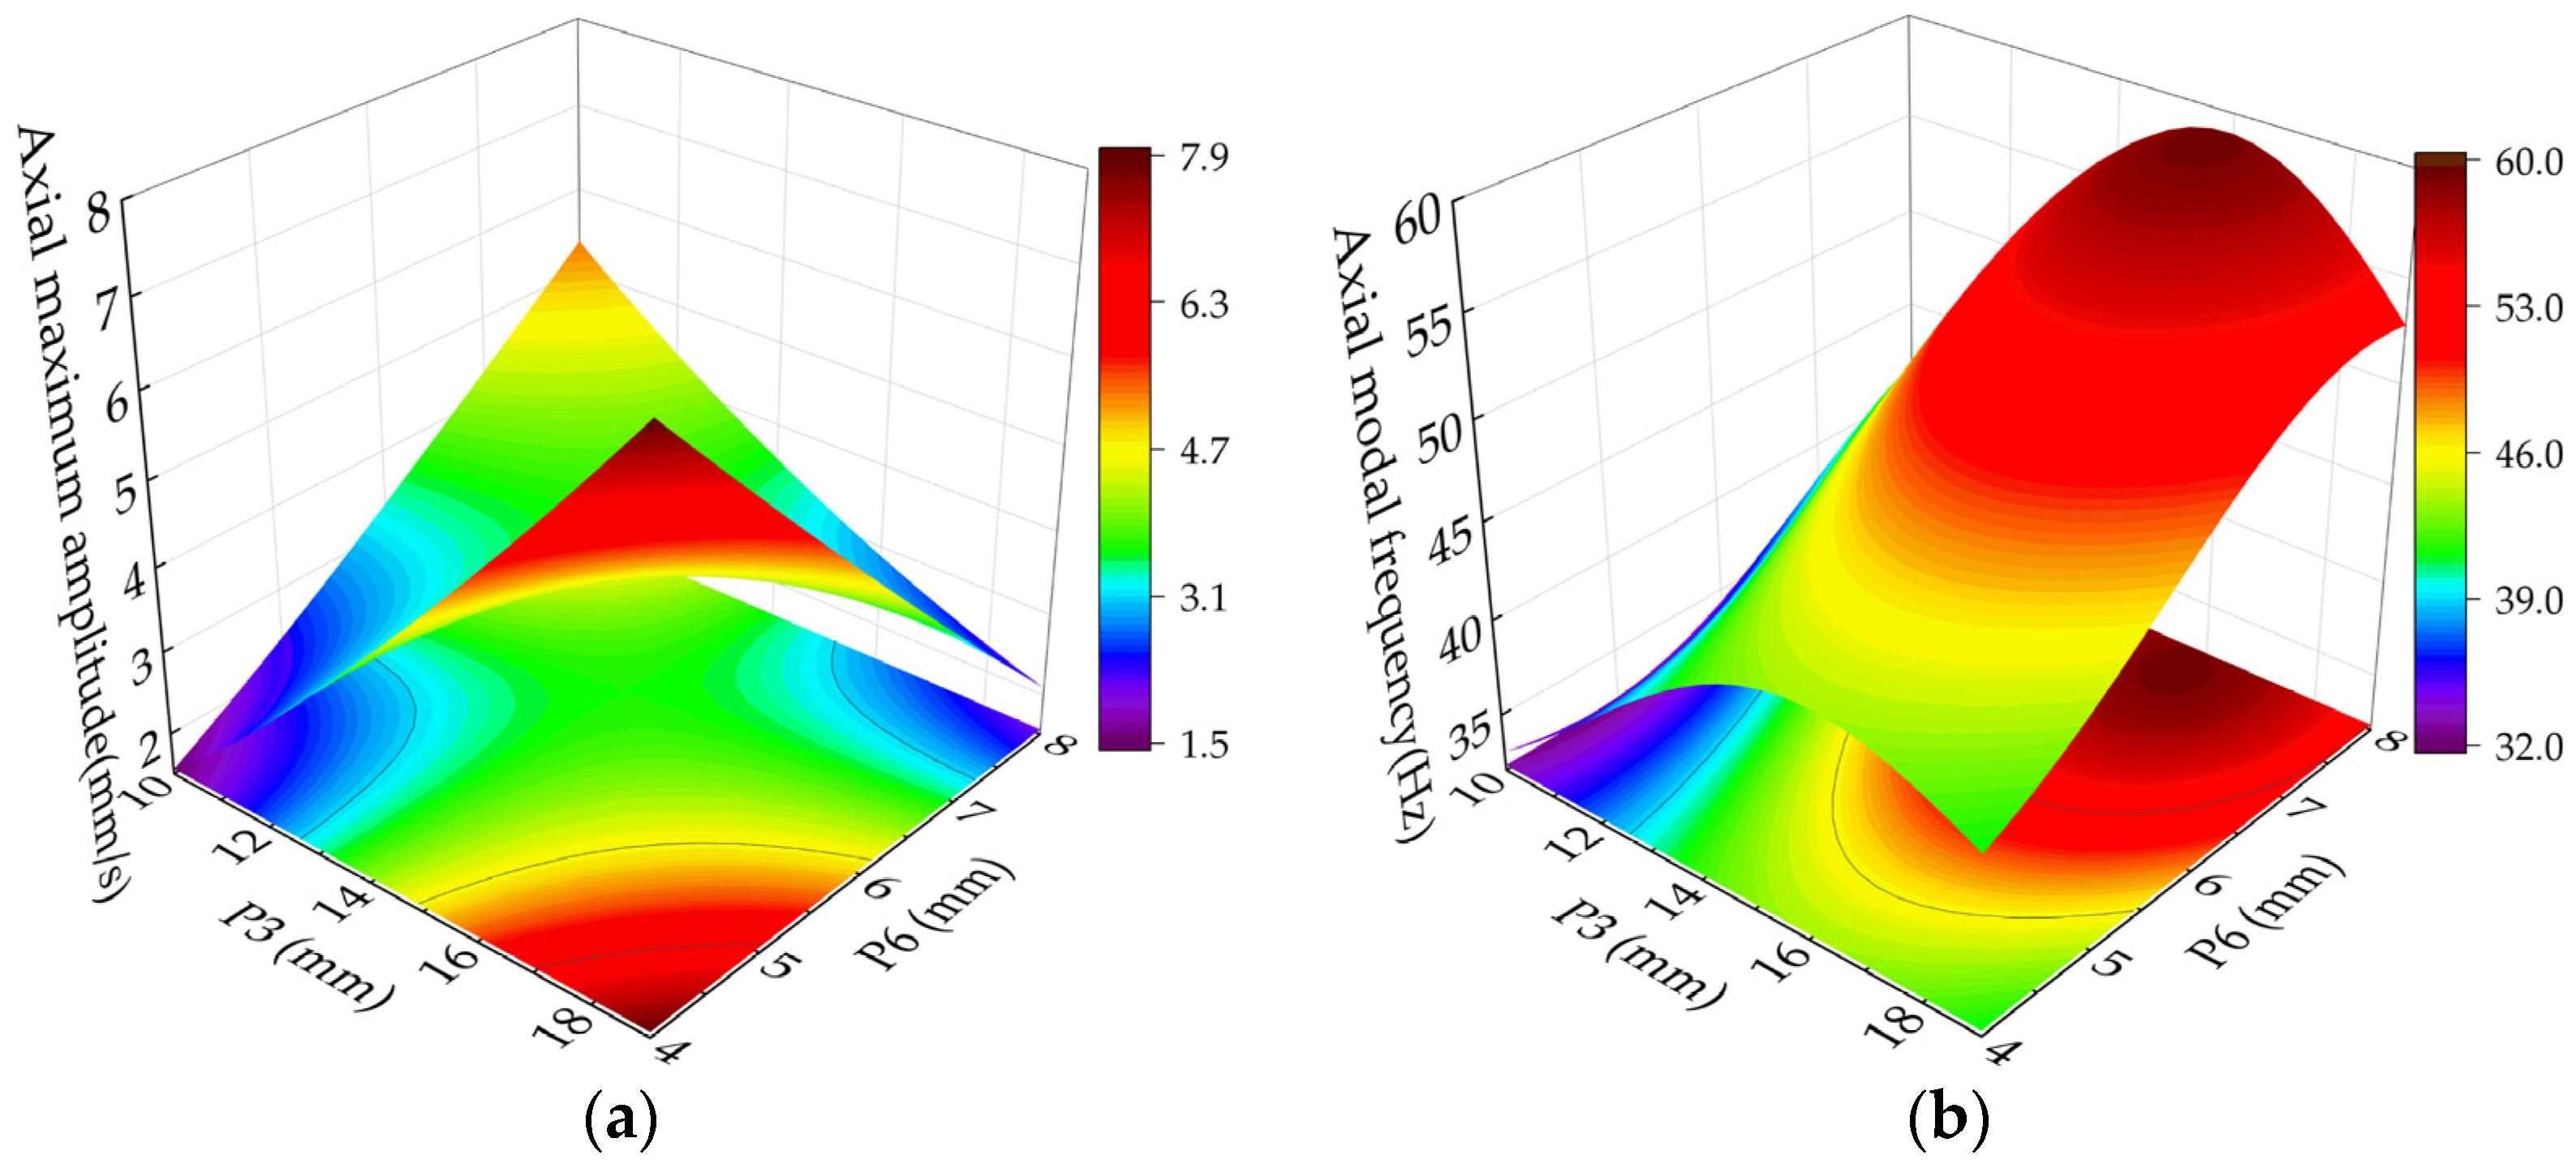
The relationship between the maximum axial amplitude with the outer diameter of the connecting tube (P3) and the thickness of the motor plate (P6) is illustrated in Figure 15a. When the motor plate thickness (P6) is small, the maximum axial amplitude increases rapidly with the increasing outer diameter of the connecting tube (P3). It is attributed to two factors: firstly, the axial modal frequency range of the structure remains close to the excitation frequency, leading to resonance phenomena. Secondly, as the outer diameter of the connecting tube (P3) increases, the stiffness of the motor board relatively decreases, which helps to excite axial resonance. This effect diminishes as the thickness of the motor plate (P6) increases.
With a sufficiently large motor plate thickness (P6), an increase in the outer diameter of the connecting tube (P3) results in a further difference between the axial mode frequency and the excitation frequency, preventing resonance. Consequently, the maximum axial amplitude decreases under these conditions.
From Figure 15b, the axial mode frequency increases initially and decreases as the connecting tube P3 increases. The thickness P6 of the motor plate increases, and the axial modal frequency increases monotonically. Compared with the outer diameter P3 of the connecting tube, the influence of the thickness P6 of the motor plate on the axial mode frequency is more visible. That is because the motor plate causes axial resonance.
From Figure 14 and Figure 15: (1) the contour curves in the axial modal frequency response surface diagram and axial maximum amplitude response surface diagram are elliptical, indicating that relevant parameters have strong interaction concerning the axial modal frequencies and the axial maximum amplitude. (2) Under interaction, the influence of any two variables on optimization objectives is nonlinear. (3) Resonance can be avoided if the difference between excited and modal frequencies outweighs 7 Hz.

4.3. Optimized Design

A multi-objective genetic algorithm (MOGA) [37] is employed to design the dimensions of a frame structure. The goal is to reduce the structure’s maximum axial amplitude and enhance axial modal frequencies. Additionally, the algorithm considers the maximum equivalent stress and maximum deformation, ensuring that these objectives remain within a safe range.
The multi-objective optimization model is represented as follows:
x min x x max , x D F x = min F 1 x , F 2 x , , F n x G i x 0 i = 1 , 2 , , m H i x = 0
In Equation (13), x is the design variable; x min and x max are the range of values for the design variables; F x is the optimization objective; D is the design space; G i x 0 and H i x = 0 are the i -th constraint inequality, which is used to determine the feasibility range of the optimal solution.
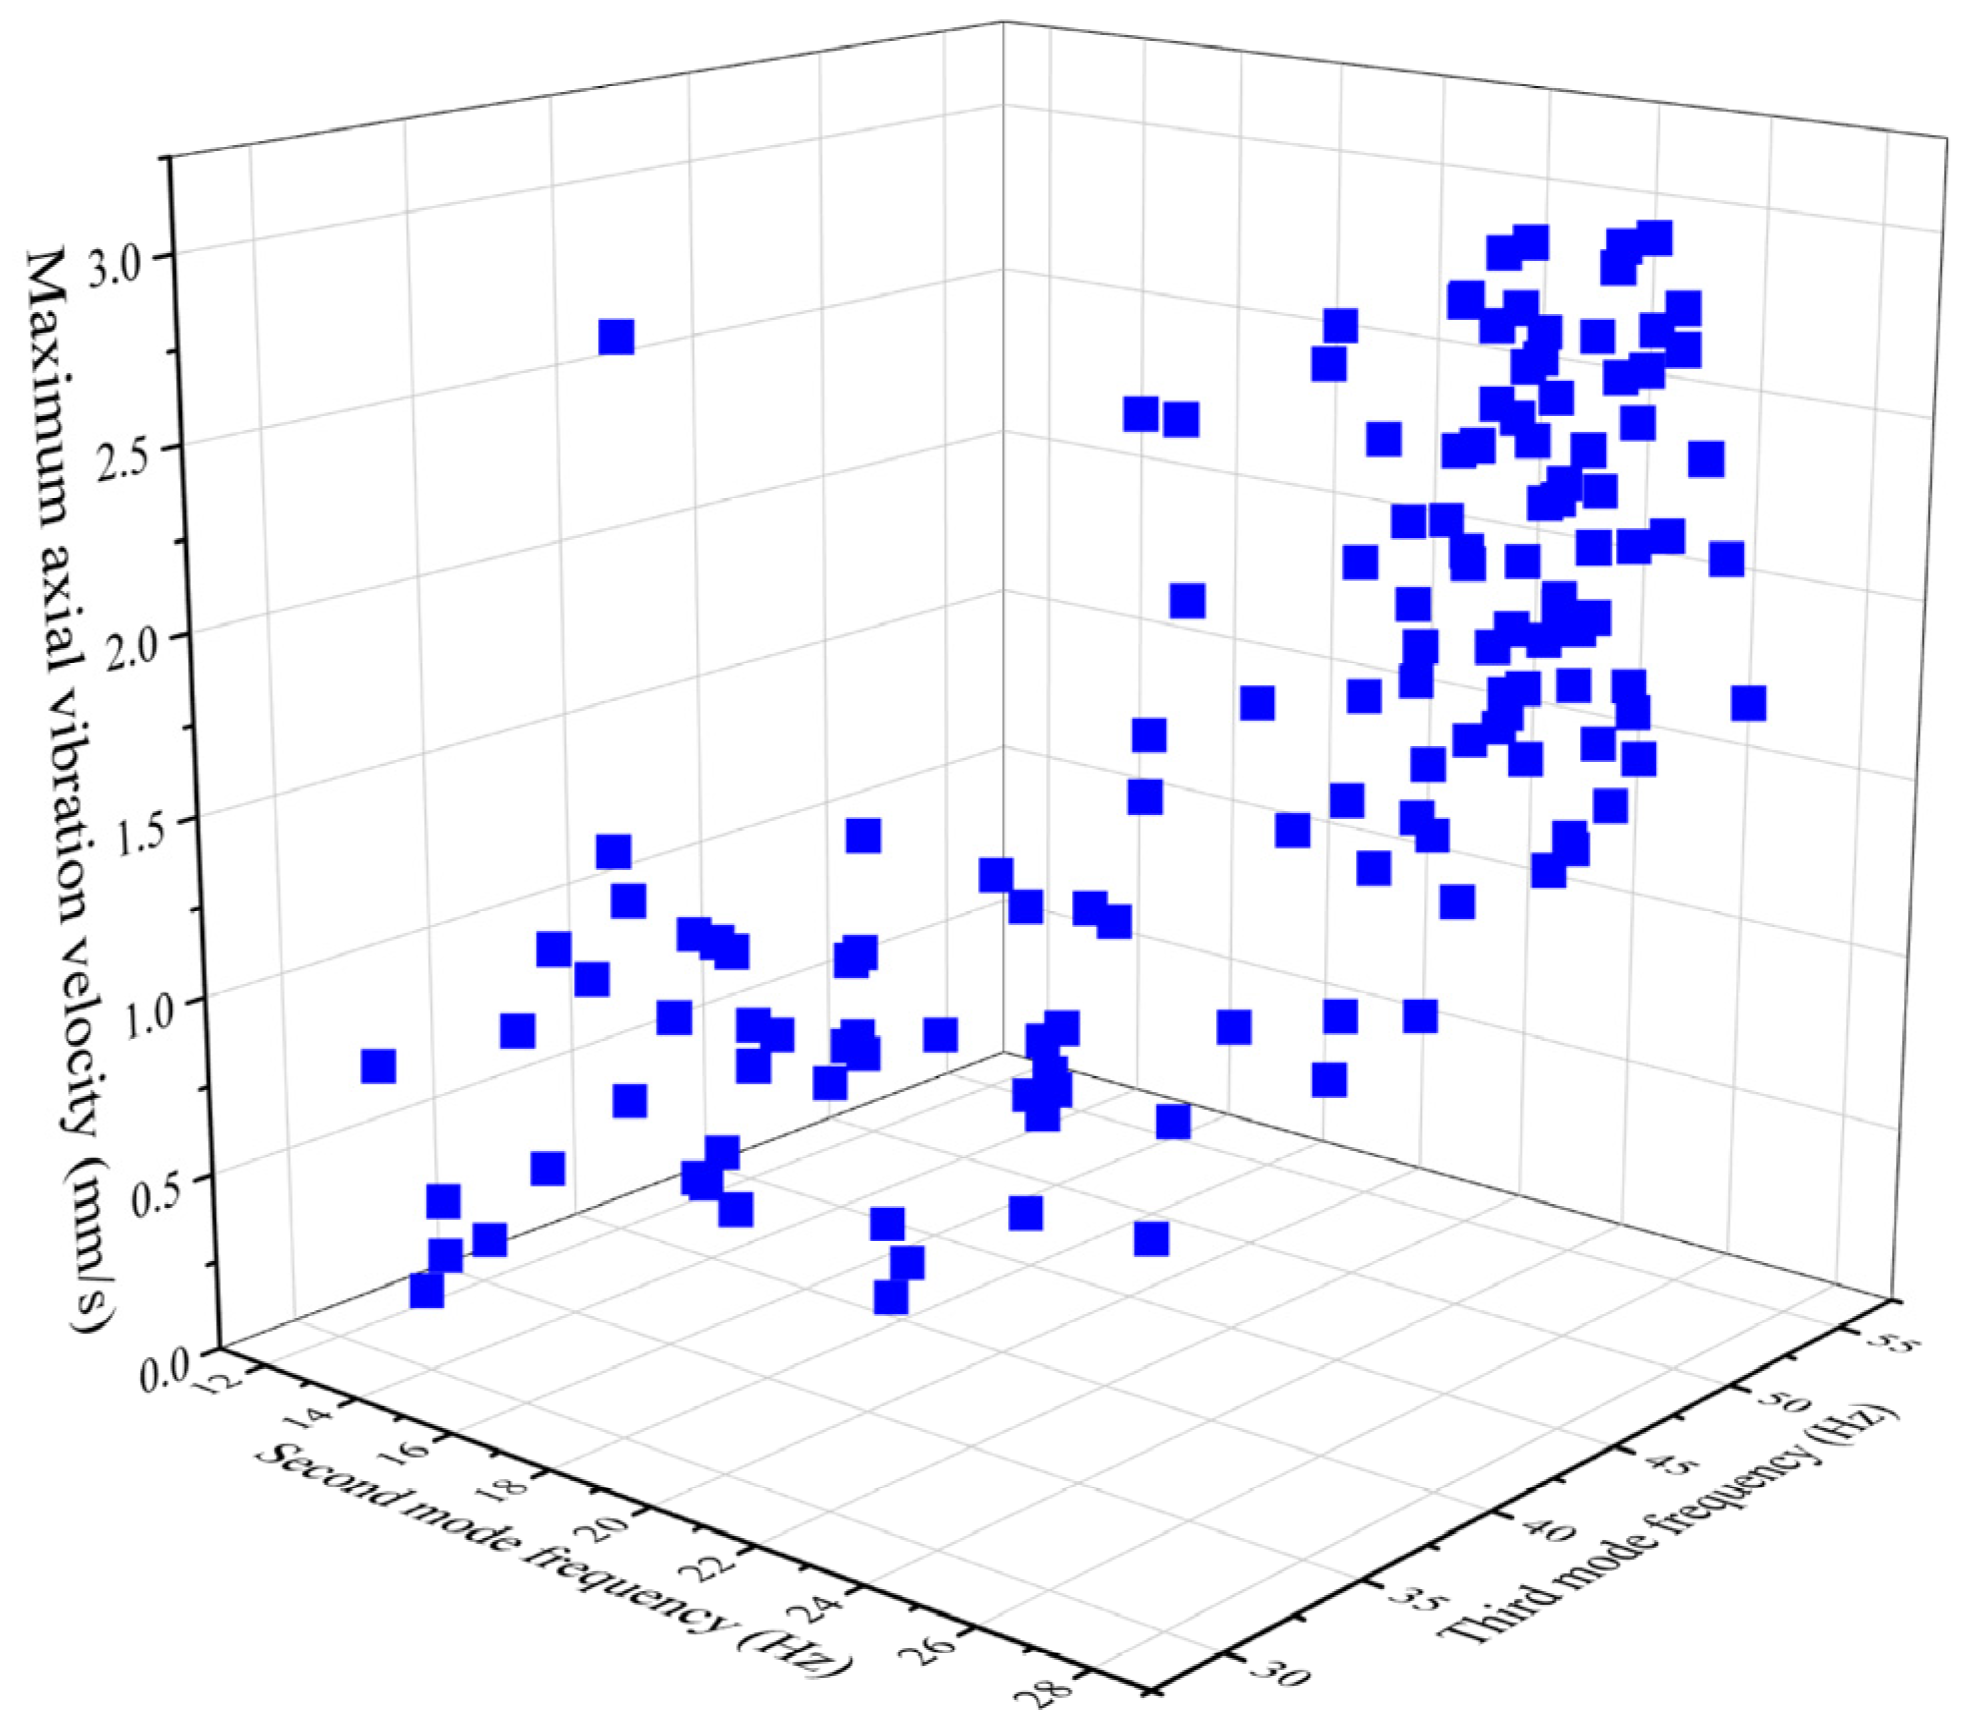
This paper constrains the structure size and provides an optimization target range. The priority of multi-objective optimization from top to bottom is vibration response, modal frequencies, maximum deformation, and maximum equivalent stress. The results show that both the maximum equivalent stress and maximum deformation are within the requirements for use. The Pareto solution set for maximum vibration response and modal frequency is shown in Figure 16.
Three groups of solutions satisfying the multi-objective optimization of frame structures are selected from the Pareto solution set, and the first- and second-order modal frequencies are required not to be within the operating shaft frequency range. The structural design variables and corresponding optimization results are presented in Table 7.
The comparison between the optimized predicted values and calculated verification values revealed that the maximum absolute error for the predicted maximum axial amplitude is 0.4872 mm/s, and the maximum absolute error for the predicted results axial modal frequency is 2.333 Hz. The results show that multi-objective optimization is effective for the vibration reduction design of fan frames. Both the maximum deformation and the maximum equivalent stress were increased, thus satisfying the structural strength requirements.

4.4. Optimization Results and Analysis

Considering the frame structure size, weight, and manufacturing cost, the third group of optimal solutions is selected for rounding processing, and the comparison results are shown in Table 8. There is no significant change in vibration characteristics before and after rounding, and they are within a reasonable range.
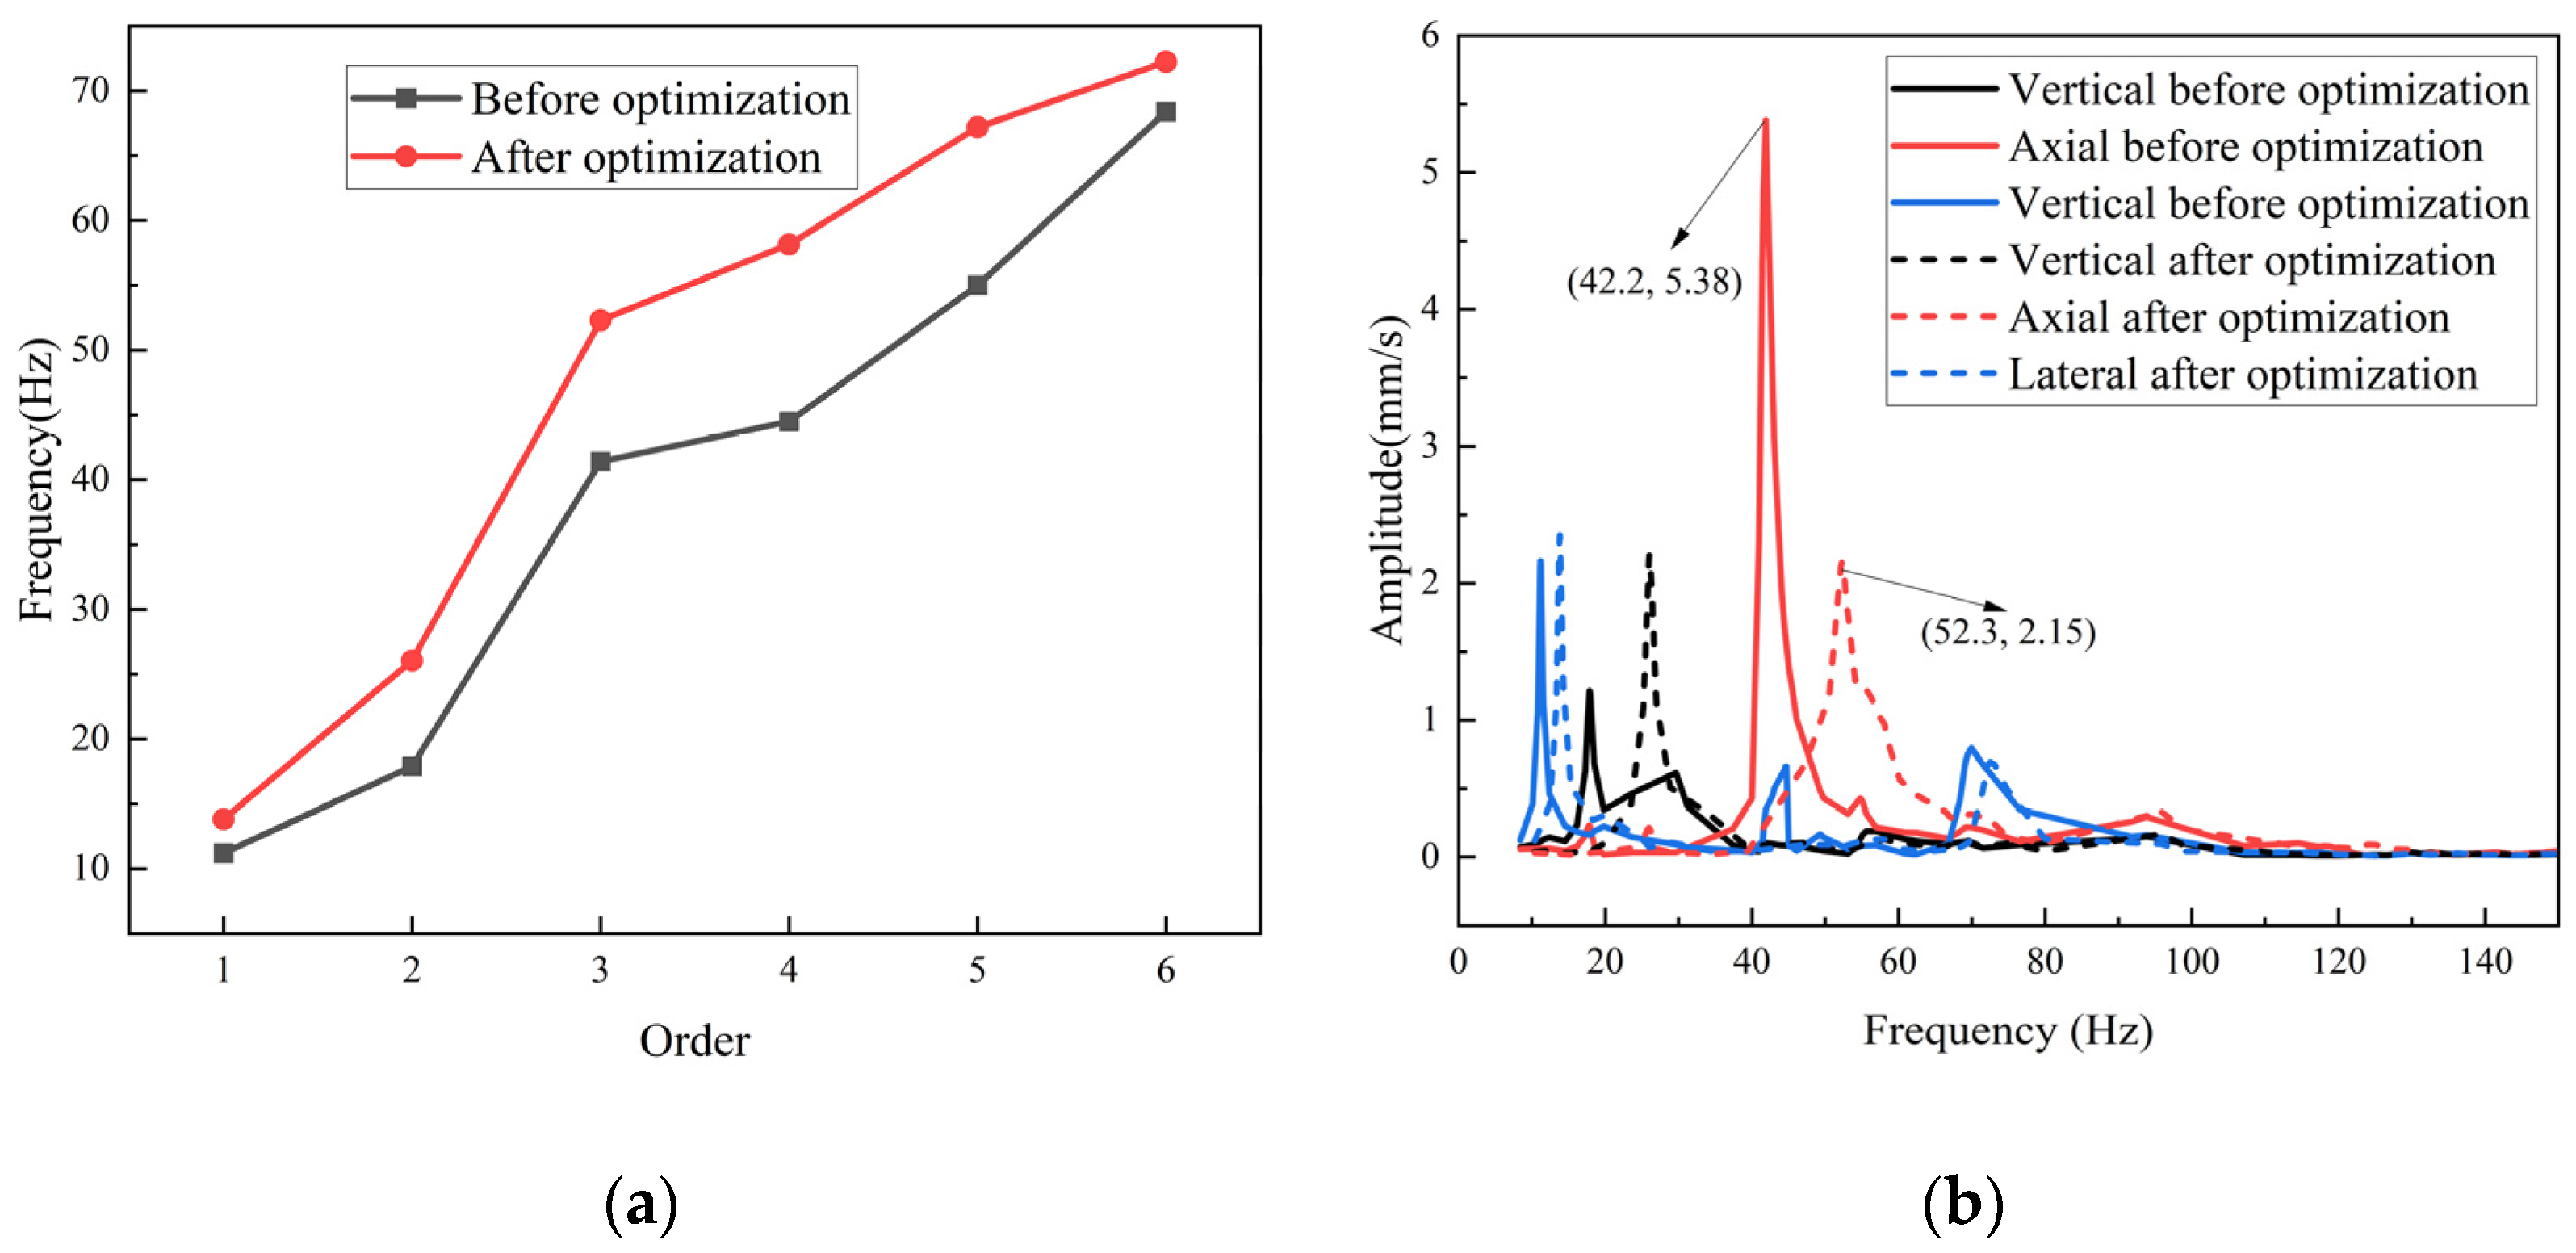
As can be seen from Figure 17, compared with the original model, the axial modal frequency and maximum axial amplitude of the frame structure after the round optimization are greatly optimized. The axial modal frequency (the third order) increased from 42.2 Hz to 52.3 Hz; at this time, the maximum axial amplitude decreased from 5.38 m/s to 2.15 mm/s, and the maximum three-way amplitude under this working condition is below 2.5 mm/s.
According to the “frequency ratio = modal frequency/excitation frequency” equation, the frequency ratio exceeds 1.2. Although the ideal vibration isolation condition is not reached, the amplitude can be effectively attenuated, indicating that structural optimization effectively improves the vibration characteristics of the frame. The maximum deformation and maximum equivalent stress vary greatly, and the structural strength meets the requirements.
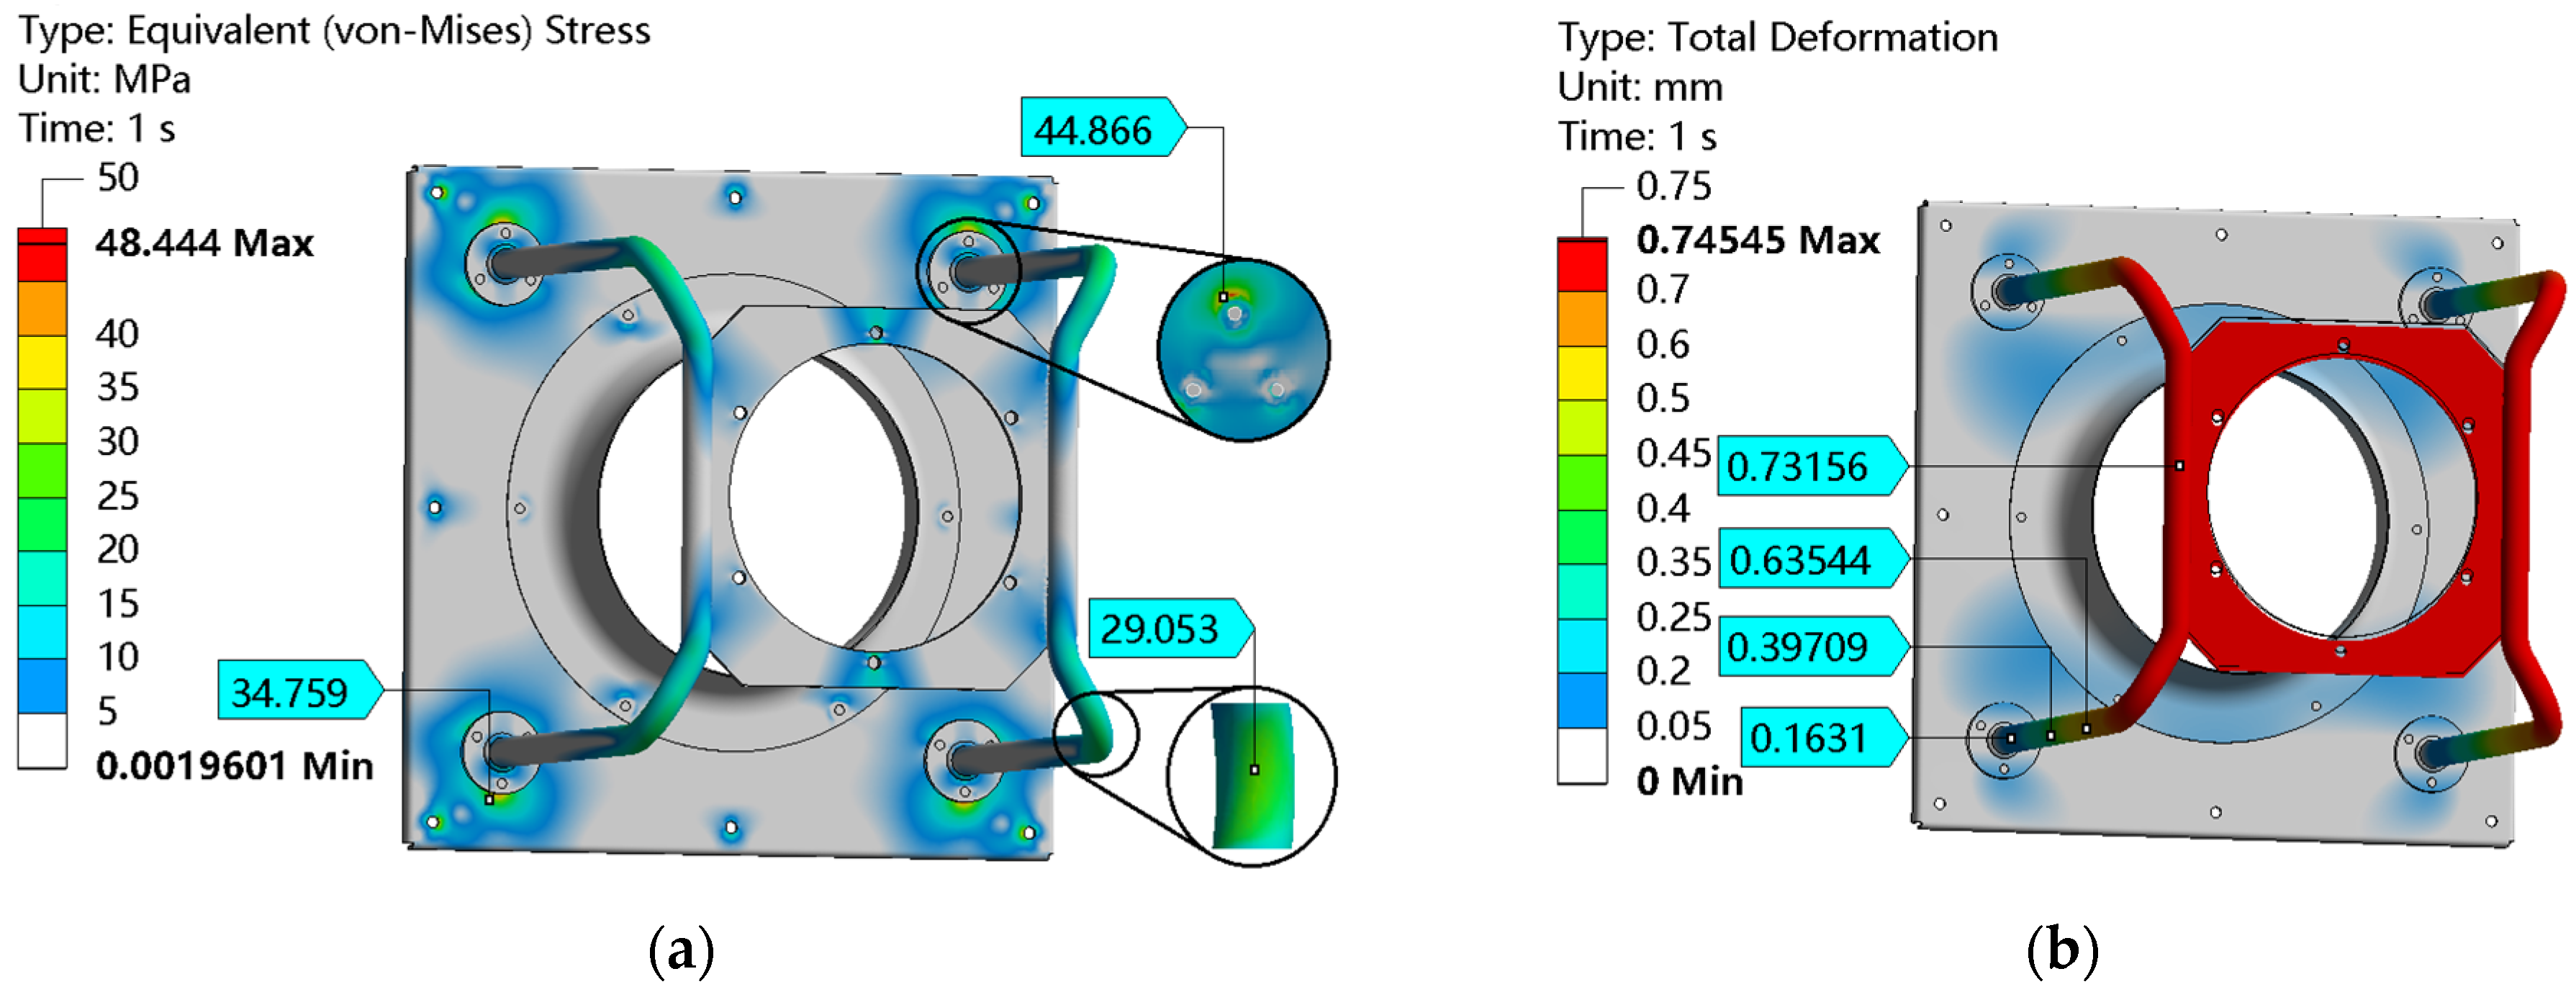
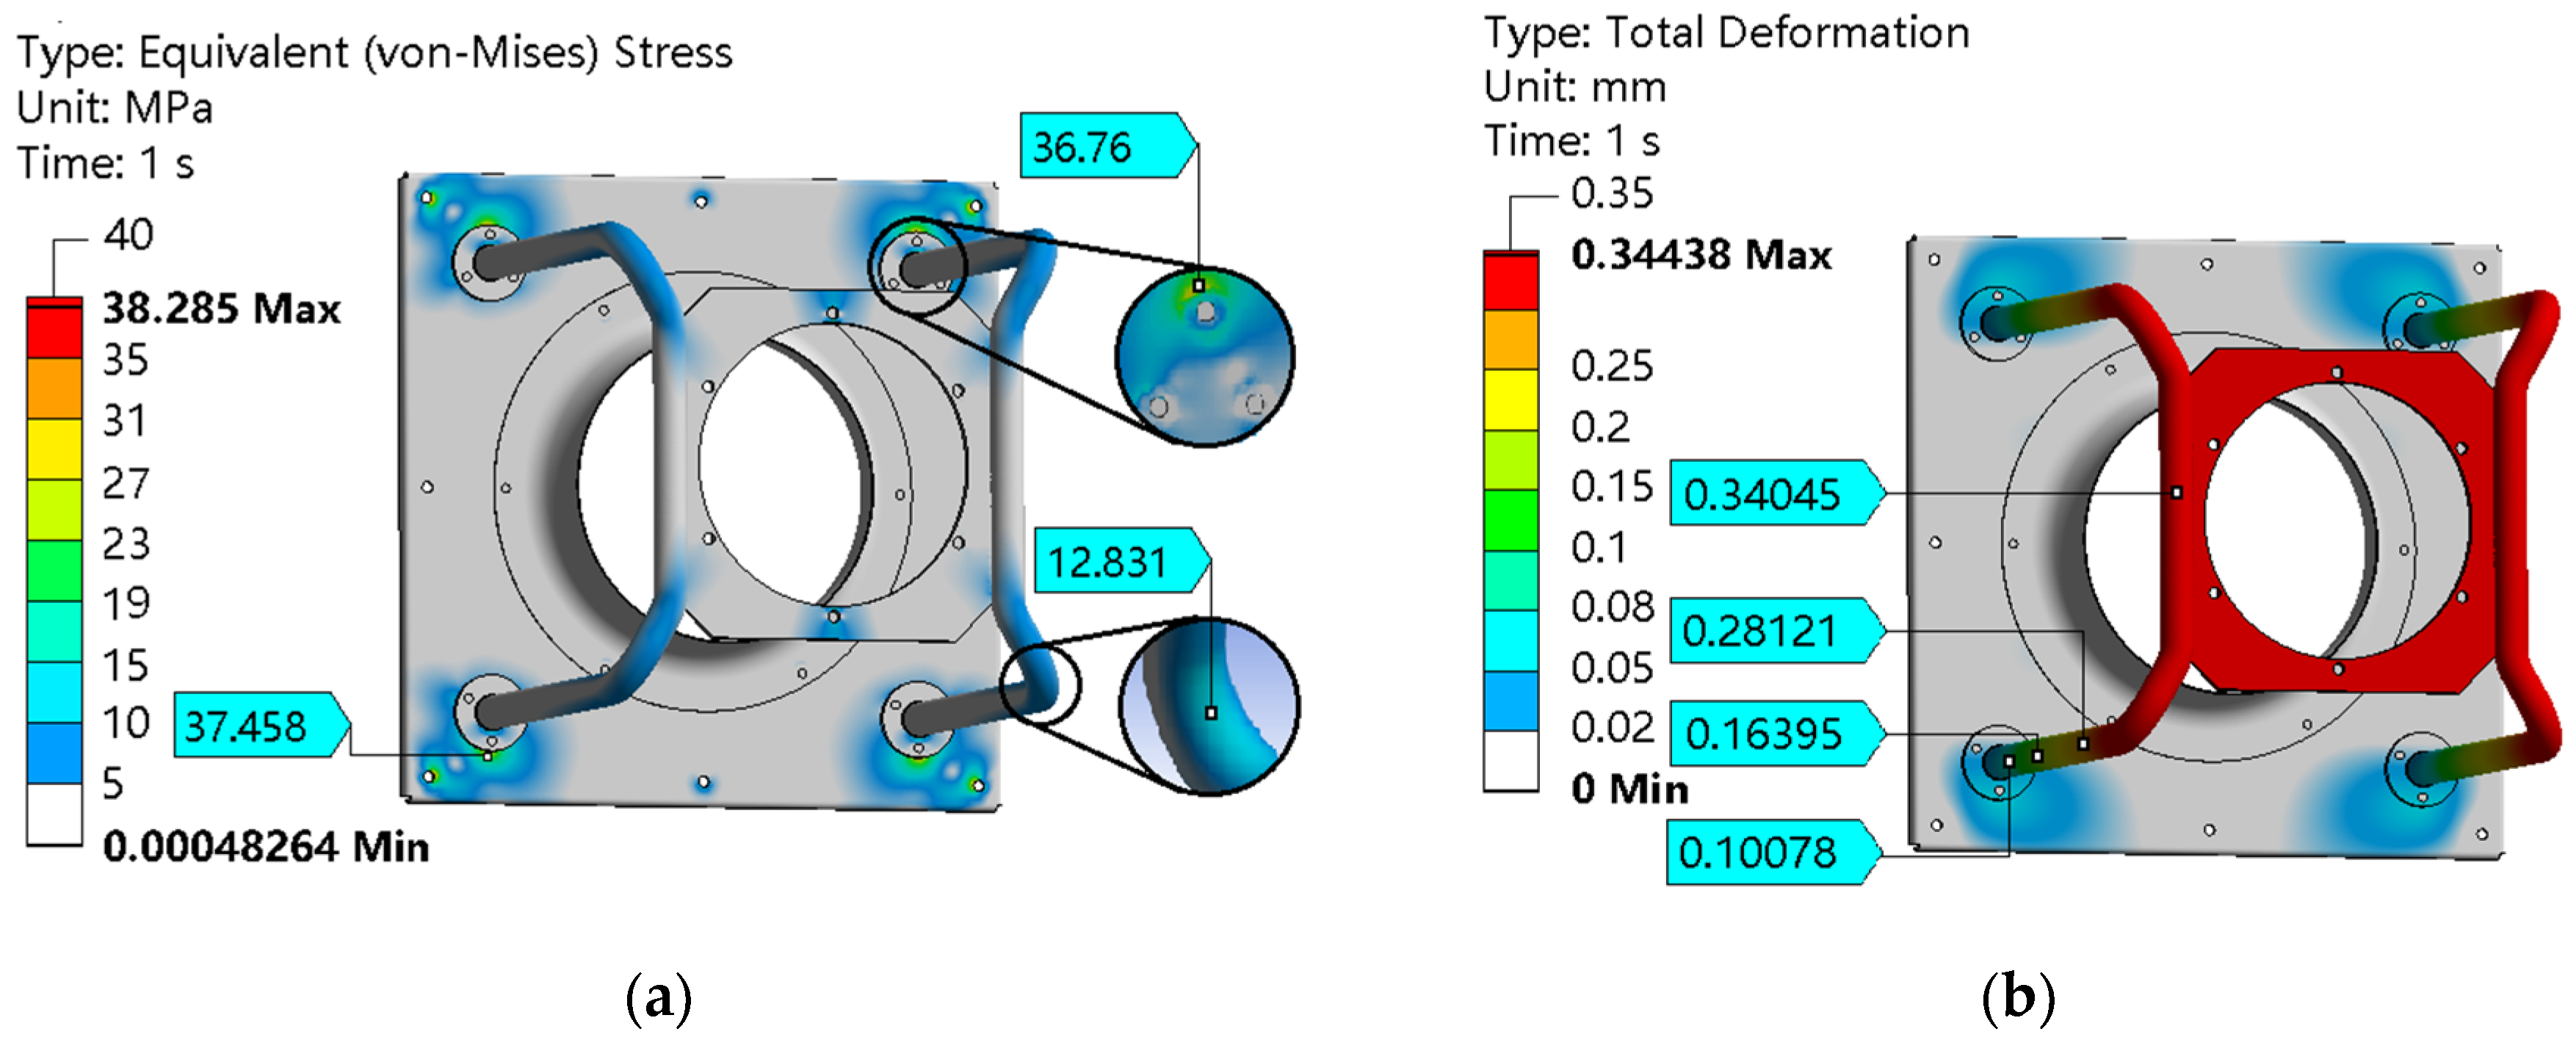
Figure 18 shows the deformation and stress results of the optimized structure. Compared with before optimization, the strength after optimization is more reliable. From Figure 18a, since the fan frame is a cantilever structure, the place with the greatest deformation is at the free end, where the motor plate and the connecting tube are. Due to the increased thickness of the optimized connecting tubes and mounting plates, the strength of the cantilever structure has increased, resulting in a significant reduction in deformation from 0.73mm to 0.34mm.
Figure 18b shows that the stress after optimization was reduced from 48.44 MPa to 38.3 MPa, and the maximum equivalent stress of the structure always occurs on the mounting plate. That is because the mounting plate is a fixed end, and ultimately, all forces will transmit to the fixed installation position. The connecting tube is like an L-shaped beam, which resists deformation at the bend, and the connection is placed under the influence of moments, so the stress is relatively prominent.

5. Conclusions

This article studies the influence of structural dimensions on the vibration of coupled systems through a combination of response surface methodology and multi-objective optimization. The following conclusions are drawn:
(1)
According to the simulation analysis results and experimental test results, it can be concluded that the shaft frequency excitation of the fan causes significant resonance in the structure, exhibiting severe vibration. The axial resonance vibration modes are caused by the undulation modes of the motor plate, and the vibration modes will appear in the third-order or fourth-order modes when the structure of the frame changes;
(2)
The effects of the motor plate thickness P6, connecting tube outer diameter P3, mounting plate thickness P1, and connecting tube inner diameter P2 on the axial vibration characteristics weakened in order. Under the interaction, the outer diameter of the connecting plate P3 and the thickness of the motor plate P6 have the greatest impact on the axial vibration characteristics;
(3)
The multi-parameter experimental design confirmed that the external excitation frequency must be more than 7 Hz away from the structural modal frequency to avoid resonance. After structural optimization, the maximum axial amplitude of the frame is reduced from 5.38 mm/s to 2.15 mm/s, and the corresponding axial modal frequencies increased from 42.2 Hz to 52.3 Hz (an increase of 24%). The frequency ratio is greater than 1.2, which can produce a vibration isolation effect, avoid resonance at maximum speed, and achieve optimized design goals.

Author Contributions

Conceptualization, L.Z. (Longfei Zhou) and K.L.; methodology, D.Z. and T.H.; software, C.W.; validation, L.Z. (Liangyu Zheng) and K.L.; formal analysis, D.Z., L.G., and C.W.; investigation, D.Z. and L.Z. (Longfei Zhou); resources, M.L. and L.G.; data curation, L.G. and C.W.; writing—original draft preparation, L.Z. (Longfei Zhou); writing—review and editing, L.Z. (Longfei Zhou) and K.L.; visualization, L.Z. (Liangyu Zheng) and T.H.; supervision, K.L., M.L., and C.W.; project administration, K.L. All authors have read and agreed to the published version of this manuscript.

Funding

This research was funded by the National Natural Science Foundation of China, grant number 52376005, the National Natural Science Foundation of China, grant number 52378094, the Henan Province Science and Technology Development Plan Project, grant number 222102220033, the Henan Provincial Science and Technology Research Project (Grant number 242102220004), and the Luoyang Science and Technology Development Plan Project, grant number 2302035A.

Institutional Review Board Statement

Not applicable.

Informed Consent Statement

Not applicable.

Data Availability Statement

The original contributions presented in the study are included in the article, further inquiries can be directed to the corresponding author.

Conflicts of Interest

Authors Chao Wang, Lei Guo and Liangyu Zheng were employed by the company Zhejiang Yilida Ventilator Co., Ltd. The remaining authors declare that the research was conducted in the absence of any commercial or financial relationships that could be construed as a potential conflict of interest.

References

  1. Dhamande, L.S.; Bhaurkar, V.P.; Patil, P.N. Vibration Analysis of Induced Draught Fan: A Case Study. Mater. Today Proc. 2023, 72, 657–663. [Google Scholar] [CrossRef]
  2. Kedir, Y.A.; Lemu, H.G. Prediction of Fatigue Crack Initiation under Variable Amplitude Loading: Literature Review. Metals 2023, 13, 487. [Google Scholar] [CrossRef]
  3. Karpenko, M.; Ževžikov, P.; Stosiak, M.; Skačkauskas, P.; Borucka, A.; Delembovskyi, M. Vibration Research on Centrifugal Loop Dryer Machines Used in Plastic Recycling Processes. Machines 2024, 12, 29. [Google Scholar] [CrossRef]
  4. Guo, H.; Zhang, K.; Lin, T.R.; Zhang, B. Effect of Ribs on Vibration Characteristics of Cantilever Plate. Thin-Walled Struct. 2023, 182, 110205. [Google Scholar] [CrossRef]
  5. Ngu, B. Fan-Wall Modifications: Improving Vibrations. Ph.D. Thesis, Jonkoping University, Jönköping, Sweden, 2023. [Google Scholar]
  6. Yumurtacı, E. Taşıt Motoru Koruma Saçının Doğal Frekanslarının Iyileştirilmesinde Topografya Optimizasyonun Uygulanması. Ph.D. Thesis, Bursa Uludag University (Turkey), Bursa, Türkiye, 2023. [Google Scholar]
  7. Talay, E.; Özkan, C.; Gürtaş, E. Designing Lightweight Diesel Engine Alternator Support Bracket with Topology Optimization Methodology. Struct. Multidiscip. Optim. 2021, 63, 2509–2529. [Google Scholar] [CrossRef]
  8. Castro, M.S.; Silva, O.M.; Lenzi, A.; Neves, M.M. Shape Preserving Design of Vibrating Structures Using Topology Optimization. Struct. Multidiscip. Optim. 2018, 58, 1109–1119. [Google Scholar] [CrossRef]
  9. Yeşilçimen, Ü. Structural Analysis and Fatigue Life Evaluation of Bracket Type Components Subjected to Random Excitations. Ph.D. Thesis, Dokuz Eylul Universitesi (Turkey), İzmir, Türkiye, 2022. [Google Scholar]
  10. Ramesh, S.; Handal, R.; Jensen, M.J.; Rusovici, R. Topology Optimization and Finite Element Analysis of a Jet Dragster Engine Mount. Cogent Eng. 2020, 7, 1723821. [Google Scholar] [CrossRef]
  11. Zhang, H.; Shi, W.; Chen, Z.; Feng, G.; He, B. Effect of Mounting Bracket Structure and Material on Automotive Air Conditioning Compressor. Aust. J. Mech. Eng. 2023, 21, 179–191. [Google Scholar] [CrossRef]
  12. Naghate, S.; Patil, S. Modal Analysis of Engine Mounting Bracket Using FEA. Int. J. Eng. Res. Appl. (IJERA) 2012, 2, 1973–1979. [Google Scholar]
  13. Adkine, A.S.; Overikar, G.P.; Surwase, P.S.S. Static and Modal Analysis of Engine Supporting Bracket-a Literature Review. 2018. Available online: https://www.researchgate.net/publication/322421314_STATIC_AND_MODAL_ANALYSIS_OF_ENGINE_SUPPORTING_BRACKET-A_LITERATURE_REVIEW (accessed on 10 March 2025).
  14. Adkine, A.S.; Overikar, G.P.; Surwase, S.S. Modal Analysis of Engine Supporting Bracket Using Finite Element Analysis. Int. J. Adv. Eng. Res. Sci. (IJAERS) 2017, 4, 55–63. [Google Scholar] [CrossRef]
  15. Jin, Y.; Yang, R.; Liu, H.; Xu, H.; Chen, H. A Unified Solution for the Vibration Analysis of Lattice Sandwich Beams with General Elastic Supports. Appl. Sci. 2021, 11, 9141. [Google Scholar] [CrossRef]
  16. Wen, S.; Chen, M.; Zhou, Z.; Jia, W. Analytical and Experimental Studies for the Vibration Transmission of the Double-Plated Structure Containing the Inner Fluid and Elastic Connections. Thin-Walled Struct. 2023, 188, 110806. [Google Scholar] [CrossRef]
  17. Van der Kolk, M. Structural Design Optimization of Vibration Isolating Structures. Ph.D. Thesis, Delft University of Technology, Delft, The Netherlands, 2015. [Google Scholar]
  18. Yang, J.; Zhang, Y.; Lee, C.-H. Multi-Parameter Optimization-Based Design of Lightweight Vibration-Reduction Gear Bodies. J. Mech. Sci. Technol. 2022, 36, 1879–1887. [Google Scholar] [CrossRef]
  19. Wang, Q.; Zeng, J.; Shi, H.; Jiang, X. Parameter Optimization of Multi-Suspended Equipment to Suppress Carbody Vibration of High-Speed Railway Vehicles: A Comparative Study. Int. J. Rail Transp. 2024, 12, 1000–1019. [Google Scholar] [CrossRef]
  20. CHEN, B.; YAN, J.; YIN, Z.; SUN, Z.; XIAO, Y. Multi-Parameter Optimization of High-Frequency Vibrating Screen Based on DEM. Chin. J. Eng. 2021, 43, 852–861. [Google Scholar] [CrossRef]
  21. Zheng, D. Vibration Characteristic Analysis of Thin-Walled Conical Shells with Arbitrary Thickness Variation and General Boundary Condition. Thin-Walled Struct. 2025, 34, 113160. [Google Scholar] [CrossRef]
  22. Bhat, P.H.; Sarawade, S.S.; Gawande, S.H. Numerical and Experimental Analysis of Compressor Mounting Bracket in Automobiles. Int. Rev. Mech. Eng. (IREME) 2018, 12, 13270. [Google Scholar] [CrossRef]
  23. Qin, Z.; Son, H.; Lyu, S.-K. Design of Anti-Vibration Mounting for 140A Class Alternator for Vehicles. J. Mech. Sci. Technol. 2018, 32, 5233–5239. [Google Scholar] [CrossRef]
  24. Adel, F.; Shokrollahi, S.; Jamal-Omidi, M.; Ahmadian, H. A Model Updating Method for Hybrid Composite/Aluminum Bolted Joints Using Modal Test Data. J. Sound Vib. 2017, 396, 172–185. [Google Scholar] [CrossRef]
  25. Kim, J.; Yoon, J.-C.; Kang, B.-S. Finite Element Analysis and Modeling of Structure with Bolted Joints. Appl. Math. Model. 2007, 31, 895–911. [Google Scholar] [CrossRef]
  26. Çeçen, F.; Aktaş, B. Modal and Harmonic Response Analysis of New CFRP Laminate Reinforced Concrete Railway Sleepers. Eng. Fail. Anal. 2021, 127, 105471. [Google Scholar] [CrossRef]
  27. Babaei, A. Forced Vibration Analysis of Non-Local Strain Gradient Rod Subjected to Harmonic Excitations. Microsyst. Technol. 2021, 27, 821–831. [Google Scholar] [CrossRef]
  28. ISO. Industrial Fans—Specifications for Balance Quality and Vibration Levels; ISO: Geneva, Switzerland, 2003. [Google Scholar]
  29. Chen, W.; Jin, M.; Huang, J.; Chen, Y.; Song, H. A Method to Distinguish Harmonic Frequencies and Remove the Harmonic Effect in Operational Modal Analysis of Rotating Structures. Mech. Syst. Signal Process. 2021, 161, 107928. [Google Scholar] [CrossRef]
  30. Wang, X.; Tsung, F.; Li, W.; Xiang, D.; Cheng, C. Optimal Space-Filling Design for Symmetrical Global Sensitivity Analysis of Complex Black-Box Models. Appl. Math. Model. 2021, 100, 303–319. [Google Scholar] [CrossRef]
  31. Agarwal, A.; Mthembu, L. Weight Optimization of Heavy-Duty Truck Chassis by Optimal Space Fill Design Using Light Weight Graphite Al GA 7-230 MMC. Mater. Today Proc. 2022, 52, 1278–1287. [Google Scholar] [CrossRef]
  32. Agarwal, A.; Seretse, O.M.; Pitso, I. Optimal Space Filling Design Based Finite Element Analysis of Hydraulic Cylinder; Palanisamy, D., Palani, I.A., Sathiya, P., Eds.; Springer: Singapore, 2022; pp. 543–552. [Google Scholar]
  33. Sarangi, S.K.; Mishra, D.P.; Ramachandran, H.; Anand, N.; Masih, V.; Brar, L.S. Analysis and Optimization of the Curved Trapezoidal Winglet Geometry in a High-Efficiency Compact Heat Exchanger. Int. J. Therm. Sci. 2021, 164, 106872. [Google Scholar] [CrossRef]
  34. Trinh, M.-C.; Jun, H. Stochastic Bending and Buckling Analysis of Laminated Composite Plates Using Latin Hypercube Sampling. Eng. Comput. 2023, 39, 1459–1497. [Google Scholar] [CrossRef]
  35. Fuhg, J.N.; Fau, A.; Nackenhorst, U. State-of-the-Art and Comparative Review of Adaptive Sampling Methods for Kriging. Arch. Comput. Methods Eng. 2021, 28, 2689–2747. [Google Scholar] [CrossRef]
  36. Xiao, N.-C.; Yuan, K.; Zhan, H. System Reliability Analysis Based on Dependent Kriging Predictions and Parallel Learning Strategy. Reliab. Eng. Syst. Saf. 2022, 218, 108083. [Google Scholar] [CrossRef]
  37. Ma, H.; Zhang, Y.; Sun, S.; Liu, T.; Shan, Y. A Comprehensive Survey on NSGA-II for Multi-Objective Optimization and Applications. Artif. Intell. Rev. 2023, 56, 15217–15270. [Google Scholar] [CrossRef]
Figure 1. Three-dimensional model.
Applsci 15 05069 g001
Figure 2. (a) Solder joint setting; (b) mass point of structural assembly connection settings; (c) fixing and loading.
Applsci 15 05069 g002
Figure 3. Static results: (a) stress cloud map; (b) deformation cloud map.
Applsci 15 05069 g003
Figure 4. First six-order vibration mode of frame: (a) first-order; (b) second-order; (c) third-order mode; (d) fourth-order; (e) fifth-order; (f) sixth-order.
Applsci 15 05069 g004
Figure 5. Excitation frequency spectrum: (a) 700 rpm; (b) 1100 rpm; (c) 2600 rpm.
Applsci 15 05069 g005
Figure 6. Simulation analysis of frequency–velocity vibration response: (a) 700 rpm; (b) 1100 rpm; (c) 2600 rpm.
Applsci 15 05069 g006
Figure 7. Experimental equipment: (a) data acquisition instrument; (b) three-way sensor.
Applsci 15 05069 g007
Figure 8. Experimental testing: (a) test-site; (b) vertical chromatogram; (c) axial chromatogram; (d) lateral chromatogram.
Applsci 15 05069 g008
Figure 9. Comparison between vibration testing and simulation: (a) modal frequency error; (b) maximum amplitude error.
Applsci 15 05069 g009
Figure 10. Excitation source vibration test.
Applsci 15 05069 g010
Figure 11. Drive signal: (a) vertical vibration excitation; (b) axial vibration excitation; (c) lateral vibration excitation; (d) vibrational effective value.
Applsci 15 05069 g011aApplsci 15 05069 g011b
Figure 12. Sample points for experimental design.
Applsci 15 05069 g012
Figure 13. (a) Parameter correlation analysis: (b) relationship between axial modal frequencies and third- and fourth-order modal frequencies.
Applsci 15 05069 g013
Figure 14. Response surface of axial maximum amplitude (a) and axial modal frequencies (b) by P1 and P2 fitting.
Applsci 15 05069 g014
Figure 15. Response surface of axial maximum amplitude (a) and axial modal frequencies (b) by P3 and P6 fitting.
Applsci 15 05069 g015
Figure 16. Pareto solution set.
Applsci 15 05069 g016
Figure 17. Comparison of vibration characteristics before and after optimization: (a) modal frequency; (b) vibration response at 2600 rpm.
Applsci 15 05069 g017
Figure 18. Optimized static results: (a) stress cloud map; (b) deformation cloud map.
Applsci 15 05069 g018
Table 1. Material attributes.
Material PropertiesSS400Q195
Density/kg·m−378607690
Young’s modulus/Pa2.12 × 10112.12 × 1011
Poisson’s ratio0.2880.286
Yield strength/MPa235195
Table 2. Mesh independence verification.
Number of Mesh-Point503,564786,524945,8231,141,4361,356,854
Maximum equivalent stress/MPa69.3360.6353.7848.4449.23
Maximum deformation/mm1.020.960.860.750.75
Table 3. Frame modal characteristics.
OrderFrequency/HzMode Description
111.2Lateral translation
217.9Vertical translation
341.4Motor plate axial lift
444.5Torsional vibration modes
555.0Symmetrical undulations in the axial direction of the motor plate
668.4The motor plate tilts from side to side
Table 4. Device parameters.
Test InstrumentMeasuring RangeResolutionSensitivityNonlinearity
INV3018CT 24 bit high-precision data acquisition instrument (Beijing, China)0.5 Hz~204.8 kHz24 bit
Three-directional vibration sensor (Beijing, China)50 g pk0.01 g RMS100 mV/g1%
Table 5. Initial values and value ranges for rack design variables.
Parameter NameVariable Ranges
Thickness of the mounting plate P1/mm2~5
Inner diameter of the connecting tube P2/mm0~12
Outer diameter of the connecting tube P3/mm10~19
Height of the connecting tube P4/mm418~478
Outer diameter of the connection block P5/mm35~60
Thickness of the motor plate P6/mm4~8
Width of the motor plate P7/mm330~450
Table 6. Response surface model accuracy evaluation.
Third Natural FrequencyFourth Natural FrequencyAxial Maximum AmplitudeAxial Modal Frequencies
P0.0010.0010.0010.041
R 2 0.970.910.970.90
R r (%)2.73996.25429.47475.6175
Table 7. Three optimal solutions.
Design Variables123
P1/mm4.494.724.33
P2/mm6.6210.619.22
P3/mm17.6318.1617.22
P4/mm443.70449.99450.03
P5/mm59.9452.0737.82
P6/mm7.697.847.68
P7/mm449.74449.58350.45
Axial Maximum Amplification/(mm/s)Predicted1.411.442.10
Simulated1.901.922.09
Axial Modal Frequency/HzPredicted53.9954.8550.40
Simulated52.6753.5152.73
Maximum deformation/mmPredicted0.3480.560.47
Simulated0.3550.530.45
Maximum equivalent stress/MPaPredicted51.3548.9142.12
Simulated48.8343.4444.93
Table 8. Rounding of design variables for the optimal solution in Group 3.
Design VariablesAfter OptimizationRounding Scheme
P1/mm4.334
P2/mm9.229
P3/mm17.2217
P4/mm450.03450
P5/mm37.8238
P6/mm7.687.5
P7/mm350.45350
Axial Maximum Amplitude/(mm/s)2.092.15
Axial Modal Frequency/Hz52.7352.3
Maximum deformation/mm0.450.34
Maximum equivalent stress/MPa44.9338.29
Disclaimer/Publisher’s Note: The statements, opinions and data contained in all publications are solely those of the individual author(s) and contributor(s) and not of MDPI and/or the editor(s). MDPI and/or the editor(s) disclaim responsibility for any injury to people or property resulting from any ideas, methods, instructions or products referred to in the content.

