1. Introduction
Liquid launch vehicles usually encounter the pogo phenomenon, recognized by NASA as a threat to spaceflight vehicles and crews as early as the Gemini-Titan II program in the 1960s [
1]. Currently, pogo is widely recognized as coupled instability between the vehicle structure and the propulsion system [
2]. In typical occurrences, axial periodic vibrations of the entire vehicle have been observed to initiate spontaneously, grow slowly, and then gradually subside in the frequency range of 5 to 120 Hz. Peak vibration amplitudes range from a few tenths of one g to as high as 34 g, with an instability duration of up to 30 s [
3].
To mitigate pogo effects, the installation of an accumulator near the pump is crucial and particularly effective [
4]. The accumulator, functioning as a soft volumetric spring, contains a volume of gas aimed at shifting hydraulic frequencies to diminish dynamic coupling between the propulsion system and the vehicle’s structural vibration modes. The space inside the accumulator is connected to the main propellant pipeline through communication ports, which are some thin-wall holes arranged around the pipe.
Typically positioned 1 to 2 feed line diameters upstream of the pump inducer, the accumulator shifts the sensed frequency of the long fluid column segment between the tank and the accumulator by providing compliance [
5]. A small maximum accumulator inertance is required to enable the accumulator to promptly react to pogo-induced fluid oscillations and the early stages of pogo pressure pulses. However, it does not adequately absorb energy from the fluid column oscillations in the duct between the accumulator and the pump, and a target design level for resistance is essential for damping the short column oscillations [
6]. Stability analyses run for a space shuttle main engine confirmed that the accumulator resistance could be highly effective in eliminating instability [
7].
Research indicates that the resistance and inertance of an accumulator primarily depend on the impedance of the communication ports and are kept low over the desired frequency range [
6]. However, accurately quantifying the inertance and resistance of communication ports, which are hydraulic parameters, has proven to be challenging, both theoretically and experimentally [
8]. Even after the installation of an accumulator, Delta vehicles experienced pogo events due to insufficient resistance in TD-1 flight and due to overestimated resistance in ITOS-E flight, where the accumulator was blocked [
9].
Initially, the accumulator is modeled as a side branch, considering the communication port as an orifice. However, Riley found that experimental results demonstrated more flow resistance than predicted by documenting pulse testing to evaluate the flow resistance of a specific accumulator design [
10]. Holster reached a similar conclusion, which could be attributed to the classical orifice flow model used for predicting the non-linear flow resistance of the communication ports [
11]. Based on the orifice flow model, Doiron derived an energy equivalence method to determine the linear flow resistance for pulsating flow through non-linear flow resistance, connecting the communication port’s resistance with its structure [
2]. Ransom further expanded on this model, proving that the resistive nature of the communication port is not solely a function of geometry but also of feedline propellant flow rates and oscillatory flow amplitude in communication ports [
2]. However, these two parameters are not considered in the classical orifice flow model, and corrections during the linearization process will not eliminate the limitations of the basic model. Shi established a non-linear communication port flow model considering fluid velocity in the supply pipeline and further derived a quasi-steady assumption-based linear resistance calculation method for communication ports under different oscillatory flow amplitudes [
12,
13]. However, it has not been verified under transient conditions, and there is no explanation for the linear resistance value when the oscillatory flow rate amplitude is close to zero. On the other hand, there are no theories yet available for calculating the communication port inertance.
To establish a communication port impedance calculation method, this paper employs a transient CFD (Computational Fluid Dynamics) simulation approach with
k-
ε turbulence model to investigate the unsteady process of communication ports. The reliability of this research method is mainly verified by comparing the transient CFD simulation result with the experimental result of an orifice flow example in
Section 2. In
Section 3, a quasi-steady assumption-based impedance calculation method for the communication port is supplemented, which is then furthered validated in
Section 4 through the transient CFD simulation results of a simplified communication port model. A linear frequency correction method for communication port impedance to extend its applicability to the pogo frequency range is also proposed. Concluding remarks are summarized in
Section 5.
2. Model and Methodology
2.1. Simplification of Accumulators’ Communication Port
The gas-filled accumulator’s structure is illustrated in
Figure 1. The primary components of the accumulator include an annular space enveloping the propellant supply pipeline and some communication ports arranged on the pipeline. This annular space can be further divided into an upper ullage zone and a lower liquid zone. The internal pipeline is usually integrated together with the annular structure for the sake of design, processing, and testing requirements. The upper end of this structure is connected to the upstream propellant supply pipeline, and the lower end is linked to the pump inlet of the engine.
This research is primarily focused on studying the influence of vertical flow within the supply pipeline on the horizontal oscillatory flow in the communication port. It can be simplified by replacing the annular liquid area following the communication port with a branch pipe. The reason for this substitution is that under specific Reynolds number conditions, such as 10
5, the increase in flow coefficient resulting from changes in the orifice aperture ratio within the range of 0.5~0.75 is less than 2%. This change is not considered as a significantly influential factor when compared to the vertical mainstream flow influence [
13]. Through this approach, the problem is transformed into a situation similar to a tee pipe, where the main pipe and branch are connected by an orifice. Also, this study is conducted on a single communication port, isolated from the overall accumulator, without taking the coupling effect between communication ports into account.
Considering the factors mentioned above, a simplified schematic model of the communication port is derived, as illustrated in
Figure 2. Its characteristic dimensions include main-pipe diameter
D, communication port diameter
DP and branch pipe diameter
d.
The communication port operates under two distinct working conditions. When the static pressure in the mainstream exceeds than in the branch, it will cause the fluid to be forced into the branch, which is called “charging”. Under this condition, the flow region includes one inlet boundary and two outlet boundaries; conversely, when the static pressure in the mainstream is lower than that in the branch, the fluid is directed into the mainstream, which is called “discharging”. Under this condition, the system includes two inlet boundaries and one outlet boundary.
The monitors’ locations are determined by referencing the measurement locations from communication port flow simulations [
12,
13] and those from orifice flow simulations and experiments [
8,
15]. A slight friction loss is conveniently disregarded, with the distance between
Section 1 and the communication port denoted as
D and the distance between section
k and the communication port as
d.
2.2. Computational Model
Liquid oxygen is used as the material for the simulation because the engine thrust sensitivity to pressure variations is closely related to the liquid density, compressibility, and thrust chamber mass flow rate. Choosing liquid oxygen can make the simulations closer to the actual situation of the accumulator’s communication port [
6]. A three-dimensional geometric region is adopted for simulation, but is treated symmetrically, retaining only half of the model to eliminate the swirl influence. The computational domain and its symmetry surface are shown in
Figure 3. This model can be divided into three parts: the main pipe, the branch, and the communication port.
The main pipe has a diameter of 470 mm and a total length of 5000 mm, with the upper and lower boundaries positioned 2500 mm from the central axis of the communication port to avoid the influence on the inlet and outlet boundaries. The wall thickness of the main pipe is 2.5 mm. The communication port possesses a diameter of 30 mm and is oriented perpendicular to the axis of the main pipe, with a hole thickness equal to the wall thickness of the main pipe. The branch pipe outlet has a diameter of 60 mm, where the aperture ratio is 0.5, with a pipe length of 500 mm.
2.3. Numerical Simulation Method and Verification
In this study, liquid oxygen is considered incompressible, with a density of 1142 kg/m
3 and a viscosity of 0.00019582 kg/(m·s), at 90 k and 0.8 MPa approximately [
16]. This incompressibility assumption is supported by the following three considerations: First, the density variation in liquid oxygen at 90 K between 0.6 MPa and 1.0 MPa is less than 0.1%. Second, the applied oscillation frequencies fall within the low-frequency regime, where liquid compressibility effects become negligible, as demonstrated in orifice flow impedance analyses. Third, the impedance of gas-filled accumulators is mainly derived from the ullage gas compliance rather than contributions from the liquid phase or structure.
The continuity equation and momentum equation are established for the communication port model. Since the fluid is incompressible and heat transfer has a minimal influence on this problem, the energy equation is omitted. Therefore, this study is conducted by solving the Navier–Stokes equations without the energy equation.
In the 1980s, Sheikholeslami studied flow through the orifice using the
k-ε turbulence model and algebraic stress turbulence model, and the simulation results had less than a 2% difference from empirical results [
17]. Relevant studies [
12,
13,
18,
19] have also demonstrated that it is reasonable and reliable to conduct numerical simulations of orifice flow using the
k-ε turbulence model and standard wall functions, which is the approach adopted in this study.
To verify the reliability of this research method, the experimental results and 2D/3D simulation results of an orifice flow example were compared. In reference [
15], an experimental study was conducted on a cylindrical orifice connected to a large chamber downstream. The inlet pipe diameter was 10 mm, the orifice diameter was 2 mm, and the orifice length was 10 mm. We applied the same conditions and reached the same conclusion that three cycles of the input sinusoid were sufficient for conditions to stabilize. The relationship between impendence amplitude
MI and oscillation frequency
f are plotted in
Figure 4, along with reference data for comparison.
2.4. Grids Generation and Independence Analysis
This research utilizes the algorithm of an unstructured tetrahedral grid generation method. For the boundary layer flow pattern, pentahedral prism grids are employed. The thickness of the first boundary layer grid near the communication port is set at 0.05 mm, approximately 0.17% of the diameter of the communication port, and it consists of four layers in total.
The obtained global and local mesh division results are presented in
Figure 5. The total number of elements is 7,863,406, and the number of nodes is 2,318,100. The element quality exceeds 0.318, with an average value of 0.846, while the element skewness is less than 0.74865, with an average value of 0.20196.
To ensure gird independence, a study is conducted with two sets of grids as an example. In the denser mesh, the grid size is reduced by 20%, and the first boundary layer grid near the communication port is reduced to 0.04 mm. This results in an increase in the total number of elements to 15,903,075, which is approximately twice the number in the normal mesh. Both the normal and dense meshes produce nearly identical solutions of pressure difference Δ
P across the communication port and the mass flow rate
in it, as illustrated in
Figure 6.
The linear resistance obtained through simulation on the normal mesh is 0.008607 MPa·s/kg, while on the dense mesh, it is 0.008636 MPa·s/kg, with a deviation of less than 0.34%. Therefore, it can be concluded that this research meets the gird independence requirements.
3. Quasi-Steady Assumption-Based Communication Port Impedance
The pressure difference across a communication port can be decomposed into two parts: resistive losses and inductive losses, which can be characterized by resistance and inertance. Impedance is a complex ratio between the Fourier transform of pressure difference and the Fourier transform of flow rate. This consideration assumes linearity for small perturbations around the operating point and corresponds to the two terms within the equation:
where
Z is the impedance of the communication port,
RLA is its linear flow resistance, and
LLA is its linear flow inertance.
Theoretically, resistance and inertance are parameters related to fluid physical properties and flow patterns. Therefore, it is not entirely accurate to solely correlate resistance and inertance with the mass flow rate in the communication port. However, considering that pogo frequencies are typically below 50 Hz, we can assume that resistive losses and inductive losses are functions of the mass flow rate within the communication port, based on the quasi-steady assumption. Thus, we can analyze the impedance of the communication port under a series of steady states.
It is known that the flow resistance of an orifice exhibits a non-linear dependency on the flow rate [
15]. The relationship between flow resistance and orifice geometry can be expressed as follows:
where
RQA is the non-linear flow resistance of communication port, ΔP is the instantaneous pressure drop across resistances,
is the instantaneous mass flow rate through a resistance,
ρ is the density of the fluid,
CD is the orifice discharge coefficient, and
AA is the total flow area of all the communication ports.
In the case of small system perturbations around steady-state flow conditions,
RLA is approximated through perturbation linearization of Equation (2) with respect to steady-state flow conditions. In the context of pulsating flow with zero mean flow weight, as previously mentioned, Doiron devised an energy equivalence method that ultimately leads to the following relationship:
where
is the amplitude of the oscillatory mass flow rate.
However, despite the similarities in geometry between the communication port and an orifice, their flow coefficients exhibit distinct differences. Shi [
12] proposed a theory that describes their relationship as follows:
where
CD,0 is the orifice discharge coefficient under zero main pipe flow velocity,
V and
VP represent surface average velocity in the supply pipeline and the communication port, and
k,
a,
b are coefficients to be determined through the experiment.
By combining Equations (2) and (4) and conducting further deduction, it becomes possible to quantify the resistance of the communication port based on its geometry for small system perturbations around steady-state flow conditions. For oscillatory flow, the linear flow resistance is defined as the ratio of pressure difference to flow rate after Fourier transformation. Thus, if the flow rate follows a sinusoidal function over time [
13], the following applies:
When the amplitude of oscillatory mass flow rate in the communication port approaches zero, the local loss of the communication port flow gradually decreases, while the energy loss (ideally equal to the dynamic pressure of fluid inside the main pipe) caused by the injection phenomenon plays a dominant role, regardless of the charging or discharging conditions. According to ref. [
2], it can be calculated as follows:
where
is the proportional constant between the oscillatory flow pressure amplitude and the supply pipeline dynamic pressure, which can ideally be taken as 1.
By utilizing Equations (4)–(6), assuming that the transition is continuous, we can calculate the quasi-steady assumption-based linear resistance RQS of the communication port.
Regarding the inertance of the communication port, some extended analysis can be conducted. Lau proved that the inertance of an orifice can be calculated as follows [
15]:
where
lE is the effective orifice length,
AO is the orifice flow area,
d is the orifice diameter, and
A(
x) is the cross-sectional area at distance
s through the orifice.
According to orifice flow theory, flow and pressure fluctuations can be assumed to be constant across the radius, leading to the derivation of a theoretical constant effective orifice length, even though this assumption is not strictly accurate [
20]. Lau demonstrated that the effective length for various orifices remains relatively constant over a range of Reynolds numbers examined [
15]. Consequently, previous studies often assumed that the inductance of the communication ports can be ignored or is a constant value solely dependent on the geometry of communication ports. However, even at low oscillatory flow frequencies, the fluid flow pattern within the communication port undergoes significant changes. With an increase in mass flow rate in the communication port, the jet flow might become narrower, leading to a reduction in the cross-sectional area through the communication port and subsequently increase in inertance.
4. Results and Discussion
4.1. Low-Frequency Oscillatory Flow Condition
When the oscillatory flow frequency is sufficiently low, inductive pressure losses become ignorable and the assumption of a quasi-steady state becomes valid. By performing Fourier transform on the periodic functions of the pressure difference and mass flow rate of the communication port under low-frequency oscillatory flow conditions (in this research, 1 Hz has been demonstrated through simulation to be sufficiently low), we can determine its resistance,
RA, under various oscillatory flow velocity amplitudes,
Mv, as shown in
Figure 7.
It is evident that the quasi-steady assumption-based linear resistance calculation method provides relatively accurate results, with a deviation of less than 3.2% from the simulation results. Moreover, achieving an oscillatory flow velocity amplitude of 6 m/s requires an oscillatory flow pressure amplitude greater than 0.05 MPa. Considering that the pressure in the LO2 supply pipeline usually drops below 1 MPa, this corresponds to a pressure fluctuation of over 5%. Therefore, it can be concluded that the quasi-steady assumption-based linear resistance calculation method is capable of reflecting the communication port flow characteristics under low oscillatory flow frequencies. It essentially reflects the primary and secondary relationship between the local loss caused by the communication port flow and the injection caused by the supply pipeline.
This also explains why previous research has shown that the experimental results demonstrate more resistance than predicted. This is because the loss of injection was not considered. By comparing Equations (3) and (5), it is evident that there are two additional terms which should represent the resistance increment caused by the injection and flow velocity of the supply pipeline. Therefore, the common term represents the linear resistance of the orifice, the first term of Equation (5) reflects the impact of supply pipeline e flow velocity, and the third term indicates the influence of injection.
Moreover, this also confirms the existence of a minimum linear resistance corresponding to oscillatory flow velocity amplitude. According to Equations (5) and (6), the minimum value of
RQS can be written as follows:
Equation (8) indicates that using RLA,1 to represent RLA during communication port design is reliable for small oscillation conditions, with a deviation within 4%. Furthermore, if experimental or simulation results of communication port linear resistance are obtained, this method can also be used for reverse-engineering of the coefficients, providing a method for measuring communication port flow characteristics.
4.2. Oscillatory Flow Frequency Effects Study
Figure 8 shows the relationship between the linear resistance
RLA and oscillatory flow velocity amplitude
Mv of the communication port at different oscillatory flow frequencies. The impact of oscillatory flow frequency on linear resistance is relatively small when it is below about 20 Hz. This feature is beneficial for quasi-steady assumption. However, when the frequency exceeds about 20 Hz, the correlation between linear resistance and velocity amplitude appears to shift. The communication port appears to have lost its asymmetry and the losses caused by injection have weakened, leading to a linear increase in its resistance with velocity amplitude.
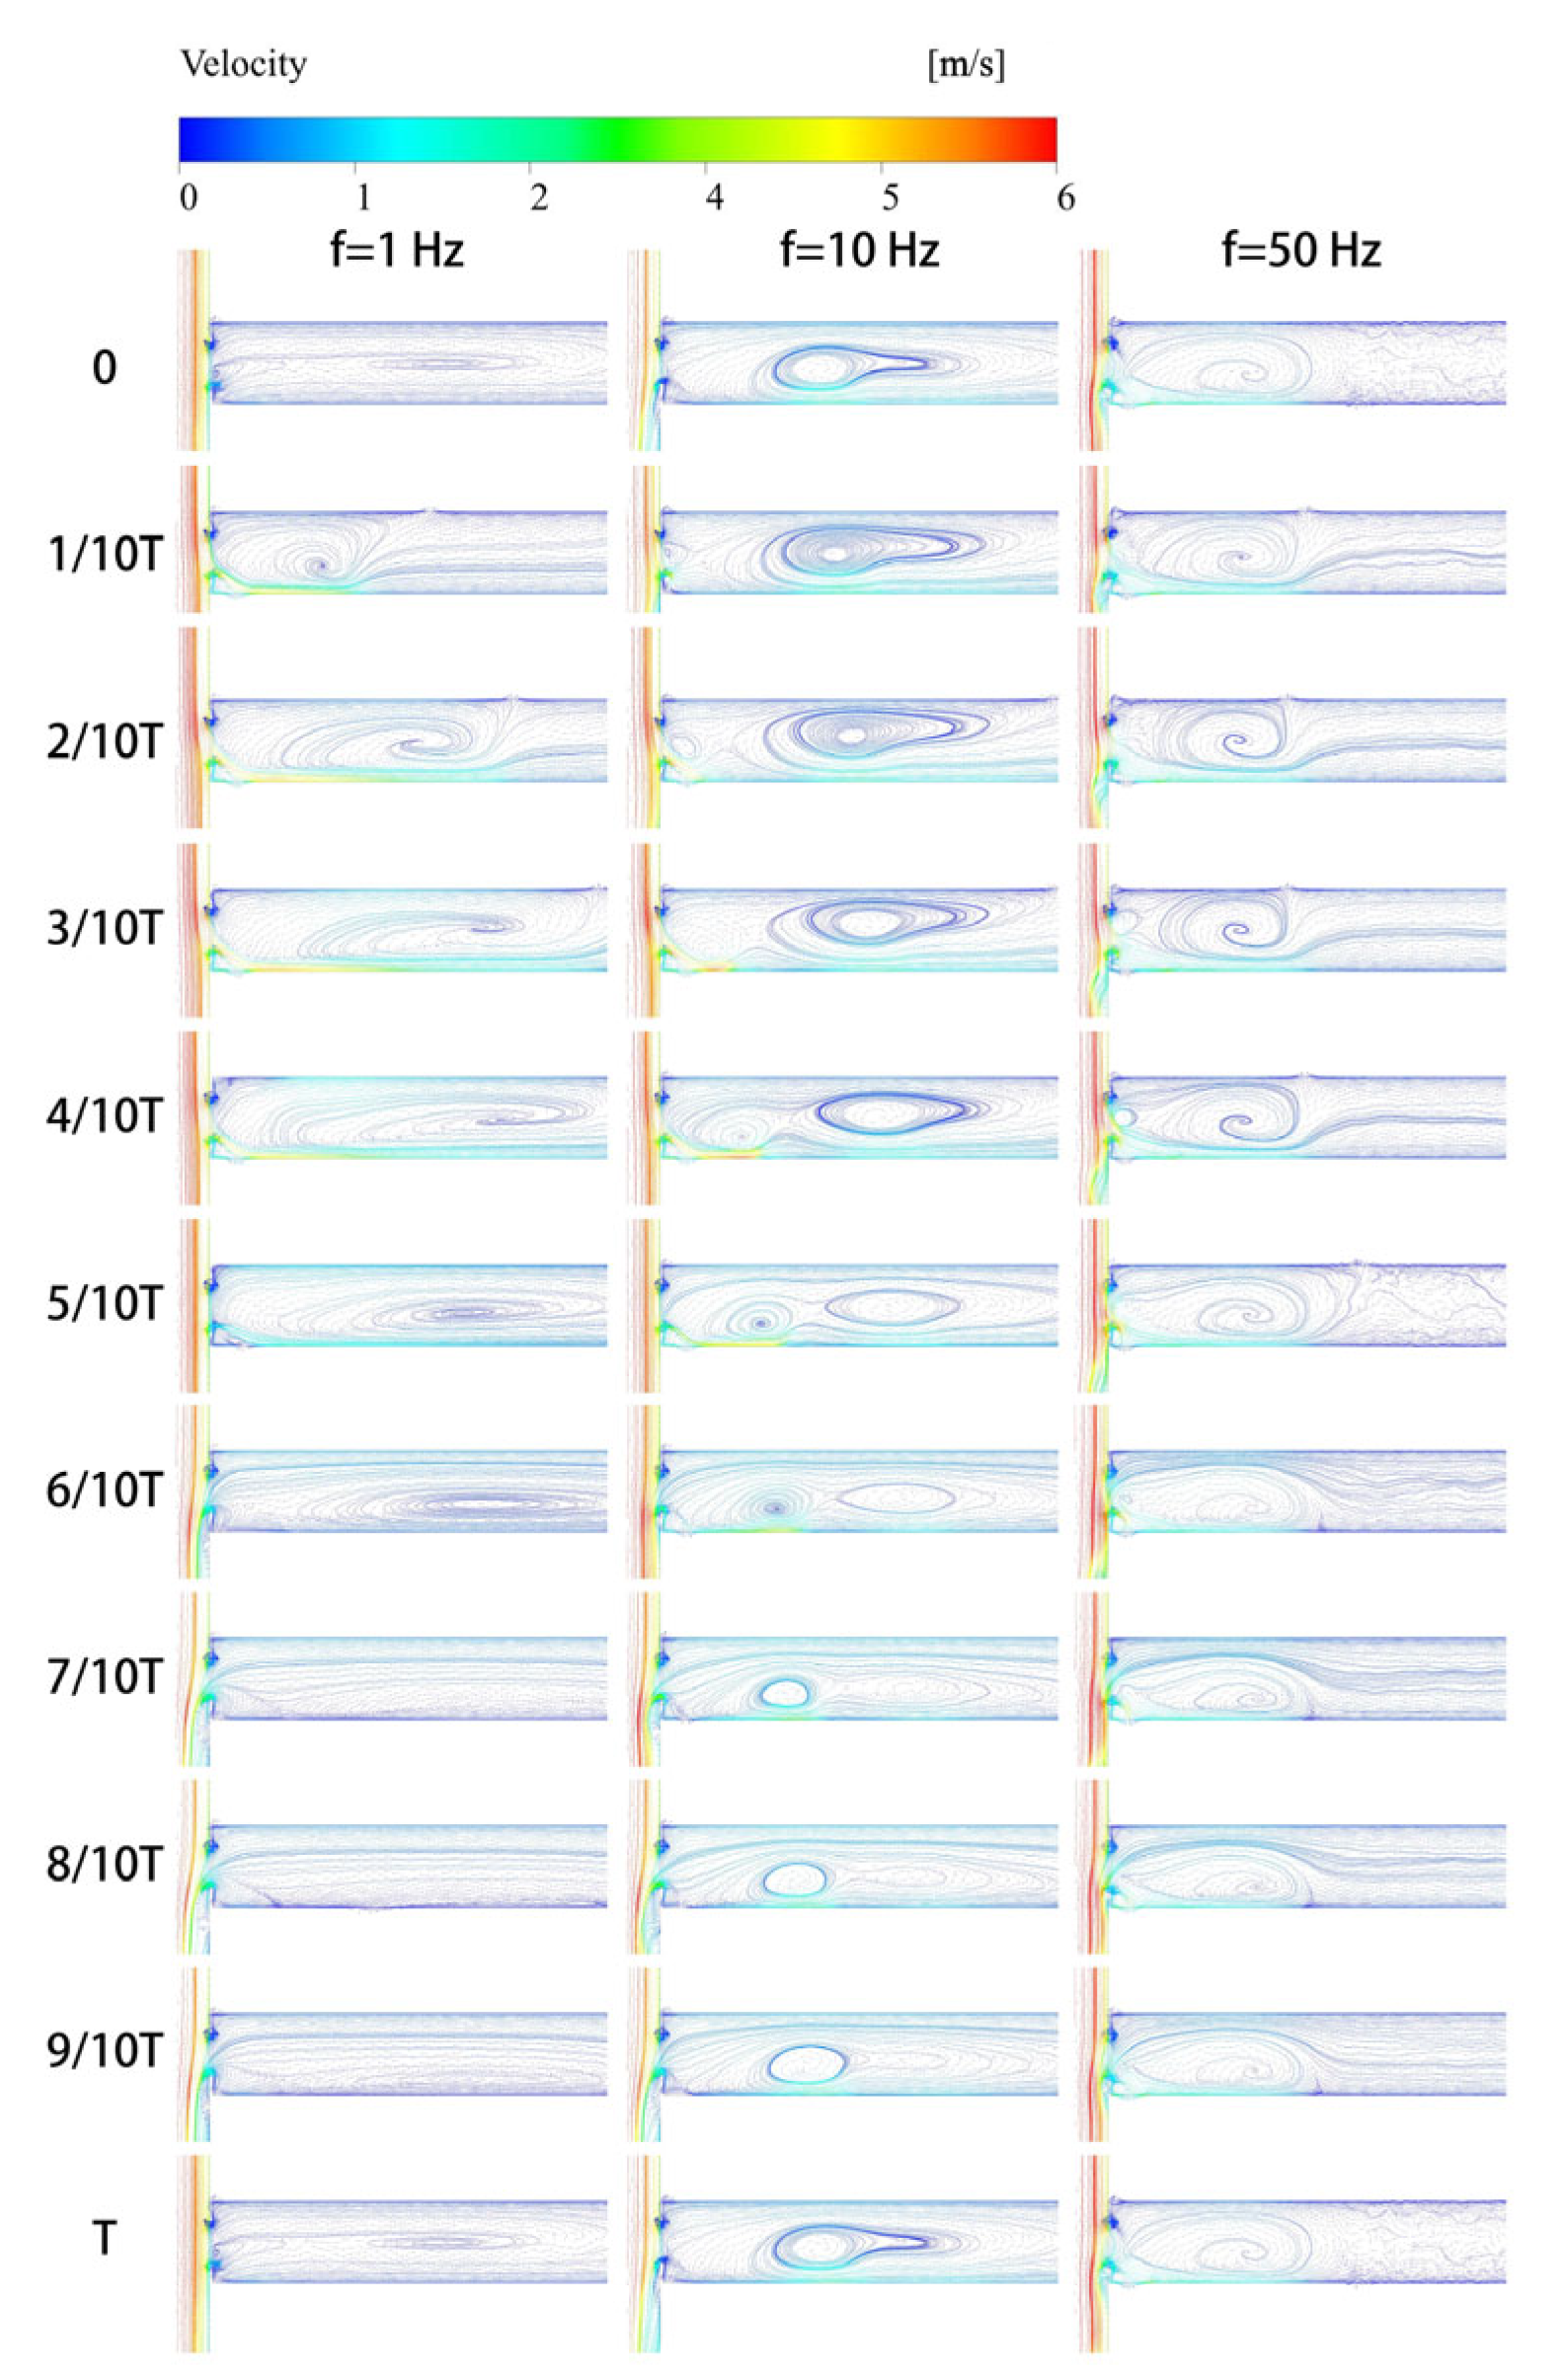
Figure 9 provides velocity vector plots at oscillatory flow frequencies of 1 Hz, 10 Hz, and 50 Hz under the velocity amplitude of 1.2 m/s.
When the oscillatory flow frequency is below 20 Hz (taking 1 Hz and 10 Hz condition as examples), a periodically moving vortex forms in the branch. According to boundary conditions, particles of the fluid inside the branch pipe undergo reciprocating motion, the trajectory of which can be transformed into a vortex affected by the asymmetric flow through the communication port or be maintained along the pipeline direction if not affected. Keeping the amplitude of oscillatory flow constant, the influenced region of asymmetric flow should decrease with the increase in oscillation frequency and would appear to form a stable vortex when viewed from streamline at any moment.
The increase in the oscillatory flow velocity amplitude will enhance the stability of communication port flow patterns, but this phenomenon cannot be avoided.
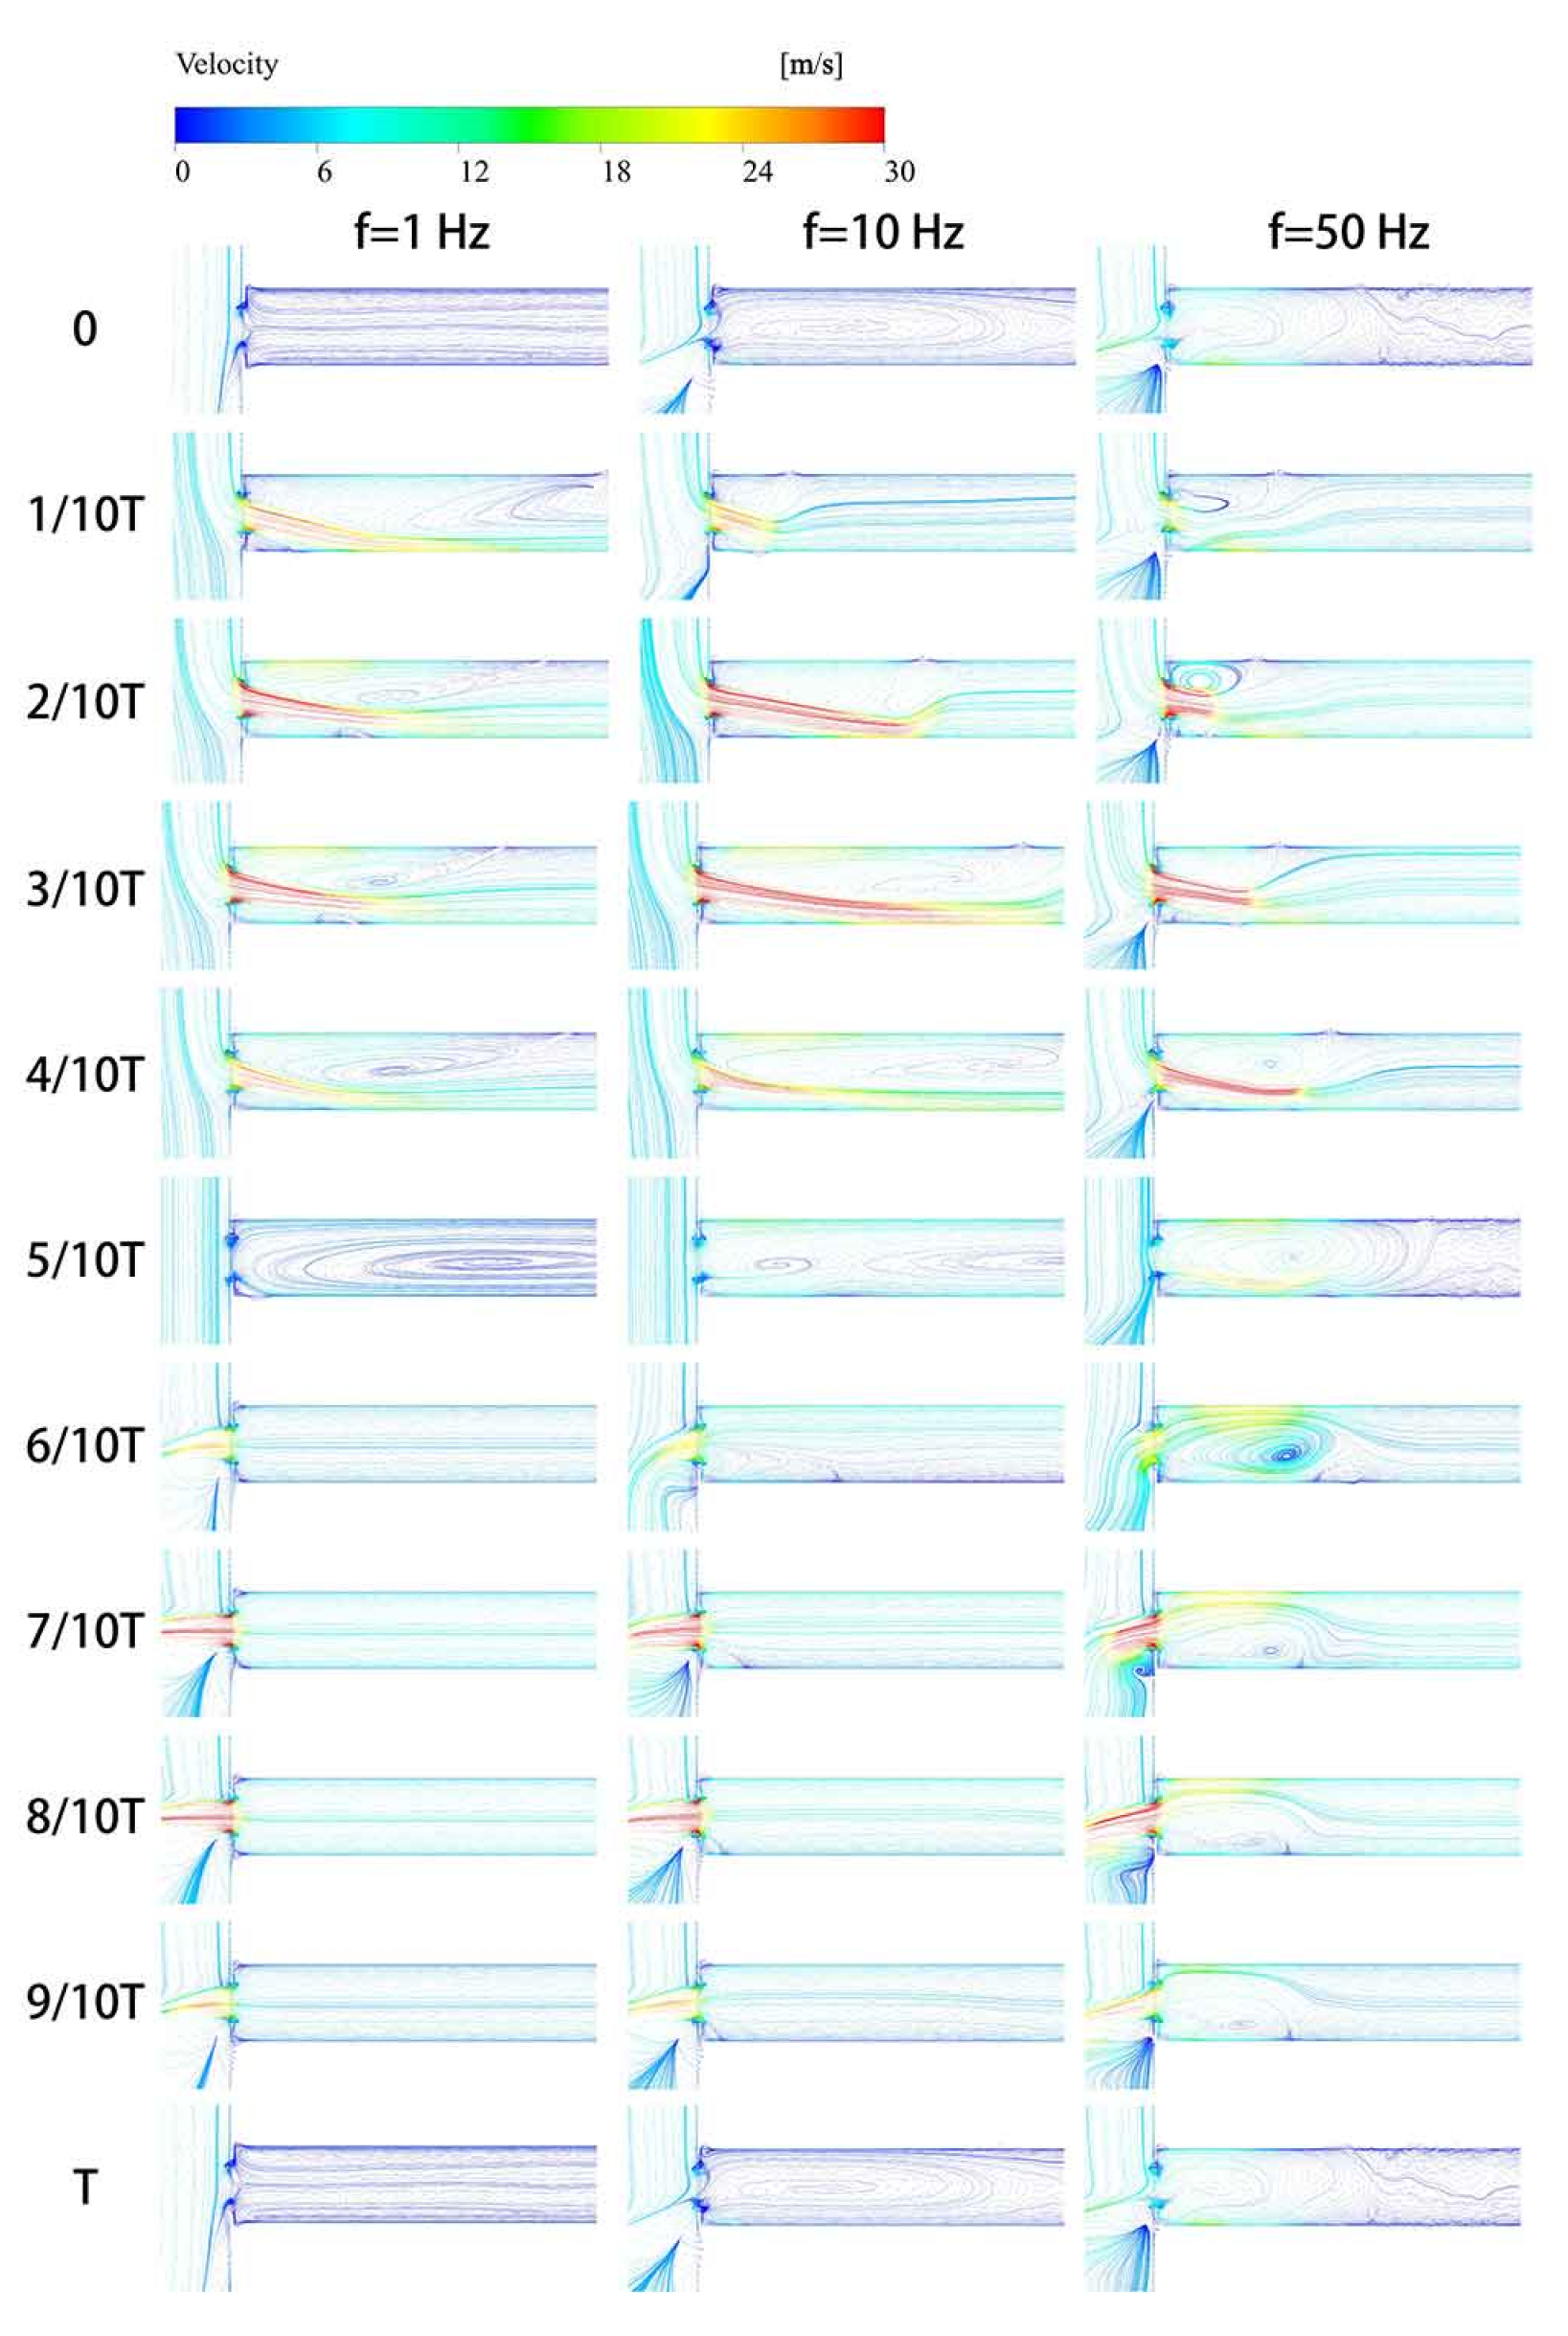
Figure 10 provides velocity vector plots at oscillatory flow frequencies of 1 Hz, 10 Hz, and 50 Hz under the flow velocity amplitude of 30 m/s. As the flow rate ratio decreases, the effect of vertical supply pipeline flow diminishes, enhancing the symmetry of the communication port. Consequently, the deviation from the orifice flow model gradually decreases.
A correlation likely exists between changes in flow patterns and the attenuation of linear resistance. Focusing on the shape of the linear resistance curve, it becomes evident that at higher oscillatory flow frequencies, the intercept characterizing the asymmetry of communication port flow shortens, meaning that the linear resistance and oscillatory flow velocity amplitude tend to exhibit a more linear correlation. And the streamline diagram provides a plausible explanation: the stable vortex generated by high-frequency flow results in symmetrical flow velocity on both sides of the communication port. As shown in
Figure 11, the presence of vortices leads to vertical flow on the right side of the communication port, to a certain extent resulting in the symmetry in the flow on both sides of the communication port. In the quasi-steady assumption-based linear resistance calculation method of the communication port flow model, the asymmetry of the flow on two sides plays a crucial role in determining its linear resistance variation, which is the cause of the injection phenomenon and the variation in communication port local loss. However, under high-oscillation-frequency conditions, the presence of vortices alters this situation, causing the linear resistance curve concerning oscillation amplitude to pass through the origin. On the other hand, it can be observed that as the oscillatory flow frequency increases, the volume of vortices decreases, consequently leading to a reduction in local loss, which suggests that the flow coefficient of the communication port will decrease with increasing frequency.
In conclusion, the primary effect of oscillation frequency appears to be the elimination of asymmetry in flow on both sides of the communication port and the reduction in flow coefficient, as evidenced by the attenuation of linear resistance.
4.3. Linear Frequency Correction Method
Based on the mechanism of the influence of oscillatory flow frequency on the linear resistance of the communication port, a method for calculating the linear resistance can be established. As analyzed earlier, we can use function
F to represent the effect of oscillatory flow frequency on linear resistance linearity and use function
G to represent the decrease in flow coefficient. As shown in
Figure 12a, we can then define the linear resistance as follows:
where
F and
G are monotonic functions of oscillation frequency that satisfy
, and
is the frequency-corrected result of
.
The simulation results are well matched as depicted in
Figure 12b. The fitting results of functions
F and
G obtained from the simulation results are the following:
Before frequency modifications, the deviation of communication port resistance between the quasi-steady assumption-based result and simulation result is 27%. This value is less than 8.5% under 10 Hz and less than 26.5% within 5~50 Hz after modifications. The results also indicate that the oscillation flow frequency within the communication port should be lower than 14.5 Hz, in order to achieve an attenuation of less than 30% in its linear resistance. In such scenarios, the quasi-steady assumption-based method is suitable for determining the linear resistance of the communication port.
4.4. Linear Inertance of Communication Port
The relationship between the linear inertance of the communication port and the oscillatory flow velocity amplitude under different oscillatory flow frequencies is shown in
Figure 13a.
This indicates that, at the same oscillating flow frequency, the flow patterns of the communication port flow may have similarities and are independent of the oscillatory flow velocity amplitude. Thus, the ratio of the communication port linear inertance to the orifice linear inertance of the same size should be a single-valued function of the oscillatory flow frequency, as follows:
where
H is a monotonic function of oscillation flow frequency, which is only meaningful within the pogo frequency range. As depicted in
Figure 13b, its value shows a good linear relationship with oscillatory flow frequency within the pogo frequency range. The fitting results of functions
H obtained from the simulation results are the follwing:
5. Conclusions
A transient CFD simulation study was conducted on the communication port of a liquid launch vehicle gas-filled accumulator to investigate the impact of supply pipeline flow velocity, oscillatory flow velocity amplitude, and frequency on its impedance. The main conclusions are summarized as follows:
(1) The linear resistance calculation results based on the quasi-steady assumption improve when the oscillation amplitude approaches zero and are further verified. The quasi-steady assumption is suitable for calculating the linear resistance of the communication port when the oscillation frequency is less than 14.5 Hz. In this research, the deviation between calculation and simulation results is less than 3.2% at an oscillatory flow frequency of 1 Hz and less than 27% at 10 Hz. It also indicates that the linear resistance value at zero oscillatory flow amplitude can be used for the communication port design, as the deviation is less than 4% for small oscillations.
(2) A linear frequency correction method on the impedance of the communication port is proposed, along with the formulae for calculating the communication port impedance, which can be used for the engineering design of gas-filled accumulators. After frequency modifications, the linear resistance of the communication port can be calculated up to 50 Hz, which is sufficient for covering the pogo frequency range. In this study, the deviation between calculation results and simulation results can be reduced to less than 26.5% within 5~50 Hz.
(3) The formation of vortices downstream of the communication port is the main reason for its impedance reduction. Destroying or deferring the formation of this vortex may prevent high-frequency failure of the communication port and makes its resistance more stable within expected oscillatory flow velocity amplitude and frequency.


