Article

Intelligent Design of Pavement Concrete Based on RSM-NSGA-III-CRITIC-VIKOR

1
College of Materials Science & Engineering, Xi’an University of Architecture and Technology, Xi’an 710055, China
2
State Key Laboratory of Green Building, Xi’an University of Architecture and Technology, Xi’an 710055, China
*
Author to whom correspondence should be addressed.
Appl. Sci. 2025, 15(9), 5030; https://doi.org/10.3390/app15095030
Submission received: 17 March 2025 / Revised: 22 April 2025 / Accepted: 29 April 2025 / Published: 30 April 2025
(This article belongs to the Special Issue Structural Mechanics in Materials and Construction)

Abstract

:
Climate-change-induced extreme environments exacerbate pavement degradation in arid regions, where traditional concrete incurs 23~40% higher life-cycle costs due to premature cracking. Particularly in the Gobi Desert, concrete pavements suffer from conflicting performance requirements—high flexural-to-compressive strength ratio (Rf/Rc), low shrinkage, and controlled porosity—with traditional design methods failing to address multi-objective trade-offs. Existing optimization methods have proven insufficient for such complex environments, with conventional approaches addressing only individual parameters or employing subjective weighting techniques that fail to capture the interrelated nature of critical performance indicators. This study develops an integrated optimization framework combining Response Surface Methodology (RSM), Non-dominated Sorting Genetic Algorithm III (NSGA-III), Criteria Importance Through Intercriteria Correlation (CRITIC) weighting, and VIšekriterijumsko KOmpromisno Rangiranje (VIKOR) decision-making to optimize the mix proportions water–cement ratio (W/C), sand ratio, and an air-entraining agent (AEA) for sustainable pavement concrete. Response Surface Methodology (RSM) analysis via Box–Behnken design revealed distinct parameter dominance: AEA exhibited the strongest non-linear effects on Rf/Rc and porosity, while W/C primarily governed shrinkage. NSGA-III generated 73 Pareto-optimal solutions, with CRITIC selecting an optimal mix (W/C = 0.35), sand ratio = 36%, AEA = 0.200%) validated experimentally (Rf/Rc = 0.141), shrinkage = 0.0446%, porosity = 2.82%. Microstructural characterization using scanning electron microscopy and low-field nuclear magnetic resonance (SEM/LF-NMR) demonstrated refined pore distribution and enhanced compactness. This framework effectively resolves trade-offs between performance indicators, providing a scientifically robust method for designing durable pavement concrete that reduces shrinkage by 13.0% and porosity by 13.5% compared to conventional mixes, lowering maintenance costs in arid regions.

1. Introduction

Pavement concrete provides significant cost advantages while delivering superior load-bearing capacity, making it particularly suitable for heavy freight traffic applications [1,2,3]. However, these concrete structures increasingly face significant challenges under extreme environments induced by climate change. As Li reports, material degradation costs approximately $4 trillion USD annually worldwide, with infrastructure failures like premature concrete deterioration in harsh environments contributing significantly to these economic losses [4]. The UN Sustainable Development Goals (SDG 9: Industry Innovation; SDG 11: Sustainable Cities) mandate urgent improvements in infrastructure resilience, as traditional concrete in these regions incur 23~40% higher life-cycle costs due to premature cracking [5,6]. Particularly in the Gobi Desert, concrete pavements experience accelerated deterioration under sustained high temperatures (40 °C) and persistent wind erosion (3.5 m/s), conditions that demand specialized concrete formulations with enhanced performance properties.
While parameters like water–cement ratio (W/C), sand ratio, and air-entraining agent (AEA) are known to influence concrete performance, the current understanding of their interactive effects on key performance indicators remains fragmented, particularly for extreme environments. Persson’s [7] research shows that increasing W/C from 0.35 to 0.45 reduces compressive strength from 100 MPa to 55 MPa, with freeze-thaw resistance declining significantly when W/C exceeds 0.45. Studies confirm that low W/C (≤0.40) combined with appropriate AEA optimize the strength–durability balance. Ma [8] found that increasing W/C from 0.3 to 0.5 increases total shrinkage by 37.3%, primarily due to easier moisture evaporation in high W/C concrete, intensifying drying shrinkage. Piasta and Zarzycki [9] demonstrated that increasing W/C raises capillary porosity, directly affecting concrete strength and durability. Kondraivendhan [10] verified this pattern, noting that higher W/C not only increases porosity but also alters pore size distribution.
Lin’s [11] experiments revealed that reducing the sand ratio by 4% improves 56 d compressive strength by approximately 10%, as coarse aggregates contribute more to compressive strength. Ding’s [12] research showed that sand ratio adjustments directly affect flexural strength in fiber-reinforced concrete. The sand ratio affects shrinkage through aggregate volume changes. Yang [13] found that increasing the sand ratio from 0.3 to 0.6 reduces coarse aggregate volume fraction from 448 L/m3 to 256 L/m3, significantly impacting concrete shrinkage behavior. Sand ratio adjustments control aggregate volume fraction and equivalent porosity, directly influencing shrinkage strain development. Lin [11] observed that while higher sand ratios improve concrete density through better particle packing, they simultaneously alter interfacial transition zone characteristics, affecting pore structure distribution.
Research [7] indicates that increasing AEA from 1% to 8% reduces compressive strength from 100 MPa to approximately 60 MPa, though moderate AEA significantly enhances freeze-thaw resistance. Li [14] confirmed that 0.7% dosage optimizes durability without excessive strength loss, while 1.4% dosage causes 30~45% strength reduction. Li [14] found that excessive AEA causes additional water to remain unhydrated, forming numerous capillary pores that generate tensile stress during moisture loss, inducing shrinkage. Experiments show that moderate AEA provides more uniform stress distribution, while excess promotes shrinkage cracking. Łaźniewska-Piekarczyk [15] demonstrated that different AEA types produce distinct pore characteristics. Li’s [14] quantitative analysis confirmed that increasing AEA content from 0% to 0.7% increases large pores by 3.56% and capillary pores by 3.05%; at 1.4%, large and capillary pores exceed 50% of total porosity, significantly affecting concrete performance.
Despite the research on individual parameter effects, knowledge gaps persist in understanding their combined influence on simultaneously optimizing the flexural–compressive strength ratio, controlling shrinkage, and regulating porosity under extreme conditions. Traditional optimization methods addressing single parameters or employing subjective weighting techniques struggle to effectively resolve multi-objective conflicts. More advanced intelligent design methods are needed to address these complex engineering challenges.
Intelligent design methods have emerged as effective tools for solving complex engineering problems. Response Surface Methodology (RSM), which integrates experimental design with mathematical modeling, has been widely applied to optimize concrete performance models [16,17,18]. RSM is effective in modeling non-linear relationships between mix proportion parameters and performance indicators [19]. However, when applied to concrete design for extreme arid environments, practical optimization problems involve multiple conflicting objectives that cannot be resolved through traditional approaches, such as balancing cost and performance or durability and strength. The Non-dominated Sorting Genetic Algorithm III (NSGA-III) generates high-quality Pareto-optimal solutions by improving the uniformity of objective distributions, providing diverse trade-offs for multi-objective optimization [20,21,22]. Despite its advantages, NSGA-III often produces a large and widespread solution set, making it challenging to identify the optimal solution with the best overall performance.
To address this challenge, multi-criteria decision-making methods have been employed for selecting solutions from Pareto fronts. Challenges remain in scientifically allocating weights and interpreting results. Traditional weighting methods, such as expert scoring and entropy weighting, rely on subjective experience or single characteristics, failing to comprehensively reflect the relative importance of different indicators. Criteria Importance Through Intercriteria Correlation (CRITIC) combines the standard deviation and correlation of indicators to objectively evaluate their importance, avoiding subjective bias. It has achieved significant success in other fields of multi-objective optimization, such as material optimization and environmental system management [23,24]. VIšekriterijumsko KOmpromisno Rangiranje (VIKOR), a compromise ranking approach, has been successfully applied in areas such as mechanical design and energy planning. VIKOR ranks multi-objective solution sets reliably, even in scenarios with conflicting criteria or unclear preferences, demonstrating strong decision-making potential [25,26]. However, many existing studies have applied techniques in isolation, lacking an integrated framework for intelligent design, particularly in multi-objective optimization for pavement concrete mix proportions.
To bridge the research gaps, this study develops an integrated optimization framework that systematically addresses the multi-objective challenges of pavement concrete design. The framework combines complementary methodologies to create a comprehensive optimization system: RSM establishes accurate mathematical models capturing the non-linear relationships between mix variables (W/C, sand ratio, AEA) and concrete performance indicators; NSGA-III efficiently explores the global solution space to generate Pareto-optimal alternatives that conventional methods cannot identify; CRITIC objectively quantifies performance indicator priorities through a data-driven analysis of standard deviations and interrelationships, eliminating the subjective bias inherent in traditional weighting methods; and VIKOR provides scientific decision-making for selecting the optimal compromise solution from complex multi-criteria alternatives. This integration creates a closed-loop “modeling–optimization–weighting–decision” system that resolves the fundamental trade-offs in concrete mix design for extreme environments. The framework systematically optimizes key performance indicators, including Rf/Rc, dry shrinkage, and porosity, demonstrating both theoretical rigor and practical effectiveness for designing high-performance pavement concrete under the complex engineering conditions found in arid regions.

2. Materials and Methods

2.1. Raw Materials

Portland cement with high sulfate resistance (P·HSR42.5) was employed, sourced from the Jianshe brand from Shandong Chongzheng Special Cement Co., Ltd., Zibo, Shandong, China. The fine aggregate used was river sand, with a fineness modulus of 2.70, and the coarse aggregate consisted of crushed stone with a particle size distribution of 5~10 mm (30%) and 10~20 mm (70%). A water-reducing agent and AEA were used as additives, and the water-reducing agent was polycarboxylic acid high-efficiency water-reducing agent (water reduction rate ≥ 30%), both of which were supplied by Zhongyan Science and Technology Co., Ltd. (Beijing, China). The mixing water was tap water. The chemical composition of the cement is provided in Table 1.

2.2. Multi-Objective Optimization Framework

In this study, a collaborative optimization framework combining RSM, NSGA-III, CRITIC objective assignment, and VIKOR compromise sorting is constructed. This framework addresses significant limitations in conventional concrete optimization approaches by integrating complementary methodologies that collectively resolve the complex trade-offs between critical performance indicators in extreme environments. The RSM reveals that the parameter non-linear interaction mechanism, NSGA-III, generates the global Pareto solution set, CRITIC quantifies the dynamic weights of the indicators, and VIKOR achieves conflict elimination to systematically solve the multi-objective collaborative optimization challenges.

2.2.1. RSM Model Design Method

RSM was applied to analyze and optimize the non-linear interactions between W/C, sand ratio, and AEA. The strength of RSM lies in its ability to quantify both main effects and interaction effects between parameters through polynomial models, capturing complex relationships that linear models cannot represent. The Box–Behnken experimental design (BBD) was employed, with dry shrinkage, porosity, and Rf/Rc selected as response variables. BBD was selected for its efficiency, requiring fewer experimental runs than full factorial designs while maintaining the ability to estimate quadratic terms and interactions—critical for understanding the complex parameter relationships in concrete performance. A total of seventeen sample sets were generated using Design-Expert software, including twelve sets for model fitting and five sets for validation. The model’s significance was evaluated through analysis of variance (ANOVA), and the coefficient of determination (R2) and the adjusted coefficient of determination (Rp2) were used to assess the model’s fitting and predictive performance. Analytical methods followed the approach outlined in references [27,28,29,30]. Factors and codings are shown in Table 2.

2.2.2. Multi-Objective Optimization and Decision-Making Method

The study introduces a multi-objective optimization and decision-making framework based on NSGA-III and the CRITIC-VIKOR method to address the trade-offs among indicators in concrete performance optimization.
As shown in Figure 1, NSGA-III employs a reference point distribution mechanism to improve coverage and uniformity within the solution set for high-dimensional objective optimization, making it suitable for complex multi-objective problems. Traditional evolutionary algorithms typically suffer from deteriorating performance when handling more than two objective functions, which is particularly problematic for concrete performance optimization where porosity, shrinkage, and Rf/Rc must be simultaneously considered. NSGA-III addresses this limitation through its structured reference point mechanism, which systematically partitions the normalized objective space to maintain solution diversity. This approach ensures comprehensive exploration of the Pareto front by associating candidate solutions with uniformly distributed reference points, thereby preserving diversity throughout the evolutionary process. This approach is particularly advantageous for concrete optimization problems where balanced trade-offs are critical for overall performance. In concrete performance optimization, NSGA-III effectively balances key indicators such as porosity, Rf/Rc, and dry shrinkage, providing reliable solutions for complex multi-objective problems.
The decision-making process, illustrated in Figure 2, integrates the CRITIC and VIKOR methods to prioritize the Pareto solution set. The CRITIC method quantifies the objective importance of indicators through a dual consideration of contrast intensity and conflict criteria. The standard deviation of each normalized criterion measures the intensity of contrast, while correlation coefficients between criteria pairs measure the conflict between criteria. This mathematical approach proves particularly valuable for concrete optimization, where performance indicators exhibit complex interdependencies that subjective weighting methods often fail to capture accurately.
Meanwhile, VIKOR implements a systematic compromise ranking based on distance functions from the ideal solution. The method calculates utility measure (Si) representing “group utility” and regret measure (Ri) representing maximum individual regret, then combines these measures into a comprehensive index (Qi). For concrete mix design, this approach is particularly suitable as it prevents solutions with excellent average performance but critical deficiencies in individual properties—a significant advantage when optimizing for extreme environments where weakness in any single property could lead to premature failure. The adjustable compromise parameter in VIKOR provides additional flexibility to balance between maximum group utility and minimum individual regret strategies [31,32,33,34].
Traditional research methods applied in isolation demonstrate significant limitations for concrete optimization in extreme environments. RSM alone provides mathematical models but lacks global optimization capabilities; NSGA-III generates diverse Pareto solutions but offers no mechanism for final selection; weighting methods without objective statistical foundations introduce bias that compromises optimization outcomes. To overcome these limitations, this study implements a sequential methodology where RSM-derived prediction models serve as objective functions for NSGA-III optimization, generating a diverse Pareto-optimal solution set. These solutions are then normalized and processed through CRITIC to calculate objective weights based on statistical analysis of performance indicators. Finally, VIKOR applies these weights to compute compromise indices, enabling a scientifically based selection of the optimal concrete mix proportions that balance conflicting performance requirements for arid environment applications.
Figure 2. The detailed process of the CRITIC-VIKOR decision-making method [35].
Applsci 15 05030 g002

2.3. Mix Design

The mix design followed the JTG/T F30-2014 specifications [36] with the primary target of achieving a 28 d flexural strength of 5.0 MPa while simultaneously satisfying critical workability and durability requirements for pavement concrete in extreme arid environments. After comprehensive preliminary testing and a literature review, W/C, sand ratio, and AEA were identified as the most influential independent variables affecting concrete performance in Gobi Desert conditions, where pavement infrastructure faces severe environmental challenges.

2.3.1. Selection of Independent Variables

W/C ranged from 0.35 to 0.43, carefully determined based on code recommendations and the target flexural strength requirements. This parameter was selected as a primary variable due to its fundamental role in controlling the hydration reaction kinetics and resultant pore structure of the cement paste, directly influencing both strength development and long-term durability of the concrete. As demonstrated by Cui [6], the optimization of W/C is critical for concrete pavements in extreme environments with large daily temperature differences, where inappropriate W/C selection can lead to significant performance degradation and premature failure. Ziari [37] further confirmed that W/C significantly impacts concrete’s susceptibility to plastic shrinkage cracking in arid conditions characterized by high temperatures and wind speeds—conditions analogous to the Gobi Desert environment. Lower W/C values (0.35) provide enhanced strength and reduced permeability, while higher values (0.43) improve workability but potentially compromise durability in severe exposure conditions.
The sand ratio was established between 36% and 42%, a range meticulously optimized through extensive slump testing to ensure a target slump of 50 mm, thus achieving an optimal balance between mechanical performance and workability. Kardos and Durham [38] demonstrated that aggregate proportioning significantly affects not only the mechanical properties but also the permeability and durability characteristics of concrete pavements. The lower boundary (36%) ensures adequate coarse aggregate content for structural integrity, while the upper boundary (42%) prevents excessive sand content that could lead to workability issues and increased shrinkage potential.
AEA dosage ranged from 0.1% to 0.3% by mass of cement, validated through systematic air content testing. This variable was selected due to its critical role in creating a controlled network of microscopic air bubbles that significantly improves freeze–thaw resistance and reduces internal stresses caused by thermal variations. Xie [39] confirmed that proper air void distribution is essential for enhancing pavement durability in severe environmental conditions. Our experimental validation demonstrated that this dosage range successfully maintained air content within 5 ± 0.5%, optimizing the balance between strength and durability. The introduction of uniformly distributed microbubbles significantly improved pore size distribution and reduced shrinkage potential through stress redistribution mechanisms.
Additionally, a water-reducing agent dosage was fixed at 0.6% of the cement mass, optimized through multiple trial mixes to ensure consistent flowability and mixture uniformity without affecting the primary variables under investigation.

2.3.2. Selection of Response Variables

Three critical performance indicators were selected as response variables to comprehensively evaluate pavement concrete performance.
Rf/Rc was selected as a primary indicator of concrete toughness and crack resistance capability. Unlike individual strength measurements, this ratio provides a more comprehensive assessment of the material’s structural behavior under the complex loading conditions experienced in pavement applications. As demonstrated by Achilleos [40], the Rf/Rc is particularly significant for predicting long-term performance in fiber-reinforced concrete pavements subjected to flexural fatigue loading.
Dry shrinkage was identified as a critical durability parameter, particularly relevant in the Gobi Desert environment where extreme temperature variations and low humidity significantly increase cracking potential. Inyim [41] identified shrinkage as one of the most decisive factors affecting long-term pavement durability in arid regions. This parameter directly measures the concrete’s volumetric stability and, consequently, its resistance to environmentally induced cracking.
Porosity was selected to evaluate the microstructural properties that fundamentally govern transport mechanisms and long-term durability. Loijos [42] established that pore structure characteristics, particularly pore size distribution and connectivity, directly influence both the mechanical performance and durability aspects of pavement concrete. This parameter provides essential insights into the material’s resistance to aggressive environmental factors prevalent in arid regions.
A Box–Behnken experimental design under the RSM framework was employed to systematically analyze both the individual effects and interactions among these variables. A total of seventeen experimental groups (including five centerpoint replicates) were constructed to ensure statistical robustness and model reliability. The comprehensive experimental design parameters are presented in Table 3.

2.4. Specimen Preparation and Testing Procedures

2.4.1. Preparation of Concrete Specimens and Mechanical Property Testing

The concrete was mixed using an HJW-60 mixer in strict accordance with JTG 3420-2020 [43]. The mixing procedure involved the following steps: sand and cement were dry mixed for 2 min, followed by the addition of coarse aggregate for 1 min. Water, superplasticizer, and AEA were then incorporated, and the mixture was stirred for an additional 2 min until homogeneous. After mixing, the slump test was performed. The fresh concrete was cast into lubricated 100 mm cube molds, compacted on a vibrating table until surface bleeding ceased and no air bubbles were visible, and then smoothed and covered with plastic film.
The specimens were demolded after 24 h. A uniform layer of paraffin wax emulsion was applied to the surface to reduce moisture evaporation and promote early hydration. The demolded specimens were cured under natural conditions for 28 d. Subsequently, flexural strength testing was performed using a WAW-1000D electro-hydraulic servo universal testing machine, and compressive strength testing of the cubes was conducted with a TYA-2000 electro-hydraulic pressure testing machine from Chengdu Dong’ao Testing Instrument Equipment Co., Ltd., Chengdu, China.

2.4.2. Dry Shrinkage Environment Simulation

An experimental apparatus was custom-designed to investigate the impact of high-temperature and wind erosion conditions in the Gobi Desert on the dry shrinkage performance of concrete, as shown in Figure 3. The environmental parameters were carefully determined through an analysis of comprehensive meteorological data collected from the central Asian arid region over a 10-year period (2013~2023), as illustrated in Figure 4a (temperature variation) and Figure 4b (wind velocity variation). The meteorological analysis presented in Figure 4a revealed peak summer temperatures averaging 36 °C in July, while Figure 4b demonstrated maximum sustained wind velocities of 3.4 m/s during the same period. Based on this data, the experimental parameters (40 °C surface temperature and 3.5 m/s wind velocity) were selected to represent the characteristic environmental conditions, with the temperature parameter accounting for the direct exposure of pavement surfaces to solar radiation. The apparatus simulates typical environmental conditions, including a wind speed of 3.5 m/s and a surface temperature of 45 °C, using adjustable fans and a constant temperature system. Validation testing confirmed that the laboratory simulation maintained temperature stability within ±0.5 °C of the target value and wind velocity uniformity within ±0.2 m/s across the specimen exposure area throughout the testing duration. Vibrating wire strain gauges were embedded in the concrete specimens to enable real-time monitoring of strain. The experimental settings were based on long-term meteorological data from the Gobi Desert, ensuring accurate and representative simulations. The setup facilitates the optimization of pavement concrete performance under extreme environmental conditions.

2.4.3. LF- NMR Testing for Pore Characterization

A Niumag LF-NMR core analyzer (magnetic field strength of 0.55 T, operating at 32 °C) was used to analyze the pore characteristics of concrete specimens. Low-Field Nuclear Magnetic Resonance (LF-NMR) is a non-destructive testing technique based on the relaxation behavior of hydrogen nuclei (protons) in a magnetic field. Its core principle involves measuring the transverse relaxation time (T2) of hydrogen atoms in pore water to indirectly characterize the pore structure of materials. T2 time reflects the rate at which proton spins lose phase coherence in a magnetic field, primarily influenced by interactions between the pore surface and water [45]. Smaller pore diameters result in more pronounced surface relaxation effects and shorter T2 times, while larger pores yield longer T2 times. Based on T2 relaxation spectra, LF-NMR technology quantifies these behaviors, providing detailed data on pore distribution. Prior to testing, specimens were vacuum-saturated for 24 h by placing concrete cube samples (standard size 100 mm3) in a vacuum chamber at −0.1 MPa for 24 h, ensuring complete water saturation of all pores. For data acquisition, saturated samples were placed in the LF-NMR probe where 90–180° pulse sequences (CPMG sequences) were applied to record T2 relaxation decay signals. Data analysis involved using inversion algorithms (such as non-negative least squares method) to convert T2 decay curves to T2 spectra, characterizing the distribution of different pore sizes. Using a surface relaxation coefficient (ρ = 10 μm/s, calibrated based on the literature for cementitious materials), T2 times (ms) were converted to equivalent pore diameters (d = ρ × T2). The detection range of the NMR (0.1~100 μm) effectively captures the multiscale pore distributions in concrete [46].

2.4.4. SEM Analysis Conditions for Pore Characterization

SEM was used to observe the microstructure of the optimal mix and the control group concrete specimens after 28 d of drying shrinkage under conditions of 45 °C and 3.5 m/s wind speed, with a focus on analyzing the changes in porosity. The observations were made using a Sigma 300 field emission scanning electron microscope (FESEM) from ZEISS AG, Oberkochen, Germany with an acceleration voltage set to 5 keV. Prior to analysis, the samples were gold-coated to ensure sufficient conductivity and to avoid charging effects.

3. Results and Analysis

Compressive strength, flexural strength, dry shrinkage, and LF-NMR tests were conducted to provide experimental data for the 17 mix proportions generated using BBD. The experimental results were subsequently used as inputs to develop an RSM model in Design-Expert 13 software, facilitating the analysis of interactions between mix parameters and their effects on key performance indicators, such as Rf/Rc, shrinkage, and porosity.

3.1. Development and Validation of the RSM Model

RSM encompasses a collection of statistical and mathematical techniques employed in experimental design, model fitting, regression analysis, and the examination of interactions between independent variables. RSM constructs the relationship between objective functions and design variables, enabling the prediction of system performance.
The relationship between the objective function y and design variables x1, x2, …, xk can be expressed using the following linear or quadratic models:
Linear model:
y = a 0 + i = 1 k a i x i + ε
Quadratic model:
y = a 0 + i = 1 k a i x i + i = 1 k a i i x i 2 + i < j a i j x i x j + ε
where a0 is the intercept, ai are the linear regression coefficients, and ε is the residual error. Where aii represents the quadratic effect of xi, and aij represents the interaction effect between xi and xj.
RSM is commonly employed to model non-linear relationships between objective functions and design variables using quadratic polynomials. The polynomial regression model enables the prediction of target output or system performance based on the given parameters.
The BBD approach in Design-Expert 13 software, along with the least squares method, was used to perform non-linear fitting on the test results summarized in Table 4. The process led to the development of response surface models for the 28 d Rf/Rc, shrinkage, and porosity, as expressed in Equations (3)–(5).
y 1 = 2.02 + 6.16 x 1 + 2.39 × 10 2 x 2 + 11.17 x 3 1.77 x 1 x 3 0.28 x 2 x 3 7.51 x 1 2 27.33 x 3 2 + 0.73 x 2 x 3 2
y 2 = 1.79 + 3.68 x 1 + 0.06 x 2 0.45 x 3 5.67 x 1 x 2 + 2.73 x 1 x 3 + 3.65 x 2 x 3 5.17 x 1 2 7.26 × 10 4 x 2 2 0.48 x 3 2
y 3 = 0.26 + 1.75 x 1 + 3.82 × 10 3 x 2 + 28.53 x 3 0.02 x 1 x 2 40.39 x 1 x 3 0.28 x 2 x 3 1.01 x 1 2 + 1.58 × 10 4 x 2 2 53.59 x 3 2
In the equations, x1 represents W/C; x2 represents the sand ratio; x3 represents AEA; y1 represents Rf/Rc; y2 represents the shrinkage; and y3 represents the porosity.
Table 4. Experimental design and results.
NumberFactorTest Result
x1x2/%x3/%y1y2/%y3/%
10.35360.20.1502.820.0433
20.35390.10.1283.880.0442
30.35390.30.1576.360.0494
40.35420.20.1234.000.0482
50.39360.10.1364.390.0492
60.39360.30.1458.550.0548
70.39390.20.1352.680.0499
80.39390.20.1473.040.0506
90.39390.20.1413.710.0416
100.39390.20.1393.230.0680
110.39390.20.1553.540.0476
120.39420.10.1573.360.0504
130.39420.30.1824.680.0526
140.43360.20.1294.040.0571
150.43390.10.1425.770.0512
160.43390.30.1432.790.0499
170.43420.20.1253.280.0521
Ensuring the reliability of the RSM model is essential for obtaining accurate optimization results. The study assessed the model’s performance through goodness-of-fit analysis and ANOVA, focusing on correlation and reliability.
Table 5 presents key metrics for model evaluation, including R2, Ra2, Rp2, Ra2Rp2, and precision. All models achieved R2 values above 0.8, confirming the ability to effectively represent non-linear interactions between influencing factors and response variables. Moreover, the Ra2Rp2 values were consistently below 0.1, indicating strong agreement between the training and testing datasets and reflecting stable predictive performance. Precision values exceeding four further demonstrate close alignment between the predicted and observed data.
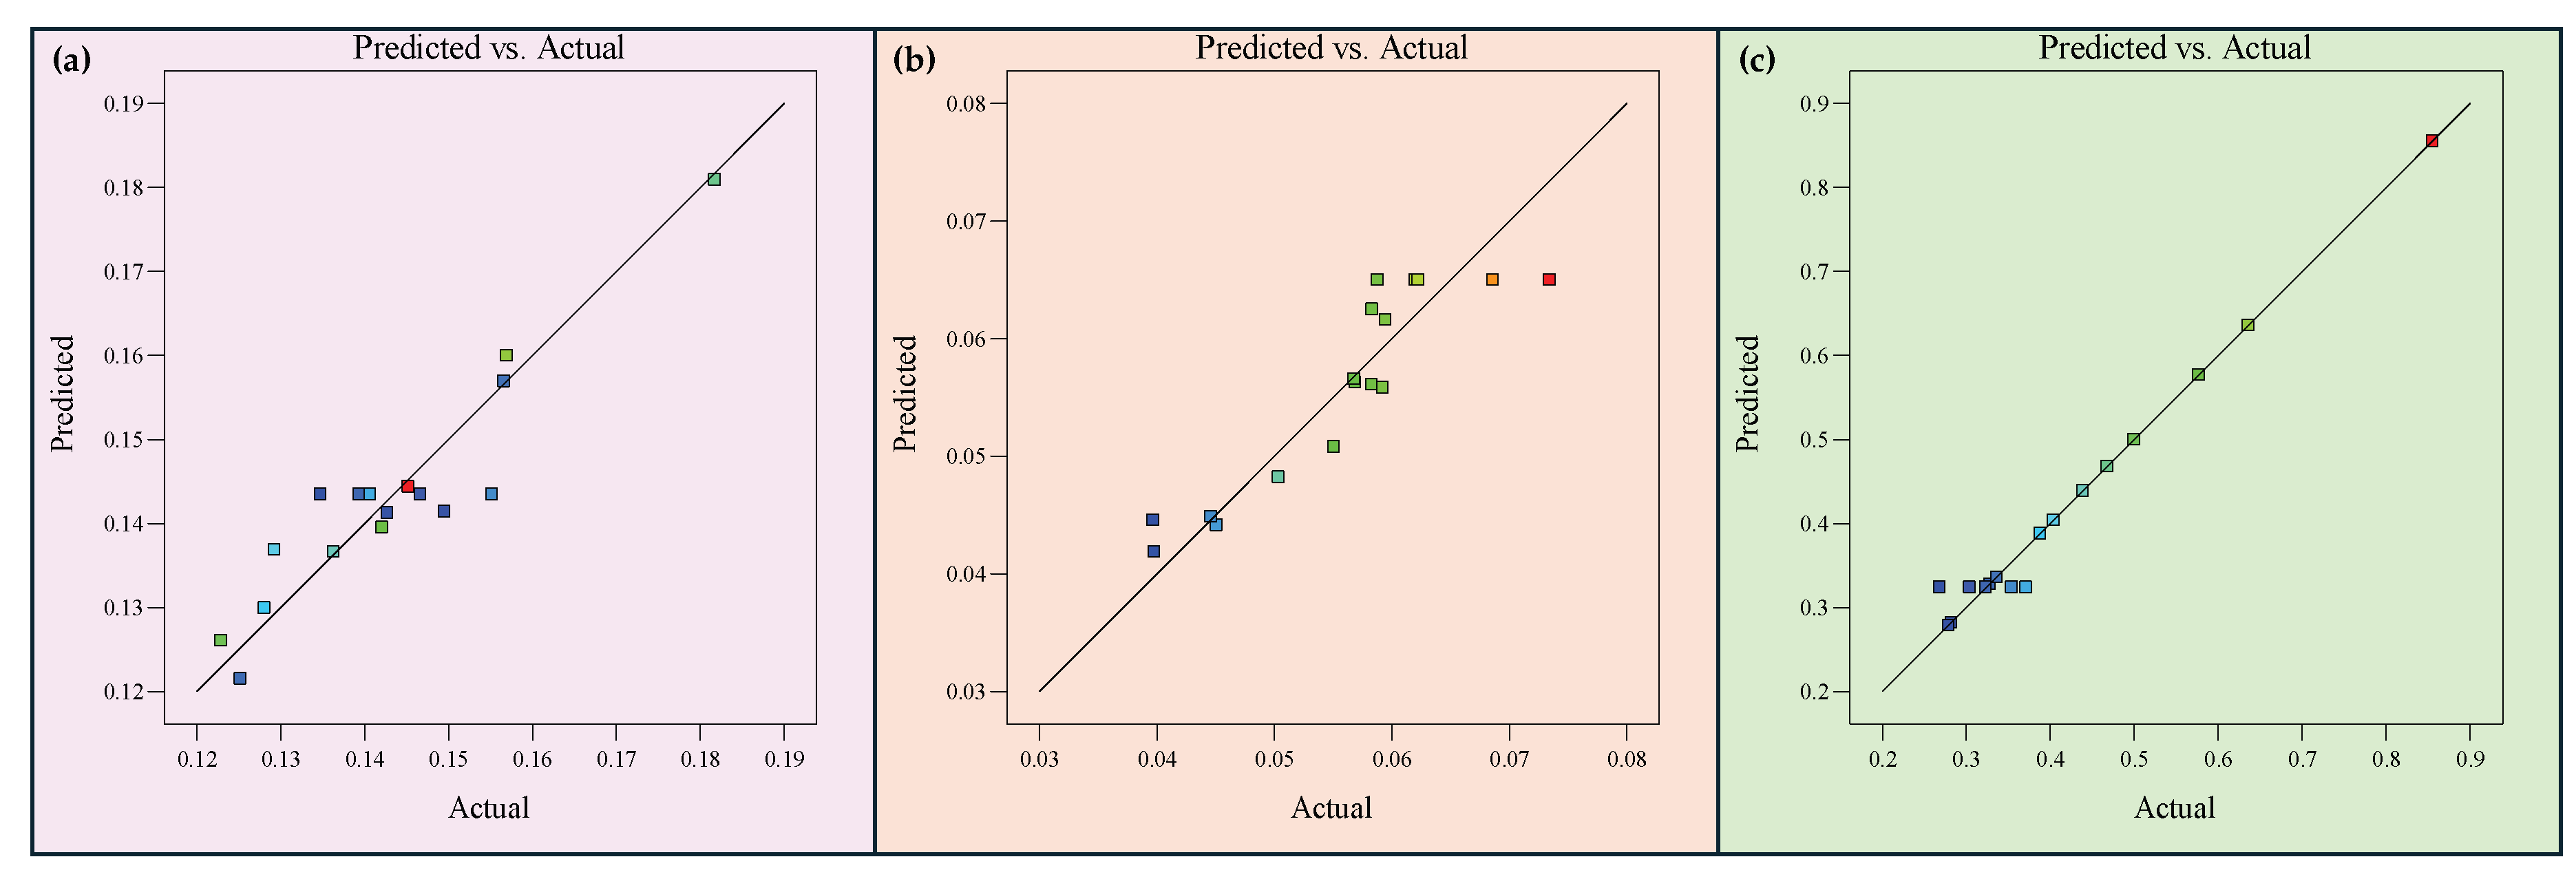
Figure 5 compares the predicted and actual values for the quadratic regression models, along with the regression lines. The alignment of data points for shrinkage, porosity, and Rf/Rc with the regression lines highlights the strong predictive accuracy and goodness-of-fit of the models.
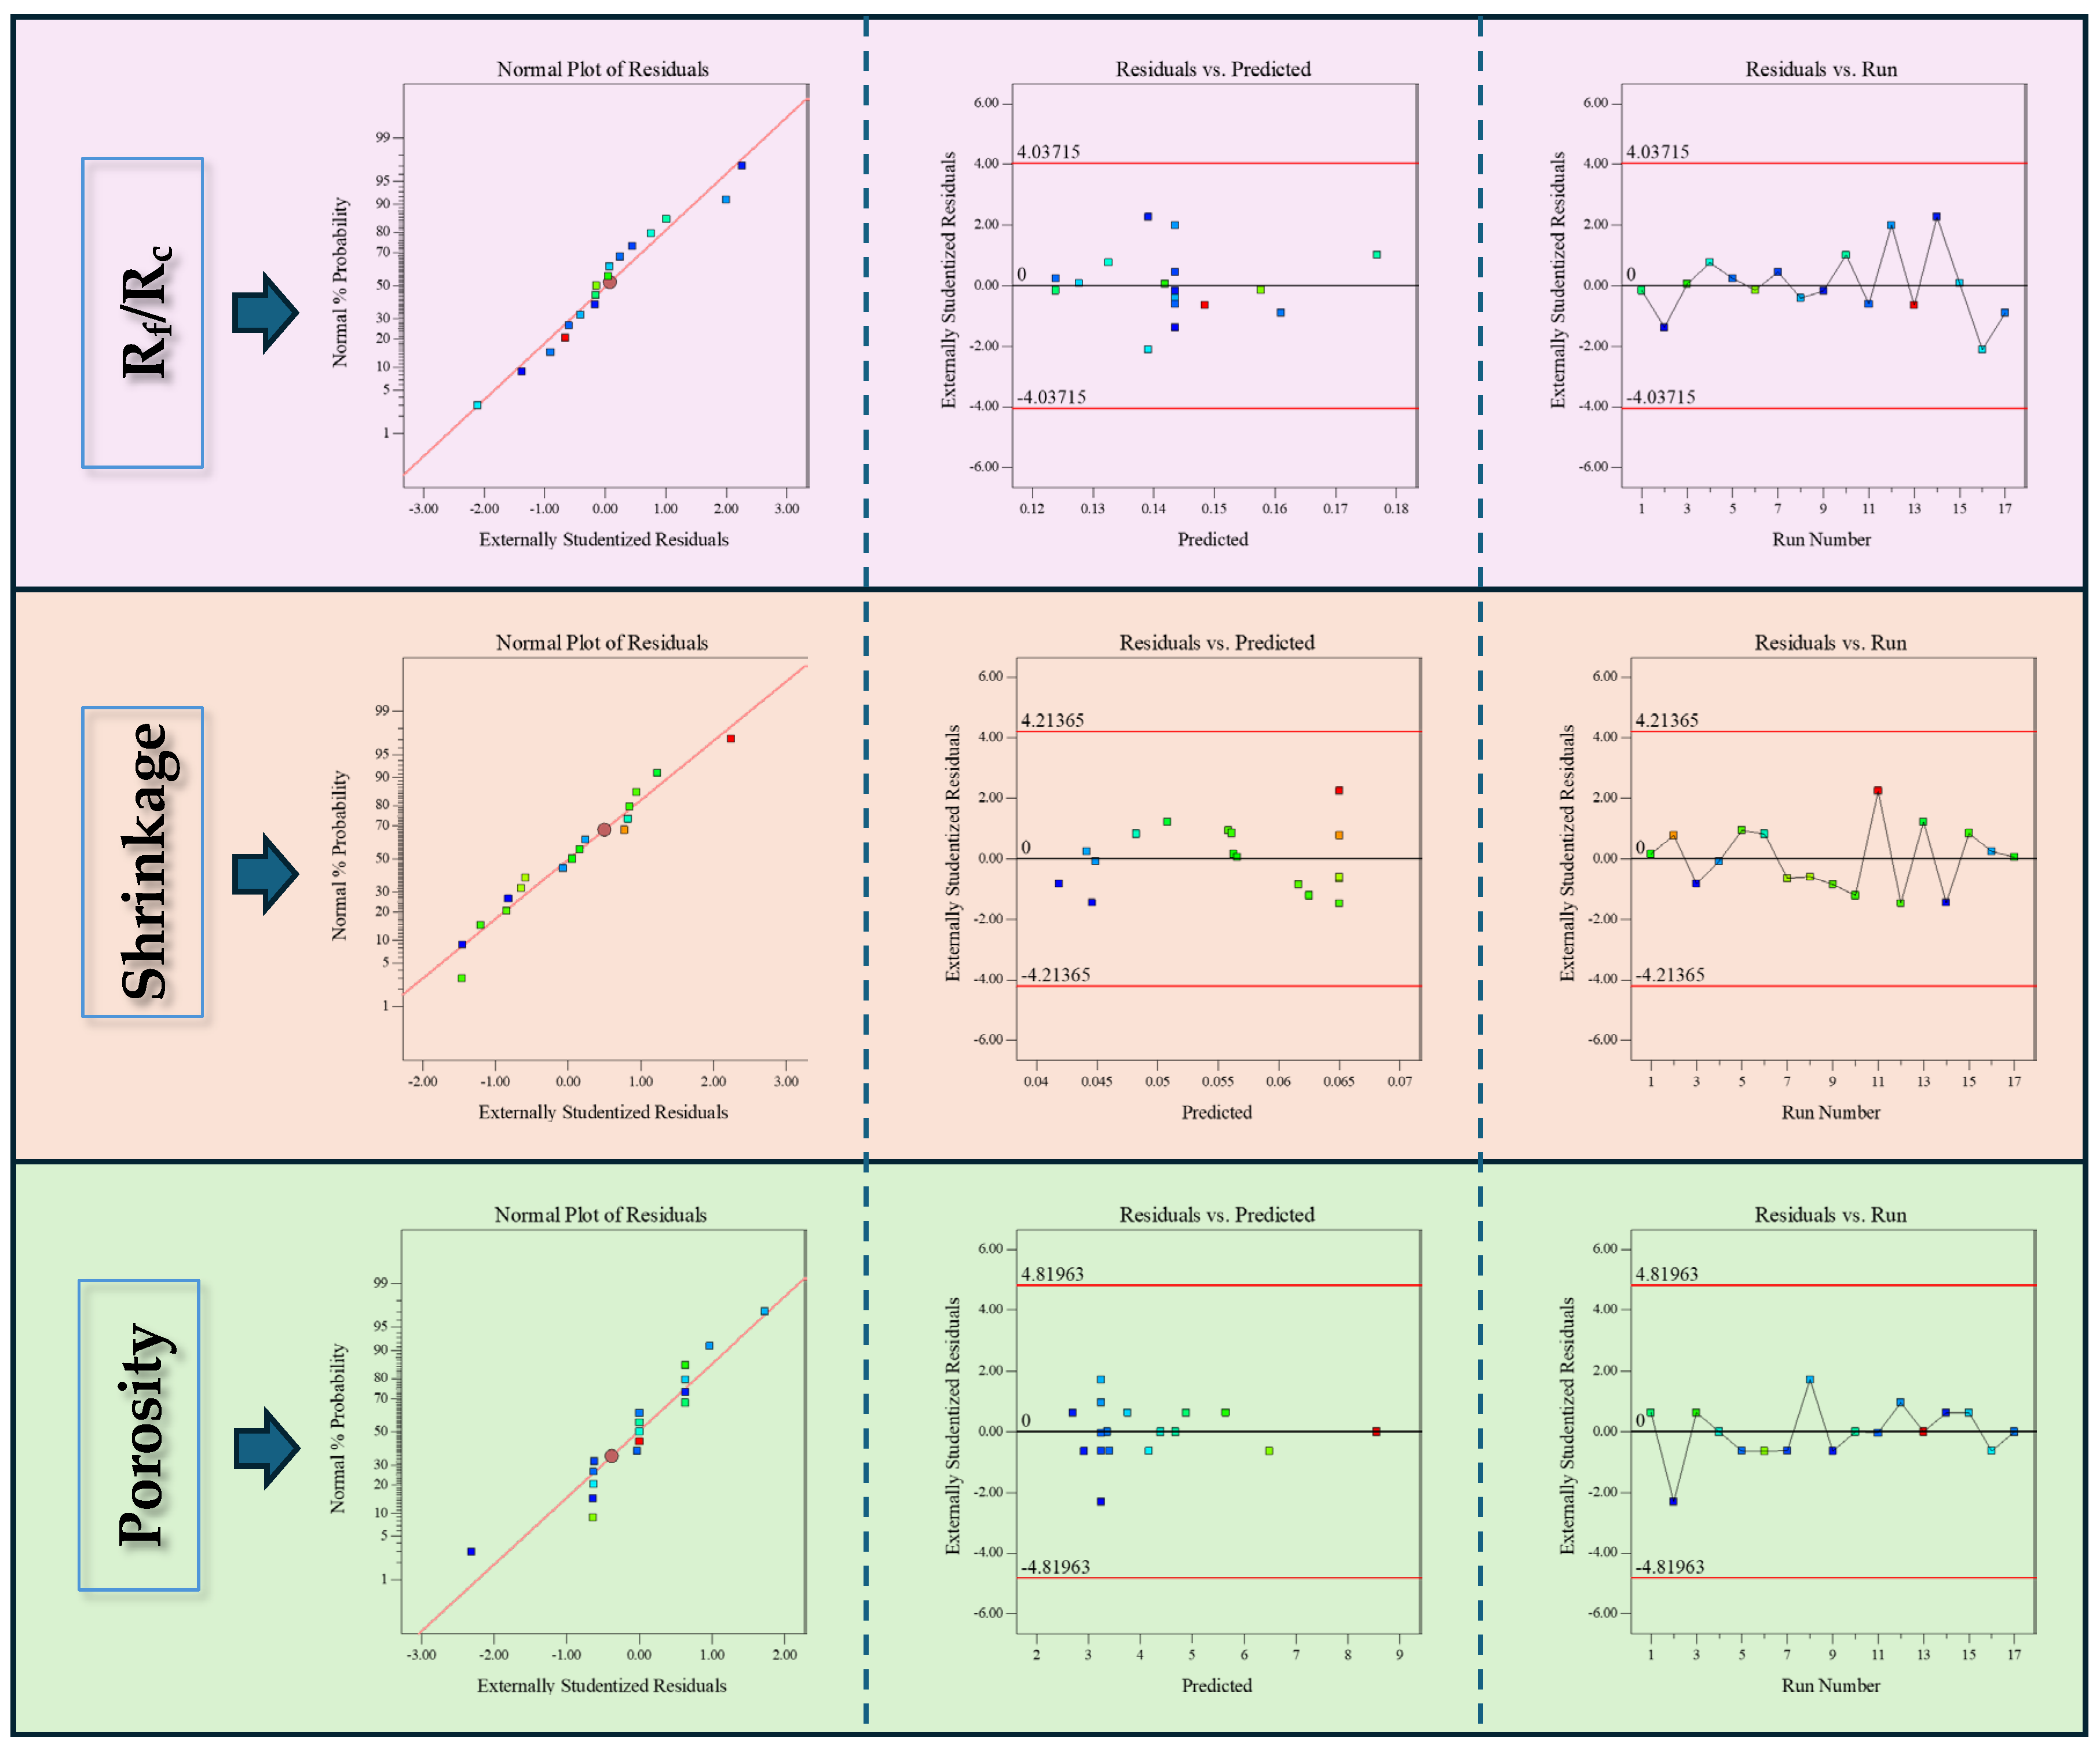
Figure 6 illustrates the normal distribution of the residuals from the response surface model. Residual analysis is a statistical technique used to evaluate the reliability of a model by examining the residuals and associated statistical metrics. A distribution of residuals that closely approximates a normal distribution indicates a good model fit, suggesting that the model has effectively captured the underlying patterns and trends within the data. The closer the observed data points are to the reference line in the plot, the better the model’s alignment with the equation. The normal probability plot reveals that the scatter points are uniformly distributed around the line, further confirming that the residuals conform to a normal distribution and that no significant outliers are present.
Table 6 presents the ANOVA results for various response surface models (e.g., y1, y2, and y3). The results indicate that the p-values for the y1, y2, and y3 models are all less than 0.01, which confirms that high statistical significance and reliability are achieved. The models are effective in describing experimental data and are suitable for subsequent optimization. Additionally, the p-values for the lack-of-fit terms in all models exceed 0.05, indicating good model fitting with no significant lack-of-fit issues. For the y1 model, significant effects were observed in the interaction terms x2 x3 (F = 22.78, p = 0.0018) and x1x3 (F = 22.13, p = 0.0024), highlighting the critical role played by the interactions in the model. However, the interaction term x1x2 was found to have a minimal contribution to the model’s predictive power, as suggested by its higher p-value. In the y2 model, both the main effects of x2 and x3 were found to be significant. Specifically, x2 (F = 11.69 p = 0.0097) contributed significantly to the model. Regarding the interaction terms, significance was found in x1x2 (F = 18.56), x1x3 (F = 14.67, p = 0.0232), and x2x3 (F = 13.45), all of which play important roles in the fitting and prediction of the y2 model. For the y3 model, significant effects were identified in the interaction terms x1x2 (F = 17.26, p = 0.0089), x1x3 (F = 13.65, p = 0.0072), and x2x3 (F = 18.17, p = 0.0085), indicating their pivotal influence on the model. Therefore, the y1, y2, and y3 models were selected for further analysis and optimization, ensuring the scientific rigor and accuracy of the results.

3.2. Analysis and Discussion Based on the RSM Model

3.2.1. Response Surface Analysis of Rf/Rc

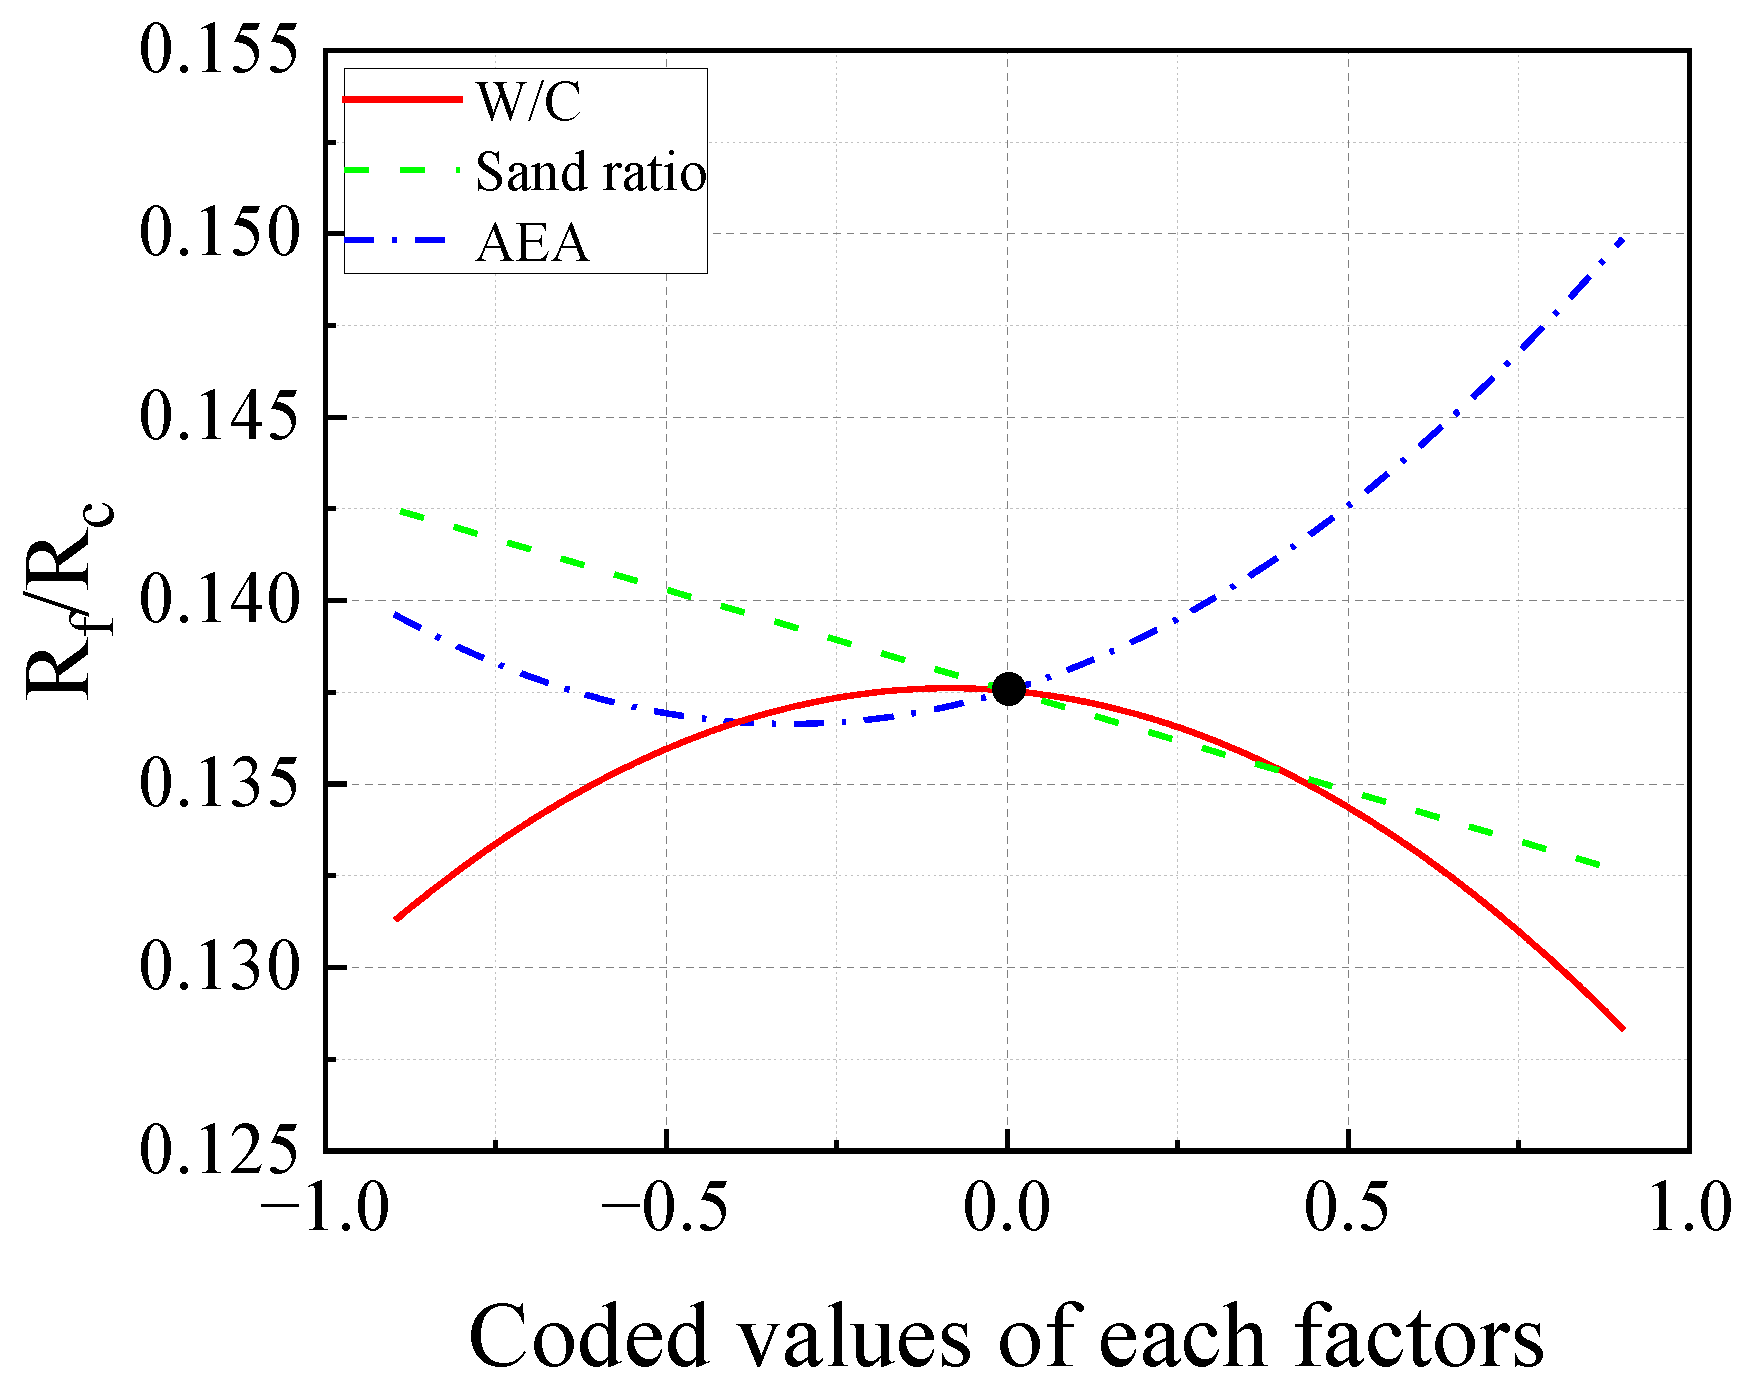
Figure 7 presents the response trajectories of Rf/Rc as influenced by W/C, sand ratio, and AEA. The analysis shows that Rf/Rc increases with W/C in the range of 0.36 to 0.39 but decreases beyond 0.39. The sand ratio shows a negative correlation with Rf/Rc, where higher sand ratios lead to lower Rf/Rc. For AEA, Rf/Rc decreases slightly in the range of 0.100~0.170% but increases significantly in the range of 0.170~0.300%. Judging by the curvature, AEA has the most significant effect on Rf/Rc, followed by W/C, with the sand ratio exhibiting a relatively smaller impact.
Figure 8a–d illustrate the interactions between key mix design parameters and their effects on Rf/Rc. The relationship between W/C and AEA is explored in Figure 8a, where the contour gradient shows that AEA has a slightly greater impact than W/C. Within the W/C range of 0.37~0.39 and AEA range of 0.280~0.300%, the combination of the two factors synergistically enhances Rf/Rc. Figure 8c highlights the interaction between the sand ratio and AEA, where the effect of AEA significantly outweighs that of the sand ratio. The most pronounced interaction occurs when the sand ratio is between 40.0% and 42.0% and AEA is between 0.270% and 0.300%, optimizing Rf/Rc.
The results can be attributed to the following single-factor effects: an optimal sand ratio effectively fills voids between coarse aggregates, increasing concrete compactness and improving both compressive and flexural strength [11]. However, an excessive sand ratio weakens the coarse aggregate skeleton, leading to strength reduction. An increase in W/C raises porosity, which significantly decreases compressive strength, thereby increasing Rf/Rc [7]. Similarly, a moderate AEA introduces microbubbles that slightly enhance flexural strength but reduce compressive strength due to decreased compactness, ultimately increasing Rf/Rc [7].
Under the combined influence of W/C and AEA, as illustrated in Figure 8a,b, a low W/C results in reduced hydration products, making the pore structure heavily reliant on AEA. At this stage, a higher AEA enhances microbubble formation, effectively optimizing crack propagation paths and improving flexural strength. However, as AEA increases further, the density of the concrete decreases, reducing compressive strength and leading to a higher Rf/Rc.
As shown in Figure 8c,d, at relatively high sand ratios, the filling effect enhances the density of the aggregate skeleton, creating a more robust structural foundation. Concurrently, the introduction of AEA optimizes stress distribution within the concrete matrix by generating microbubbles, which slightly enhances flexural strength. However, an excessive AEA leads to a decline in compressive strength due to reduced density, increasing the Rf/Rc.

3.2.2. Response Surface Analysis of Shrinkage

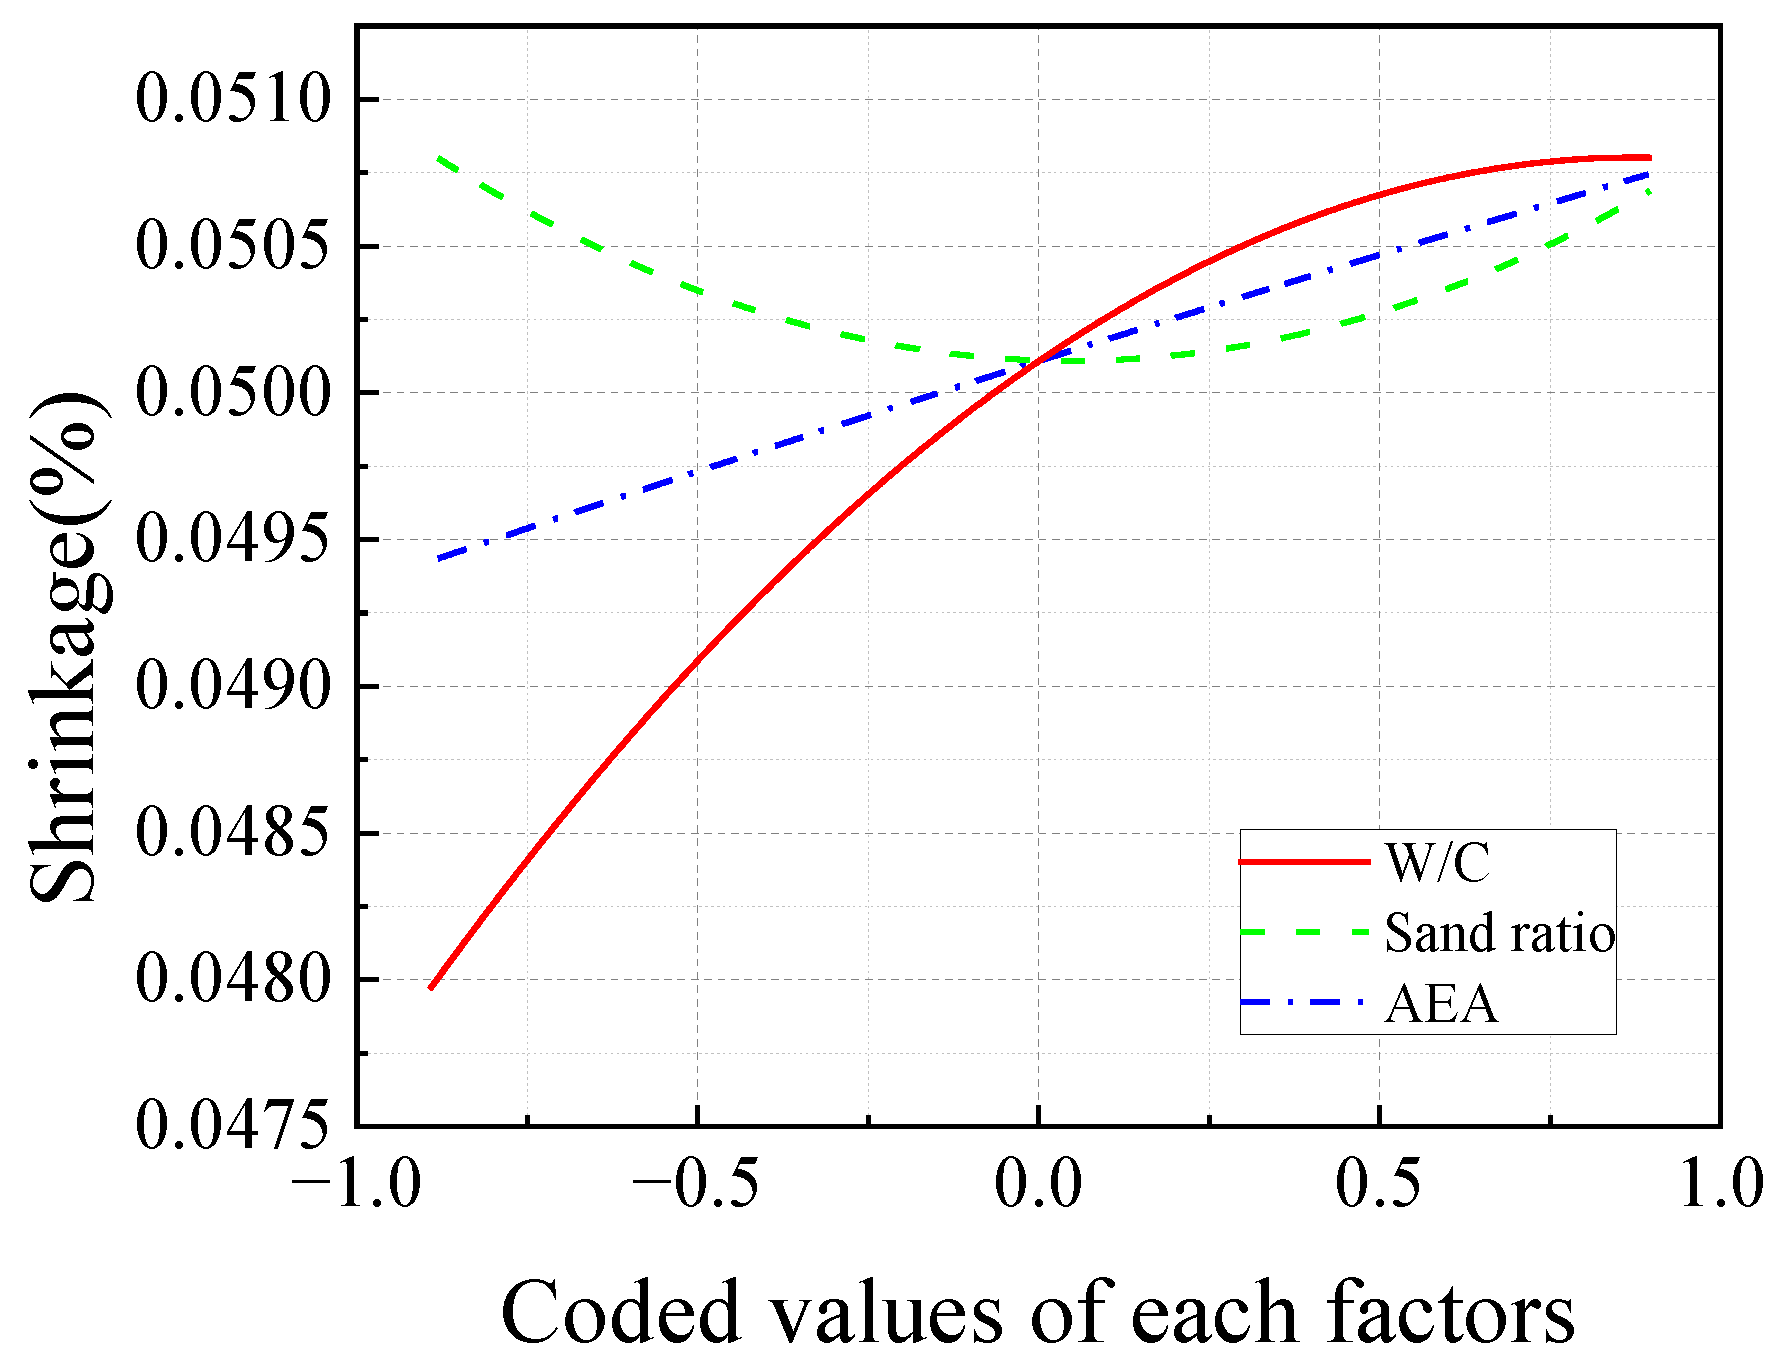
Figure 9 presents the response trajectories of shrinkage as influenced by W/C, sand ratio, and AEA. Shrinkage showed a positive correlation with W/C, with higher W/C leading to increased shrinkage, though the rate of increase diminished at higher levels, suggesting a non-linear behavior. For the sand ratio, shrinkage initially decreased as the ratio increased from 36.0% to 39.0%, but this trend reversed with further increases from 39.0% to 42.0%, resulting in a sharp rise in shrinkage. In contrast, higher AEA consistently led to higher shrinkage values. Among the factors studied, W/C had the most significant impact, followed by the sand ratio and AEA.
Figure 10a–f illustrate the influence of key parameters on shrinkage. In Figure 10a,b, the interaction between W/C and the sand ratio reveals that W/C has a slightly stronger impact on shrinkage. The minimum shrinkage is observed when the W/C is around 0.35 and the sand ratio is below 39%. Figure 10c,d demonstrate that W/C exerts a slightly greater effect on shrinkage than AEA, with the lowest shrinkage occurring at a W/C of 0.35 and an AEA of 0.100%. Figure 10e,f highlight the dominant role of the sand ratio in shrinkage, with the lowest shrinkage observed at a sand ratio between 36.0% and 37.0%, and an AEA close to 0.100%.
The results can be summarized into the following single-factor effects: (1) an increase in W/C raises porosity and free water content, leading to increased shrinkage [8]. (2) Variations in the sand ratio affect aggregate packing and pore distribution, causing shrinkage to first decrease and then increase [13]. (3) When AEA increases, excessive and unevenly distributed air bubbles compromise the structural integrity of the cement paste, weaken the bond between aggregates and the paste, and accelerate moisture migration and pore pressure release due to enhanced bubble connectivity. These combined effects lead to a significant increase in concrete shrinkage [14].
Figure 10a,b show a contour plot illustrating the non-linear interaction between W/C and the sand ratio on shrinkage. When the W/C is reduced to 0.35 and the sand ratio is below 39%, the shrinkage rate is minimized. This is due to the dense microstructure of the cement paste at lower W/C, which reduces moisture evaporation, combined with the moderate sand ratio (36~39%) that creates a stable aggregate framework. This framework helps limit the shrinkage of the paste, while the paste fills the gaps between the aggregates, reducing internal stress. On the other hand, when the W/C increases to 0.42~0.43 and the sand ratio is 36%, the shrinkage rate is maximized. This results from higher W/C increasing capillary porosity, leading to greater shrinkage from moisture evaporation, while a lower sand ratio means a higher proportion of paste, which reduces the restraining effect of the aggregates and creates a weaker, paste-dominated structure, intensifying shrinkage. Additionally, when the sand ratio exceeds 39%, the effect of aggregate gaps becomes more noticeable, leading to uneven paste distribution and an increase in shrinkage.
Figure 10c,d show the combined effect of W/C and AEA on concrete shrinkage. When the W/C is 0.35 and the AEA is 0.100%, the shrinkage rate is at its lowest. This is due to the optimized interaction between the two factors: the lower W/C (0.35) creates a denser cement paste microstructure, reducing capillary porosity and minimizing moisture evaporation during the drying process. The moderate AEA (0.100%) helps introduce uniformly distributed microbubbles, relieving internal stress concentration and improving workability, which further reduces shrinkage caused by capillary tension. On the other hand, when the W/C increases to 0.43 and the AEA increases to 0.300%, the shrinkage rate reaches its maximum. The higher W/C results in more free water in the paste, forming interconnected capillary pores as the concrete hardens, which increases shrinkage due to moisture evaporation. Additionally, the higher AEA (0.300%) leads to an increased volume of air bubbles that are unevenly distributed, weakening the structural integrity of the cement paste and reducing the bond between the aggregates and the paste. The increased connectivity between the air bubbles also accelerates moisture migration, leading to quicker pore pressure release, and the combined effects of these factors significantly increase shrinkage.
Figure 10e,f show the combined effect of the sand ratio and AEA on concrete shrinkage. When the sand ratio is between 36.0% and 37.0% and the AEA is 0.100%, the shrinkage rate is at its lowest. This is due to a higher proportion of coarse aggregates, which act as a rigid framework to limit shrinkage, and the moderate AEA (0.100%) that introduces small, evenly distributed air bubbles. These bubbles help reduce internal stress and decrease the rate of moisture evaporation. On the other hand, when the sand ratio increases to 42.00% and the AEA rises to 0.280~0.300%, the shrinkage rate is at its highest. The higher sand ratio increases the paste content, which leads to more shrinkage, while excessive AEA introduces larger, unevenly distributed air bubbles that weaken the paste-aggregate bond. These bubbles also create pathways for moisture evaporation, increasing shrinkage stress. The combination of high sand ratio and high AEA amplifies the negative effects, resulting in the highest shrinkage rate.

3.2.3. Response Surface Analysis of Porosity

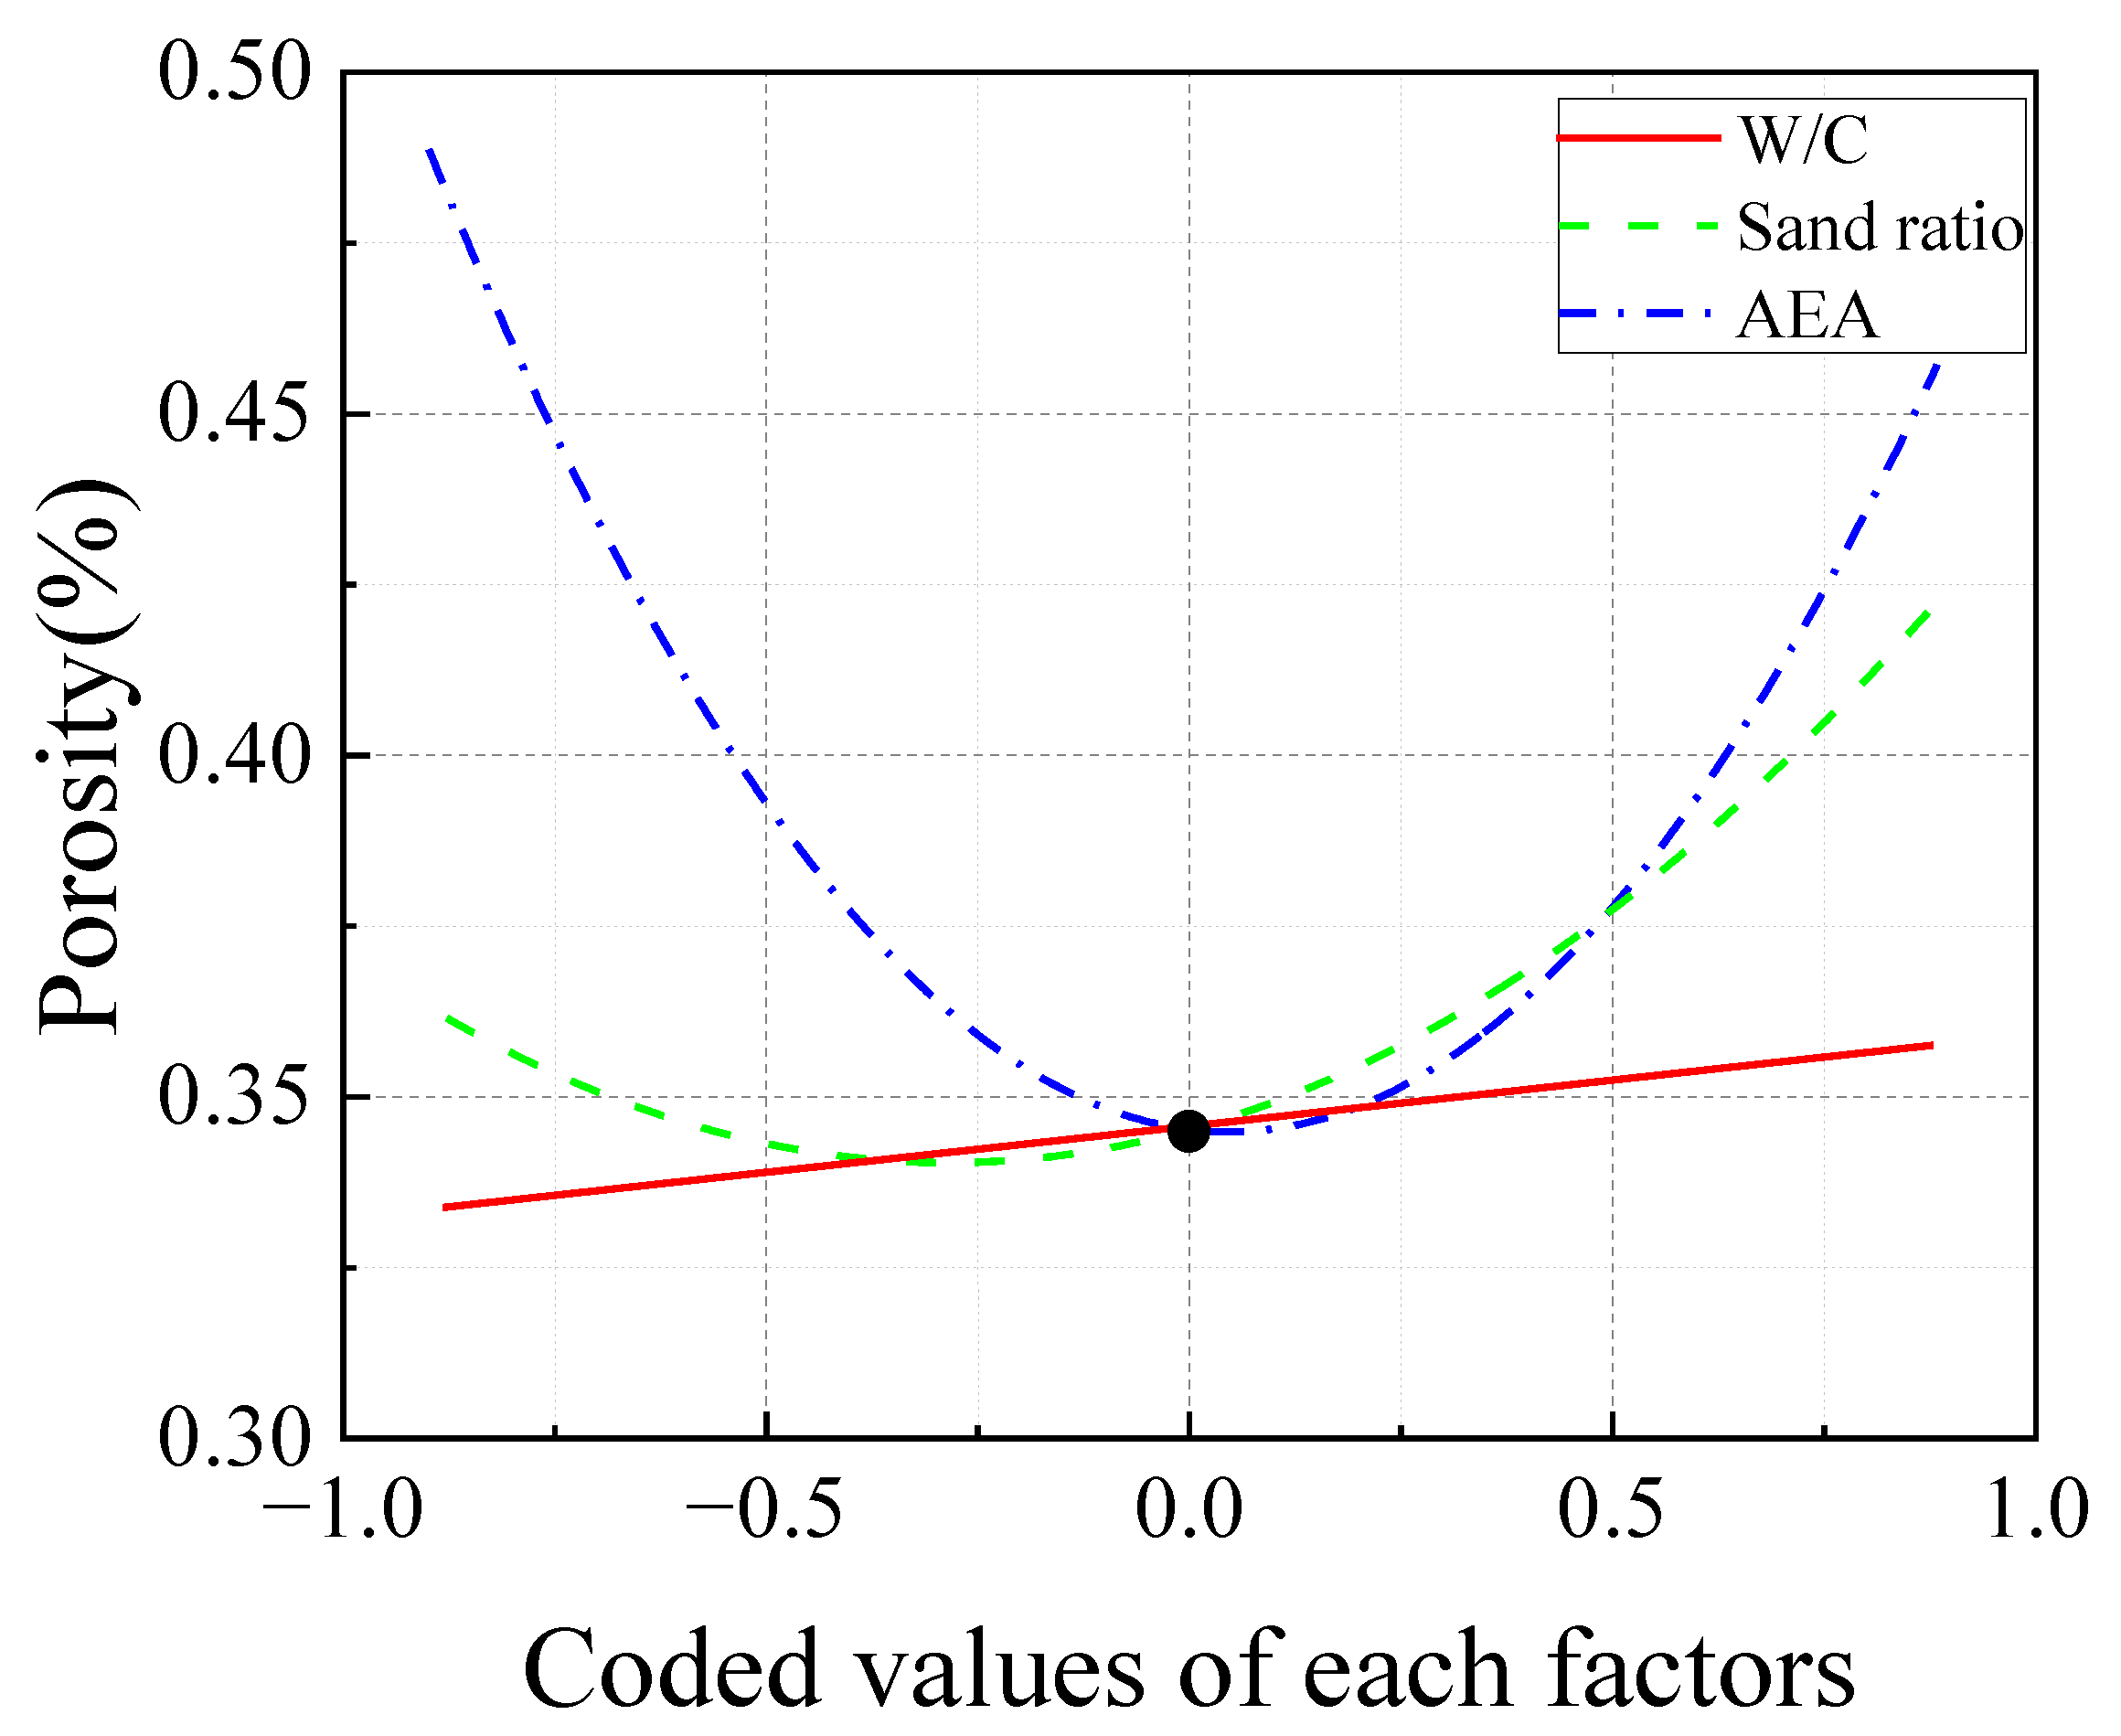
Figure 11 illustrates the response patterns of porosity to variations in W/C, sand ratio, and AEA. A positive correlation is observed between W/C and porosity. Within the range of 36.0~38.0% sand ratio, porosity decreases, while it increases as the sand ratio extends from 38.0% to 42.0%. Porosity decreases with the increase in AEA from 0.100% to 0.225% but continues to rise as the AEA exceeds the threshold. By analyzing the curvature, AEA exerts the most significant effect on porosity, exhibiting a pronounced non-linear trend, followed by the sand ratio and W/C.
Figure 12a–d collectively illustrate the interactions between W/C, sand ratio, and AEA on porosity. Figure 12a,b demonstrate that the sand ratio slightly surpasses W/C in influencing porosity, with both factors working together to minimize porosity within the ranges of W/C (0.35~0.36) and the sand ratio (36.0~37.0%). Figure 12c,d emphasize the dominant impact of AEA over the sand ratio, where the combination of sand ratio (36.0~38.0%) and AEA (0.140~0.200%) leads to the most substantial porosity reduction.
The results can be attributed to the following single-factor effects: (1) porosity increases with higher W/C because excessive water in the paste cannot fully participate in the hydration reaction, reducing the production of hydration products [9]. (2) Porosity initially decreases and then increases with higher sand ratios. An appropriate sand ratio effectively fills voids between coarse aggregates, reducing porosity; however, an excessive sand ratio diminishes the structural support of coarse aggregates, causing porosity to rebound [11]. (3) Porosity increases with higher AEA, as the introduction of uniform air bubbles increases the total pore volume and reduces the number of interconnected pores, complicating the pore structure [15].
In Figure 12a,b, the lowest porosity is observed when both the W/C and sand ratios are low. The explanation lies in the fact that, although hydration is not fully completed with a low W/C, the amount of hydration products is relatively well matched to the available water. Hydration products effectively encapsulate the fine and coarse aggregates, filling most of the voids. Additionally, low W/C minimizes excess water retention, limiting the formation of additional pores. The lower connectivity of pores under the conditions results in a more closed pore structure, which further reduces porosity. As the sand ratio increases, however, the cement paste is no longer sufficient to fully coat the aggregates, leading to higher porosity.
In Figure 12c,d, the relationship between the sand ratio and AEA reveals a clear trend. The lowest porosity occurs when the sand ratio is between 36.0% and 38.0%, and AEA is between 0.160% and 0.180%. The optimal sand ratio efficiently fills the gaps between the coarse aggregates, improving the overall compactness of the concrete. Simultaneously, a moderate AEA introduces fine air bubbles that refine the pore structure without overwhelming it, maintaining a uniform pore distribution and minimizing porosity. When the sand ratio exceeds the optimal range, the proportion of coarse aggregates decreases, weakening the aggregate structure and causing the porosity to increase. Similarly, when AEA is excessively high, excessive air bubbles lead to a more complex pore structure, resulting in increased porosity.

3.3. Global Optimization Using NSGA-III

Based on NSGA-III, this study performs multi-objective optimization of pavement cement concrete performance indexes with a response surface model as the input objective function; the optimization objectives are to maximize Rf/Rc (0.125~0.182), minimize porosity (2.68~8.55%), and minimize shrinkage (0.042~0.050%)—the specific parameters of NSGA-III are shown in Table 7. The Pareto front obtained through the NSGA-III algorithm is shown in Figure 13, clearly illustrating the trade-offs among the optimization objectives. The results indicate that, under different weight combinations, increasing Rf/Rc is often associated with fluctuations in porosity and shrinkage. Maximizing Rf/Rc typically results in an increase in porosity, but it remains within an acceptable range (below 8.55%). Conversely, as shrinkage approaches its minimum, Rf/Rc may decrease to a critical threshold (>0.125). Further analysis demonstrates that the optimized solution set effectively balances the conflicts among the three objectives, providing comprehensive guidance for concrete performance design.

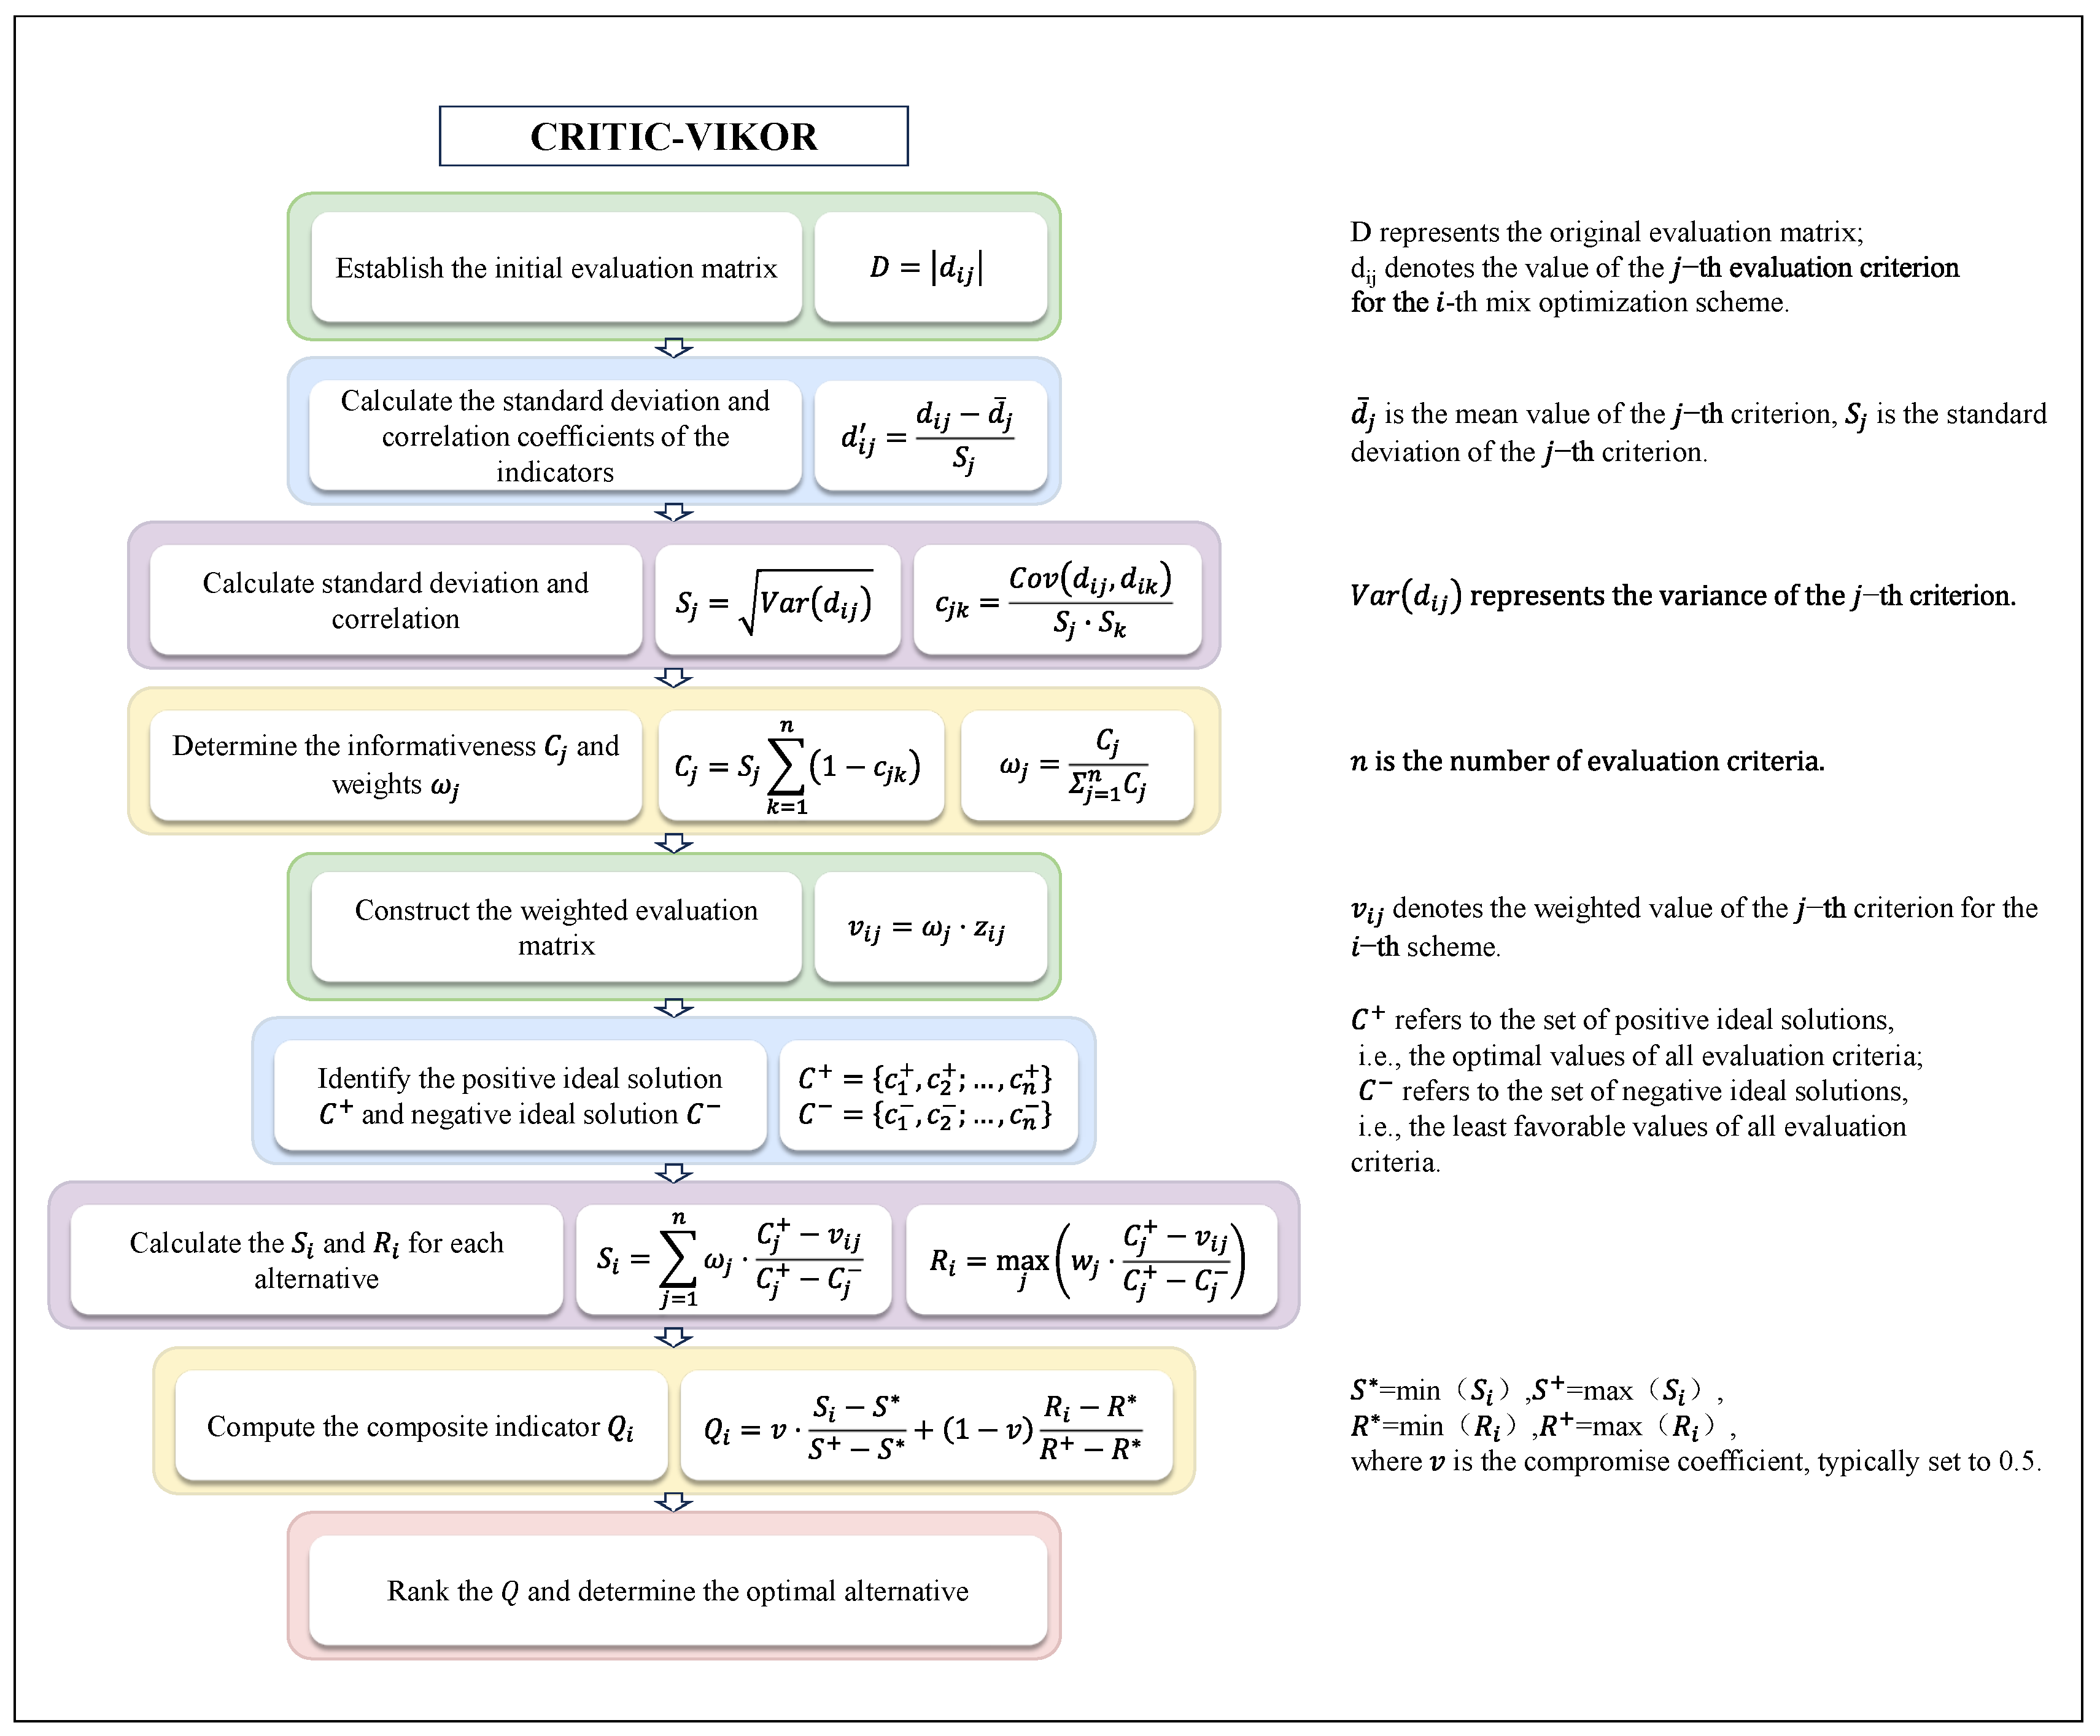
3.4. Comprehensive Evaluation Using CRITIC-VIKOR

To achieve objective weight assignment, the CRITIC method was employed. Prior to weight determination, correlation analysis was conducted to assess the interdependence among evaluation parameters, as shown in Table 8. The correlation matrix reveals that Rf/Rc and porosity demonstrate a moderate positive correlation coefficient (0.40), indicating partial covariance between these performance indicators. Conversely, shrinkage exhibits minimal correlation with both Rf/Rc (0.18) and porosity (0.21), suggesting its relative independence as an evaluation criterion. These correlation coefficients were subsequently integrated with the standard deviation of each parameter to calculate the information content (Cj), which quantifies the degree of distinctive information conveyed by individual indicators and serves as the foundation for objective weight derivation. The resulting parameter values and weights presented in Table 9. Among the response indicators, Rf/Rc displayed the highest weight (0.39), underscoring its critical importance in the overall performance evaluation. Porosity and shrinkage followed, with weights of 0.32 and 0.29, respectively, signifying their significant but relatively lower influence.
Weights were then incorporated into the VIKOR method to rank and identify the optimal mix proportions, effectively balancing the trade-offs among the three indicators. These results highlight the pivotal influence of Rf/Rc in guiding mix design, while also emphasizing the necessity of controlling porosity and shrinkage to enhance concrete performance.
The CRITIC analysis results reveal that Rf/Rc holds the highest weight at 39%, while shrinkage carries the lowest weight at 29%. By integrating CRITIC with VIKOR, we systematically ranked the Pareto-optimal solutions to identify the most balanced mix design. As summarized in Table 10, the optimal mix proportions consist of a W/C of 0.35, a sand ratio of 36.0%, and an AEA of 0.200%.
This optimized framework significantly reduced the experimental workload, generating 73 diverse Pareto-optimal solutions from just 17 mix designs, dramatically improving efficiency compared to traditional trial-and-error methods. When comparing the optimal mix to the baseline mix (W/C = 0.39, sand ratio = 39%, AEA = 0.2%), substantial improvements were achieved: Rf/Rc increased by 4.5% (from 0.135 to 0.141), shrinkage decreased by 13.0% (from 0.0515% to 0.0446%), and porosity reduced by 13.5% (from 3.24% to 2.82%). These performance enhancements directly contribute to concrete pavements with greater structural integrity and durability under the harsh environmental conditions of arid regions. The optimized mix’s lower shrinkage rate significantly reduces crack formation potential, while the improved microstructure from reduced porosity enhances long-term resistance to weathering and traffic loads, resulting in fewer maintenance interventions and extended service life for infrastructure projects in challenging environments.

3.5. Validation of the Optimal Solution

To validate the accuracy of the multi-objective optimization model based on RSM-NSGA-III-CRITIC-VIKOR for pavement cement concrete mix design, five experiments were conducted using the optimized mix proportions. The results were rounded for analysis. The experimental results, presented in Table 11, show that the measured values for shrinkage, porosity, and Rf/Rc closely align with the predicted values. The prediction intervals for shrinkage, porosity, and Rf/Rc were 0.0446%, 2.70%, and 0.136, respectively, with all experimental values falling within the intervals. The validation results further confirm the reliability and effectiveness of the RSM-NSGA-III-CRITIC-VIKOR model in designing mix proportions for pavement cement concrete.

3.6. Microstructural Analysis of Pore Distribution and Density Improvement in Optimal Mix Proportions

To comprehensively evaluate the effects of optimized mix proportions on the microstructure of concrete, the section integrates the results of Scanning Electron Microscopy (SEM) analyses and LF-NMR, examining concrete performance from the perspectives of microstructural morphology and pore distribution.
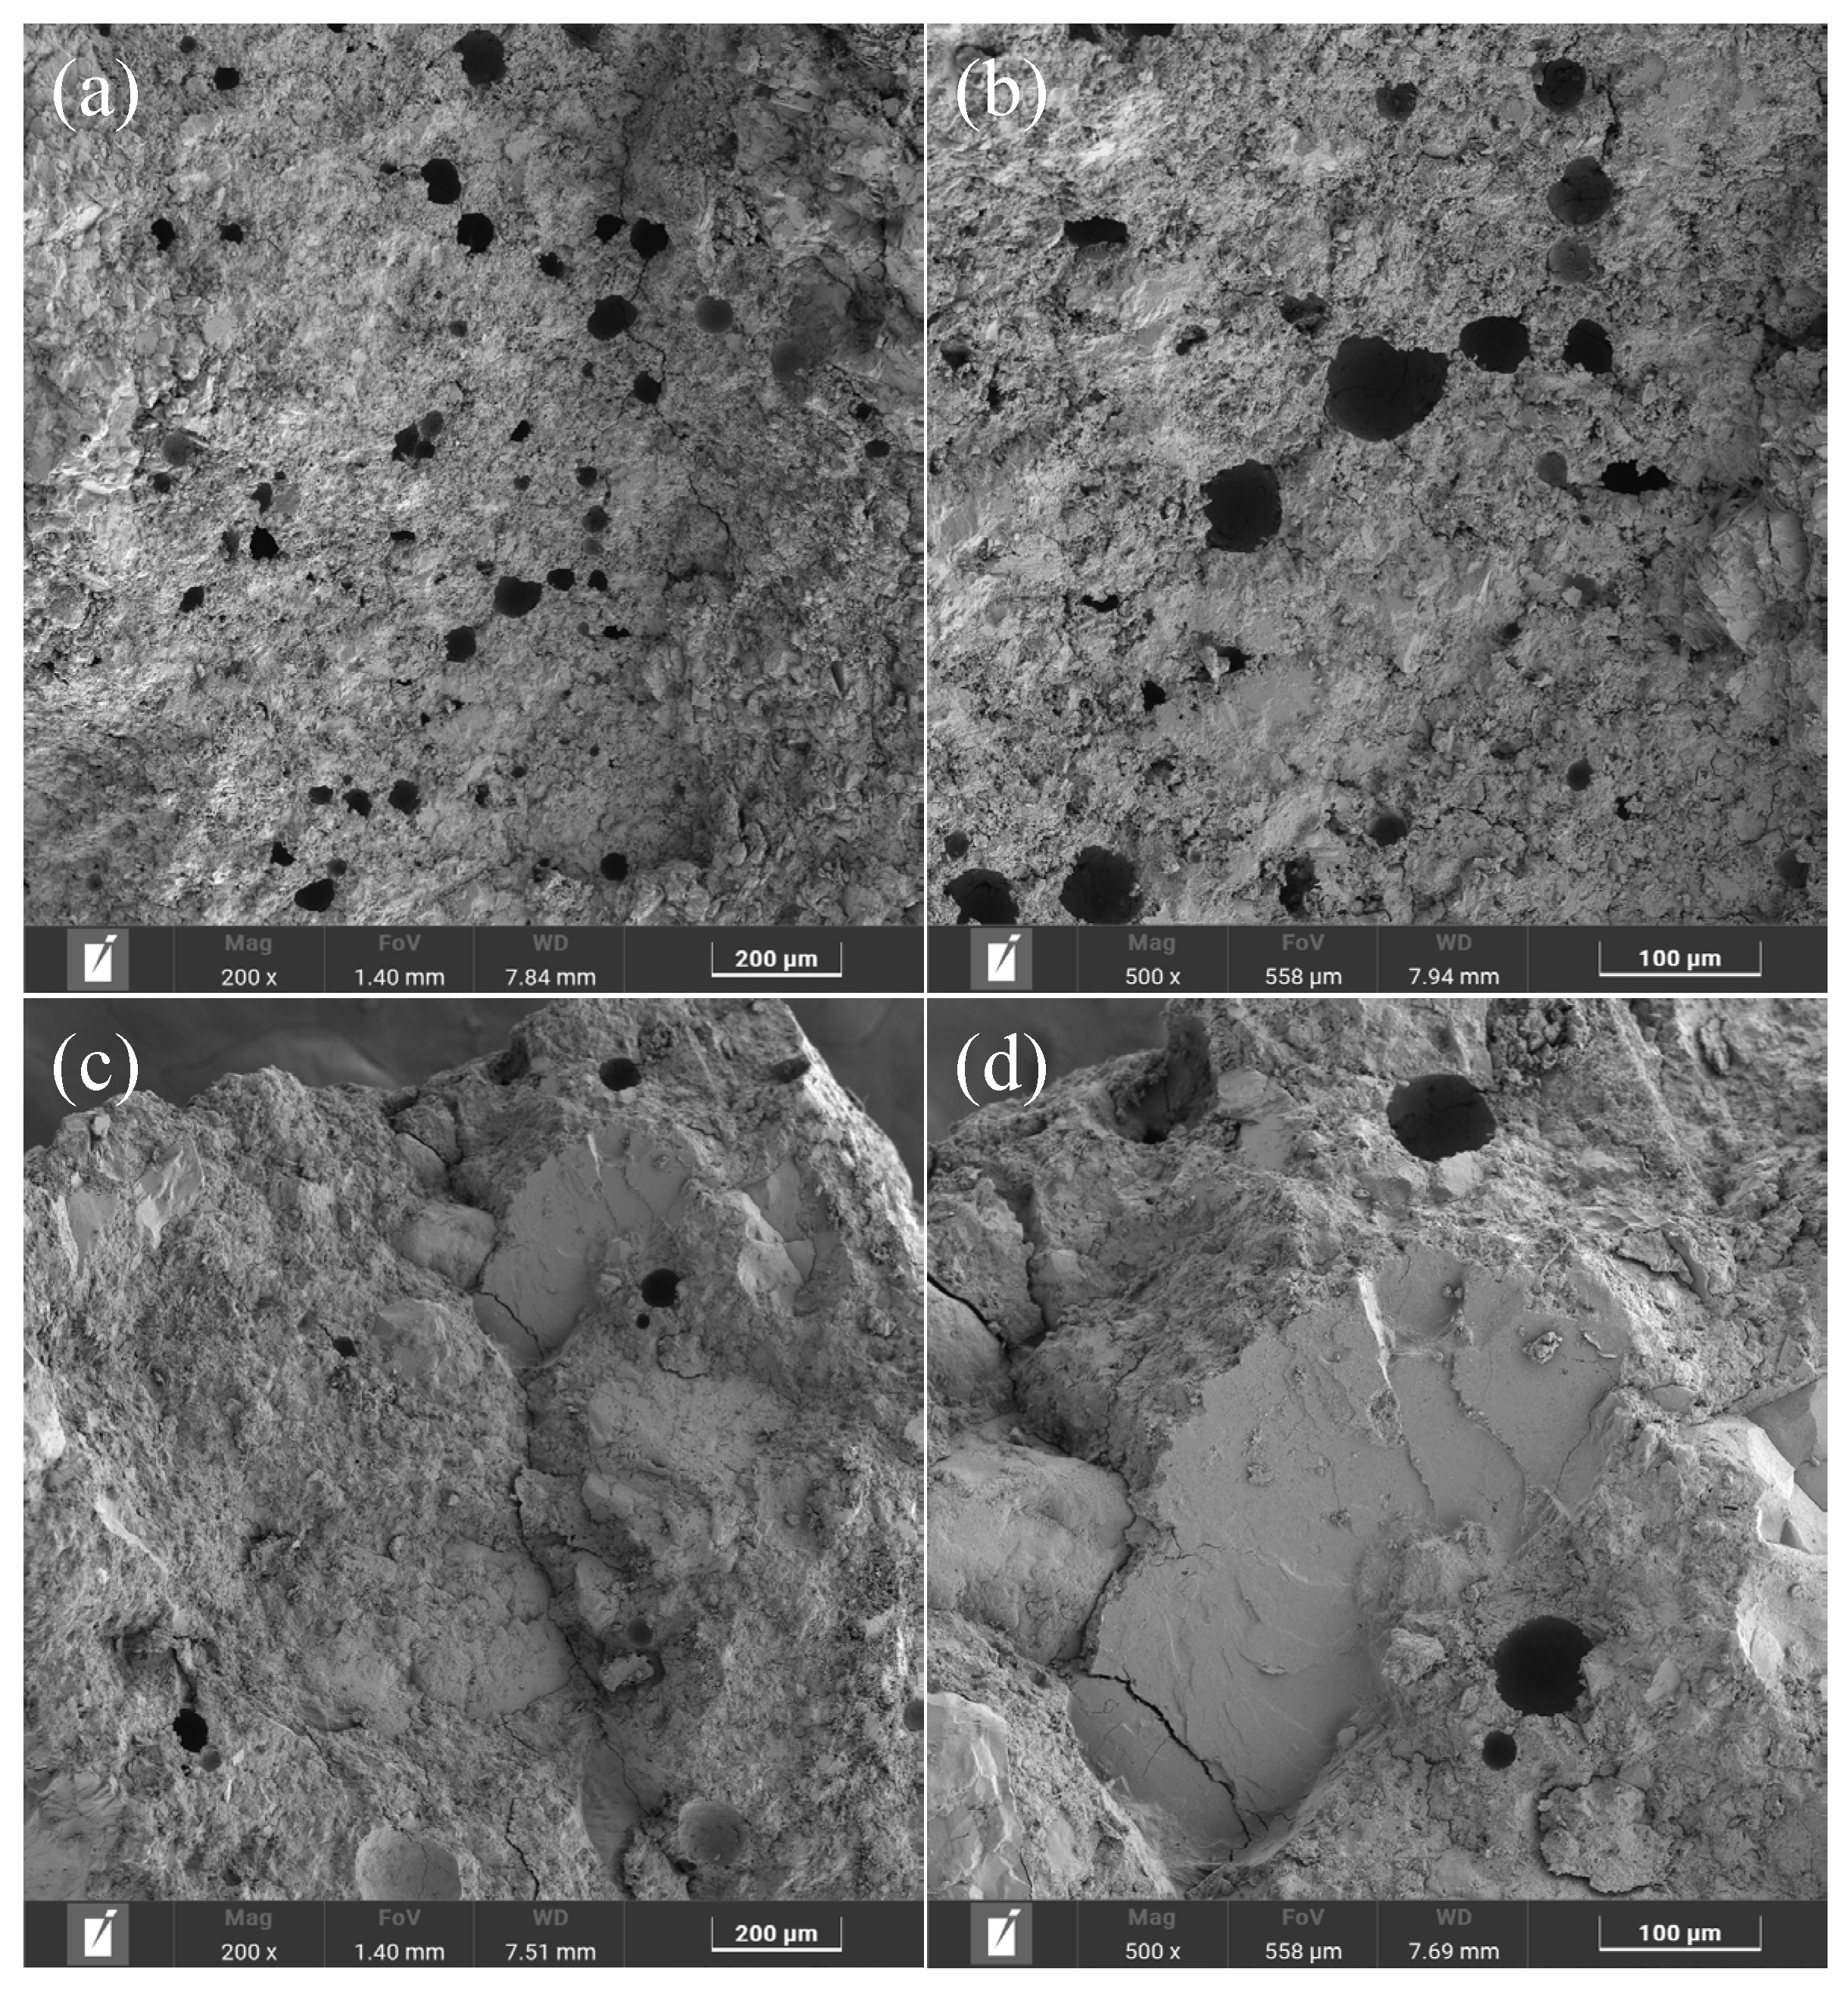
The unoptimized concrete (Figure 14a,b) contains a higher number of pores, characterized by larger, irregularly shaped voids. Larger pores reduce the mechanical strength and durability of the concrete, primarily affecting compressive strength and permeability resistance. They create weak zones within the concrete matrix, making the material more susceptible to changes in shrinkage and overall structural integrity, particularly over prolonged exposure to environmental conditions. In contrast, the concrete with optimized mix proportions (Figure 14c,d) demonstrates a significant reduction in pore volume. The reduced pore volume correlates with a denser and more uniform microstructure, which contributes to improved overall performance.
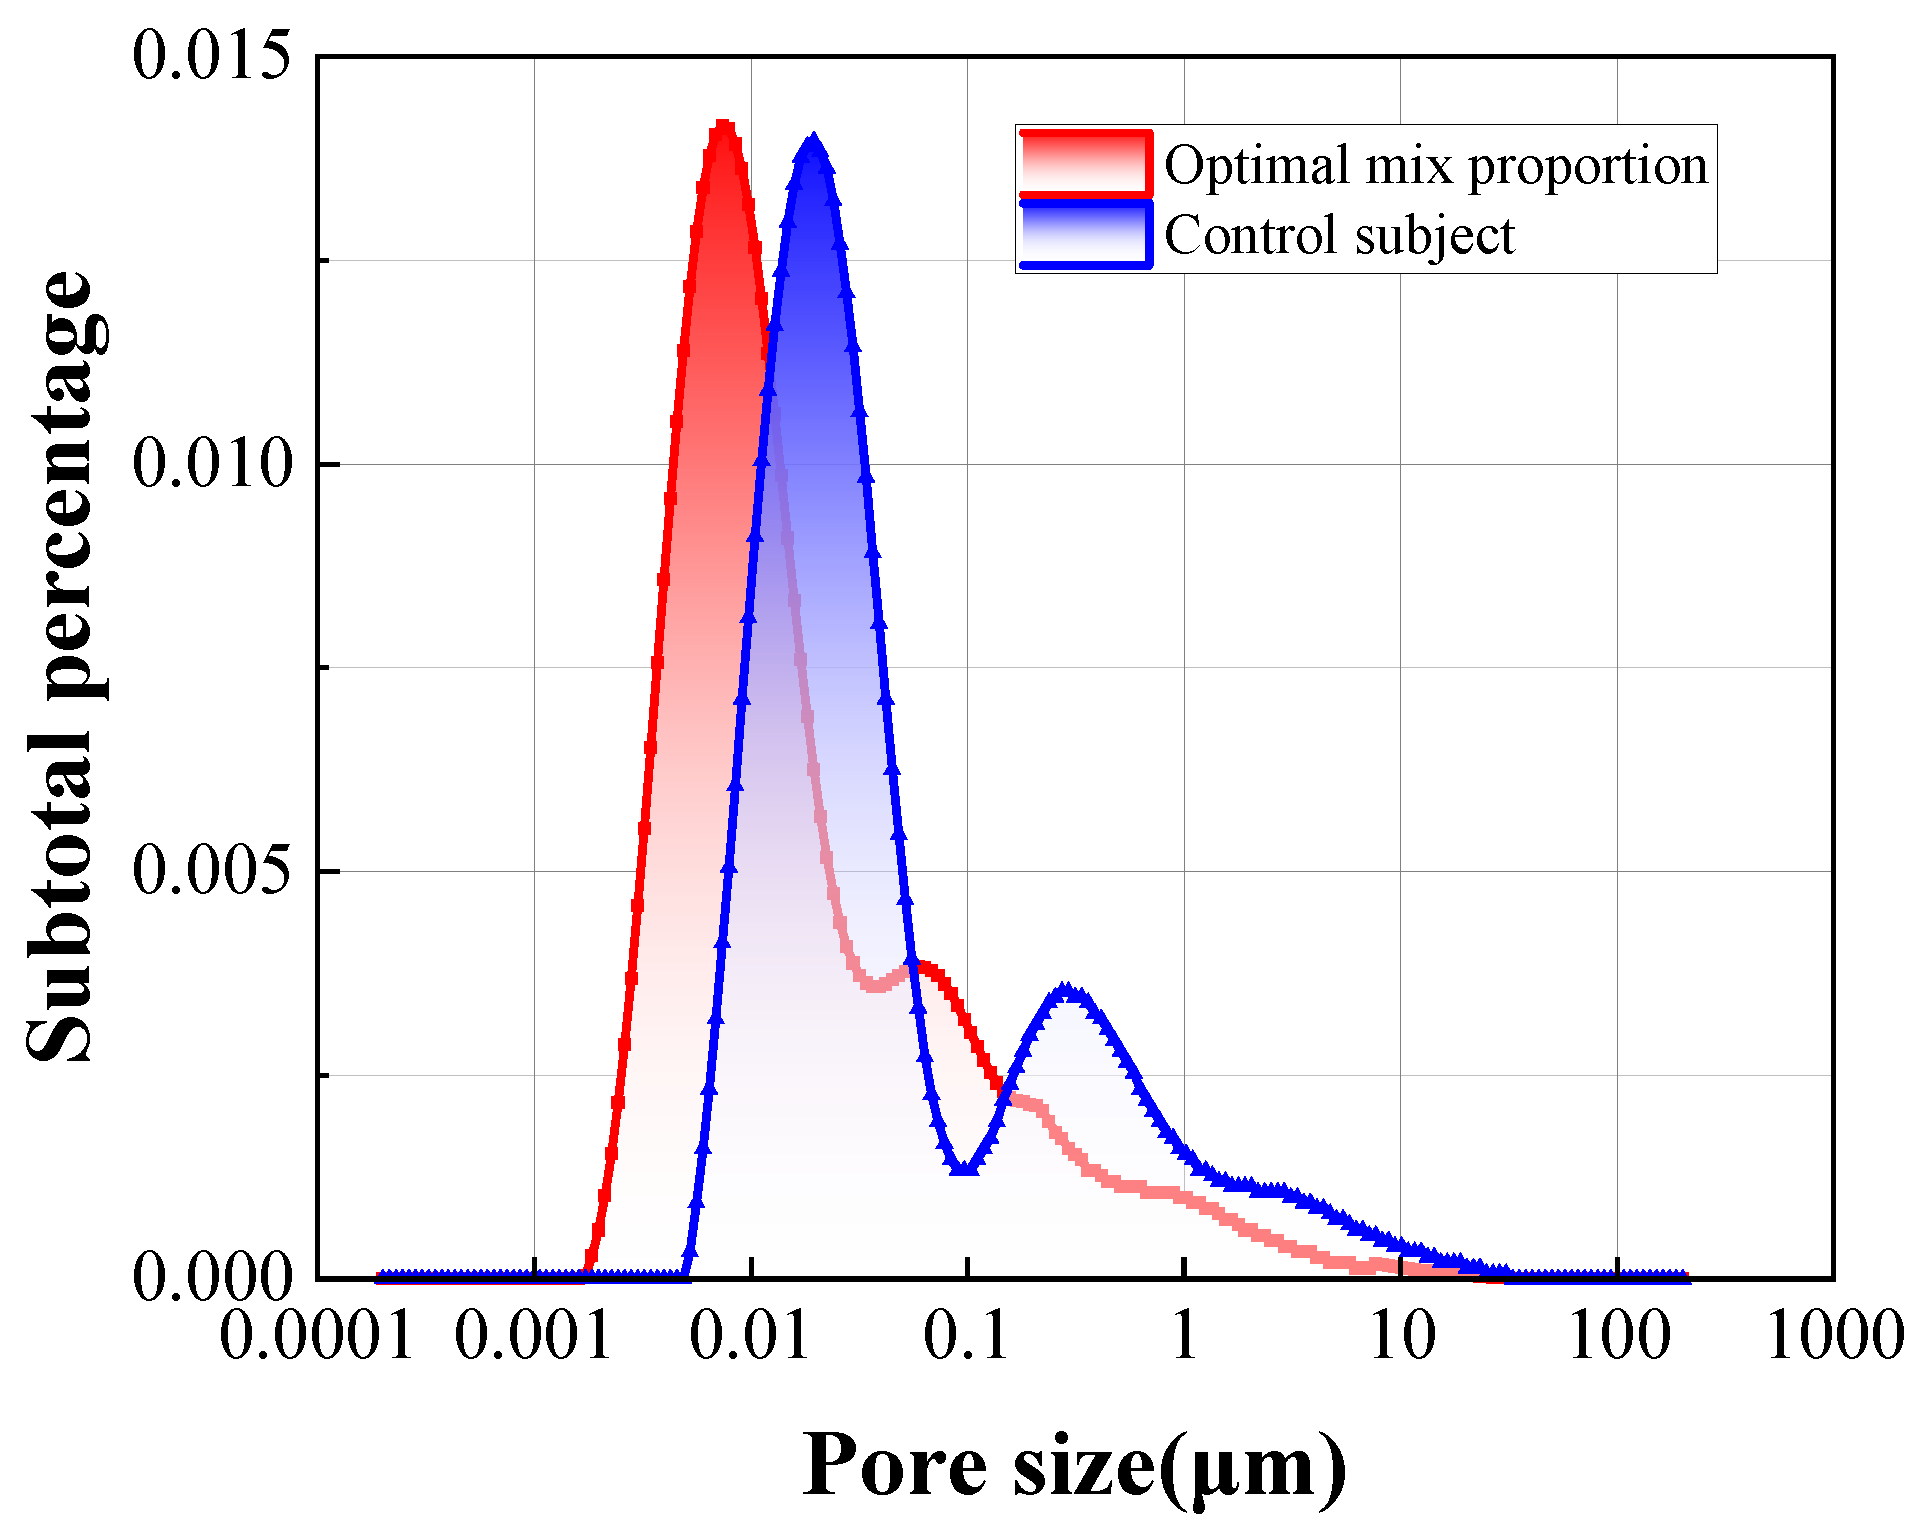
According to the LF-NMR results presented in Figure 15, a significant change in the pore distribution is observed when comparing the optimized mix with the unoptimized control. The pore distribution curve for the optimized concrete shifts to the left, indicating a general reduction in pore size. The shift is primarily achieved by reducing the proportion of larger pores and increasing the proportion of smaller pores, thus refining the pore structure. Such optimization enhances concrete density and overall performance by minimizing the presence of larger pores, which adversely affect concrete durability, particularly in the 10~100 μm pore size range.
Specifically, the optimized concrete shows a substantial increase in the proportion of pores in the smaller pore size range (such as 0.0001~0.1 μm), while the proportion of pores in the larger size range (such as 0.1~10 μm) decreases. The optimized mix effectively adjusted the pore distribution, resulting in a denser and more uniform pore structure.
The combined SEM and LF-NMR results provide a comprehensive understanding of the concrete microstructural improvements. While SEM offers clear observations of pore distribution, LF-NMR highlights the refinement of smaller pores that SEM analysis may not clearly capture. Integration improves the understanding of pore structure changes at different scales.
In conclusion, SEM and LF-NMR results complement each other, demonstrating that optimizing the mix proportions significantly improves the concrete microstructure, particularly in terms of pore distribution. The improvements contribute to a more stable microstructure, enhancing the concrete ability to withstand environmental stresses, thereby improving long-term performance and suitability for demanding engineering applications.

4. Conclusions

  • A robust multi-objective optimization framework was developed by integrating the RSM predictive model, NSGA-III, CRITIC weighting method, and VIKOR ranking technique. The framework effectively addresses trade-offs among conflicting performance objectives, including Rf/Rc, shrinkage, and porosity, demonstrating its ability to enhance the rationality and feasibility of concrete mix design under complex engineering conditions, demonstrating its practical value for designing durable pavement concrete in harsh environments, and enhancing the rationality and feasibility of concrete mix design under complex engineering conditions.
  • The RSM-based predictive models exhibited excellent fitting performance, with R2 values of 0.8574, 0.8346, and 0.9824 for Rf/Rc, shrinkage, and porosity, respectively. Statistical analysis confirmed their significance (p < 0.01) and reliability. Among the influencing factors, AEA was identified as the most critical determinant for Rf/Rc and porosity, while W/C primarily influenced shrinkage. The accuracy and reliability of these models offer important theoretical value for optimizing concrete mix designs.
  • The Pareto-optimal front generated by NSGA-III revealed trade-offs among performance metrics. By applying the CRITIC and VIKOR methods, the optimal mix proportions were identified as follows: W/C = 0.35, sand ratio = 36%, and AEA = 0.200%. Experimental validation confirmed that under the proportions, the concrete achieved an Rf/Rc of 0.141, shrinkage of 0.0446%, and porosity of 2.82%.
  • Microstructural analysis using LF-NMR and SEM further validated the optimization framework. LF-NMR results showed a shift in pore distribution, characterized by a reduction in larger pores and an increase in smaller pores, indicating a denser microstructure. SEM analysis confirmed that the number of pores was significantly reduced, thus improving the densification and durability of the concrete. The enhanced microstructure further supports the feasibility of this optimization framework for practical applications, particularly in regions prone to extreme environmental stresses.

5. Future Perspectives

Despite the promising results obtained from the RSM-NSGA-III-CRITIC-VIKOR framework, several aspects warrant further investigation.
The parameter ranges used in this study (W/C: 0.35~0.43, sand ratio: 36~42%, and AEA: 0.1~0.3%) were specifically calibrated for arid Gobi Desert conditions. Future work should explore the framework’s adaptability to other environmental contexts through appropriate parameter adjustments and sensitivity analyses.
Additionally, incorporating dynamic environmental factors and field performance data would enhance the model’s predictive accuracy. The gap between laboratory optimization and field implementation could be addressed through long-term monitoring of pavement performance under actual service conditions.
Further research could also expand the optimization framework to include additional variables such as fiber type and content, supplementary cementitious materials, and innovative admixtures to develop more sustainable and resilient pavement solutions for extreme environments.

Author Contributions

Conceptualization, Y.H. and Z.L.; methodology, Y.H.; software, Y.H.; validation, Y.H.; formal analysis, Y.H.; investigation, Z.L.; resources, Y.W.; data curation, Y.H.; writing—original draft preparation, Y.H.; writing—review and editing, Y.W. and Z.L.; visualization, Y.H.; supervision, Z.L. and Y.W.; project administration, Y.W.; funding acquisition, Y.W. All authors have read and agreed to the published version of the manuscript.

Funding

This work was financially supported by the National Natural Science Foundation of China (Grant No. 52222806), the Outstanding Youth Science Foundation of Shaanxi province (Grant No. 2022JC-20).

Institutional Review Board Statement

Not applicable.

Informed Consent Statement

Not applicable.

Data Availability Statement

The raw data supporting the conclusions of this article will be made available by the authors on request.

Acknowledgments

The work presented herein was conducted in the State Key Laboratory of Green Buildings in Western China at the Xi’an University of Architecture and Technology. The authors gratefully acknowledge the support that has made this laboratory and its operation possible.

Conflicts of Interest

The authors declare no conflicts of interest.

Abbreviations

The following abbreviations are used in this manuscript:
RSMResponse Surface Methodology
NSGA-IIINon-dominated Sorting Genetic Algorithm III
Rf/Rcflexural-to-compressive strength ratio
BBDBox–Behnken design
W/Cwater–cement ratio
AEAair-entraining agent
ANOVAanalysis of variance
R2coefficient of determination
Rp2adjusted coefficient of determination
CRITICCriteria Importance Through Intercriteria Correlation
VIKORVIšekriterijumsko KOmpromisno Rangiranje

References

  1. Paglia, C.; Mosca, C.; Antonietti, S. The Concrete Versus Asphalt Roadways: Case Studies. J. Mater. Poly. Sci. 2022, 2, 1–8. [Google Scholar]
  2. Choi, S.Y.; Park, J.S.; Jung, W.T. A Study on the Shrinkage Control of Fiber Reinforced Concrete Pavement. Procedia Eng. 2011, 14, 2815–2822. [Google Scholar] [CrossRef]
  3. Pranav, S.; Aggarwal, S.; Yang, E.-H.; Sarkar, A.K.; Singh, A.P.; Lahoti, M. Alternative Materials for Wearing Course of Concrete Pavements: A Critical Review. Constr. Build. Mater. 2020, 236, 117609. [Google Scholar] [CrossRef]
  4. Li, X.; Zhang, D.; Liu, Z.; Li, Z.; Du, C.; Dong, C. Materials science: Share corrosion data. Nature 2015, 527, 441–442. [Google Scholar] [CrossRef]
  5. Zhang, Z.; Zhang, H.; Ma, J.; Wang, N. Multi-Objective Optimization, Shrinkage and Fracture Properties of Unsaturated Polyester Resin Modified Concrete for Bridge Deck Pavement Based on System Theory. Constr. Build. Mater. 2024, 443, 137694. [Google Scholar] [CrossRef]
  6. Cui, T.; Zhang, T.; Wang, J.; Chen, J.; Wang, W.; Wang, H.; Wang, H.; Yang, D. Optimization and Regulation of Pavement Concrete Properties in Plateau Environment with Large Daily Temperature Difference: From Mixture Design to Field Application. Constr. Build. Mater. 2023, 378, 131167. [Google Scholar] [CrossRef]
  7. Persson, B. Self-Compacting Concrete for Submerged Repair of Harbours or Water Power Plant Dams; Division of Building Materials, LTH, Lund University: Lund, Sweden, 2003. [Google Scholar]
  8. Ma, L.; Zhang, Y.; Li, X.; Chen, W.; Wu, Z. Water loss and shrinkage prediction in 3D printed concrete with varying w/c and specimen sizes. Cement Concr. Compos. 2024, 149, 105523. [Google Scholar] [CrossRef]
  9. Piasta, W.; Zarzycki, B. The effect of cement paste volume and w/c ratio on shrinkage strain, water absorption and compressive strength of high performance concrete. Constr. Build. Mater. 2017, 140, 395–402. [Google Scholar] [CrossRef]
  10. Kondraivendhan, B.; Bhattacharjee, B. Strength and w/c ratio relationship of cement based materials through pore features. Mater. Charact. 2016, 122, 124–129. [Google Scholar] [CrossRef]
  11. Lin, W.-T. Effects of sand/aggregate ratio on strength, durability, and microstructure of self-compacting concrete. Constr. Build. Mater. 2020, 242, 118046. [Google Scholar] [CrossRef]
  12. Ding, T.; Xiao, J.; Zou, S.; Yu, J. Flexural properties of 3D printed fibre-reinforced concrete with recycled sand. Constr. Build. Mater. 2021, 288, 123077. [Google Scholar] [CrossRef]
  13. Yang, K.-H.; Kim, H.-Y.; Lee, H.-J. Shrinkage behavior of concrete containing bottom ash granules as partial replacement of natural sands. Constr. Build. Mater. 2021, 300, 124188. [Google Scholar] [CrossRef]
  14. Li, Y.; Zhang, X.; Zhou, M.; Yang, Z.; Wang, Q. Influence of pore size distribution on concrete cracking with different AEA content and curing age using acoustic emission and low-field NMR. J. Build. Eng. 2022, 58, 105059. [Google Scholar] [CrossRef]
  15. Łaźniewska-Piekarczyk, B. The type of air-entraining and viscosity modifying admixtures and porosity and frost durability of high performance self-compacting concrete. Constr. Build. Mater. 2013, 40, 659–671. [Google Scholar] [CrossRef]
  16. Giri, A.K.; Mishra, P.C. Optimization of Different Process Parameters for the Removal Efficiency of Fluoride from Aqueous Medium by a Novel Bio-Composite Using Box-Behnken Design. J. Environ. Chem. Eng. 2023, 11, 109232. [Google Scholar] [CrossRef]
  17. Anjali, R.; Venkatesan, G. Optimization and Prediction of Mechanical Properties of Composite Concrete with Crumb Rubber Using RSM and Hybrid DNN-HHO Algorithm. J. Build. Eng. 2024, 84, 108486. [Google Scholar] [CrossRef]
  18. Arjomandi, A.; Mousavi, R.; Tayebi, M.; Nematzadeh, M.; Gholampour, A.; Aminian, A.; Gencel, O. The Effect of Sulfuric Acid Attack on Mechanical Properties of Steel Fiber-Reinforced Concrete Containing Waste Nylon Aggregates: Experiments and RSM-Based Optimization. J. Build. Eng. 2023, 64, 105500. [Google Scholar] [CrossRef]
  19. Liu, W.; Xu, Y.; Yang, Q.; Li, Y.; Xia, H.; Wu, X.; Zhang, L. Optimization of Ultrasonic Enhanced Chloride-Hydrogen Peroxide System for Leaching Platinum from Propane Dehydrogenation Spent Catalyst by Response Surface Methodology. Sep. Purif. Technol. 2025, 353, 128384. [Google Scholar] [CrossRef]
  20. Deb, K.; Jain, H. An Evolutionary Many-Objective Optimization Algorithm Using Reference-Point Based Non-Dominated Sorting Approach. IEEE Trans. Evol. Comput. 2014, 18, 1121–1146. [Google Scholar] [CrossRef]
  21. Zhang, Z.; Lv, J.; Xie, G.; Wang, S.; Ye, Y.; Huang, G.; Tan, D. Effect of Assisted Hydrogen on Combustion and Emission Characteristics of a Diesel Engine Fueled with Biodiesel. Energy 2022, 254, 124269. [Google Scholar] [CrossRef]
  22. Tan, D.; Wu, Y.; Lv, J.; Li, J.; Ou, X.; Meng, Y.; Lan, G.; Chen, Y.; Zhang, Z. Performance Optimization of a Diesel Engine Fueled with Hydrogen/Biodiesel with Water Addition Based on the Response Surface Methodology. Energy 2023, 263, 125869. [Google Scholar] [CrossRef]
  23. Luo, Y.; Yang, Z.; Qin, Y. A Hybrid BWM–CRITIC–VIKOR Approach for Assessing Oil and Gas Risk Scenarios in Probabilistic Linguistic Term Set. Heliyon 2024, 10, e38514. [Google Scholar] [CrossRef] [PubMed]
  24. Zhou, J.; Peng, J.; Wu, J.; Wei, Z.; Fan, Y.; Guo, X. Multi-Performance Enhanced Eco-Driving Strategy for Connected Fuel Cell Hybrid Electric Bus Based on Stein Soft Actor-3-Critic. Energy 2024, 307, 132697. [Google Scholar] [CrossRef]
  25. Yadav, R.; Singh, M.; Meena, A.; Lee, S.Y.; Park, S.J. Selection and Ranking of Dental Restorative Composite Materials Using Hybrid Entropy-VIKOR Method: An Application of MCDM Technique. J. Mech. Behav. Biomed. Mater. 2023, 147, 106103. [Google Scholar] [CrossRef]
  26. Shah, A.I.; Pan, N.D. Flood Susceptibility Assessment of Jhelum River Basin: A Comparative Study of TOPSIS, VIKOR, and EDAS Methods. Geosyst. Geoenviron. 2024, 3, 100304. [Google Scholar] [CrossRef]
  27. Tian, Z.; Zhang, Z.; Zhang, K.; Tang, X.; Huang, S. Statistical Modeling and Multi-Objective Optimization of Road Geopolymer Grouting Material via RSM and MOPSO. Constr. Build. Mater. 2021, 271, 121534. [Google Scholar] [CrossRef]
  28. Wang, Y.; Xu, Y.; Zhang, H. Optimization Design for Nozzle Contour of Rocket Engine Based on Response Surface Method. J. Aerosp. Power 2022, 37, 214–224. [Google Scholar]
  29. Luo, X.; Xing, G.; Qiao, L.; Miao, P.; Yu, X. Multi-Objective Optimization of the Mix Proportion for Dune Sand Concrete Based on Response Surface Methodology. Constr. Build. Mater. 2023, 366, 129928. [Google Scholar] [CrossRef]
  30. Hammoudi, A.; Moussaceb, K.; Belebchouche, C.; Dahmoune, F. Comparison of Artificial Neural Network (ANN) and Response Surface Methodology (RSM) Prediction in Compressive Strength of Recycled Concrete Aggregates. Constr. Build. Mater. 2019, 209, 425–436. [Google Scholar] [CrossRef]
  31. Amusan, O.T.; Nwulu, N.I.; Gbadamosi, S.L. Multi-Criteria Decision-Based Hybrid Energy Selection System Using CRITIC Weighted CODAS Approach. Sci. Afr. 2024, 26, e02372. [Google Scholar] [CrossRef]
  32. Shan, R.; Han, T.; Zhao, W.; Wu, H.; Bai, Y.; Xu, Z.; Qiao, D.; Jing, G. Study on the Performance of Coal Gangue Ceramsite Steel Fiber High Strength Concrete. J. Build. Eng. 2024, 95, 110121. [Google Scholar] [CrossRef]
  33. Yang, G.; Wang, L.; Gu, W.; Gu, J.; Fan, D.; Liang, M.; Liu, J.; Wang, Z. Soil Ecological Risk Assessment of Ten Industrial Areas in China Based on the TRIAD and VIKOR Methods. Ecol. Indic. 2024, 166, 112270. [Google Scholar] [CrossRef]
  34. Zhang, Z.; Liu, H.; Yang, D.; Li, J.; Lu, K.; Ye, Y.; Tan, D. Performance Enhancements of Power Density and Exergy Efficiency for High-Temperature Proton Exchange Membrane Fuel Cell Based on RSM-NSGA III. Energy 2024, 301, 131687. [Google Scholar] [CrossRef]
  35. Yang, X.; Chen, Z. Exploiting temporal features in water resource carrying capacity assessment based on extended VIKOR. Sustain. Cities Soc. 2024, 114, 105801. [Google Scholar] [CrossRef]
  36. JTG/T F30-2014; Technical Specifications for Construction of Highway Cement Concrete Pavements. Ministry of Transport of the People’s Republic of China: Beijing, China, 2014.
  37. Ziari, H.; Fazaeli, H.; Vaziri Kang Olyaei, S.J.; Ziari, M.A. Evaluation of Effects of Temperature, Relative Humidity, and Wind Speed on Practical Characteristics of Plastic Shrinkage Cracking Distress in Concrete Pavement Using a Digital Monitoring Approach. Int. J. Pavement Res. Technol. 2022, 15, 138–158. [Google Scholar] [CrossRef]
  38. Kardos, A.J.; Durham, S.A. Strength, Durability, and Environmental Properties of Concrete Utilizing Recycled Tire Particles for Pavement Applications. Constr. Build. Mater. 2015, 98, 832–845. [Google Scholar] [CrossRef]
  39. Xie, N.; Akin, M.; Shi, X. Permeable Concrete Pavements: A Review of Environmental Benefits and Durability. J. Clean. Prod. 2019, 210, 1605–1621. [Google Scholar] [CrossRef]
  40. Achilleos, C.; Papadopoulou, M.; Papadopoulos, A.; Anastasopoulos, I.; Koutsou, A.; Vassilaki, G. Proportioning of Steel Fibre Reinforced Concrete Mixes for Pavement Construction and Their Impact on Environment and Cost. Sustainability 2011, 3, 965–983. [Google Scholar] [CrossRef]
  41. Inyim, P.; Galarza, A.; Silva, G.; Rosa, F. Environmental Assessment of Pavement Infrastructure: A Systematic Review. J. Environ. Manag. 2016, 176, 128–138. [Google Scholar] [CrossRef]
  42. Loijos, A.; Santero, N.; Ochsendorf, J. Life Cycle Climate Impacts of the US Concrete Pavement Network. Resour. Conserv. Recycl. 2013, 72, 76–83. [Google Scholar] [CrossRef]
  43. JTG 3420-2020; Testing Methods of Cement and Concrete for Highway Engineering. Ministry of Transport of the People’s Republic of China: Beijing, China, 2020.
  44. Weather Spark. Tashkent Climate, Weather by Month, Average Temperature (Uzbekistan). 2023. Available online: https://weatherspark.com/y/107296/Average-Weather-in-Tashkent-Uzbekistan-Year-Round (accessed on 15 March 2025).
  45. Walkley, B.; Provis, J.L. Solid-State Nuclear Magnetic Resonance Spectroscopy of Cements. Mater. Today Adv. 2019, 1, 100007. [Google Scholar] [CrossRef]
  46. Zhang, X.; Pel, L.; Smeulders, D. Influence of Water-Soluble Leachates from Natural Fibers on the Hydration and Microstructure of Cement Paste Studied by Nuclear Magnetic Resonance. Cem. Concr. Res. 2024, 185, 10762. [Google Scholar] [CrossRef]
Figure 1. The detailed process of NSGA-III.
Applsci 15 05030 g001
Figure 3. Dry shrinkage simulation device for the Gobi Desert environment. (a) Simulation device setup; (b) actual experimental setup.
Applsci 15 05030 g003
Figure 4. Monthly temperature and wind velocity patterns in the central Asian arid region (2013~2023). (a) Temperature variation; (b) wind velocity variation [44].
Applsci 15 05030 g004
Figure 5. Predicted vs. actual values for the models. (a) Rf/Rc model; (b) Shrinkage model; (c) Porosity model.
Applsci 15 05030 g005
Figure 6. Plots of studentized residuals versus predicted.
Applsci 15 05030 g006
Figure 7. The responses trace for Rf/Rc.
Applsci 15 05030 g007
Figure 8. Rf/Rc Contour chart and 3D Surface chart. (a) Effect of W/C and AEA on Rf/Rc Contour chart; (b) Effect of W/C and AEA on Rf/Rc 3D Surface chart; (c) Effect of Sand ratio and AEA on Rf/Rc Contour chart; (d) Effect of Sand ratio and AEA on Rf/Rc 3D Surface chart.
Applsci 15 05030 g008
Figure 9. The responses trace for shrinkage.
Applsci 15 05030 g009
Figure 10. Shrinkage Contour chart and 3D Surface chart. (a) Effect of W/C and Sand ratio on Shrinkage. Contour chart; (b) Effect of W/C and Sand ratio on Shrinkage. 3D Surface chart; (c) Effect of W/C and Sand ratio on Shrinkage. Contour chart; (d) Effect of W/C and Sand ratio on Shrinkage. 3D Surface chart; (e) Effect of Sand ratio and AEA on Shrinkage. Contour chart; (f) Effect of Sand ratio and AEA on Shrinkage. 3D Surface chart.
Applsci 15 05030 g010
Figure 11. The responses trace for porosity.
Applsci 15 05030 g011
Figure 12. Porosity Contour chart and 3D Surface chart. (a) Effect of W/C and Sand ratio on Porosity. Contour chart; (b) Effect of W/C and Sand ratio on Porosity. 3D Surface chart; (c) Effect of Sand ratio and AEA on Porosity. Contour chart; (d) Effect of Sand ratio and AEA on Porosity. 3D Surface chart.
Applsci 15 05030 g012
Figure 13. Pareto optimal front.
Applsci 15 05030 g013
Figure 14. SEM characterization analysis of optimal mix rate. (a) Pre-optimization (200×); (b) pre-optimization (500×); (c) post-optimization (200×); (d) post-optimization (500×).
Applsci 15 05030 g014
Figure 15. Pore size distribution.
Applsci 15 05030 g015
Table 1. Chemical composition of cement (%).
MgOSO33CaO·SiO23CaO·Al2O3LOIInsoluble
2.891.8047.181.850.560.42
Table 2. Levels and codings of factors.
CodingFactor
x1x2/%x3/%
−10.35360.1
00.39390.2
10.43420.3
Note: x1 represents W/C; x2 represents: sand ratio; x3 represents AEA.
Table 3. Mix design parameters (kg).
NumberWaterCementSand5~10 mm
Aggregate
10~20 mm
Aggregate
SPAEA
1147420.0668.88356.7832.42.55.0 × 10−3
2147420.0724.62340.0793.42.52.5 × 10−3
3147420.0724.62340.0793.42.57.6 × 10−3
4147420.0780.36323.3754.32.55.0 × 10−3
5147376.9684.39365.0851.72.32.3 × 10−3
6147376.9684.39365.0851.72.36.8 × 10−3
7147376.9798.45330.8771.82.32.3 × 10−3
8147376.9798.45330.8771.82.36.8 × 10−3
9147341.9697.01371.7867.42.14.1 × 10−3
10147341.9755.09354.3826.72.12.1 × 10−3
11147341.9755.09354.3826.72.16.2 × 10−3
12147341.9813.18336.9786.12.14.1 × 10−3
13147376.9741.42347.9811.82.34.5 × 10−3
14147376.9741.42347.9811.82.34.5 × 10−4
15147376.9741.42347.9811.82.34.5 × 10−5
16147376.9741.42347.9811.82.34.5 × 10−6
17147376.9741.42347.9811.82.34.5 × 10−7
Table 5. Goodness-of-fit analysis of the response surface model.
ModelR2Ra2Rp2Ra2Rp2Precision
y10.87540.75070.69610.054611.2911
y20.83460.70600.62390.08216.6713
y30.98240.97520.96370.011518.8101
Table 6. Analysis of variance for the response surface models.
Termy1y2y3
F-Valuesp-ValuesF-Valuesp-ValuesF-Valuesp-Values
Model7.020.00626.490.006125.400.0011
x10.790.39901.36 × 10−20.90962.380.0164
x24.500.066610.690.00970.050.0984
x39.650.01452.760.13110.520.0527
x1x2//18.56/17.260.0089
x1x320.780.001814.670.023213.650.0072
x2x322.130.002413.45/18.170.0085
x1211.690.009111.260.0084//
x22//7.030.02649.440.0277
x3210.150.01293.770.084067.690.0004
x22x3////33.650.0021
x2x3218.330.0027//37.560.0017
Lack~of-fit0.690.64720.520.75371.58 × 10−50.9991
Table 7. NSGA-III parameter settings.
ParameterValue
Number of generated reference points50
Population size100
Maximum number of generations1000
Crossover rate0.9
Mutation rate0.01
Table 8. Correlation coefficients calculated by CRITIC.
ShrinkagePorosityRf/Rc
Shrinkage1.000.210.18
Porosity0.211.000.40
Rf/Rc0.180.401.00
Table 9. CRITIC parameter values and weights.
Standard Deviation (Si)Information Content (Cj)Weight (Wj)
Shrinkage0.221.320.29
Porosity0.162.000.32
Rf/Rc0.211.860.39
Table 10. VIKOR optimal solutions and conditions.
NumberW/CSand RatioAEASiRiQi
20.3536.00.2000.04120.03210.0000
30.3539.00.1000.05230.03890.0124
320.3637.70.1930.05870.04120.0189
590.3737.30.1800.06310.04560.0253
640.3737.40.1760.06540.04780.0287
90.3936.80.1050.06720.04830.0301
470.3738.30.1720.06890.04950.0329
600.3737.20.2010.07010.05010.0344
580.3539.70.1860.07150.05120.0367
360.3740.70.1140.07280.05240.0385
Note: only the top 10 VIKOR-ranked solutions (out of 73 Pareto-optimal solutions) are presented in the table. The selection highlights the most relevant results for clarity and further discussion.
Table 11. Validation results.
Evaluation IndicatorPredicted ValueTest Value95% PI Low95% PI High
Shrinkage/%0.04460.04330.04260.0466
Porosity/%2.702.822.572.84
Rf/Rc0.1360.1410.1290.143
Disclaimer/Publisher’s Note: The statements, opinions and data contained in all publications are solely those of the individual author(s) and contributor(s) and not of MDPI and/or the editor(s). MDPI and/or the editor(s) disclaim responsibility for any injury to people or property resulting from any ideas, methods, instructions or products referred to in the content.

