Article

Analysis of a Mixture of Banana Peel and Rice Straw Extracts for Inhibiting Corrosion of Carbon Steel in Hydrochloric Acid Solution

1
Department of Chemistry, Faculty of Basic Sciences and Engineering, Gonbad Kavous University, Gonbad Kavous 49717-99151, Iran
2
Department of Chemistry, Faculty of Science, Gonbad Kavous University, Gonbad Kavous 49717-99151, Iran
*
Author to whom correspondence should be addressed.
Appl. Sci. 2025, 15(9), 5026; https://doi.org/10.3390/app15095026
Submission received: 24 March 2025 / Revised: 29 April 2025 / Accepted: 29 April 2025 / Published: 30 April 2025

Abstract

:
Preventing metal corrosion is one of the most pressing issues in the modern world. One of the most effective ways to combat corrosion is to use inhibitors. Currently, much research is devoted to the study of green corrosion inhibitors obtained from plant extracts and agricultural waste. In this study, banana peel extract, rice straw extract, and their mixture as green corrosion inhibitors of carbon steel samples in 1 M HCl solution were examined by weight loss, electrochemical, and scanning electron microscopy methods. The experimental results showed that the mixture of extracts (40:60 banana peel and rice straw) had a higher inhibitory capacity than the individual inhibitors. At 750 ppm after 24 h of immersion, the inhibition of banana peel, rice extract, and the suggested mixture was 77.87, 95.03, and 96.36%, respectively. Furthermore, the mixture exhibited a maximum synergistic inhibition value of 1.65, indicating a 65% increase in inhibition efficiency when using the mixture instead of the extract alone. Nyquist plots obtained from electrochemical experiments confirmed the optimum concentration value of 750 ppm for banana peel extract, rice extract, and their mixture. These tests also show that the diameter of the semicircles in the presence of the mixture was larger than in the case of the extract alone, indicating a higher inhibitory capacity of the mixture. Moreover, scanning electron microscopy analysis showed the formation of a stable protective film on the metal surface. Finally, adsorption analysis showed the presence of both physical and chemical adsorptions of all the extracts used, which was obtained using the Langmuir isotherm.

1. Introduction

Corrosion is the process of material degradation due to reaction with the environment in which it is located [1]. Corrosion is an unwanted spontaneous process of loss of important properties of metals during their physical interaction with the environment. Destruction of metal products associated with the loss of metal mass causes great damage to the industry [2]. Corrosion has always been a key problem in the oil and gas industry, and researchers are working to solve this problem; reducing and preventing its effects can prevent economic losses [3].
Hydrochloric acid is used to clean oil wells, in the chemical industry to obtain chloride salts and organic products, to synthesize synthetic rubber and dyes, and to saponify fats and oils. In many areas of industry, there is a problem of developing reliable methods of protecting equipment and steel products from destruction by hydrochloric acid solution, which is an aggressive environment [4,5,6,7]. The study of the process of corrosion destruction of steel by hydrochloric acid using the gravimetric method shows the dependence of the loss of sample mass on the concentration of the acid solution [8]. In addition, the rate of destruction of steel samples depends on temperature [9]. This confirms the general rule about the dependence of the rate of chemical reaction on temperature, since with increasing temperature the rate of diffusion and the rate of dissolution of oxide films located on the surface of the samples increase [10,11,12].
Corrosion inhibitors are divided into two categories according to chemical composition: inorganic and organic [13,14], but they have many disadvantages, such as toxicity, short-term stability, and rapid decomposition [15,16]. Traditional corrosion inhibitors, which are highly toxic, cause irreparable damage to the environment at various stages, from the production process of these materials to transportation and application. The use of environmentally friendly corrosion inhibitors based on plant raw materials is due to a number of factors, including a renewable source of the inhibitor, as well as a structure of substances that is environmentally acceptable for nature and humans [2,17]. At the same time, plant extracts and fruit wastes have attracted much attention because they contain many active compounds and can prevent [18,19,20,21].
The inhibition efficiency of the compound increases with the number of heteroatoms and benzene rings [22]. Also, the chemisorption of an organic compound increases with the increase of electron density on the heteroatom. The mechanism of action and the inhibitory function of the extracts directly depend on the active phytochemical compounds present in the plant [23]. In general, the mechanism of corrosion inhibitor adsorption is carried out in three ways: chemical adsorption, physical adsorption, and a combination of these adsorptions [24]. The following is a literature review on the use of banana peel and rice straw extracts as green corrosion inhibitors.
Ji et al. (2015) reported the inhibition efficiency of banana peel extract in one molar HCl solution on mild steel samples by conducting various experiments [25]. The authors noted that the main compound inhibiting the corrosion process was gallocatechin. They observed a maximum inhibition efficiency of 92% for mild steel using a weight loss test. The authors, studying the effect of immersion time, concluded that the inhibition efficiency of banana peel extract was a function of test duration. Su et al. (2025) analyzed the inhibition efficiency of banana peel extract as green corrosion inhibitors for carbon steel [26]. The authors reported an inhibition efficiency of 77.9% using the weight loss method. The protective film on the metal surface was confirmed by morphological analysis of the treated samples with banana peel extract. The authors noted that the use of this green inhibitor can help in safe and clean production in various industries, including petroleum. Manikandan et al. (2019) evaluated the inhibitory properties of banana peel extract on mild steel in HCl solution [27]. They reported that the inhibition efficiency could be increased by increasing the extract concentration up to 87%. The authors noted from FTIR analyses that the adsorption of the extract occurs due to the presence of hydroxyl and carboxyl groups. Tambun et al. (2018) reported a maximum inhibition efficiency of 68% for banana peel extract in preventing iron corrosion in 3% NaCl solution [28]. They noted that, based on FTIR analysis, tannin compounds are present in banana peel extracts that reduce the corrosion rate. Fouda et al. (2021) used rice straw extract to inhibit Al corrosion in 2M HCl solution by conducting weight loss and electrochemical experiments [29]. They observed an inhibition efficiency of 96.8% at 25 °C after 3 h of immersion. The results showed that rice straw extract acted as a mixed-type green corrosion inhibitor. Both physical and chemical adsorptions occurred based on the use of the Langmuir isotherm model. In addition, the activation energy of the corrosion process in the presence of rice straw extract was higher than in its absence. Oyewole et al. (2022) analyzed the corrosion protection of mild steel in 1.5 M sulfuric acid solution using rice straw extract at different temperatures, immersion times, and concentrations [30]. The authors optimized the corrosion inhibition process and determined the maximum efficiency of 86.4% at the optimal parameter values for rice straw extract. In addition, the authors noted that the formation of a double electrical layer on the surface of the metal sample by adsorption of extract molecules can inhibit the corrosion process. Yahya et al. (2019) used rice straw extract as a green corrosion inhibitor for mild steel samples in NaCl solution (3.5%) [31]. Based on LC-MS analysis, the authors noted the presence of 4-allylsyringol and 4-ethyl guaiacol as the main compounds that act as corrosion inhibitors due to the presence of benzene rings and heteroatoms in their structures. In these compounds, the presence of lone electron pairs and relative positive charges caused both chemical and physical adsorptions.
According to the above, the use of green corrosion inhibitors can solve the environmental problem compared with traditional ones. In addition, the increase in corrosion inhibition can be achieved by mixing different reagents. The inhibition results of a mixture of banana peel extract and rice straw extract have not been reported in the literature. For this purpose, in this study, a mixture of banana peel extract and rice straw extract is investigated for preventing corrosion damage of carbon steel in a one molar hydrochloric acid solution. The obtained extracts are used in a corrosive environment separately (100% banana peel and 100% rice straw), as well as in the form of mixtures in various mixing ratios. The inhibition efficiency of green corrosion inhibitors is evaluated by weight loss and electrochemical tests. Based on experimental analyses, the best mixing ratio and optimum inhibition concentration of the mixture of two extracts are determined. Moreover, the effect of immersion time on the inhibition efficiency of green inhibitors is examined. The formation of a protective film on the surface of metal samples in the presence of inhibitors is studied using scanning electron microscopy. Finally, the adsorption mechanism and Gibbs free energy are investigated to determine the type of adsorption of the extracts on the metal surface.

2. Material and Methods

In this study, banana peel and rice straw extracts were prepared and used as green corrosion inhibitors for HCl solution. Various tests were conducted to determine the inhibition efficiency of the extracts individually and as a mixture. The flowchart of the steps and methods used is shown in Figure 1. The details of the experimental methods performed are given in the subsections below.

2.1. Materials and Extract Preparation

In this study, carbon steel samples (1 × 1 × 0.1 cm3) were examined. The tests were performed in a one molar hydrochloric acid environment. Extracts of banana peel and rice straw were used as green corrosion inhibitors. The collected samples of rice straw and banana peel were washed, dried, crushed to a smaller size using an industrial grinder, and powdered separately. 200 g of powdered banana peel and rice straw, which were extracted separately by soaking in 70% ethanol (400 cc) for 72 h at 25 °C. Then, the solutions were stirred at 65 °C on a hot plate for 2 h. The extracted solutions were filtered under a vacuum pump. The alcohol was then removed from the mixture using a centrifuge, after which the extracts were obtained.

2.2. Weight Loss Method

The weight loss method is one of the most common and effective methods for determining the corrosion rate of metals under laboratory conditions and determining the inhibitory efficiency of corrosion inhibitors under static conditions. In this case, the metal being tested is determined by the difference in mass loss in the solution with and without the addition of the inhibitor [32]. All samples were preliminarily degreased and weighed on high-precision analytical scales. The experiments were conducted in a hydrochloric acid solution and in the presence of corrosion inhibitor additives at different concentrations (0–blank, 250, 500, 750, and 1000 ppm). The tests were carried out in three immersion periods: 6, 24, and 48 h at a constant temperature of 35 °C. In this study, 100% banana peel extract (BPE), 100% rice straw extract (RSE), 50:50 BPE:RSE, 40:60 BPE:RSE, and 60:40 BPE:RSE were used in weight loss tests. After completion of each test, the mass of the steel specimens was measured again, and the mass reduction during immersion was determined. Three parallel measurements were performed at each inhibitor concentration, and the average mass loss values were used to evaluate the inhibition efficiency. The corrosion rate and inhibition efficiency of the green inhibitors were determined using the following relationships [33]:
C R = 8760   Δ m A ρ t
I n h i b i t i o n   e f f i c i e n c y   ( I E ) = C R 0 C R 1 C R 0 × 100
where CR is the corrosion rate of the carbon steel samples in the studied corrosive medium (mm·y−1); 8760 is a constant obtained by converting an hour to a year (7860 = 24 × 365); Δm is the mass reduction of the metal samples after test completion (mg); A is the surface area of the metal samples (mm2); ρ is the density of the examined steel samples (kg·m−3); t is the time (h); and CR0 and CR1 are the corrosion rates without and with the addition of the extracts as green corrosion inhibitors to the solution (mm·y−1).
The values of the synergistic inhibitory effect of the mixture of BPE (40%) and RSE (60%) at 35 °C were determined. For this purpose, the inhibitory efficiency values of the mixture at different concentrations (250, 500, 750, 1000 ppm) were used for test durations of 6, 24, and 48 h. The following formula was used to quantify the synergistic inhibition effect [34]:
S y n e r g i s t i c   i n h i b i t i o n   e f f e c t   v a l u e = I E m 40 × I E B P E + 60 × I E R S E × 100
where IEm is the inhibition efficiency of the mixture of BPE (40%) and RSE (60%) (%); IEBPE is the inhibition efficiency of 100% banana peel extract (%); and IERSE is the inhibition efficiency of 100% rice straw extract (%). It should be noted that if the value of the synergistic inhibitory effect is greater than one, then a positive effect is observed [34]. This means that the inhibitory efficiency of the mixture is higher than that of individual inhibitors.

2.3. Electrochemical Tests

Electrochemical tests (electrochemical impedance spectroscopy—EIS) were carried out to evaluate the corrosion behavior of carbon steel samples in the one-molar HCl solution and also to analyze the inhibitory ability of banana peel, rice straw, and their mixture extracts. In addition, these tests were used to determine the optimum concentration of inhibitors and to determine the mixing ratio that would achieve the highest corrosion inhibition efficiency. For this purpose, electrochemical testing was completed using a cell containing three electrodes: working (carbon steel sample), reference (silver/silver chloride), and counter (platinum) using a CorrTest potentiostat (CS350M, Corrtest, China) device. The value of dissolved oxygen in the test environment was 1 ppm. All EIS tests were conducted at 35 °C and 24 h immersion time. First, BPE (100%) and RSE (100%) were tested separately at concentrations of 0, 250, 500, 750, and 1000 ppm. Then, their mixture in ratios of 40:60, 50:50, and 60:40 (BPE:RSE) at 750 ppm was analyzed. Finally, the best mixture (40:60 BPE:RSE), 100% BPE, and 100% RSE at 750 ppm were investigated to compare the inhibition efficiency of the proposed mixture and individual inhibitors. In all EIS tests, Nyquist plots were used to evaluate the corrosion inhibition performance of the extracts under static conditions.

2.4. Scanning Electron Microscopy Analysis

Scanning electron microscopy (SEM) was used to analyze and characterize the metal surfaces. Carbon steel samples were examined in the presence and absence of extracts in the corrosive medium using a CamScan MV2300 (Tescan, Czech Republic) device. The immersion time of the samples was 24 h at 35 °C. The inhibitors were used at a concentration of 750 ppm. A mixture of banana peel extract and rice straw extract was used in a ratio of 40 to 60.

2.5. Adsorption Analysis

The corrosion inhibition process occurs due to the adsorption of inhibitor molecules at the metal-solution interface. The importance of the adsorption isotherm is due to its information about the interaction of molecules with the metal surface [35]. Surface coverage values were obtained by weight loss at different inhibitor concentrations and immersion times. Surface coverage values were used to test how they fit different isotherm models. The obtained data showed the best agreement with the Langmuir adsorption model. In the Langmuir adsorption isotherm, the adsorbed layers do not interact with each other, and the surface is uniform and homogeneous. The Langmuir adsorption isotherm is expressed by the following relationship [34]:
C θ = 1 K a d s + C
where C is the molar concentration of green corrosion inhibitor (M), θ is the surface coverage value (IE/100), and Kads is the adsorption constant. By plotting C/θ versus C and obtaining the y-intercept, the adsorption constant is determined. The Kads values were used to determine the Gibbs free energy using the following relationship [36]:
G a d s = R T l n ( 55.5 K a d s )
where ΔGads is the Gibbs free energy, which is used for evaluating the extract adsorption on the metal surface (kJ·mol−1); R is the gas constant in SI units; and T is the absolute temperature (308.15 K in this study). The Gibbs free energy values were determined for 100% BPE, 100% RSE, and their mixture (40:60 BPE:RSE) for immersion durations of 6, 24, and 48 h.

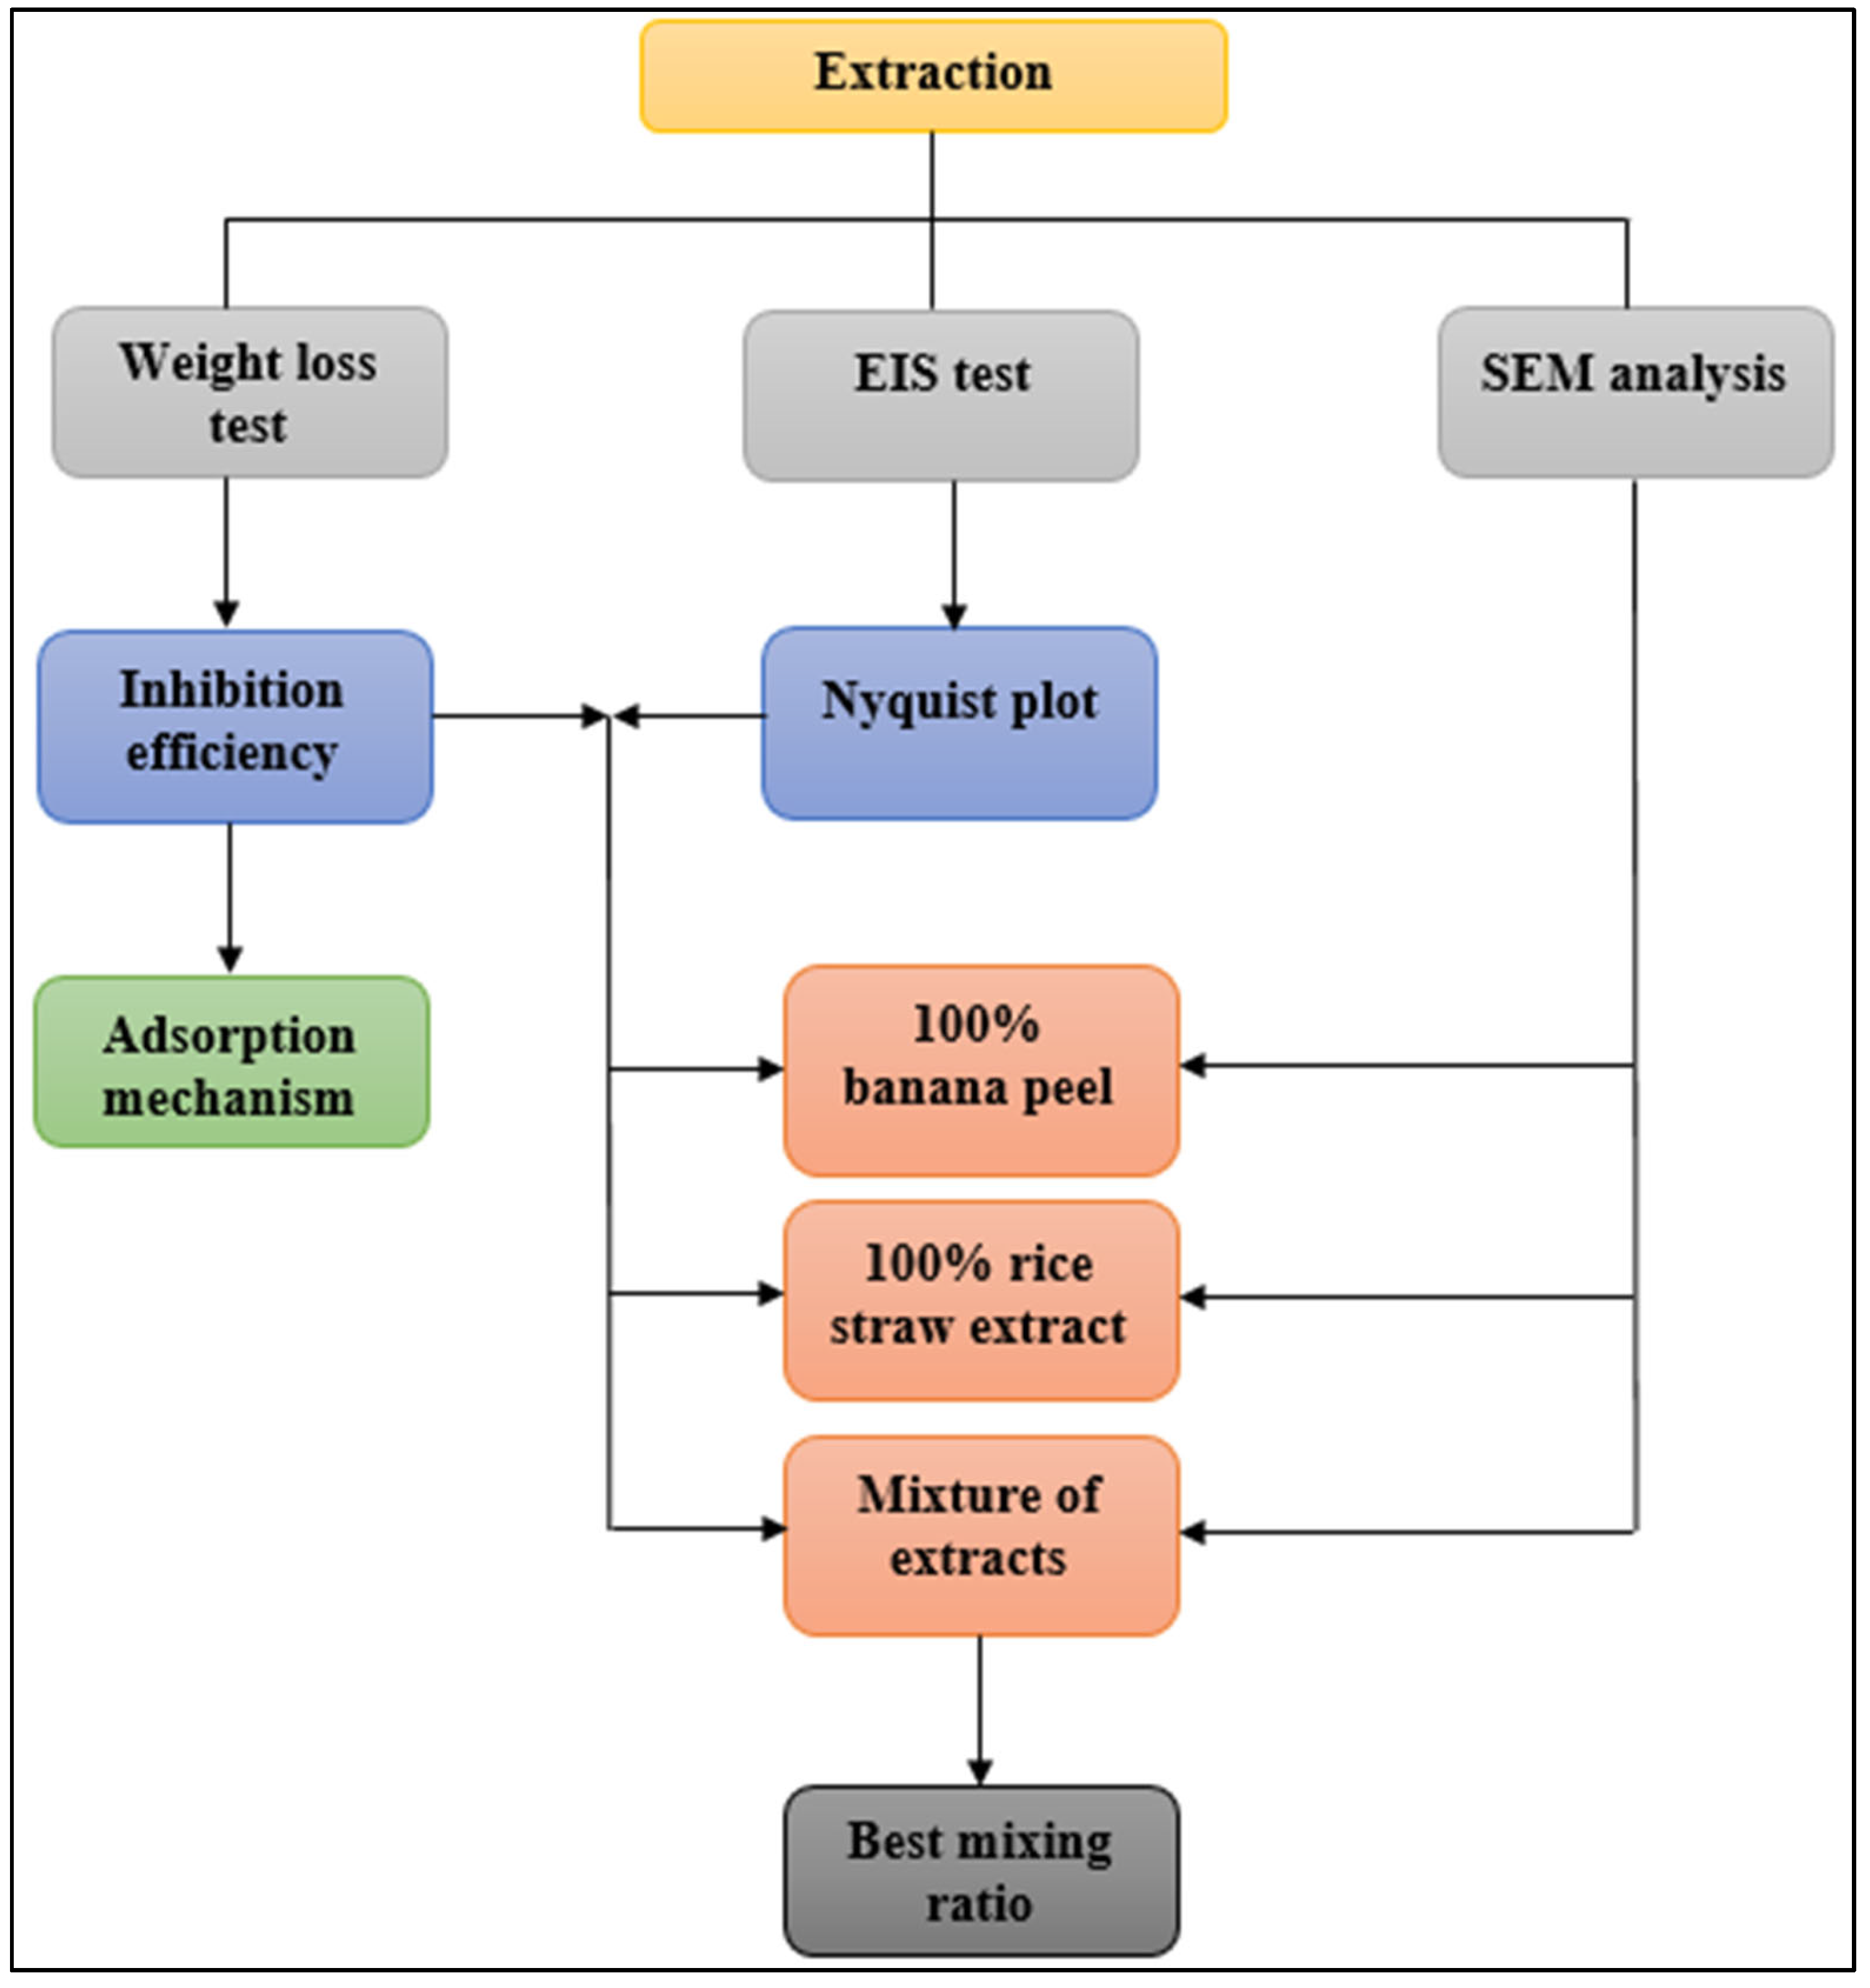
3. Results and Discussion

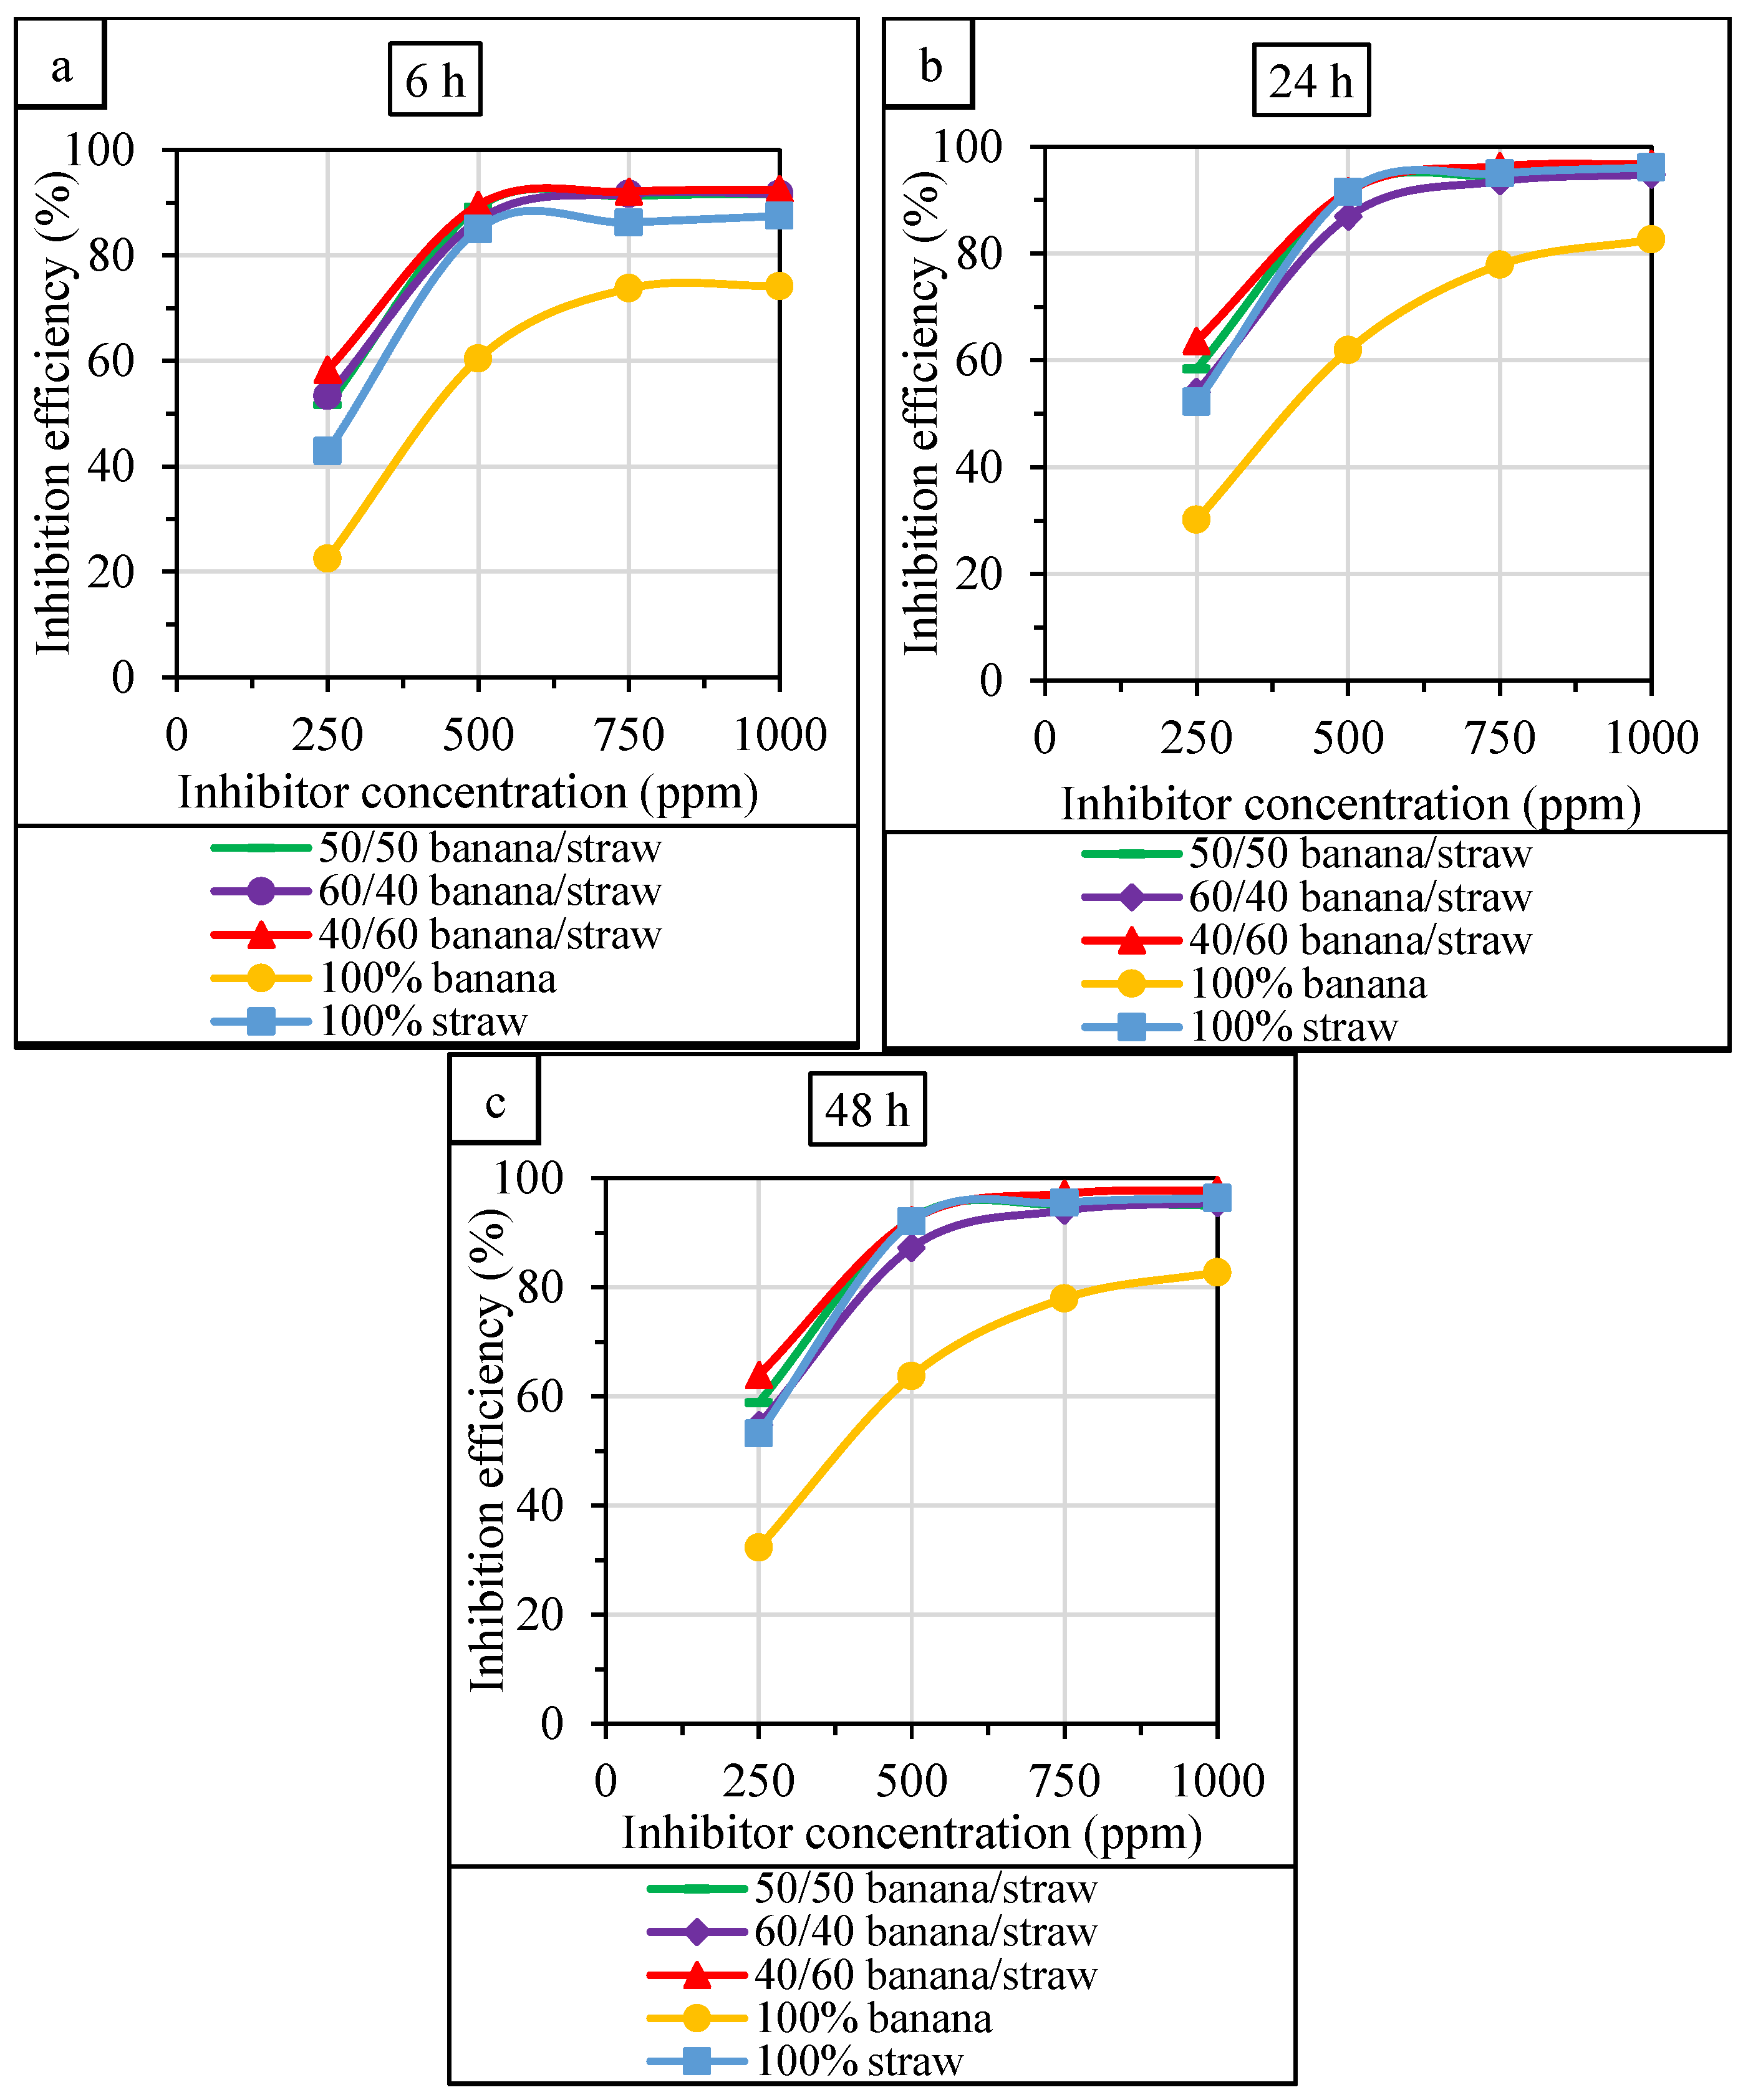
3.1. The Results of Weight Loss Tests

Studies have shown that the greatest protective effect, due to the presence of a synergistic effect, is provided by mixtures of corrosion inhibitors [37,38,39]. The results of weight loss tests (inhibition efficiency) in the presence of BPE (100% banana peel), RSE (100% rice straw), and their mixture in different mixing ratios are shown in Figure 2. The results were obtained at a constant temperature of 35 °C in HCl. The figure demonstrates that the content of the extracts in the acid affects the control of the corrosion process. It should be noted that if the extracts used are not used in sufficient quantities, the corrosion rate will be high and the inhibition process will be useless. The concentrations of green corrosion inhibitors ranged from 250 to 1000 ppm. The figure shows that significant increases in efficiency occur with increasing concentrations of BPE, RSE, and their mixture in all mixing ratios up to approximately 750 ppm. At higher inhibitor dosages (above 750 ppm), the changes in efficiency were not significant. Thus, Figure 2 demonstrates that the optimal concentration of the extract is 750 ppm. Such an increase in the effectiveness of the studied extracts as green corrosion inhibitors is associated with the formation of a layer on the metal surface. Moreover, the highest inhibition efficiency was obtained when mixing 40% BPE and 60% RSE (according to experimental results). The inhibition efficiency of 100% BPE, 100% RSE, and 40:60 (BPE:RSE) at 750 ppm after 24 h was 77.87, 95.03, and 96.36%, respectively. It should be noted that the details of the data obtained by the weight loss method (mass reduction, corrosion rate, and inhibition efficiency) are shown in the Supplementary Materials in Table S1.
Immersion time plays an important role in corrosion control studies, affecting the corrosion rate and inhibition efficiency. As the test time increases, the corrosion rate increases due to the longer contact of the immersed specimen with the acidic environment [10]. Also, when determining the corrosion rate, the test duration is in the denominator of Equation (1). Thus, the effect of immersion time on the inhibition efficiency is not the same for different inhibitors in corrosive acids. Figure 2 shows the effect of immersion time using weight loss data for banana peel extract, rice straw extract, and their mixtures in different ratios. In this case, the inhibition efficiency was determined at 35 °C. As can be seen from the graphs, the inhibition efficiency increases with increasing immersion time. Thus, over a longer period of time, a stronger protective layer of inhibitor against the corrosion process is formed.
It should be noted that the corrosion process of steel samples in an HCl solution without an inhibitor or at low inhibitor concentrations occurs through anodic and cathodic reactions and leads to the formation of chloride products as follows:
Fe (s) ➝ Fe2+ (aq) + 2e
2H+ (aq) + 2e ➝ H2 (g)
Fe (s) + 2HCl (aq) ➝ Fe2+ (aq) + H2 (g)+ 2Cl (aq) ➝ FeCl2 (aq) + H2 (g)
Other side reactions also occur due to the presence of dissolved oxygen (1 ppm) and produce oxide products as follows:
O2 + 4H+ + 4e ➝ 2H2O (l)
2Fe (s) + O2 (g) + 2H2O (l) ➝ 2Fe2+ (aq) + 4OH (aq) ➝ 2Fe(OH)2 (s)
2Fe(OH)2 (s)+ 0.5O2 (g) + H2O (l) ➝ 2Fe(OH)3 (s)
2Fe(OH)3 (s) ➝ Fe2O3 (s) + 3H2O (l)
At a sufficient concentration of the inhibitor, the above reactions do not occur due to the prevention of contact of the metal with the acidic environment and the inhibition of the formation of electrons.
Figure 3 depicts the results of the synergistic inhibitory effect between BPE and RSE for corrosion control of a carbon steel sample using weight loss data. These results are related to the mixture of 40% BPE and 60% RSE as the best ratio based on the weight loss test results (Figure 2). In addition, synergistic evaluation was performed at different concentrations and immersion times at a constant temperature of 35 °C. Figure 3 shows that synergistic effects were observed at all concentrations and immersion times. A synergistic effect of greater than one is a positive value and indicates an increase in the inhibition efficiency of the mixture compared to the individual inhibitors [33]. The highest synergistic effect values were observed at 250 ppm. In addition, the synergistic effect decreased with increasing immersion time. The highest synergism value was 1.65, indicating a 65% increase in the inhibitory efficiency of the mixture compared to the individual inhibitors.

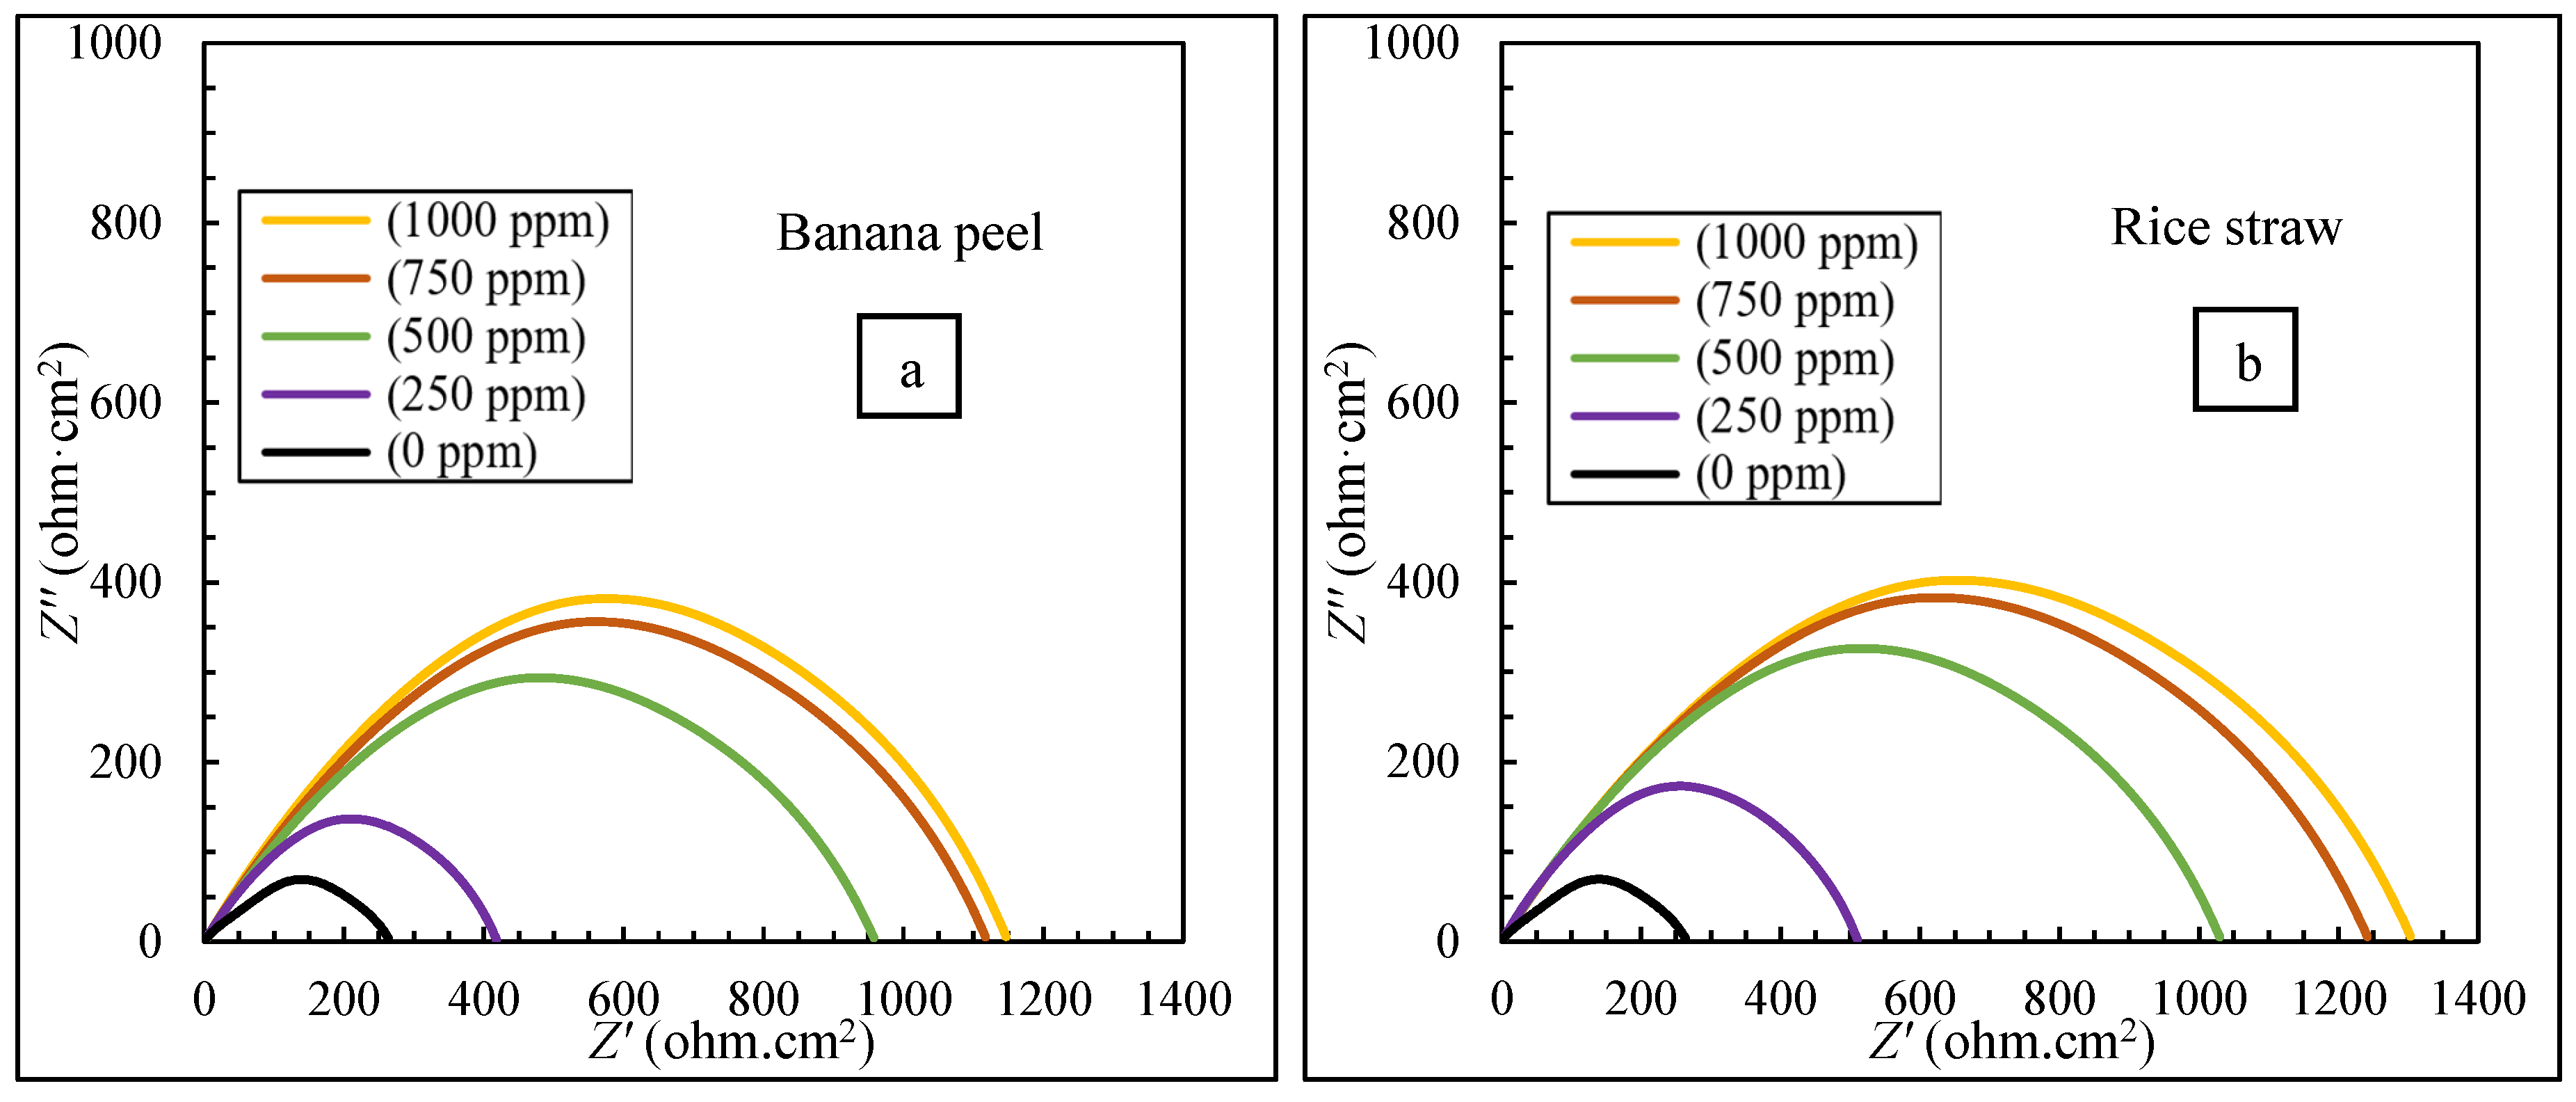
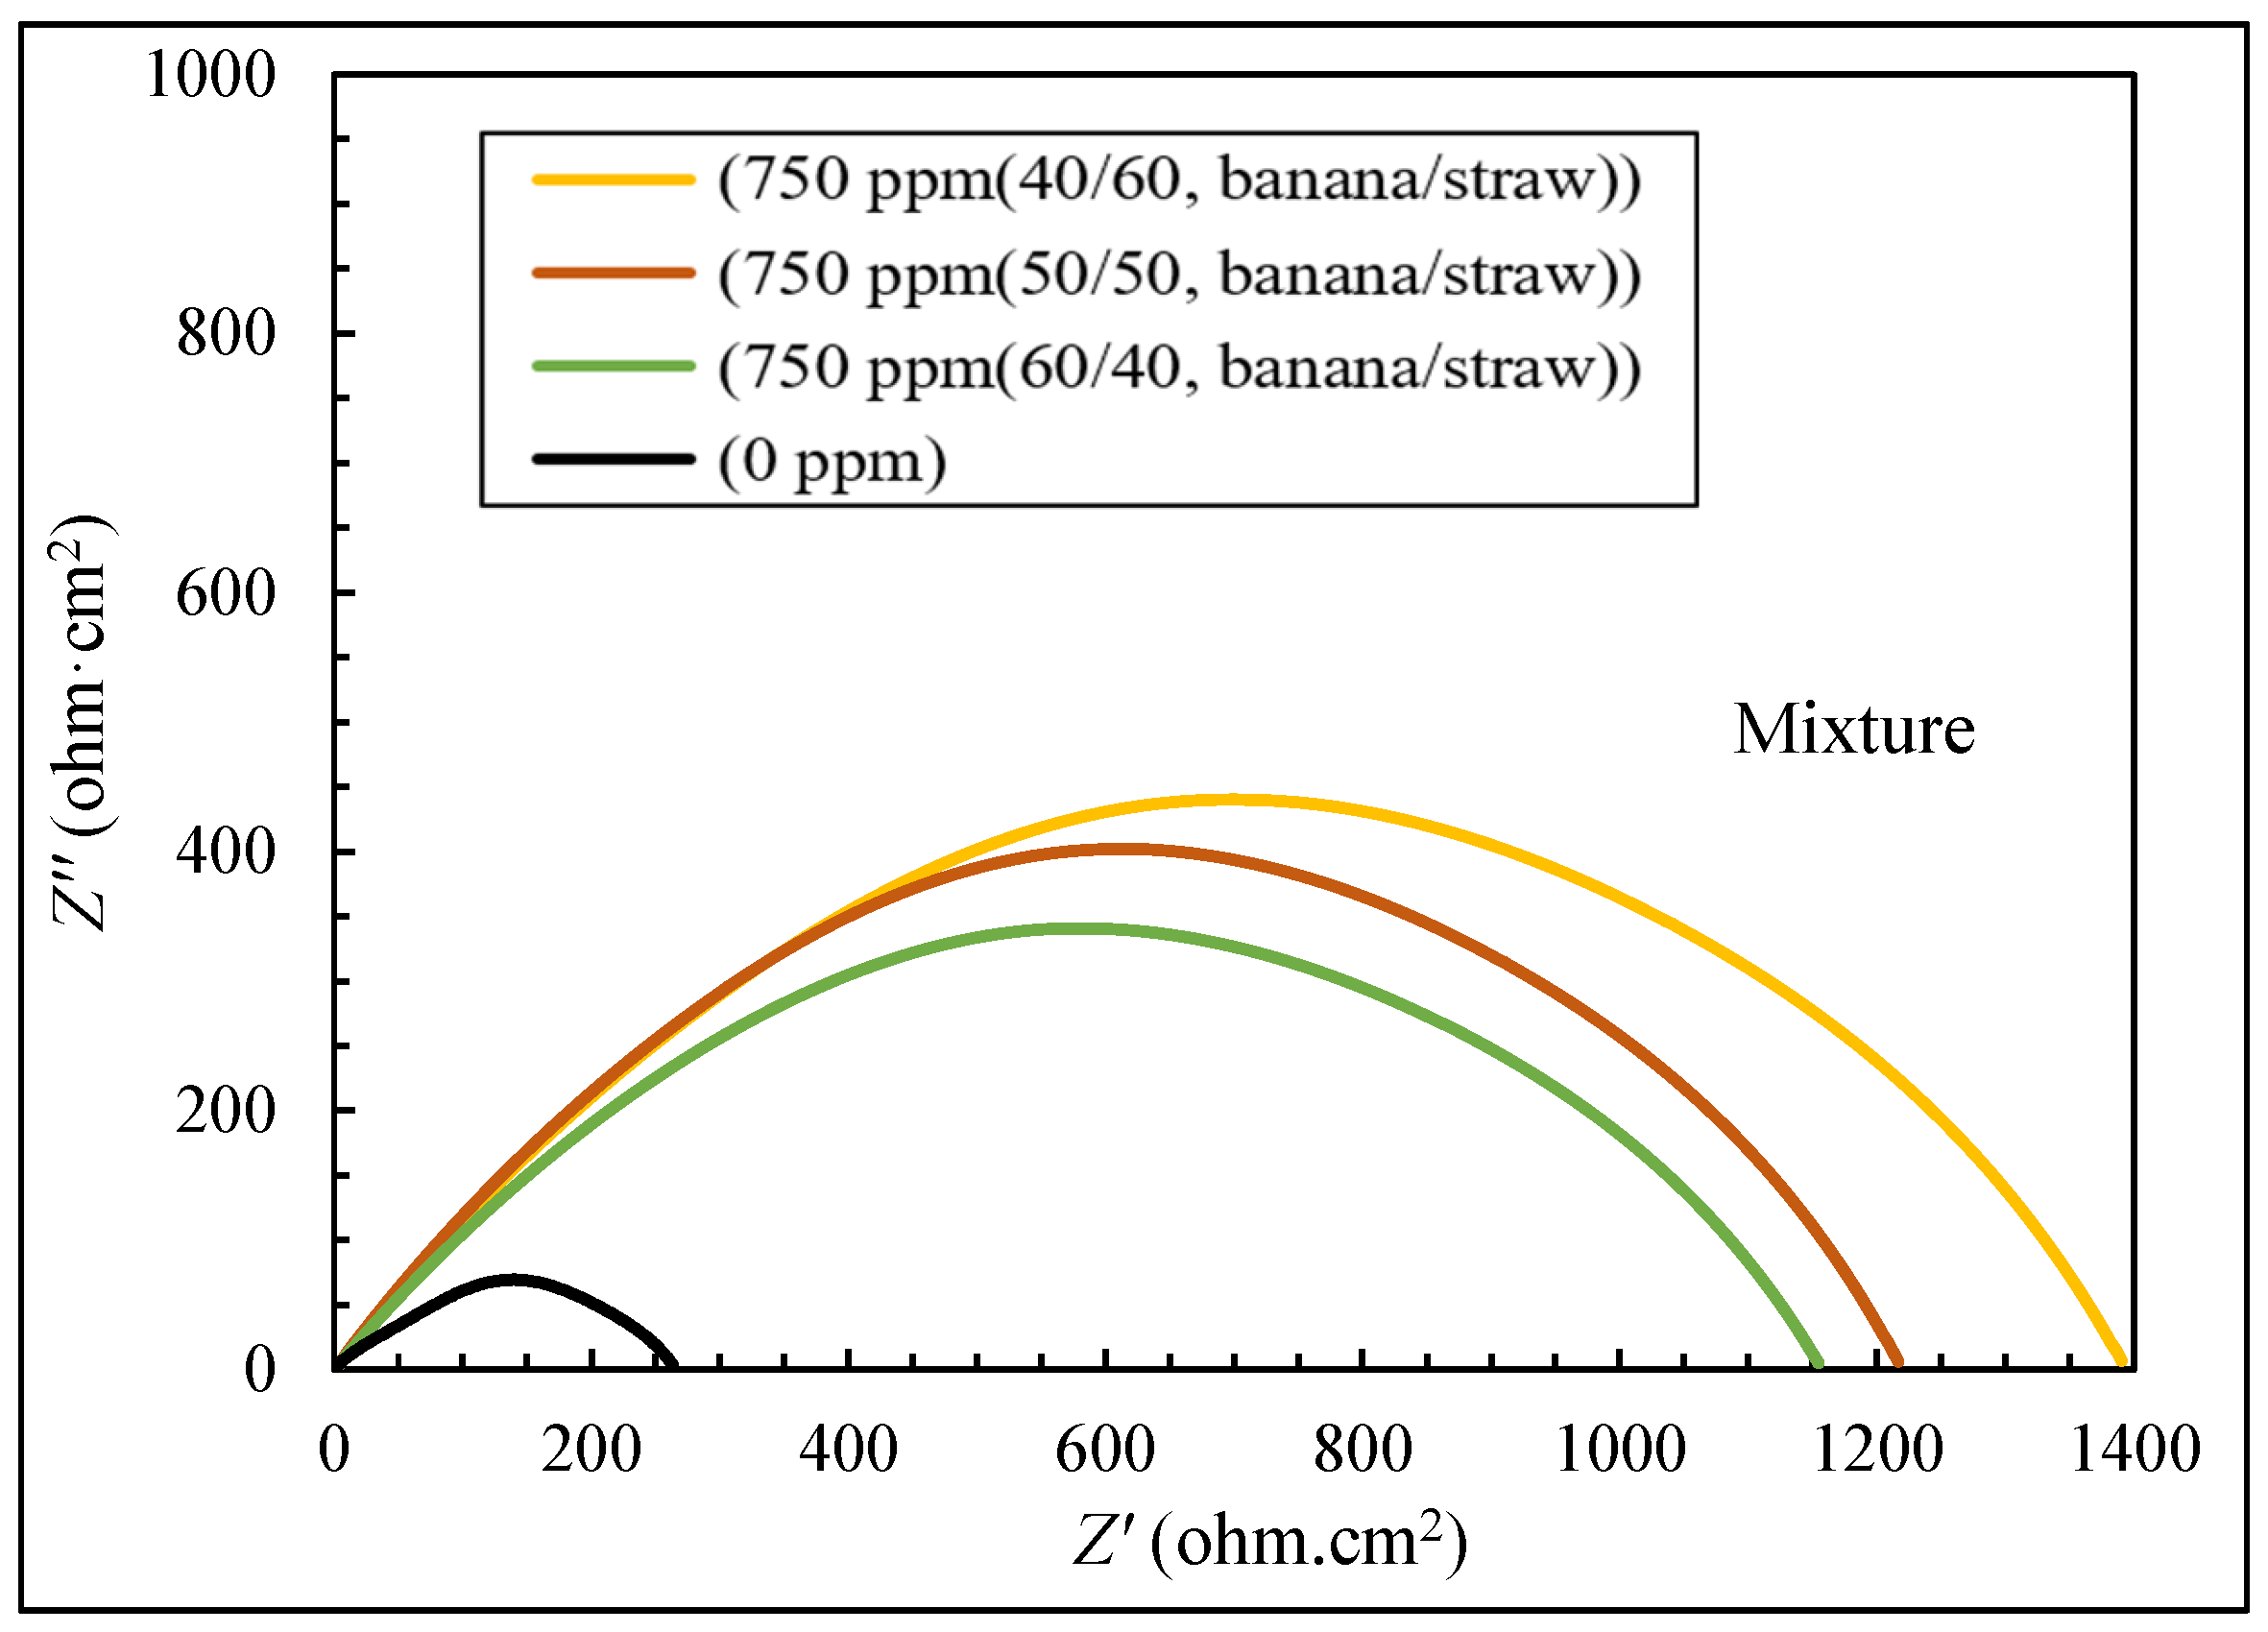
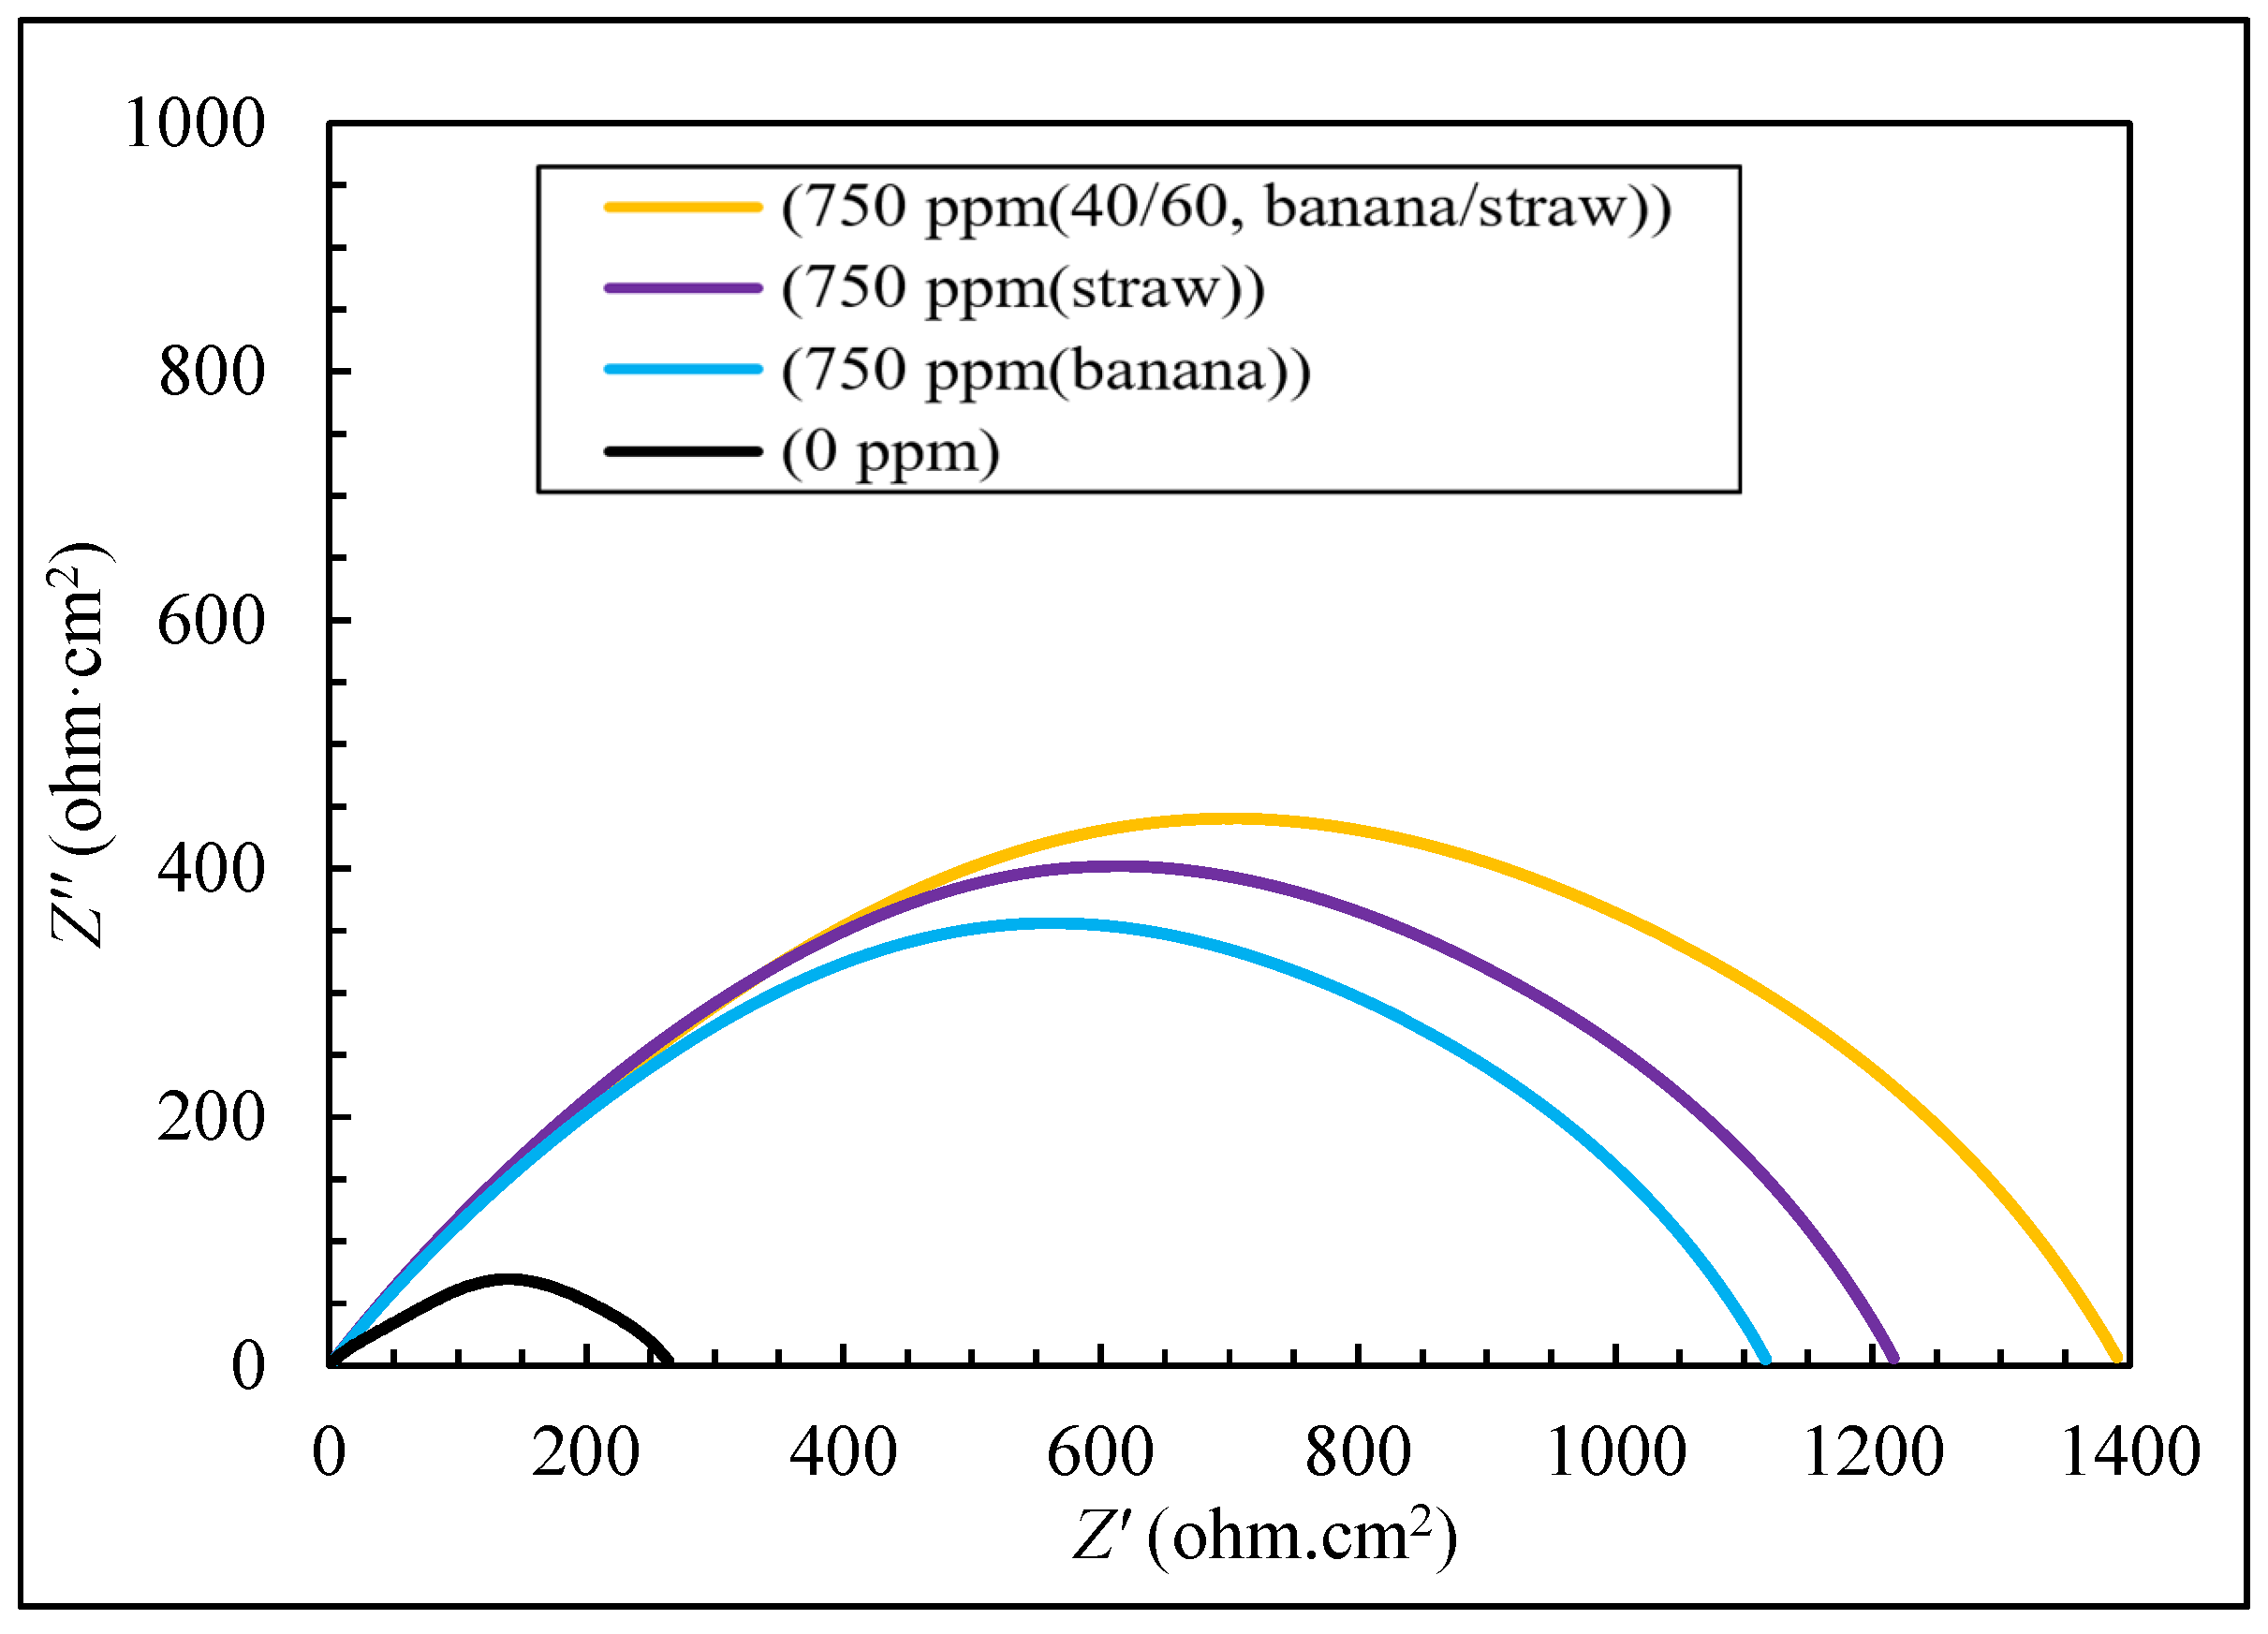
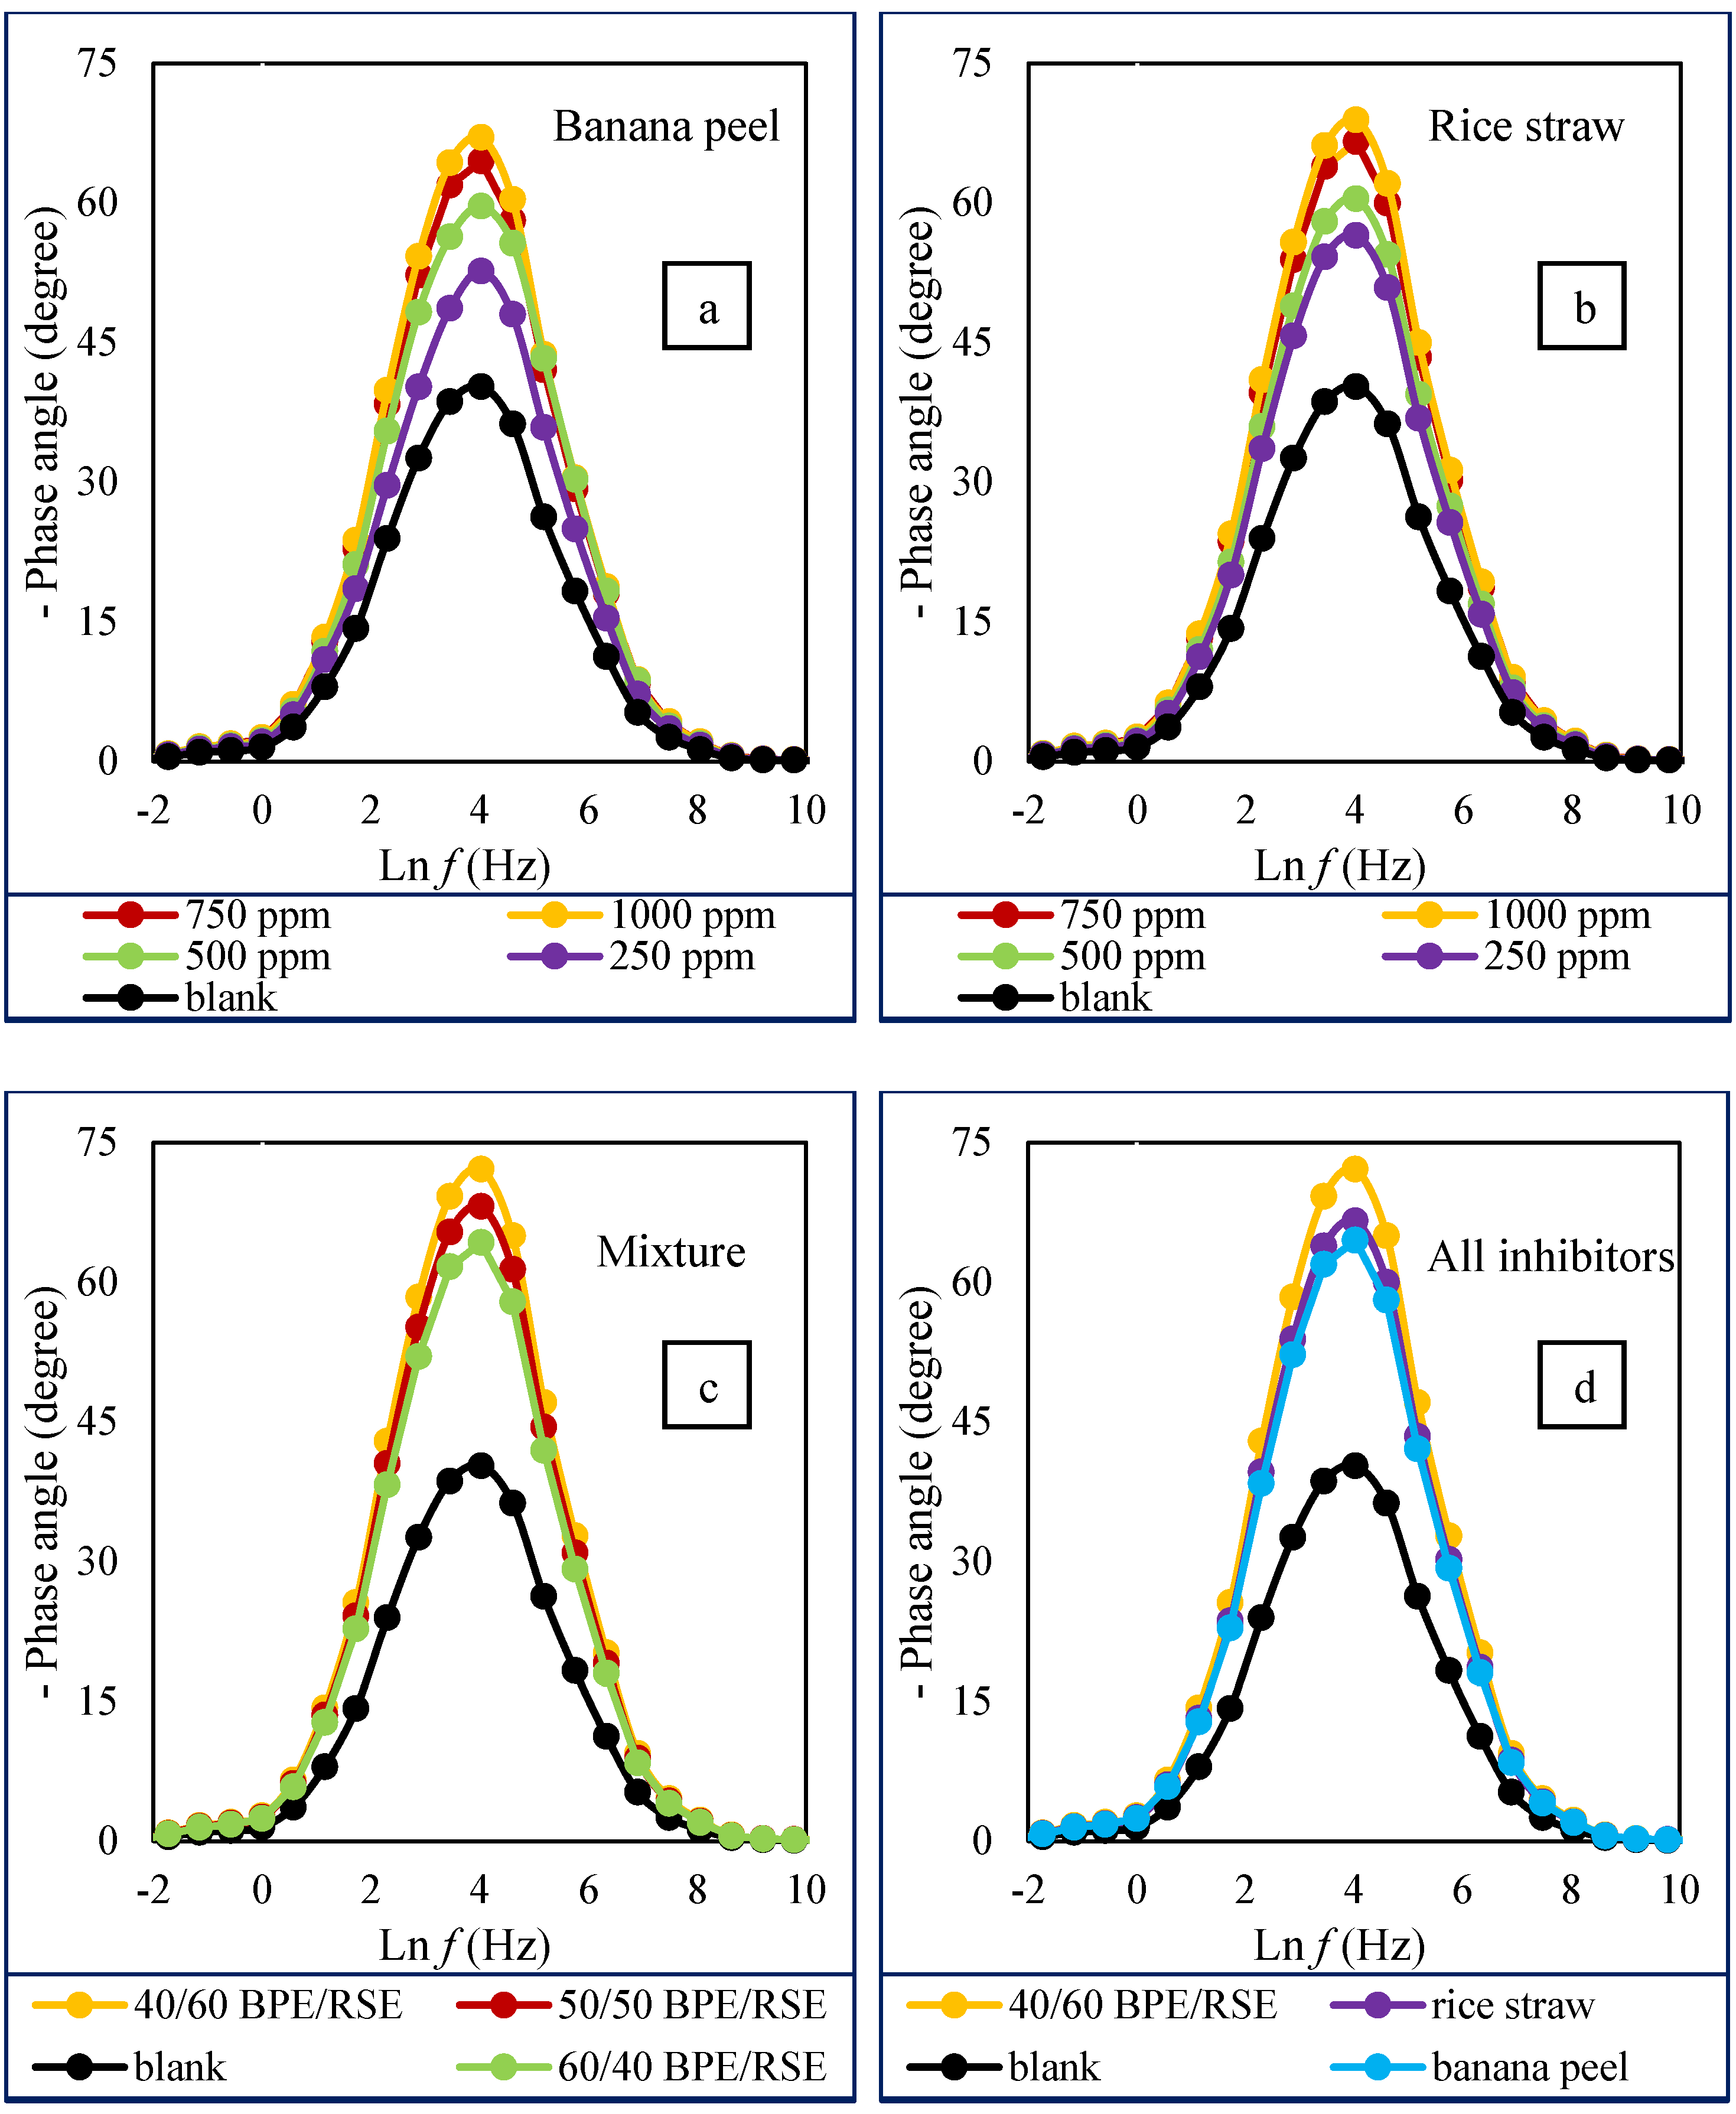
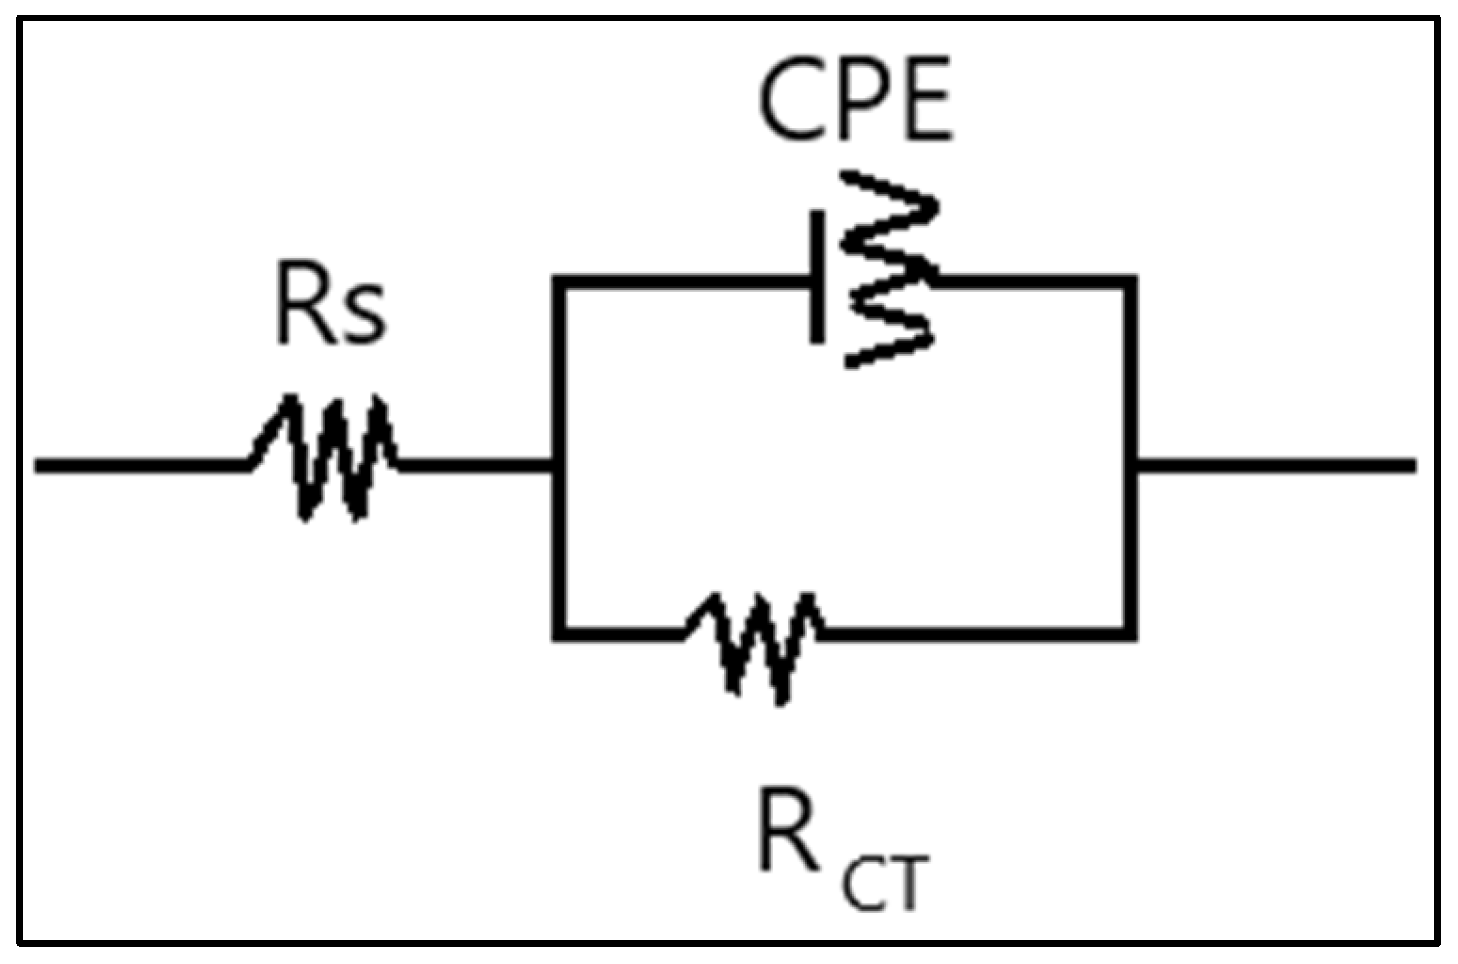
3.2. The Results of EIS Tests

The inhibition efficiency of the extracts was analyzed by electrochemical impedance spectroscopy. The Nyquist plots obtained by EIS are presented in Figure 4, Figure 5 and Figure 6. The figures show the results of the EIS test after 24 h of immersion in the solution. The semicircles in the Nyquist diagram are due to the charge transfer reaction that occurs on the metal surface near the electrolyte. The simplest possible case is when the sample surface is not coated. According to the results, all the figures are semicircular, which indicates non-ideal capacitive behavior at the metal-solution interface. The inhibitor molecules must repel the solution molecules, which creates resistance in the solution, and then the inhibitor molecules must overcome a large barrier, which is the electrical double layer that occurs when the sample is immersed in the solution [1]. As can be seen from the figures, in the presence of the inhibitor, the charge transfer resistance increased, and, as a result, the diameter of the semicircle in the Nyquist diagram increased. Analysis of these results may indicate the inhibitory effect of the compound used on the corrosion rate of the steel surface. When an inhibitor is added to the environment, the resistance of the solution increases, meaning that when a corrosion inhibitor is added, it becomes more difficult for ions to reach the metal surface, which reduces the corrosion rate [4].
If the resistance of the solution is high, in other words, the concentration of inhibitors is low and their passage through the solution molecules is difficult, then the controlling factor of the corrosion process is concentration polarization [40]. If the inhibitor concentration is high and the inhibitor molecules easily reach the sample surface, the molecules have to cross the electrical double layer, which means that the reaction on the metal surface is difficult. In this case, the corrosion process is controlled by polarization due to charge transfer. Therefore, it can be concluded that the corrosion process is essentially controlled by charge transfer.
Figure 4 and Figure 5 demonstrate that the system impedance changes dramatically with increasing extracts of BPE, RSE, and their mixture in comparison with a blank case. As the inhibitor concentration (C) increases, the capacity of the double electric layer decreases, which is due to the increase in adsorbed molecules with increasing inhibitor concentration. In this case, by decreasing the capacitance of the electrical double layer, fewer electrons are produced at the anode, and, as a result, fewer electrons are consumed at the cathode. As the inhibitor concentration increases, the surface coverage increases, and hence the effectiveness of the corrosion inhibitor increases [41]. Moreover, Figure 4 depicts that the diameter of the semicircle in the presence of BPE and RSE at 750 and 1000 ppm is almost the same, and no significant increase in diameter is observed with increasing concentration from 750 to 1000 ppm. Thus, the concentration of 750 ppm is the optimum value for both inhibitors. In addition, Figure 5 shows that the mixing ratio of 40% BPE and 60% RSE is the best value for the highest inhibition efficiency by the EIS test. This result is consistent with the value of the weight loss method.
Figure 6 shows the Nyquist plot of BPE, RSE, and their mixture (40:60 BPE:RSE) at 750 ppm after 24 h of immersion. As can be seen in this figure, the largest diameter of the semicircles is in the presence of the mixture. Thus, the mixture of BPE and RSE has a higher inhibition efficiency for corrosion control than only BPE or RSE in HCl solution. Therefore, the EIS results also confirm the occurrence of synergistic inhibition between BPE and RSE and the enhancement of inhibition efficiency.
The Bode plot of the EIS tests is shown in Figure 7. As depicted in this figure, the loop size in the presence of green corrosion inhibitors was larger than in their absence in the acidic environment. This indicates corrosion protection in the presence of the inhibitors used. This effect was enhanced by increasing the inhibitor concentration. These figures show that 750 ppm is the optimal value for banana peel and rice straw extracts. In addition, the best mixing ratio is 40:60 banana peel and rice straw. These results are completely consistent with the weight loss results.
The phase angle graphs of the EIS tests are shown in Figure 8. As can be seen, the phase angle was increased by adding green corrosion inhibitor to the solution. In this case, the phase angle was increased by increasing the concentration of the extract. The figure shows that the optimum concentration is 750 ppm. Moreover, the banana peel and rice straw mixture showed the best performance at a mixing ratio of 60:40 BPE:RSE.
The electrochemical equivalent circuit was also used to analyze the impedance characteristics, as shown in Figure 9. The system used consists of Rs (HCl solution resistance), RCT (charge transfer resistance), and CPE (constant phase element). This test was carried out in the absence (blank case) and in the presence of green corrosion inhibitors under static conditions. The results obtained from this analysis are presented in Table 1. It should be noted that the inhibition efficiency was determined using the following formula:
I n h i b i t i o n   e f f i c i e n c y   ( I E ) = R C T 1 R C T 0 R C T 1 × 100
where RCT1 and RCT0 are related to the blank case (0 ppm) and the solution with the inhibitor (ohm·cm2). As shown in Table 1, the RCT values increased with the increase of inhibitor concentration, and as a result, the inhibition efficiency increased. For the extracts, the optimum concentration of steel corrosion protection was 750 ppm. In addition, rice straw extract showed better results than banana peel extract. These results are consistent with those obtained in the weight loss tests. In addition, the best inhibition performance was obtained by mixing banana peel and rice straw in a ratio of 40:60. The inhibition efficiencies of banana peel, rice straw, and their mixture (40:60) were 78.18, 95.19, and 96.34% at 750 ppm, respectively.
Potentiodynamic polarization tests were completed by determining the corrosion current density for the extracts at different concentrations and for the mixture at different mixing ratios. In addition, a blank test (without inhibitor addition) was completed. The experiments were carried out at 35 °C. In order to verify the accuracy of used data, a comparison of experimental and theoretical values was performed by electrochemical frequency modulation technique using a capacity of 10 mV by defining two causal factors. These factors corresponded to the standard values 2 and 3. The obtained results are presented in Table 2. The table shows that the deviation of experimental and theoretical values is not significant at both standard values. In this case, the maximum deviation values for causal factors 2 and 3 were 9% and 7%, respectively. Moreover, the current density was significantly reduced by increasing the extract concentration. These results confirmed the previous findings regarding the optimal inhibitor concentration (750 ppm) and the extract mixing ratio (40:60 BPE:RSE). It should be noted that the inhibition efficiency in potentiodynamic polarization tests was determined using the following formula:
I n h i b i t i o n   e f f i c i e n c y = i c o r r 0 i c o r r 1 R c o r r 0 × 100
where icorr0 and icorr1 are the corrosion current densities, which are related to the blank case (0 ppm) and the solution with inhibitor (μ·cm−2).
Validation of EIS data using Kramers–Kronig Transformation (KKT) can ensure the accuracy of testing and help in the correct selection of corrosion inhibitors. Validation of EIS data in KKT is a topic for our future work.

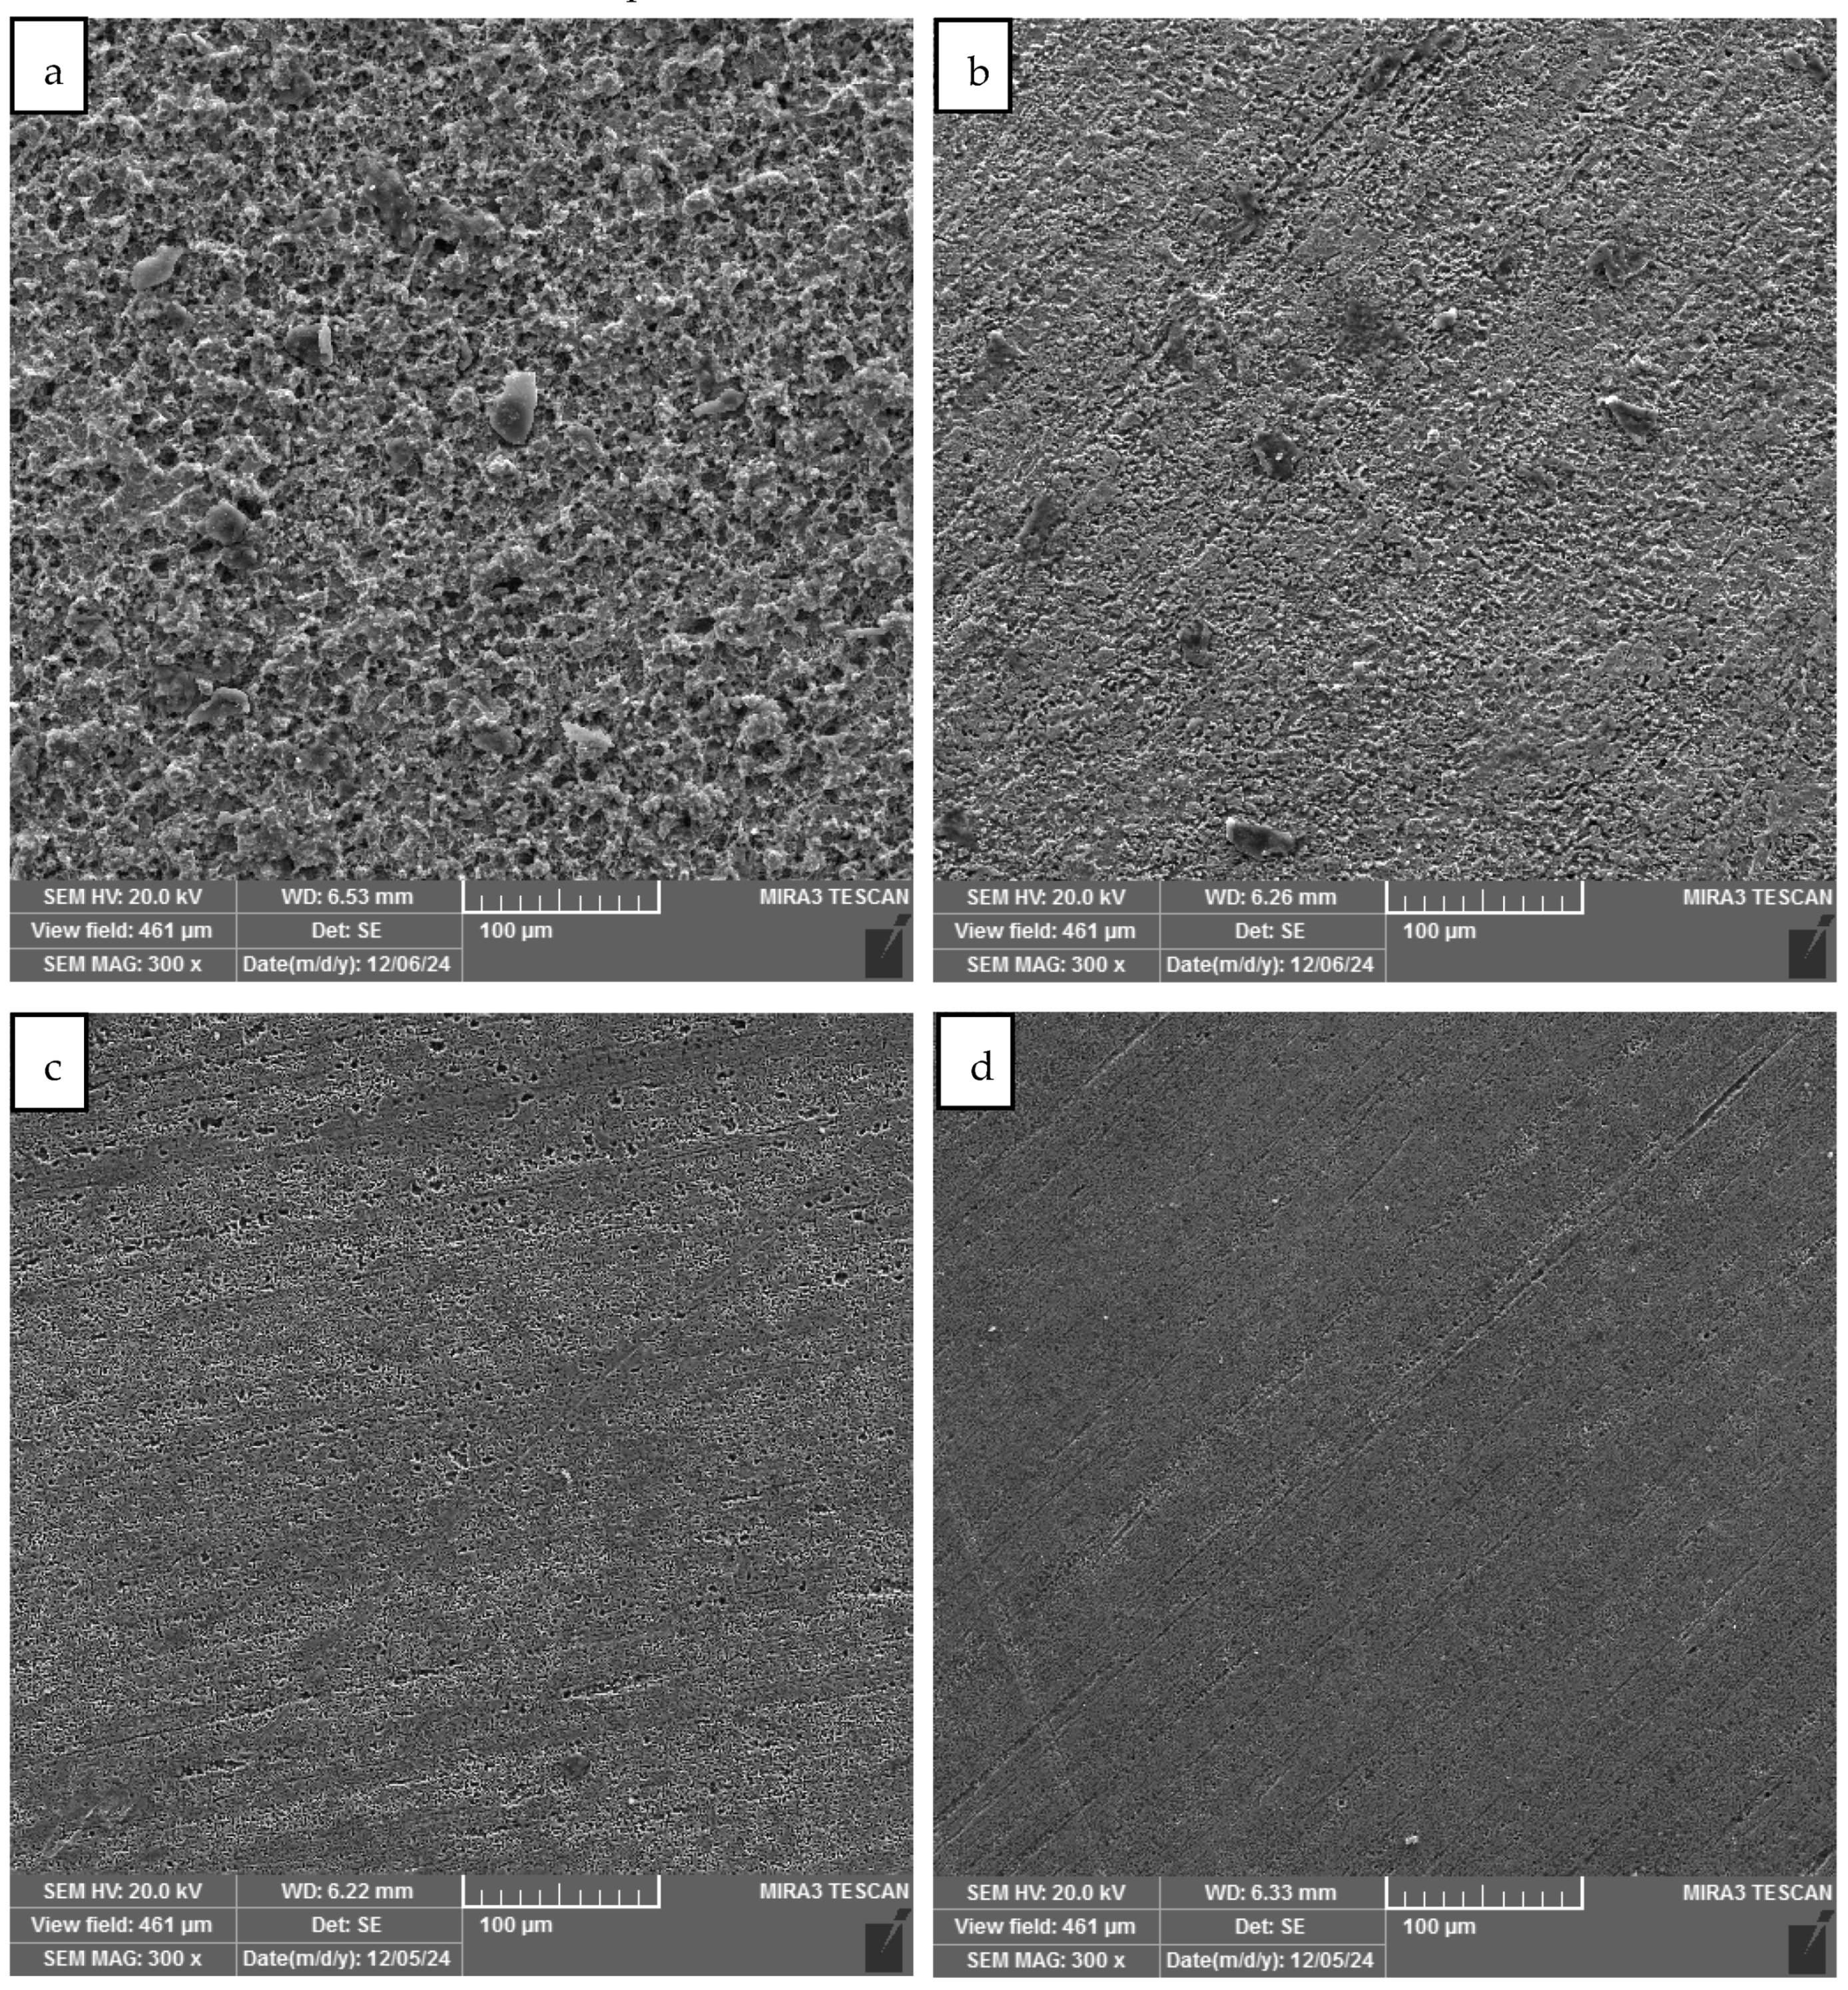
3.3. Results of SEM Analysis

In this study, SEM analysis of metal samples was performed in the presence and absence of green corrosion inhibitors. This analysis was performed on 750 ppm extracts after 24 h and 35 °C in a 1 M hydrochloric acid environment. The results are shown in Figure 10. From Figure 10a (blank case), it can be seen that damage to the carbon steel sample is obvious in the absence of corrosion inhibitor. The surface of the damaged metal and the corrosion products are demonstrated in Figure 10a. As can be seen from this figure, the metal surface is damaged due to dissolution in the corrosive solution. In addition, the highly porous surface and the holes formed indicate its surface degradation in the acidic environment. Other Figure 10b–d depicts the protection of metal surfaces against corrosion using banana peel extract, rice straw extract, and the mixture of both (40:60 BPE:RSE). In the presence of the inhibitors, the rate of dissolution of the metal surface is significantly reduced, and a relatively smooth surface appears. Among these figures, the best protection and most uniform layer is observed in the presence of the mixture (Figure 10d). In this case, the resulting film is stable. Between banana peel and rice straw, the better result is shown in Figure 10c (for rice straw extract). Thus, the formation of the protective film in the presence of rice straw extract is more stable and uniform than in the presence of banana peel extract. These results are consistent with the results of the weight loss and EIS experiments.
EDS analysis of metal samples was performed in order to determine the mass percentage of elements in the used steel after immersion in the HCl solution in the absence and presence of banana peel extract, rice straw extract, and their mixture (40:60 BPE:RSE) at 750 ppm. The analysis indicated that there was a large difference in the mass percentage of iron (the main element of steel) between the inhibited and uninhibited metal samples. The results showed the following mass percentage for the blank case, banana peel, rice straw, and their mixture: 70.12%, 88.94%, 90.07%, and 92.13%, respectively. The low iron percentage in the blank case shows the metal consumption due to corrosion. The higher iron percentage value in the steel in the presence of green inhibitors confirms their effectiveness in inhibiting corrosion. The highest iron percentage was for the case of the extract mixture, which demonstrates its higher inhibitory capacity compared to individual extracts.
The corrosion products of steel samples in the presence and absence of green corrosion inhibitors were analyzed by Raman spectroscopy. The results showed that the main corrosion products in the uninhibited surface and in the inhibited surface at low inhibitor concentrations were in the form of oxides and chlorides due to the appearance of oxygen and chlorine peaks.

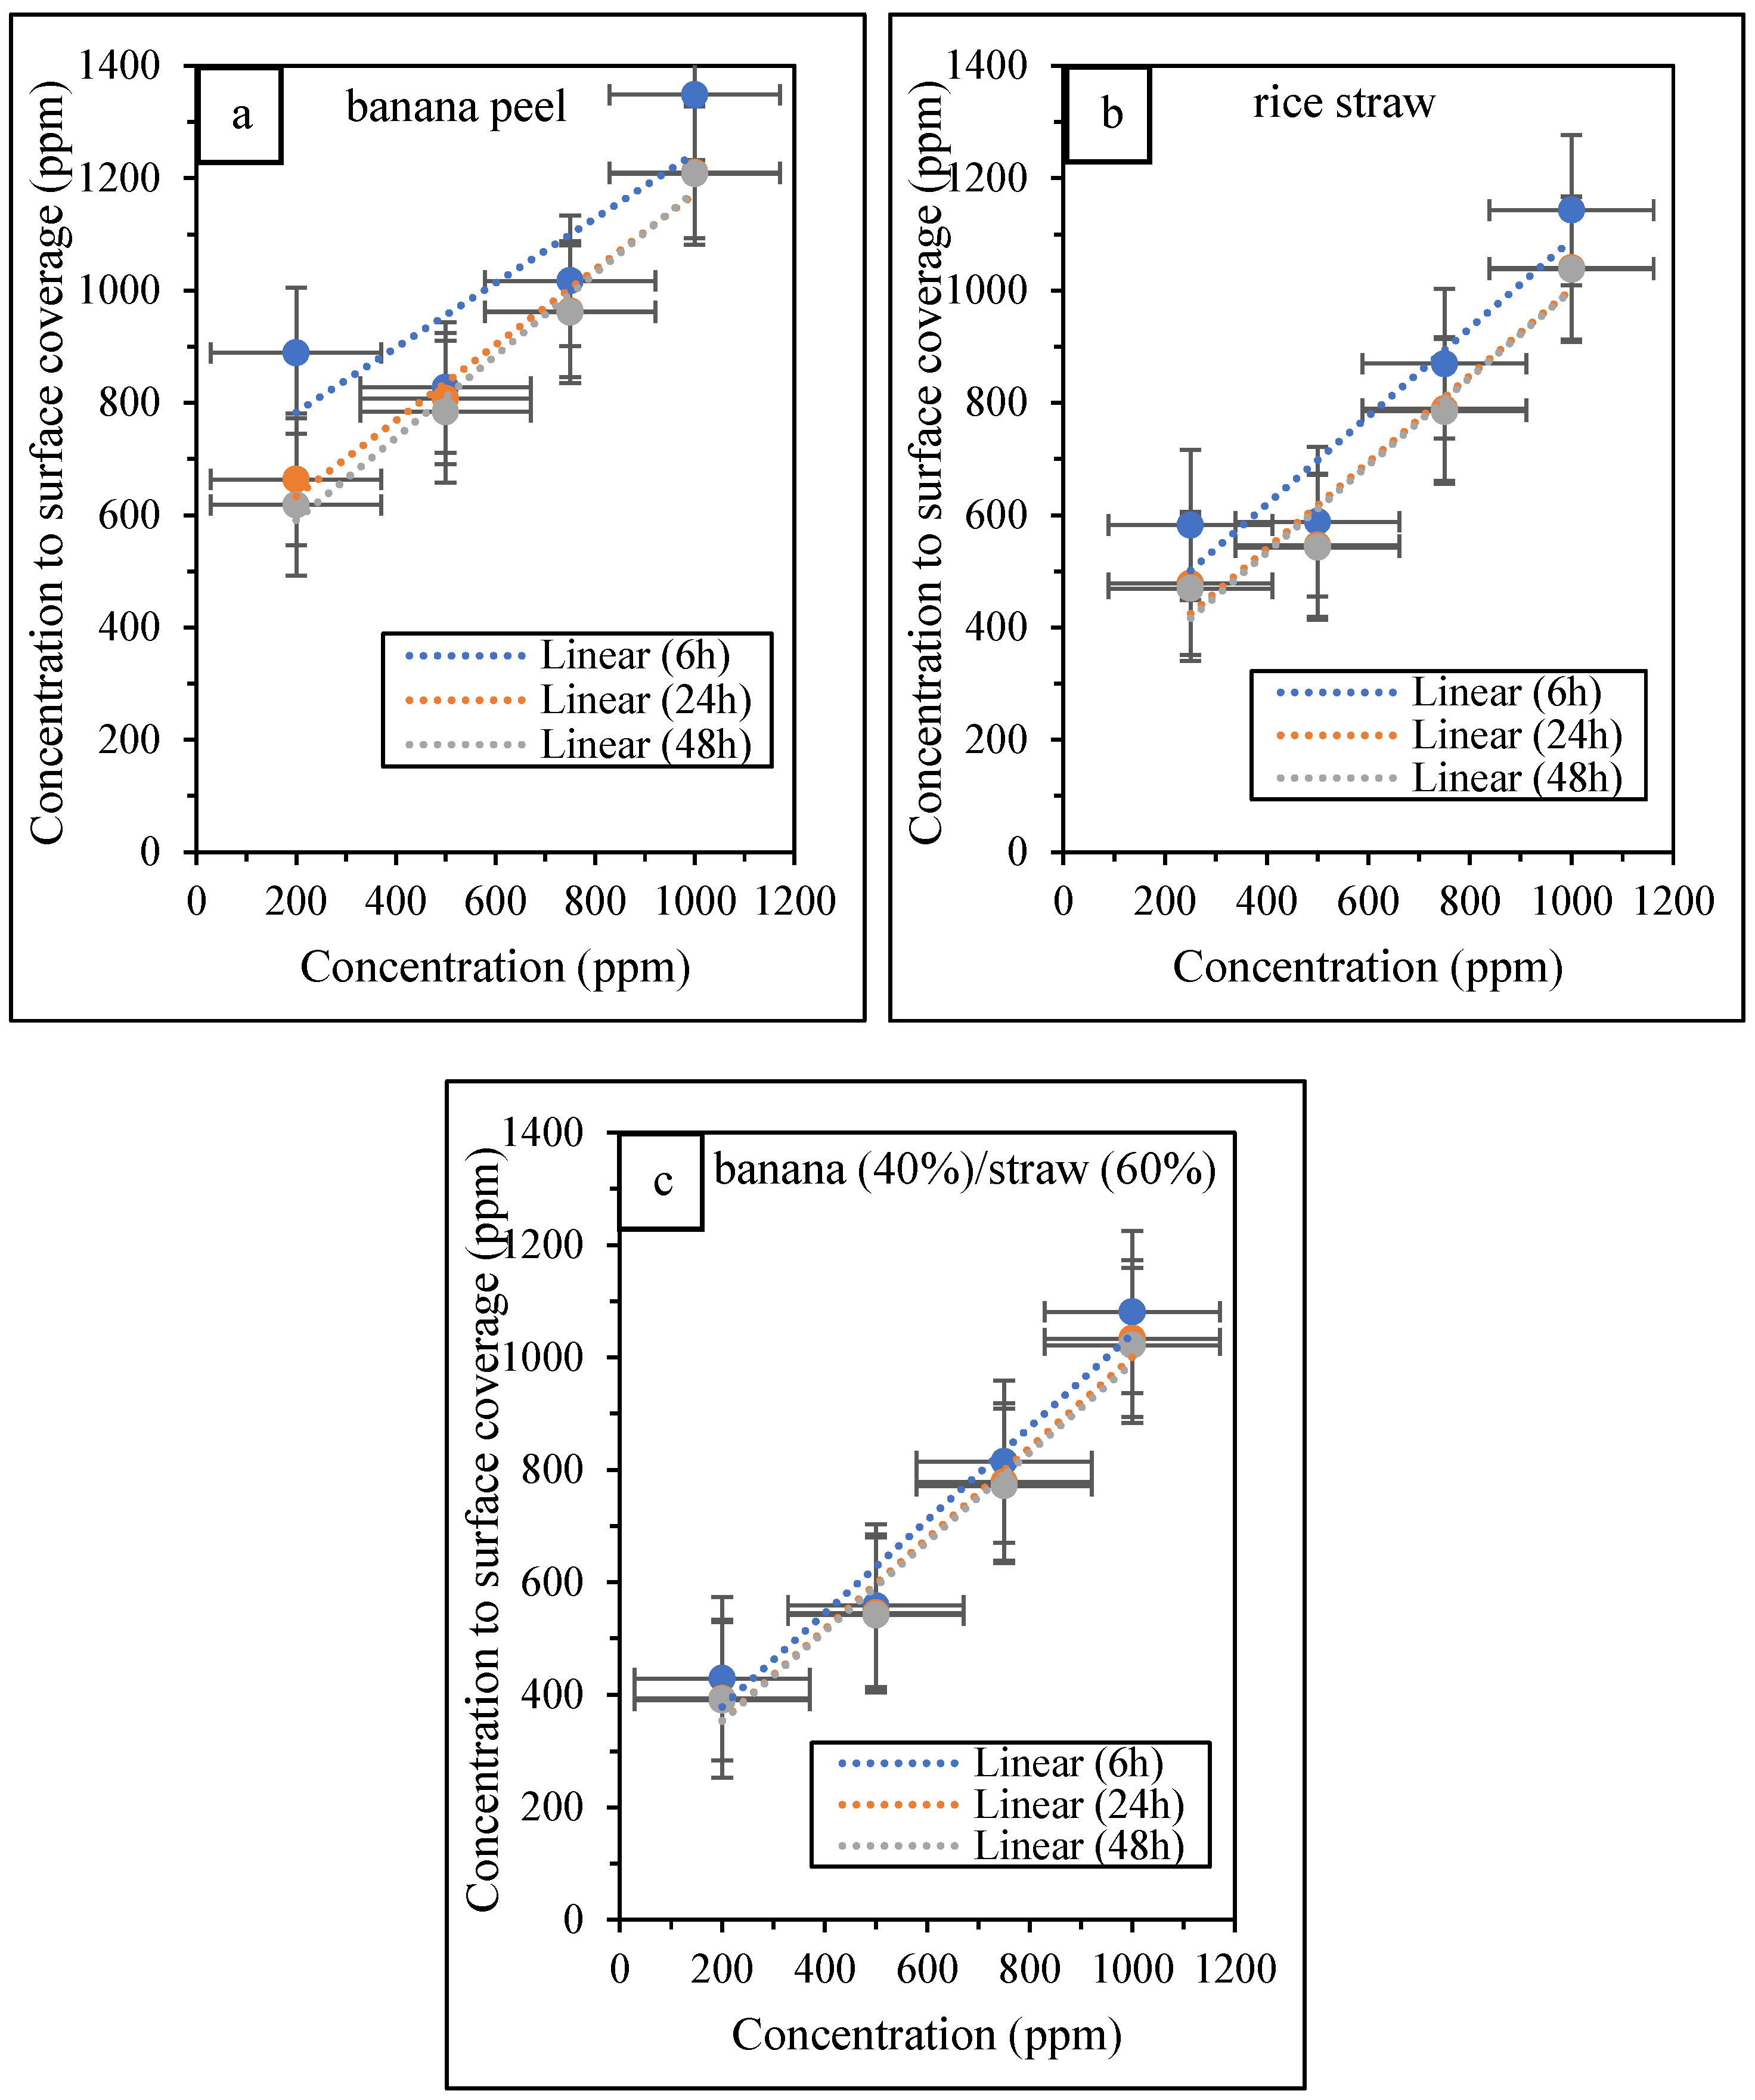
3.4. The Results of Analysis of Inhibitor Adsorption on Metal Surface

It is generally accepted that the main stage of inhibitor action in acidic solutions is adsorption on the metal surface [12]. In other words, the action of inhibitors is mainly associated with a change in the state of the protected surface due to adsorption, which leads to a decrease in the active surface of the metal and an increase in the activation energy of corrosion, and is of an electrochemical nature [4]. Moreover, the basic information about the adsorption of inhibitor molecules on the metal surface can be obtained from the adsorption isotherm. There are several adsorption isotherms, such as Langmuir, Flory–Huggins, Temkin, Freundlich, and Frumkin, which explain the mechanism of corrosion inhibition. In this study, Temkin, Freundlich, and Langmuir models were used for adsorption analysis of inhibition data of banana peel, rice straw, and their mixture at three immersion periods. The average value of the coefficient of determination for the linear fitting of experimental data for Temkin, Freundlich, and Langmuir was 0.832, 0.891, and 0.955, respectively. Thus, the Langmuir model was selected for the adsorption analysis since it could better describe the adsorption of the used extracts as green corrosion inhibitors.
Figure 11 shows the linear fit of C/θ at different inhibitor concentrations and times using the Langmuir model. The figures show that the used model can fully describe the adsorption behavior of banana peel extract, rice straw extract, and their mixture on a metal surface. As can be seen from Figure 11, the slope of all graphs is close to unity, which indicates the high accuracy of the used adsorption isotherm for the studied inhibitors. The value of the adsorption constant (Kads) is obtained from the reciprocal of the y-intercept of the graph line. This value was used in all cases of immersion time to determine the standard calculation of the adsorption energy. The adsorption constant value represents the degree of adsorption. The calculated values of adsorption free energy at times 6, 24, and 48 for all three inhibitors are given in Table 3 (at a constant temperature of 35 °C). In this table, the values of Kads in molar were obtained by dividing Kads in ppm by 1000 × MW (molecular weight). According to the literature [25,30], gallocatechin (306 g/mol) and glycosides (584 g/mol) were the main components for banana peel and rice straw, respectively. For the mixture, the average molecular weight of gallocatechin and glycosides (472.8 = 0.4 × 306 + 0.6 × 584) was used. A negative value of the Gibbs free energy of adsorption indicates the spontaneity of the process, and the extract molecules are adsorbed on the metal. Energy values less than 20 kJ·mol−1 indicate physical adsorption of the inhibitor molecule on the metal surface. In addition, the free energy of adsorption of more than 40 kJ·mol−1 indicates chemical adsorption and the establishment of coordination interactions between the inhibitor compounds and iron atoms [42]. Therefore, the molecular structure of the inhibitors is of particular importance. In this study, the results show that the Gibbs free energy values range from −36.7 to −38.4 kJ/mol−1, indicating that both types of adsorption occurred.

3.5. Inhibition Mechanism

Various experiments conducted have shown better efficiency of the proposed mixture in inhibiting corrosion than individual inhibitors. This is due to the manifestation of a positive synergistic effect of inhibition due to the chemical compounds of banana peel and rice straw. Moreover, the higher efficiency of the mixture can be related to the formation of a more uniform protective film on the metal surface than in the case of individual extraction. The SEM analysis in Figure 10 showed that the film formed in the presence of the mixture was more uniform than in the presence of banana peel extract or rice straw extract. This behavior is associated with chemical adsorption of extracts on the metal surface through the formation of coordination bonds due to the presence of heteroatoms and pi-electrons in the structure of inhibitors and physical adsorption in the form of a mixture. This mechanism has been mentioned in previous studies of banana peel and rice straw by researchers [25,29,31]. In this study, FTIR and phytochemical analysis of the extracts were also completed to confirm this finding. FTIR results were obtained after immersing the metal samples in HCl solution in the presence and absence of banana peel and rice straw extracts. The results for the blank showed the absence of peaks (a constant transmittance value at all wavenumbers). Figure 12 shows the FTIR analysis in the presence of extracts at 750 ppm. The figure demonstrates that in the presence of banana peel and rice straw extracts, the spectrum was characterized by the presence of several peaks, confirming the existence of corrosion-inhibiting molecules. The results show that both extracts used were adsorbed on the surface of the steel samples, forming a protective layer. In addition, phytochemical analysis of banana peel and rice straw extracts was carried out to determine their compounds. The results showed the existence of many chemical compounds, among which gallocatechin and glycosides were the main components of banana peel extract and rice straw extract, respectively. The chemical structure of these materials is shown in Figure 13. These findings are consistent with the results of previous studies [25,29,43,44].
The high strength of chemical adsorption of the mixture compared to the extract alone is explained by the co-adsorption of heteroatoms in both green inhibitors, which simultaneously participate in surface bonds. Moreover, as shown in Figure 13, heteroatoms (pairs of free electrons in oxygen) and pi-electrons (in the aromatic rings) in the structure of gallocatechin and glycosides (as the main components of banana peel and rice straw for corrosion inhibition) can cause easier electron donation to the d-orbital of steel atoms (Fe), which leads to strong adsorption of extract molecules on the sample surface, thereby improving the corrosion protection efficiency [25,29,34,45]. It should be noted that lone pairs of electrons are present in all oxygen atoms in the structure of the molecules in Figure 13.
In addition, the formation of a compact and stable layer is associated with electrostatic interactions (physical adsorption) between protonated particles (charged inhibitor molecules INH–H+) and negatively charged surfaces [12,29,46,47]. As shown in Figure 13, the main components of the extracts under study have heteroatoms in their structure. The positive charge is due to the protonation of the inhibitor molecule by H+ ions in the HCl solution. Chemical reagents containing heteroatoms can be protonated in an aggressive acidic solution according to the following relationship [29]:
[gallocatechin/glycoside molecules] + xH+ ➝ [gallocatechin/glycoside molecules − Hx]x+

4. Conclusions

In this work, banana peel extract, rice straw extract, and their mixture were used as green corrosion inhibitors for carbon steel in the acidic environment. The following findings were drawn:
  • The inhibition efficiency of the mixture at a ratio of 40:60 (banana peel to rice straw) was higher than that of the individual extracts at all concentrations and immersion times based on the weight loss method.
  • The inhibition efficiency was increased by increasing the concentration of the green corrosion inhibitors. Weight loss and electrochemical experiments showed that the optimum concentration of individual inhibitors and their mixture was 750 ppm, and the performance did not change significantly with further increase of the extract content in the HCl solution. Moreover, increasing the immersion time increased the corrosion inhibition efficiency, but this effect was weaker than the effect of inhibitor concentration.
  • For all immersion times and inhibitor concentrations, a positive synergistic effect was observed at a mixing ratio of banana peel and rice straw of 40:60. The highest synergistic value was 1.65, indicating an average increase of 65% in inhibition efficiency for the mixture compared to the extract alone.
  • The electrochemical tests confirmed the higher efficiency of the mixture (40:60 banana peel and rice straw) compared to 100% banana peel and 100% rice straw. When extracts were added to the corrosive environment, the resistance of the solution increased, and it became more difficult for ions to reach the metal surface, which led to an increase in the effectiveness of corrosion inhibition.
  • Scanning electron microscope images clearly showed the formation of a stable film on the metal surface. The film formed in the presence of the banana peel and rice straw mixture was more stable and uniform than that in the presence of the individual extract.
  • The Langmuir isotherm model most accurately describes the adsorption characteristics of the used extracts and their mixture. Both physical and chemical adsorption occurred for the banana peel and rice straw extracts, as well as for their mixture.

Supplementary Materials

The following supporting information can be downloaded at: https://www.mdpi.com/article/10.3390/app15095026/s1, Table S1. The details of data obtained by weight loss method (mass reduction, corrosion rate and inhibition efficiency).

Author Contributions

Methodology, A.K.; Validation, A.T.; Formal analysis, A.T.; Investigation, M.D.; Writing—original draft, A.K.; Writing—review & editing, A.K.; Supervision, A.K.; Project administration, A.K. All authors have read and agreed to the published version of the manuscript.

Funding

This work was supported by Gonbad Kavous University (master’s thesis of Maral Dazdari).

Data Availability Statement

The original contributions presented in this study are included in the article and Supplementary Materials. Further inquiries can be directed to the corresponding author.

Conflicts of Interest

The authors declare no conflict of interest.

References

  1. Dehghani, A.; Berdimurodov, E.; Verma, C.; Verma, D.K.; Berdimuradov, K.; Quraishi, M.; Aliev, N. Constructing efficacy: A novel perspective on organic corrosion inhibitors and interfacial interactions. Chem. Pap. 2024, 78, 1367–1397. [Google Scholar] [CrossRef]
  2. Medupin, R.O.; Ukoba, K.O.; Yoro, K.O.; Jen, T.-C. Sustainable approach for corrosion control in mild steel using plant-based inhibitors: A review. Mater. Today Sustain. 2023, 22, 100373. [Google Scholar] [CrossRef]
  3. Khormali, A.; Ahmadi, S. Experimental and modeling analysis on the performance of 2-mercaptobenzimidazole corrosion inhibitor in hydrochloric acid solution during acidizing in the petroleum industry. J. Pet. Explor. Prod. Technol. 2023, 13, 2217–2235. [Google Scholar] [CrossRef]
  4. Aslam, R.; Mobin, M.; Zehra, S.; Aslam, J. A comprehensive review of corrosion inhibitors employed to mitigate stainless steel corrosion in different environments. J. Mol. Liq. 2022, 364, 119992. [Google Scholar] [CrossRef]
  5. Groysman, A. Corrosion problems and solutions in oil, gas, refining and petrochemical industry. Koroze A Ochr. Mater. 2017, 61, 100. [Google Scholar] [CrossRef]
  6. Haldhar, R.; Kim, S.-C.; Berdimurodov, E.; Verma, D.K.; Hussain, C.M. Corrosion inhibitors: Industrial applications and commercialization. In Sustainable Corrosion Inhibitors II: Synthesis, Design, and Practical Applications; ACS Publications: Washington, DC, USA, 2021; pp. 219–235. [Google Scholar]
  7. Ahmadi, S.; Khormali, A.; Razmjooie, A. Experimental investigation on separation of water in crude oil emulsions using an oil-soluble demulsifier. Iran. J. Chem. Chem. Eng. 2023, 42, 2332–2343. [Google Scholar]
  8. Annon, I.A.; Abbas, A.S.; Al-Azzawi, W.K.; Hanoon, M.M.; Alamiery, A.; Isahak, W.N.R.; Kadhum, A.A.H. Corrosion inhibition of mild steel in hydrochloric acid environment using thiadiazole derivative: Weight loss, thermodynamics, adsorption and computational investigations. S. Afr. J. Chem. Eng. 2022, 41, 244–252. [Google Scholar] [CrossRef]
  9. Ma, I.W.; Ammar, S.; Kumar, S.S.; Ramesh, K.; Ramesh, S. A concise review on corrosion inhibitors: Types, mechanisms and electrochemical evaluation studies. J. Coat. Technol. Res. 2022, 19, 241–268. [Google Scholar] [CrossRef]
  10. Zhang, H.; Yan, L.; Zhu, Y.; Ai, F.; Li, H.; Li, Y.; Jiang, Z. The effect of immersion corrosion time on electrochemical corrosion behavior and the corrosion mechanism of EH47 ship steel in seawater. Metals 2021, 11, 1317. [Google Scholar] [CrossRef]
  11. Ahmadi, S.; Khormali, A. Development of an RSM-based predictive model for evaluation of corrosion efficiency of ATMP in one molar HCl for carbon steel samples. Pet. Sci. Technol. 2024, 42, 4537–4555. [Google Scholar] [CrossRef]
  12. Chen, L.; Lu, D.; Zhang, Y. Organic compounds as corrosion inhibitors for carbon steel in HCl solution: A comprehensive review. Materials 2022, 15, 2023. [Google Scholar] [CrossRef]
  13. Ahmed, M.A.; Amin, S.; Mohamed, A.A. Current and emerging trends of inorganic, organic and eco-friendly corrosion inhibitors. RSC Adv. 2024, 14, 31877–31920. [Google Scholar] [CrossRef]
  14. Shwetha, K.; Praveen, B.; Devendra, B.K. A review on corrosion inhibitors: Types, mechanisms, electrochemical analysis, corrosion rate and efficiency of corrosion inhibitors on mild steel in an acidic environment. Results Surf. Interfaces 2024, 16, 100258. [Google Scholar]
  15. Zomorodian, A.; Behnood, A. Review of corrosion inhibitors in reinforced concrete: Conventional and green materials. Buildings 2023, 13, 1170. [Google Scholar] [CrossRef]
  16. Valdez-Salas, B.; Vazquez-Delgado, R.; Salvador-Carlos, J.; Beltran-Partida, E.; Salinas-Martinez, R.; Cheng, N.; Curiel-Alvarez, M. Azadirachta indica leaf extract as green corrosion inhibitor for reinforced concrete structures: Corrosion effectiveness against commercial corrosion inhibitors and concrete integrity. Materials 2021, 14, 3326. [Google Scholar] [CrossRef]
  17. Marzorati, S.; Verotta, L.; Trasatti, S.P. Green corrosion inhibitors from natural sources and biomass wastes. Molecules 2018, 24, 48. [Google Scholar] [CrossRef]
  18. Al Jahdaly, B.A.; Maghraby, Y.R.; Ibrahim, A.H.; Shouier, K.R.; Alturki, A.M.; El-Shabasy, R.M. Role of green chemistry in sustainable corrosion inhibition: A review on recent developments. Mater. Today Sustain. 2022, 20, 100242. [Google Scholar] [CrossRef]
  19. Salleh, S.Z.; Yusoff, A.H.; Zakaria, S.K.; Taib, M.A.A.; Seman, A.A.; Masri, M.N.; Mohamad, M.; Mamat, S.; Sobri, S.A.; Ali, A. Plant extracts as green corrosion inhibitor for ferrous metal alloys: A review. J. Clean. Prod. 2021, 304, 127030. [Google Scholar] [CrossRef]
  20. Wei, H.; Heidarshenas, B.; Zhou, L.; Hussain, G.; Li, Q.; Ostrikov, K.K. Green inhibitors for steel corrosion in acidic environment: State of art. Mater. Today Sustain. 2020, 10, 100044. [Google Scholar] [CrossRef]
  21. Miralrio, A.; Espinoza Vázquez, A. Plant extracts as green corrosion inhibitors for different metal surfaces and corrosive media: A review. Processes 2020, 8, 942. [Google Scholar] [CrossRef]
  22. Albo Hay Allah, M.A.; Balakit, A.A.; Salman, H.I.; Abdulridha, A.A.; Sert, Y. New heterocyclic compound as carbon steel corrosion inhibitor in 1 M H2SO4, high efficiency at low concentration: Experimental and theoretical studies. J. Adhes. Sci. Technol. 2023, 37, 525–547. [Google Scholar] [CrossRef]
  23. Răuță, D.-I.; Matei, E.; Avramescu, S.-M. Recent Development of Corrosion Inhibitors: Types, Mechanisms, Electrochemical Behavior, Efficiency, and Environmental Impact. Technologies 2025, 13, 103. [Google Scholar] [CrossRef]
  24. Huang, M.; Wang, R.; Xiong, J.; Liu, C.; Wang, J.; Wang, Q. Inhibition effect and adsorption behavior of Michelia alba leaf extract as corrosion inhibitors for Cu in 0.5 M H2SO4. J. Dispers. Sci. Technol. 2025, 1–18. [Google Scholar] [CrossRef]
  25. Ji, G.; Anjum, S.; Sundaram, S.; Prakash, R. Musa paradisica peel extract as green corrosion inhibitor for mild steel in HCl solution. Corros. Sci. 2015, 90, 107–117. [Google Scholar] [CrossRef]
  26. Su, Y.; Wu, F.; Xiao, P.; Zhang, H.; Lv, G.; Zhu, M.; Liu, Q.; Zhao, C. Facile and green synthesis of Ag/Cu bimetallic nanoparticles using waste banana peel extract for effective corrosion inhibition of mixed sulfate-reducing bacteria. J. Environ. Manag. 2025, 373, 123713. [Google Scholar] [CrossRef]
  27. Manikandan, C.B.; Balamurugan, S.; Balamurugan, P.; Beneston, S.L. Corrosion inhibition of mild steel by using banana peel extract. Int. J. Innov. Technol. Explor. Eng 2019, 8, 1372–1375. [Google Scholar]
  28. Tambun, R.; Christamore, E.; Pakpahan, Y.F.; Haryanto, B. Banana peel utilization as the green corrosion inhibitor of Iron in NaCl medium. Mater. Sci. Eng. 2018, 420, 012059. [Google Scholar] [CrossRef]
  29. Fouda, A.; Gadow, H.; Abd Elal, E.; El-Tantawy, M. Corrosion inhibition of aluminium by rice straw extract in 2 M hydrochloric acid solution. J. Bio-Tribo-Corros. 2021, 7, 102. [Google Scholar] [CrossRef]
  30. Oyewole, O.; Abayomi, T.S.; Oreofe, T.A.; Oshin, T.A. Anti-corrosion using rice straw extract for mild steel in 1.5 M H2SO4 solution. Results Eng. 2022, 16, 100684. [Google Scholar] [CrossRef]
  31. Yahya, S.; Othman, N.; Ismail, M. Corrosion inhibition of steel in multiple flow loop under 3.5% NaCl in the presence of rice straw extracts, lignin and ethylene glycol. Eng. Fail. Anal. 2019, 100, 365–380. [Google Scholar] [CrossRef]
  32. El Azzouzi, M.; Azzaoui, K.; Warad, I.; Hammouti, B.; Shityakov, S.; Sabbahi, R.; Saoiabi, S.; Youssoufi, M.; Akartasse, N.; Jodeh, S. Moroccan, Mauritania, and senegalese gum Arabic variants as green corrosion inhibitors for mild steel in HCl: Weight loss, electrochemical, AFM and XPS studies. J. Mol. Liq. 2022, 347, 118354. [Google Scholar] [CrossRef]
  33. Khormali, A.; Ahmadi, S.; Kazemzadeh, Y.; Karami, A. Evaluating the Efficacy of Binary Benzimidazole Derivatives as Corrosion Inhibitors for Carbon Steel Using Multi-Modal Analysis and Optimization Techniques. Results Eng. 2025, 26, 104671. [Google Scholar] [CrossRef]
  34. Khormali, A.; Ahmadi, S. Synergistic effect between oleic imidazoline and 2-mercaptobenzimidazole for increasing the corrosion inhibition performance in carbon steel samples. Iran. J. Chem. Chem. Eng. 2023, 42, 321–336. [Google Scholar]
  35. Vaszilcsin, C.G.; Putz, M.V.; Kellenberger, A.; Dan, M.L. On the evaluation of metal-corrosion inhibitor interactions by adsorption isotherms. J. Mol. Struct. 2023, 1286, 135643. [Google Scholar] [CrossRef]
  36. Zarrouk, A.; Hammouti, B.; Zarrok, H.; Al-Deyab, S.; Messali, M. Temperature effect, activation energies and thermodynamic adsorption studies of L-cysteine methyl ester hydrochloride as copper corrosion inhibitor in nitric acid 2M. Int. J. Electrochem. Sci. 2011, 6, 6261–6274. [Google Scholar] [CrossRef]
  37. Zhu, Y.; Sun, Q.; Wang, Y.; Tang, J.; Wang, Y.; Wang, H. Molecular dynamic simulation and experimental investigation on the synergistic mechanism and synergistic effect of oleic acid imidazoline and l-cysteine corrosion inhibitors. Corros. Sci. 2021, 185, 109414. [Google Scholar] [CrossRef]
  38. Umoren, S.A.; Solomon, M.M. Synergistic corrosion inhibition effect of metal cations and mixtures of organic compounds: A review. J. Environ. Chem. Eng. 2017, 5, 246–273. [Google Scholar] [CrossRef]
  39. Snihirova, D.; Lamaka, S.; Taheri, P.; Mol, J.; Montemor, M. Comparison of the synergistic effects of inhibitor mixtures tailored for enhanced corrosion protection of bare and coated AA2024-T3. Surf. Coat. Technol. 2016, 303, 342–351. [Google Scholar] [CrossRef]
  40. Ebenso, E.E.; Verma, C.; Olasunkanmi, L.O.; Akpan, E.D.; Verma, D.K.; Lgaz, H.; Guo, L.; Kaya, S.; Quraishi, M.A. Molecular modelling of compounds used for corrosion inhibition studies: A review. Phys. Chem. Chem. Phys. 2021, 23, 19987–20027. [Google Scholar] [CrossRef]
  41. Zaidon, F.H.; Kassim, K.; Zaki, H.M.; Embong, Z.; Anouar, E.H.; Hashim, N.Z.N. Adsorption and corrosion inhibition accomplishment for thiosemicarbazone derivatives for mild steel in 1.0 M HCl medium: Electrochemical, XPS and DFT studies. J. Mol. Liq. 2021, 329, 115553. [Google Scholar] [CrossRef]
  42. Toghan, A.; Gadow, H.; Fawzy, A.; Alhussain, H.; Salah, H. Adsorption mechanism, kinetics, thermodynamics, and anticorrosion performance of a new thiophene derivative for C-steel in a 1.0 M HCl: Experimental and computational approaches. Metals 2023, 13, 1565. [Google Scholar] [CrossRef]
  43. González-Montelongo, R.; Lobo, M.G.; González, M. Antioxidant activity in banana peel extracts: Testing extraction conditions and related bioactive compounds. Food Chem. 2010, 119, 1030–1039. [Google Scholar] [CrossRef]
  44. Utami, S.P.; Fermi, M.I.; Aziz, Y.; Irianti, R.S. Corrosion control of carbon steel using inhibitor of banana peel extract in acid diluted solutions. Mater. Sci. Eng. 2018, 345, 012030. [Google Scholar]
  45. Verma, D.K.; Dewangan, Y.; Dewangan, A.K.; Asatkar, A. Heteroatom-based compounds as sustainable corrosion inhibitors: An overview. J. Bio-Tribo-Corros. 2021, 7, 15. [Google Scholar] [CrossRef]
  46. Mohd, N.K.; Kian, Y.S.; Ibrahim, N.A.; Nor, S.M.M.; Wan Yunus, W.M.Z.; Ghazali, M.J.; Huei, L.W. Corrosion inhibition, adsorption and thermodynamic properties of hydrophobic-tailed imines on carbon steel in hydrochloric acid solution: A comparative study. J. Adhes. Sci. Technol. 2021, 35, 2558–2579. [Google Scholar] [CrossRef]
  47. Olasunkanmi, L.O.; Obot, I.B.; Kabanda, M.M.; Ebenso, E.E. Some quinoxalin-6-yl derivatives as corrosion inhibitors for mild steel in hydrochloric acid: Experimental and theoretical studies. J. Phys. Chem. C 2015, 119, 16004–16019. [Google Scholar] [CrossRef]
Figure 1. The flowchart of conducted experiments for evaluation of inhibition performance of extracts.
Applsci 15 05026 g001
Figure 2. The dependence of corrosion inhibition efficiency on the mixing ratio of BPE and RSE after 6 h (a), 24 h (b), and 48 h (c) at various concentrations and at 35 °C in HCl solution using the weight loss method.
Applsci 15 05026 g002
Figure 3. Quantitative values of the synergistic inhibitory effect of the mixture of BPE (40%) and RSE (60%) at 35 °C using the weight loss method data.
Applsci 15 05026 g003
Figure 4. Nyquist diagram of EIS tests in a blank case (0 ppm) and in the presence of BPE (a) and RSE (b) at various concentrations.
Applsci 15 05026 g004
Figure 5. Nyquist diagram of EIS tests in a blank case (0 ppm) and in the presence of the mixture of BPE and RSE at various mixing ratios at 750 ppm.
Applsci 15 05026 g005
Figure 6. Nyquist diagram of EIS tests in a blank case (0 ppm) and in the presence of green inhibitors (BPE, RSE, and the mixture of 40:60 BPE:RSE) at 750 ppm.
Applsci 15 05026 g006
Figure 7. Bode plots of EIS tests for steel specimens in HCl solution in the absence and presence of green corrosion inhibitors: banana peel extract (a), rice straw extract (b), mixture of extracts at different mixing ratios at 750 ppm (c), and single and mixture of extracts at 750 ppm (d).
Applsci 15 05026 g007
Figure 8. Phase angle plots of EIS tests for steel specimens in HCl solution in the absence and presence of green corrosion inhibitors: banana peel extract (a), rice straw extract (b), mixture of extracts at different mixing ratios at 750 ppm (c), and single and mixture of extracts at 750 ppm (d).
Applsci 15 05026 g008
Figure 9. The equivalent circuit used for fitting data obtained in EIS.
Applsci 15 05026 g009
Figure 10. SEM analysis of steel samples in a blank case (a) and in the presence of BPE (b), RSE (c), and the mixture of BPE (40%) and RSE (60%) at 750 ppm (d).
Applsci 15 05026 g010
Figure 11. Adsorption analysis of banana peel (a), rice straw (b), and a mixture of banana peel (40%) and rice straw (60%) (c) extracts using the Langmuir adsorption isotherm at 35 °C and test durations of 6, 24, and 48 h.
Applsci 15 05026 g011
Figure 12. FTIR analysis after addition of banana peel and rice straw extracts.
Applsci 15 05026 g012
Figure 13. Structure of gallocatechin and glycoside molecules that were identified as major components of banana peel and rice straw extracts, respectively.
Applsci 15 05026 g013
Table 1. Charge transfer resistance and inhibition efficiency results for the fitted EIS data using the equivalent circuit.
Inhibition Efficiency (%)RCT (ohm·cm2)Concentration (ppm)Inhibitor Type
---46.150blank
30.1366.05250banana peel
59.96115.26500
78.18211.48750
81.50249.451000
50.3492.94250rice straw
90.56488.62500
95.19958.57750
95.521029.471000
96.341259.4875040/60banana
peel/rice
straw
94.67865.0775050/50
93.41700.1875060/40
Table 2. Inhibition efficiency results obtained from potentiodynamic polarization tests and comparison of experimental and theoretical values in determining causal factors (according to standard values 2 and 3).
Inhibition Efficiency (%)Deviation (Comparison of Experimental and Theoretical Values) (%)Causal Factor According to 3Deviation (Comparison of Experimental and Theoretical Values) (%)Causal Factor According to 2icorr (μ·cm−2)Concentration (ppm)Inhibitor Type
---4.673.149.002.1810650blank
30.701.673.052.501.95738250banana peel
61.034.002.881.002.02415500
78.401.002.974.002.08230750
80.193.333.102.002.042111000
51.271.332.967.002.14519250rice straw
88.924.332.872.002.04118500
94.553.003.092.501.9558750
95.027.003.215.501.89531000
95.595.333.168.502.174775040/60banana
peel/rice
straw
95.871.673.056.502.134475050/50
92.863.673.118.502.177675060/40
Table 3. Adsorption constant and Gibbs free energy in the presence of banana peel extract, rice straw extract, and a mixture of banana peel (40%) and rice straw (60%) obtained using the Langmuir adsorption isotherm at different test durations (from Figure 11).
ΔGads (kJ·mol−1)Kads (M−1)Kads (ppm−1)Kads−1 (ppm)Time (h)Inhibitor Type
−38.71564.89298 × 10−90.001497667.896banana peel
−37.96846.55088 × 10−90.002005498.8624
−37.67787.33799 × 10−90.002245445.3548
−38.36505.61107 × 10−90.003277305.176rice straw
−37.65717.39763 × 10−90.00432231.4724
−37.54847.71841 × 10−90.004508221.8548
−37.11609.1383 × 10−90.004321231.456banana peel (40%): rice straw (60%)
−36.65011.09617 × 10−80.005183192.9524
−36.66891.08816 × 10−80.005145194.3748
Disclaimer/Publisher’s Note: The statements, opinions and data contained in all publications are solely those of the individual author(s) and contributor(s) and not of MDPI and/or the editor(s). MDPI and/or the editor(s) disclaim responsibility for any injury to people or property resulting from any ideas, methods, instructions or products referred to in the content.

