1. Introduction
Freshwater scarcity and AWG: The World Economic Forum identifies water crises as one of the top global risks in terms of impact and likelihood [
1]. With over 2 billion people lacking access to safe drinking water [
2], freshwater scarcity contributes to a range of socio-economic challenges, including compromised health, agricultural setbacks, and conflicts over dwindling water resources [
3]. Traditional water sources, such as rivers and aquifers, are under immense stress, necessitating innovative solutions to meet the growing water demand. AWG is a device that collects water from atmospheric moisture. The water vapor in the air is cooled below the dew point by a refrigeration system forcing a phase transfer from gaseous to liquid. However, the current technology does not provide economically viable alternatives for different cities or for different seasons. But this could become a promising technology that can aid in overcoming the scarcity of water in regions for drinking, farming, or any other application that requires freshwater. Innovative material and structural designs enable moisture harvesters with desirable features, such as high-water uptake, spontaneous water collection, and long-term recyclability, boosting the rapid development of next-generation AWG [
4].
The two main atmospheric factors that directly affect the amount of water that can be condensed are the atmospheric temperature and relative humidity. The process of producing water from air humidity requires less energy when the humidity is high and thus the most suitable atmospheric conditions are hot and humid. This is why AWG has been often integrated with other systems such as rainwater or city water supply to ensure a consistent water supply [
5]. Some popular methods for AWG are based on the ideal gas law, desiccation, and separation membranes [
6]. Thermoelectric cooling by Peltier device [
7] and thermoacoustic refrigeration (TAR) are other innovative clean technology [
8].
The primary goal of this research is to advance the efficiency of Peltier-driven AWG by optimizing the properties of condensation surfaces. Previous research has shown that hybrid and modified surfaces with ridge and structures have improved the amount of water collected by AWG [
9]. The most popular condensation surfaces for Peltier-based AWG are coated metal flat plates, heatsink-like fins [
10], parallel array of cooling plates [
11], etc. Ribbed or grooved structures such as micro-grooved copper wires are used for significant enhancement of fog and dew harvesting [
12]. Additionally, biomimetic designs inspired by plants and animals often incorporate surface grooves to enhance water flow and retention during fog harvesting. All these structures have one thing in common—a two-dimensional condensation surface. For fin-like structures, the flat plates are arranged in a way that looks like a heatsink to make a three-dimensional capturing surface. While having flat plate-like structures have the advantage of altering the surface wettability in various ways, such as laser texturing, sandblasting, chemical etching, etc., it lacks the opportunity of maximizing the surface area of a given 3D space. TPMS structures modeled in nTop are considered here to be the condensation surface that is to be mounted on the cold side of the Peltier. These three-dimensional structures possess an exceptionally large surface area due to their intricate surface design and are expected to condensate a larger amount of atmospheric moisture. Previous research has shown that hybrid and modified surfaces with ridge and structures have improved the amount of water collected by AWG [
9]. This study explores the viability of TPMS in terms of providing a maximum surface area to volume ratio and minimum temperature difference between the cold base and warm top surface of the models. The former is to achieve the largest possible surface area for condensation and the latter is to achieve efficient cooling from the Peltier. This goal was achieved by performing thermal simulation on the models and then using various data to conduct a regression analysis and finally, multi-objective optimization using Minitab® 21.4.2 (64-bit).
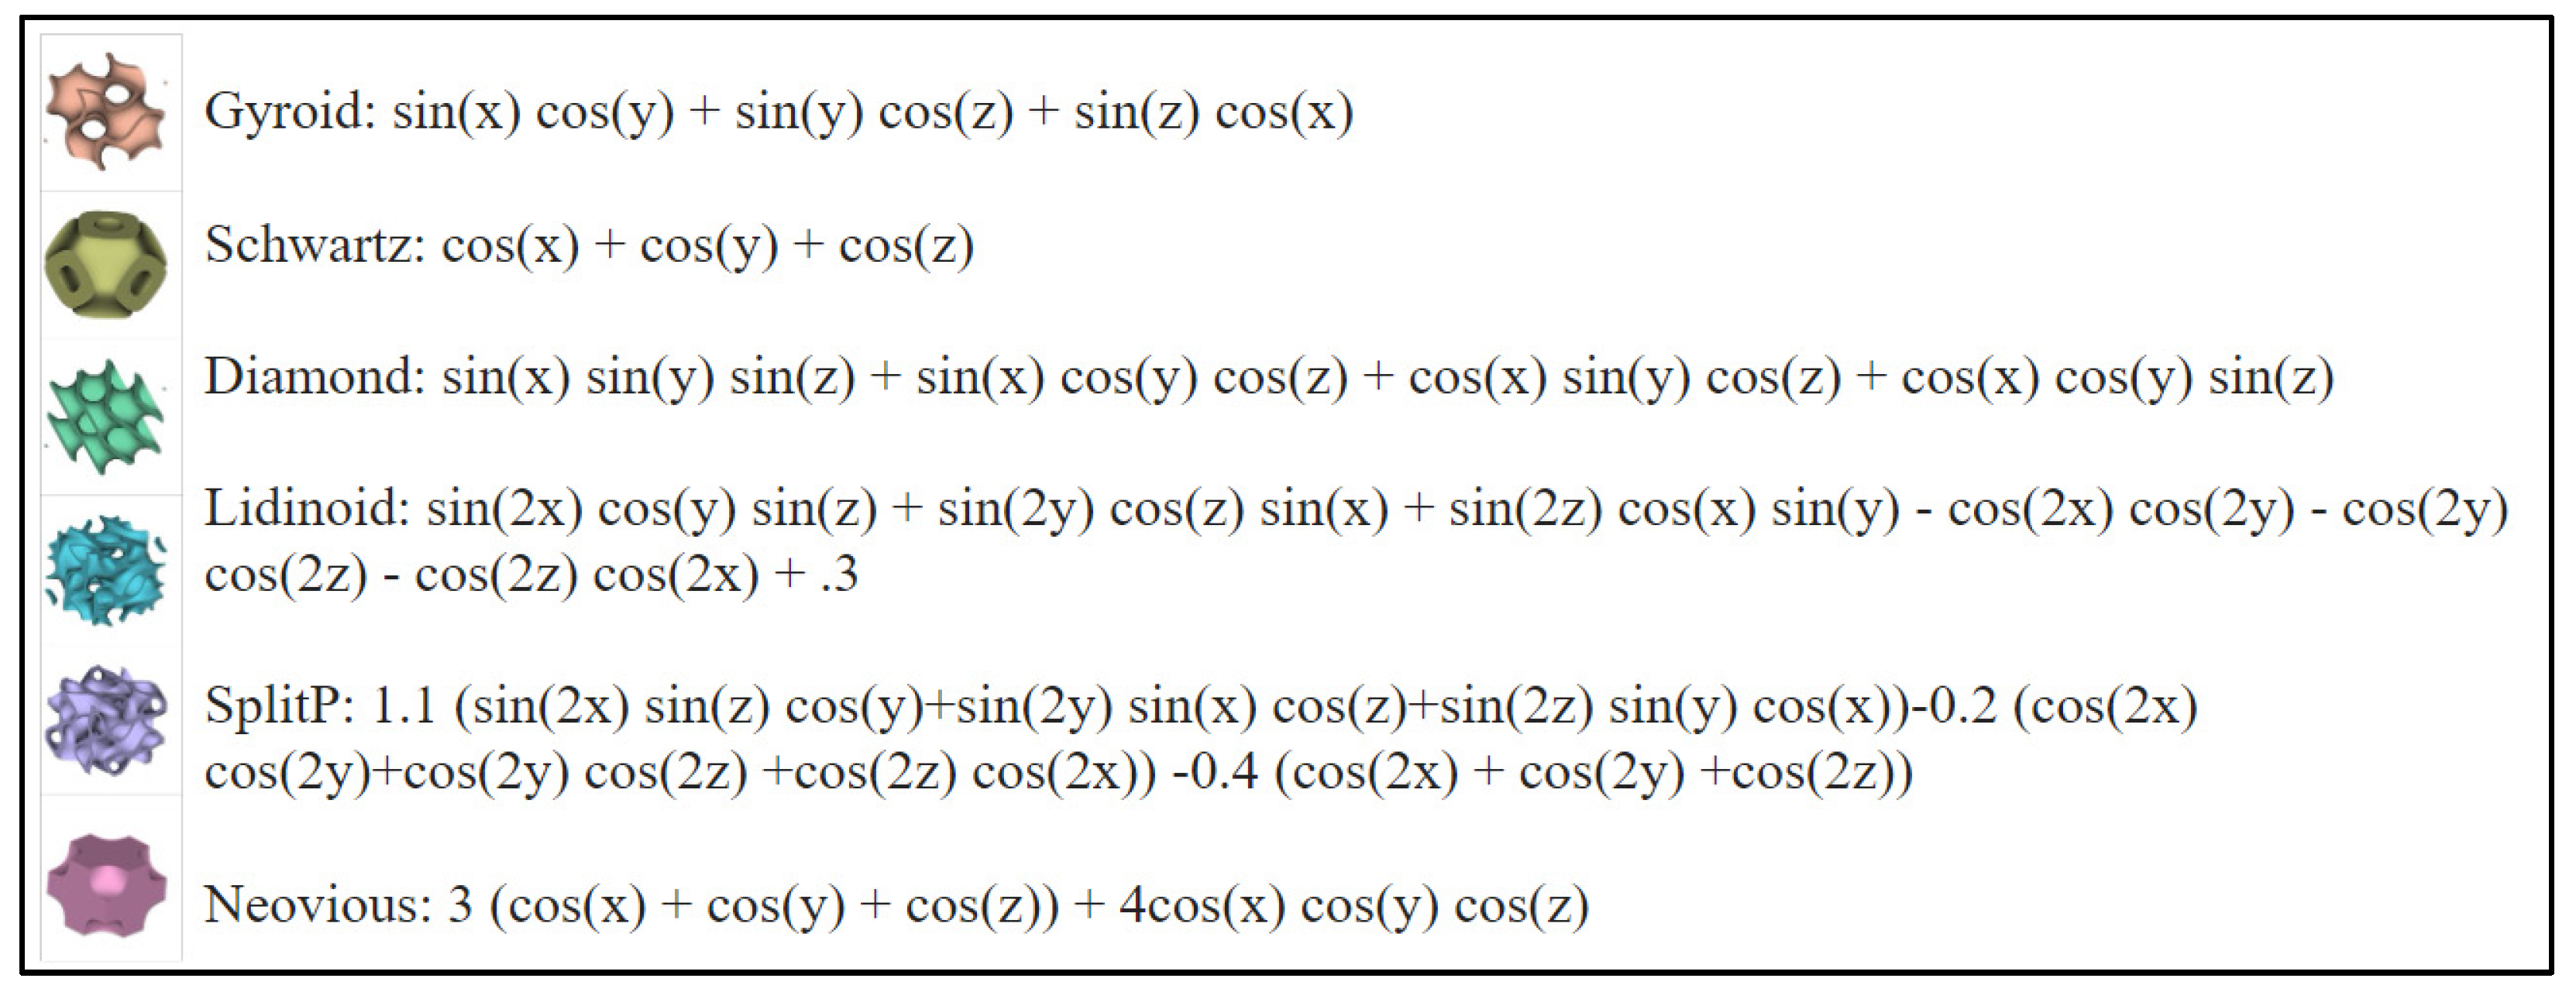
TPMS modeling: Design considerations for modeling in this study are based on lattice-influenced geometry that has the resemblance of a crystal structure. This can be divided into two sub-groups: graphic unit cell and TPMS. Graphic unit cells are structures that are composed of beams with no thickness that include graph properties of valencies, edge counts, and more. TPMS are structures created out of sine and cosine equations and create periodic structures when stacked in the x-, y-, or z-directions [
13]. For example, Gyroid, Schwartz, Diamond, Lidinoid, SplitP, Neovious, and all these TPMS have their unique equations (
Figure 1). In nTop, a TPMS can be also custom-built from an equation as well as custom unit cells can be created to build custom lattice structures. Minimal surfaces are surfaces with the smallest area among all possible surfaces for a given boundary [
14]. Minimal Surfaces are also defined as surfaces with a mean curvature of zero. TPMS are Minimal Surfaces that are periodic in three different directions. This mathematically defined periodic minimal surface is also found in nature. For example, highly curved TPMS is found in giant amoeba (
Chaos carolinensis) mitochondria [
15] that suggests structural adaptation and survival. Gyroid cubic membranes are found in the chloroplast of green alga
Zygnema (LB923) [
16] and their formation indicates the adaptability of the chloroplast membrane to different environmental stresses such as limited nutrients, temperature fluctuations, and UV exposure, etc. Gyroid is observed in the wings of the
Callophrys rubi butterfly and primitive TPMS is found in the microstructure of sea urchin skeletons [
17]. Another research introduces an innovative approach of combining TPMS with varying axial elastic moduli to achieve isotropic mechanical properties that were supported by simulations and experiments [
18]. A formalized parametric design is applied [
19] to create and assess TPMS identifying key design parameters such as equation, volume fraction, unit cell, number of cells, orientation, etc. A comprehensive topology optimization was developed for functionally graded TPMS-based structures [
20]. The research uses numerical homogenization and material interpolation laws for transversely isotropic elastic bulk properties of the structures. These TPMS structures demonstrate remarkable adaptability and functionality in both biological and engineered systems.
Extracting data such as the volume of the solid and the surface area of the TPMS is straight forward with simple commands in nTop. One of the crucial factors of this study (surface area to volume ratio) is determined by the data which are used in the later stage of data analysis.
nTopology for modeling and thermal simulation: According to a master’s thesis, nTop platform and Inspire emerged as the top two topology optimization software tools compared to SolidWorks 2019 Student Edition by Dassault Systems, Fusion 360 V.2.0.7824 by Autodesk, and Ansys Student 2020 R1 by Ansys- all student licenses [
22]. nTop made it easy to automate the homogenization process for TPMS in a large number for mechanical properties analysis [
23]. This software is known for its advanced capabilities of handling complex geometries that are widely used in heat exchangers and are for additive manufacturing [
24]. This is why nTop was selected to design and perform steady-state thermal analysis of the TPMS models in this study.
A study conducted a numerical simulation of a Gyroid heat exchanger employing the SST K-ω turbulence model [
25]. The effects of lattice size, unidirectional lattice size, and the hot/cold fluid porosity ratio were investigated, and the porosity ratio was found to be crucial for optimizing heat transfer coefficients and flow dynamics of the system. This study explored the performance of Gyroid, Diamond, and IWP in comparison with traditional fin structures, and the Diamond was found to be the best in heat transfer efficiency due to its unique design of lacking “through-holes” [
26]. In another study, Schwartz P was found to be more efficient than Gyroid and Diamond in heat transfer and achieving lower pressure drop [
27]. The simulation was done in Ansys Fluent, and the results were compared to conventional liquid-cooled radiators. Ansys Fluent was also used to simulate TPMS structures to improve the performance of glass microfiber-based thermal transpiration pumps [
28]. A numerical simulation model and experimental validation were performed on TPMS structures demonstrating enhanced heat transfer with improved thermal performance compared to conventional designs. New TPMS models outperform Diamond and Gyroid models by having superior convective heat transfer coefficients [
29]. Another study among porous TPMS structures shows that the Gyroid performs better than Diamond and FKS exhibiting the highest Nusselt number for heat removal [
30]. Computation analysis of Fisher–Koch (FK) TPMS was performed which showed their superior thermal-hydraulic performance compared to Schwartz-D [
31]. This study also concludes that TPMS application significantly enhances heat exchanger design and performance. Conducting a thermal simulation on the established TPMS models provided the necessary data on the temperature difference between the cold base and the warm top surface of the structures to conduct further evaluation by data analysis.
Regression analysis and multi-objective optimization: Regression analysis is a statistical tool for the investigation of relationships between variables [
32,
33]. The responses are the predicted outcomes that are dependent on the factors or variables. A study employs this analysis to accurately predict different mechanical properties of TPMS lattice structures [
34] such as mass, yield stress, elastic modulus, specific energy absorption, and onset of densification. Understanding the process of regression analysis is crucial since it has been widely used in many different fields such as cardiorespiratory fitness [
35].
The simplest mathematical formulation of multi-objective optimization is to rank the candidate alternatives from the best to the worst while considering trade-offs between two or more conflicting criteria [
36]. While calculating these appraisal scores, information concerning weights (relative importance) allocated to different criteria may be sometimes required. These criteria weights can be estimated subjectively taking into consideration the opinions of the participating experts or determined objectively based on the randomness/variability of the data in the decision matrix itself. A streamlined Taguchi approach with weighted factors was considered for multi-objective optimization to identify optimal process parameters [
37]. The parameters were for the nano-powder-mixed electrical discharge machining of INCONEL800 that utilizes a copper electrode where the goal was to minimize surface roughness and maximize material removal rate. Another study applied multi-objective optimization to minimize printing time with higher-quality printed parts for ABS polymer in Fused Filament Fabrication [
38]. Energy consumption, quality, and production responses were optimized simultaneously assigning weights to energy consumption responses, surface roughness, and material removal rate during the rough turning operation [
39]. The Taguchi method was used in another study to identify the optimal factors such as temperature, catalyst concentration, and acidity of catalyst and their interactions that affect the thermocatalytic degradation of waste polypropylene to liquid fuel in a batch reactor [
40]. Multi-objective optimization was also applied to find the optimal cutting force and surface roughness in the machining of Ti-6Al-4V [
41]. A practical approach of regression analysis and desirability functions to find optimal factor settings for advanced process control proved to be beneficial for complex processes with limited historical data [
42]. A similar analysis has been adapted to this study using regression-based transfer functions allocated with weights.
Hence, regression analysis and multi-objective optimization are used in this research. Regression analysis helps to identify the significance of the two factors, lattice thickness (T) and cell size (X), for each of the cell types that are investigated. The regression equations can predict the output of each response for any given parameter of the factors. This is useful to optimize time and cost in the study. And multi-objective optimization helps to find optimal factor values that can fulfill the goal of contradictory responses in the most efficient way.
2. Materials and Methods
The multi-objective goal of maximizing surface area to volume ratio (SA/VS) and minimizing temperature difference (∆T) is performed by the following 3 steps. Each of them is explained further in this section.
Modeling: Generated models based on input factors such as cell size and lattice thickness for different cell types using nTop.
Thermal simulation: Conducted thermal steady-state simulation for standard ambient temperature, available materials, and natural convection using nTop.
Data Analysis: Factors and responses are recorded and analyzed in Excel and Minitab for further analysis.
2.1. Modeling
In order to model the TPMS structures, the input factors are cell types, lattice thickness, and cell size. The TPMS lattice structures are built using nTop with an overall dimension of 40 × 40 × 30 mm
3 with a base of 2 mm thickness in UVW orientation. The Peltier that is used to cool these models have 40 × 40 mm
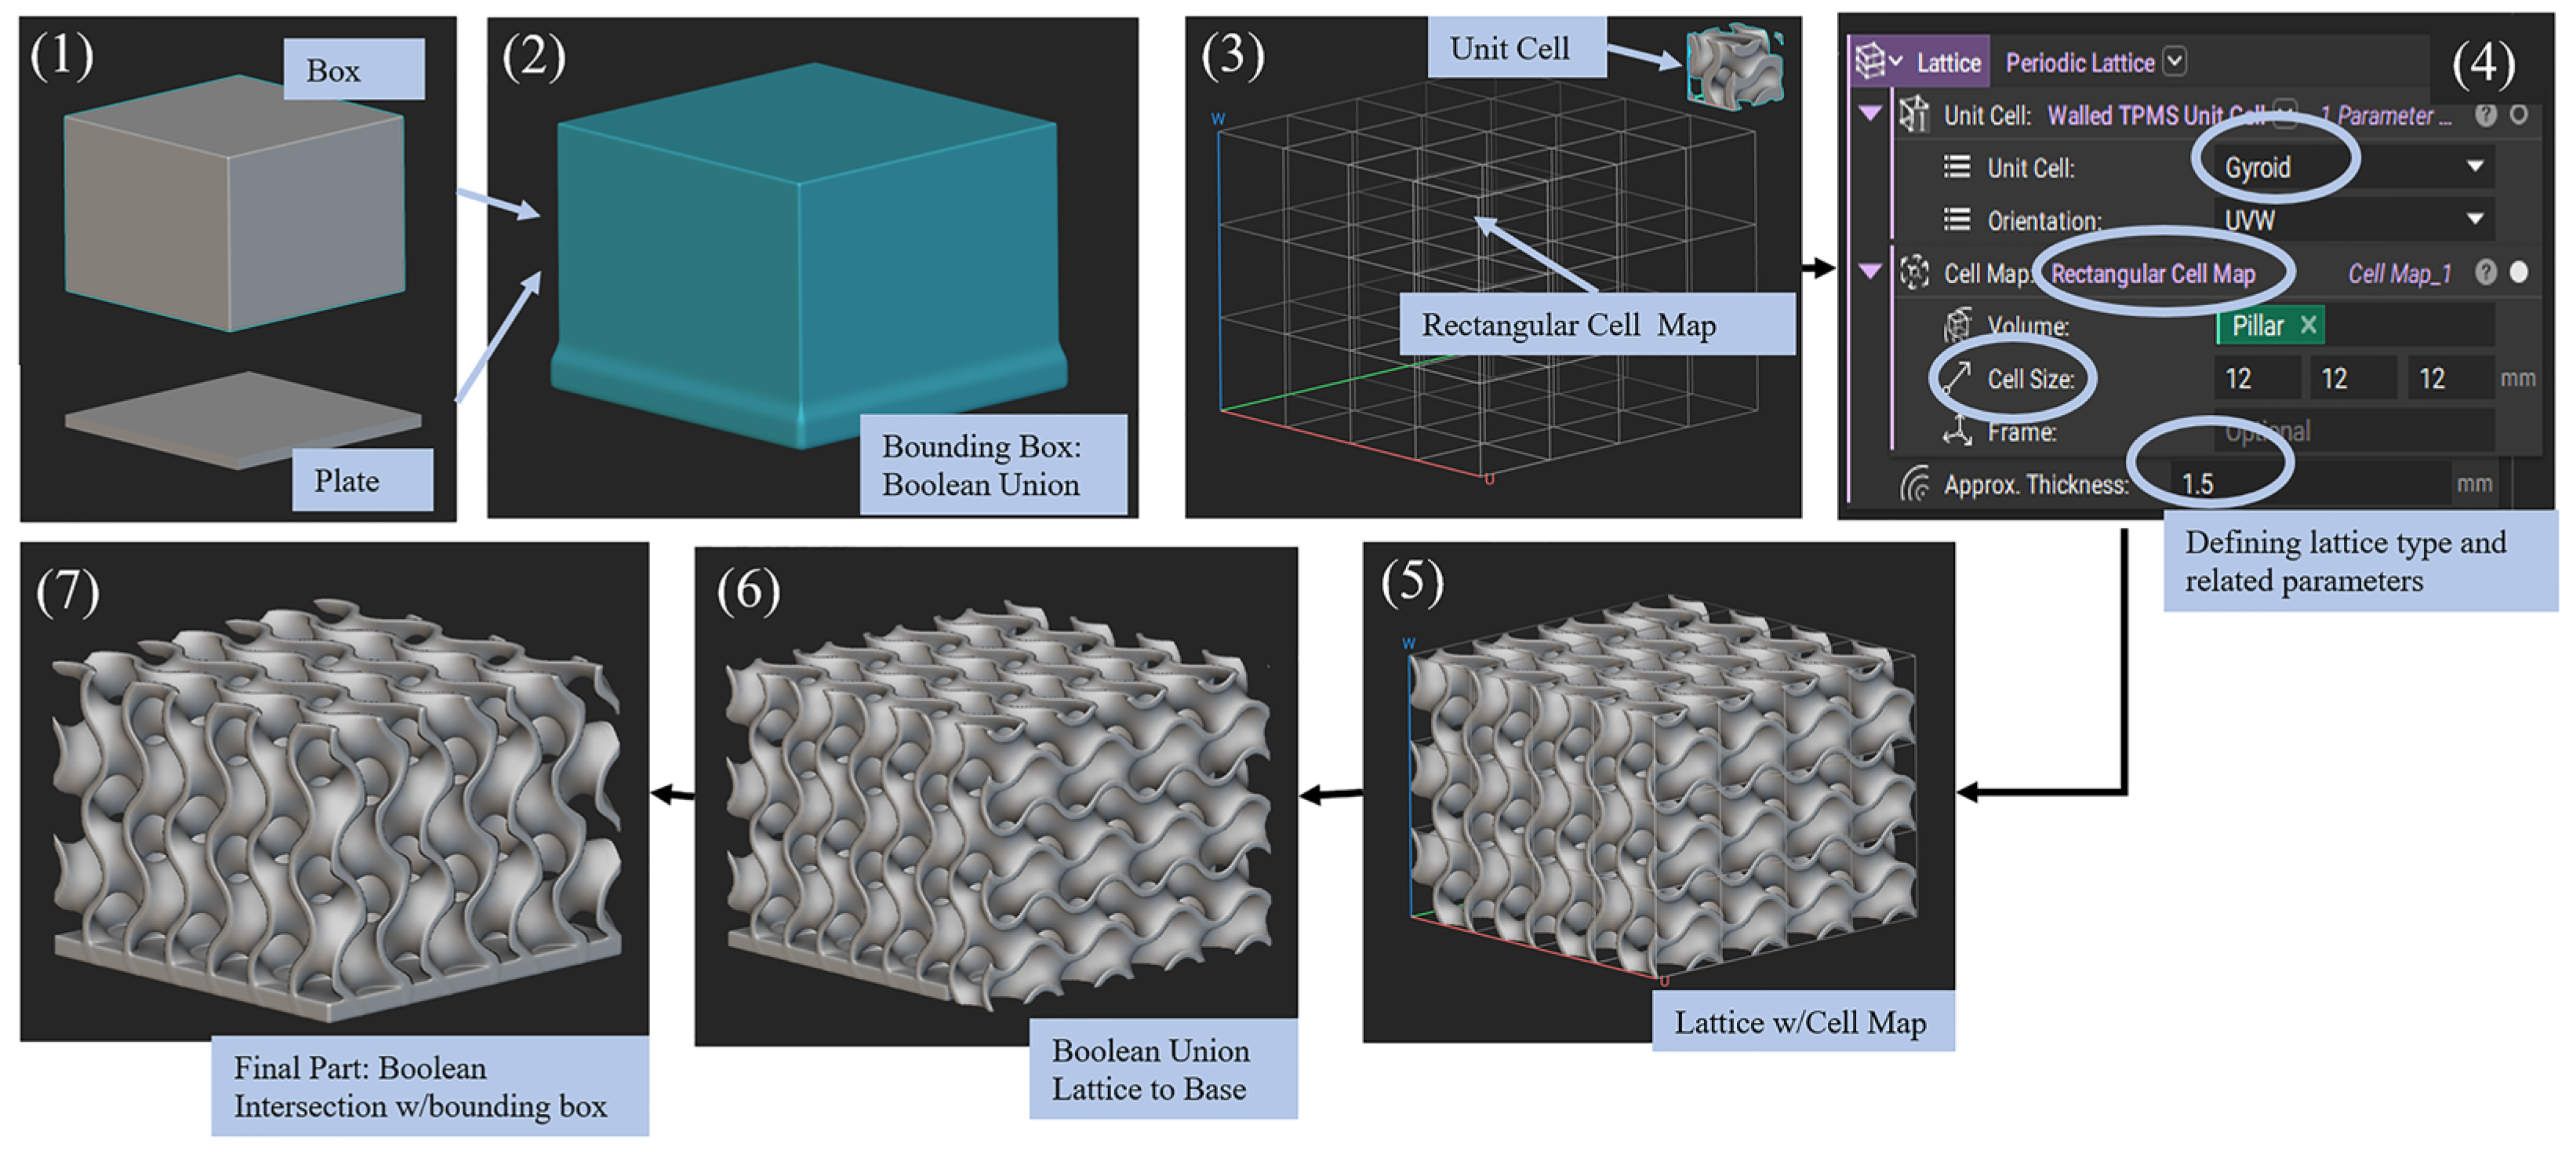
2 cooling surface. Hence the bottom surface of the models is identical in size to ensure uniform cooling effect throughout the structures. The model construction procedure was carried out using the guide from the nTop support knowledge base [
43] and can be described in 7 simple steps that are shown in
Figure 2.
Creating the bounding box that defines the space for the lattice structure for the final part and the plate that resembles the base of the structure. The bounding box is 40 × 40 × 30 mm3, and the plate is 40 × 40 × 2 mm3.
With the operation of Boolean union, connect the bounding box and the plate as a single body.
Choosing the type of unit cell that is used to create the lattice model with the cell map type. A rectangular cell map is chosen to have a uniform design in all x-, y-, z-directions.
Additional information regarding building this lattice structure such as orientation (UVW is chosen here), cell size, and approx. thickness of the lattice or lattice thickness is defined here. Lattice thickness and cell size are the input factors for these design considerations.
Lattice structure within the cell map is generated in this step.
Boolean union is performed to attach the lattice structure to the base plate.
Since the generated lattice overhangs the bounding box because of its independent formation, Boolean intersection with the bounding box is performed resulting in the desired size of final parts.
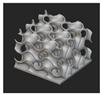
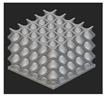
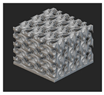
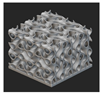
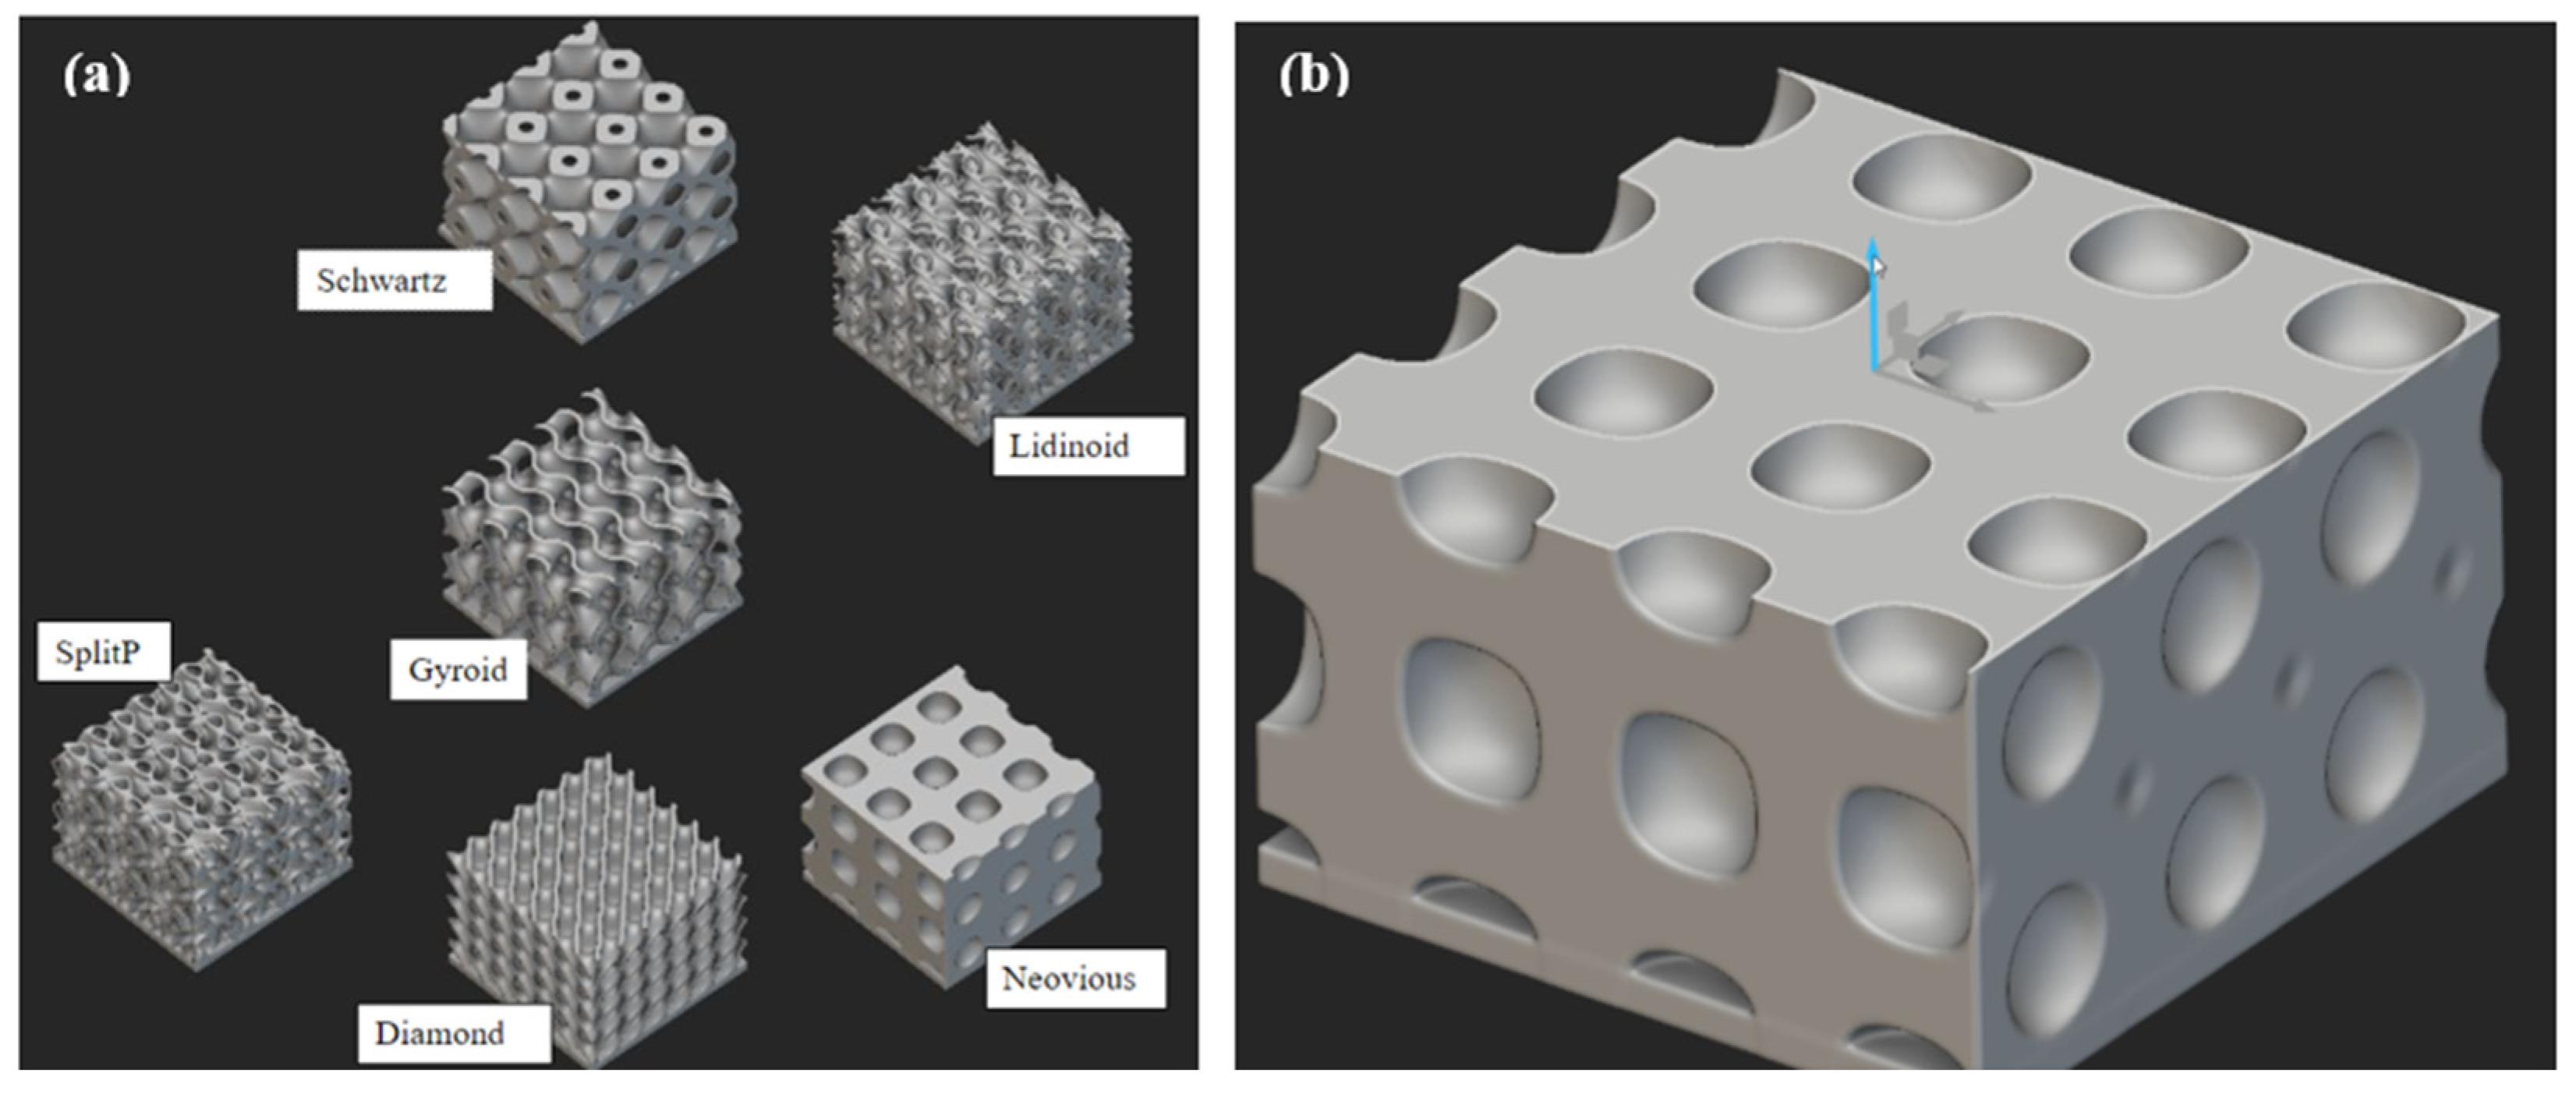
Cell types (C): In the nTop software, under TPMS structure options, there are a total of 6 types of lattice structures: Neovious, Schwartz, Lidinoid, Gyroid, Diamond, and SplitP (
Figure 3a). The Neovious model has inner hollow structures (
Figure 3b) that are mainly implemented to make the parts light in weight in different applications such as aerospace or automobiles. For the application of this study, only exposed surfaces are important. The calculated surface area by the software is misleading in this scenario and hence, Neovious is excluded from further consideration in this paper.
Lattice thickness (T): Wall thickness of each cell in each cell type. In this study, three levels of T are considered: Thin, Moderate, and Thick. Values for ‘Thin’ are selected to be the lowest possible values that can support the structural integrity without distorting the cell design. Similarly, ‘Thick’ is selected to be the largest possible values that maintain the cell identity without decreasing too much surface area. The ‘Moderate’ values are in between Thick and Thin but not exactly a geometric mean of the highest and lowest values. A closer value to the geometric mean that does not produce broken corners is selected for each case. Because TPMS is basically stacks of multiple unit cells connected together, it is possible to generate a partial overhang from the main structure. This prohibits the next step, such as meshing and can lead to false values of surface area and volume. Depending on the C, the value for these three levels can vary. Such as for Gyroid, Thin (1.5 mm), Moderate (2 mm), and Thick (4 mm) whereas for Schwartz, Thin (1 mm), Moderate (1.5 mm), and Thick (2 mm).
Cell size (X): The size of individual cells contained in the structure. The smaller the size, the greater the number of cells that can be packed in the same block. The three levels X’s considered in the study are Small, Medium, and Large. Such as for Gyroid, Small (12 × 12 × 12 mm3), Medium (16 × 16 × 16 mm3), and Large (20 × 20 × 20 mm3) whereas for Schwartz, Small (10 × 10 × 10 mm3), Medium (14 × 14 × 14 mm3), and Large (18 × 18 × 18 mm3). The size selection for different cell types was driven by similar key factors to the lattice thickness—to have structural rigidity that is manufacturable as well as maximizing surface area. Lower values than the ‘Small’ cell size generated structures that are too tight and will not be practical for the purpose of water generation and extraction. Bigger than ‘Large’ cell size dramatically reduces surface area and volume of the solid. In this case, a geometric mean value could be considered as ‘Medium’ value since it does not generate any partial overhang of the model.
The combinations of the T and X are chosen based on the final model outcome that can generate a continuous model to mesh for further thermal simulation processes. Since each C is considered independently for data analysis, the different numbers assigned for different levels for each C do not impact the judgment of their behavior.
2.2. Thermal Simulation
For the thermal simulation section, additional input factors are materials, ambient temperature, and convection coefficient. Additional operations are conducted at this stage such as creating mesh [
44] and FE models [
45] to be able to run the simulation. nTop support knowledge base [
46] was used as a guide to create this thermal simulation.
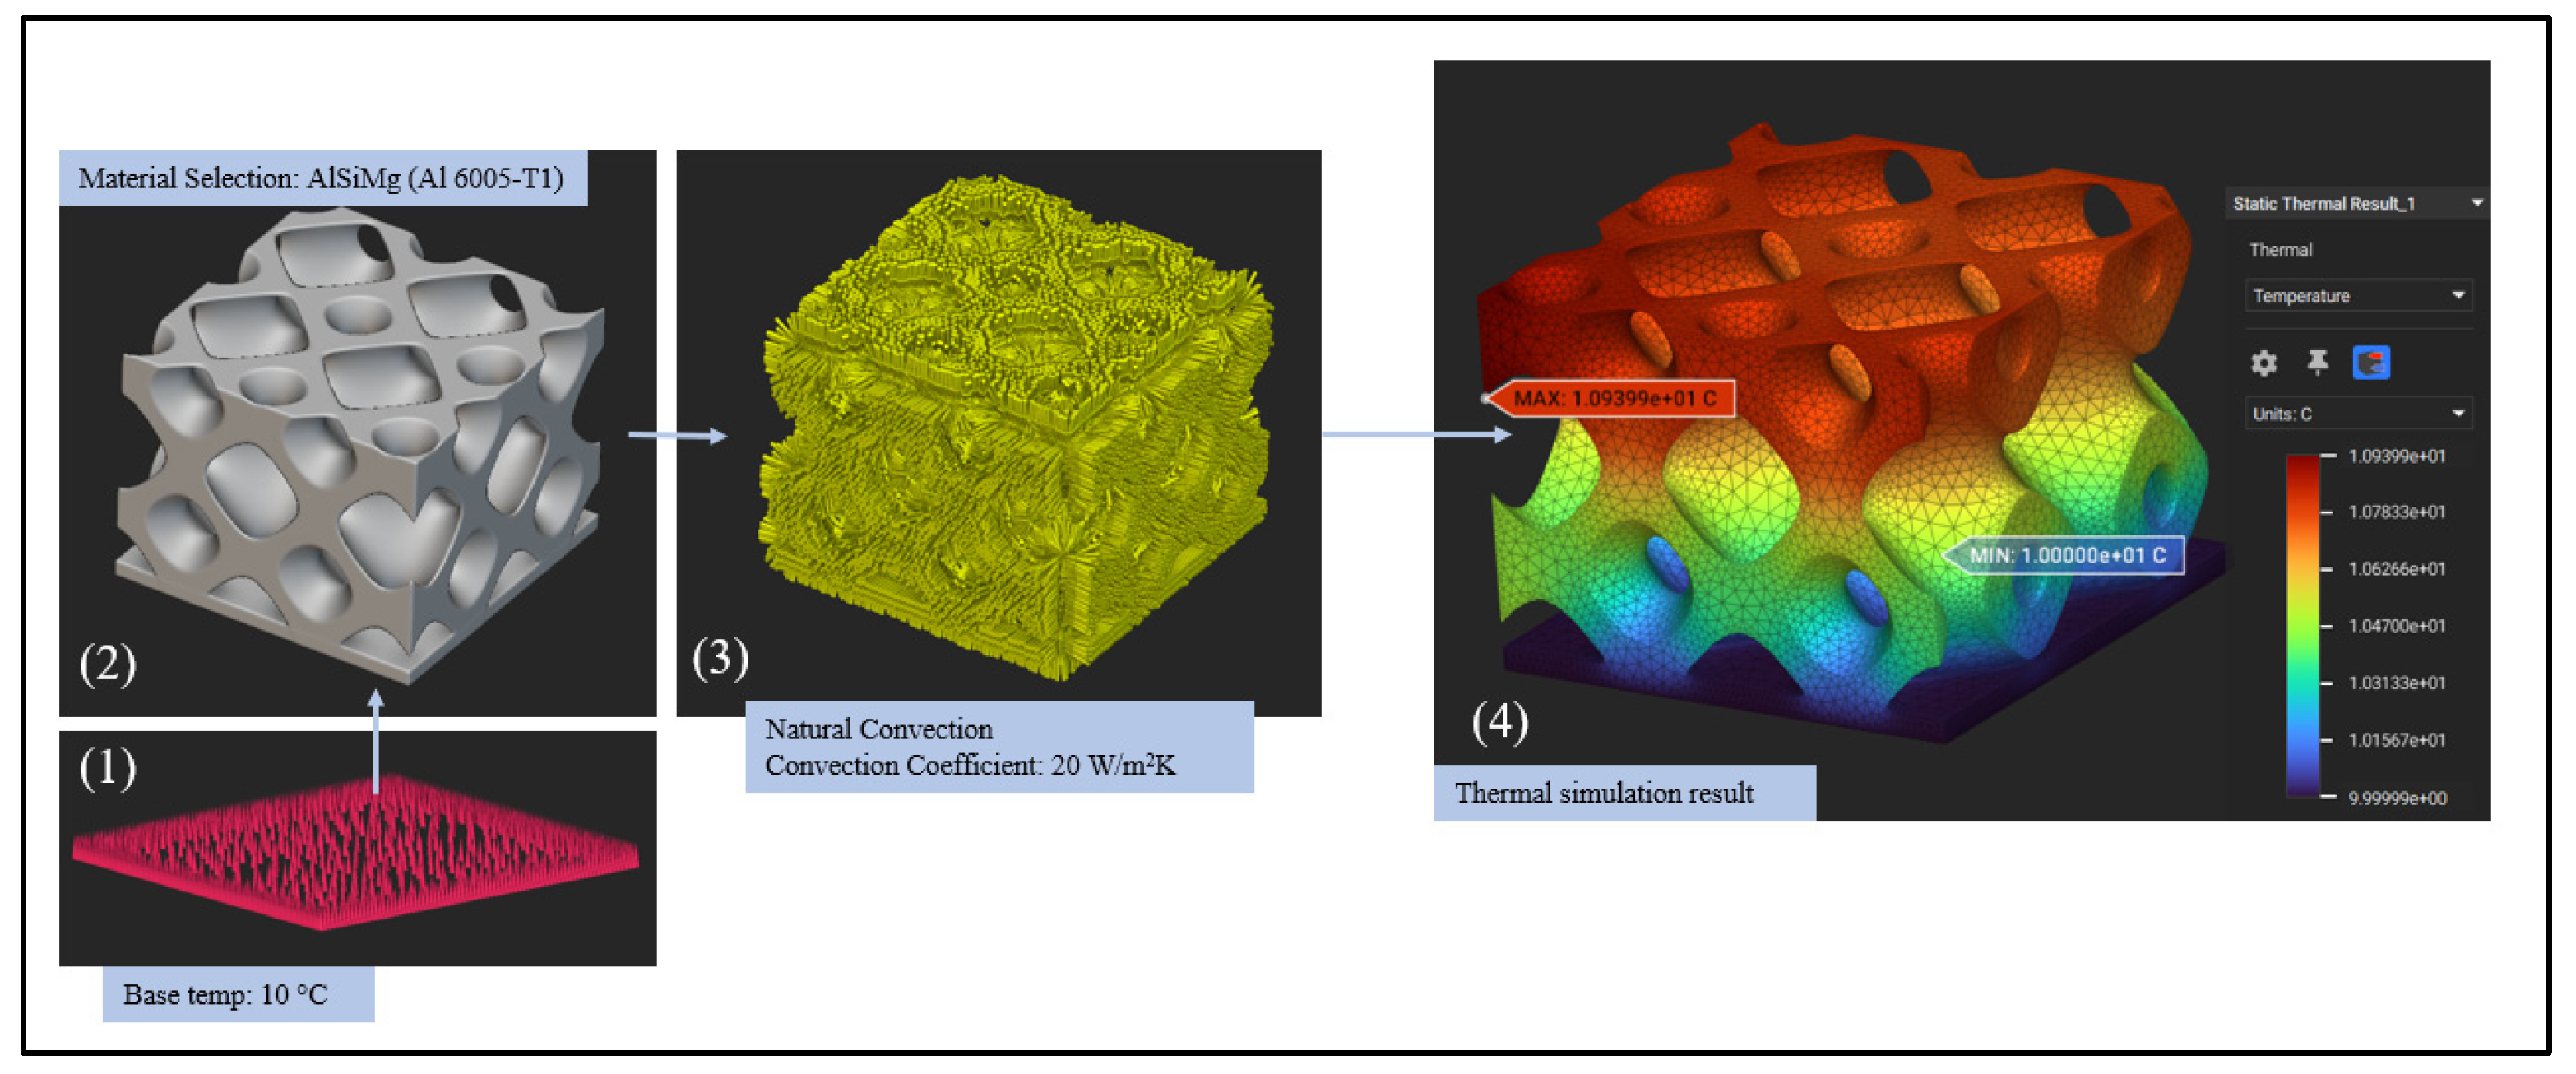
Material: Al 6061-T6 is used as the default material in the nTop software since it is a widely used metal for industrial applications with a good conductivity of 167 W/m-K and a specific heat capacity of 0.896 J/g-°C at temperatures 0–100 °C [
47]. The conductivity and specific heat capacity values for widely used additive manufacturing material AlSiMg (Al 6005-T1) are 180 W/m-K and 0.890 J/g-°C, respectively, which are fairly close to Al 6061-T6 [
48]. Hence, this material is chosen to have results that can be applied to both manufacturing processes.
Boundary conditions: The temperature at the base of the models is defined as a fixed temperature of 10 °C shown in step 1 in
Figure 4. The base is attached to the cold side of a Peltier maintaining this temperature. The ambient temperature is 25 °C and the convection coefficient is 20 W/m
2K (step 3,
Figure 4) considering natural convection around the experimental setup. Finally, running a steady-state thermal analysis gives a static thermal simulation result in equilibrium where the temperature gradient of the model can be interpreted by the color-coded scale (step 4,
Figure 4).
2.3. Data Analysis
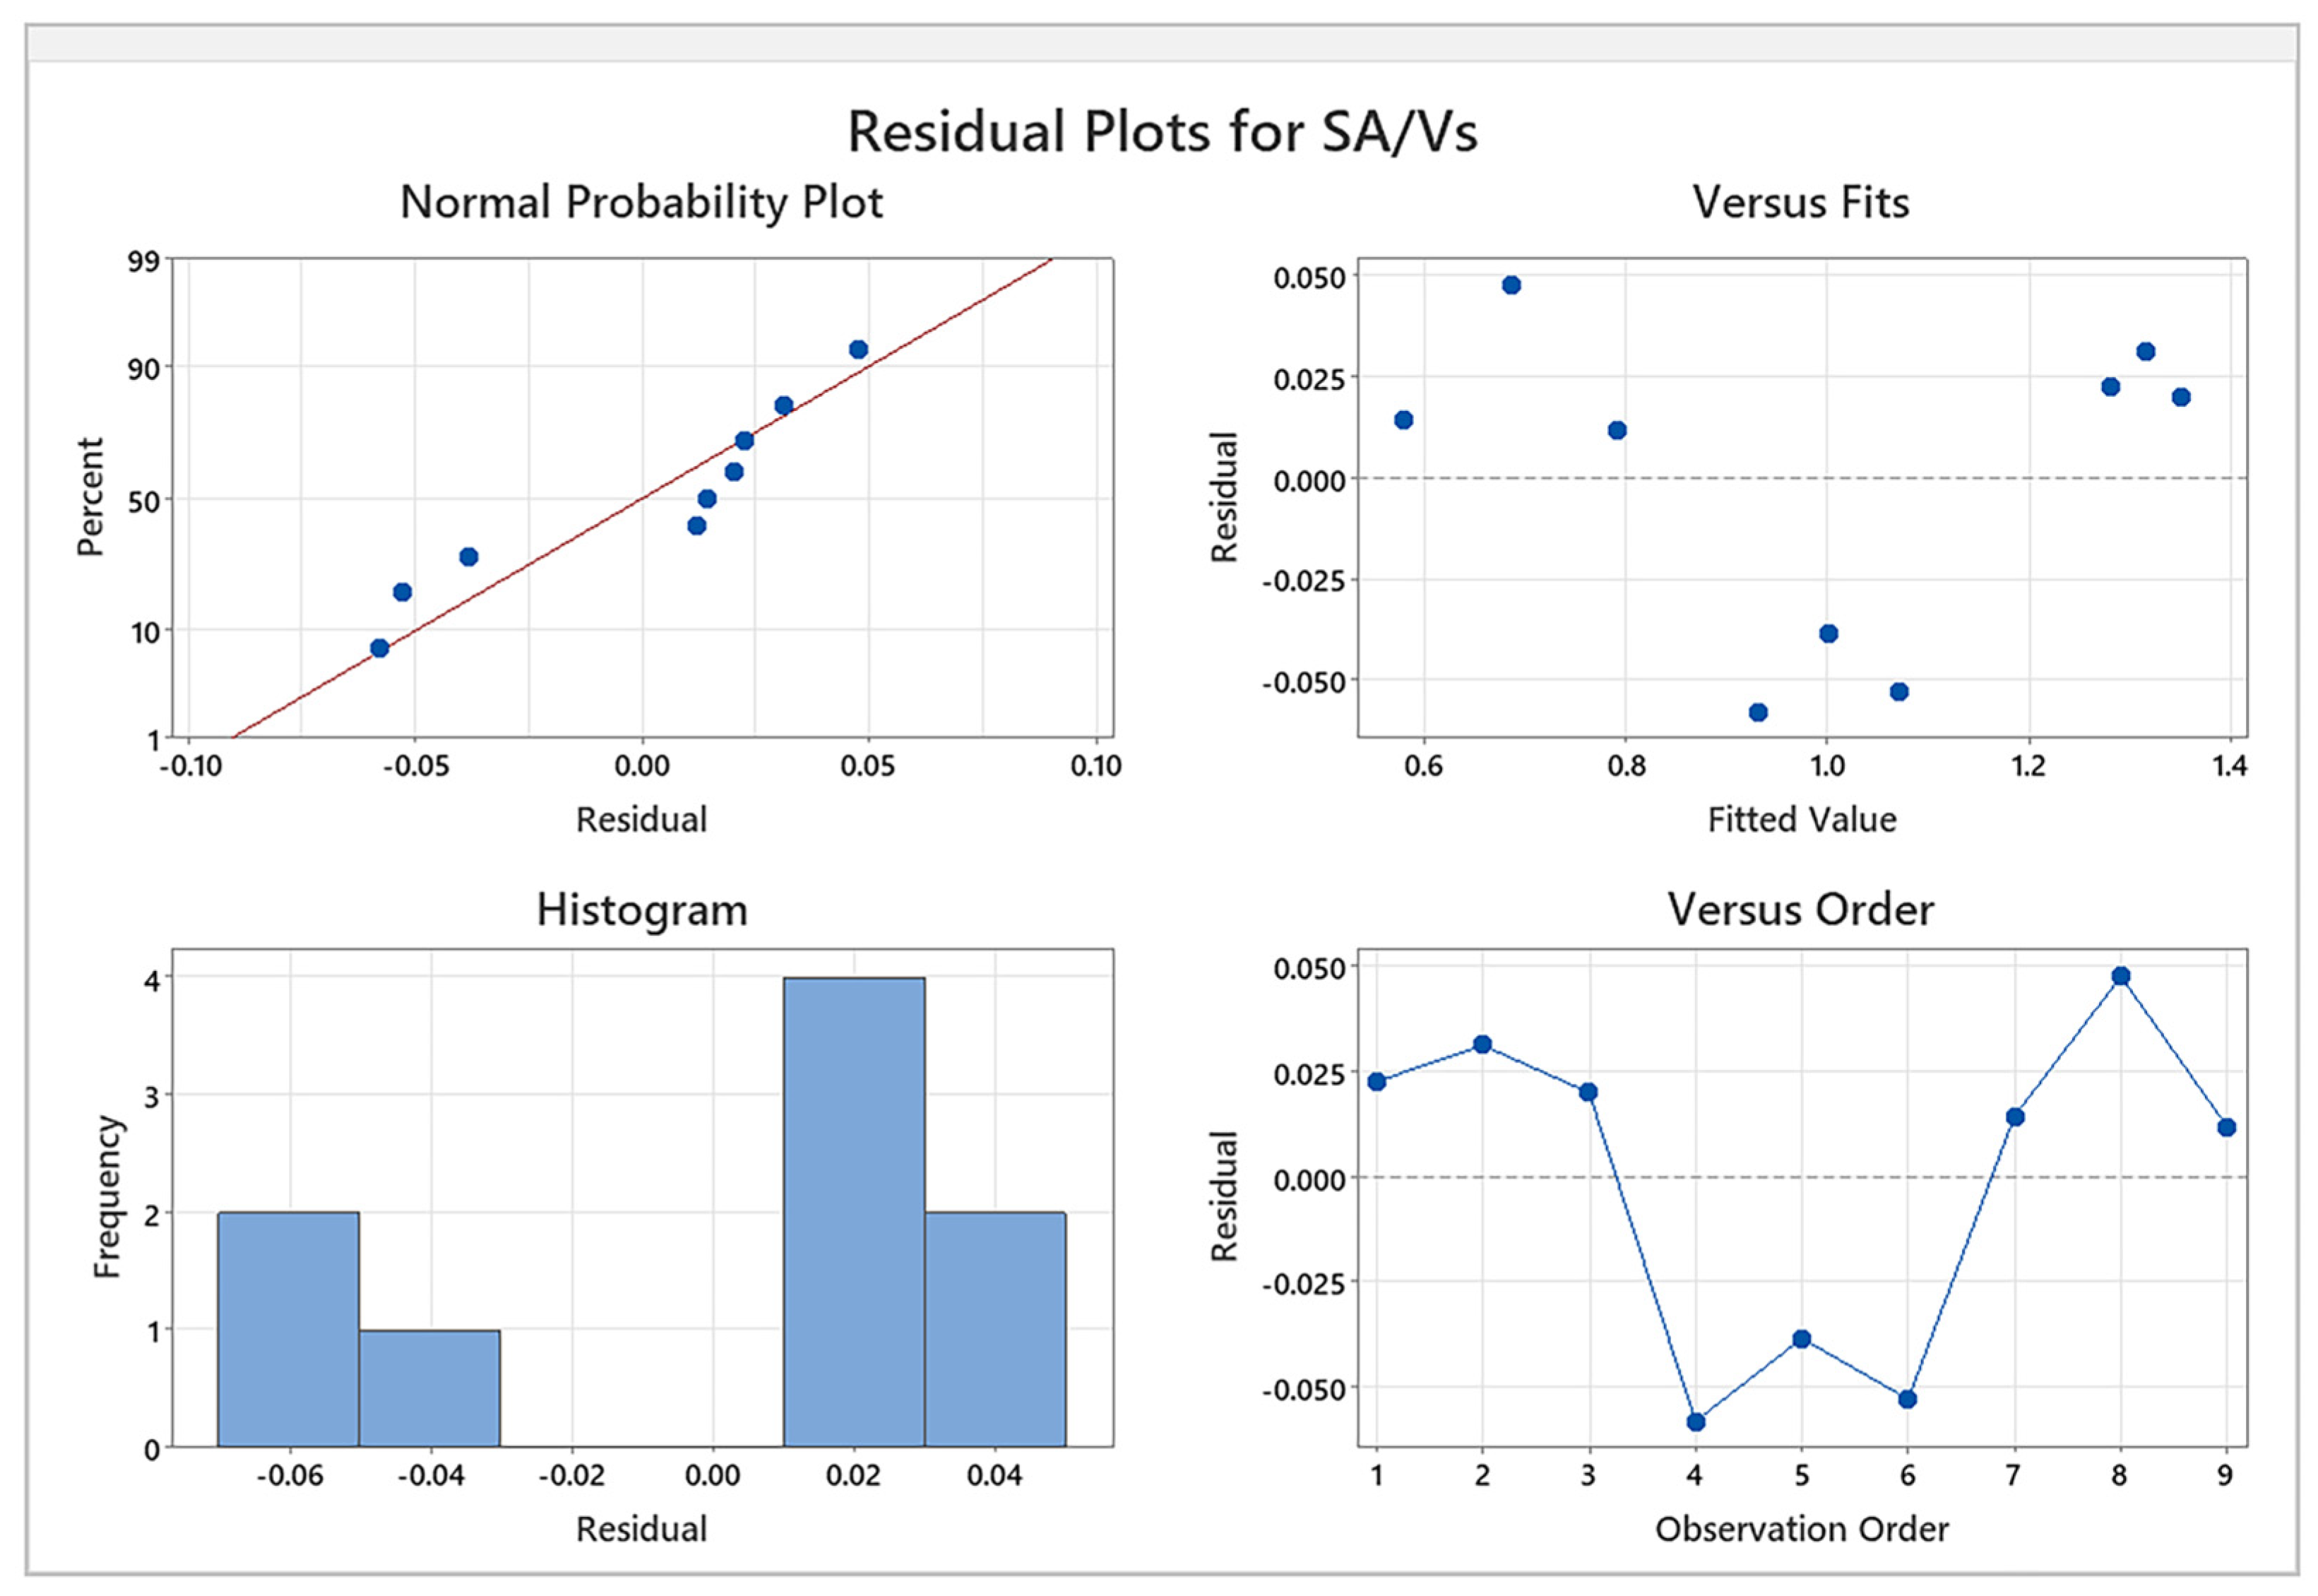
A regression model is constructed for each cell type, C, to understand the effects of the input factors (T and X) on the responses. The responses are the key performance measures for this analysis. These are the following:
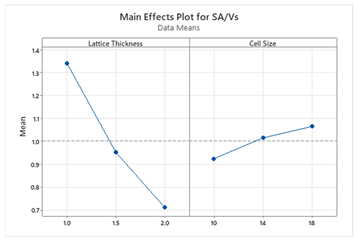
Surface area to volume ratio of the solid (SA/VS): The ratio of the surface area (SA) to the volume of the solid (VS) is measured to evaluate the promising surfaces that will have a higher surface area compared to a given volume of the solid. This means more surface area for water formation. The surface area and the volume of the solids are individually recorded from the nTop and are calculated by the software for each design. Then, SA/VS is calculated in Excel by dividing the SA value by VS.
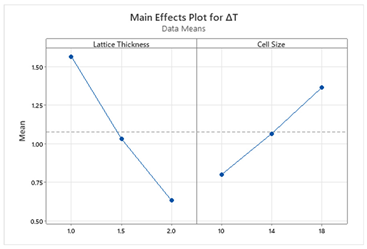
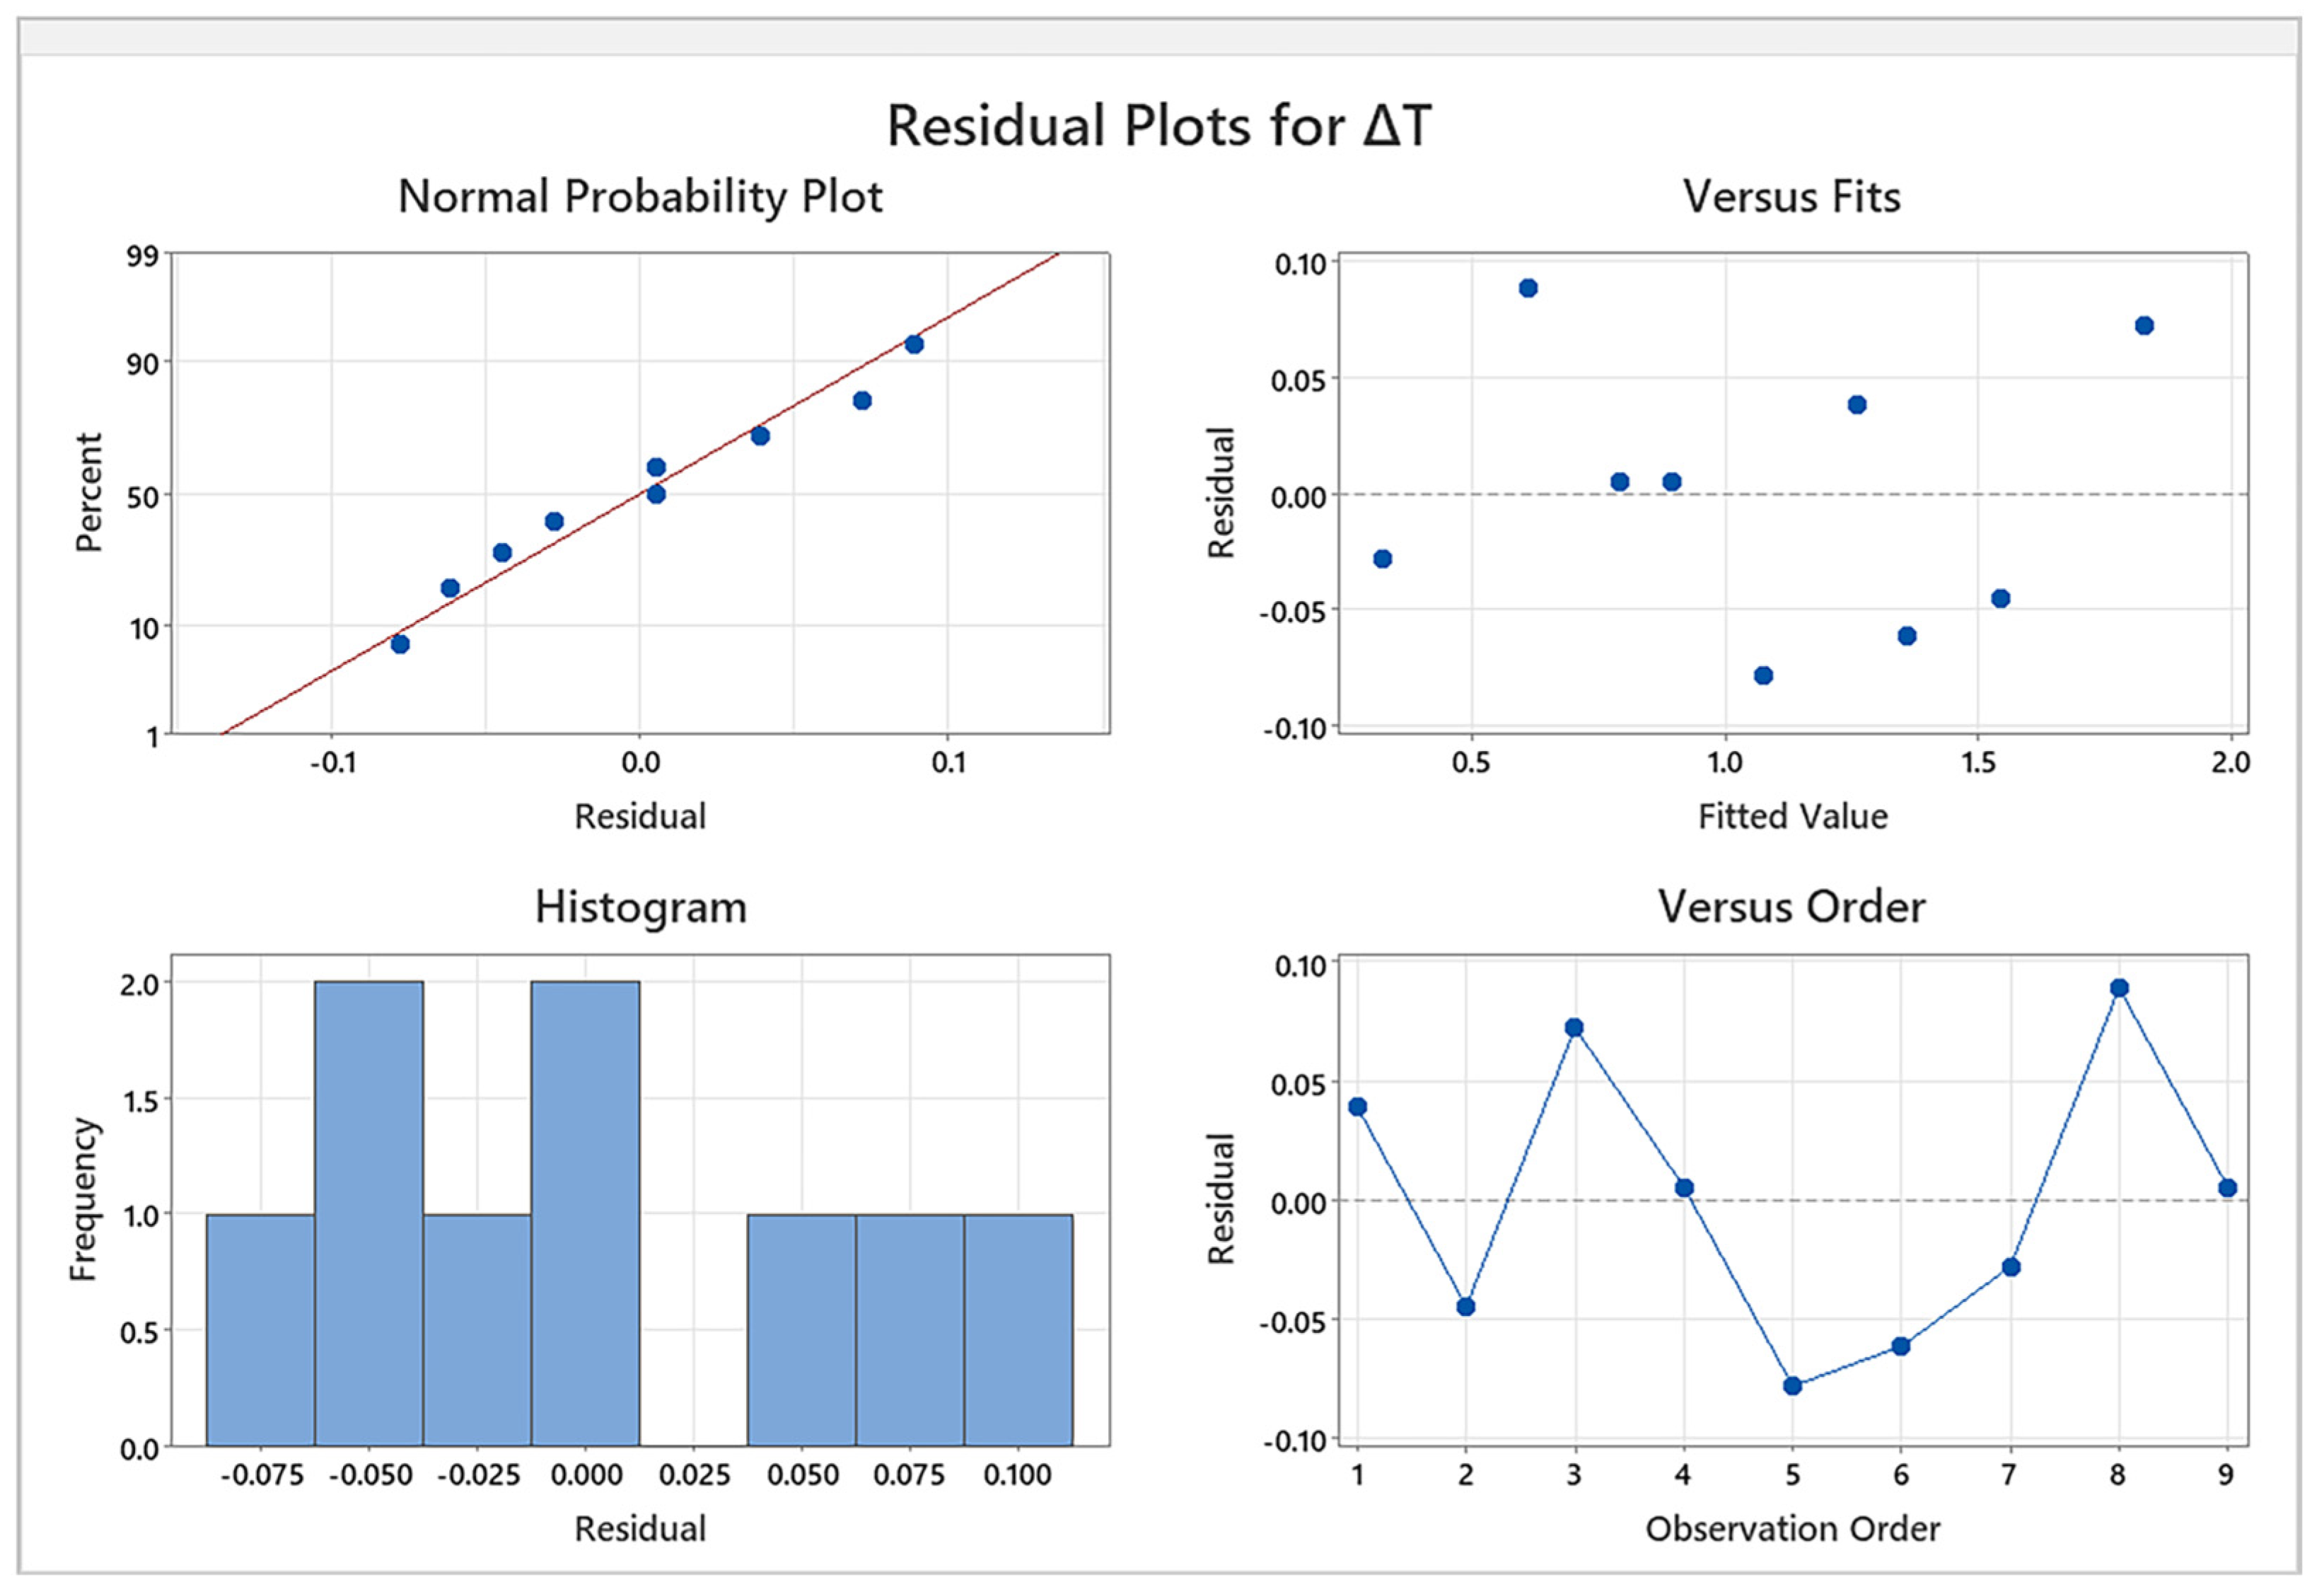
Temperature difference (∆T): This is the difference between the temperature on the top surface of the structure (T
T) and the fixed temperature of the base (10 °C). The top surface is the farthest surface from the cooling base. This surface, along with the sides and the hollow structures of the models, are exposed to the ambient temperature and natural convection. The cooling base is attached to the cold side of the Peltier. Being the farthest surface from the base, the top surface temperature will mean how well the cooling effect takes place on different combinations of cell types, lattice structures, and cell sizes based on the materials. The smaller the temperature difference (∆T) is, the better the cooling effect. The T
T values for each simulation are recorded and ∆T is calculated in Excel from the formula of ∆T = T
T – 10. The design table (
Table 1) that includes all the data for the factors and the responses is shown below.
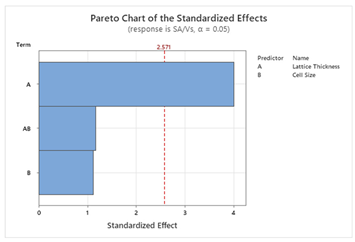
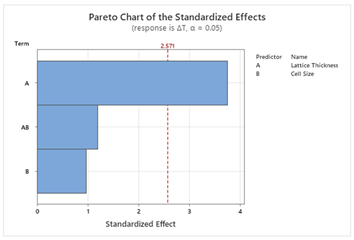
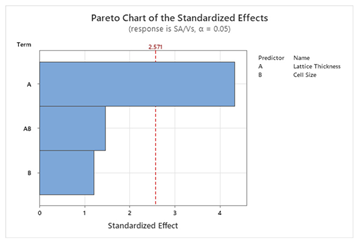
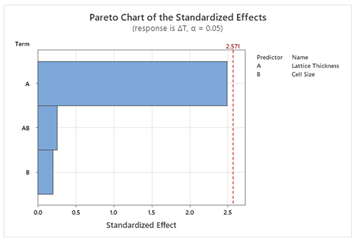
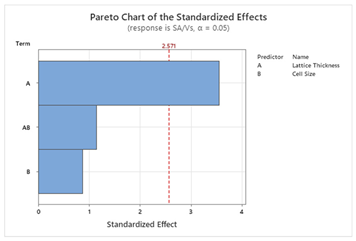
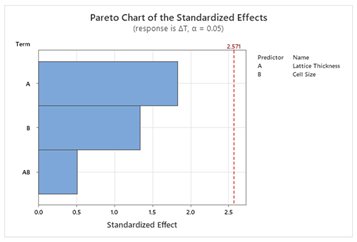
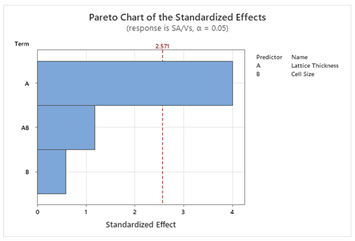
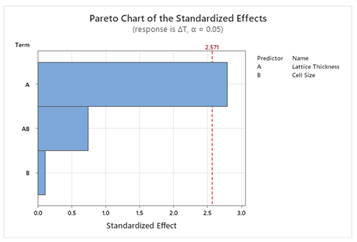
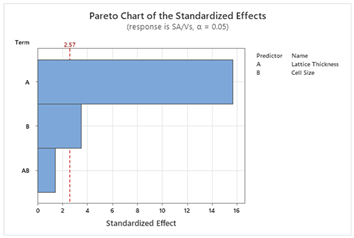
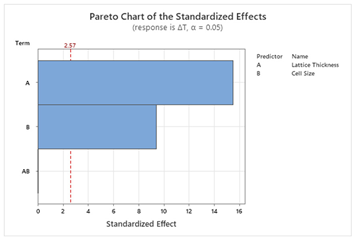
The regression model is developed to find the regression equations using the following guide from Minitab [
49]. To design the model, two factors (T and X) with three levels (T: Thin, Moderate, Thick; X: Small, Medium, Large) and two responses are used. Pareto charts of the standardized effects help to visualize the effects of the factors on the responses. Other parameters such as model summary, residual plots, and table of analysis of variance are automatically produced by Minitab as supplementary information to the statistical models. Then response optimization is conducted to achieve the multi-objective goals for this study following the Minitab guide [
50]. The goal is to maximize the SA/V
S and to minimize the ∆T. During optimization, three different scenarios are considered: allotting weight or sensitivity (0.75, 0.5, 0.25) to each response to compare their output results.
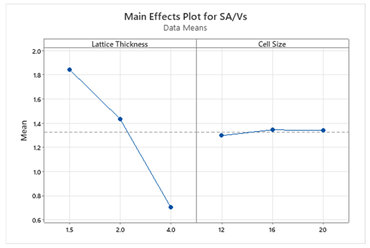
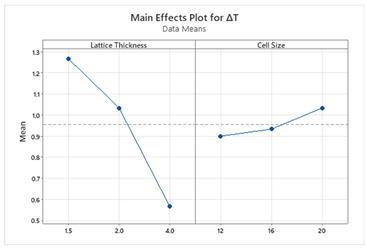
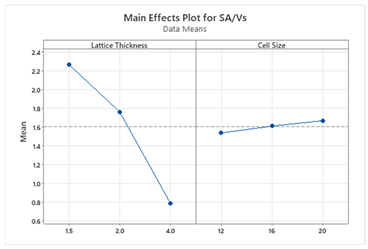
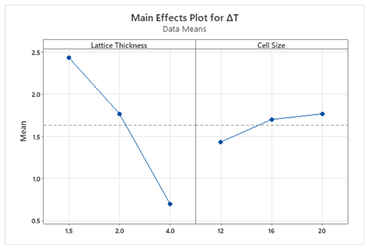
5. Discussion
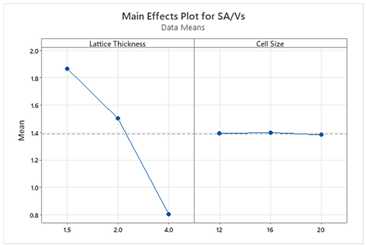
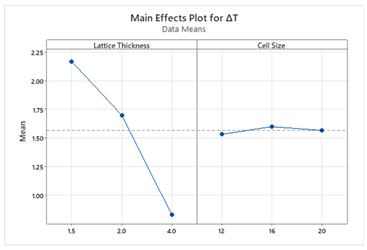
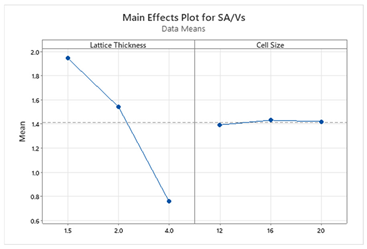
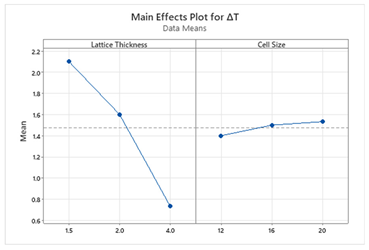
In this study, a regression model and multi-objective optimization were focused on achieving the goal of finding significant factors and optimal parameters for desirable responses. The regression equations for each TPMS cell type provide insights into the influence of lattice thickness and cell size on the surface area to volume ratio (SA/V
S) and temperature difference (ΔT). From a practical standpoint, these models allow designers to predict the impact of design modifications without conducting additional simulations. For instance, if minimizing ΔT is prioritized due to energy constraints, the model suggests increasing lattice thickness while keeping cell size moderate. Conversely, if maximizing SA/V
S is the goal, thinner lattice structures should be used. For example, the regression model for the Schwartz structure reveals that both lattice thickness and cell size significantly impact SA/V
S and ΔT, whereas for other structures, lattice thickness is the dominant factor. This suggests that Schwartz structures offer more tunability, making them suitable for scenarios where both objectives are equally important. The main effect plots and Pareto charts from
Table 3 and
Table 4 support these findings.
In
Table 5, optimal parameters were calculated in Minitab by providing 75%, 50%, and 25% response. Having SA/Vs = 0.75; ∆T = 0.25 means that maximizing SA/Vs was given 3 times more importance than minimizing ∆T and vice versa for SA/Vs = 0.25; ∆T = 0.75. For SA/Vs = 0.5; ∆T = 0.5, both objectives were given equal importance. By using this analysis, factor values are predicted that bring out the best possible multi-objective outcome of the desired balance for this study. Depending on the conditions, any of these settings—or any value between 0% and 100%—can represent the overall optimum. For instance, factors such as geometry with high manufacturing costs or fluctuations in energy prices for temperature reduction may shift the priority of these objectives, leading to a higher weight for one over the other.
When SA/VS is given higher priority (0.75 weight), the optimization process favors thinner lattice structures and smaller cell sizes to maximize surface area for condensation.
When ΔT is prioritized (0.75 weight), the model selects thicker lattice structures, which enhance heat transfer and reduce the temperature difference.
At equal weighting (0.5, 0.5), the optimization finds a balanced solution that moderately enhances both objectives.
These findings are important for considering design decisions:
Minimizing ΔT is critical to reduce cooling loads that will lead to energy efficient solutions. Hence, thicker lattice structures should be chosen.
To increase water collection efficiency, condensation surface area must be maximized. Hence, thinner structures should be prioritized.
Depending on the manufacturing process, certain lattice thicknesses or cell sizes may be impractical depending on material availability, production feasibility, and cost constraints. In those cases, the manufacturing capability needs to be assessed before fabricating a particular cell type model.
By adjusting sensitivity levels, designers and engineers can tailor the TPMS structure to best fit specific operational requirements, ensuring an optimal balance between performance, manufacturability, and energy efficiency. Assigning weight percentages to the response parameters allows for the identification of the respective optimal by prioritizing each outcome according to their relative importance in the overall analysis.
The use of TPMS structures to collect water from the air is a promising energy-saving and additive-free technology, especially suited for areas with water scarcity and high humidity. However, efficient materials may require advanced manufacturing processes and higher production costs. Additionally, there are seasonal and diurnal variations in collection efficiency, and the water quality may be affected by airborne pollutants. Additional filtration systems, renewable power supply, and suitable material selection are needed to tackle these limitations along with engineering enhancement.
6. Conclusions and Future Work
The findings from regression analysis enable engineers to make data-driven decisions about which TPMS structures and parameters to select based on specific application needs. This research is a data-driven prediction of performance outcomes where the influence of two parameters such as lattice thickness and cell size on both surface area to volume ratio and temperature difference are quantified. This is conducted for five TPMS structures providing specific information about which TPMS can be uniquely tunable and offer more flexibility. The ability to optimize trade-offs between surface area to volume ratio and thermal performance is critical for improving AWG efficiency.
Furthermore, the use of a response optimizer with different sensitivity allows deviation of choices based on the importance of either or both responses. By applying this strategy, designers can fine-tune lattice geometry based on specific performance priorities such as energy efficiency or water collection rates. The approach in this study is more practical and simpler that can be utilized in new manufacturing processes, where the process is complex and might have insufficient data. In cases like this, the data are helpful to estimate process parameters such as manufacturability, and lead time, and to minimize the budget for processing. This is a methodological framework that demonstrates a systematic approach for navigating trade-offs of limited datasets for solving engineering problems. This tool can be useful for engineers solving problems in thermal management, sustainable design, and advanced manufacturing. Finally, this study enables innovation in atmospheric water harvesting, heat exchangers, biomimicry in the context of AWG, and complex 3D design structures that represent practical design choices from simulation data.
In the next step, the best-suited models for the AWG application would be manufactured using additive/subtractive/hybrid methods for further experimentation. To determine the most viable outcomes, a thorough examination of material selection and manufacturing processes will be undertaken. This step is crucial in ensuring that the chosen condensation surface not only performs optimally in terms of efficiency but is also feasible for real-world applications. The goal is to identify the best-performing condensation surface with the feasibility of materials, processes, and geometry. This integrated approach will pave the way for innovative advancements in AWG technology, addressing the critical global issue of freshwater scarcity.


