
Multiphysics Feature-Based State-of-Energy Estimation for LiFePO4 Batteries Using Bidirectional Long Short-Term Memory and Particle Swarm-Optimized Kalman Filter


Abstract
1. Introduction
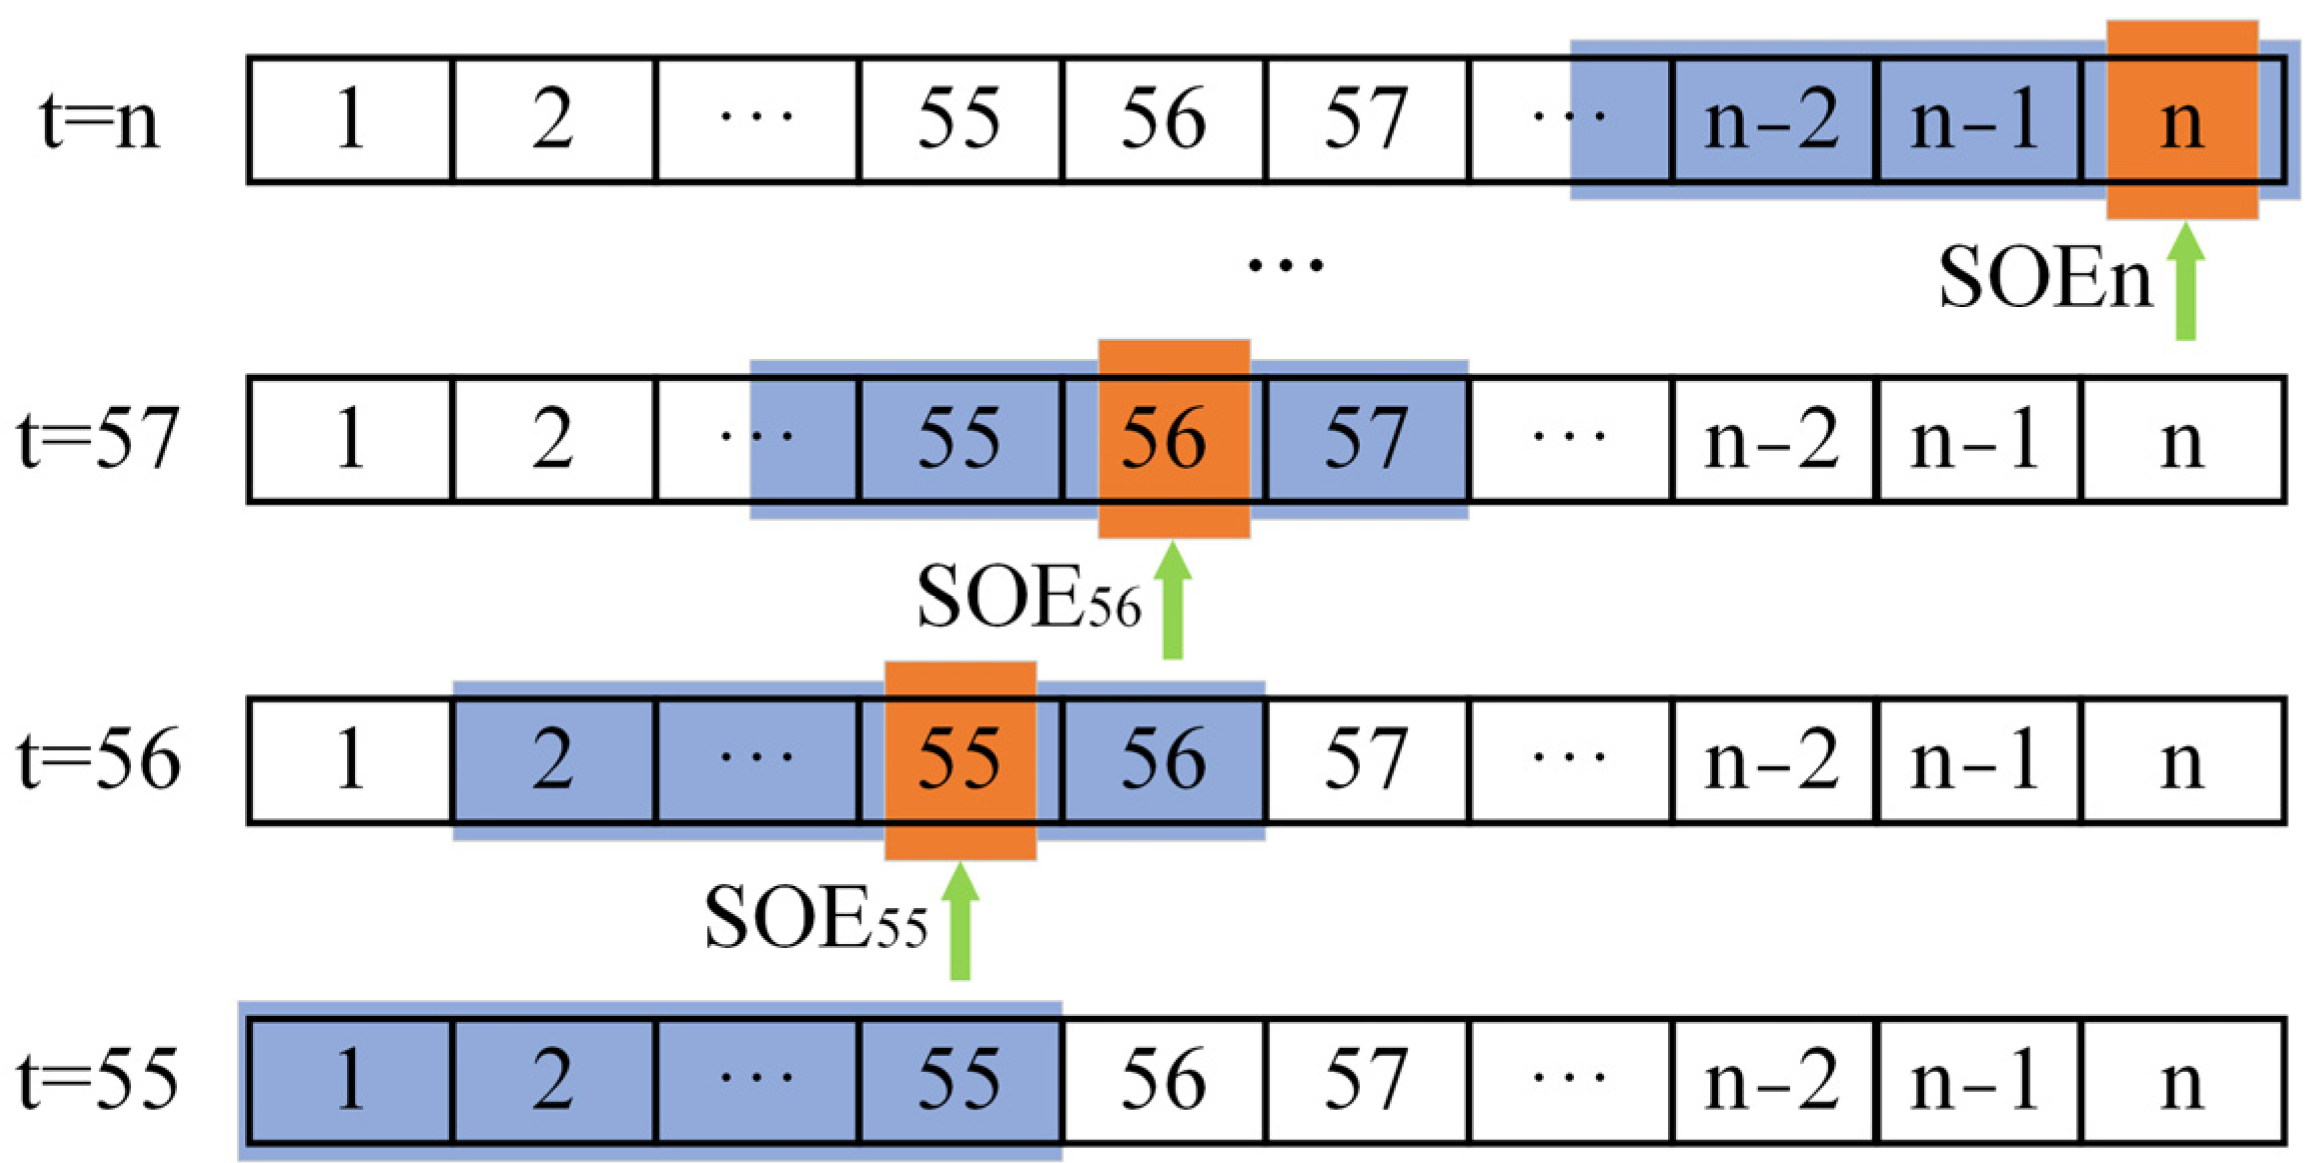
- A sliding window is proposed to make full use of past measurements containing voltage, temperature, current, and mechanical force.
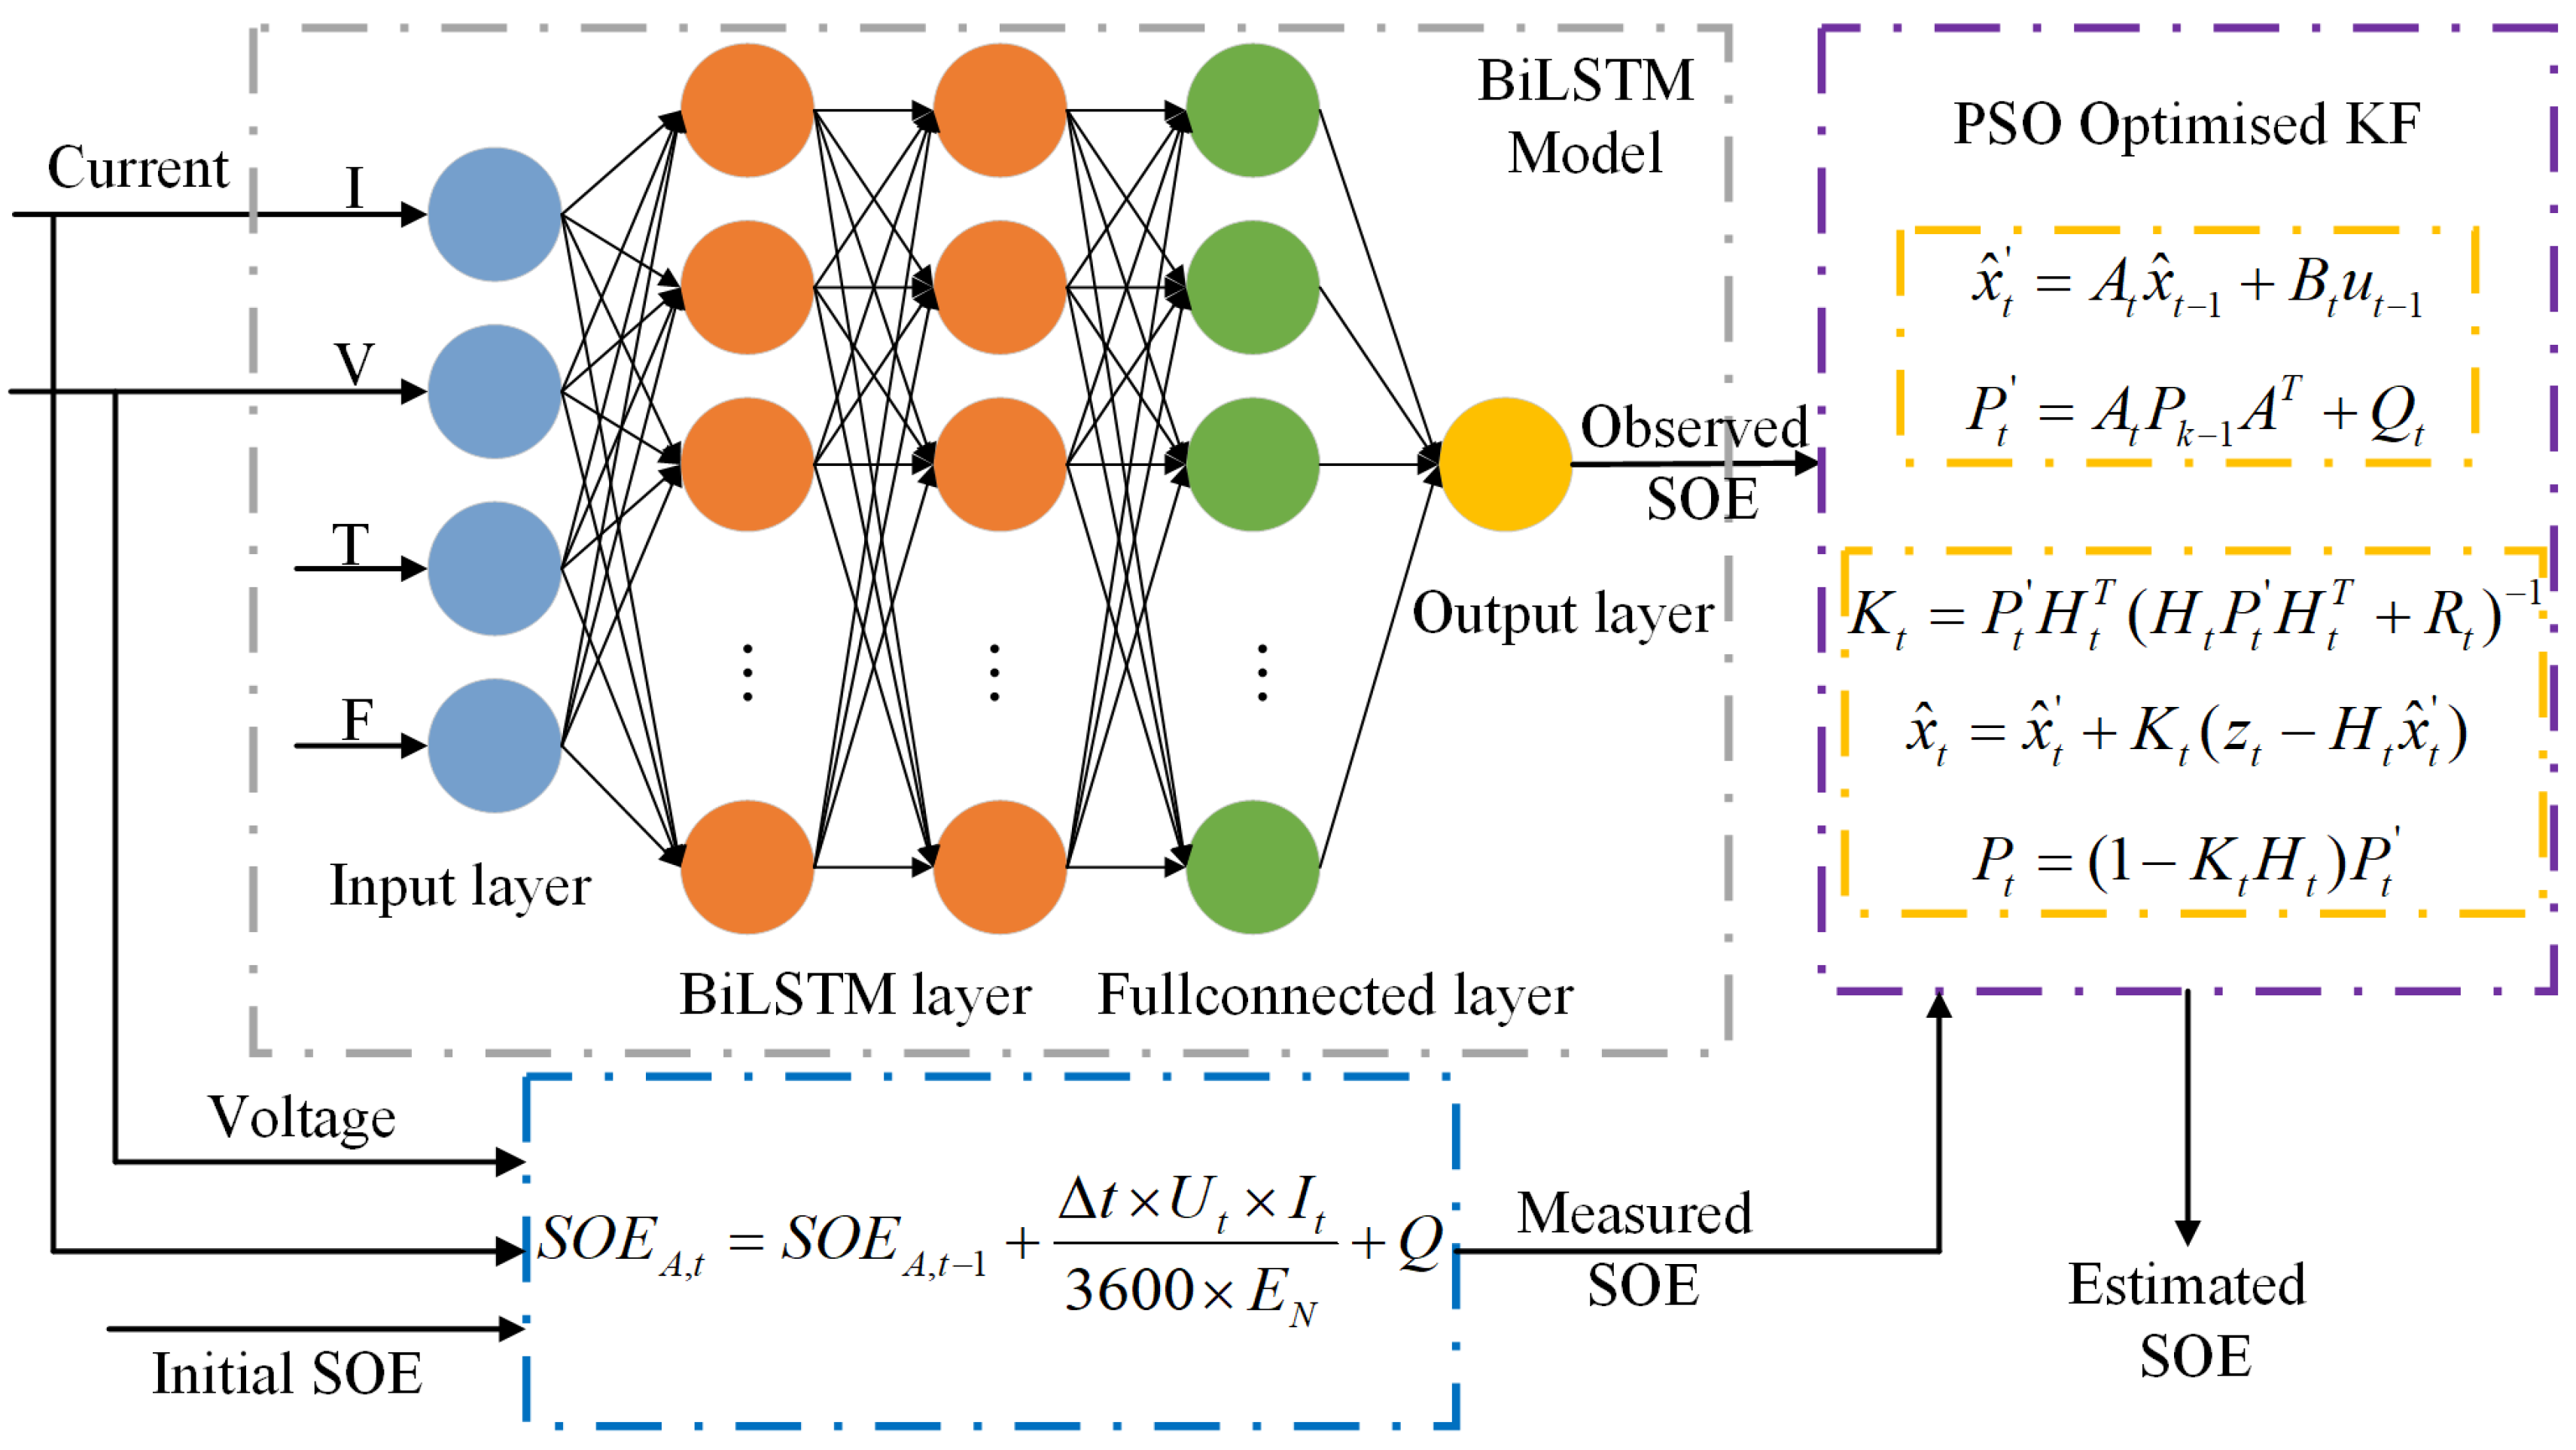
- A BiLSTM with four multiphysics feature inputs is used to obtain preliminary estimation of SOE. The PSO algorithm is introduced to optimize the noise covariance of the KF, thereby minimizing manual parameter adjustments. The optimized KF algorithm then smooths the outputs of BiLSTM, achieving enhanced estimation precision and effectively mitigating noise interference.
- A test bench is established to acquire multiphysics features, including current, voltage, temperature, and mechanical force. The force signal is introduced as a model input feature, which significantly improves the estimation accuracy of SOE during the voltage plateau period.
- The validity of the proposed model and mechanical force signals in high-precision SOE prediction is verified by applying the proposed method to different operating conditions and temperatures. In addition, the comparison of BiLSTM, PSO, and KF (BiLSTM–PSO–KF) with other networks and the prediction results under different preload forces further validate the robustness and generalization performance of the proposed model.
2. Experimental Data Analysis
2.1. Text Platform
2.2. Data Acquisition
2.3. Data Analysis
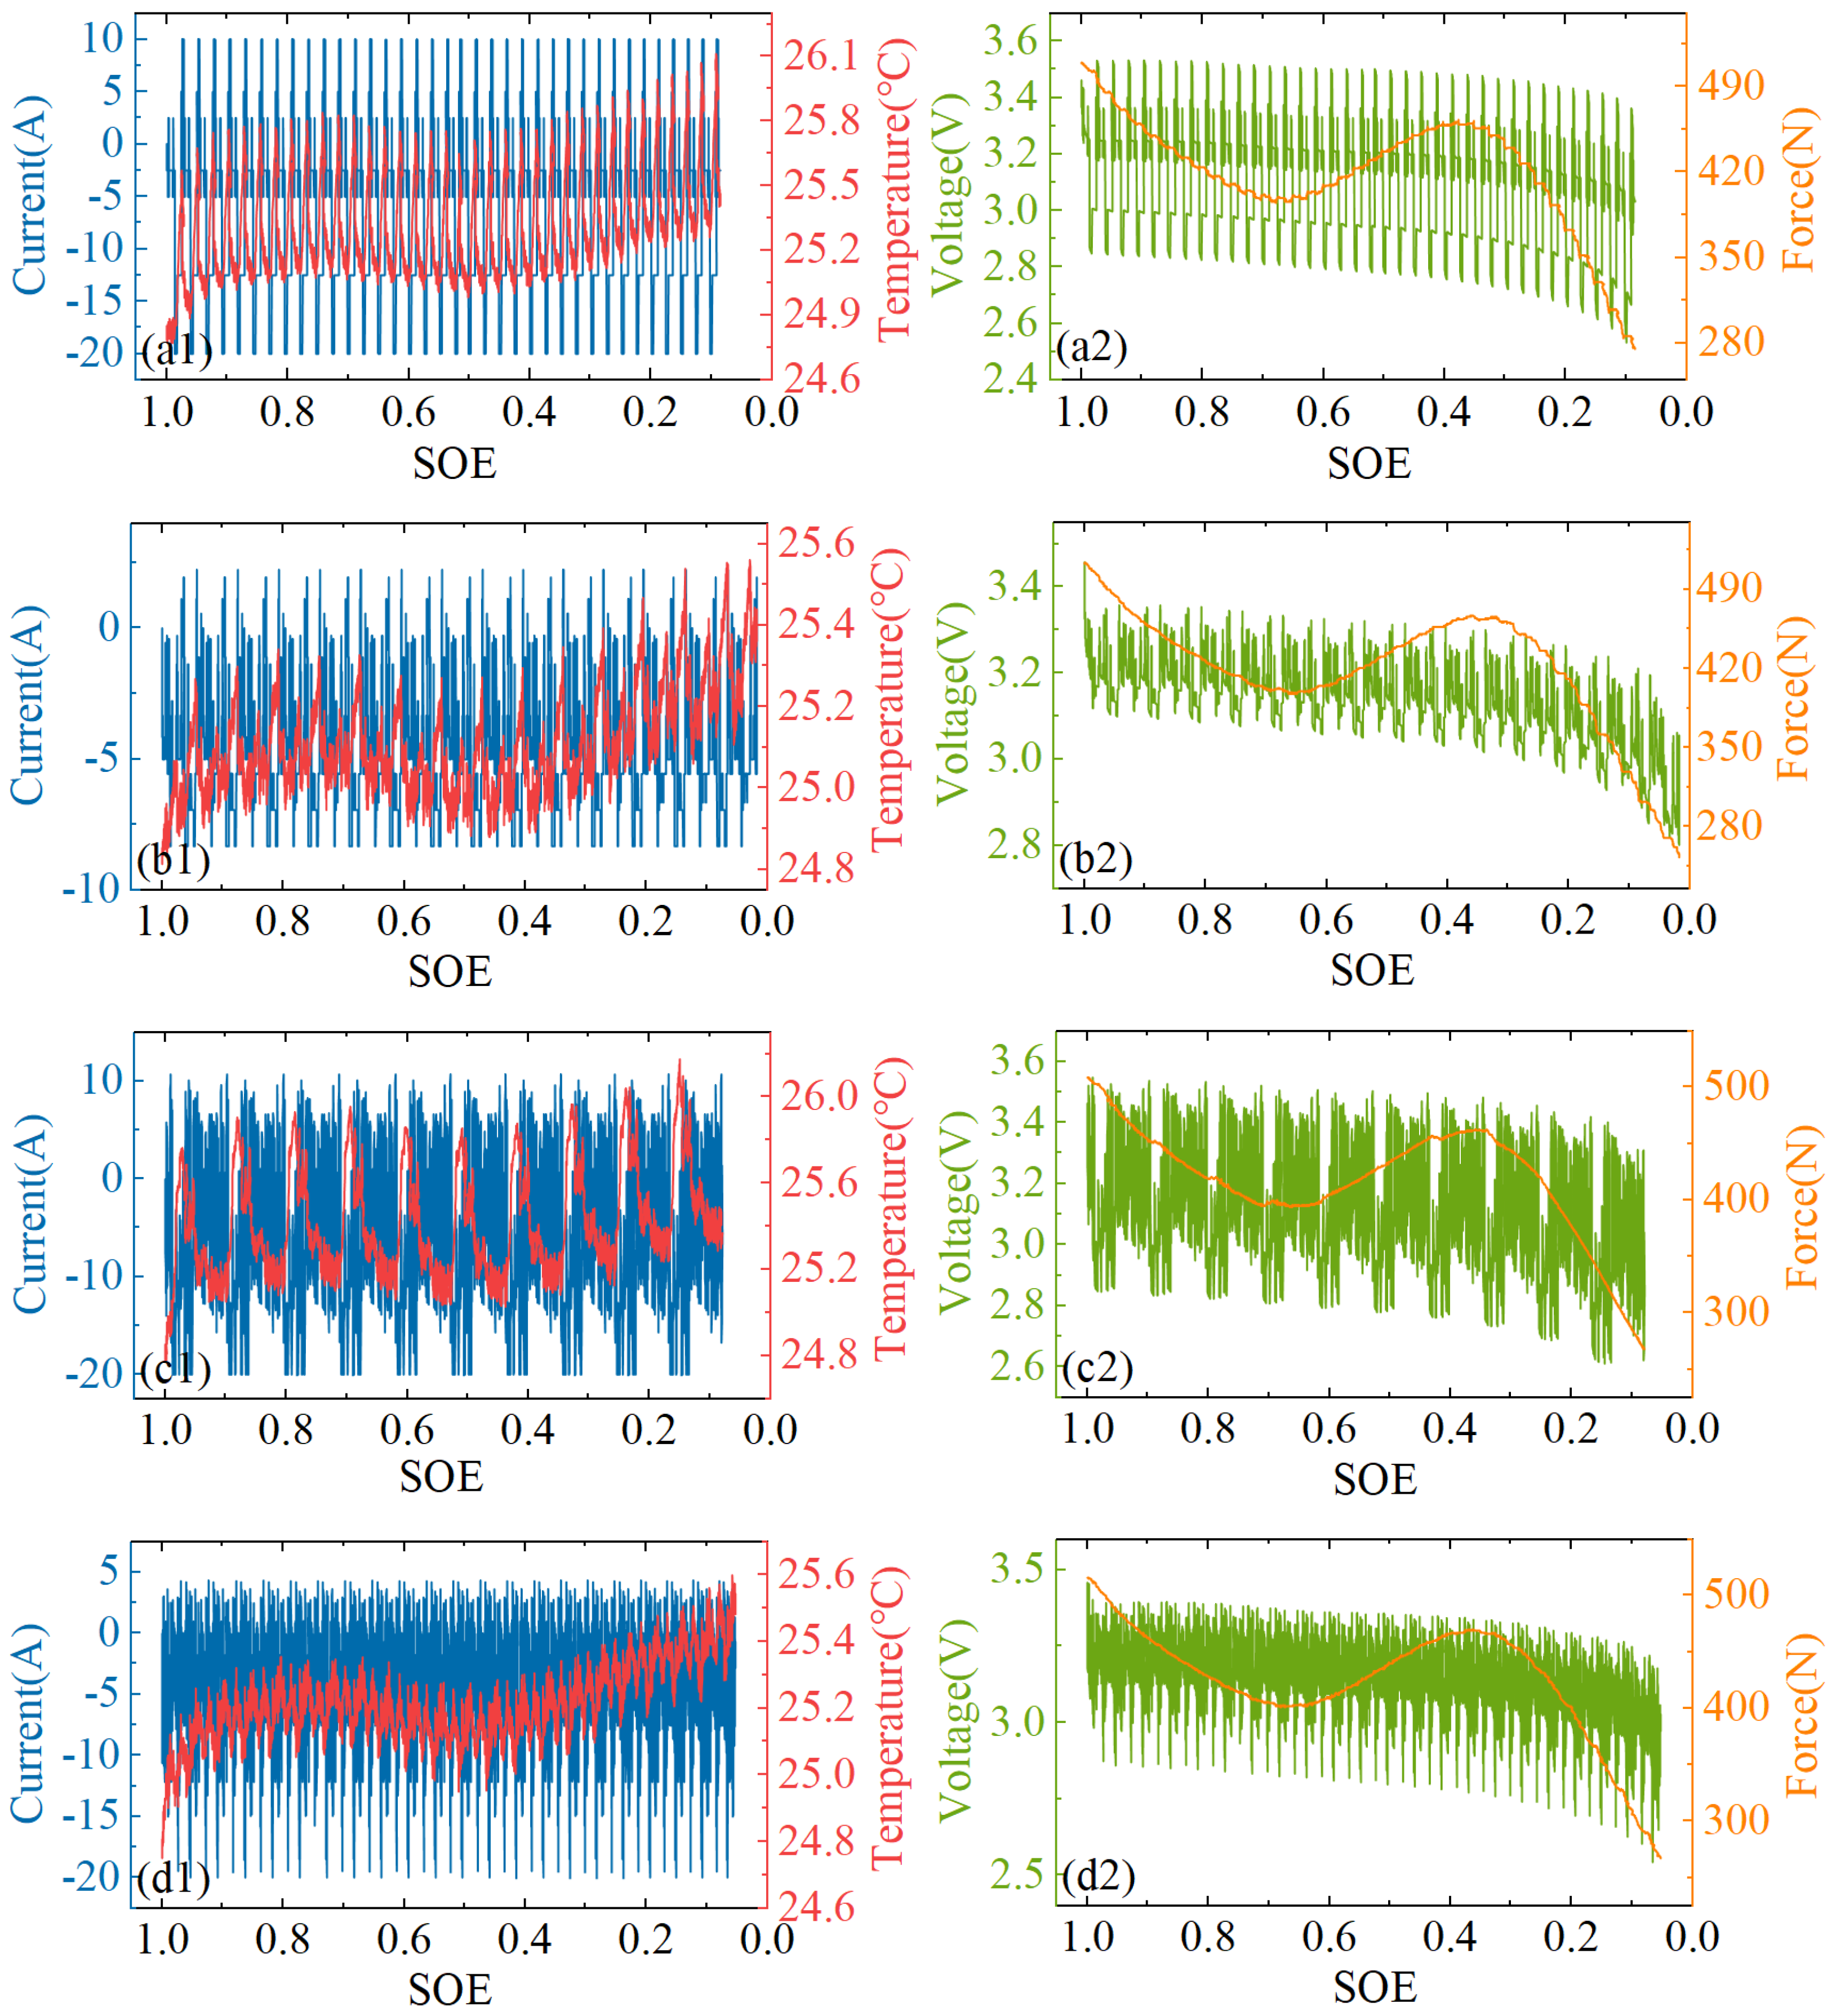
- The voltage and temperature exhibit a strong dependence on the periodically varying current. Both parameters fluctuate significantly with the current within a localized range. In contrast, the mechanical force remains relatively stable in both local variations within a single operating condition and overall variations across different operating conditions.
- Conventional methods utilize voltage, current, and temperature as model inputs to predict the SOE of LFP batteries. However, similar to SOC estimation, these methods suffer from the issue of the voltage plateau, which leads to reduced estimation accuracy. Figure 3(a2–d2) show the overall trend of voltage with a slow decrease in the range of 0.3 to 0.9 SOE, although it fluctuates periodically with the current. In contrast, the curve of mechanical force shows a significant change with an overall decreasing trend, but a reverse peak occurs in the range of 0.3 to 0.6 SOE.
3. Methodology
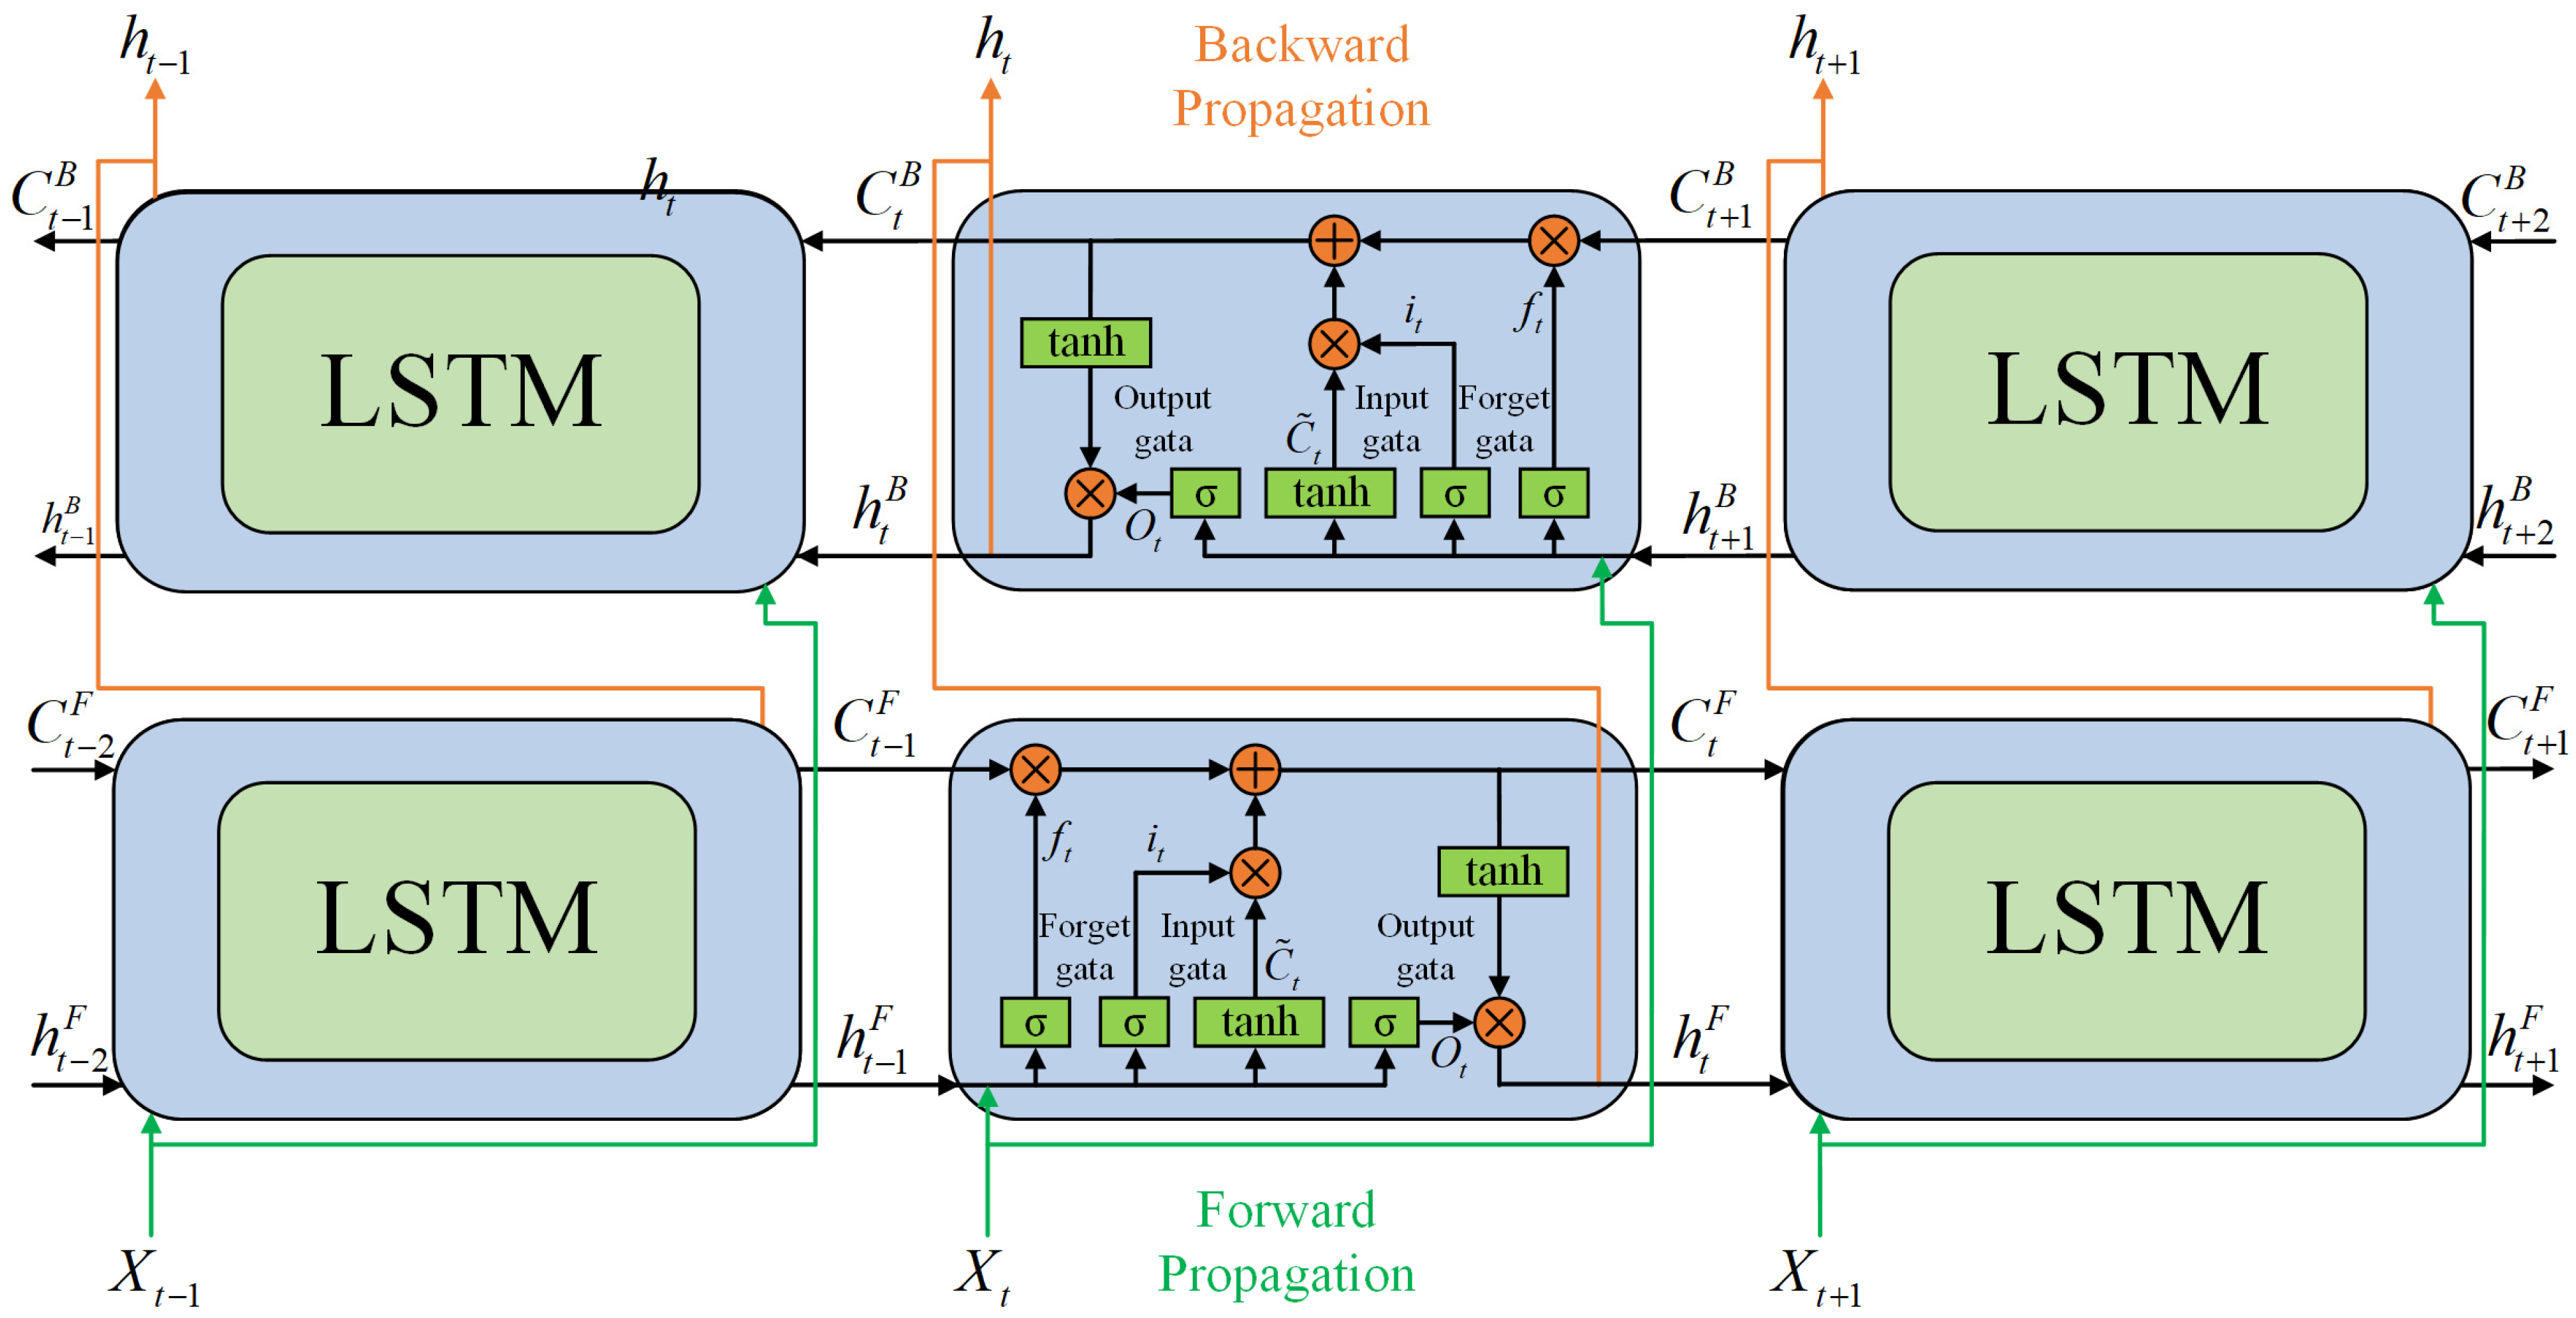
3.1. BiLSTM
3.2. KF
- Initialization process
- 2.
- Prediction progress
- 3.
- Correction process
3.3. PSO
3.4. Training and Evaluation
3.4.1. Model Setup
3.4.2. Evaluation Criteria
3.5. The Fusion Model Framework
4. Results and Discussion
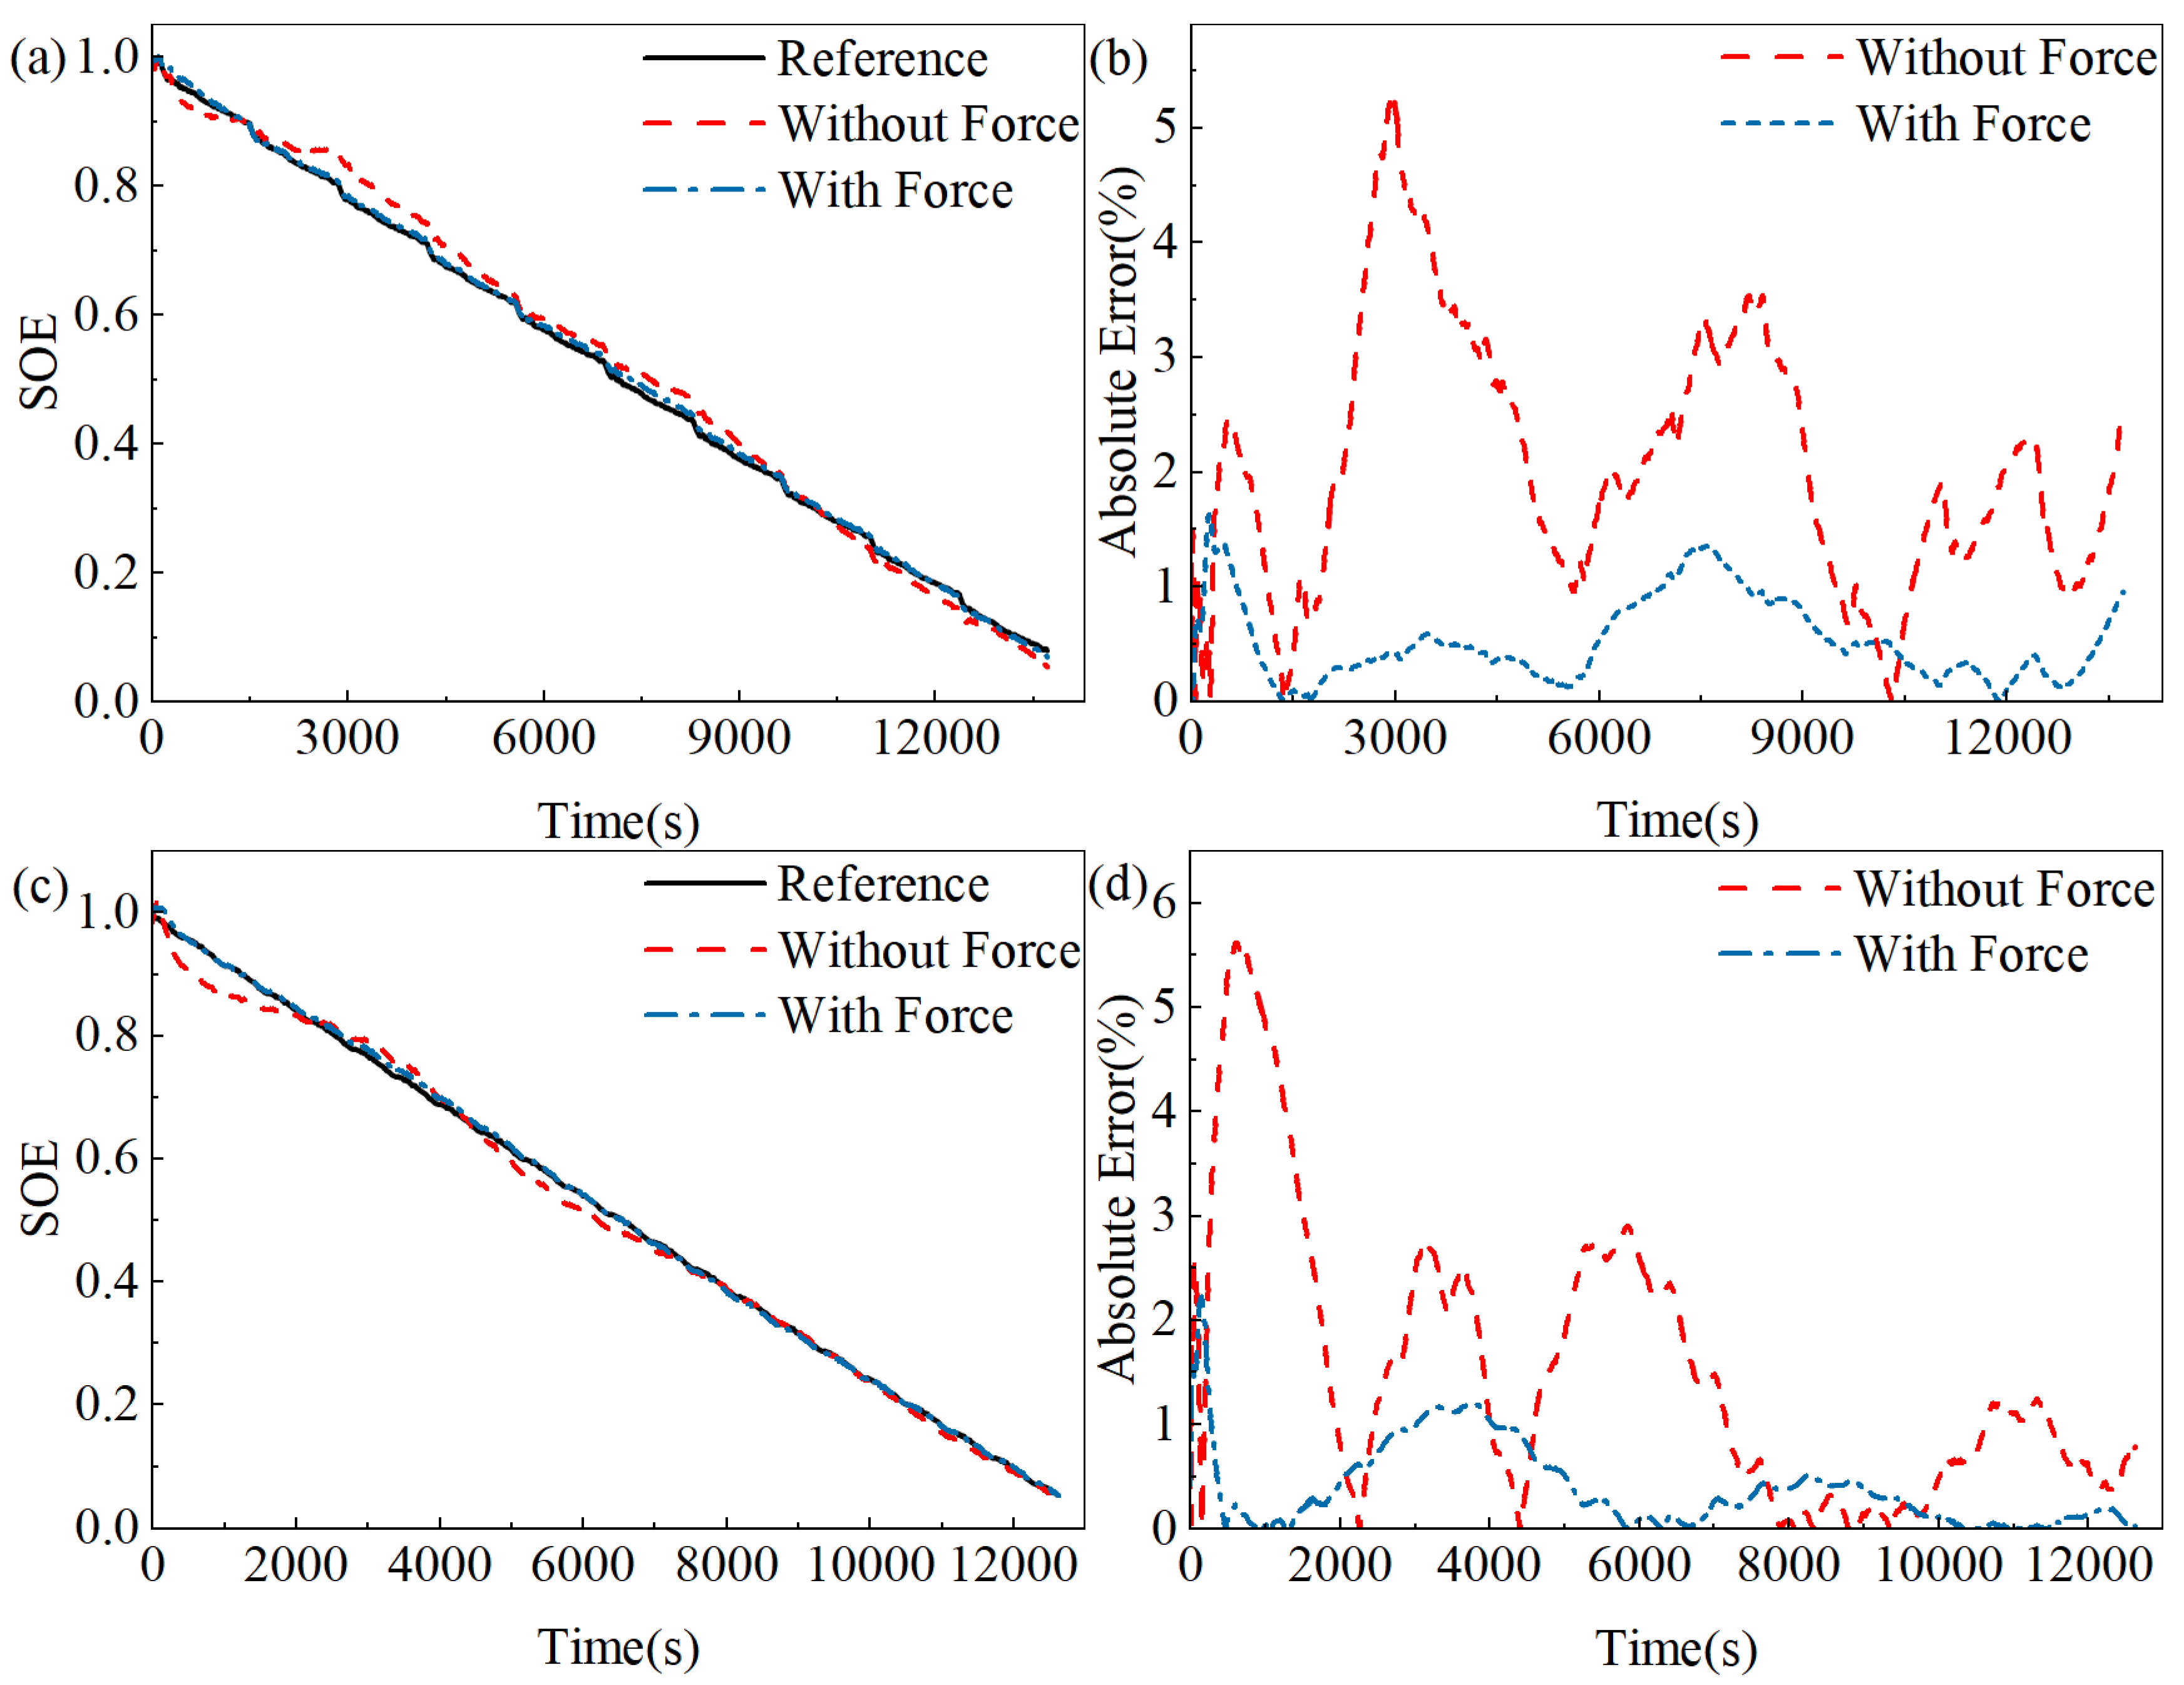
4.1. Comparison of SOE Estimation with Different Operating Conditions
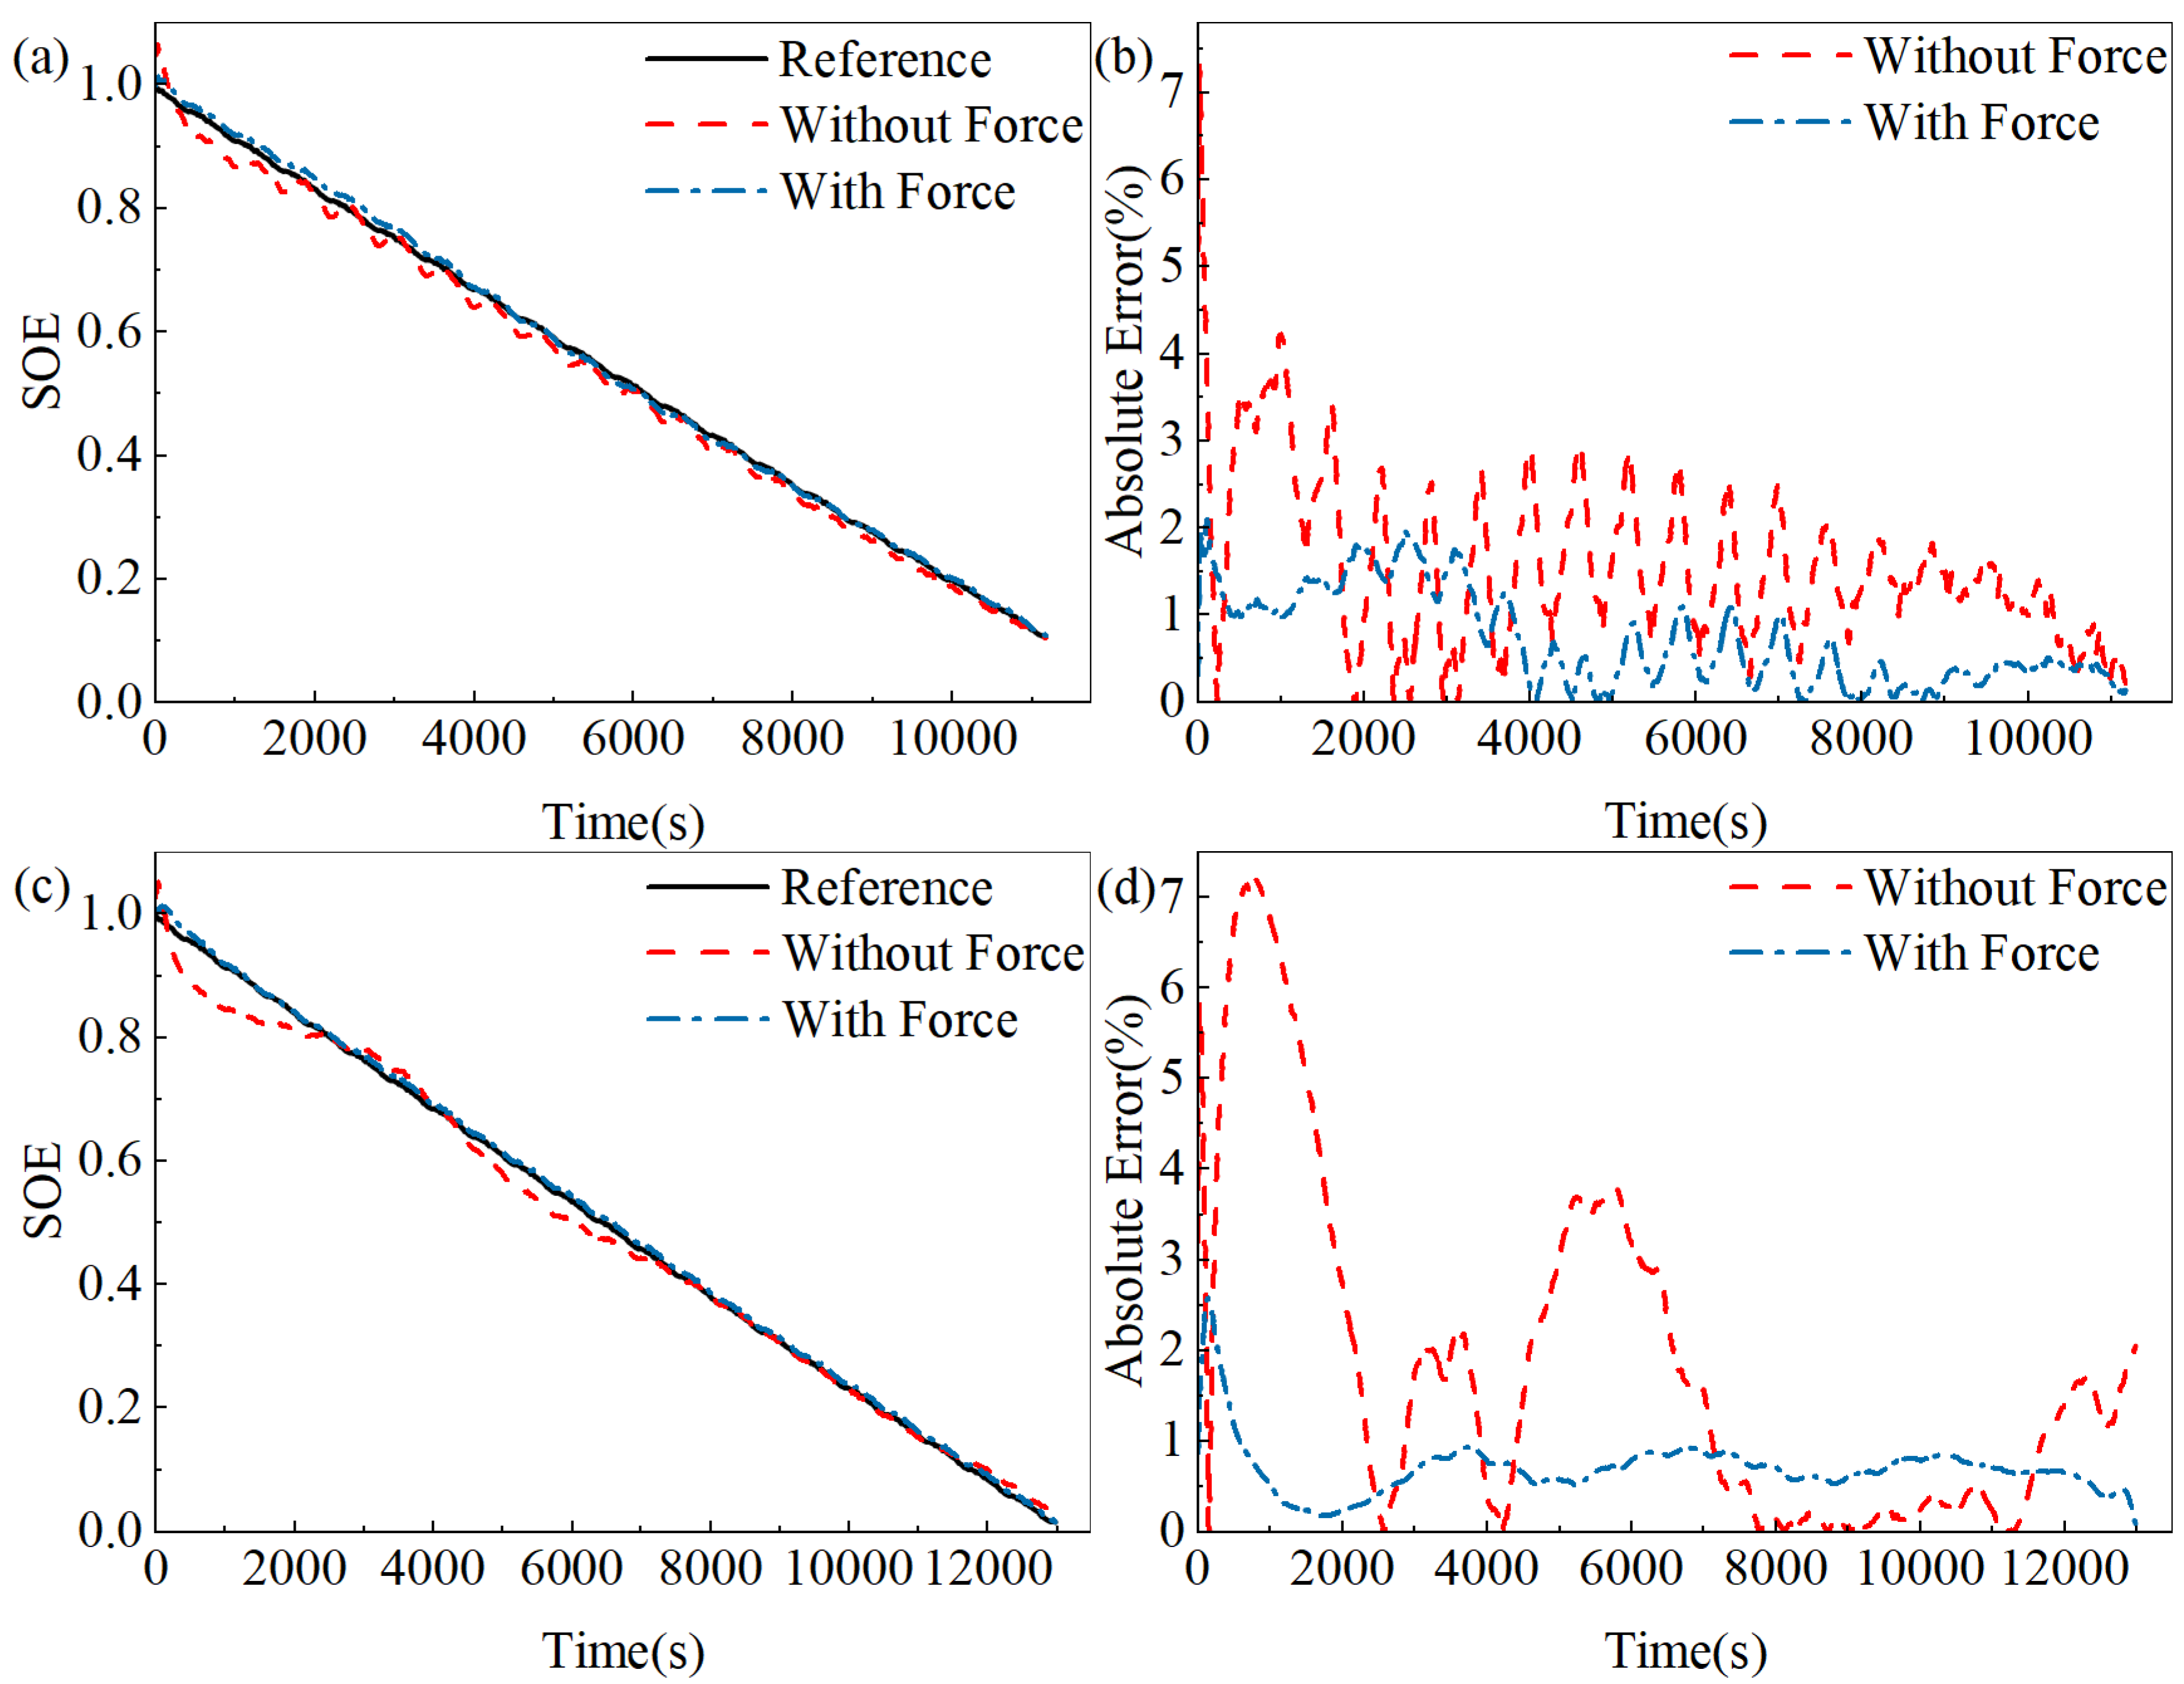
4.2. Comparison of SOE Estimation at Different Temperatures
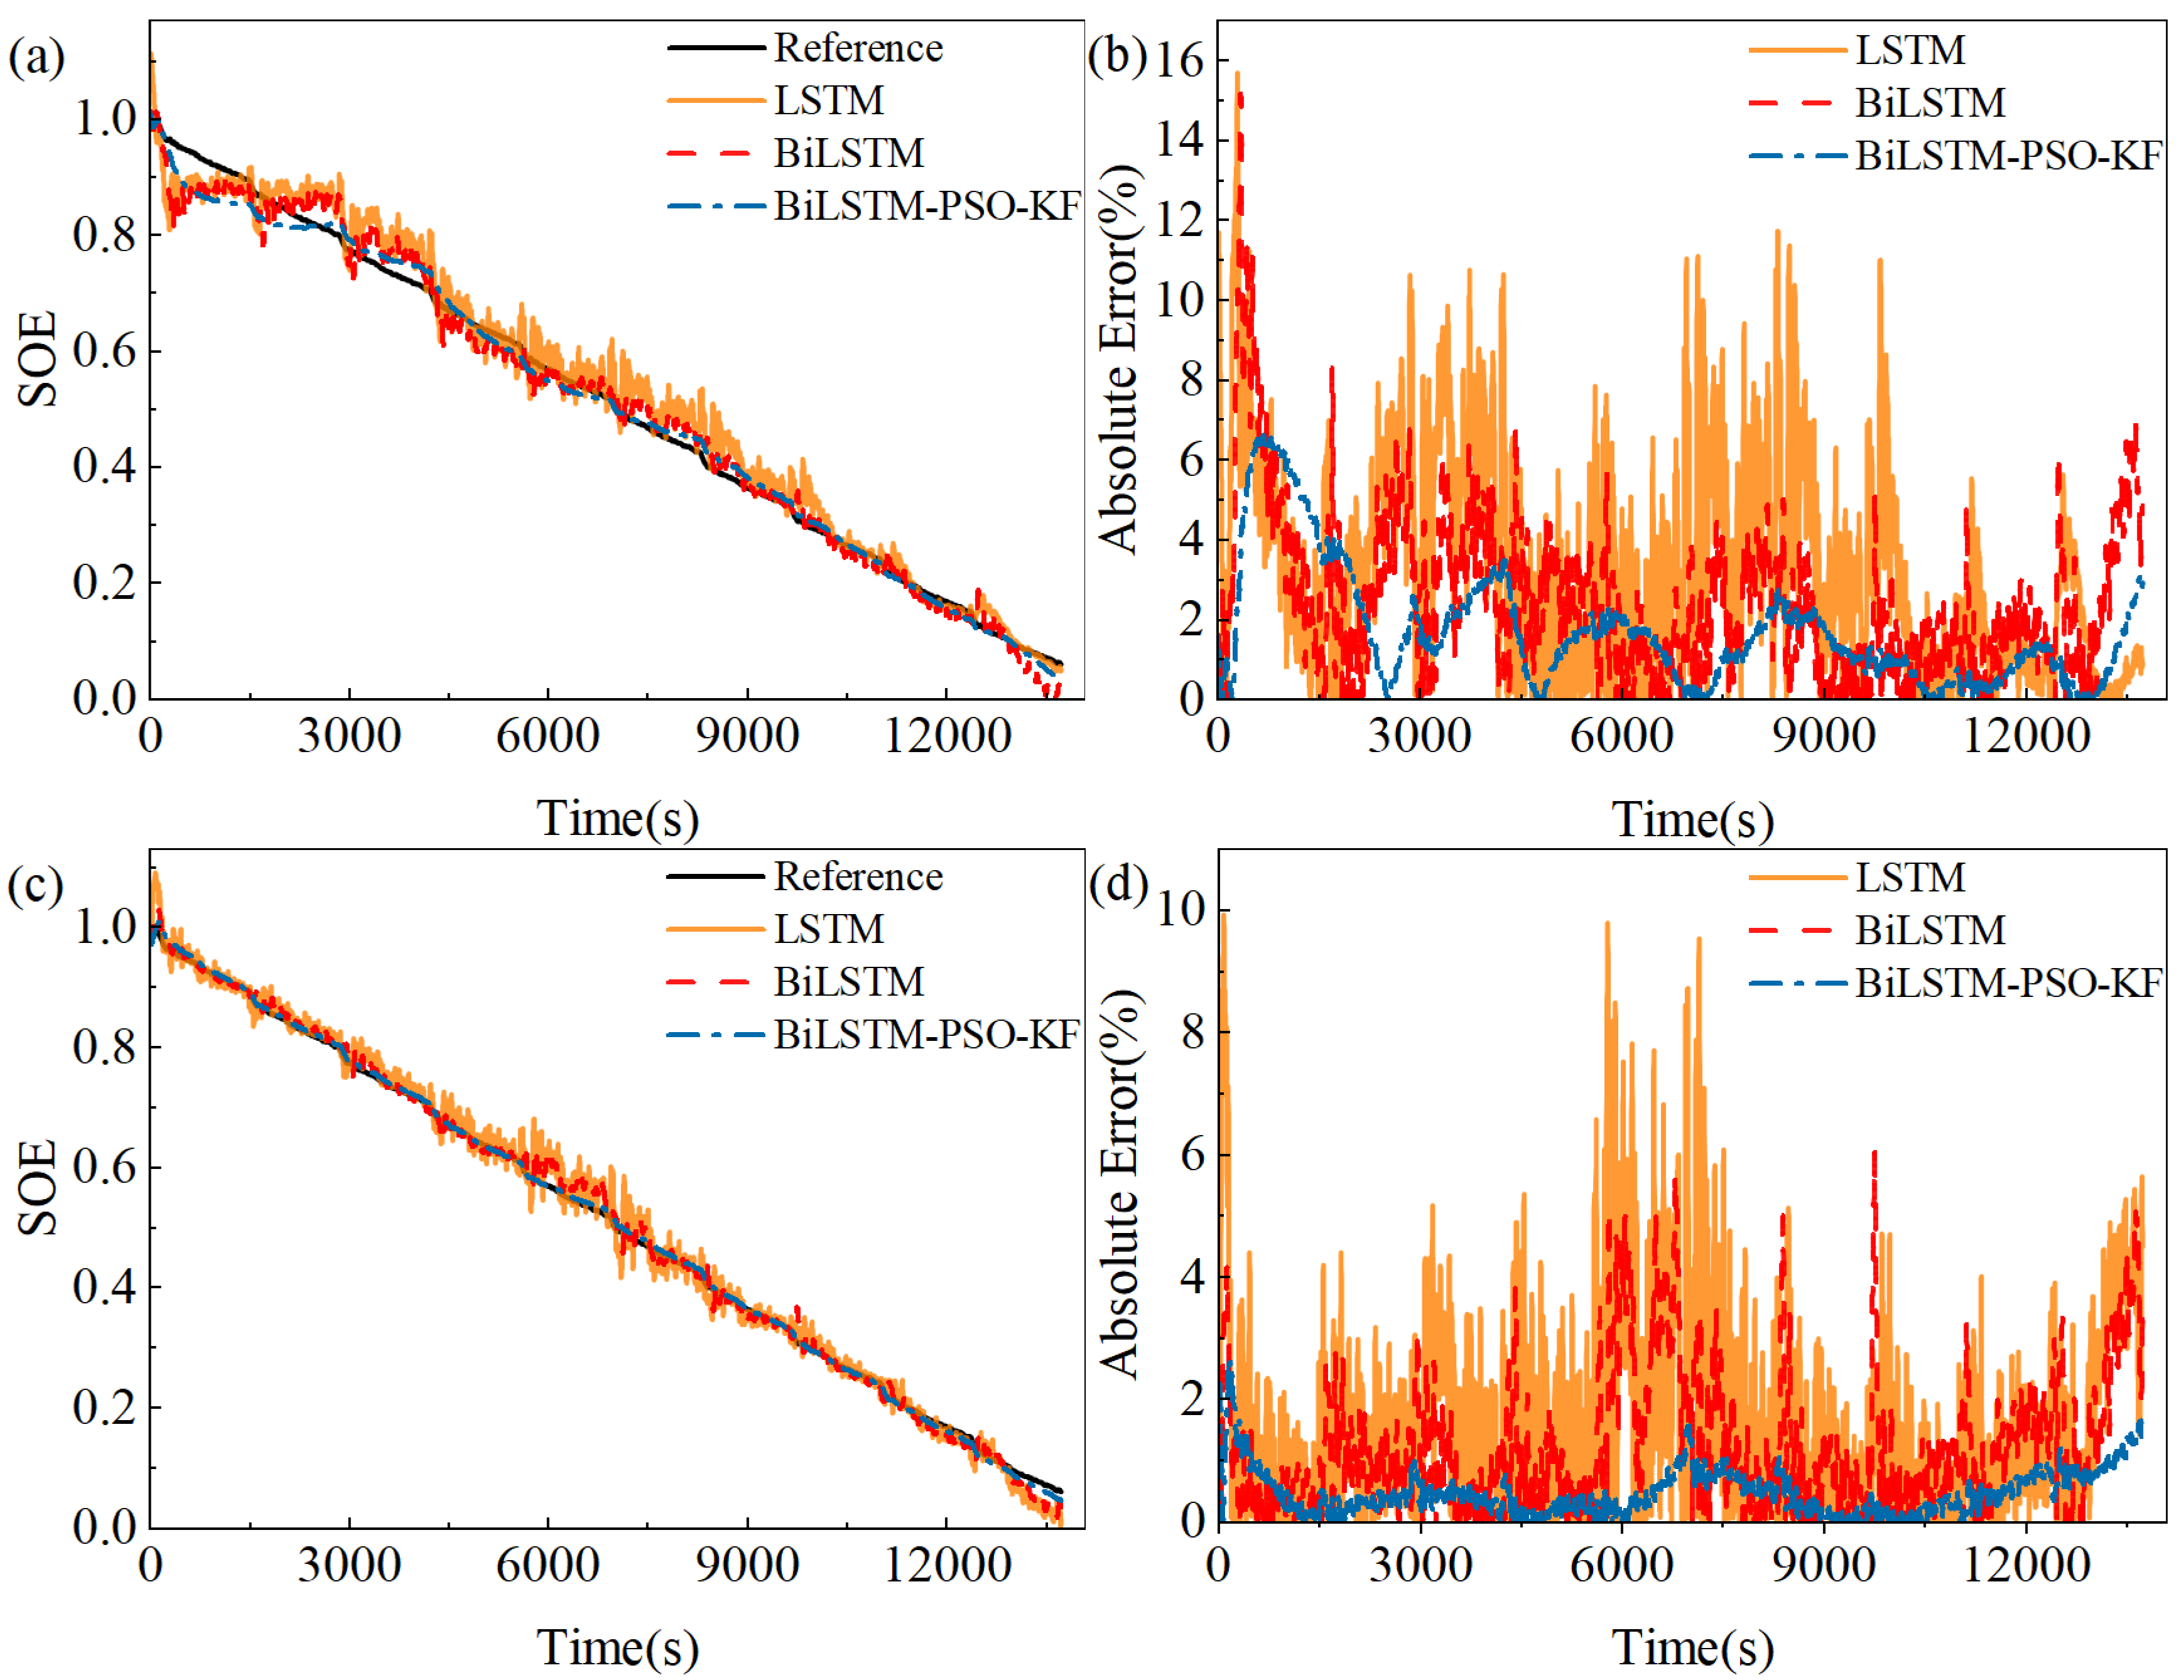
4.3. Comparison of SOE Estimation of Different Models
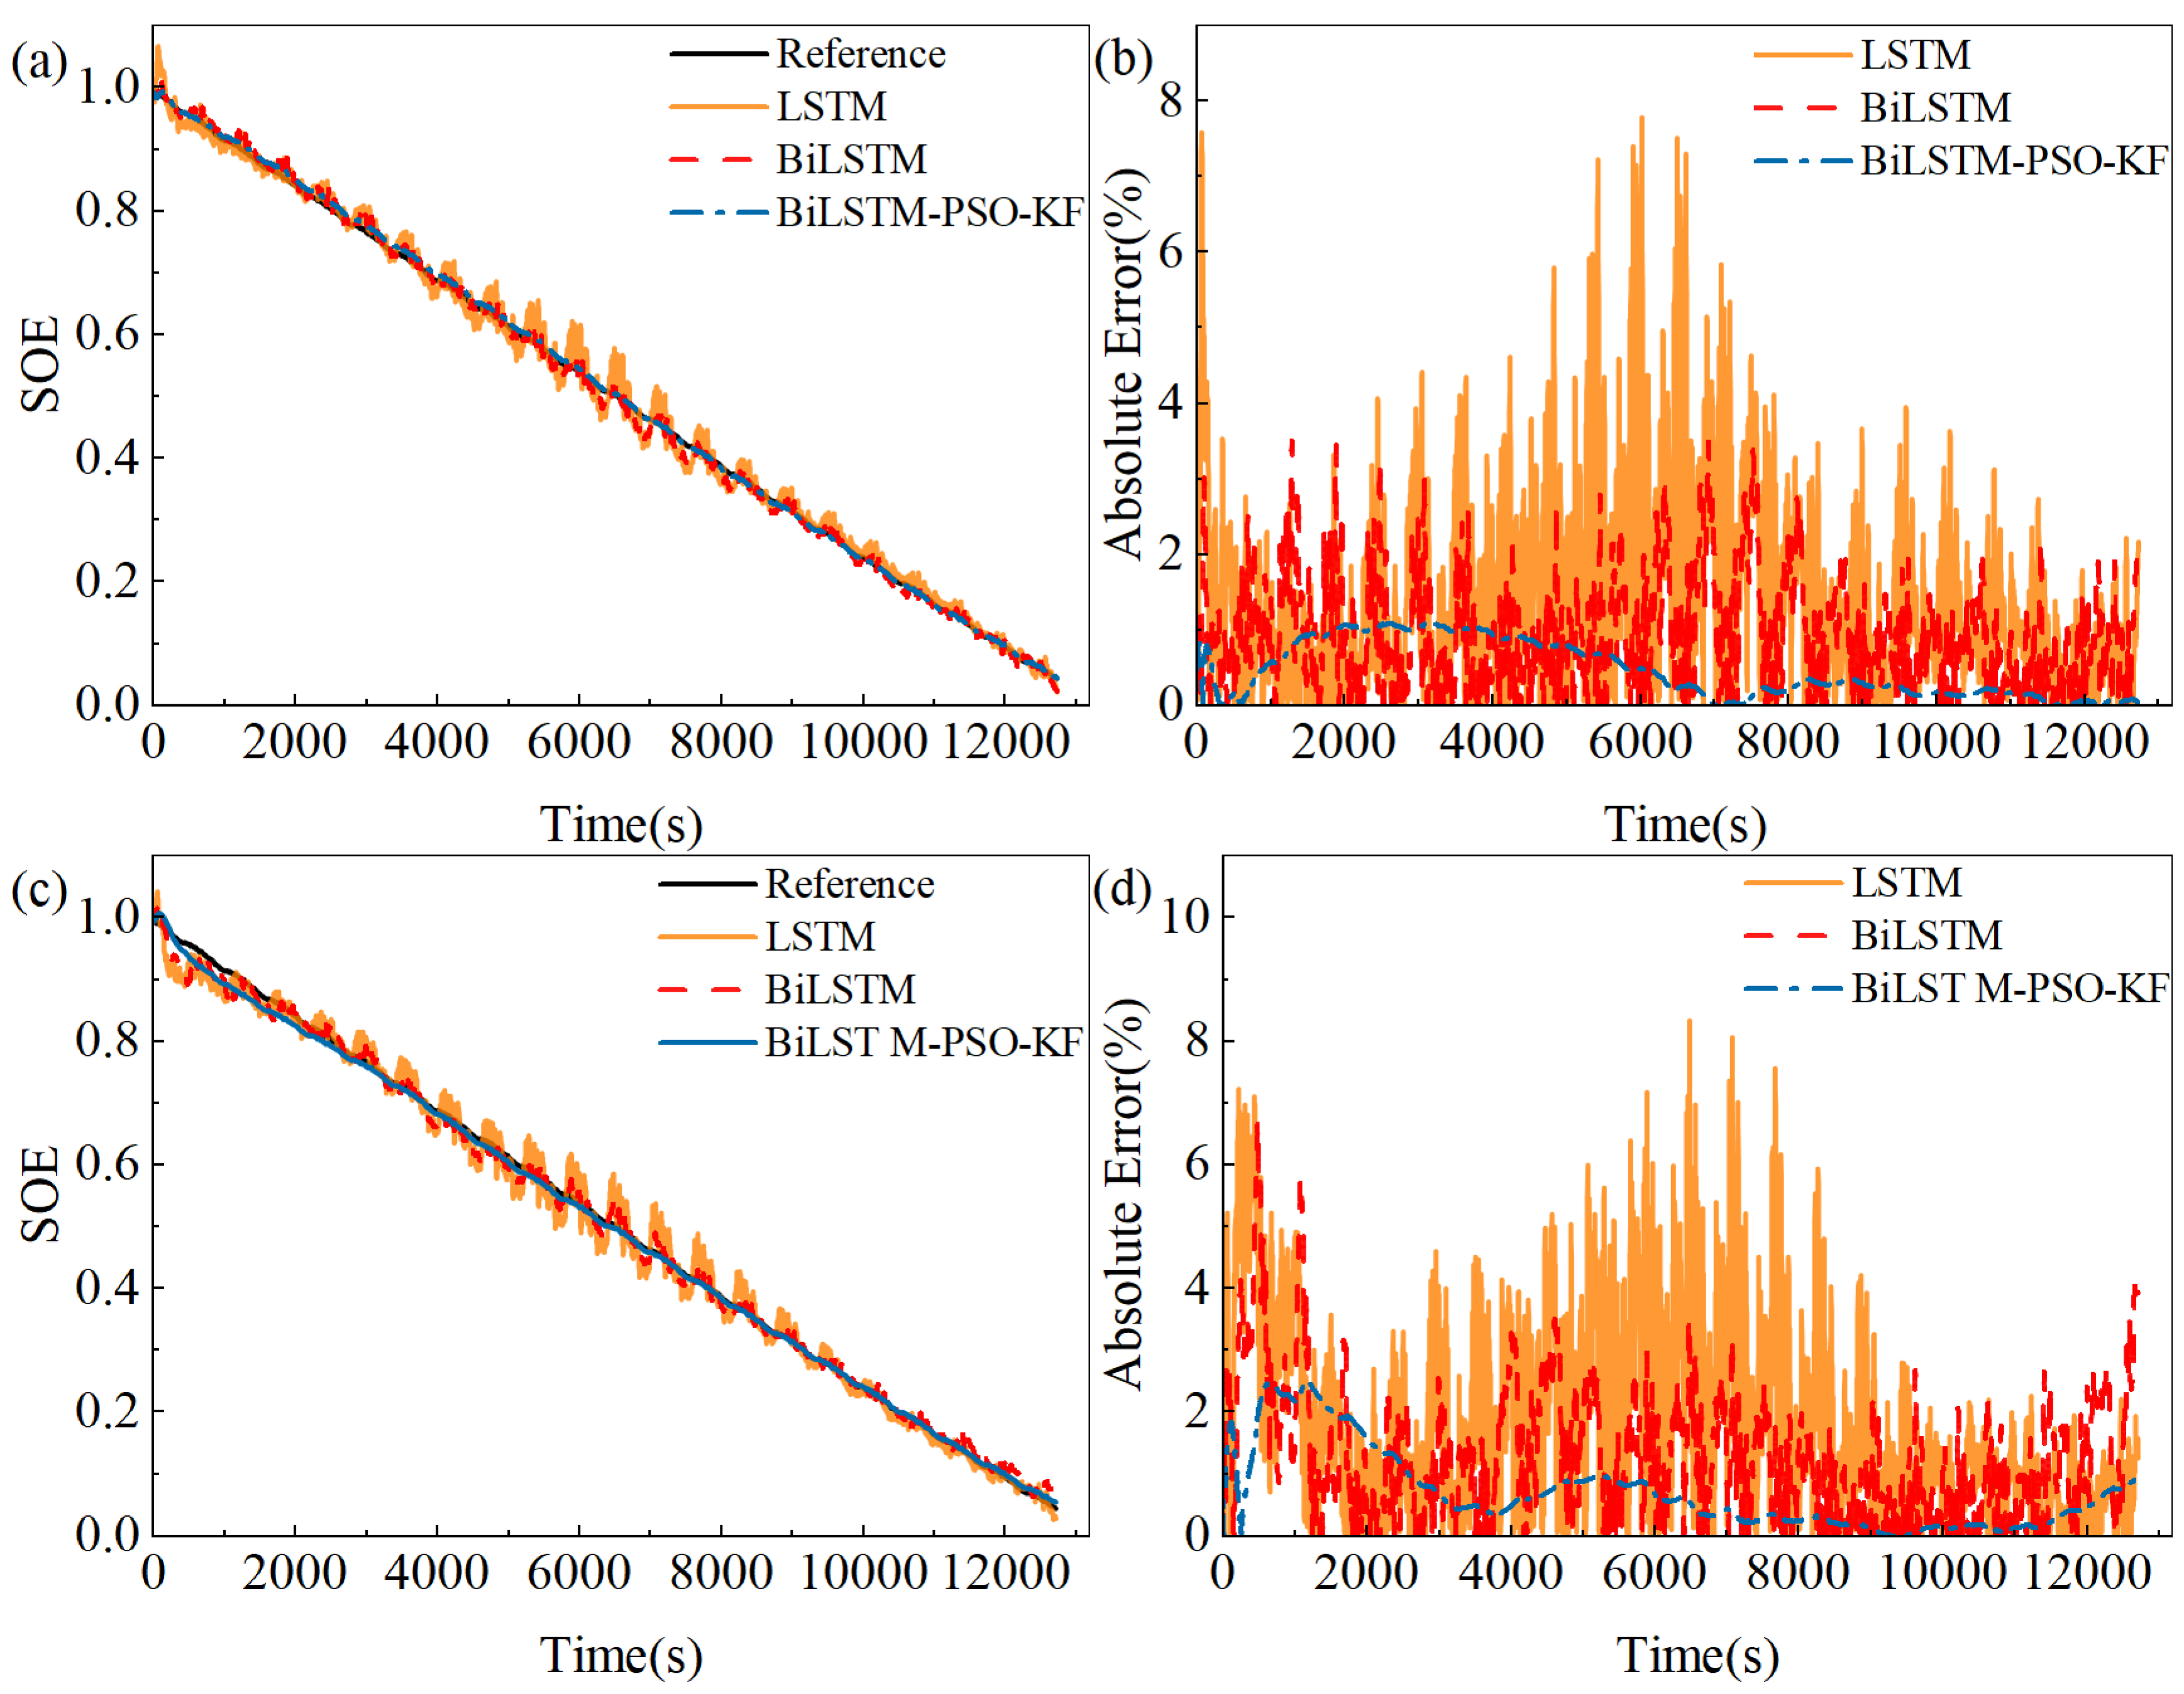
4.4. Comparison of SOE Estimation Under Different Preload Forces
5. Conclusions
Author Contributions
Funding
Institutional Review Board Statement
Informed Consent Statement
Data Availability Statement
Acknowledgments
Conflicts of Interest
References
- Shamsuddoha, M.; Nasir, T. The Road Ahead for Hybrid or Electric Vehicles in Developing Countries: Market Growth, Infrastructure, and Policy Needs. World Electr. Veh. J. 2025, 16, 180. [Google Scholar] [CrossRef]
- Wang, S.; Qiu, P.; Feng, Y.; Jin, X. Optimal Configuration Strategy of PV and ESS for Enhancing the Regulation Capability of Electric Vehicles Under the Scenario of Orderly Power Utilization. Energies 2025, 18, 1530. [Google Scholar] [CrossRef]
- Jin, G.; Zhao, W.; Zhang, J.; Liang, W.; Chen, M.; Xu, R. High-Temperature Stability of LiFePO4/Carbon Lithium-Ion Batteries: Challenges and Strategies. Sustain. Chem. 2025, 6, 7. [Google Scholar] [CrossRef]
- Qian, C.; Guan, H.; Xu, B.; Xia, Q.; Sun, B.; Ren, Y.; Wang, Z. A CNN-SAM-LSTM hybrid neural network for multi-state estimation of lithium-ion batteries under dynamical operating conditions. Energy 2024, 294, 130764. [Google Scholar] [CrossRef]
- Wu, F.; Wang, S.; Liu, D.; Cao, W.; Fernandez, C.; Huang, Q. An improved convolutional neural network-bidirectional gated recurrent unit algorithm for robust state of charge and state of energy estimation of new energy vehicles of lithium-ion batteries. J. Energy Storage 2024, 82, 110574. [Google Scholar] [CrossRef]
- Zhang, Z.; Yu, W.; Yan, Z.; Zhu, W.; Li, H.; Liu, Q.; Guan, Q.; Tan, N. State of charge estimation of lithium-ion batteries using a fractional-order multi-dimensional Taylor network with adaptive Kalman filter. Energy 2025, 316, 134577. [Google Scholar] [CrossRef]
- Shrivastava, P.; Soon, T.K.; Idris, M.Y.I.B.; Mekhilef, S.; Adnan, S.B.R.S. Combined State of Charge and State of Energy Estimation of Lithium-Ion Battery Using Dual Forgetting Factor-Based Adaptive Extended Kalman Filter for Electric Vehicle Applications. IEEE Trans. Veh. Technol. 2021, 70, 1200–1215. [Google Scholar] [CrossRef]
- Xia, L.; Wang, S.; Yu, C.; Fan, Y.; Li, B.; Xie, Y. Joint estimation of the state-of-energy and state-of-charge of lithium-ion batteries under a wide temperature range based on the fusion modeling and online parameter prediction. J. Energy Storage 2022, 52, 105010. [Google Scholar] [CrossRef]
- Lai, X.; Weng, J.; Huang, Y.; Yuan, M.; Yao, Y.; Han, X.; Zheng, Y. A joint state-of-health and state-of-energy estimation method for lithium-ion batteries through combining the forgetting factor recursive least squares and unscented Kalman filter. Measurement 2022, 205, 112187. [Google Scholar] [CrossRef]
- Kong, L.; Luo, Y.; Fang, S.; Niu, T.; Chen, G.; Yang, L.; Liao, R. State Estimation of Lithium-ion Battery for Shipboard Applications: Key Challenges and Future Trends. Green Energy Intell. Transp. 2024, 4, 100192. [Google Scholar] [CrossRef]
- Shrivastava, P.; Naidu, P.A.; Sharma, S.; Panigrahi, B.K.; Garg, A. Review on technological advancement of lithium-ion battery states estimation methods for electric vehicle applications. J. Energy Storage 2023, 64, 107159. [Google Scholar] [CrossRef]
- Zhang, C.; Zhang, Y.; Li, Z.; Zhang, Z.; Nazir, M.S.; Peng, T. Enhancing state of charge and state of energy estimation in Lithium-ion batteries based on a TimesNet model with Gaussian data augmentation and error correction. Appl. Energy 2024, 359, 122669. [Google Scholar] [CrossRef]
- Ma, L.; Hu, C.; Cheng, F. State of Charge and State of Energy Estimation for Lithium-Ion Batteries Based on a Long Short-Term Memory Neural Network. J. Energy Storage 2021, 37, 102440. [Google Scholar] [CrossRef]
- Mou, J.; Zhou, W.; Yu, C.; Fu, Q.; Wang, B.; Wang, Y.; Li, J. A data-driven SOE estimation framework for lithium-ion batteries under drive cycle conditions over wide temperature range. Energy 2025, 318, 134658. [Google Scholar] [CrossRef]
- Wu, F.; Wang, S.; Cao, W.; Long, T.; Liang, Y.; Fernandez, C. An improved long short-term memory based on global optimization square root extended Kalman smoothing algorithm for collaborative state of charge and state of energy estimation of lithium-ion batteries. Int. J. Circuit Theory Appl. 2023, 51, 3880–3896. [Google Scholar] [CrossRef]
- Bao, X.; Chen, L.; Lopes, A.M.; Wang, S.; Chen, Y.; Li, P. Joint estimation of state-of-charge and state-of-energy of lithium-ion batteries at different ambient temperatures based on domain adaptation and unscented Kalman filter. Electr. Power Syst. Res. 2024, 231, 110284. [Google Scholar] [CrossRef]
- Chen, Y.; Duan, W.; Huang, X.; Wang, S. Multi-output fusion SOC and SOE estimation algorithm based on deep network migration. Energy 2024, 308, 133032. [Google Scholar] [CrossRef]
- Jiang, B.; Tao, S.; Wang, X.; Zhu, J.; Wei, X.; Dai, H. Mechanics-based state of charge estimation for lithium-ion pouch battery using deep learning technique. Energy 2023, 278, 127890. [Google Scholar] [CrossRef]
- Mukhopadhyay, A.; Sheldon, B.W. Deformation and stress in electrode materials for Li-ion batteries. Prog. Mater. Sci. 2014, 63, 58–116. [Google Scholar] [CrossRef]
- Huang, S.; Fan, F.; Li, J.; Zhang, S.; Zhu, T. Stress generation during lithiation of high-capacity electrode particles in lithium ion batteries. Acta Mater. 2013, 61, 4354–4364. [Google Scholar] [CrossRef]
- Zhou, J.; Li, B.; Xie, L.; Han, Q.; Qiu, X.; Cao, X.; Zhu, L. Progress in optimizing the application strategy of SEI membranes for HC sodium ion batteries. J. Energy Storage 2024, 104, 114443. [Google Scholar] [CrossRef]
- Tang, S.; Liang, Y.; Zhong, C.; Peng, Y.; Hu, Y.; Hu, W.; Liao, Y.; Lin, J.; Yang, X.; Zhang, H.; et al. Revisiting the overdischarge process as a novel accelerated aging method for LiFePO4/Graphite batteries through the unveiling of SEI evolution mechanism. Energy Storage Mater. 2025, 74, 103916. [Google Scholar] [CrossRef]
- Zhang, Y.; Tan, X.; Wang, Z. Stat-of-charge estimation for lithium-ion batteries based on recurrent neural network: Current status and perspectives. J. Energy Storage 2025, 112, 115575. [Google Scholar] [CrossRef]
- Chen, J.; Zhang, Y.; Wu, J.; Cheng, W.; Zhu, Q. SOC estimation for lithium-ion battery using the LSTM-RNN with extended input and constrained output. Energy 2023, 262, 125375. [Google Scholar] [CrossRef]
- Jiao, M.; Wang, D.; Qiu, J. A GRU-RNN based momentum optimized algorithm for SOC estimation. J. Power Sources 2020, 459, 228051. [Google Scholar] [CrossRef]
- Long, T.; Wang, S.; Cao, W.; Zhou, H.; Fernandez, C.; Wang, Y. A novel M-1 structured Bidirectional Long Short Term Memory-Rauch Tung Striebel Smoothing algorithm for the joint estimation State of Charge and multi-constrained sustained peak power of lithium-ion batteries. J. Energy Storage 2023, 67, 107576. [Google Scholar] [CrossRef]
- Jafari, S.; Kim, J.; Byun, Y.-C. A novel fusion-based deep learning approach with PSO and explainable AI for batteries State of Charge estimation in Electric Vehicles. Energy Rep. 2024, 12, 3364–3385. [Google Scholar] [CrossRef]
- Chen, L.; He, M.; Wu, S.; Chen, D.; Zhao, M.; Pan, H. Multi-algorithm fusion-based state of energy assessment of retired lithium-ion batteries. J. Energy Storage 2025, 105, 114690. [Google Scholar] [CrossRef]
- Tian, A.; Wang, Y.; Yu, H.; Gao, Y.; Wang, L.; Lv, L.; Chang, C.; Liao, L.; Jiang, J. A novelty state of charge estimation framework for LiFePO4 batteries considering multi-dimensional features selection. J. Energy Storage 2024, 101, 113829. [Google Scholar] [CrossRef]
- Liu, M.; Xu, J.; Jiang, Y.; Mei, X. Multi-dimensional features based data-driven state of charge estimation method for LiFePO4 batteries. Energy 2023, 274, 127407. [Google Scholar] [CrossRef]


| Item | LFP Battery |
|---|---|
| Cathode | LiFePO4 |
| Anode | Graphite |
| Nominal capacity | 10 Ah |
| Nominal voltage | 3.2 V |
| Charge cutoff voltage/discharge voltage | 3.65 V/2.5 V |
| Size (H/W/L) | 135/68/13 mm |
| Brand | Dingshan New Energy Co., Ltd., Guiyang, China |
| Model code | 1368135-10 Ah |
| Production date | 13 January 2024 |
| Training Data | Test Data | RMSE% | MAXE% | MAE% |
|---|---|---|---|---|
| DST, BJDST (without force) | FUDS | 2.35 | 5.34 | 2.06 |
| US06 | 2.02 | 5.62 | 1.50 | |
| DST, BJDST (with force) | FUDS | 0.64 | 1.64 | 0.53 |
| US06 | 0.56 | 2.22 | 0.39 |
| Training Data | Test Data | RMSE% | MAXE% | MAE% |
|---|---|---|---|---|
| DST, BJDST (without force) | US06 (15 °C) | 1.85 | 7.32 | 1.58 |
| US06 (35 °C) | 2.65 | 7.25 | 1.84 | |
| DST, BJDST (with force) | US06 (15 °C) | 0.89 | 2.10 | 0.71 |
| US06 (35 °C) | 0.76 | 2.58 | 0.69 |
| Model | Training Data | Test Data | RMSE% | MAXE% | MAE% |
|---|---|---|---|---|---|
| LSTM | DST, BJDST (without force) | FUDS | 4.20 | 15.70 | 3.28 |
| BiLSTM | 3.20 | 15.18 | 2.51 | ||
| Proposed | 2.29 | 6.67 | 1.73 | ||
| LSTM | DST, BJDST (with force, 500 N) | FUDS | 2.34 | 9.33 | 1.74 |
| BiLSTM | 1.69 | 6.05 | 1.27 | ||
| Proposed | 0.62 | 2.66 | 0.48 |
| Model | Training Data | Test Data | RMSE% | MAXE% | MAE% |
|---|---|---|---|---|---|
| LSTM | DST, BJDST (1000 N) | US06 | 1.86 | 7.78 | 1.44 |
| BiLSTM | 1.16 | 3.51 | 0.93 | ||
| Proposed | 0.59 | 1.09 | 0.46 | ||
| LSTM | DST, BJDST (1500 N) | US06 | 2.38 | 8.34 | 1.85 |
| BiLSTM | 1.65 | 6.70 | 1.28 | ||
| Proposed | 0.95 | 2.48 | 0.70 |
Disclaimer/Publisher’s Note: The statements, opinions and data contained in all publications are solely those of the individual author(s) and contributor(s) and not of MDPI and/or the editor(s). MDPI and/or the editor(s) disclaim responsibility for any injury to people or property resulting from any ideas, methods, instructions or products referred to in the content. |
© 2025 by the authors. Licensee MDPI, Basel, Switzerland. This article is an open access article distributed under the terms and conditions of the Creative Commons Attribution (CC BY) license (https://creativecommons.org/licenses/by/4.0/).
Share and Cite
Wu, Z.; He, X.; Chen, H.; Lv, L.; Jiang, J.; Wang, L. Multiphysics Feature-Based State-of-Energy Estimation for LiFePO4 Batteries Using Bidirectional Long Short-Term Memory and Particle Swarm-Optimized Kalman Filter. Appl. Sci. 2025, 15, 5003. https://doi.org/10.3390/app15095003
Wu Z, He X, Chen H, Lv L, Jiang J, Wang L. Multiphysics Feature-Based State-of-Energy Estimation for LiFePO4 Batteries Using Bidirectional Long Short-Term Memory and Particle Swarm-Optimized Kalman Filter. Applied Sciences. 2025; 15(9):5003. https://doi.org/10.3390/app15095003
Chicago/Turabian StyleWu, Zhengpu, Xu He, Haisen Chen, Lu Lv, Jiuchun Jiang, and Lujun Wang. 2025. "Multiphysics Feature-Based State-of-Energy Estimation for LiFePO4 Batteries Using Bidirectional Long Short-Term Memory and Particle Swarm-Optimized Kalman Filter" Applied Sciences 15, no. 9: 5003. https://doi.org/10.3390/app15095003
APA StyleWu, Z., He, X., Chen, H., Lv, L., Jiang, J., & Wang, L. (2025). Multiphysics Feature-Based State-of-Energy Estimation for LiFePO4 Batteries Using Bidirectional Long Short-Term Memory and Particle Swarm-Optimized Kalman Filter. Applied Sciences, 15(9), 5003. https://doi.org/10.3390/app15095003