Article

Non-Invasive Hydration Monitoring with a Graphene Dual Sweat Sensor

by
Joseph J. Q. Ng
1,2,†,
Sergey Tkachev
2,3,†,
Glendon C. F. Sim
2,†,
Luiza Felippi de Lima
2,
Gavin K. W. Koon
2,3,
Alexandre P. Lima
2,3 and
Antonio H. Castro Neto
2,3,4,5,*
1
Faculty of Dentistry, National University of Singapore, Singapore 119085, Singapore
2
Centre for Advanced 2D Materials, National University of Singapore, Singapore 117546, Singapore
3
Institute for Functional Intelligent Materials (I-FIM), National University of Singapore, Singapore 117544, Singapore
4
Department of Materials Science and Engineering, National University of Singapore, Singapore 117575, Singapore
5
Department of Physics, National University of Singapore, Singapore 119077, Singapore
*
Author to whom correspondence should be addressed.
These authors contributed equally to this work.
Appl. Sci. 2025, 15(9), 4970; https://doi.org/10.3390/app15094970
Submission received: 18 March 2025 / Revised: 22 April 2025 / Accepted: 22 April 2025 / Published: 30 April 2025
(This article belongs to the Special Issue Research and Design of Two-Dimensional Functional Materials)

Abstract

:
Maintaining optimal hydration is critical for physiological function, particularly during intense physical activities, in which dehydration or overhydration can impair performance and recovery. Traditional methods for monitoring hydration status, such as body weight changes, bioelectrical impedance, and urine specific gravity, are limited by inconvenience and lack of real-time capability. This study introduces a novel graphene-based dual-sensing electrochemical sensor for the rapid and non-invasive quantification of sodium and potassium concentrations in human sweat, key biomarkers of hydration status. Leveraging graphene’s exceptional conductivity and functionalization potential, the sensor employs open-circuit potentiometry (OCP) to achieve high sensitivity and selectivity in detecting sodium and potassium. The sensor performance was validated against that of a commercial analyzer and ICP-OES, demonstrating a near-Nernstian response (61.93 mV/decade for sodium and 61.21 mV/decade for potassium detection) and a linear detection range spanning from 0.1 mM to 100 mM for both sodium and potassium monitoring in sweat. Sweat samples from an athlete during endurance exercise confirmed the sensor’s reliability, with results closely matching those of ICP-OES and outperforming the commercial analyzer in regards to accuracy and sample efficiency. This work represents a cross-validated study of a sweat-based sensor with a second analytical technique, highlighting its potential as a real-time hydration monitoring tool for use in sports and beyond.

1. Introduction

Maintaining optimal hydration levels is important for physiological function [1], particularly during physically demanding activities. To avoid the adverse effects of dehydration or overhydration, such as metabolite imbalances, reduced performance, muscle cramps, muscle fatigue, and extended recovery times [2,3,4,5], athletes work with sports scientists to track their hydration status and tailor fluid replacement strategies for optimized performance.
Currently, the three methods used to determine hydration status include (I) assessing changes in body weight to detect fluctuations in water content; (II) utilizing bioelectrical impedance analysis, measuring electrolyte concentrations in blood or urine samples; (III) comparing urine density with that of water through urine specific gravity [6]. While each technique offers distinct advantages, they are all limited by the inconvenience of sample or data collection and the inability to offer real-time monitoring, highlighting the need for more efficient solutions.
Sweat analysis has gained increasing attention, as sweat contains a diverse range of solutes, including inorganic ions, organic molecules, amino acids, hormones, proteins, peptides, and other secretions [7,8], that could reflect the body’s status. Most importantly, the collection of sweat is non-invasive.
Notably, sodium was identified as a key biomarker for hydration status in sweat. The body constantly regulates sodium levels through excretion and reabsorption in the sweat glands and kidneys, thereby controlling water retention [9]. During physical activity, the sweat rate increases with exercise intensity. As sweat production increases, sodium secretion in the sweat glands exceeds the rate of reabsorption, leading to higher sodium concentrations in the sweat secreted, ranging from 10–90 mM [6,10,11,12,13]. In another words, a higher sweat sodium concentration could indicate more loss of water through sweat, leading to dehydration.
In addition to sodium, potassium is one of the three electrolytes that are directly involved in sweat secretion [7]. While the underlying physiological mechanism of how potassium correlates with hydration status may not be clear, it is understood that the concentration of potassium in sweat remains relatively constant and does not fluctuate more than 2 mM when the sweat rate increases [11,12,14,15]. Given this unique characteristic, potassium could serve as a quality control for sweat analysis. If potassium concentration detected in sweat is higher than the typical range (1 to 10 mM), it could be an indication that the sample collected was contaminated or that evaporation has occurred. In this case, the results for other analytes, such as sodium, detected in that sweat sample may not be reliable.
Recent developments have focused on wearable biosensors based on electrochemical detection for sweat sodium analysis. While these biosensors can provide instantaneous readings and uninterrupted, second-by-second tracking, they may require other systems such as wireless transmitors, microfluids, and a power source to be built into the system [16,17]. The most crucial element is for the biosensor to be stable for an extended period of time, requiring no re-calibration during use. As a result of the combination of all these factors, wearable biosensors are often bulky, require a longer fabrication process, and exhibit a higher cost and technical demand [16,18,19].
As the sweat sodium concentration does not fluctuate dramatically within seconds, but instead changes gradually over time [12,20], a sensor that continuously tracks this concentration may exceed the practical requirements for hydration monitoring. Hence, this paper focuses on the development of a sensor that analyzes sweat using a drop-and-test method, where sweat is collected and dispensed onto the biosensor for analysis, reather than on designing a wearable device.
A screen printed electrode (SPE) was selected as the platform, as it is a versatile and cost-effective approach to the electrochemical detection of sodium and potassium in sweat. This method leverages the high sensitivity, selectivity, and rapid response times [21] of SPEs—attributes enhanced by its simple fabrication methods and miniaturized systems. Specifically, the electrochemical detection technique used in this paper comprises open circuit potentiometry (OCP); this method involves detecting the potential difference between the working electrode and the reference electrode, providing accurate and reliable measurements of ion concentrations.
Ag/AgCl is the common material of choice for the reference electrode on SPEs due to its ability to maintain a stable potential via the redox reaction (Equation (1)). Although AgCl displays low solubility, the chloride ion can leach, disrupting the equilibrium of the redox reaction due to the loss of the chloride ion. This is particularly critical for sweat analysis due to the presence of a high electrolyte concentration, including that of chloride, which may exacerbate the disruption. A junction layer could be fabricated to overcome this challenge [22]. The layer will serve as a barrier that allows for interaction between the sample solution and the reference electrode, enabling the flow of current necessary for the electrochemical cell to function, while preventing the loss of chloride ions.
A g C l s + e A g s + C l
Theoretically, based on the Nernst equation (Equation (2)) [19], a sensor working under standard conditions (25 °C, n = 1) is predicted to exhibit a shift of 59.2 mV per 10-fold increase in ion concentration (mV/decade). This value, known as the Nernstian response, serves as a benchmark to assess whether the developed sensor achieves optimal sensitivity and accuracy.
E = E 0 + R T n F ln o x i d i z e d r e d u c e d
However, achieving this response requires the electrochemical sensor to be functionalized for effective ion detection, enhancing its specificity and selectivity towards the target analyte. Common materials employed for working electrodes include gold, platinum, carbon, and graphene. Among these, graphene-based nanomaterials have emerged as highly promising candidates due to their unique and adjustable physicochemical properties, biocompatibility, and extensive surface area, which facilitate the immobilization of bio-recognition elements, amplifying detection sensitivity [23]. Regarding the electrochemical sensor design, graphene’s exceptional electrical conductivity, combined with its capacity for controlled functionalization through sp2 hybridized carbon atoms, makes it ideal for efficient electron transfer in electrochemical sensors [24].
This paper proposes a graphene-based dual-sensing sensor designed to quantify sodium and potassium concentrations in human sweat within 30 s using a minimal sample volume. We conducted a comparative analysis of our sensor’s performance against a commercial analyzer and the inductively coupled plasma atomic emission spectroscopy (ICP-OES) technique. Our findings demonstrate that the graphene dual-sensor delivers reliable results, comparable to those obtained via ICP-OES. This study also attempts to undertake a cross-validation with an alternative technique to corroborate the concentrations measured by such sensors.

2. Materials and Methods

An SPE with two working electrodes was functionalized with either a sodium or potassium ion selective membrane using a drop-cast technique. The reference electrode also includes a junction layer to increase its stability. The performance of the reference electrode with the junction layer was compared against that of an external reference electrode probe. Several tests were performed to ascertain the performance of the dual-sensing biosensor. A run-to-run repeatability test was conducted on a sensor to identify the shift between tests on one sensor, and a reproducibility test was performed with five sensors to understand the differences in the reading of the same concentration between different sensors. For the selectivity test, magnesium chloride, ammonium chloride, and calcium chloride were used to indicate how other electrolytes can potentially affect the sensor’s performance. Finally, the sensor was tested for real-world application, analyzing sweat samples collected from an individual. The samples were also analyzed with a commercial analyzer and ICP-OES for cross-validation.
The electrochemical detection method employed to detect the concentrations of sodium and potassium ions in standard solutions and sweat samples comprised open-circuit potentiometry (OCP). The sensor was either immersed in the test solution, or 30 µL of the solution or sweat samples were dispensed on it. The OCP value was recorded for 30 s. To ensure consistent liquid deposition, the Scienion SciFlexarrayer S12 device was used for all dispensing activities, which included the drop-casting of ion selective membranes.
Sodium chloride (NaCl), potassium chloride (KCl), ammonium chloride (NH4Cl), calcium chloride (CaCl2), magnesium chloride (MgCl2), sodium ionophore, valinomycin, dioctyl sebacate (DOS), sodium tetrakis[3,5 bis (trifluoromethyl) phenyl] borate (NaTFPB), polyvinyl chloride (PVC), sodium tetraphenylborate (NaTPB), tetrahydrofuran, Nafion, polyvinyl butyral (PVB), potassium ferricyanide (K3Fe(CN)6), and hydrochloric acid (HCl) were purchased from Sigma-Aldrich (St. Louis, MO, USA).

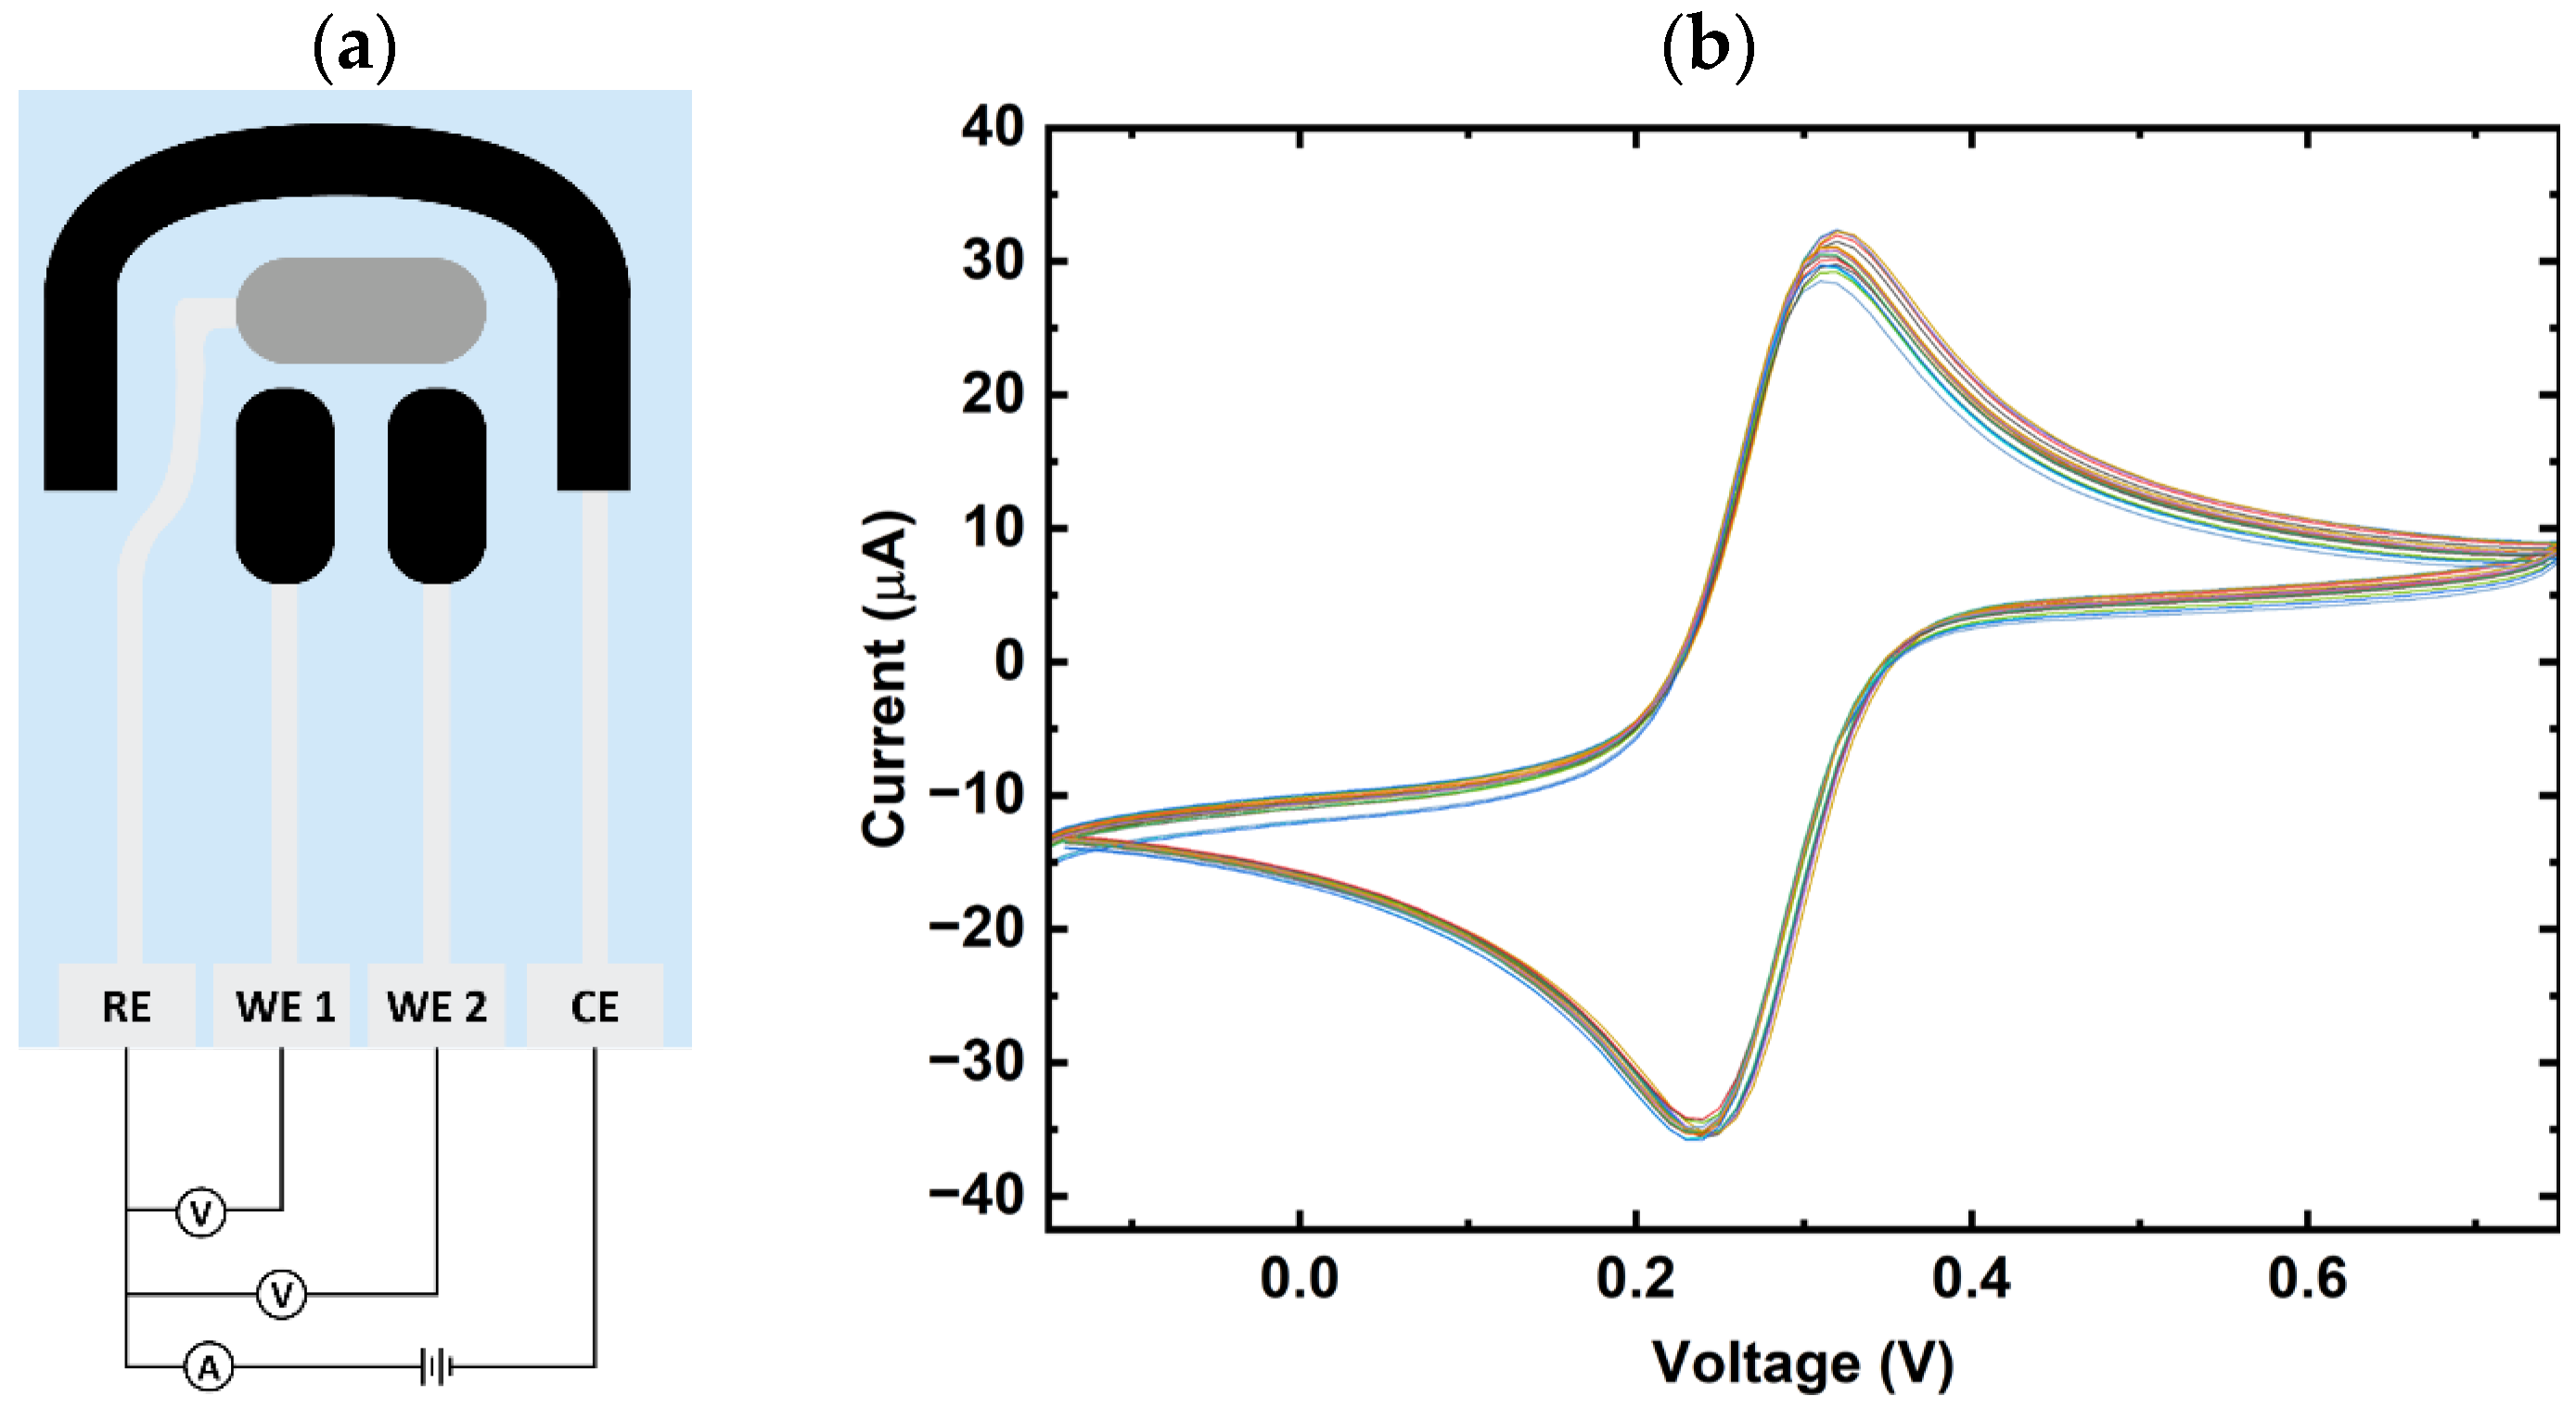
2.1. Sensor Fabrication

The sensors utilized in this study were supplied by the Center for Advanced 2D Materials (CA2DM) at the National University of Singapore (NUS). The electrodes were manufactured using a screen-printing technique on a flexible, high-resistance polyethylene terephthalate (PET) substrate. The sensor comprises two graphene-based working electrodes, each with an area of 2.3 mm2, sharing an Ag/AgCl quasi-reference electrode (RE) and a graphene counter electrode (CE). A dielectric coating was applied as an insulating layer.
To verify the initial variability of the electrode surface prior to functionalization, cyclic voltammetry was conducted from −0.15 V to 0.75 V for five cycles with 2 mM of potassium ferricyanide in 0.1 M of hydrochloric acid and 0.1 M of potassium chloride. The cyclic voltammetry profile of the graphene dual-sensor, as seen in Figure 1b, displays an average peak current of 31.3 µA, with a standard deviation of 0.8 µA across five different sensors. This reproducibility indicates that the base graphene surfaces exhibit similar and stable baseline electrochemical properties, which decreases the sensor-to-sensor variability post-functionalization.
The sodium ion-selective membrane was prepared by mixing 1 wt.% of sodium ionophore, 65.5 wt.% of DOS, 0.5 wt.% of NaTFPB, and 33 wt.% of PVC. The potassium ion-selective membrane was prepared by mixing 2 wt.% of valinomycin, 65 wt.% of DOS, 0.5 wt.% of NaTPB, and 32.5 wt.% of PVC. The sodium and potassium ion-selective membranes were then prepared by dissolving 150 mg of the mixture in 1 mL of THF. The mixture was stirred with a magnetic stirrer (1000 rpm for 30 min) and sonicated (20 min), resulting in a clear and transparent solution. The potassium and sodium ion-selective membranes were drop-cast on the working electrodes. The working electrodes were covered with 2 µL of the membrane cocktail and left to dry overnight at room temperature to ensure complete solvent evaporation.
To enhance the functionality of the reference electrode, a multi-layer configuration was implemented. The first layer consisted of a mixture of 1 M NaCl dissolved in a 5 wt.% Nafion solution. The second layer was formulated by dissolving 79 mg of PVB and 50 mg of NaCl in 1 mL of methanol. Finally, the third layer was composed of a 5% Nafion solution. To construct these layers, 2 µL of the first, 4 µL of the second, and 1 µL of the third layer were drop-casted onto the reference electrode. Each layer was subjected to a drying process at 40 °C for 15 min.
The sensors were then conditioned in 10 mM of NaCl solution for 30 min before testing. Sodium and potassium standard solutions were prepared by dissolving NaCl or KCl salt in ultrapure water and diluted further to obtain solutions of different concentrations.
The performance of the reference electrode with the multi-layer junction was evaluated against a single junction commercial Ag/AgCl reference in concentrations of NaCl solution ranging from 0.1 mM to 1 M. To verify the electrode stability, the signal was measured for over 100 min.

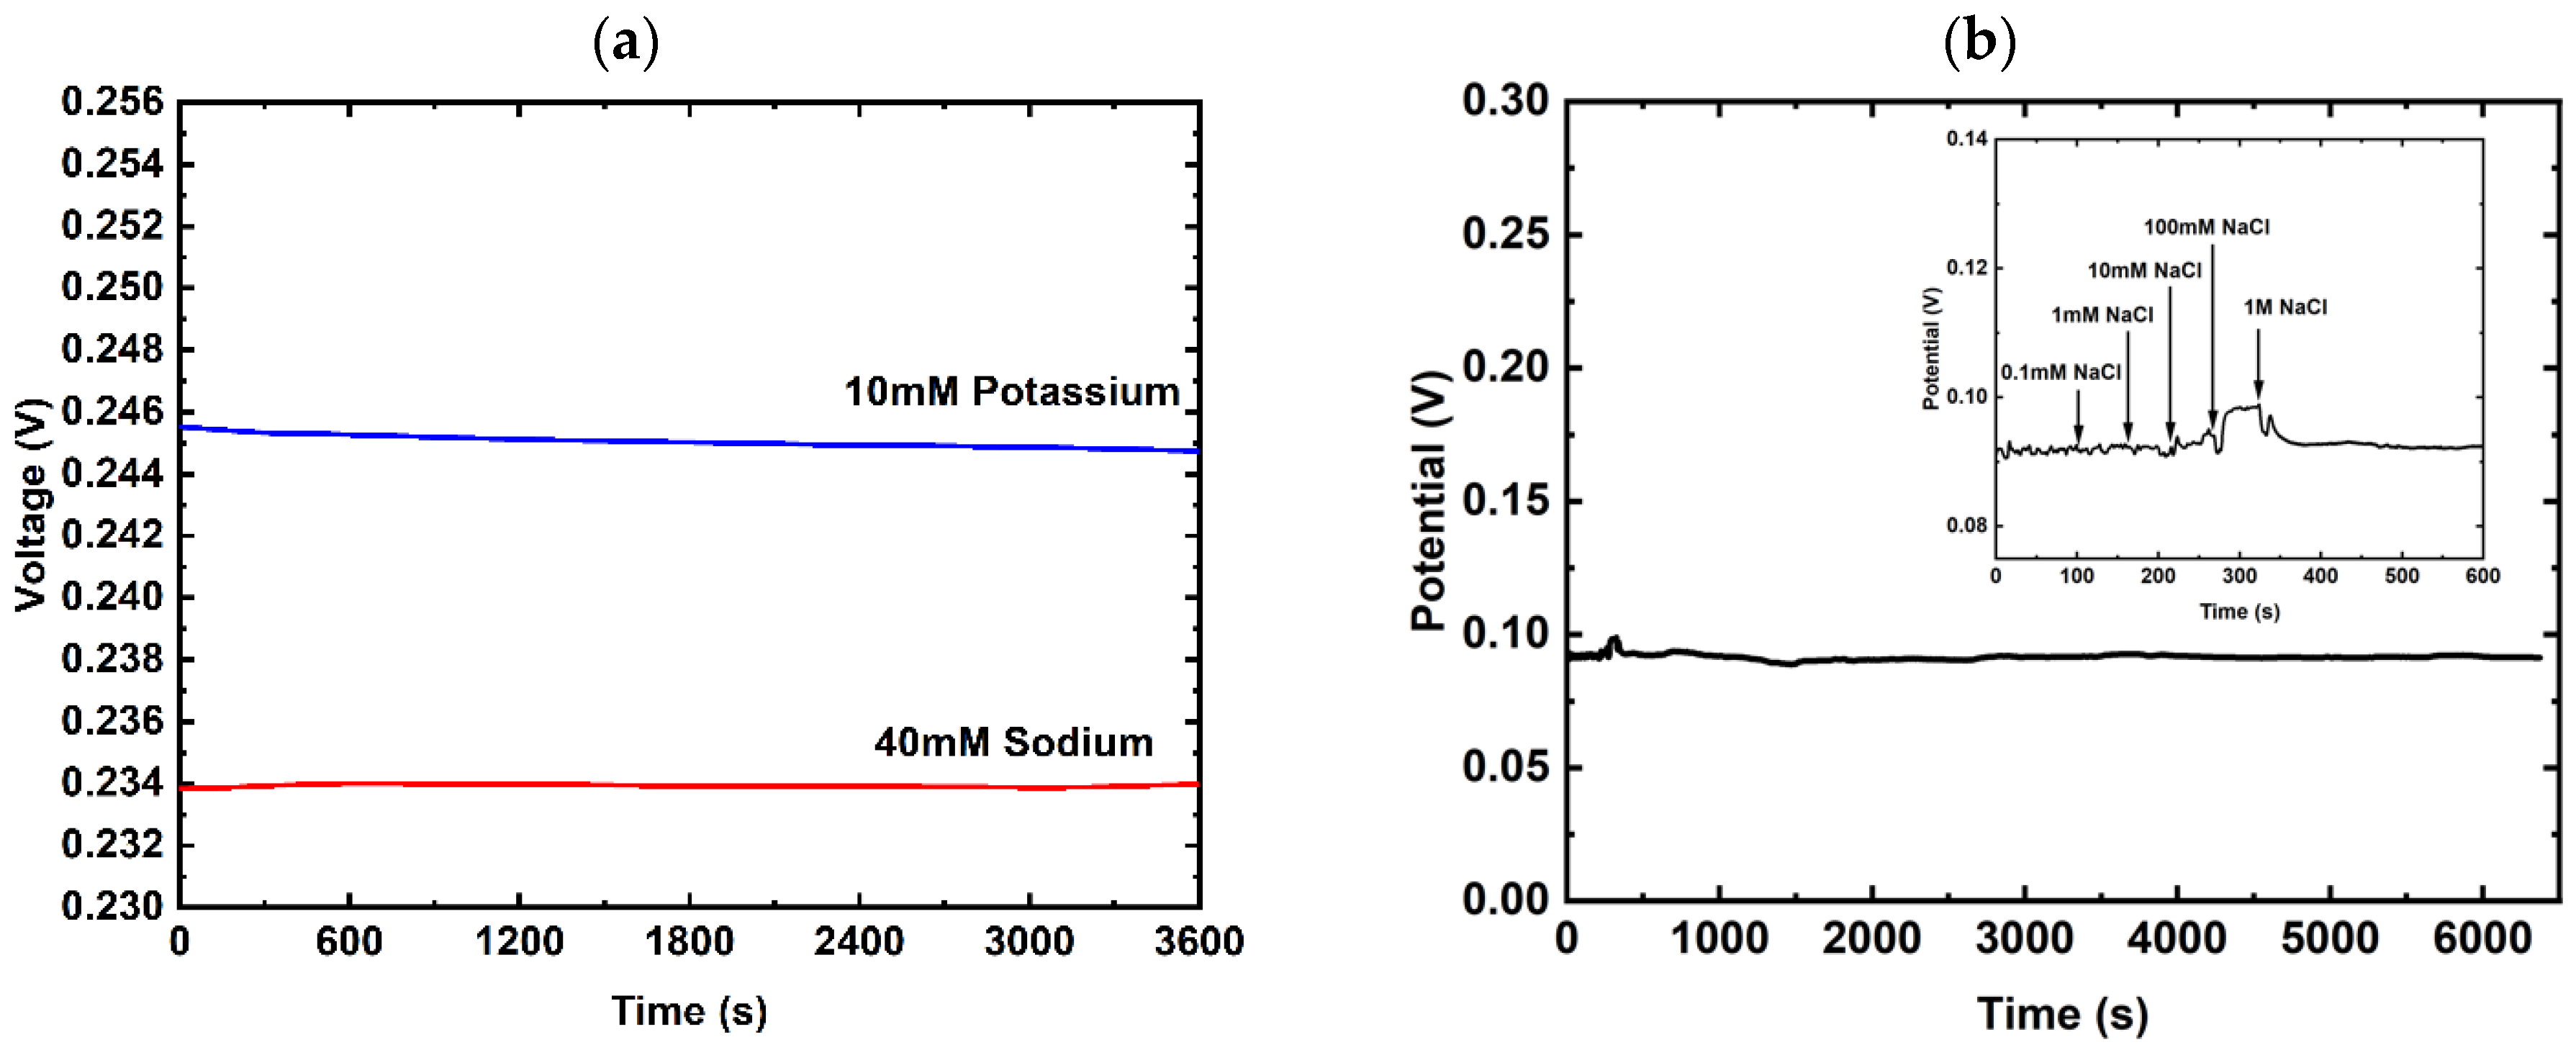
2.2. Sensor’s Performance and Reliability

To assess the run-to-run repeatability of the sensor’s detection repeatability tests, repeat measurements were conducted on the same sensors for sodium and potassium, with concentrations from 0.1 mM to 100 mM, increasing in tenfold steps. The reproducibility tests were performed via identical measurements on the five different sodium and potassium sensors, with concentrations from 0.1 mM to 100 mM, increasing in tenfold steps.
Other ions present in human sweat may interfere with the detection of target ions, making it necessary to evaluate the sensor’s interference resistance. For this, the sensor was immersed in the test ion solution (10 mM NaCl or 10 mM KCl), and interfering ions were sequentially added. The voltage output detected by the sensor was monitored. The interference ions tested for both the Na+ and K+ sensors were 10 mM NaCl, 10 mM MgCl2, 10 mM CaCl2, 10 mM KCl, 10 mM NH4Cl, and a mixed solution containing 10 mM of each chemical (NaCl, MgCl2, CaCl2, KCl and NH4Cl).
To assess the practical performance of the sensor, a test was conducted using human sweat. A trained athlete participated in an experimental trial that involved three, 30 min intervals of endurance running to induce sweating. Sweat was then collected from the forearm, upper arm, and chest after a 15 min seated rest using sweat patches (3M™ Tegaderm™ +Pad Film Dressing with Non-Adherent Pad, Saint Paul, MN, USA) (Figure 2). A total of nine samples were collected from the different body parts at the three intervals and were immediately placed in an ice box before being stored at −20 °C.
The collected sweat samples were then analyzed using one graphene-based dual-sensing sensor. The results were compared with those from a commercial analyzer and with analytical results from inductively coupled plasma atomic emission spectroscopy (ICP-OES). The commercial analyzer used was from HORIBA (Kyoto, Japan), specifically the LAQUAtwin-Na-11 and LAQUAtwin-K-11 models. The sweat samples were tested without any dilution or cleaning procedures. For ICP-OES analysis, the samples were aliquoted and diluted 100 times with ultrapure water. Each sample was analyzed in triplicate, and a 1 ppm sodium or potassium standard was concurrently analyzed for validation.

3. Results and Discussion

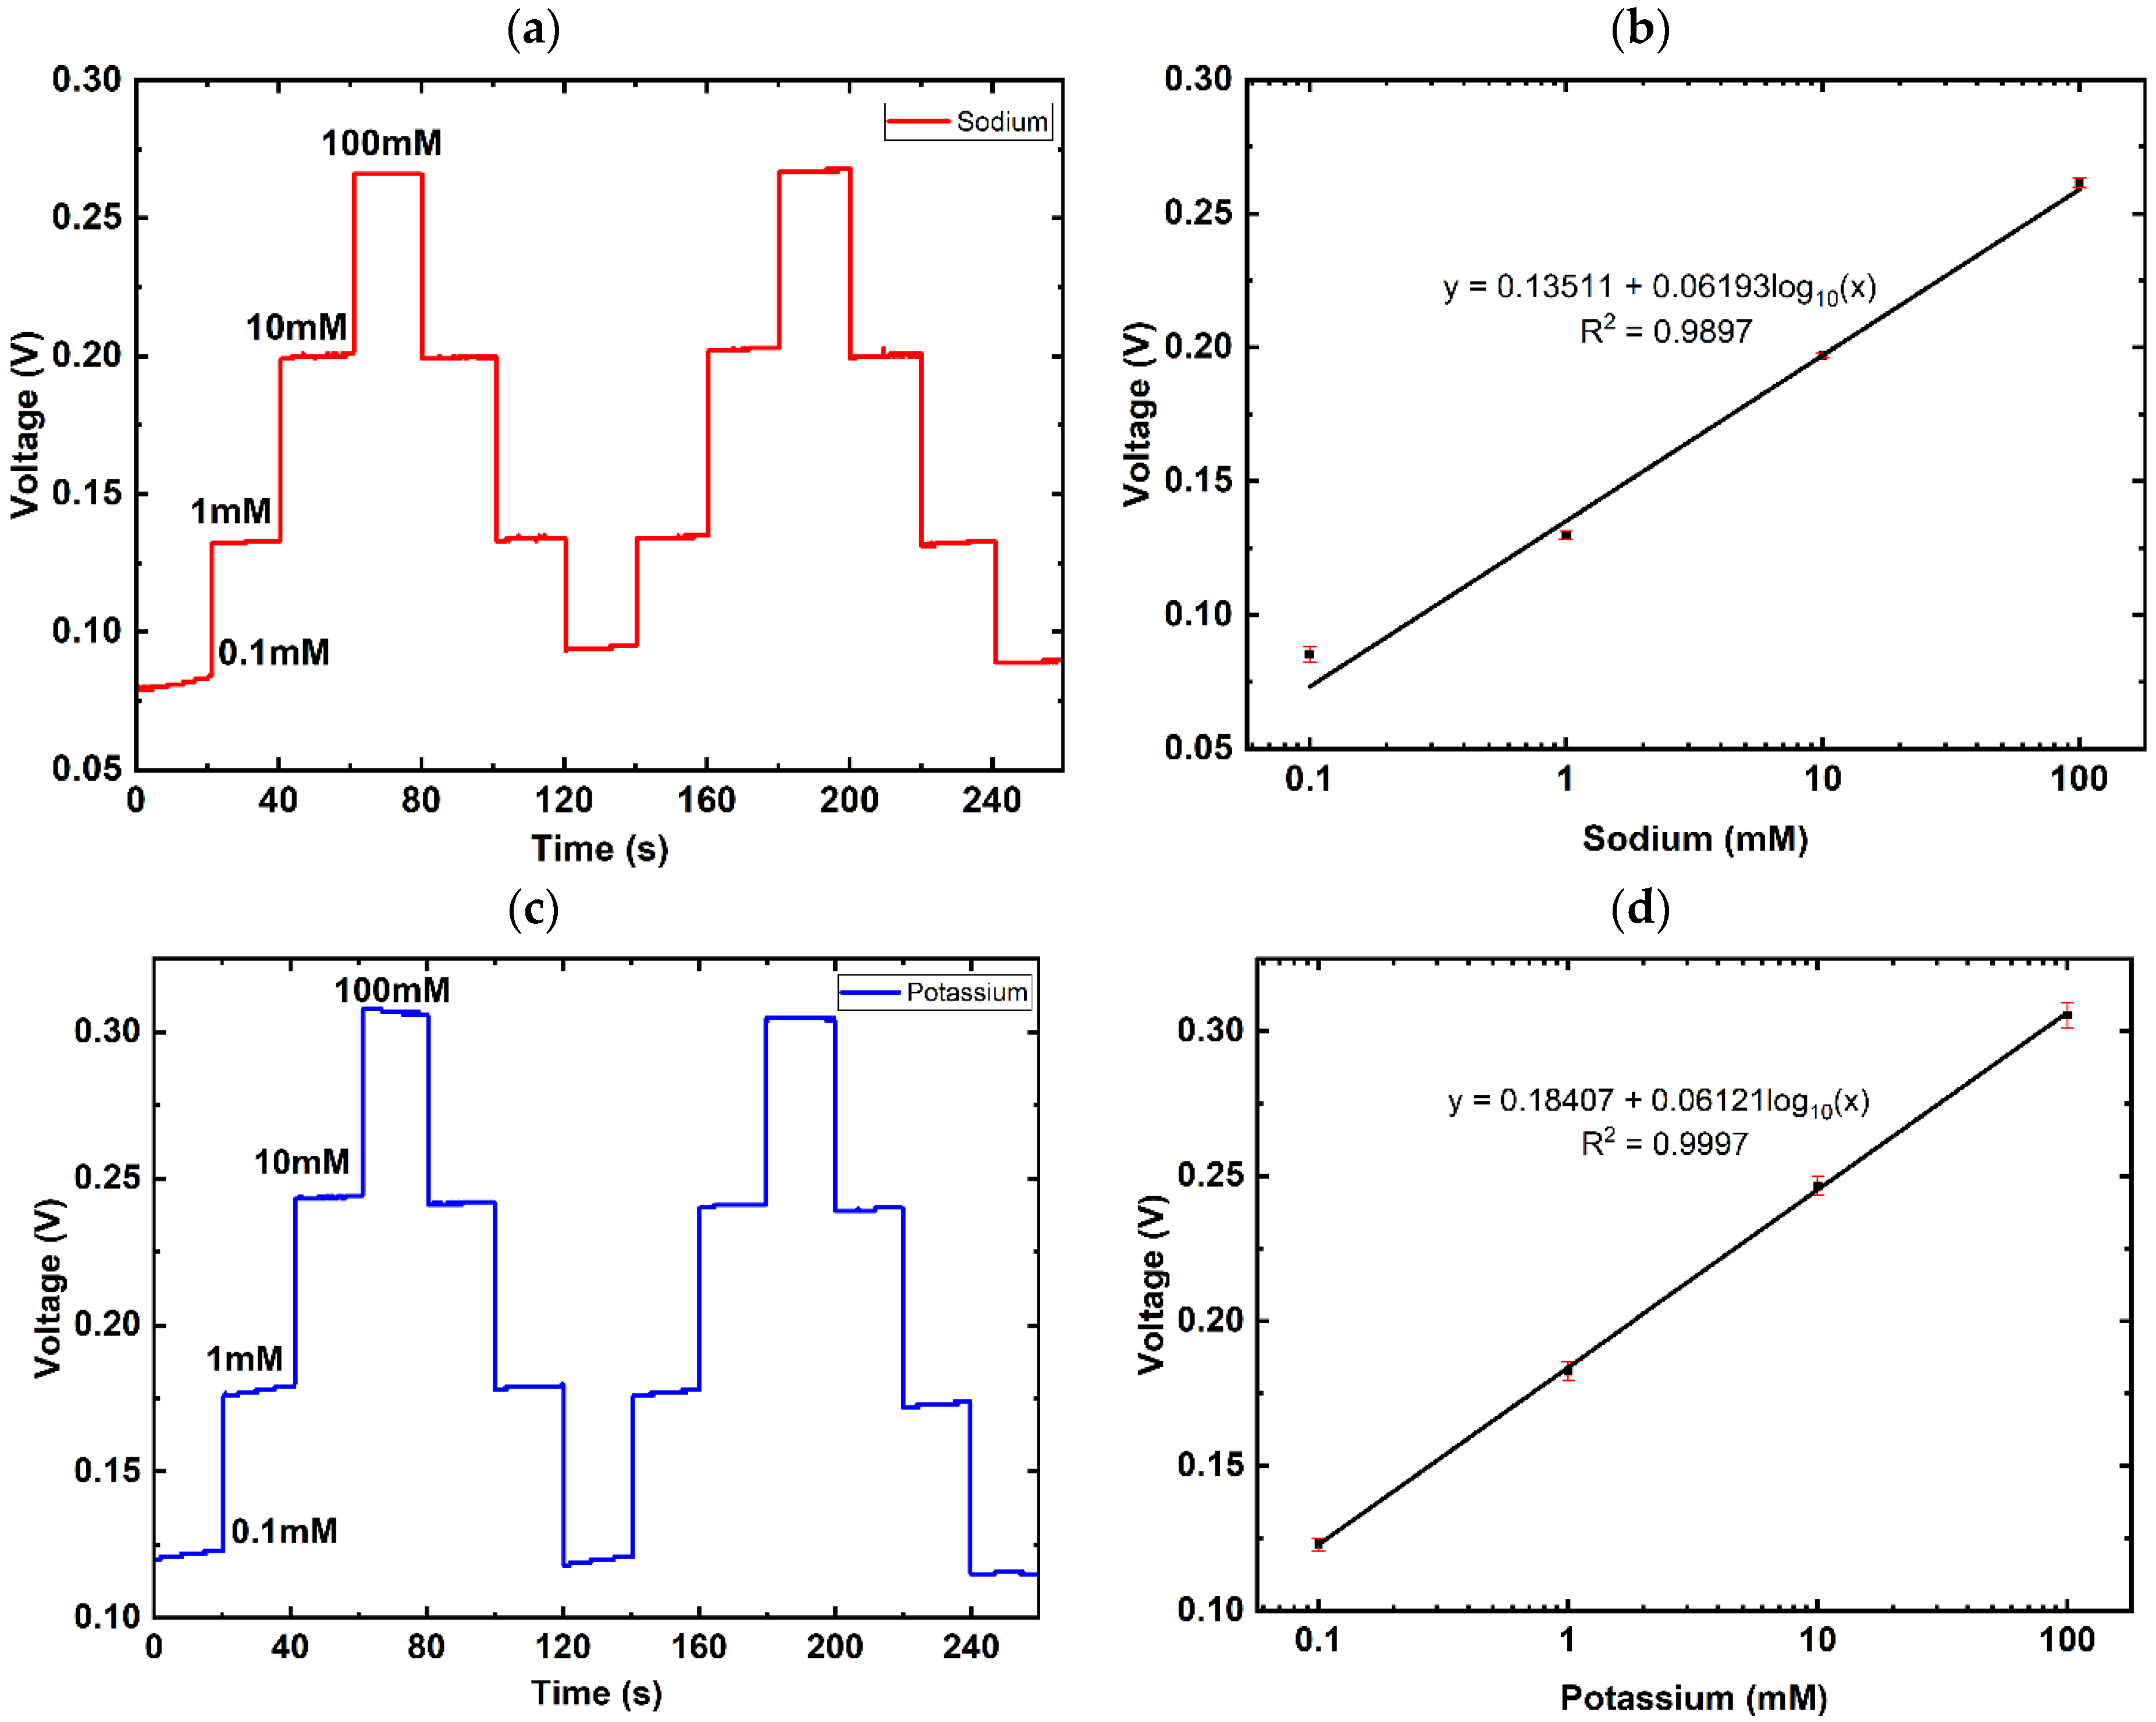
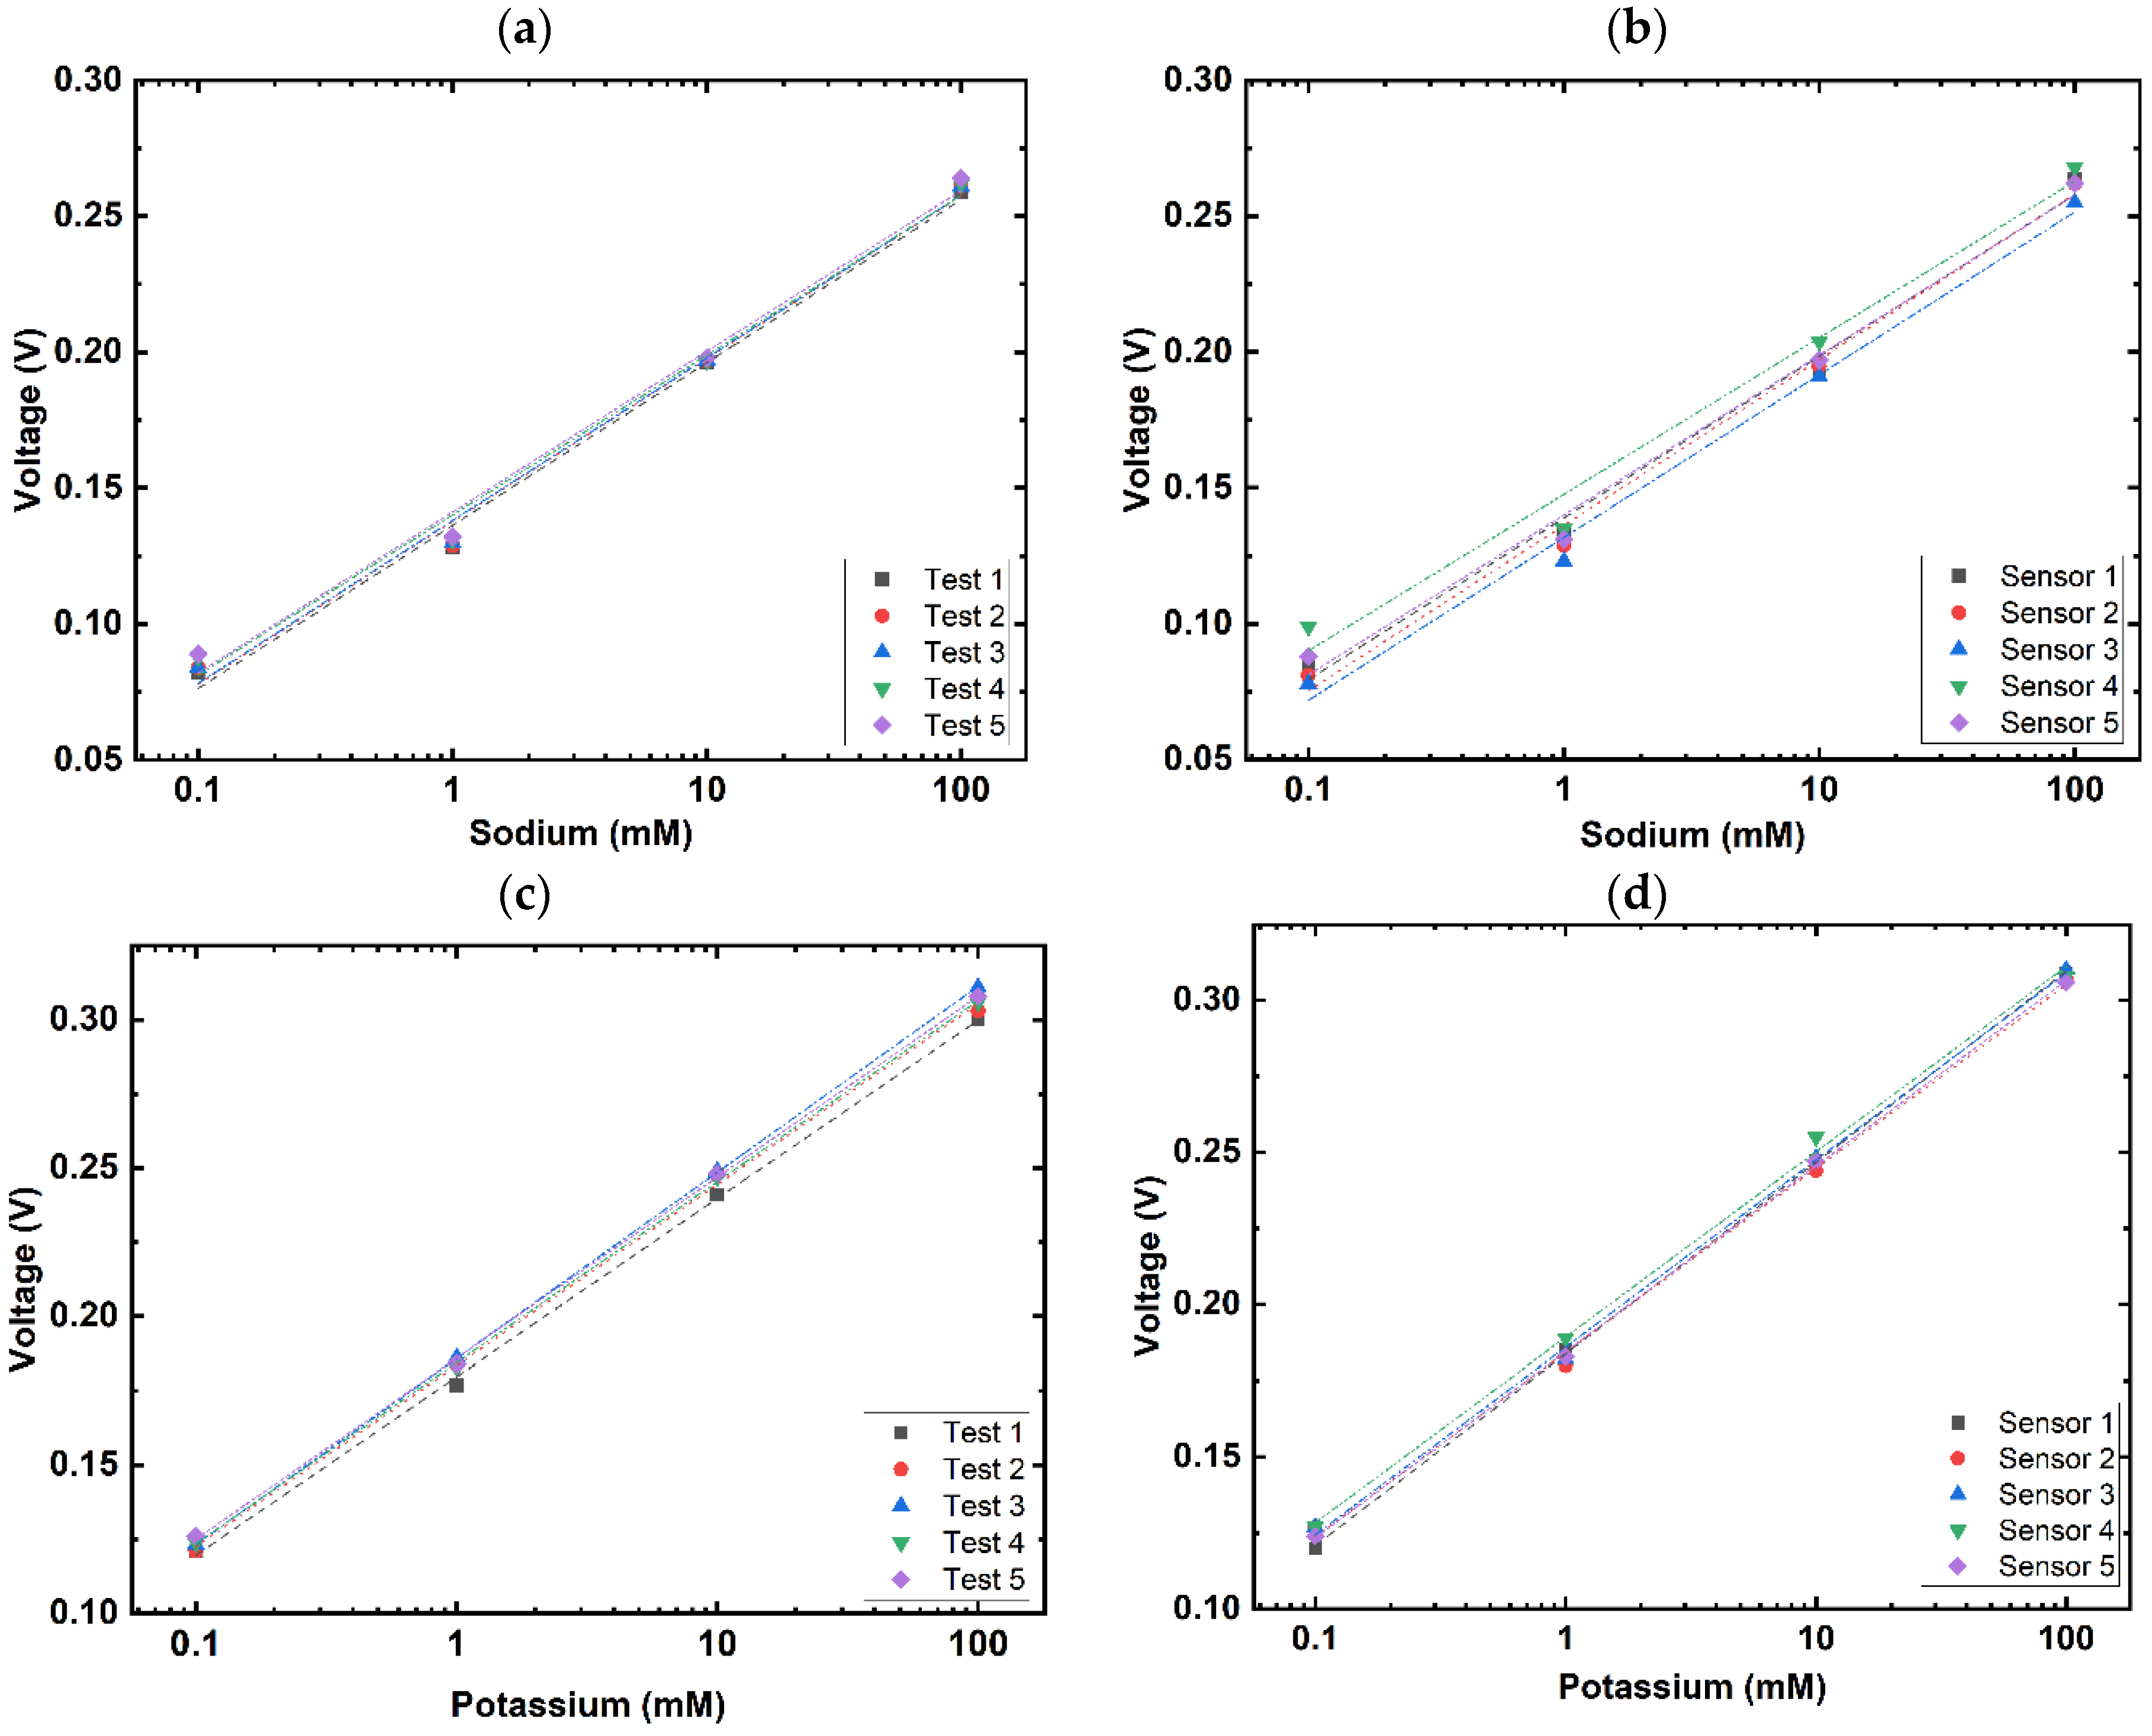
3.1. Sensor Characterization: Electrochemical Performance

To investigate the dynamic range, the graphene dual-sensing sensor was subjected to varying concentrations of NaCl and KCl, from 0.1 mM to 100 mM, via microfluidic control in tenfold steps. Figure 3a,c present the results obtained for sodium and potassium selective electrode, respectively. The detection range of both ion selective electrodes were then regressed using a semi-logarithmic scale, where the x-axis of the concentration is of a log10 scale and thus, y = a + log10(x). As seen in Figure 3b, the sodium selective electrode is calculated to achieve approximately 61.93 mV/decade, R2 = 0.9897, and the potassium selective electrode (Figure 3d) achieved 61.21 mV/decade, R2 = 0.9997, both exhibiting a near-Nernstian response. This indicates that the dual-sensing sensor is reliable for the detection of sweat sodium and potassium levels within the physiological concentration range.
The stability of the sodium and potassium selective electrodes was also assessed by subjecting the electrodes to extensive exposure to the respective ions for which they are selective. As seen in Figure 4a, the variation over time for the sodium and potassium selective electrode is found to be within 1 mV of fluctuation across the span of 1 h. In addition, an extensive stability test was conducted for the reference electrode by measuring it against a commercial external reference electrode probe, where the concentration of sodium chloride in the solution in which the electrodes were immersed increased to 1M, and this level was maintained for over one hour. If the reference electrode is sensitive to changes in chloride concentration, this would result in potential drift, even at constant concentrations, and further shifts as the concentration changes.
The reference electrode with the junction layer showed few changes when the concentration was brought to 0.1 mM, 1 mM, and 10 mM (Figure 4b). A shift of about 4 mV was observed when the concentration was increased to 100 mM, and it subsequently decreased by 4 mV when the concentration was brought to 1M, stabilizing at around 92 mV—comparable to the initial values (91 mV) observed at lower concentrations. The signal remained stable, with slight fluctuation between 91 mV and 94 mV, for over 100 min. A variation of less than 10 mV was observed between the lowest and highest concentration, and stability was maintained for more than 100 min, indicating that this junction layer effectively stabilizes the reference electrode. This result demonstrate that the Nafion PVB-NaCl-covered reference electrode is able to return to a stable level quickly after the injection of sodium chloride, as well as its ability to maintain a stable voltage level in the presence of excess ions, a critical characteristic required for the ion-selective sensor to fulfill its role as a potential constant reference.
The repeatability of the dual-sensing sensor was evaluated by repeating five rounds of measurements on one sensor (Figure 5a,c). Reproducibility was evaluated by conducting one round of measurements with five identically fabricated sensors (Figure 5b,d). The descriptive statistics of these results (Table 1) showed a minimal variance within one sensor and between the five sensors. Hence, it can be concluded that the dual-sensing sensor is suitable for repeated measurement for at least 20 readings without recalibration. The low variability between sensors also enhances the reliability, as it demonstrates consistent performance across fabrication batches.
To evaluate selectivity, 30 µL of each of calcium chloride, magnesium chloride, and ammonium chloride, each at a concentration of 10 mM, were dispensed onto the sensor and analyzed. Potassium chloride was added to assess for interference on the sodium-detecting working electrode, and sodium chloride was added to assess for interference on the potassium-detecting working electrode. Some changes in the potential signal were observed upon the addition of the ions. To better understand how this impacts the sensor, the quantification of differences was converted to concentration (mM) using the logarithmic calibration equation in Figure 5b,d. As presented in Table 2, the effect of each interferant (ion) on the sensor showed a maximum change of 0.3 mM. One possible cause for this minute change could be correlated from the similar deviation found between the selectivity tests and that gradient obtained from repeated measurements and the sensor-to-sensor variation, as seen in Table 1. The other cause could potentially be due to the difference in the base conductivity of the ions producing the difference in the signal seen in the potentiometry measurements [25,26]. If true, this would suggest that the change in signal during the selectivity test was not due to the poor selectivity of the sensor but to the variability and intrinsic properties of the ions.
To mimic the physiological electrolyte environment in sweat, a mixed solution of sodium chloride, potassium chloride, ammonium chloride, and calcium chloride, each having a final concentration of 10 mM, was dispensed on the sensor. This test was repeated on five different sensors in order to observe the degree of difference of the results when all of these ions are combined in one solution. As seen in the last row of Table 2, the sensors were able to detect approximately 10 mM of sodium and potassium, as per what was added in the solution, with a 7% variance between sensors. These results indicate that the sodium and potassium electrodes are highly selective to the ions they were functionalized to detect, with minimal interference from other similar ions.
Our technology advances the field beyond the relatively limited existing graphene-based sensor platforms. The dual graphene sensor we developed operates over a wide linear detection range, delivers a near-Nernstian response, and requires a lower sample volume. Additionally, we have validated our sensor against both commercial solutions and ICP-OES measurements to ensure accuracy and reliability. For comparison, we have included Table S1, comparing previous graphene-based sweat sensors with our own, highlighting key differences and improvements.

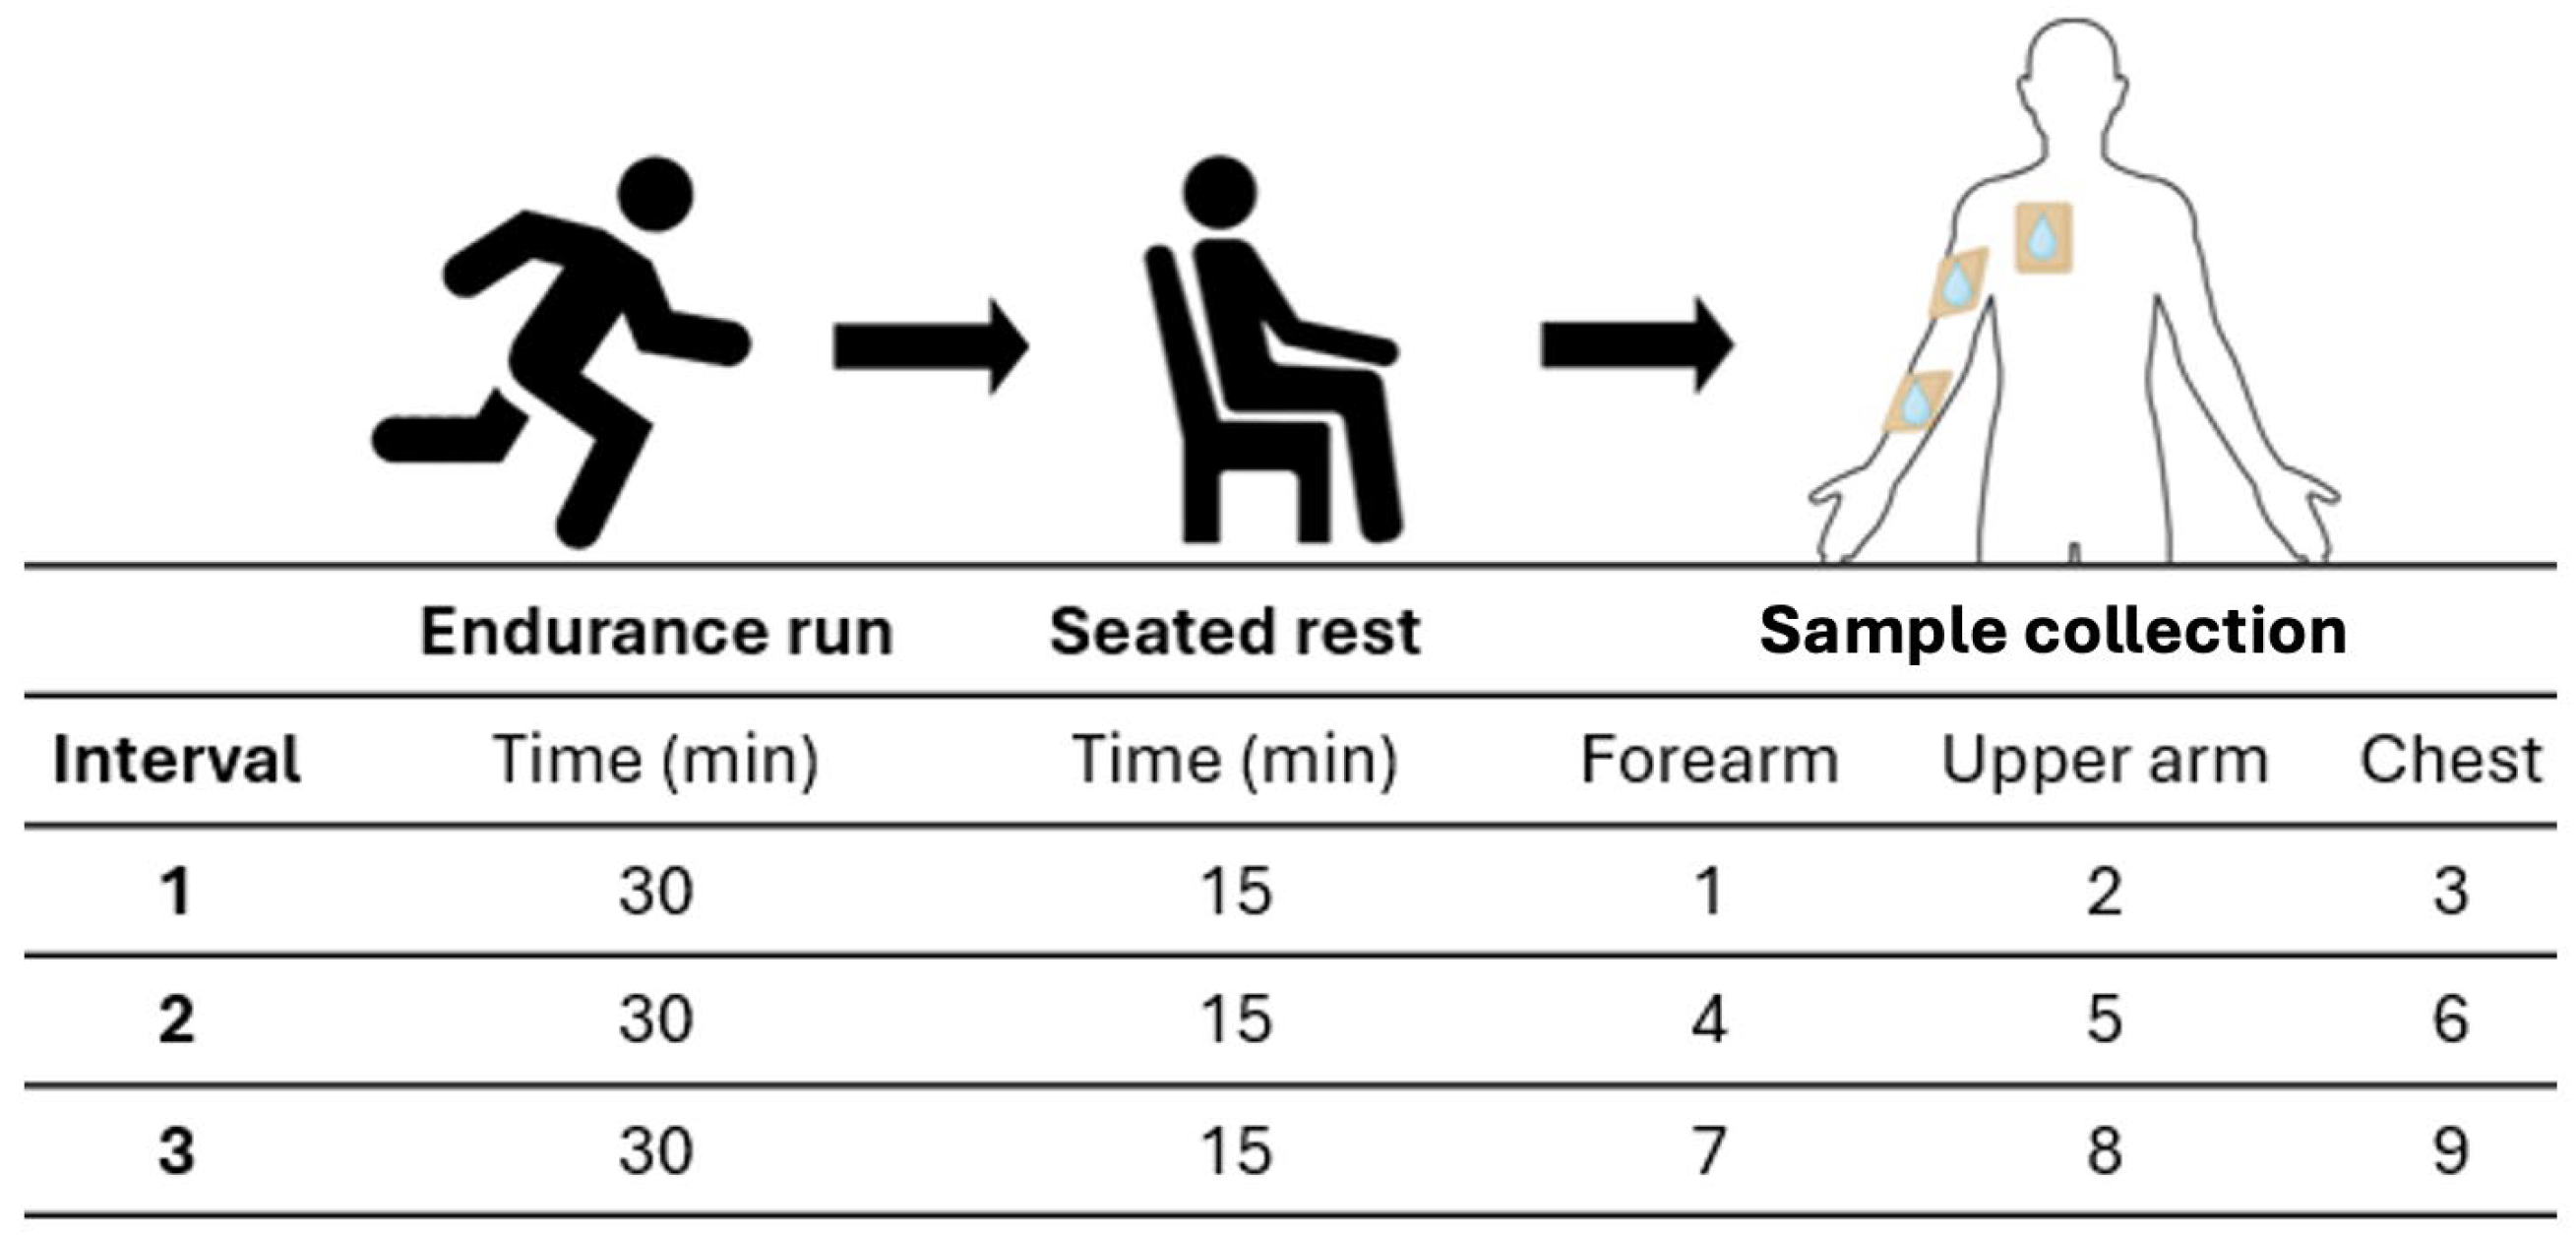
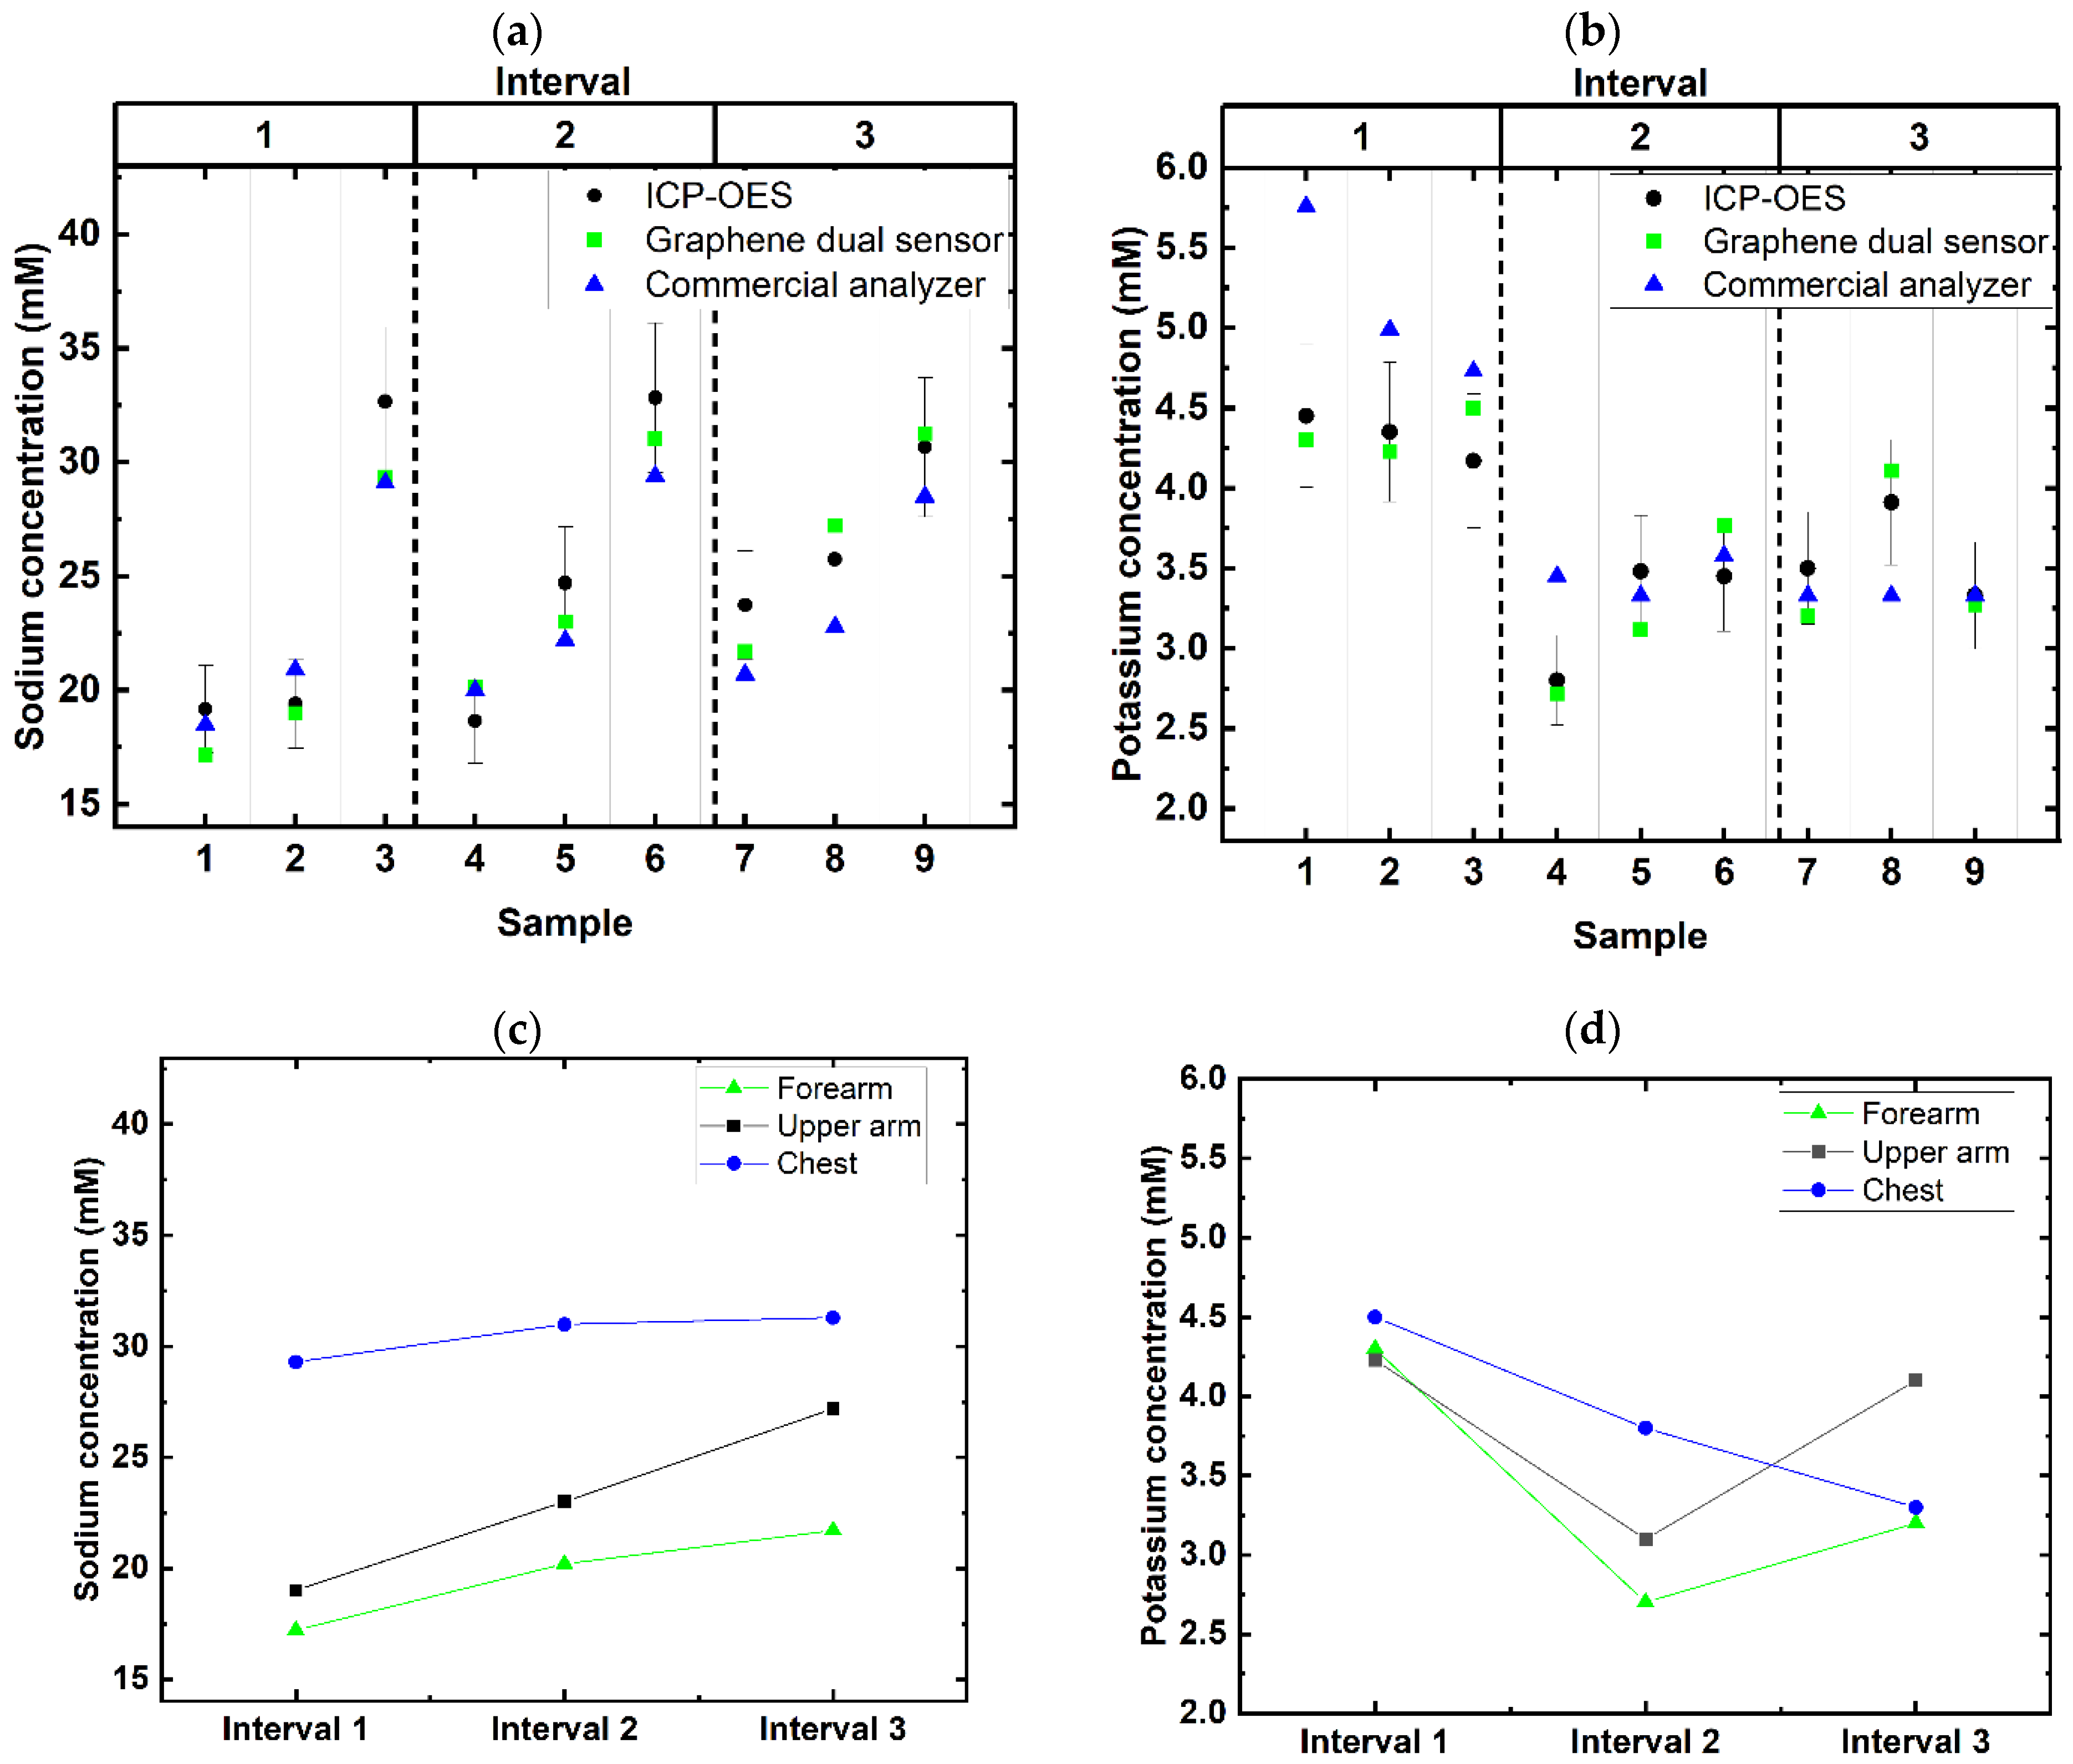
3.2. Practical Application

Sweat samples collected from a participant were analyzed to test the dual-sensing sensor’s practical use. Results from ICP-OES, the dual-sensing sensor, and a commercial analyzer (Table S2) were plotted, with an error bar set at 10%, based on the ICP-OES results as a reference (Figure 6a,b). While the relative standard deviation (RSD) for all samples tested using ICP-OES was less than 5%, an additional 5% RSD was factored in to account for errors during sample preparation for ICP-OES. Thus, the error bar was set at 10% as a tolerance threshold when comparing the results of ICP-OES against the dual-sensing sensor and the commercial analyzer. The graphs show that the dual-sensing sensor demonstrated less variation from ICP-OES for both sodium and potassium detection. This result was further confirmed with statistical analysis.
One-way repeated measures ANOVA and a Tukey test for post hoc analysis were performed using Origin Pro to obtain results regarding the sodium concentration. The Tukey test revealed that there is no statistically significant difference (α = 0.05) when comparing ICP-OES against the dual-sensing sensor (p = 0.38) and the dual-sensing sensor against the commercial analyzer (p = 0.37). However, there is a statistically significant difference when comparing ICP-OES against the commercial analyzer (p = 0.04). Similarly, statistical analysis was performed for potassium results using Friedman ANOVA, as the data do not present a normally distributed curve. The results revealed that there are no statistically significant differences between the three methods (α = 0.05): ICP-OES vs dual-sensing sensor (p = 0.87), dual-sensing sensor vs commercial analyzer (p = 0.23), and ICP-OES vs commercial analyzer (p = 0.76). These results suggest that the dual-sensing sensor is reliable and that the results are comparable to those for ICP-OES.
The results were further analyzed using Bland–Altman plots, with a 95% confidence interval, to assess the agreement between the methods (Figure S2a–d), and Cohen’s d was calculated to quantify the effect sizes of the differences (Table S3). While both analyses suggest that the differences between ICP-OES and the commercial analyzer are small, in practical terms, they do indicate that the dual-sensing sensor has a slight edge over the commercial analyzer, displaying a bias closer to zero on the Bland–Altman plot and exhibiting a smaller Cohen’s d value.
While there are sensors developed for the detection of sodium and potassium, and some have used actual sweat samples in their experiments [19,27], it is not usual to observe the use of a second analytical technique for cross-validation, further proving that the results received via their sensor are accurate or comparable to established detection techniques. In addition to providing more accurate results, the dual-sensing sensor only requires a single-step measurement with about 30 µL of the sample as compared to the constraints for the commercial analyzer, which requires one device for each ion and utilizes 300 µL of each sample for reliable measurements.
While the concentration of potassium seems to fluctuate as the intervals progress (Figure 6d), the differences are less than 2 mM, and the concentrations are well within the typical range. With that, we conclude that the sample collected was not contaminated. As with many other papers that compared sweat sodium concentration during exercise [11,19,28], the participant showed an increase in sweat sodium concentration as the intervals progressed. However, it is noticed that the sweat sodium concentration and the changes across the intervals were on the lower end. Although this participant is physically active, it was reported that fitness level does not have an impact on sweat sodium secretion [11], but the dietary intake of sodium does [29,30,31]. This indicates that there might not be an absolute range when one might be considered dehydrated or requires electrolyte replacement based on the sodium concentration; rather, it is subject to the inherent condition of the individual. With the development of this graphene dual sensor that is accurate, easy to use, requiring minimal volume, and able to provide real-time measurements, more studies can be conducted to understand how sodium concentration can be further utilized to understand the hydration status of each unique individual and further optimize their performance.
The hydration status, or sodium level, not only offers an indication of how and when the individual should replace water loss, but also provides an indication of whether or not the athlete is acclimatized to the environment [32]. This is especially important for athletes who train or live in cooler climates and travel to regions that are more humid or hot. Acclimatizing to the heat helps them to reach their top performance condition, and this can be tracked through the sweat sodium concentration. With the sensor developed here, the monitoring can be achieved with ease, and instant results can be obtained.

4. Conclusions

In this study, a graphene-based dual-sensing electrochemical sensor for rapid and accurate sweat sodium and potassium detection was developed to address the limitations of conventional hydration monitoring techniques. By harnessing graphene’s unique physicochemical properties, the sensor achieved a near-ideal Nernstian response (61.93 mV/decade for sodium and 61.21 mV/decade for potassium) and demonstrated high sensitivity, selectivity, and stability across a targeted detection range of 0.1 mM to 100 mM, making it suitable for sweat monitoring. Sweat samples were collected from a trained athlete, and the concentrations of sodium and potassium were measured using the dual-sensing sensor, ICP-OES, and commercial analyzers. The experimental outcomes demonstrated that the sensor exhibited outstanding performance in regards to sweat sodium and potassium detection, statistically indistinguishable from ICP-OES (p > 0.05) and out-performing commercial analyzers. Requiring only 30 μL of the sample—ten times less than the commercial alternative—no sample preparation, and producing result in 30 s, these features further corroborate the graphene dual sensor’s practical utility. The sensor’s rapid response time, minimal sample requirement, and non-invasive nature position it as an attractive tool for real-time hydration monitoring, with potential applications in sports science, clinical diagnostics, and personalized health management. Future studies should include the investigation of the sensor’s stability in regards to varying temperatures and humidity levels under long-term storage after fabrication. The capability of the sensor could also be further expanded to include the detection of other electrolytes or biomarkers, with potential anti-doping applications by targeting illegal substances in biofluids such as saliva, tears, or urine. Testing with larger, diverse cohorts will also help to establish individualized hydration thresholds and validate the sensor’s performance across varied environmental and physiological conditions, further solidifying its role in real-time health monitoring.

Supplementary Materials

The following supporting information can be downloaded at: https://www.mdpi.com/article/10.3390/app15094970/s1, Table S1: Performance comparison of our graphene dual-sensor against existing technologies; Table S2: Quantification of sodium and potassium on the graphene dual-sensor, with comparison to other methods of quantification; Figure S1: Comparison of our work, bare screen-printed electrode’s reference electrode and another commercial reference electrode against a commercial reference electrode stored in 3 M KCl with varying concentrations of sodium chloride added; Figure S2a–d: Bland-Altman plots; Table S3: Cohen’s d value. References [18,19,27,33,34,35,36] are cited in the supplementary materials.

Author Contributions

S.T., G.K.W.K. and A.H.C.N. conceptualized the project. S.T., G.C.F.S., L.F.d.L. and J.J.Q.N. performed the measurements. S.T., G.C.F.S., J.J.Q.N. and L.F.d.L. conducted the analysis and discussion. J.J.Q.N., S.T., G.C.F.S. and G.K.W.K. led the manuscript writing, with the assistance of all co-authors. G.K.W.K. and A.P.L. managed the administration and finances of the project. A.H.C.N. supervised the project. All authors have read and agreed to the published version of the manuscript.

Funding

This research was funded by the National Research Foundation, Prime Minister’s Office, Singapore, under its Medium-Sized Center Program and Central GAP (Project No. TAP2502020-05-02), and by the Singapore Ministry of Education under its Research Center of Excellence award to the Institute for Functional Intelligent Materials, National University of Singapore (Project No. EDUNC-33-18-279-V12).

Institutional Review Board Statement

Not applicable.

Informed Consent Statement

Verbal informed consent was obtained from the volunteer. The rationale for utilizing verbal consent is that the study involved no risk, with non-invasive sample collection and no identifiable personal data recorded, making written consent unnecessary in line with our institutional guidelines for exempt research.

Data Availability Statement

The original contributions presented in this study are included in the article/supplementary material. Further inquiries can be directed to the corresponding author.

Acknowledgments

We thank the Heat Resilience & Performance Centre team at National University of Singapore for their valuable discussions and for providing the sweat samples used in this study.

Conflicts of Interest

The authors declare no conflicts of interest.

References

  1. Popkin, B.M.; D’Anci, K.E.; Rosenberg, I.H. Water, hydration, and health. Nutr. Rev. 2010, 68, 439–458. [Google Scholar] [CrossRef]
  2. Goulet, E.D. Dehydration and endurance performance in competitive athletes. Nutr. Rev. 2012, 70 (Suppl. 2), S132–S136. [Google Scholar] [CrossRef]
  3. Bekheirnia, M.R.; Schrier, R.W. Pathophysiology of water and sodium retention: Edematous states with normal kidney function. Curr. Opin. Pharmacol. 2006, 6, 202–207. [Google Scholar] [CrossRef] [PubMed]
  4. Palmer, B.F.; Clegg, D.J. Physiology and pathophysiology of potassium homeostasis. Adv. Physiol. Educ. 2016, 40, 480–490. [Google Scholar] [CrossRef]
  5. Hew-Butler, T.; Smith-Hale, V.G.; Sabou, J. Exercise-associated electrolyte disorders. Curr. Opin. Endocr. Metab. Res. 2019, 9, 51–55. [Google Scholar] [CrossRef]
  6. Baron, S.; Courbebaisse, M.; Lepicard, E.M.; Friedlander, G. Assessment of hydration status in a large population. Br. J. Nutr. 2015, 113, 147–158. [Google Scholar] [CrossRef]
  7. Baker, L.B. Physiology of sweat gland function: The roles of sweating and sweat composition in human health. Temperature 2019, 6, 211–259. [Google Scholar] [CrossRef] [PubMed]
  8. Yang, D.S.; Ghaffari, R.; Rogers, J.A. Sweat as a diagnostic biofluid. Science 2023, 379, 760–761. [Google Scholar] [CrossRef]
  9. Buono, M.J.; Claros, R.; DeBoer, T.; Wong, J. Na+ secretion rate increases proportionally more than the Na+ reabsorption rate with increases in sweat rate. J. Appl. Physiol. 2008, 105, 1044–1048. [Google Scholar] [CrossRef]
  10. Surapongchai, J.; Saengsirisuwan, V.; Rollo, I.; Randell, R.K.; Nithitsuttibuta, K.; Sainiyom, P.; Leow, C.H.; Lee, J.K. Hydration Status, Fluid Intake, Sweat Rate, and Sweat Sodium Concentration in Recreational Tropical Native Runners. Nutrients 2021, 13, 1374. [Google Scholar] [CrossRef]
  11. Hamouti, N.; Del Coso, J.; Ortega, J.F.; Mora-Rodriguez, R. Sweat sodium concentration during exercise in the heat in aerobically trained and untrained humans. Eur. J. Appl. Physiol. 2011, 111, 2873–2881. [Google Scholar] [CrossRef] [PubMed]
  12. Baker, L.B. Sweating Rate and Sweat Sodium Concentration in Athletes: A Review of Methodology and Intra/Interindividual Variability. Sports Med. 2017, 47, 111–128. [Google Scholar] [CrossRef]
  13. Ranchordas, M.K.; Tiller, N.B.; Ramchandani, G.; Jutley, R.; Blow, A.; Tye, J.; Drury, B. Normative data on regional sweat-sodium concentrations of professional male team-sport athletes. J. Int. Soc. Sports Nutr. 2017, 14, 40. [Google Scholar] [CrossRef] [PubMed]
  14. Baker, L.B.; Stofan, J.R.; Hamilton, A.A.; Horswill, C.A. Comparison of regional patch collection vs. whole body washdown for measuring sweat sodium and potassium loss during exercise. J. Appl. Physiol. 2009, 107, 887–895. [Google Scholar] [CrossRef] [PubMed]
  15. Patterson, M.J.; Galloway, S.D.R.; Nimmo, M.A. Variations in Regional Sweat Composition in Normal Human Males. Exp. Physiol. 2000, 85, 869–875. [Google Scholar] [CrossRef]
  16. Asadi, M.; Nadhum Bahjat, M.; Hosseini, M. A Review on Wearable Sensors for Sodium Detection in Human Sweat. Anal. Bioanal. Electrochem. 2023, 15, 794–814. [Google Scholar] [CrossRef]
  17. Schazmann, B.; Morris, D.; Slater, C.; Beirne, S.; Fay, C.; Reuveny, R.; Moyna, N.; Diamond, D. A wearable electrochemical sensor for the real-time measurement of sweat sodium concentration. Anal. Methods 2010, 2, 342–348. [Google Scholar] [CrossRef]
  18. Pirovano, P.; Dorrian, M.; Shinde, A.; Donohoe, A.; Brady, A.J.; Moyna, N.M.; Wallace, G.; Diamond, D.; McCaul, M. A wearable sensor for the detection of sodium and potassium in human sweat during exercise. Talanta 2020, 219, 121145. [Google Scholar] [CrossRef]
  19. Yang, M.; Sun, N.; Lai, X.; Li, Y.; Zhao, X.; Wu, J.; Zhou, W. Screen-Printed Wearable Sweat Sensor for Cost-Effective Assessment of Human Hydration Status through Potassium and Sodium Ion Detection. Micromachines 2023, 14, 1497. [Google Scholar] [CrossRef]
  20. Sawka, M.N.; Burke, L.M.; Eichner, E.R.; Maughan, R.J.; Montain, S.J.; Stachenfeld, N.S. American College of Sports Medicine position stand. Exercise and fluid replacement. Med. Sci. Sports Exerc. 2007, 39, 377–390. [Google Scholar]
  21. Gao, F.; Liu, C.; Zhang, L.; Liu, T.; Wang, Z.; Song, Z.; Cai, H.; Fang, Z.; Chen, J.; Wang, J.; et al. Wearable and flexible electrochemical sensors for sweat analysis: A review. Microsyst. Nanoeng. 2023, 9, 1. [Google Scholar] [CrossRef] [PubMed]
  22. Shitanda, I.; Komoda, M.; Hoshi, Y.; Itagaki, M. An instantly usable paper-based screen-printed solid-state KCl/Ag/AgCl reference electrode with long-term stability. Analyst 2015, 140, 6481–6484. [Google Scholar] [CrossRef]
  23. Fahmy, H.M.; Abu Serea, E.S.; Salah-Eldin, R.E.; Al-Hafiry, S.A.; Ali, M.K.; Shalan, A.E.; Lanceros-Méndez, S. Recent Progress in Graphene- and Related Carbon-Nanomaterial-based Electrochemical Biosensors for Early Disease Detection. ACS Biomater. Sci. Eng. 2022, 8, 964–1000. [Google Scholar] [CrossRef] [PubMed]
  24. Mukherjee, S.; Mukherjee, A.; Bytesnikova, Z.; Ashrafi, A.M.; Richtera, L.; Adam, V. 2D graphene-based advanced nanoarchitectonics for electrochemical biosensors: Applications in cancer biomarker detection. Biosens. Bioelectron. 2024, 250, 116050. [Google Scholar] [CrossRef]
  25. France-Lanord, A.; Grossman, J.C. Correlations from Ion Pairing and the Nernst-Einstein Equation. Phys. Rev. Lett. 2019, 122, 136001. [Google Scholar] [CrossRef]
  26. Singh, M.R.; Singh, P.G.; Gande, V.V.; Chauhan, R.; Minocha, N. Simplified Universal Equations for Ionic Conductivity and Transference Number. J. Electrochem. Soc. 2024, 171, 073502. [Google Scholar] [CrossRef]
  27. Mazzaracchio, V.; Serani, A.; Fiore, L.; Moscone, D.; Arduini, F. All-solid state ion-selective carbon black-modified printed electrode for sodium detection in sweat. Electrochim. Acta 2021, 394, 139050. [Google Scholar] [CrossRef]
  28. Holmes, N.; Bates, G.; Zhao, Y.; Sherriff, J.; Miller, V. The effect of exercise intensity on sweat rate and sweat sodium and potassium losses in trained endurance athletes. Ann. Sports Med. Res. 2016, 3, 1–4. [Google Scholar]
  29. Braconnier, P.; Milani, B.; Loncle, N.; Lourenco, J.M.; Brito, W.; Delacoste, J.; Maillard, M.; Stuber, M.; Burnier, M.; Pruijm, M. Short-term changes in dietary sodium intake influence sweat sodium concentration and muscle sodium content in healthy individuals. J. Hypertens. 2020, 38, 159–166. [Google Scholar] [CrossRef]
  30. Baker, L.B.; De Chavez, P.J.D.; Nuccio, R.P.; Brown, S.D.; King, M.A.; Sopeña, B.C.; Barnes, K.A. Explaining variation in sweat sodium concentration: Effect of individual characteristics and exercise, environmental, and dietary factors. J. Appl. Physiol. 2022, 133, 1250–1259. [Google Scholar] [CrossRef]
  31. Allsopp, A.J.; Sutherland, R.; Wood, P.; Wootton, S.A. The effect of sodium balance on sweat sodium secretion and plasma aldosterone concentration. Eur. J. Appl. Physiol. Occup. Physiol. 1998, 78, 516–521. [Google Scholar] [CrossRef] [PubMed]
  32. Buono, M.J.; Kolding, M.; Leslie, E.; Moreno, D.; Norwood, S.; Ordille, A.; Weller, R. Heat acclimation causes a linear decrease in sweat sodium ion concentration. J. Therm. Biol. 2018, 71, 237–240. [Google Scholar] [CrossRef] [PubMed]
  33. Rostampour, M.; Lawrence, D.J., Jr.; Hamid, Z.; Darensbourg, J.; Calvo-Marzal, P.; Chumbimuni-Torres, K.Y. Highly Reproducible Flexible Ion-selective Electrodes for the Detection of Sodium and Potassium in Artificial Sweat. Electroanalysis 2023, 35, e202200121. [Google Scholar] [CrossRef]
  34. Kim, D.S.; Jeong, J.M.; Park, H.J.; Kim, Y.K.; Lee, K.G.; Choi, B.G. Highly Concentrated, Conductive, Defect-free Graphene Ink for Screen-Printed Sensor Application. Nano-Micro Lett. 2021, 13, 87. [Google Scholar] [CrossRef] [PubMed]
  35. Liang, B.; Cao, Q.; Mao, X.; Pan, W.; Tu, T.; Fang, L.; Ye, X. An Integrated Paper-Based Microfluidic Device for Real-Time Sweat Potassium Monitoring. IEEE Sens. J. 2021, 21, 9642–9648. [Google Scholar] [CrossRef]
  36. Yoon, J.H.; Park, H.J.; Park, S.H.; Lee, K.G.; Choi, B.G. Electrochemical characterization of reduced graphene oxide as an ion-to-electron transducer and application of screen-printed all-solid-state potassium ion sensors. Carbon Lett. 2020, 30, 73–80. [Google Scholar] [CrossRef]
Figure 1. (a) Graphene dual-sensor design. The graphene-based sensor consists of two working graphene electrodes, a graphene counter, and one reference electrode; (b) cyclic voltammetry of bare sensors under 2 mM K3Fe(CN)6, 0.1 M HCl, and 0.1 M KCl over five cycles across five different dual sensors.
Applsci 15 04970 g001
Figure 2. Schematics of sweat collection experimental procedure. The procedure subjected the participant to three exercise intervals. Each interval started with a 30 min endurance run, followed by a 15 min seated rest before sweat was collected from the forearm, upper arm, and chest, with each sample labeled sequentially. Immediately after the collection, the participant started the next interval.
Applsci 15 04970 g002
Figure 3. Range of detection for sodium and potassium. (a) Response curve, voltage vs time plot (V-t), showing the change in voltage as the concentration of sodium varies from 0.1 mM to 100 mM; (b) semi-logarithmic regressed curve for sodium from 0.1 mM to 100 mM, R2 = 0.9897; (c) response curve, voltage vs time plot (V-t), showing the change in voltage as the concentration of potassium varies from 0.1 mM to 100 mM; (d) semi-logarithmic regressed curve for potassium from 0.1 mM to 100 mM, R2 = 0.9997.
Applsci 15 04970 g003
Figure 4. Stability of sodium and potassium sensors. (a) Sodium selective electrode subjected to 40 mM of sodium chloride and potassium selective electrode subjected to 10 mM of potassium chloride over a period of 1 h; (b) reference electrode with Nafion PVB-NaCl coverage measured against a commercial reference electrode stored in 3 M KCl, with varying concentrations of sodium chloride added. A comparison of our work against a bare SPE reference electrode and another commercial reference electrode is shown in Figure S1.
Applsci 15 04970 g004
Figure 5. Repeatability and reproducibility tests of sodium and potassium ion sensors. (a) Repeatability tests via repeat measurements on the same sodium selective electrodes, with concentrations from 0.1 mM to 100 mM, increasing in tenfold steps; (b) reproducibility tests via identical measurements on the five different sodium selective electrodes, with concentrations from 0.1 mM to 100 mM, increasing in tenfold steps; (c) repeatability tests via repeat measurements on the same potassium sensors, with concentrations from 0.1 mM to 100 mM, increasing in tenfold steps; (d) reproducibility tests via identical measurements on the five different potassium sensors, with concentrations from 0.1 mM to 100 mM, increasing in tenfold steps.
Applsci 15 04970 g005
Figure 6. Variation and trends of sweat sodium and potassium concentrations. (a) Variation of sweat sodium concentration between all three methods of detection (legend: black circle—ICP-OES; blue triangle—commercial sensor; green square—graphene dual sensor). Error bar was set at 10%. (b) Variation of sweat potassium concentration between all three methods of detection (legend: black circle—ICP-OES; blue triangle—commercial sensor; green square—graphene dual sensor). Error bar was set at 10%. (c) Trend showing the changes of sweat sodium concentration across three intervals of exercise (legend: black square—upper arm; green triangle—forearm; blue circle—chest). (d) Trend showing the changes of sweat potassium concentration across three intervals of exercise (legend: cyan square—upper arm; purple triangle—forearm; orange circle—chest).
Applsci 15 04970 g006
Table 1. Average and standard deviation of slope in mV/decade of repeatability, and reproducibility tests for sodium and potassium sensors in mV/decade (n = 5).
SodiumPotassium
(mV/decade)RepeatabilityReproducibilityRepeatabilityReproducibility
Slope59.561.259.361.3
Std. Dev.0.50.91.21.0
Table 2. Selectivity tests with the respective sensors, with estimations of the voltage response using the regression in Figure 3b,d.
Selectivity TestsSodium Selective Electrode Response (mM)Potassium Selective Electrode Response (mM)
10 mM NaCl-<0.1
10 mM KCl<0.1-
10 mM NH4Cl<0.1<0.1
10 mM CaCl2<0.2<0.1
10 mM MgCl2<0.2<0.1
10 mM mix *9.7–10.8 **9.6–10.6 **
* Mixed solution with 10 mM NaCl, KCl, NH4Cl, CaCl2, and MgCl2. ** Received data from five different sensors.
Disclaimer/Publisher’s Note: The statements, opinions and data contained in all publications are solely those of the individual author(s) and contributor(s) and not of MDPI and/or the editor(s). MDPI and/or the editor(s) disclaim responsibility for any injury to people or property resulting from any ideas, methods, instructions or products referred to in the content.

