Abstract
Non-visual techniques for identifying sleep postures have become essential for enhancing sleep health. Conventional methods depend on a costly professional medical apparatus that is challenging to adapt for domestic use. This study developed an economical airbag mattress and introduced a method for detecting sleeping positions via restricted body pressure data. The methodology relies on distributed body pressure data obtained from barometric pressure sensors positioned at various locations on the mattress. Two combinations of base learners were chosen based on the complementary attributes of the model, each of which can be amalgamated through a soft-voting strategy. Additionally, the architectures of Autoencoder and convolutional neural networks were integrated, collectively constituting the base learning layer of the model. Gradient enhancement was utilized in the meta-learner layer to amalgamate the output of the basic learning layer. The experimental findings indicate that the suggested holistic learning model has high classification accuracy of up to 95.95%, precision of up to 96.13%, and F1 index of up to 95.01% in sleep posture recognition assessments and possesses considerable merit. In the subsequent application, the sleep monitoring device identified the sleep posture and employed an air conditioner and an air purifier to create a more comfortable sleep environment. The user can utilize the sleep posture data to improve the quality of sleep and prevent related diseases.
1. Introduction
Sleep health is intricately linked to individuals’ everyday activities and their physical and mental well-being. The restorative and regulatory functions of the human body during sleep sustain its regular operation [1]. The sleeping position significantly influences sleep quality and physiological functions by affecting breathing, blood circulation, and musculoskeletal pressure [2,3,4]. Prevalent sleeping postures encompass supine, lateral, and prone positions [5]. The supine position facilitates airway patency, thereby diminishing the likelihood of sleep apnea and hypoventilation syndrome; however, it is contraindicated for individuals with gastroesophageal reflux disease [6]. The lateral position benefits cardiac function, particularly in patients with cardiovascular conditions, yet prolonged maintenance on the same side may result in scoliosis and muscular strain [7]. Conversely, the prone position, while providing a sense of security, exerts pressure on the chest and abdomen, adversely impacting respiratory and circulatory functions [8].
Impaired sleep quality or sleep disorders adversely impact life and are linked to significant health issues, including pressure ulcers [9], mental illnesses [10], and cardiovascular [11] and cerebrovascular diseases [12]. Accurate identification of sleeping postures is crucial for enhancing sleep quality and preventing illness, making the advancement of effective monitoring and recognition systems a significant focus in sleep health.
The main results of the work in this paper are as follows:
- A model of an airbag mattress that can recognize sleeping posture and modify its softness and stiffness at numerous spots is offered. The methods for recognizing sleeping positions and adjusting firmness utilize identical hardware configurations, hence diminishing system complexity.
- On the basis of using entropy-weighted scores to filter base learners, the complementarity scores between models are combined to filter two sets of base classifier combinations. These two approaches can greatly enhance the complementary nature of the model in ensemble learning, where selected combinations of base classifiers and convolutional neural networks (CNNs) are used together to build the base learning layer of the model. Among other things, CNNs can explore deep relationships between features.
- An ensemble learning model combining voting and stacking was developed. It can not only further extract data features based on the foundational model, thus diminishing the bias of an individual model, but also streamline the model’s structure with hyperparameters optimized for each base model utilizing the Ivy optimization algorithm to enhance model performance.
The rest of this article is structured as follows. Section 2 reviews the pertinent literature; Section 3 delineates the systematic design of the mattress prototype; Section 4 elaborates on the methodology employed during the experiments, encompassing data collection, processing, model construction, and hyperparameter optimization; Section 5 evaluates the experimental results and juxtaposes them with other related methodologies; and Section 6 concludes the study.
2. Related Work
In recent years, machine learning (incl. deep learning) models have achieved considerable theoretical advancements in sleep posture identification. A main challenge facing research on this subject is the collection of the requisite dataset and its associated processing, encompassing both non-contact and contact approaches [13]. Non-contact methods mostly encompass thermal cameras, radar, and similar technologies. A thermal camera is the most straightforward method for obtaining a user’s sleep posture [14,15]. For instance, researchers like Awais Khan et al. [16] employed Red Green Blue (RGB) and thermal cameras for the identification of sleep postures. That study categorized sleep into two conditions, with and without blankets. In the absence of blankets, the quadratic support vector machine attained an accuracy of 96.7%. Conversely, in the presence of blankets, the linear support vector machine achieved a recognition rate of 96%. Additionally, the fusion of normally distributed sequences reached a recognition rate of 99%. Nonetheless, the utilization of thermal cameras for recognizing sleep posture through the capture of thermal radiation imaging of the human body presents significant privacy concerns due to the detailed thermal imaging contours, including sensitive areas. This issue positions radar technology for sleep posture recognition as a promising alternative [17,18,19].
Ka-Hei Lai et al. [20], employed a triple ultra-wideband radar system to transmit electromagnetic waves and acquire inverse positional change data, ultimately determining that the Swin Transformer with lateral and head radar configurations attained the highest prediction accuracy of 80.8%. Nonetheless, the expense associated with radar utilization is excessive for daily application.
In the domain of sleep recognition, contact-based methods are frequently employed, such as accelerometers and pressure sensors. Accelerometer sensors are employed to gather data on subjects’ indicators using devices such as bracelets and headgear [21,22]. Chawakorn Intongkum et al. [23] employed triaxial acceleration signal monitoring to develop a system for monitoring human bed activity and sleep posture. Their triaxial accelerometer sensors, utilizing a single GY-521 sensor, were positioned on the abdominal muscles to gather data, which was subsequently classified using the K-Nearest Neighbor (KNN) algorithm, achieving an average classification accuracy of 93%. Hoang-Dieu Vu et al. [24] described a portable wearable device that uses a single accelerometer to monitor 12 sleep positions. Experiments were conducted on data from 15 participants and used a lightweight deep learning model, AnpoNet, which had a classification accuracy of 94.67% ± 0.80%.
In contrast to accelerometers, pressure sensors do not require wearing and are more suited for home usage, contributing to their popularity in the research of sleeping postures [25,26,27,28]. Among the most suitable for daily application are airbag pressure sensors, as demonstrated in the experiments conducted by Yao Chao et al. [29]. Their primary design features an air spring matrix in the torso area, comprising 121 branching air pathways that segment the torso into four zones, each regulated by four subordinate control units and four air pumps for efficient inflation. Ultimately, the F1 score of the Sparrow Search Algorithm-optimized CNN model reached 99.2%.
Zebo Li et al. [30] developed a sleep posture recognition data acquisition system utilizing SPR-DE. This system resembles the one created by Yao Chao et al., comprising three components, the head, torso, and legs. Ultimately, AdaBoost-SVM was employed as the classification model, achieving an accuracy of 99.9%. An air spring matrix, while more precise, is characterized by complexity, high cost, susceptibility to damage resulting in erroneous data collection, and maintenance challenges. Giacomo Peruzzi et al. [31] proposed a microcontroller-based approach for pose classification using the execution of embedded machine learning models. The results showed that the method was able to maintain a high classification accuracy, achieving 90% classification accuracy with the use of six pressure sensors.
Notable advancements have been made in sleeping posture recognition; nonetheless, the majority depend on intricate frameworks, rendering them impractical for everyday settings. This paper presents an innovative model for sleeping posture recognition that utilizes merely four back airbags positioned at the back, waist, hip, and leg, significantly diminishing reliance on sensors, and introduces a revolutionary integrated classifier for sleep posture identification. The experimental results demonstrate that our developed system can alter mattress softness and hardness using only basic sensors, while also achieving high accuracy in sleep posture identification.
3. System Design
Figure 1 displays the prototype mattress for this design. The first layer is a 30 mm latex foam, which can provide a more comfortable resting experience for the participants. The second layer is a sponge layer, which is utilized to fix and protect the airbags and the primary control panel. In addition, there are four airbags in the sponge layer, the back airbag, waist airbag, hip airbag, and leg airbag. Buried behind each airbag is an air tube that links to the main control panel to generate a branching air channel.
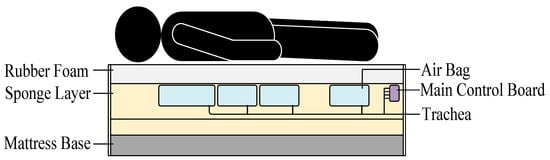
Figure 1.
Prototype mattress.
The structure of the primary control board in Figure 1 is shown in Figure 2. Its core is a high-performance four-core Advanced RISC Machine (ARM) processor, which can achieve great performance, low power consumption, and low cost. When it receives the command to inflate, it will regulate the output valve controller to open the microair pump. The air pressure sensor will monitor the air pressure of each branch in real time, and when the airbag branch air pressure reaches a specified level, it will close the micro air pump. When the subject lies on the mattress, the air pressure sensor monitors the air pressure of each branch in real time and sends the real-time information of the airbag air pressure to the inbuilt system at the speed of one line per second, and the upper computer connects with the main control board through the serial port to obtain the airbag air pressure information in the system.
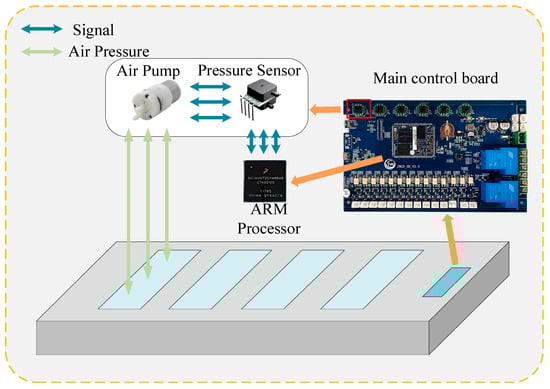
Figure 2.
Main control board structure.
4. Methodology
This section describes the whole process of the sleep posture recognition experiment, including data collection preprocessing, model construction, and judging metrics. The specific process is shown in Figure 3.
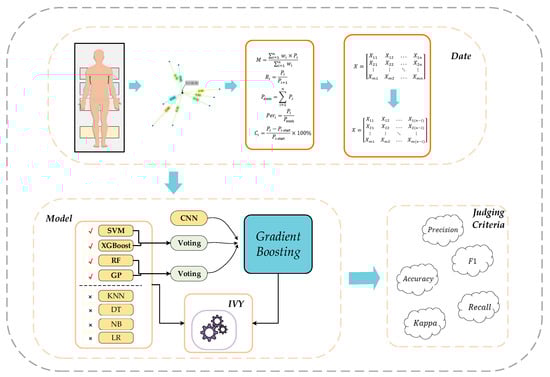
Figure 3.
Experimental flow chart.
4.1. Sleeping Position Definition
Currently, most of the studies on sleep positions are generally based on three basic kinds of sleeping postures, namely: supine, side lying and prone [32]. It was revealed that supine and side lying had the highest usage rate, and the likelihood of creating sleep disorders and pressure sores was also the highest [6]. Considering the bed fall produced by the edge sleeping position, this investigation categorized the sleeping positions into the seven most prevalent sleeping positions. As illustrated in Figure 4, they were discriminated for several positions of the torso, including supine, pressed-legged supine, crossed-legged supine, side lying, baby-side lying, prone, and edge sleeper.
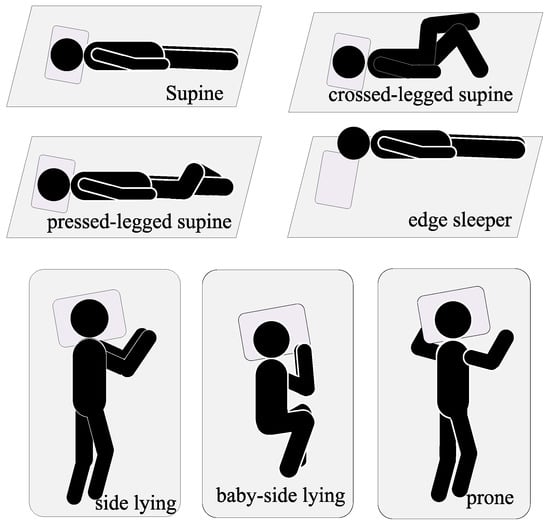
Figure 4.
Definition diagram of the seven sleeping positions.
4.2. Data Collection
Since different users have different body types, in order to improve the accuracy of the experiment, we chose 20 healthy subjects with different body mass index (BMI) health indices, among which the number of lighter subjects was four (BMI < 18.5), the number of standard weight subjects was nine (18.5 ≤ BMI ≤ 23.9), and the number of heavier subjects was seven (BMI > 23.9). Table 1 presents the individual mean values of the indicators with a coverage that is indicative of the majority of the adult population.

Table 1.
Mean values of subjects for each indicator.
In the process of experimental data acquisition, the air pressure values of the four airbags are set to the initial value air pressure (), subjects are classified according to the definition of their sleeping posture, and the experiment is carried out. To avert excessive data duplication, subjects were instructed to remain immobile for 30–40 s after stabilizing each posture to replicate a sleep scenario; approximately 50 data points were collected for each stabilized posture, which included pressure data for the four airbags (back airbag pressure defined as , waist airbag pressure defined as , hip airbag pressure defined as , leg airbag pressure defined as ), while data produced by the rolling action during measurement was also preserved to ensure data validity. In order to imitate their usual sleep scenario, throughout the experiment, individuals made suitable adjustments to the posture according to their comfort situation. Table 2 demonstrates the airbag pressure data for one subject in different positions.
Table 2.
Example of pressure data.
4.3. Feature Engineering
The gathered data were classified, and with each subject as a group, the mean values of four variables, namely, back airbag, waist airbag, hip airbag, and leg airbag, were determined as the centroid of the data in the group. Then, the Euclidean distance () from each data point to the centroid was determined, and the outliers were analyzed based on it, and 80% of them were picked as normal data and the remaining 20% as abnormal data. The Euclidean distance formula is as follows:
where is the mean value of the corresponding airbag air pressure variable.
Feature engineering of normal data following processing of outliers is also a critical stage in machine learning [33]. In order to discover the relationship between body weight and airbag pressure, the idea of ‘relative body weight’ was set. According to the investigations of Zatsiorsky, Seluyanov, and other researchers on the mass of each part of the human body [34,35], the ratio of the mass of the back, waist, hip, and leg to the mass of the complete body of a typical human being is roughly 0.20:0.30:0.10:0.12. In the present work, we used the magnitude of the values of the airbag pressure in the four sections of the human body as a surrogate for the magnitude of the mass to calculate a ‘relative weight’ of the human body. In order to find the relationship between the airbag air pressures, the ratio between the airbag air pressures (), the ratio of the airbag air pressures to the total air pressures (), the rate of change of the airbag air pressures relative to the initial air pressures (), and the sum of the pressures of the airbags () were also calculated.
4.4. Ensemble Learning
Ensemble learning is a strong machine learning strategy that tries to improve the performance of a model by combining numerous learnings to solve a problem. The core notion of ensemble learning is to build a final prediction by constructing many base learners and having them make independent predictions on the input data, and then somehow merging the predictions of each base learner to produce a final prediction [36]. There are four main ways to ensemble learning: Bagging, Boosting, Stacking, and Voting. Among them, the representative algorithm for Bagging is Random Forest (RF) [37], and the representative methods for Boosting include Extreme Gradient Boosting (XGBoost) [38].
Voting is utilized to make the ultimate decision by integrating the prediction results of numerous base classifiers. Specifically, for each test sample, different base classifiers will give their respective prediction findings, and then the voting technique will pick the final category based on these predictions. One of the most representative methods is soft voting [39], which calculates the final probability of the ensemble learning model for the sample belonging to each category by weighting the average of the predicted probabilities of the samples belonging to each category output by each base classifier.
where represents the category, represents the weight of each base classifier in soft voting, and represents the prediction probability of each base classifier.
Stacking, on the other hand, builds a more powerful ensemble learning model by combining several different base learners [40], the basic idea of which is to first use several different base learners to learn and predict the training data, and then pass the outputs of these base learners to the meta-learner as new features to allow it to learn and train on these new features, and ultimately obtain the prediction results of the Stacking ensemble learning model’s prediction results.
In the design and execution of this experiment, we prioritized the optimization of model performance and the effective utilization of resources. We developed a model fusion technique that employs a soft voting procedure and layered meta-learning layers. A soft voting technique was initially employed on the complementary models to enhance the performance of the basic learner. Thereafter, these results were conveyed to the meta-learning layer for consolidation. The meta-learning layer derived deep feature correlations from the data and later generated the final outcomes. This method substantially diminishes the intricacy of the model architecture and prevents the development of excessively huge and complicated model frameworks. Simultaneously, it facilitates a substantial decrease in the utilization of computational resources.
4.5. Judging Criteria
In this experiment on sleeping position identification, in order to completely and accurately quantify the performance of the model, five basic metrics are used, including accuracy, precision, recall, F1, and Kappa [13].
where TP refers to the number of samples from the positive category that the model correctly predicts as positive, TN refers to the number of samples from other non-target categories that the model correctly predicts as other non-target categories, TP refers to the number of samples outside of the category that the model incorrectly predicts as that category, TN refers to the number of samples from the positive category that the model incorrectly predicts as other categories.
Among these measures, Accuracy is used to test the overall classification accuracy of the model, Precision focuses more on measuring the accuracy of the model’s prediction in positive instances, and Recall focuses on measuring how effectively the model covers positive cases. F1 is a reconciled average of Precision and Recall, which provides a more thorough assessment of the model’s performance, and the Kappa is aimed to quantify inter-model consistency.
4.6. Selection of Base Learners
Presently, in the realm of ensemble learning, the predominant method for base-learner selection is the entropy-weighted score [32]. However, this approach solely identifies the base learner with superior overall performance and does not adequately capture the complementary capabilities among base learners in ensemble learning. Consequently, we offer a novel evaluation metric, the complementarity score, to identify base learner models that are complementary to it after the entropy-weighted score has filtered the high-quality base learner models, aiming to develop a superior ensemble learning model.
During the preliminary selection step of base learners, we integrate four assessment metrics (Accuracy, F1, AUC, and Kappa) to identify the most appropriate base learners. The candidate base learners include Logistic Regression (LR) [41], Naive Bayes (NB) [42], Decision Tree (DT) [43], KNN [44], RF, Support Vector Machine (SVM) [45], XGBoost, and Gaussian Process(GP) [46]. By calculating the entropy-weighted scores of each base learner, as illustrated in Figure 5, SVM and RF exhibited superior overall performance, achieving entropy-weighted scores of 25.53 and 24.83, respectively. The Decision Tree and KNN models, exhibiting lower entropy-weighted scores, contributed less to the overall efficacy of the sleeping posture classification task and were hence eliminated from the upcoming investigation.
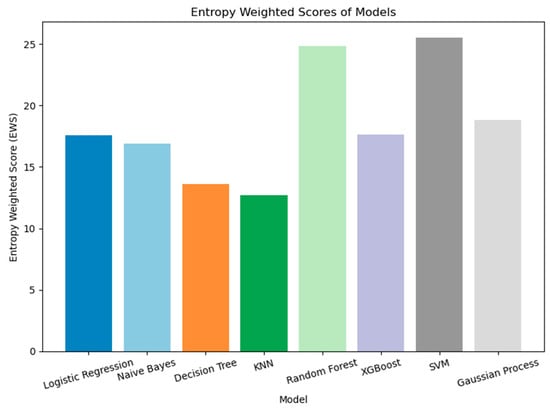
Figure 5.
Entropy-weighted scores for each base learner.
To further optimize the ensemble learning model, we computed the complementarity scores between the remaining candidate base learners and the two high-performing base learners, SVM and RF. The criterion for computing the complementarity score integrates Accuracy, the Kappa coefficient, and the overlap of misclassified samples, applying a weighting ratio of 1:1:3 to emphasize the complementary characteristics among the models. Figure 6 illustrates that SVM and XGBoost exhibit the highest complementarity scores; RF and GP also demonstrate notable complementarity scores. Consequently, we ultimately selected two combinations of base learners, SVM + XGBoost and RF + GP, to enhance the performance and stability of ensemble learning.
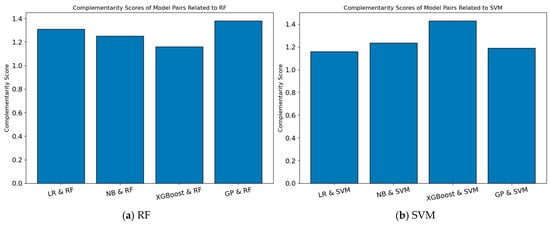
Figure 6.
Complementarity scores of candidate models and SVM or RF.
The entropy-weighted composite score () and complementarity score () are calculated as follows:
where is the score of the model on the jth metric, is the entropy value of model , is a small constant, , , is the weight of each metric, represents the size of the intersection of error samples between the two models, and represents the size of the concatenation of error samples among the two models.
The confusion matrix in Figure 7 shows the results for the two most efficient classifiers and their results after soft voting with the integration of the complementary models. It can be seen that RF and SVM are less accurate for supine, cross-legged supine, supine, and edge sleepers; however, these deficiencies are clearly strengthened after soft voting with the supplementary model. Although there was a slight attenuation of some of the dominant terms, it was not significant.
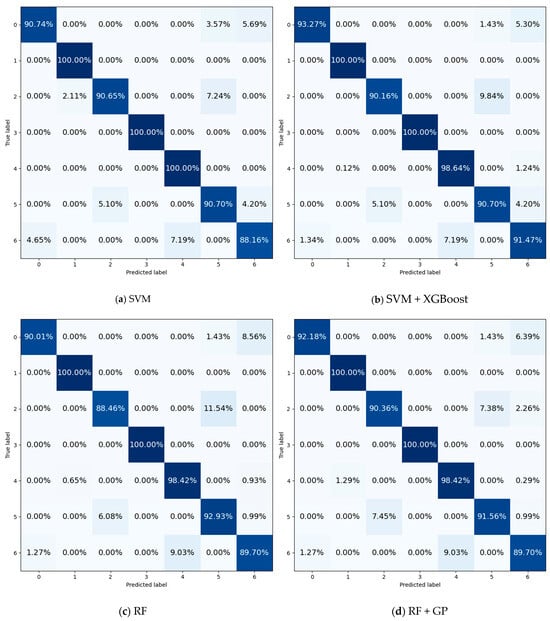
Figure 7.
Comparison of model results before and after complementarity.
To more fully capture the intricate interactions among the feature values, we incorporate CNN as a foundational learner in the ensemble learning models. The incorporation of CNN not only helped with the predictive performance of the overall model but also offered more varied feature representations for the integrated model, hence improving its generalization capability. To enhance data representation, we initially executed dimensionality reduction of the original features via Autoencoder, which condenses high-dimensional data into a low-dimensional space to more effectively capture underlying patterns. This dimensionality reduction technique efficiently diminishes data complexity while retaining essential feature information, hence enhancing the quality of data input for subsequent model training.
Intricate CNN architecture may result in model overfitting; hence, we have devised a streamlined CNN structure, including two convolutional layers and two pooling layers, as illustrated in Figure 8. This design decreases computational complexity while progressively extracting high-level features from the data. The classification output is finalized by a fully linked layer to enhance the model’s performance on intricate datasets. We utilized the cross-entropy loss function as the target during training and employed the Adam optimizer to update parameters, hence enhancing the convergence speed and ensuring elevated classification accuracy. This approach integrates the dimensionality reduction capabilities of self-encoders with the robust feature learning abilities of CNNs, enhancing the performance of the combined model while ensuring computational efficiency and prediction stability.
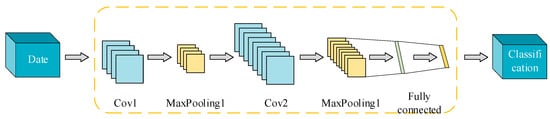
Figure 8.
CNN model structure diagram.
4.7. Characteristic Importance Analysis
To identify appropriate features from numerous options, we conducted a comprehensive feature importance analysis for each base learner.
In the XGBoost model, the feature significance score is derived from the “feature_importances_” attribute, which is based on the frequency of the feature as a split node in the tree structure and the gain associated with each split. The SVM model acquires feature coefficients through the “coef_” attribute and utilizes their absolute values as a measure of feature importance, indicating the extent of the effect of features on the decision boundary. The GP evaluates feature significance by computing the absolute difference between the means of features across several categories. RF use the “feature_importances_” attribute to evaluate the significance of features based on their mean impurity reduction in the decision tree. The disparity in the scales of feature significance scores from various models complicates direct comparison. Consequently, in this investigation, the feature importance scores from each model were standardized using StandardScaler to ensure uniformity in scale. Thereafter, the standardized feature importance scores from all models were consolidated, and the mean standardized importance of each feature across models was computed and normalized to the [0, 1] range.
Figure 9 clearly illustrates substantial disparities in the contributions of several characteristics to the model’s prediction efficacy. Relative body weight holds the utmost significance, with a score nearing 1, signifying its crucial involvement in the model and its indispensable contribution to the predictive capacity of the target variable. Alongside relative body weight, the significance of attributes such as back airbag, leg airbag, waist airbag, and hip airbag is notably substantial, suggesting that these raw data are similarly significant in model prediction. Simultaneously, the significance of certain composite features (e.g., Waist Airbag to Hip Airbag Pressure Ratio, Back Airbag Change Rate, and Total Airbag Pressure) is notably pronounced, indicating a potential nonlinear relationship among the features that merits further exploration. Nevertheless, the chart indicates that certain traits are of minimal significance. These traits may exert a minimal impact on the target variables or exhibit a significant level of redundancy. In the subsequent investigation, the nine principal properties identified in the analysis were utilized as fundamental inputs to the model, thereby enhancing its structure.
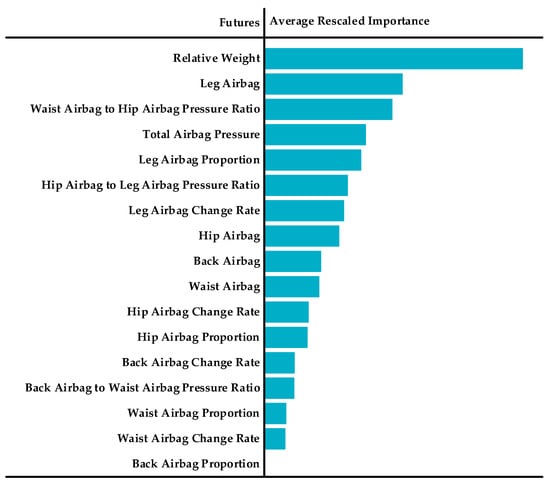
Figure 9.
Average Rescaled Feature Importance.
4.8. Sleep Posture Recognition Method
During the preliminary phase of this study, we conducted numerous experiments and discovered that various models emphasize distinct aspects for different individuals and sleeping positions. Consequently, we proposed an ensemble learning approach, which comprises two components, the base learner and the meta-learner. The base learner comprises two groups of machine learning algorithms (SVM + XGBoost, RF + GP) and one deep learning method (Autoencoder + CNNs). To prevent the input feature dimension of the meta-learner from being excessively high, the two sets of machine learning algorithms were firstly combined independently using a soft voting mechanism, with voting weights assigned based on each model’s accuracy on the training set. This weight allocation process can enhance the performance of the superior model while mitigating the adverse effects of the inferior model on the final decision, achieving the complementary benefits of the models.
The meta-learner part is tasked with synthesizing the outputs of the previously described base learner. It is trained with a Gradient Boosting classifier due to its superior efficacy in managing intricate datasets and integrating many input features. The meta-learner produces the ultimate categorization outcomes by integrating the prediction capabilities of various models. This hierarchical framework maximizes the benefits of each model while substantially mitigating the danger of overfitting via multi-model integration. Figure 10 illustrates the experimental flowchart.
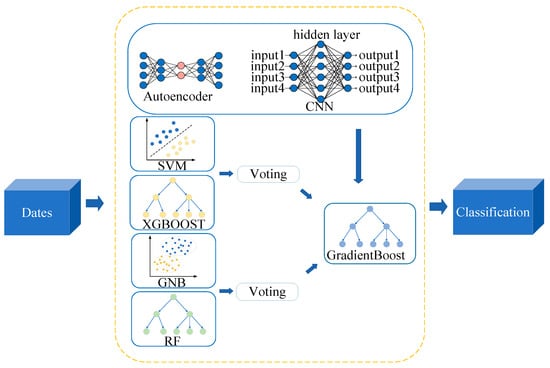
Figure 10.
Model structure diagram.
To mitigate the issue of bias arising from varying adaptations to disparate data in the multi-model fusion learning process, it is imperative to implement a cross-validation technique for data partitioning and model evaluation throughout the integrated model’s development phase [47]. Figure 11 illustrates that in the KFCV module, the dataset is partitioned into numerous segments for the training of several base models. The base models generate predictions on the test data subsequent to training on the training set. The prediction outcomes of these basic models are sent as input data to the meta-model layer, resulting in the final prediction outcome Y. This design can significantly enhance the model’s accuracy and generalization capacity through extensive cross-validation and model integration. This work employs a five-fold cross-validation method, which optimizes the balance between accuracy and computing expense in model evaluation, hence facilitating a more thorough assessment of model performance.
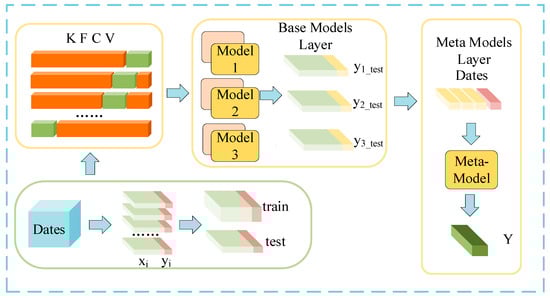
Figure 11.
Cross-validation flowchart.
4.9. Hyperparameter
Hyperparameter tuning is a crucial phase in the optimization of integrated learning. The optimization approach enhances the model’s performance on both training and test datasets, markedly increasing prediction accuracy on unfamiliar data [48]. This study used the IVY algorithm, an optimization method inspired by simulated vine growth, for hyperparameter optimization of the model [49]. In contrast to conventional hyperparameter optimization techniques, evolutionary algorithms may necessitate greater processing resources, and particle swarm optimization is susceptible to local optima; however, IVY can diminish computational overhead while preserving high accuracy.
The training set data is initially employed for hyperparameter optimization of each base model, with the ideal hyperparameter combinations serving as a crucial foundation for further model training and prediction. The number of iterations for each model is established at 200 to guarantee enough tuning for enhanced overall performance. Given the limited number of parameters in GP and their minimal influence on model performance, which is not cost-effective, hyper-parameter optimization was not conducted. The optimal values post-optimization are presented in Table 3.
Table 3.
Hyperparameter configuration.
5. Results
5.1. Analysis of Sleeping Position Classification Results
After completing the five-fold cross-validation, a more extensive analysis of the results was achieved. The overall accuracy reached 95.63%, which means that the model has achieved a high degree of overall performance. The confusion matrix is given in Figure 12a. Specifically, the classification correct rate of pressed-legged supine and side lying can reach 100%, and the classification correct rate of the baby-side lying category is also as high as 99.71%, which fully proves that the features of these three sleeping postures have a very distinctive character, and that the model has a strong discriminatory ability for these two categories.
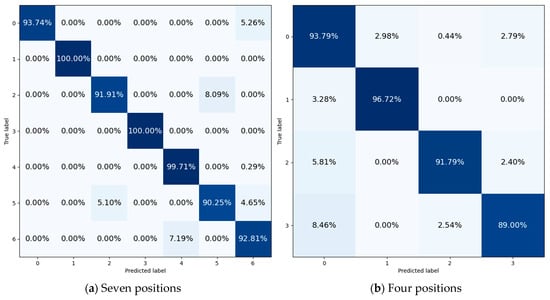
Figure 12.
Confusion matrix under two definitions.
However, for some other categories, although the correct classification rate is also at a high level, there is still some room for improvement. For example, the correct classification rate of supine is 93.74%, and some of the samples are incorrectly classified as ‘borderline sleeping position’. This phenomenon indicates that the model does not accurately grasp the distinguishing features between supine and edge sleeper in the key aspects of feature extraction and classification decision. There was also a high misclassification between crossed-legged supine and prone, which may be due to the high similarity between crossed-legged supine and prone in the feature dimensions of back airbag pressure and waist airbag pressure. In addition, the misclassification rate of 7.19% between edge sleeper and baby-side lying also failed to adequately capture the key differences between these two types of data, resulting in the susceptibility to misclassification during the classification process.
The majority of current sleep posture research provide fixed positions to individuals, yielding experimental data that lack generalizability. Consequently, we performed an additional series of tests, gathering sleep posture data from 20 volunteers, encompassing only four sleeping positions (supine lying, side lying, prone and edge sleeper), without imposing fixed limb postures to reflect real-life settings. The ultimate accuracy was 93.77%; the confusion matrix is given in Figure 12b. Given that the four vaguely defined sleeping postures do not consider the limbs, yet they influence the air pressure of each airbag, it is expected that the accuracy of these four fuzzy-defined postures is inferior to that of the seven distinctly defined sleeping postures.
5.2. Comparison of Results
We empirically assessed the performance of GP, XGBoost, RF, SVM, CNN, and our suggested enhanced model in classification tasks. The efficacy of each model was rigorously evaluated using four principal metrics: Accuracy, Precision, F1 score, and Kappa statistic.
Table 4 indicates that the performance of the GP was comparatively suboptimal, achieving an accuracy of 91.54%. This limitation arises from the model’s assumption of feature independence, which may hinder its adaptability to complicated real-world data. XGBoost and RF demonstrated superior performance, achieving Accuracies of 93.18% and 94.21%, respectively, confirming the efficacy of the ensemble learning model in handling high-dimensional and nonlinear data. The SVM achieved an Accuracy of 94.31%, with Precision and F1 index values of 94.35% and 93.31%, respectively, indicating its robust generalization capability on high-dimensional feature data. CNN enhanced its classification performance, achieving an Accuracy of 94.66%, the highest among all base-learner models.
Table 4.
Model comparison table.
Our enhanced model demonstrated substantial advancements across all evaluation parameters, achieving Accuracy, Precision, F1, and Kappa of 95.63%, 95.70%, 95.63%, and 94.90%, respectively, thereby surpassing other models thoroughly. This results from the comprehensive integration of various complementary base learning models to enhance the model’s accuracy and resilience, with the deep learning amalgamation of auto-encoder and CNN for the extraction of more profound features. This outcome illustrates that our suggested model can proficiently encapsulate the intricate characteristics of the data while also markedly enhancing the accuracy and stability of the classification task through its unique model architecture and algorithm optimization.
To validate the superiority of our proposed model in integration learning, we conduct a thorough comparison with existing classical integration learning approaches, including TreeBag, AdaBoost, Voting, and Stacking. The results in Figure 13 demonstrate that our model surpassed the other techniques across multiple evaluation metrics. This signifies that our approach possesses significant advantages in sleep posture identification and can offer a more dependable solution.
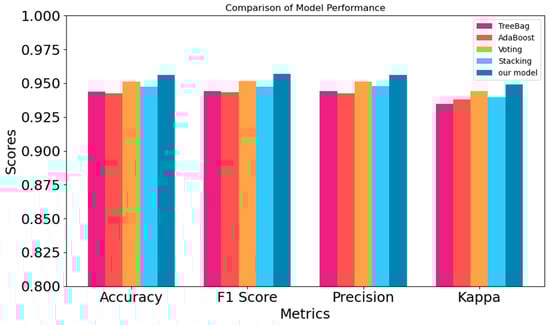
Figure 13.
Experimental comparison with other integrated learning models.
Table 5 depicts a comparison between our current studies and the most sophisticated and representative experiments available. The utilization of RGB and thermal cameras is significantly more precise than non-contact sensors, as they may directly capture body contour maps, facilitating improved access to body position markers, albeit potentially disclosing private information. Our method demonstrates significantly greater precision compared to the approach utilizing triple ultra-wideband radar. In comparison to the contact sensors, our approach demonstrates a more superior performance relative to the method employing accelerometer sensors and conventional pressure sensors, attributable to the latter’s collection of greater interference data. Nonetheless, our findings are inferior to those of the intensive airbag pressure sensor, which uses more sensors and more accurate sensors. In contrast, our sparse airbag sensor technology is more appropriate for everyday usage due to its lower cost and ease of maintenance.
Table 5.
Comparison with different sensor methods of recognizing sleeping position.
6. Discussion
The results show that the sleeping posture recognition model constructed based on the barometric pressure sensor shows good performance, and it can accurately recognize multiple sleeping posture categories. The system achieves a high level of accuracy both in the seven well-designed and clearly defined sleeping postures, and in the four vaguely defined experimental conditions of supine, side lying, prone, and edge without limitation of limb postures to validate the generality of the system.
This sleep posture recognition system has extensive practical applications. In the healthcare sector, it can assist specialists in monitoring patients’ sleeping positions. For patients with certain ailments, suitable sleeping positions can mitigate symptoms and enhance recovery. Additionally, real-time monitoring and feedback on patients’ sleeping postures enable healthcare providers to offer more precise sleep coaching. This system can autonomously modify the mattress’s firmness based on the user’s sleeping position, enhancing comfort while simultaneously gathering real-time data on the sleeping posture to mitigate risks of falls and sleep disorders.
Nonetheless, it is important to acknowledge the existing limitations of this study. This sleep position identification system was tested solely during a brief trial period and within a controlled environment, leaving its efficacy in more intricate and prolonged scenarios of full-night sleep unexamined and unassessed. Subsequent research must prioritize the long night sleep scenario to enhance the system’s recognition accuracy and reliability during prolonged nocturnal rest. This can be achieved by optimizing the algorithms, enhancing the sensor performance, or employing advanced data processing techniques, thereby ensuring the sleep recognition system aligns more closely with practical application requirements.
Author Contributions
Conceptualization, C.L., G.R. and Z.W.; methodology, C.L. and G.R.; software, G.R.; validation, G.R.; formal analysis, Z.W.; investigation, G.R.; resources, C.L. and Z.W.; data curation, G.R.; writing—original draft preparation, G.R.; writing—review and editing, G.R.; visualization, G.R.; supervision, C.L. and Z.W.; project administration, Z.W.; funding acquisition, Z.W. All authors have read and agreed to the published version of the manuscript.
Funding
This research received no external funding.
Institutional Review Board Statement
The National Health and Health Commission, Ministry of Education, Ministry of Science and Technology, and the State Administration of Traditional Chinese Medicine publicly released the ‘Life Science and Medical Research Involving Human Beings’ in February 2023, which stipulates that ‘under the premise of using information data or biological samples of human beings, not causing harm to human beings, and not involving sensitive personal information or commercial interests. Ethical review may be waived for life sciences and medical research involving human beings in some cases’. Ethical approval was not necessary as the data for this study did not include any information that would identify individuals.
Informed Consent Statement
Informed consent was obtained from all subjects involved in the study.
Data Availability Statement
The data supporting the reported results are not available due to privacy restrictions. Protecting the privacy of the individuals involved in this study is of utmost importance, and thus, we are unable to share the relevant data.
Conflicts of Interest
The authors declare no conflict of interest.
References
- Ramar, K.; Malhotra, R.K.; Carden, K.A.; Martin, J.L.; Abbasi-Feinberg, F.; Aurora, R.N.; Kapur, V.K.; Olson, E.J.; Rosen, C.L.; Rowley, J.A. Sleep is essential to health: An American Academy of Sleep Medicine position statement. J. Clin. Sleep Med. 2021, 17, 2115–2119. [Google Scholar] [CrossRef]
- Lim, D.C.; Najafi, A.; Afifi, L.; Bassetti, C.L.; Buysse, D.J.; Han, F.; Högl, B.; Melaku, Y.A.; Morin, C.M.; Pack, A.I. The need to promote sleep health in public health agendas across the globe. Lancet Public Health 2023, 8, e820–e826. [Google Scholar] [CrossRef] [PubMed]
- Ji, K.-H.; Yun, C.-H. Emerging Technologies to Track and Improve Sleep Health. Sleep Med. Clin. 2025, 20, 47–55. [Google Scholar] [CrossRef] [PubMed]
- Dashti, H.S.; Cade, B.E.; Stutaite, G.; Saxena, R.; Redline, S.; Karlson, E.W. Sleep health, diseases, and pain syndromes: Findings from an electronic health record biobank. Sleep 2021, 44, zsaa189. [Google Scholar] [CrossRef] [PubMed]
- Zhang, Y.; Xiao, A.; Zheng, T.; Xiao, H.; Huang, R. The relationship between sleeping position and sleep quality: A flexible sensor-based study. Sensors 2022, 22, 6220. [Google Scholar] [CrossRef]
- Yo, S.W.; Joosten, S.A.; Wimaleswaran, H.; Mansfield, D.; Thomson, L.; Landry, S.A.; Edwards, B.A.; Hamilton, G.S. Body position during laboratory and home polysomnography compared to habitual sleeping position at home. J. Clin. Sleep Med. 2022, 18, 2103–2111. [Google Scholar] [CrossRef]
- Piele, D.; Ilie, E.; Rusu, L.; Marin, M.I. Relevance of Surface Electromyography Assessment and Sleep Impairment in Scoliosis: A Pilot Study. Appl. Sci. 2023, 13, 11108. [Google Scholar] [CrossRef]
- Gattinoni, L.; Tognoni, G.; Pesenti, A.; Taccone, P.; Mascheroni, D.; Labarta, V.; Malacrida, R.; Di Giulio, P.; Fumagalli, R.; Pelosi, P. Effect of prone positioning on the survival of patients with acute respiratory failure. N. Engl. J. Med. 2001, 345, 568–573. [Google Scholar] [CrossRef]
- Mäki-Turja-Rostedt, S.; Leino-Kilpi, H.; Korhonen, T.; Vahlberg, T.; Haavisto, E. Consistent practice for pressure ulcer prevention in long-term older people care: A quasi-experimental intervention study. Scand. J. Caring sciences 2021, 35, 962–978. [Google Scholar] [CrossRef]
- Harvey, A.G.; Dong, L.; Hein, K.; Yu, S.H.; Martinez, A.J.; Gumport, N.B.; Smith, F.L.; Chapman, A.; Lisman, M.; Mirzadegan, I.A. A randomized controlled trial of the Transdiagnostic Intervention for Sleep and Circadian Dysfunction (TranS-C) to improve serious mental illness outcomes in a community setting. J. Consult. Clin. Psychol. 2021, 89, 537. [Google Scholar] [CrossRef]
- Gottesman, R.F.; Lutsey, P.L.; Benveniste, H.; Brown, D.L.; Full, K.M.; Lee, J.-M.; Osorio, R.S.; Pase, M.P.; Redeker, N.S.; Redline, S. Impact of sleep disorders and disturbed sleep on brain health: A scientific statement from the American Heart Association. Stroke 2024, 55, e61–e76. [Google Scholar] [CrossRef] [PubMed]
- Zhang, L.; Li, G.; Bao, Y.; Liu, M. Role of sleep disorders in patients with cardiovascular disease: A systematic review. Int. J. Cardiol. Cardiovasc. Risk Prev. 2024, 21, 200257. [Google Scholar] [CrossRef]
- Li, X.; Gong, Y.; Jin, X.; Shang, P. Sleep posture recognition based on machine learning: A systematic review. Pervasive Mob. Comput. 2023, 90, 101752. [Google Scholar] [CrossRef]
- Jakkaew, P.; Onoye, T. Non-contact respiration monitoring and body movements detection for sleep using thermal imaging. Sensors 2020, 20, 6307. [Google Scholar] [CrossRef] [PubMed]
- Özdil, A.; Yılmaz, B. Automatic body part and pose detection in medical infrared thermal images. Quant. InfraRed Thermogr. J. 2022, 19, 223–238. [Google Scholar] [CrossRef]
- Khan, A.; Kim, C.; Kim, J.-Y.; Nam, Y. Sleep Posture Classification Using RGB and Thermal Cameras Based on Deep Learning Model. CMES-Comput. Model. Eng. Sci. 2024, 140, 1729–1755. [Google Scholar] [CrossRef]
- Lai, D.K.-H.; Zha, L.-W.; Leung, T.Y.-N.; Tam, A.Y.-C.; So, B.P.-H.; Lim, H.-J.; Cheung, D.S.K.; Wong, D.W.-C.; Cheung, J.C.-W. Dual ultra-wideband (UWB) radar-based sleep posture recognition system: Towards ubiquitous sleep monitoring. Eng. Regen. 2023, 4, 36–43. [Google Scholar] [CrossRef]
- Lai, D.K.-H.; Tam, A.Y.-C.; So, B.P.-H.; Chan, A.C.-H.; Zha, L.-W.; Wong, D.W.-C.; Cheung, J.C.-W. Deciphering Optimal Radar Ensemble for Advancing Sleep Posture Prediction through Multiview Convolutional Neural Network (MVCNN) Approach Using Spatial Radio Echo Map (SREM). Sensors 2024, 24, 5016. [Google Scholar] [CrossRef]
- Liu, X.; Jiang, W.; Chen, S.; Xie, X.; Liu, H.; Cai, Q.; Tong, X.; Shi, T.; Qu, W. PosMonitor: Fine-grained sleep posture recognition with mmWave radar. IEEE Internet Things J. 2023, 11, 11175–11189. [Google Scholar] [CrossRef]
- Lai, D.K.-H.; Yu, Z.-H.; Leung, T.Y.-N.; Lim, H.-J.; Tam, A.Y.-C.; So, B.P.-H.; Mao, Y.-J.; Cheung, D.S.K.; Wong, D.W.-C.; Cheung, J.C.-W. Vision Transformers (ViT) for blanket-penetrating sleep posture recognition using a triple ultra-wideband (UWB) radar system. Sensors 2023, 23, 2475. [Google Scholar] [CrossRef]
- Jeon, Y.; Kim, S.; Kang, S. A Method for Detecting Movement and Posture During Sleep Using an Acceleration Sensor of a Wearable Device. IEMEK J. Embed. Syst. Appl. 2022, 17, 1–7. [Google Scholar]
- Yoshihi, M.; Okada, S.; Wang, T.; Kitajima, T.; Makikawa, M. Estimating sleep stages using a head acceleration sensor. Sensors 2021, 21, 952. [Google Scholar] [CrossRef]
- Intongkum, C.; Sasiwat, Y.; Sengchuai, K.; Booranawong, A.; Phukpattaranont, P. Monitoring and Classification of Human Sleep Postures, Seizures, and Falls From Bed Using Three-Axis Acceleration Signals and Machine Learning. SN Comput. Sci. 2023, 5, 104. [Google Scholar] [CrossRef]
- Vu, H.-D.; Tran, D.-N.; Pham, H.-H.; Pham, D.-D.; Can, K.-L.; Dao, T.-H.; Tran, D.-T. Human sleep position classification using a lightweight model and acceleration data. Sleep Breath. 2025, 29, 95. [Google Scholar] [CrossRef]
- He, C.; Fang, Z.; Liu, S.; Wu, H.; Li, X.; Wen, Y.; Lin, J. A smart detection method for sleep posture based on a flexible sleep monitoring belt and vital sign signals. Heliyon 2024, 10, e31839. [Google Scholar] [CrossRef] [PubMed]
- Breuss, A.; Gnarra, O.; Fujs, M.; Schmidt, M.; Riener, R. Sleep position classification with a compact pressure textile sensor mattress using convolutional neural networks. Biomed. Signal Process. Control 2024, 90, 105775. [Google Scholar] [CrossRef]
- Diao, H.; Chen, C.; Yuan, W.; Amara, A.; Tamura, T.; Fan, J.; Meng, L.; Liu, X.; Chen, W. Deep residual networks for sleep posture recognition with unobtrusive miniature scale smart mat system. IEEE Trans. Biomed. Circuits Syst. 2021, 15, 111–121. [Google Scholar] [CrossRef]
- Yoon, J.; Moon, A.; Son, S.W. Effective Posture Classification Using Statistically Significant Data from Flexible Pressure Sensors. IEEE J. Flex. Electron. 2024, 3, 173–180. [Google Scholar] [CrossRef]
- Chao, Y.; Liu, T.; Shen, L.-M. Method of recognizing sleep postures based on air pressure sensor and convolutional neural network: For an air spring mattress. Eng. Appl. Artif. Intell. 2023, 121, 106009. [Google Scholar] [CrossRef]
- Li, Z.; Zhou, Y.; Zhou, G. A dual fusion recognition model for sleep posture based on air mattress pressure detection. Sci. Rep. 2024, 14, 11084. [Google Scholar] [CrossRef]
- Peruzzi, G.; Galli, A.; Giorgi, G.; Pozzebon, A. Sleep Posture Detection via Embedded Machine Learning on a Reduced Set of Pressure Sensors. Sensors 2025, 25, 458. [Google Scholar] [CrossRef] [PubMed]
- Xu, X.; Mo, Q.; Wang, Z.; Zhao, Y.; Li, C. Classification of Sleeping Position Using Enhanced Stacking Ensemble Learning. Entropy 2024, 26, 817. [Google Scholar] [CrossRef]
- Verdonck, T.; Baesens, B.; Óskarsdóttir, M.; vanden Broucke, S. Special issue on feature engineering editorial. Mach. Learn. 2024, 113, 3917–3928. [Google Scholar] [CrossRef]
- De Leva, P. Adjustments to Zatsiorsky-Seluyanov’s segment inertia parameters. J. Biomech. 1996, 29, 1223–1230. [Google Scholar] [CrossRef]
- Winter, D.A. Biomechanics and Motor Control of Human Movement; John Wiley & Sons: Hoboken, NJ, USA, 2009. [Google Scholar]
- Dong, X.; Yu, Z.; Cao, W.; Shi, Y.; Ma, Q. A survey on ensemble learning. Front. Comput. Sci. 2020, 14, 241–258. [Google Scholar] [CrossRef]
- Biau, G.; Scornet, E. A random forest guided tour. Test 2016, 25, 197–227. [Google Scholar] [CrossRef]
- Niazkar, M.; Menapace, A.; Brentan, B.; Piraei, R.; Jimenez, D.; Dhawan, P.; Righetti, M. Applications of XGBoost in water resources engineering: A systematic literature review (Dec 2018–May 2023). Environ. Model. Softw. 2024, 174, 105971. [Google Scholar] [CrossRef]
- Awe, O.O.; Opateye, G.O.; Johnson, C.A.G.; Tayo, O.T.; Dias, R. Weighted hard and soft voting ensemble machine learning classifiers: Application to anaemia diagnosis. In Sustainable Statistical and Data Science Methods and Practices: Reports from LISA 2020 Global Network, Ghana, 2022; Springer: Cham, Switzerland, 2024; pp. 351–374. [Google Scholar]
- Luo, S.; Wang, B.; Gao, Q.; Wang, Y.; Pang, X. Stacking integration algorithm based on CNN-BiLSTM-Attention with XGBoost for short-term electricity load forecasting. Energy Rep. 2024, 12, 2676–2689. [Google Scholar] [CrossRef]
- Bisong, E. Logistic regression. In Building Machine Learning and Deep Learning Models on Google Cloud Platform: A Comprehensive Guide for Beginners; Apress: Berkeley, CA, USA, 2019; pp. 243–250. [Google Scholar]
- Reddy, E.M.K.; Gurrala, A.; Hasitha, V.B.; Kumar, K.V.R. Introduction to Naive Bayes and a review on its subtypes with applications. In Bayesian Reasoning and Gaussian Processes for Machine Learning Applications; Chapman and Hall/CRC: Boca Raton, FL, USA, 2022; pp. 1–14. [Google Scholar]
- Charbuty, B.; Abdulazeez, A. Classification based on decision tree algorithm for machine learning. J. Appl. Sci. Technol. Trends 2021, 2, 20–28. [Google Scholar] [CrossRef]
- Zhang, S. Challenges in KNN classification. IEEE Trans. Knowl. Data Eng. 2021, 34, 4663–4675. [Google Scholar] [CrossRef]
- Abdullah, D.M.; Abdulazeez, A.M. Machine learning applications based on SVM classification a review. Qubahan Acad. J. 2021, 1, 81–90. [Google Scholar] [CrossRef]
- Villacampa-Calvo, C.; Zaldívar, B.; Garrido-Merchán, E.C.; Hernández-Lobato, D. Multi-class Gaussian process classification with noisy inputs. J. Mach. Learn. Res. 2021, 22, 1–52. [Google Scholar]
- Kislay, K.; Singh, S.; Joshi, S.; Dutta, R.; Flint, J.S.G.; Zhu, K. Evaluating K-Fold Cross Validation for Transformer Based Symbolic Regression Models. arXiv 2024, arXiv:2410.21896. [Google Scholar]
- Rimal, Y.; Sharma, N.; Alsadoon, A. The accuracy of machine learning models relies on hyperparameter tuning: Student result classification using random forest, randomized search, grid search, bayesian, genetic, and optuna algorithms. Multimed. Tools Appl. 2024, 83, 74349–74364. [Google Scholar] [CrossRef]
- Ghasemi, M.; Zare, M.; Trojovský, P.; Rao, R.V.; Trojovská, E.; Kandasamy, V. Optimization based on the smart behavior of plants with its engineering applications: Ivy algorithm. Knowl.-Based Syst. 2024, 295, 111850. [Google Scholar] [CrossRef]
Disclaimer/Publisher’s Note: The statements, opinions and data contained in all publications are solely those of the individual author(s) and contributor(s) and not of MDPI and/or the editor(s). MDPI and/or the editor(s) disclaim responsibility for any injury to people or property resulting from any ideas, methods, instructions or products referred to in the content. |
© 2025 by the authors. Licensee MDPI, Basel, Switzerland. This article is an open access article distributed under the terms and conditions of the Creative Commons Attribution (CC BY) license (https://creativecommons.org/licenses/by/4.0/).