Article

Study on the Impact of Ventilation Methods on Droplet Nuclei Transmission in Subway Carriages

School of Energy and Power, Jiangsu University of Science and Technology, Zhenjiang 212000, China
*
Author to whom correspondence should be addressed.
Appl. Sci. 2025, 15(9), 4919; https://doi.org/10.3390/app15094919
Submission received: 10 March 2025 / Revised: 19 April 2025 / Accepted: 23 April 2025 / Published: 29 April 2025

Abstract

:
The environment inside subway carriages is relatively enclosed, putting passengers at risk of respiratory infections during viral pandemics such as COVID-19 and SARS. This paper uses the Euler–Lagrange method to simulate the distribution of droplet nuclei produced by coughing under six different operating conditions in a subway carriage. The study investigates the impact of different air supply characteristics and ventilation methods, including mixed ventilation (MV), floor-supply, and ceiling-return ventilation (SFRC), on the distribution of droplets. These results indicate that under MV mode, the dispersion range of droplets during a patient’s cough is the largest, with an average droplet suspension rate (SR) of up to 77% at the initial moment. The SFRC system markedly diminishes droplet dispersion, decreasing the SR by 35%. Upon increasing the air supply velocity to 0.8 m/s, the SR diminishes to 6%, the probability of particles attaining a 2 m social distance (PRP) declines by roughly 70%, and the weighted average contamination range (CR) of coughing particles reaching a safe social distance reduces by 33.5%. These results may act as a guide for the subsequent design and optimization of airflow patterns in carriages to reduce the risk of cross-infection.

1. Introduction

The global outbreak of viral pandemics has posed unprecedented challenges to public transportation, particularly in densely populated subway carriages. This makes these environments prone to being hotspots for the transmission of infectious diseases [1]. Furthermore, aerosolized droplets can remain suspended in the air for extended periods and are considered one of the primary transmission routes for viruses [2]. This characteristic makes controlling the spread of viruses in underground rail networks more complex and challenging. Studies have found that droplets smaller than 30 μm are minimally affected by gravity and inertia and their transport is mainly governed by the airflow patterns within the room [3]. Therefore, effective ventilation is key to controlling the airborne transmission of respiratory infections, and it is crucial to explore the infection risks within subway systems.
Droplets carrying viruses or bacteria are responsible for the majority of respiratory infections [4,5]. Once susceptible individuals inhale aerosols containing pathogens, respiratory disease transmission events may occur. Viral transmission events are more likely to occur in densely populated indoor spaces, such as classrooms [6], fever clinics [7], and airplane cabins [8].
The particle size of cough droplets ranges from 0.1 to 500 µm [9], with approximately 97% of droplets having a particle size of less than 1 µm [10]. Each cough produces 947–2085 particles [11], with a concentration of 24–23,600 (per liter) [12], and a maximum flow rate of 5–22 m/s [13], with females coughing at a flow rate of 10.6–13.07 m/s [14], and males at 15.2–15.3 m/s [15]. High-velocity airflow rubbing against the respiratory mucosa during coughing may result in exhaled coughing at high velocities, which may cause the mucous membrane to rub against the mucous membrane, with a total of 13.07 m/s in women and 15.2–15.3 m/s in men. The friction between the high-velocity airflow and the mucous membranes of the respiratory tract during coughing may cause the temperature of the exhaled gas to be slightly higher than that of the body temperature (about 34–35 °C). The particle size of cough droplets ranges from 0.01 to 100 µm [9], with about 87% of the droplets having a particle size of less than 1 µm [16], and the maximum flow rate is 1.3–1.4 m/s, with a flow rate of 1.4 m/s for breathing through the nose and a flow rate of 1.3 m/s for breathing through the mouth [17]; the temperature of the inhaled gas is close to the body temperature (32–34 °C), and the temperature distribution is relatively uniform. The likelihood of transmitting respiratory diseases is significantly greater indoors than outdoors. Previous research has explored the transmission of aerosol droplets in various indoor environments, for example, in the case of operating rooms [18] and long-distance buses [19]. Studies have shown that droplets smaller than 30 μm are minimally influenced by gravity and inertia; their transport is primarily influenced by the indoor flow field [3,15]. Therefore, efficient ventilation reduces the airborne transmission of respiratory infections and effective ventilation systems help prevent such spread. Currently, most subway carriages use MV systems with fixed air-supply parameters. However, in relatively enclosed and densely populated subway carriages, traditional MV systems are not ideal for providing a safe and healthy environment. Mahdi Ahmadzadeh [20] conducted research on high-speed train carriages, considering the effects of factors such as temperature and humidity. The results indicate that factors such as ventilation rate, relative humidity, droplet sources, exhaust, physical barriers, and temperature have a significant impact on droplet evaporation and transmission. Luo [21] studied displacement ventilation (DV) systems, demonstrating their effectiveness in improving ventilation performance in enclosed spaces while also reducing the risk of pollutant transmission. Wu [22] revealed the key mechanisms of droplet dispersion in subway cars through CFD numerical simulations. It was found that the position of the infected person significantly affected the ventilation efficiency. This suggests that the airflow organization of the ventilation system needs to be differentiated for the different zones. Similar studies include those by Zee [23], who used CFD simulations to analyze the dispersion of cough-generated droplets in aircraft cabins, a key concern in aviation epidemiology. The results demonstrated that decreased ventilation rates led to an increased dispersion range of droplets throughout the cabin. In order to ascertain the impact of various ventilation configurations, air change rates, breathing patterns, and supply air temperatures on cross-exposure and infection risk were analyzed. Zhang [24] found that in the aircraft cabin, air pollutant transport via airflow is greatly influenced by the differences in passengers breathing and area pollutant concentration evaluation of cross-infection. The results show that the seating layout has a significant impact on pollutants. Dao et al. [25] used CFD simulations to study the transport and evaporation processes of multicomponent cough droplets under different ventilation configurations in hospital wards. The influence of exhaust vent positioning on droplet removal efficacy was examined, and an optimized vent location was recommended to enhance the extraction of droplets from indoor air. John et al. [26] performed an investigation on individual exposure in thermally stratified meeting rooms at varying airflow speeds. Their findings suggested that with increased airflow, exposure may become less reliant on the source’s position. Wei et al. [27] examined the impact of various airflow dispersion techniques on infection probability. Their findings indicated that the position of the affected individual significantly influences the probability of infection in both displacement and wall-mounted ventilation systems. Nevertheless, the latter demonstrated a more significant impact. Li et al. [28] considered two key parameters, with the purpose of exploring the transmission of virus-containing droplets in a dynamic indoor environment, with a particular focus on the interaction between human movement speed and the distance between people. The results indicate that human movement speed and distance affect the size and direction of indoor airflow, influencing the suspension and diffusion of droplets of different sizes, and significantly increase the infection risk for susceptible individuals. Ye et al. [29] pointed out that the use of physical barriers can effectively block exhalation, thereby preventing droplet and airborne transmission over short distances between individuals. Compared to the situation without barriers, the presence of cross and linear barriers increases the concentration within the compartment by an average of 97.2% and 25.5%.
Previous studies have examined the functionality of MV systems, but most of these have focused on the effects of changing the supply and return air vent positions or the location of infected individuals. Many issues still remain unresolved. These issues can be divided into two main themes, the aim being to verify the accuracy of the model assumptions and the simulation scenarios. The use of tracer gas-wrapped droplets in the form of tracer gas provides intuition in terms of visualization and enables a more direct view of the distance of droplet spreading. The study concluded that the better ventilation method is the SFRC air supply method, which can effectively inhibit the spread of droplets. The researchers quantitatively analyzed the arrival distance of particles to determine a safe distance from the infected person in the carriage and assessed the risk of infection in the carriage. Regarding simulated scenarios, there is limited research in the literature on the extent and distribution of contamination with different combinations of ventilation modes and air supply parameters in subway carriages. This study presents scenarios designed with varying air supply parameters and ventilation modes. Suitable parameters, such as suspension rate, contamination range, PRP, and deposition fraction, are mathematically defined and used for quantitative analysis based on computational simulation data, as well as for qualitative assessments. Finally, the optimal operating condition and air supply method were determined through energy consumption analysis, comfort assessment, and the critical Wells–Riley model.
This study analyzed the impact of various exhalation source characteristics on the indoor distribution of cough droplets in crowded and confined subway carriages. A reliable model was developed by comparing experimental data, and the effects of different ventilation modes and air supply speeds on droplet distribution were analyzed. By integrating various infection risk evaluation metrics, the optimal solution was determined under different conditions. The structure is shown in Figure 1.

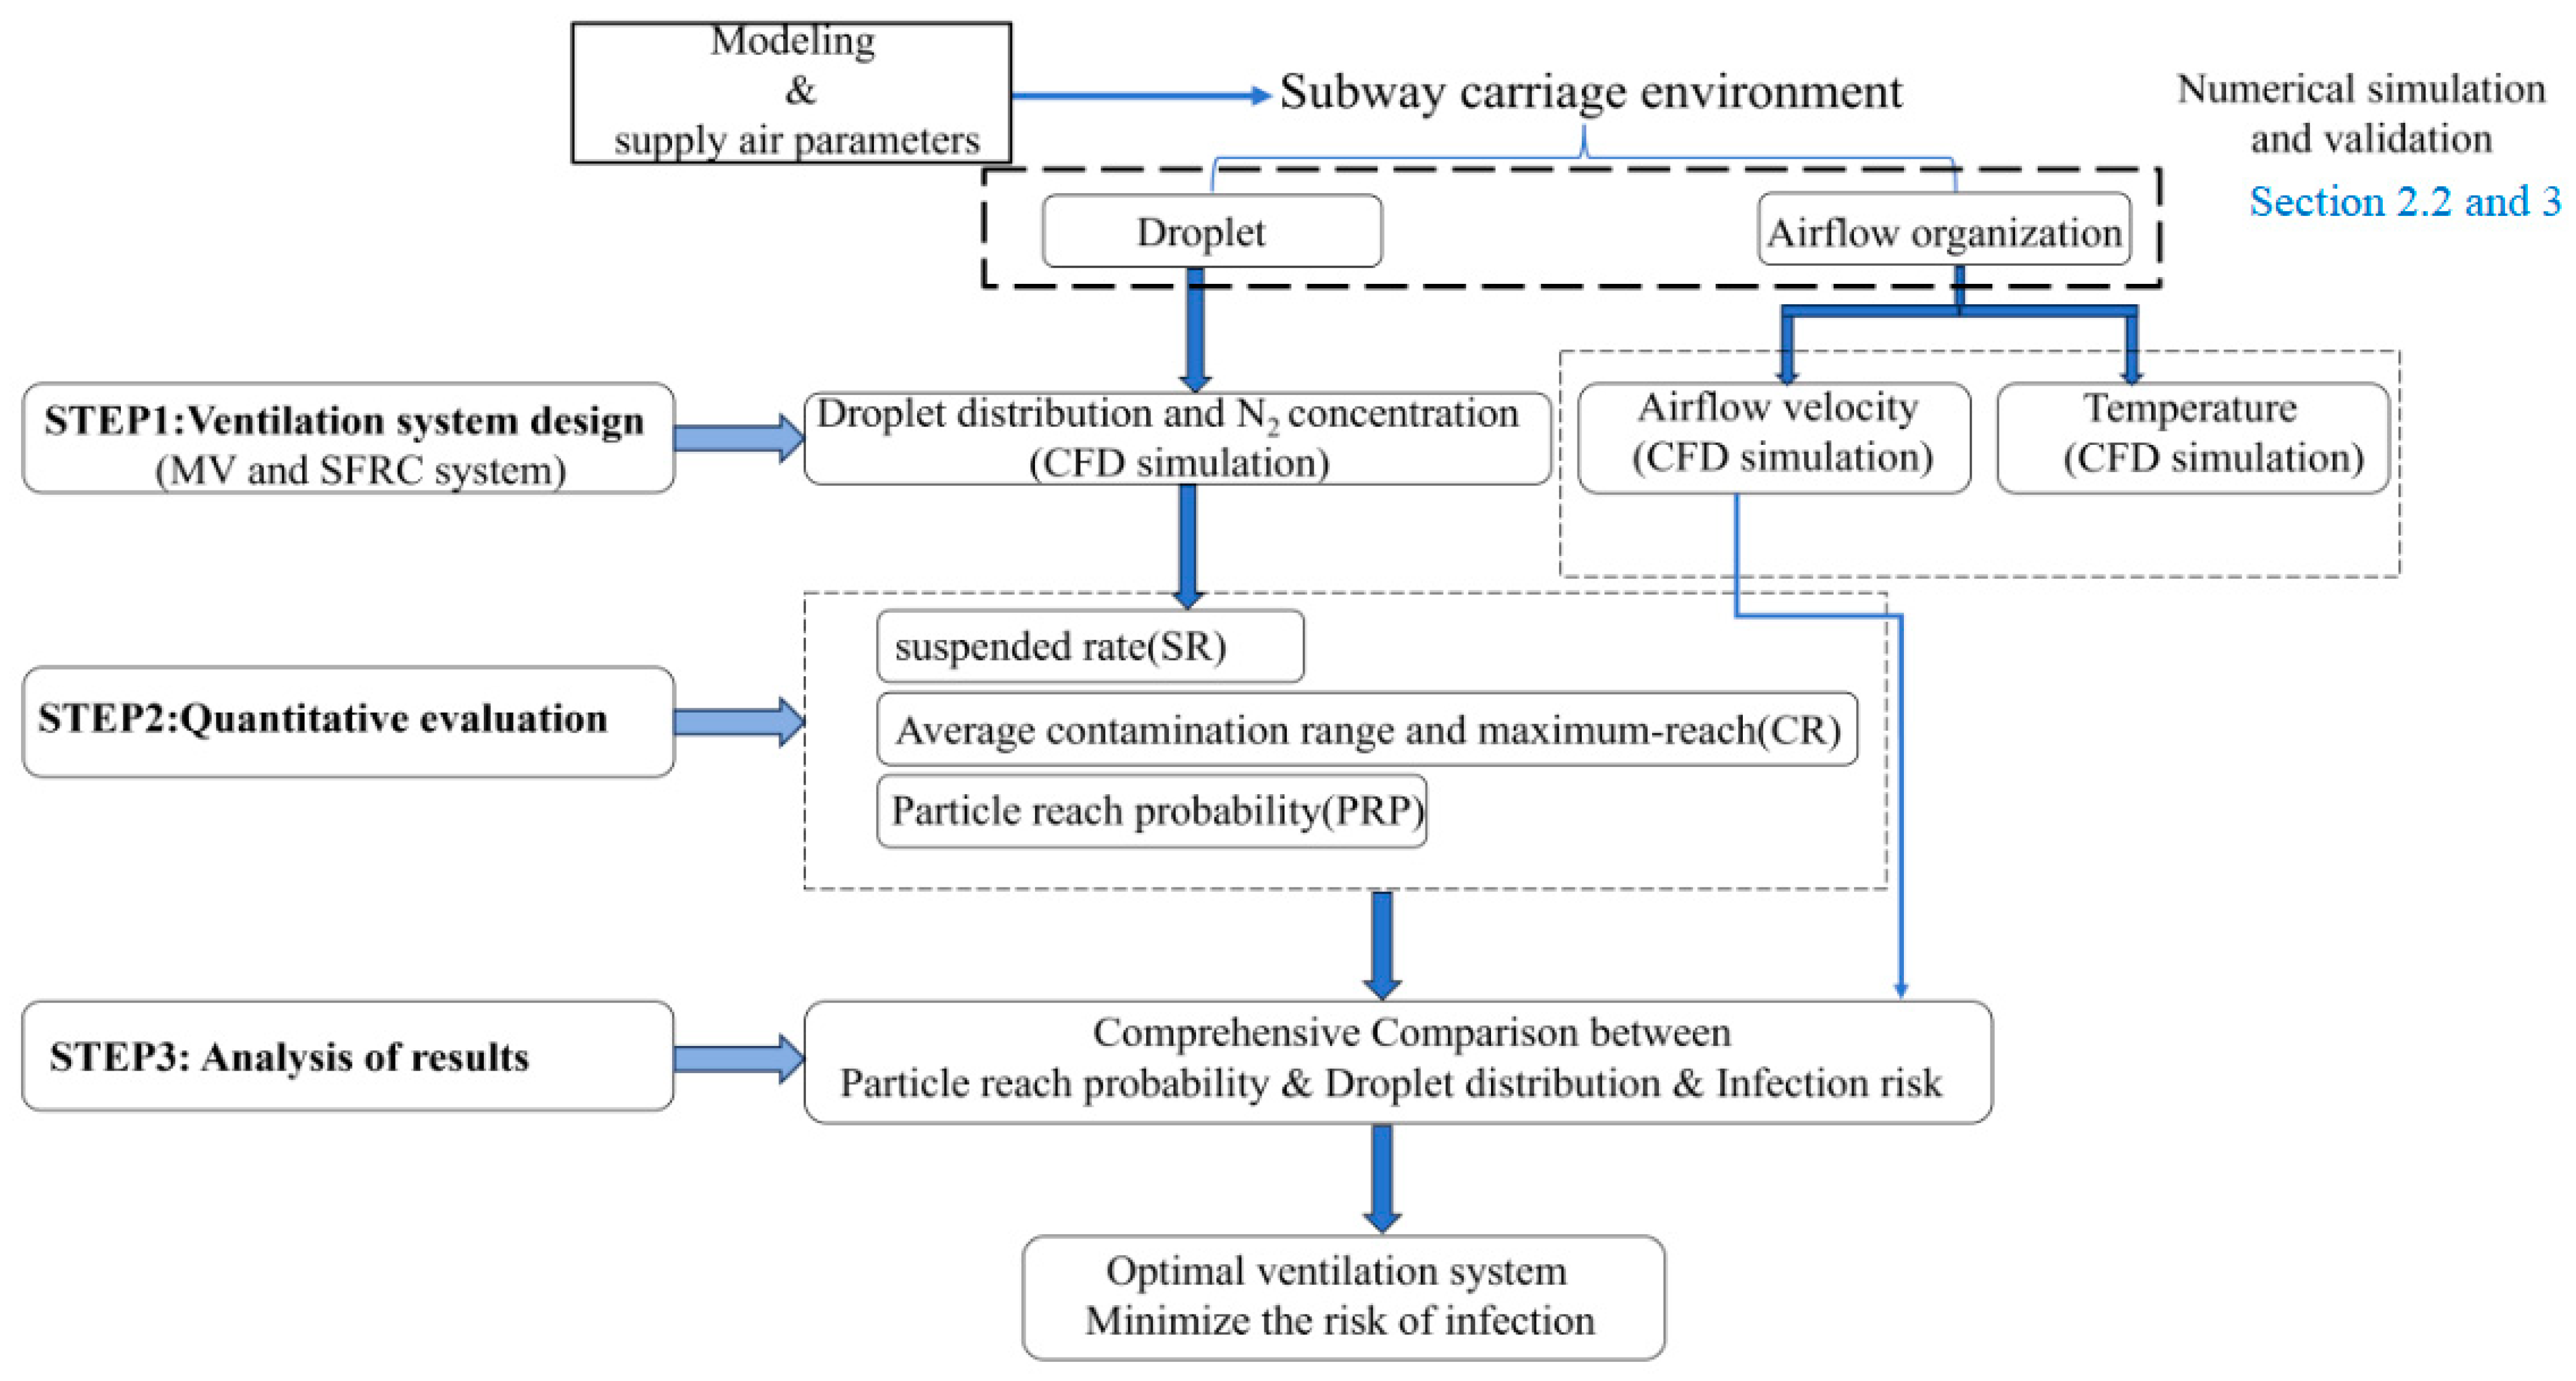
2. Materials and Methods

2.1. Numerical Models

Simulations were conducted to evaluate the performance of different ventilation modes (MV and SFRC) under varying ventilation factors. The Reynolds-averaged Navier–Stokes (RANS) equations were employed to model the airflow field inside the subway carriage. Considering the successful application of the RNG k-ε model in indoor airflow simulations, this study employed the RNG k-ε model to improve the accuracy of turbulent vortex simulations [30,31]. The governing equations for continuity, momentum, energy, and turbulence are expressed in the following general form:
( ρ φ ) t + d i v ( ρ U φ ) = d i v Γ φ g r a d φ + S φ
In this equation, ρ represents the density of the air, U represents the velocity vector of the air, φ denotes the transported quantity, Γ φ is the effective diffusion coefficient associated with φ, t represents the time of particle flow, and S φ is the source term.
After being expelled from the passenger (cougher), the moisture within the droplets rapidly evaporates into the surrounding air. To model the transport and diffusion of the water vapor–air mixture under turbulent conditions, a mass transfer model is employed. This model is represented by the following equation:
t ( ρ Y ) + · ( ρ V Y ) = · J + S Y
In this equation, Y represents the local mass fraction of water vapor, J signifies the diffusion flow of water vapor, and SY is the source term for water vapor. Relative humidity is used to calculate the mass fraction of the air and water vapor mixture.
The rate of evaporation is governed by diffusion driven by concentration gradients and is related to the difference in water vapor concentration between the surface of the droplet and the surrounding air [32].
d N d t = c ( C S C )
In this equation, c represents the mass transfer coefficient and CS and C are the molar concentrations of water vapor at the droplet surface and in the air, respectively. The general Equations (2) and (3) can be used to figure out how the mass fraction of each fluid in the mixture changes as it moves.
In the Lagrange framework, the trajectory of each droplet is obtained by solving the momentum equation for the particles.
d u p d t = F D ( u u p ) + g ( ρ p ρ ) ρ p + F a
In this equation, u and u p represent the velocities of the air and the particles, and F a denotes the additional force acting on the particles. Based on the indoor airflow and droplet size, this study considers only the thermophoretic force, Brownian force, and Saffman lift, neglecting the resuspension of particles. The calculation formula for the thermophoretic force is as follows:
F t h = 6 π d p μ 2 C s K + C t K n ρ T 1 + 3 C m K n 1 + 2 K + 2 C t K n T
In this equation, K n is the Knudsen number = 2 λ/dp, where λ is the mean free path of the fluid, K is the thermal conductivity of the fluid, and K p is the thermal conductivity of the particles. C s is 1.17, C t is 2.18, C m is 1.14, T is the local fluid temperature, μ is the fluid viscosity, and dp is the particle diameter. Forces two orders of magnitude smaller than the pulling force are considered negligible and do not need to be accounted for. It is assumed that the particles are spherical in shape. The Discrete Random Walk (DRW) model is used to predict particle movement under turbulent conditions. This model reduces the errors resulting from the random effects of turbulence on particle paths.
The Brownian force is as follows:
F B r = ξ 12 π μ k B T R Δ t
In this equation, R is the particle radius, μ is the fluid viscosity, KB is the Boltzmann constant, T is the thermodynamic temperature, and Δ t is the fluid time step.
The Saffman force was as follows:
F S = 2 K v 1 / 2 ρ d i j ρ p d p ( d l k d k l ) 1 / 4 ( v v p )
In this equation, K = 2.594 and d i j is the deformation tensor.

2.2. Model Description and Mesh

The geometry and mesh of the different ventilation methods (MV and SFRC) inside the subway carriage are shown in Figure 2 and Figure 3. A hexahedral mesh was used for the simulation. The physical model of the subway carriage was established according to the national standard “Subway Design Code” (GB 50157-2013) [33]. The dimensions of the car were 12.8 m (X) × 2.5 m (Y) × 2.1 m (Z). The carriage contained 36 passengers (according to the GB 50157-2013 standard, a typical case with 36 seated passengers was selected), one of whom was considered infected. The height of the infected passenger was 1.7 m, and the mouth of each individual was modeled as a circular opening. Table 1 contains the inlet and outlet information (size and quantity), as well as the mesh numbers for both ventilation methods.

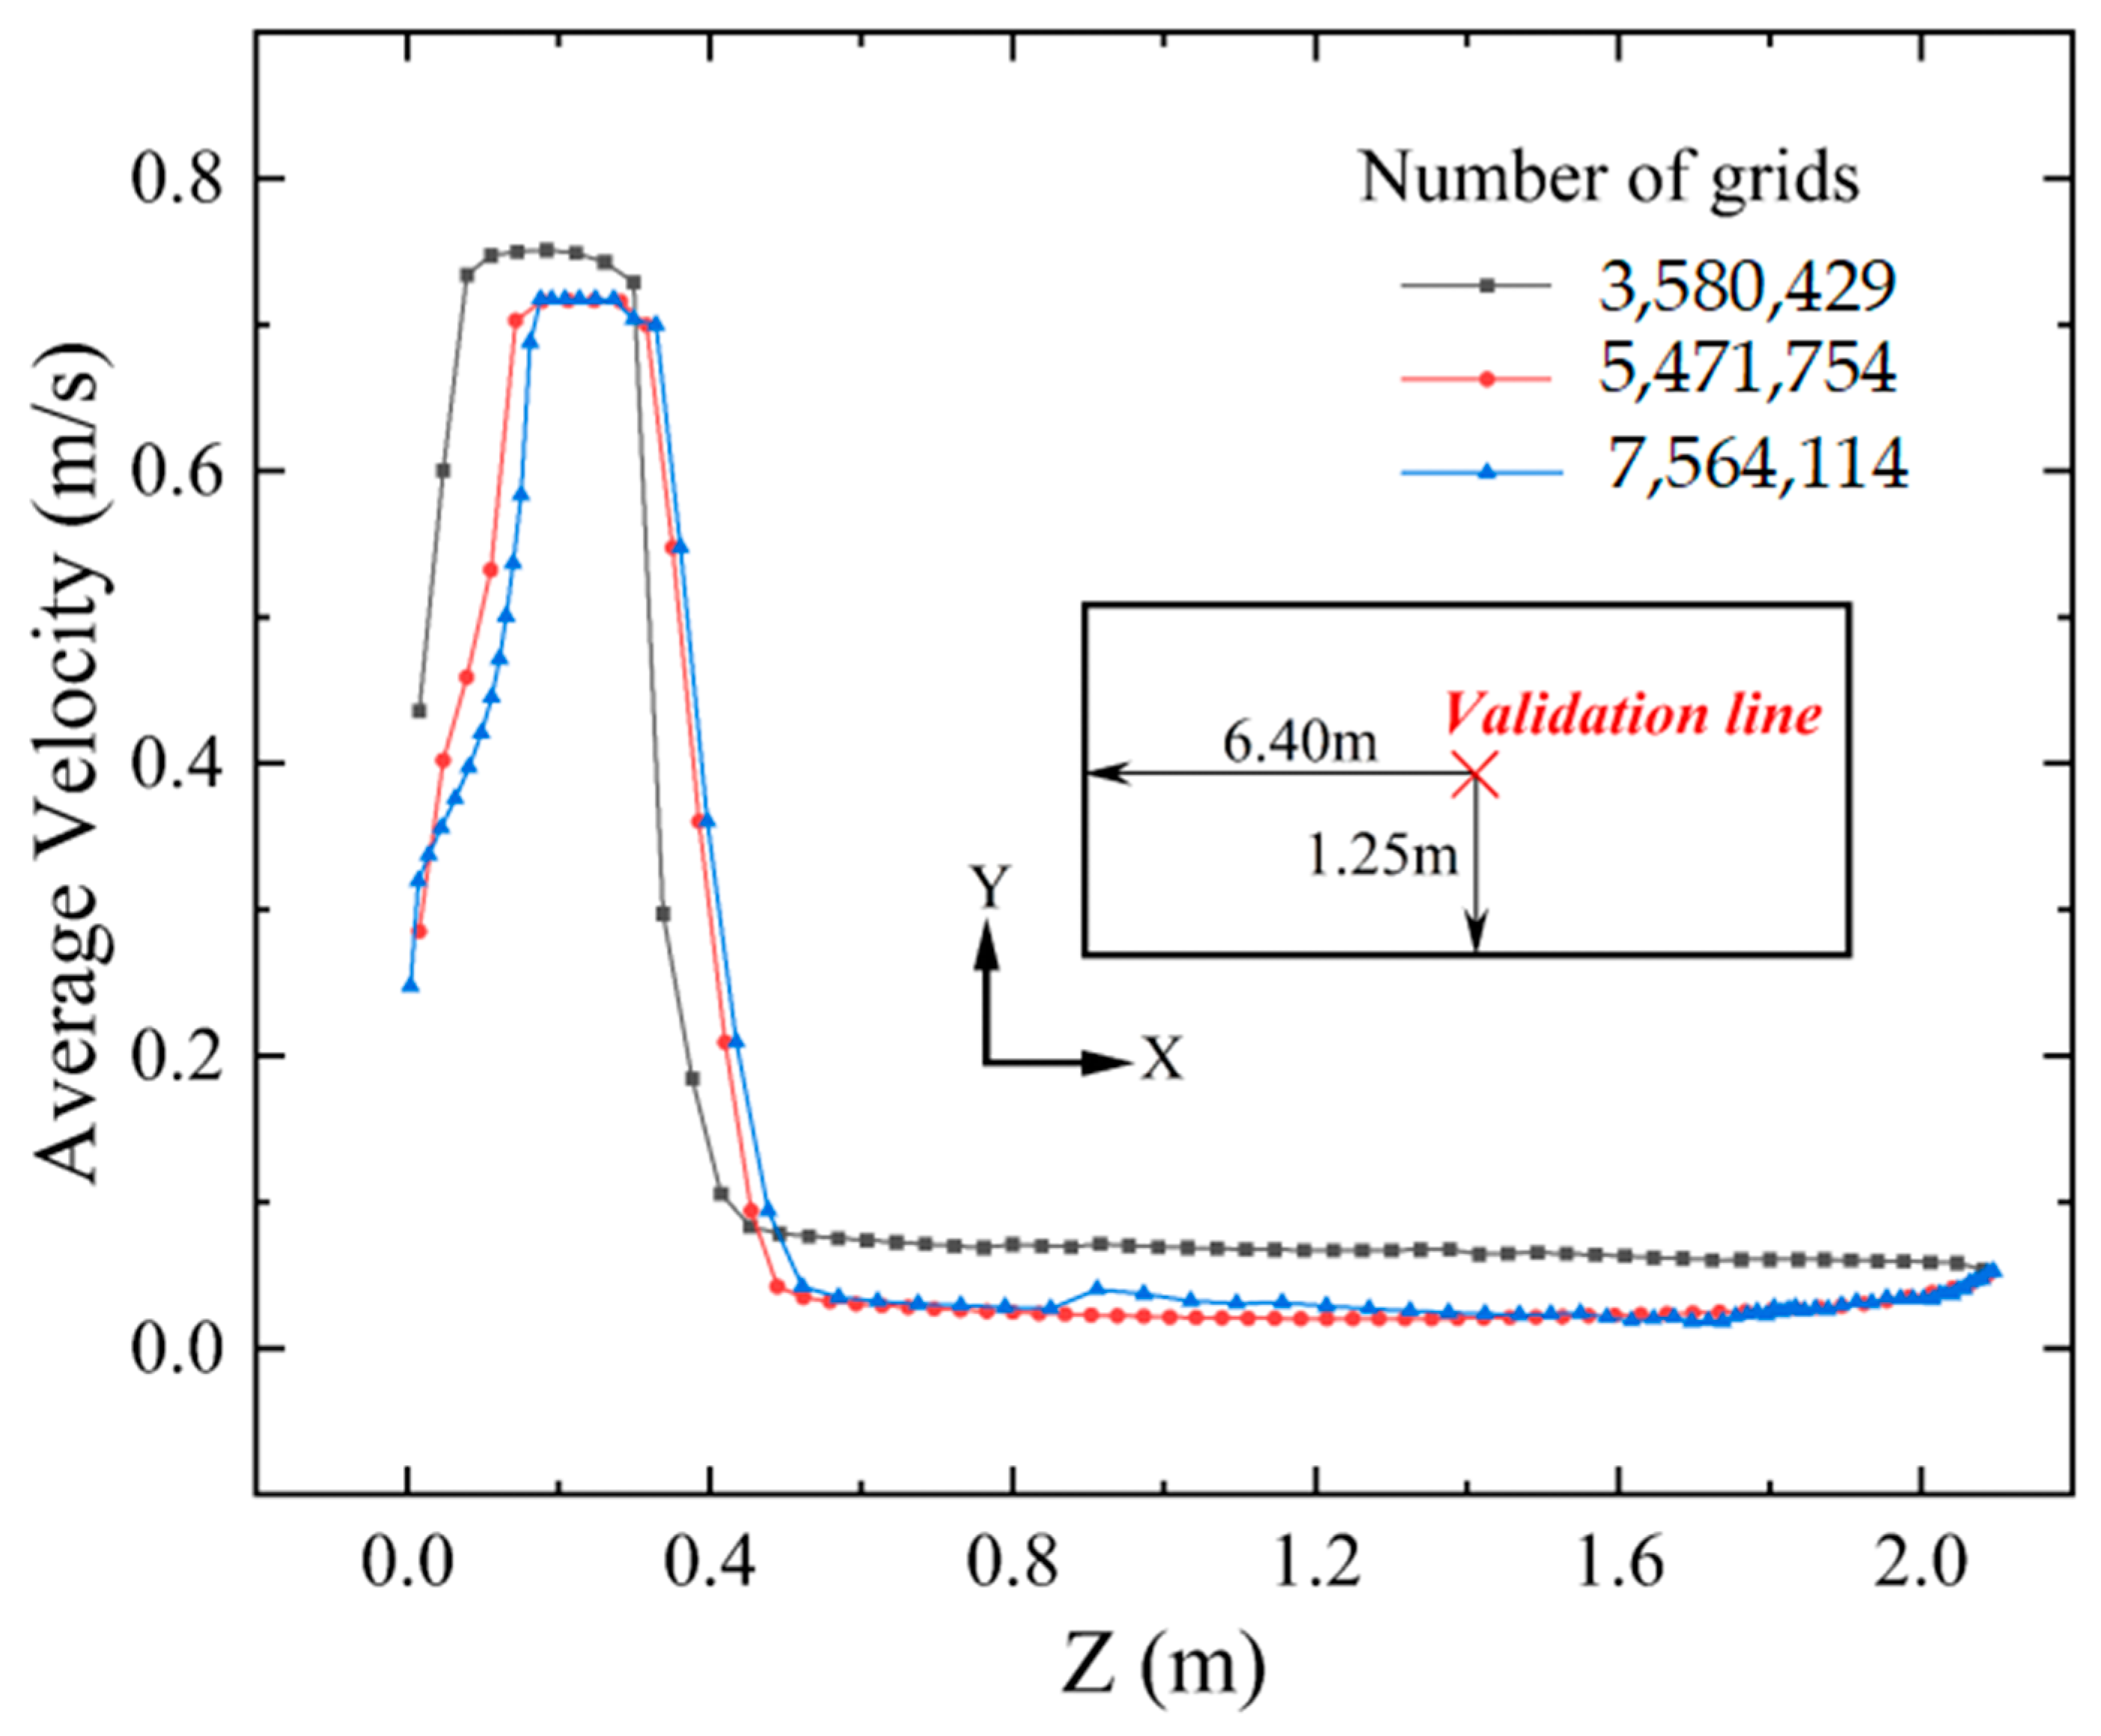
2.3. Grid Independence Test

Local mesh refinement is necessary to examine how gradient changes influence factors such as velocity, temperature, concentration, and others. The facial area near the patient’s mouth was refined to a size of 5 mm. Ten prism layers were applied to the patient’s skin, with the first layer having a thickness of 0.5 mm. Additionally, three expanding boundary layers were applied to each surface of the subway car to ensure sufficient mesh refinement. The Grid Convergence Index (GCI) was used to verify mesh independence. In conformity with the y+ range, we use the k-epsilon model to be able to improve the accuracy for the calculation. Three different mesh resolutions were used for each computational model. Specifically, coarse (3,580,429 cells), medium (5,471,754 cells), and fine (7,564,114 cells) meshes were used, with varying surface and volume mesh sizes. The velocity along the validation line (X = 6.4 m, Y = 1.25 m, Z = 0–2.1 m) differed by less than 5% when compared with the results using the fine mesh (7,564,114 cells). The results of the mesh independence verification analysis are shown in Figure 4. A mesh model consisting of 5,471,754 cells was selected for the simulations, balancing computational accuracy with the available resources of the computer system used in this paper. The maximum length of the volume mesh was 90 mm, while the surface mesh sizes for the model, air supply and exhaust surfaces, wall surfaces, and the passengers’ mouths were 12.5 mm, 15 mm, 85 mm, and 4 mm, respectively.

2.4. Boundary Conditions

This research investigates the effects of different ventilation methods, air supply velocities, and masks on droplet distribution within the subway carriage. In accordance with the Chinese national standard “Subway Design Code” [33], which stipulates that individuals must be able to tolerate an appropriate level of heat, three air change rates and a specific air source temperature were selected as the primary focus of the study. ASHRAE 55-2020 may specify the maximum air velocity allowed in summer air-conditioned environments to avoid cold draft sensations. In indoor environments, the air supply velocity needs to be set to avoid cold air sensations (draft) and localized discomfort. ASHRAE 55-2020 recommends the following general comfort range: The air supply velocity should be controlled between 0.15 and 0.25 m/s to maintain thermal comfort. In order to better remove contaminants from the cabin, we increased the air velocity to 0.4 m/s. The subsequent ADPI values show that this air velocity meets the thermal comfort requirements. The air supply speed of the SFRC air supply method is one quarter of that of the MV air supply method, because the area of the lower air outlet of the SFRC air supply method is four times the area of the air supply outlet of the MV air supply method, so there are three kinds of air supply speeds used in the MV system, namely, 0.8 m/s, 1.2 m/s, and 1.6 m/s, and the SFRC system is used in the air supply speeds of 0.2 m/s, 0.3 m/s, and 0.4 m/s. air supply speeds. The air supply velocities for the MV system were established at 0.8 m/s, 1.2 m/s, and 1.6 m/s, in accordance with the ventilation specifications of the subway carriage. The SFRC system’s speeds were set at 0.2 m/s, 0.3 m/s, and 0.4 m/s. The inlet was configured as a uniform velocity inlet. The air supply opening was covered by a very fine mesh, with the difference between the effective area and the total area being sufficiently small. The turbulence intensity was set at 5%. The carriage’s enclosure, which includes the ceiling, side walls, and floor, was defined as a non-slip wall. To reflect real conditions more accurately, the ceiling was modeled as two flat panels. The incompressible ideal gas assumption was used to approximate density variations. The convergence criterion was set to 10 × 10−5. A second-order upwind scheme was used to solve for momentum, turbulent kinetic energy, and the turbulence dissipation rate, while pressure was solved using the SIMPLE algorithm.
The surface temperature of the body was set to 310 K, based on measurements taken during the trial [34,35], with specific details shown in Table 2. The other solid surfaces in the subway car were assumed to be adiabatic. The droplets were released due to coughing (0–0.4 s) and continuous breathing (0.4–120 s) was simulated, with all other passengers maintaining exhalation. A user-defined function (UDF) was used to control the infected passenger’s breathing after the cough. This UDF was used to infect the passenger’s mouth, because the cough only lasted 0.2 s, but the whole simulation continued for 120 s, so the UDF was used to make them stop coughing automatically. In the 0–0.4 s time range, a coughing event was simulated in order to establish a connection between the continuous and discrete phases in both directions. The speed of coughing was set to 13 m/s [36]. Multiple time steps were tested to ensure accurate capture of the transient airflow field. The study found that time steps of 0.01 s for coughing and 0.1 s for breathing were sufficient to capture airflow changes during these processes. Therefore, a time step of 0.01 s was used for coughing and 0.1 s for breathing. The infected patient’s mouth diameter was 0.028 m, and the breathing temperature was around 310 K. Given the wide initial size range of cough droplets, this study used a size range of 0.1 µm to 100 µm, and particles within this range were classified using a double-R distribution. It was assumed that they are spherical [25]. The indoor relative humidity was set to 50%. The initial droplets consisted of 98.2% water and 1.8% solids [37]. After complete evaporation, the particle’s average diameter reduced to 26% of its original diameter.
These droplets are generated exclusively during coughing. The boundary conditions for the discrete phase were defined by assigning a reflective boundary to the inlet and an escape boundary to the outlet. The other surfaces were given trap boundaries. Details of each operating condition can be found in Table 3.

2.5. Evaluation Criteria

Airflow distribution under different ventilation methods, air supply velocities, and air supply temperatures significantly impacts infection risk. When evaluating subway ventilation systems during a pandemic, deposition rate and suspension rate are commonly used to assess their effectiveness. The deposition rate is defined as the ratio of the total number of exhaled droplets to the number of droplets deposited on various indoor surfaces. The suspension rate is defined as the ratio of the number of suspended droplets inside the subway car to the total number of exhaled droplets. The system’s effectiveness is evaluated by measuring the instantaneous mass of particles escaping through the return air vents and the average instantaneous mass of infectious particles inhaled by passengers. Additionally, the risk of cross-infection can be determined by examining the concentration of contaminants in the breathing zones of the infected individual and other passengers. To guide public policy on social distancing, it is essential to measure the dispersion of cough particles, quantified by the average contamination range and the maximum reach of the droplets. In this study, the average concentration of tracer gas N2 in the entire car was used for calibration. The first two terms refer to one type of evaluation definition, while the latter can be expressed as a volume-weighted average concentration. The formulas for calculating deposition rate (DER), suspension rate (SR), weighted average contamination range (CR), and particle reach probability (PRP) are as follows:
D E R = N t r a p N s × 100
S R = ( 1 N e s c a p e + N t r a p N s ) × 100
where N e s c a p e represents the number of droplets discharged from the exhaust louvers (EA), N t r a p is the number of droplets deposited on each surface in the ward, and N s is the total number of droplets produced by the patient’s exhalation.
C R = i = 0 n x i d i i = 0 n x i
where xi represents the particle mass or count and di denotes the distance the particle travels in the streamwise direction from the mouth.
Droplets may collide with one another, either adhering together or bouncing off during transportation. High slip velocity or particle acceleration can also cause the droplets to break apart. Additionally, droplet evaporation occurs, influenced by the Sherwood number of the droplets. The results revealed all three phenomena, with droplet coalescence being the most prominent. The droplets expelled from the mouth had sizes varying from 0.1 μm to 50 μm. We assume that the mass-weighted CR was influenced by larger (heavier) particles, while the count-weighted CR was affected by the smallest particles due to their higher quantity. Therefore, the CR was calculated using both mass-weighted and count-weighted averages to assess its sensitivity to these two metrics. The maximum range of the particles refers to the farthest distance from the origin (mouth) in the direction of the cough where droplets are deposited. An alternative approach to quantifying contamination spread is to estimate the percentage of particles within a defined distance from the coughing individual. Therefore, the 2–3 m thresholds are used to determine the percentage of particles that settle on the ground within these distances.
Following a forceful expiratory event, like a cough, particles of different sizes are expelled into the environment. Their dispersion is affected by factors such as particle size, velocity, and interactions with the surrounding airflow. Due to their greater mass and momentum, larger particles tend to settle on the ground over a shorter distance. To formally quantify this behavior, the concept of PRP is introduced. For a particle with a specific diameter di, in the cough, the PRP is defined as the probability that the particle remains dispersed in the free-flowing medium at a given streamwise distance x and time t. Mathematically, this can be expressed as follows:
P R P i x , t = 1 N i x , t N t
where PRPi (x, t) represents the probability that a particle with diameter di reaches a specific location, while Ni (x, t) is the cumulative number of particles deposited at x and Nt is the total number of particles. It is important to note that the PRP is a function of the relative magnitudes of Ni and Nt for a droplet of a given diameter, rather than their absolute values. Therefore, the PRP does not quantify the total number of particles.

3. Results

The study used two ventilation methods, SFRC and MV, under the same air supply temperature but with varying air supply speeds. In the SFRC system, the air supply speeds for cases 1–3 are 0.2 m/s, 0.3 m/s, and 0.4 m/s; in the MV system, the air supply speeds for cases 4–6 are 0.8 m/s, 1.2 m/s, and 1.6 m/s, respectively.

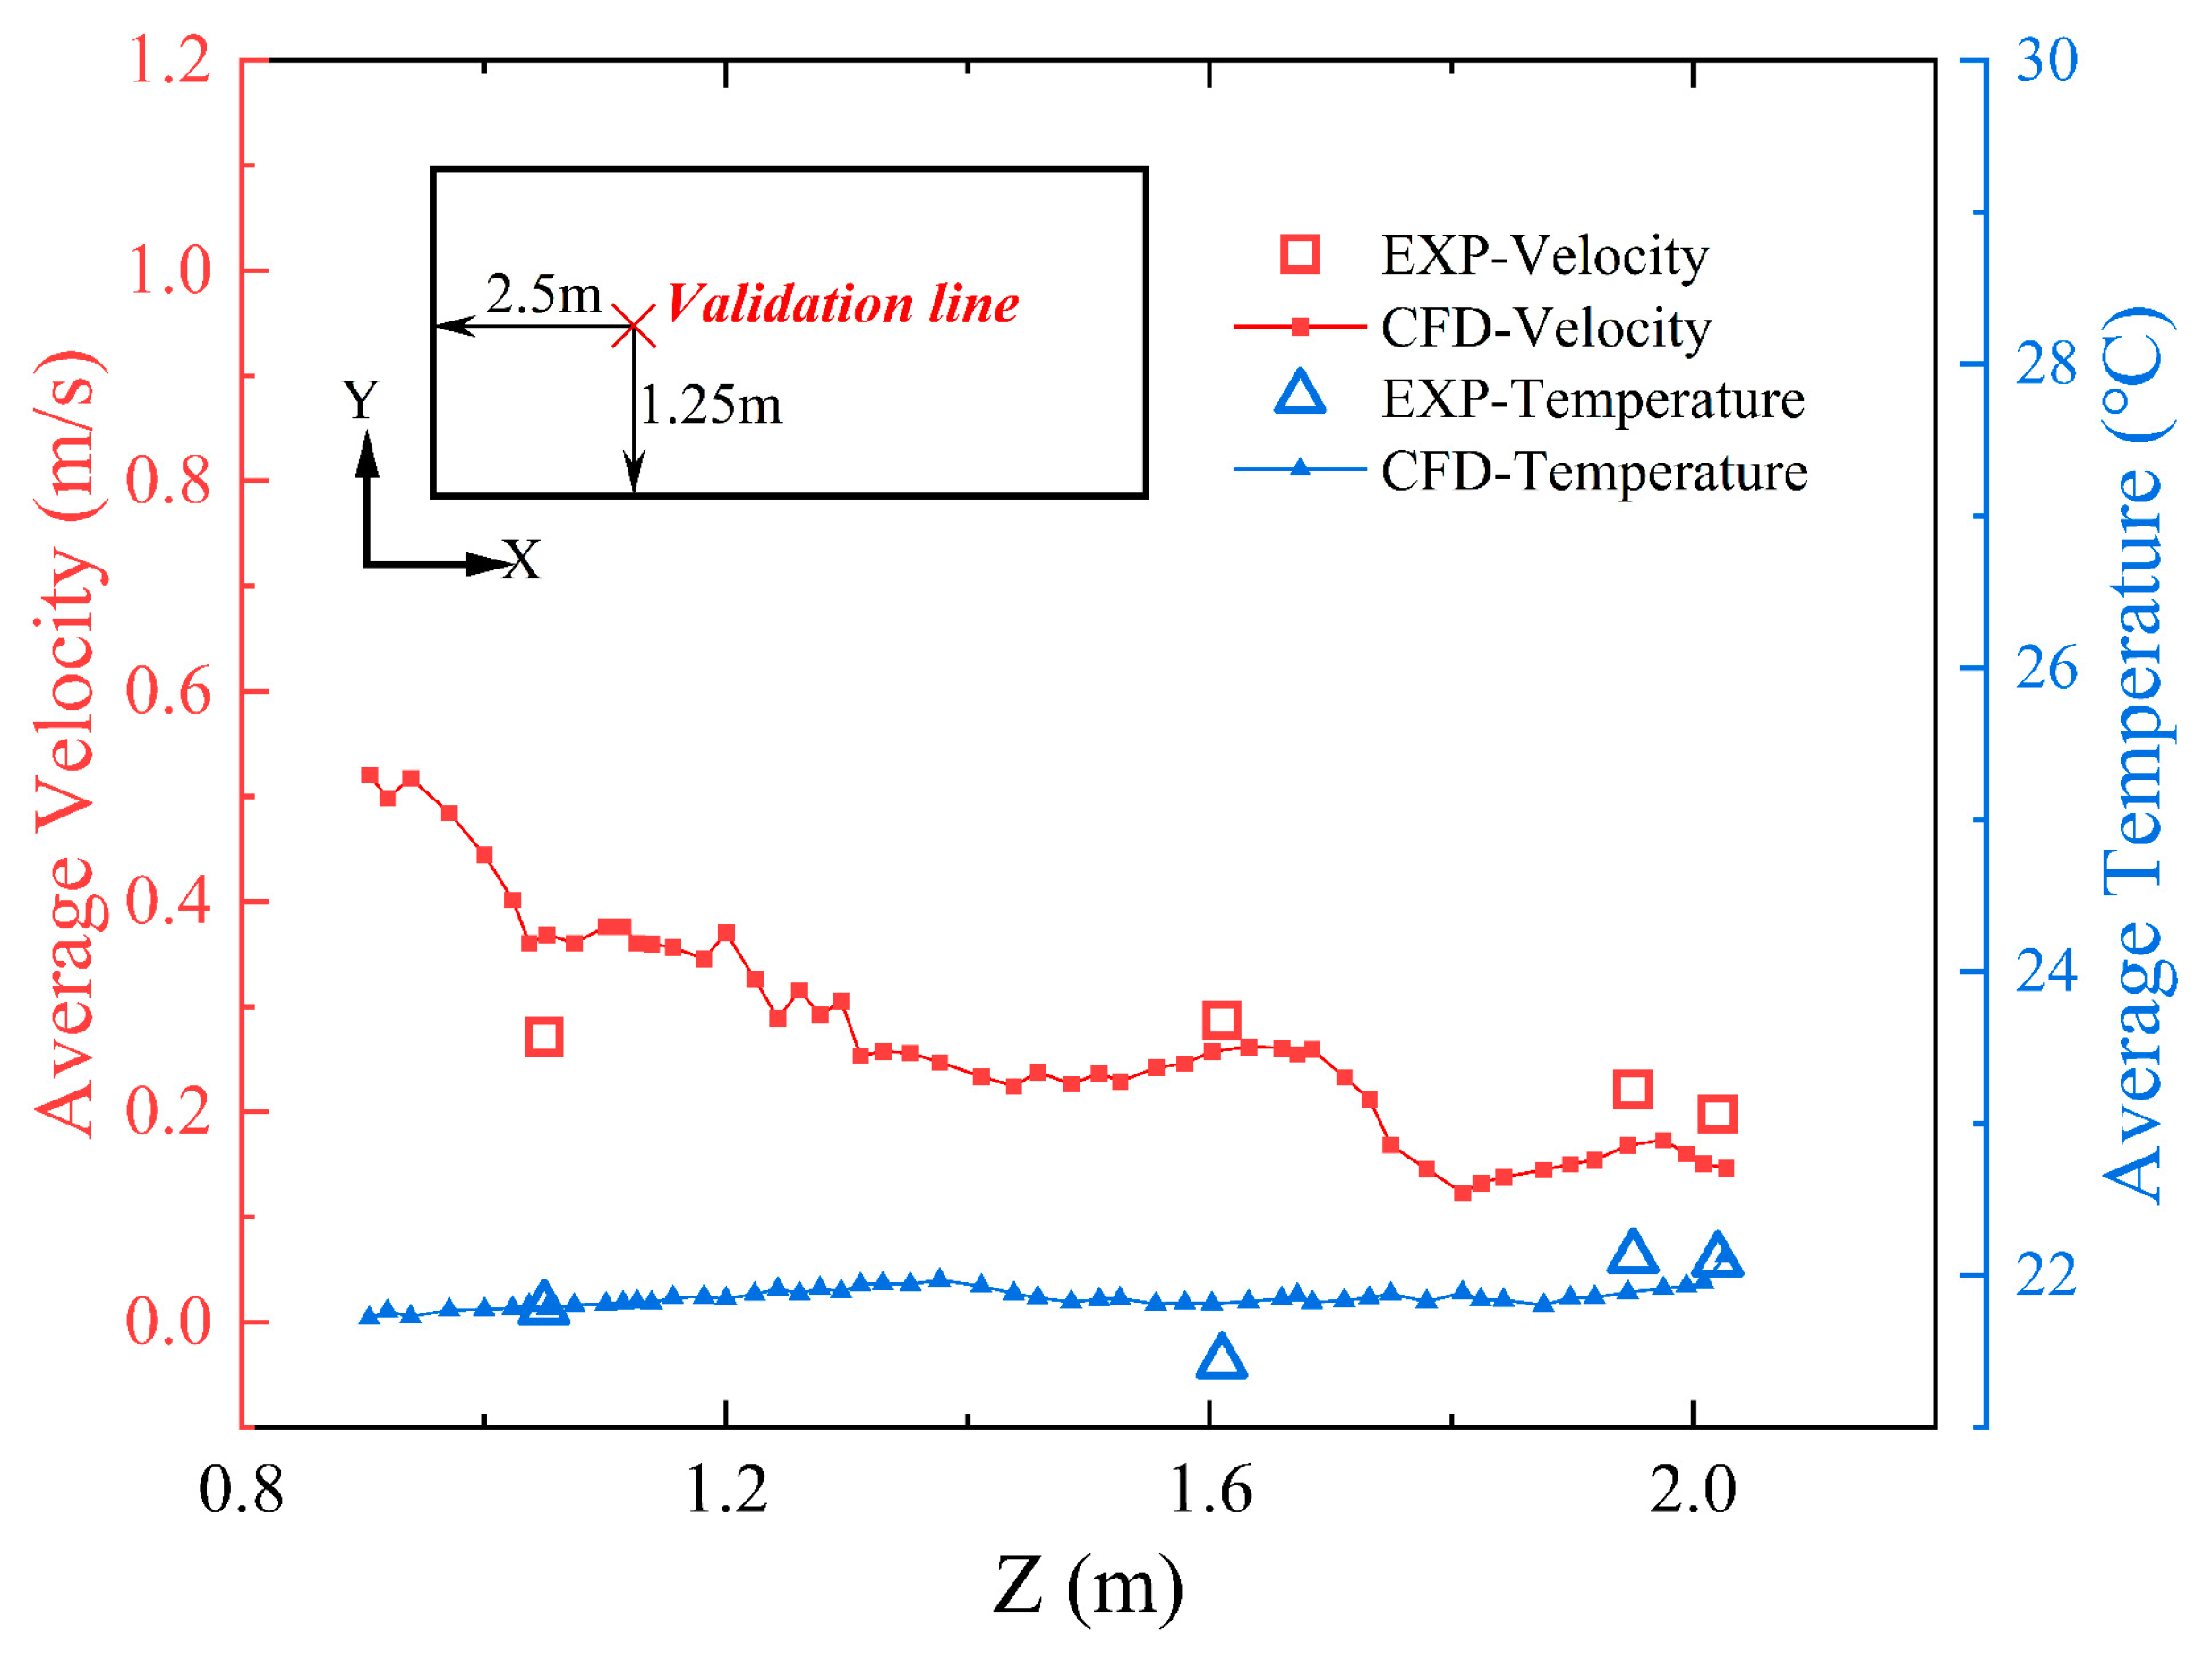
3.1. Model Validation

The numerical model leverages the experimental data set supplied by Chen [38] to recreate the experimental conditions. In the simulation, the air supply velocity under the MV mode is 1.6 m/s, and under the SFRC mode, the air supply velocities, consistent with this study, are 0.2 m/s, 0.3 m/s, and 0.4 m/s, with all temperatures set at 293 K. Figure 5 shows a comparison between the simulated velocity and temperature fields and the experimental results. The experimental and modeling results show that the velocity and temperature distributions along the Z-axis are consistent, with maximum errors of 26% for wind speed and 2.3% for temperature. In the experiment, potential movement of passengers in the subway carriage could have influenced the discrepancies between the experimental and simulation results. Therefore, this study assumes that passengers remain stationary in the simulation.

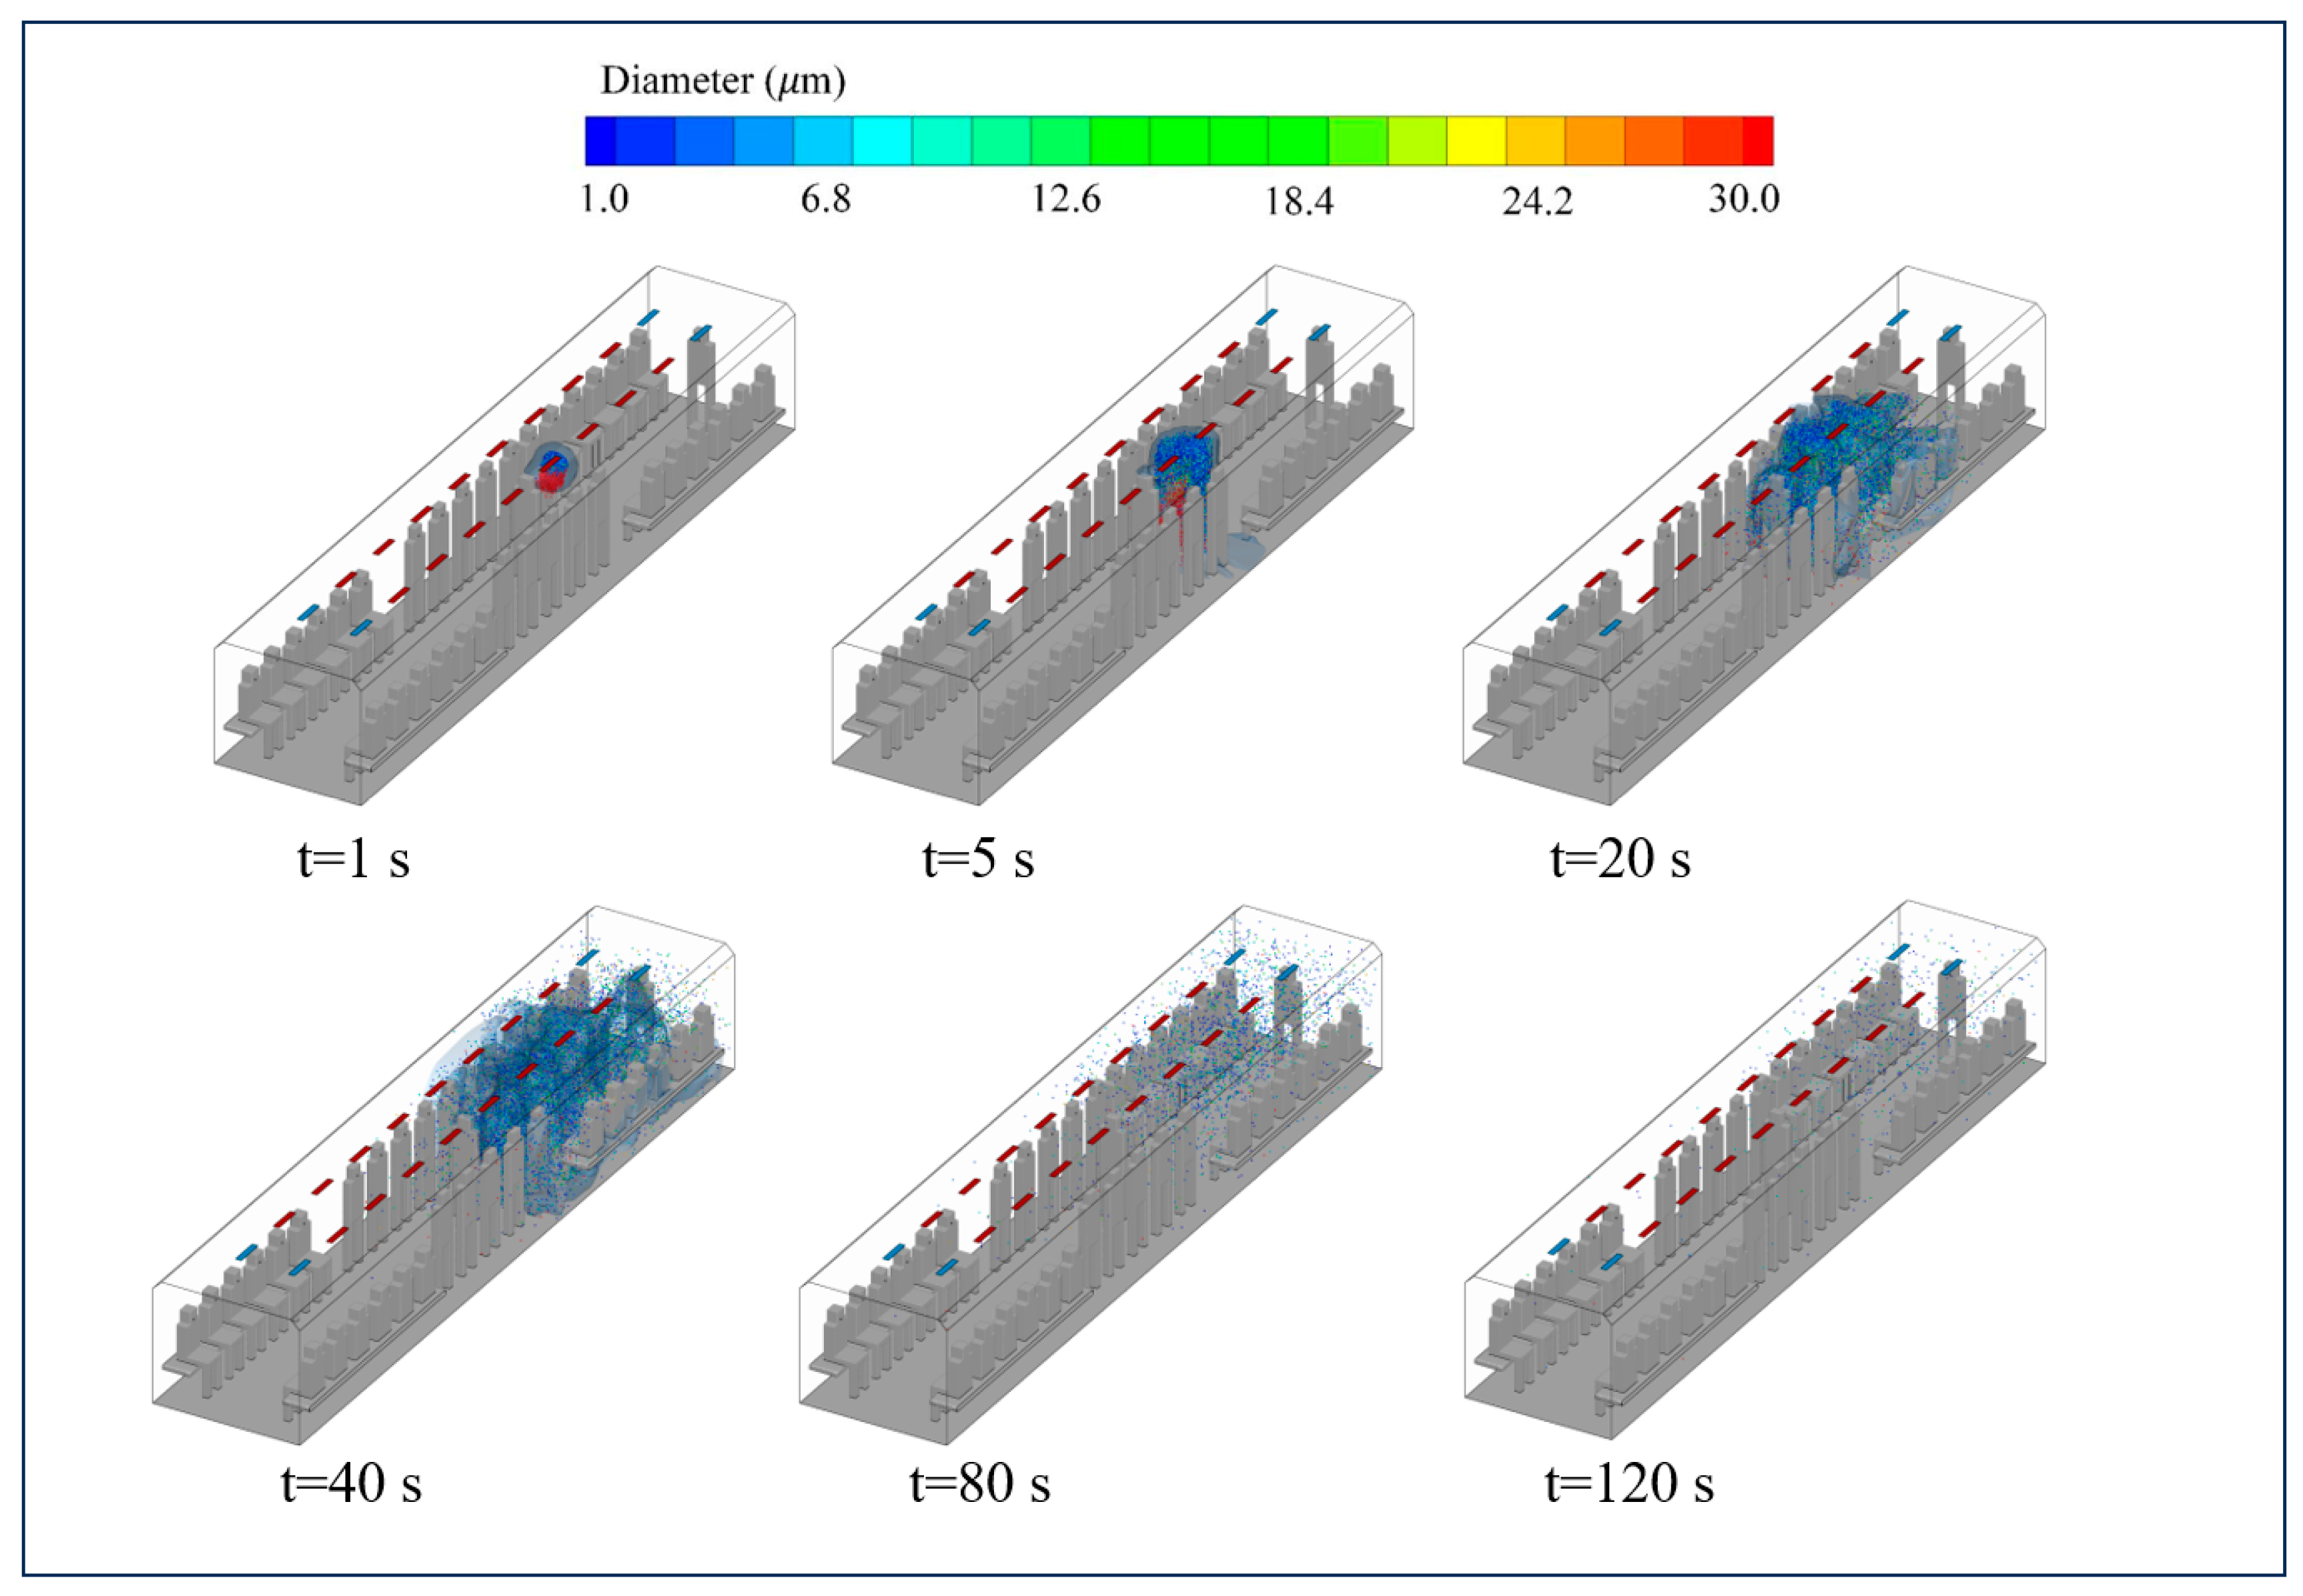
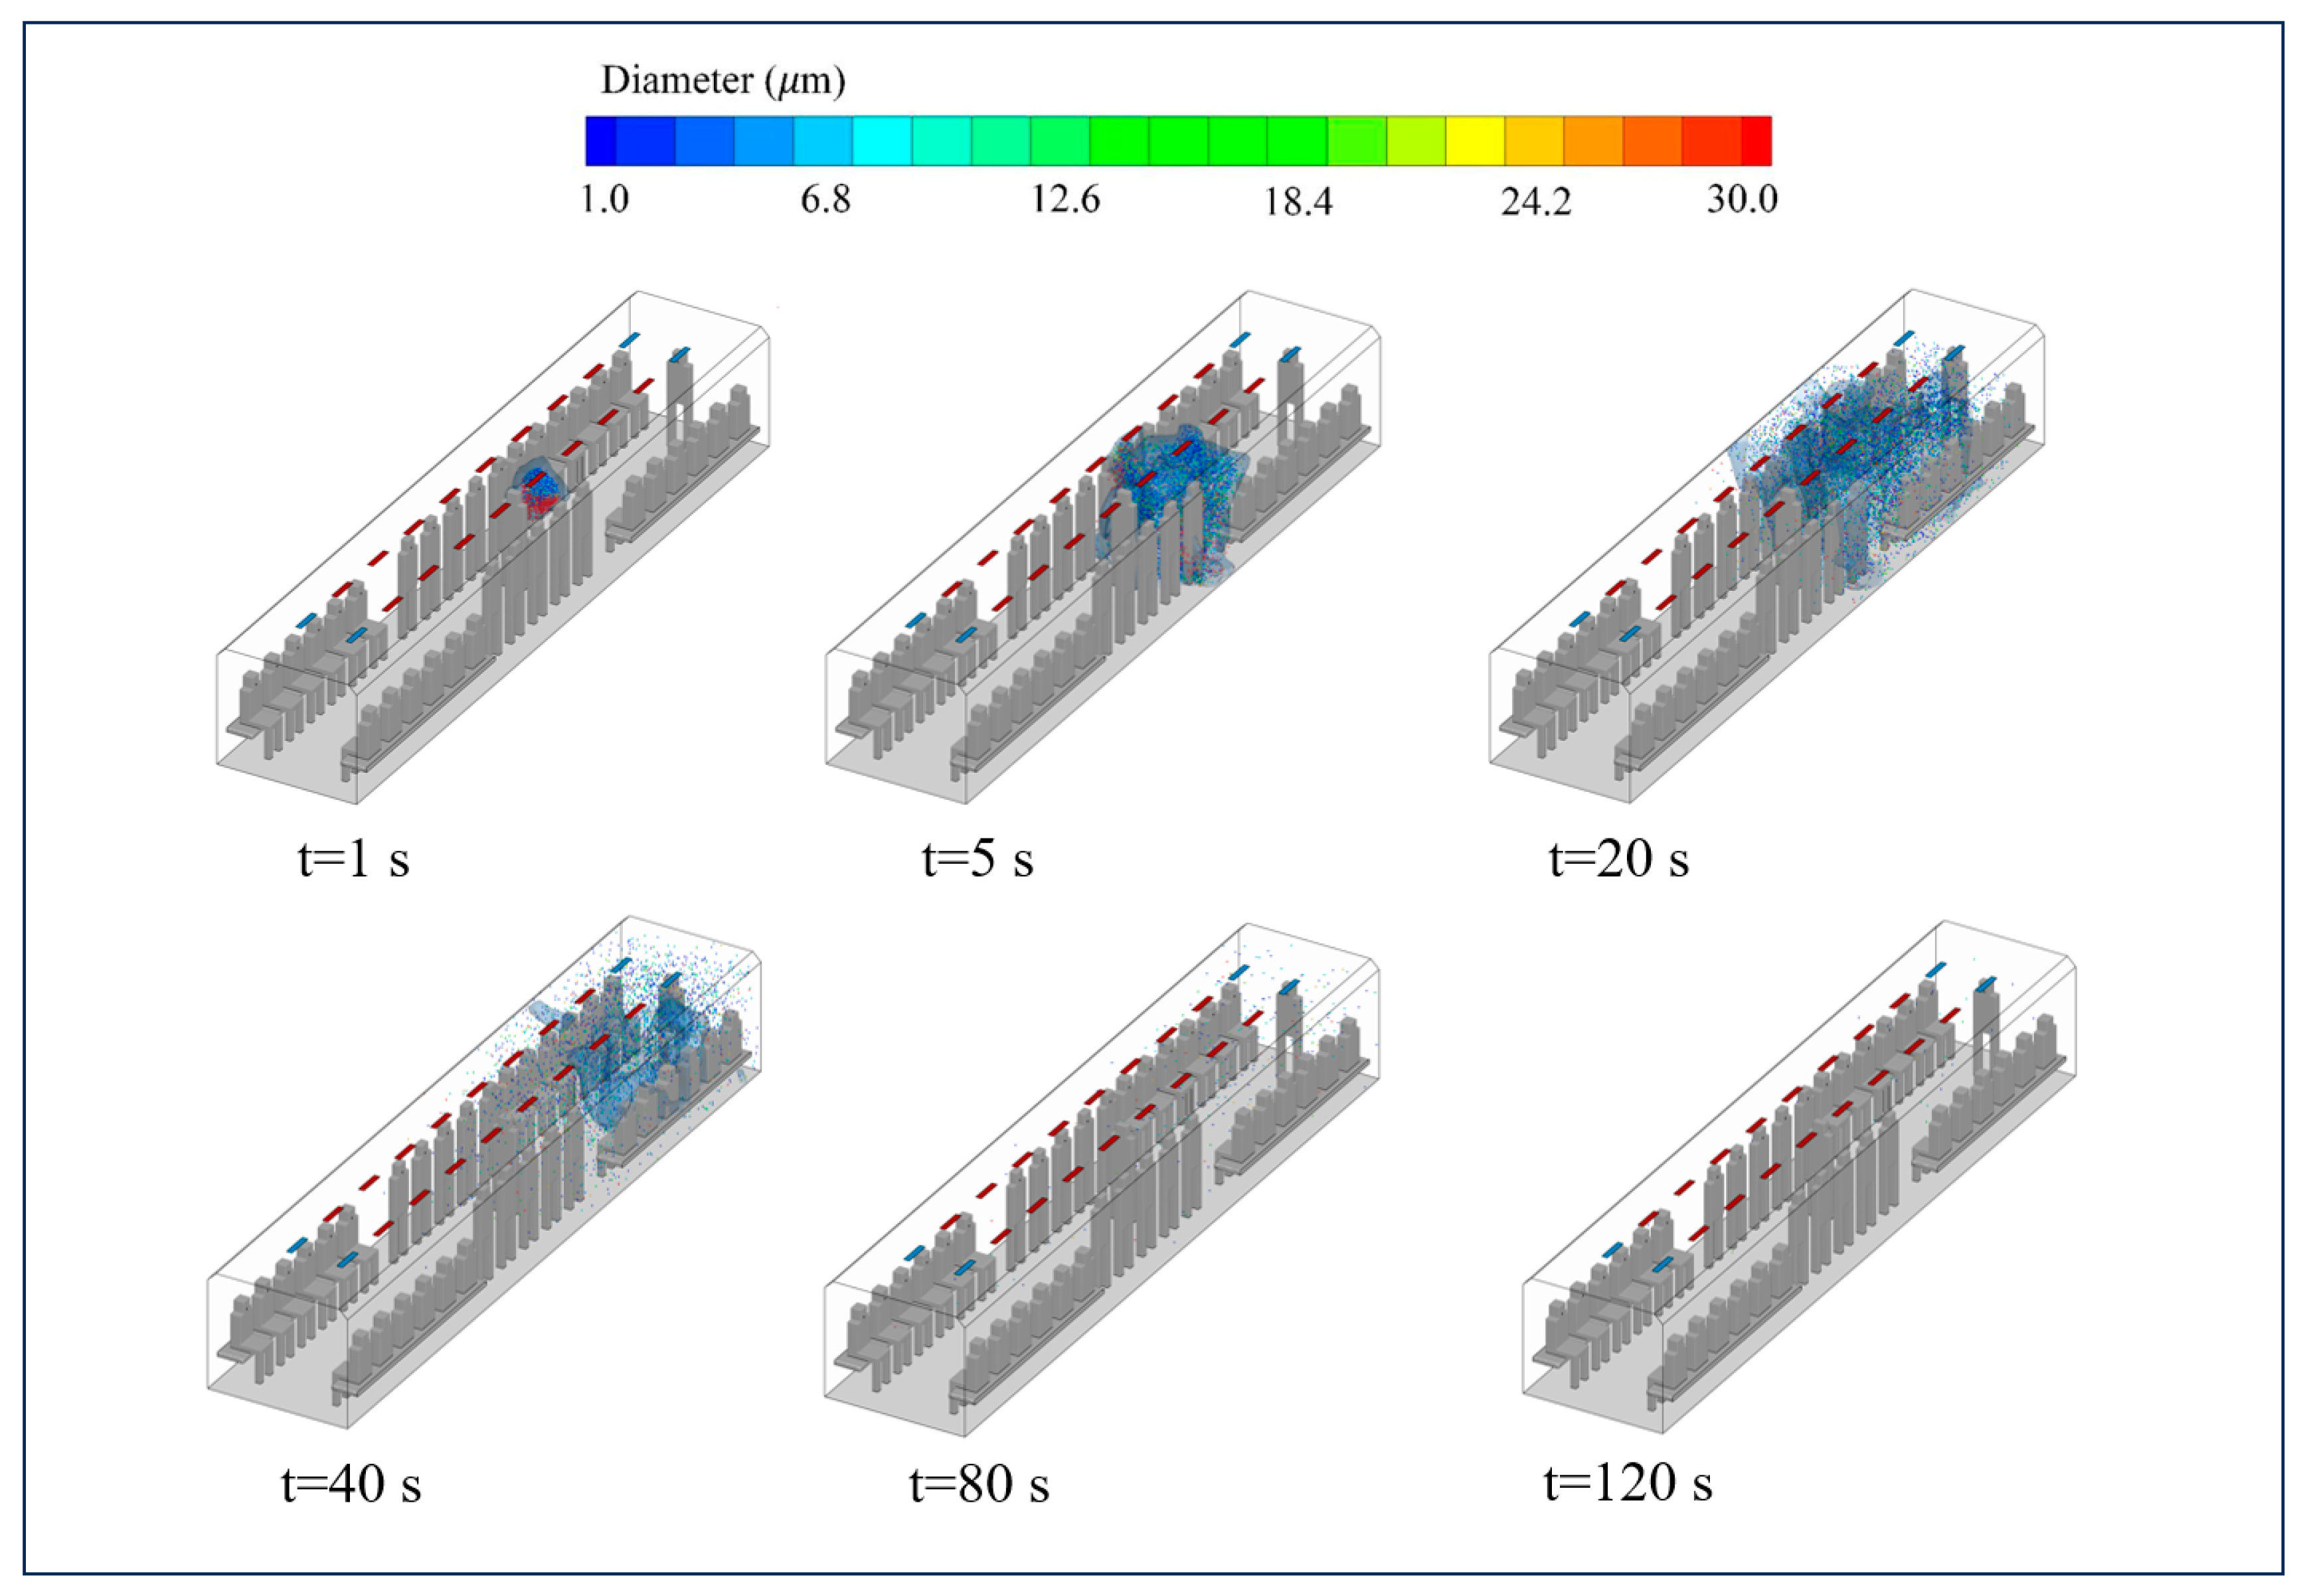
3.2. Spatiotemporal Distribution of Cough Droplets Under the MV System

When an infected person coughs, a large number of droplets are generated, and both the air supply velocity and ventilation method in enclosed spaces significantly affect droplet distribution. Figure 6 and Figure 7 show the spatial distribution of droplets and droplet nuclei in Case 4 and Case 6. The central patient expels cough droplets forward. Figure 6 shows that the air supply velocity in the MV system is 0.8 m/s. At t = 1 s, droplets with varying initial diameters can be observed, and by t = 5 s, the particle travel distance expands outward under the influence of the initial kinetic energy. Droplets measuring 50–80 µm diminish to below 50 µm as a result of evaporation, transforming into droplet nuclei. During the dispersion of cough droplets, the water content serves as an evaporative component, and decreases significantly, particularly for particles around 20 µm. Droplets of 100 µm are deposited on the patient or the floor due to gravity. At t = 20 s, particles spread significantly forward at the initial speed of 13 m/s, with some larger particles continuing to move in the direction of the cough. However, the droplet size has noticeably reduced to below 50 µm. The concentration range of the tracer gas N2 shows that a significant portion of particles is concentrated in the direction of the cough. The movement of these droplets is predominantly affected by the patterns of indoor airflow, causing them to gradually move toward nearby passengers, the sidewalls, and the ceiling, before dispersing outward. At t = 120 s, the droplet dispersion range remains in the direction of the cough, with minimal impact on the breathing zones of passengers seated in the opposite direction.
Figure 7 illustrates the scenario in Case 6, where the air supply velocity of the MV system is 1.6 m/s. It can be observed that, unlike at lower wind speeds, the droplets disperse more quickly and broadly at t = 1 s. At t = 5 s, the largest droplets complete a forward and downward movement cycle, ultimately depositing on the ground. In contrast to Case 6, at t = 20 s, the droplets disperse more widely and over a larger range, with a variety of particle sizes still present. In Case 6, due to the combined effect of the exhaled airflow and thermal plume, the droplets move upwards and disperse upon reaching the ceiling. The droplet nuclei move forward with the airflow. At t = 120 s, the particulate matter in the rear area of the carriage is almost completely removed, with no extensive dispersion into the breathing zones of other individuals in the carriage, contrasting sharply with the low wind-speed scenario. Notably, most of the droplet nuclei are concentrated within a range of 0–4 m in front of the patient, forming a high concentration area. The dispersion pattern is similar to that observed in Case 4. However, at higher wind speeds, the distribution of droplet nuclei is more uniform, and they are more rapidly drawn into the return air vents, resulting in more uniform and swift dispersion due to the carrying effect of the airflow supply. Low wind speed is not ideal for preventing cross-infection.

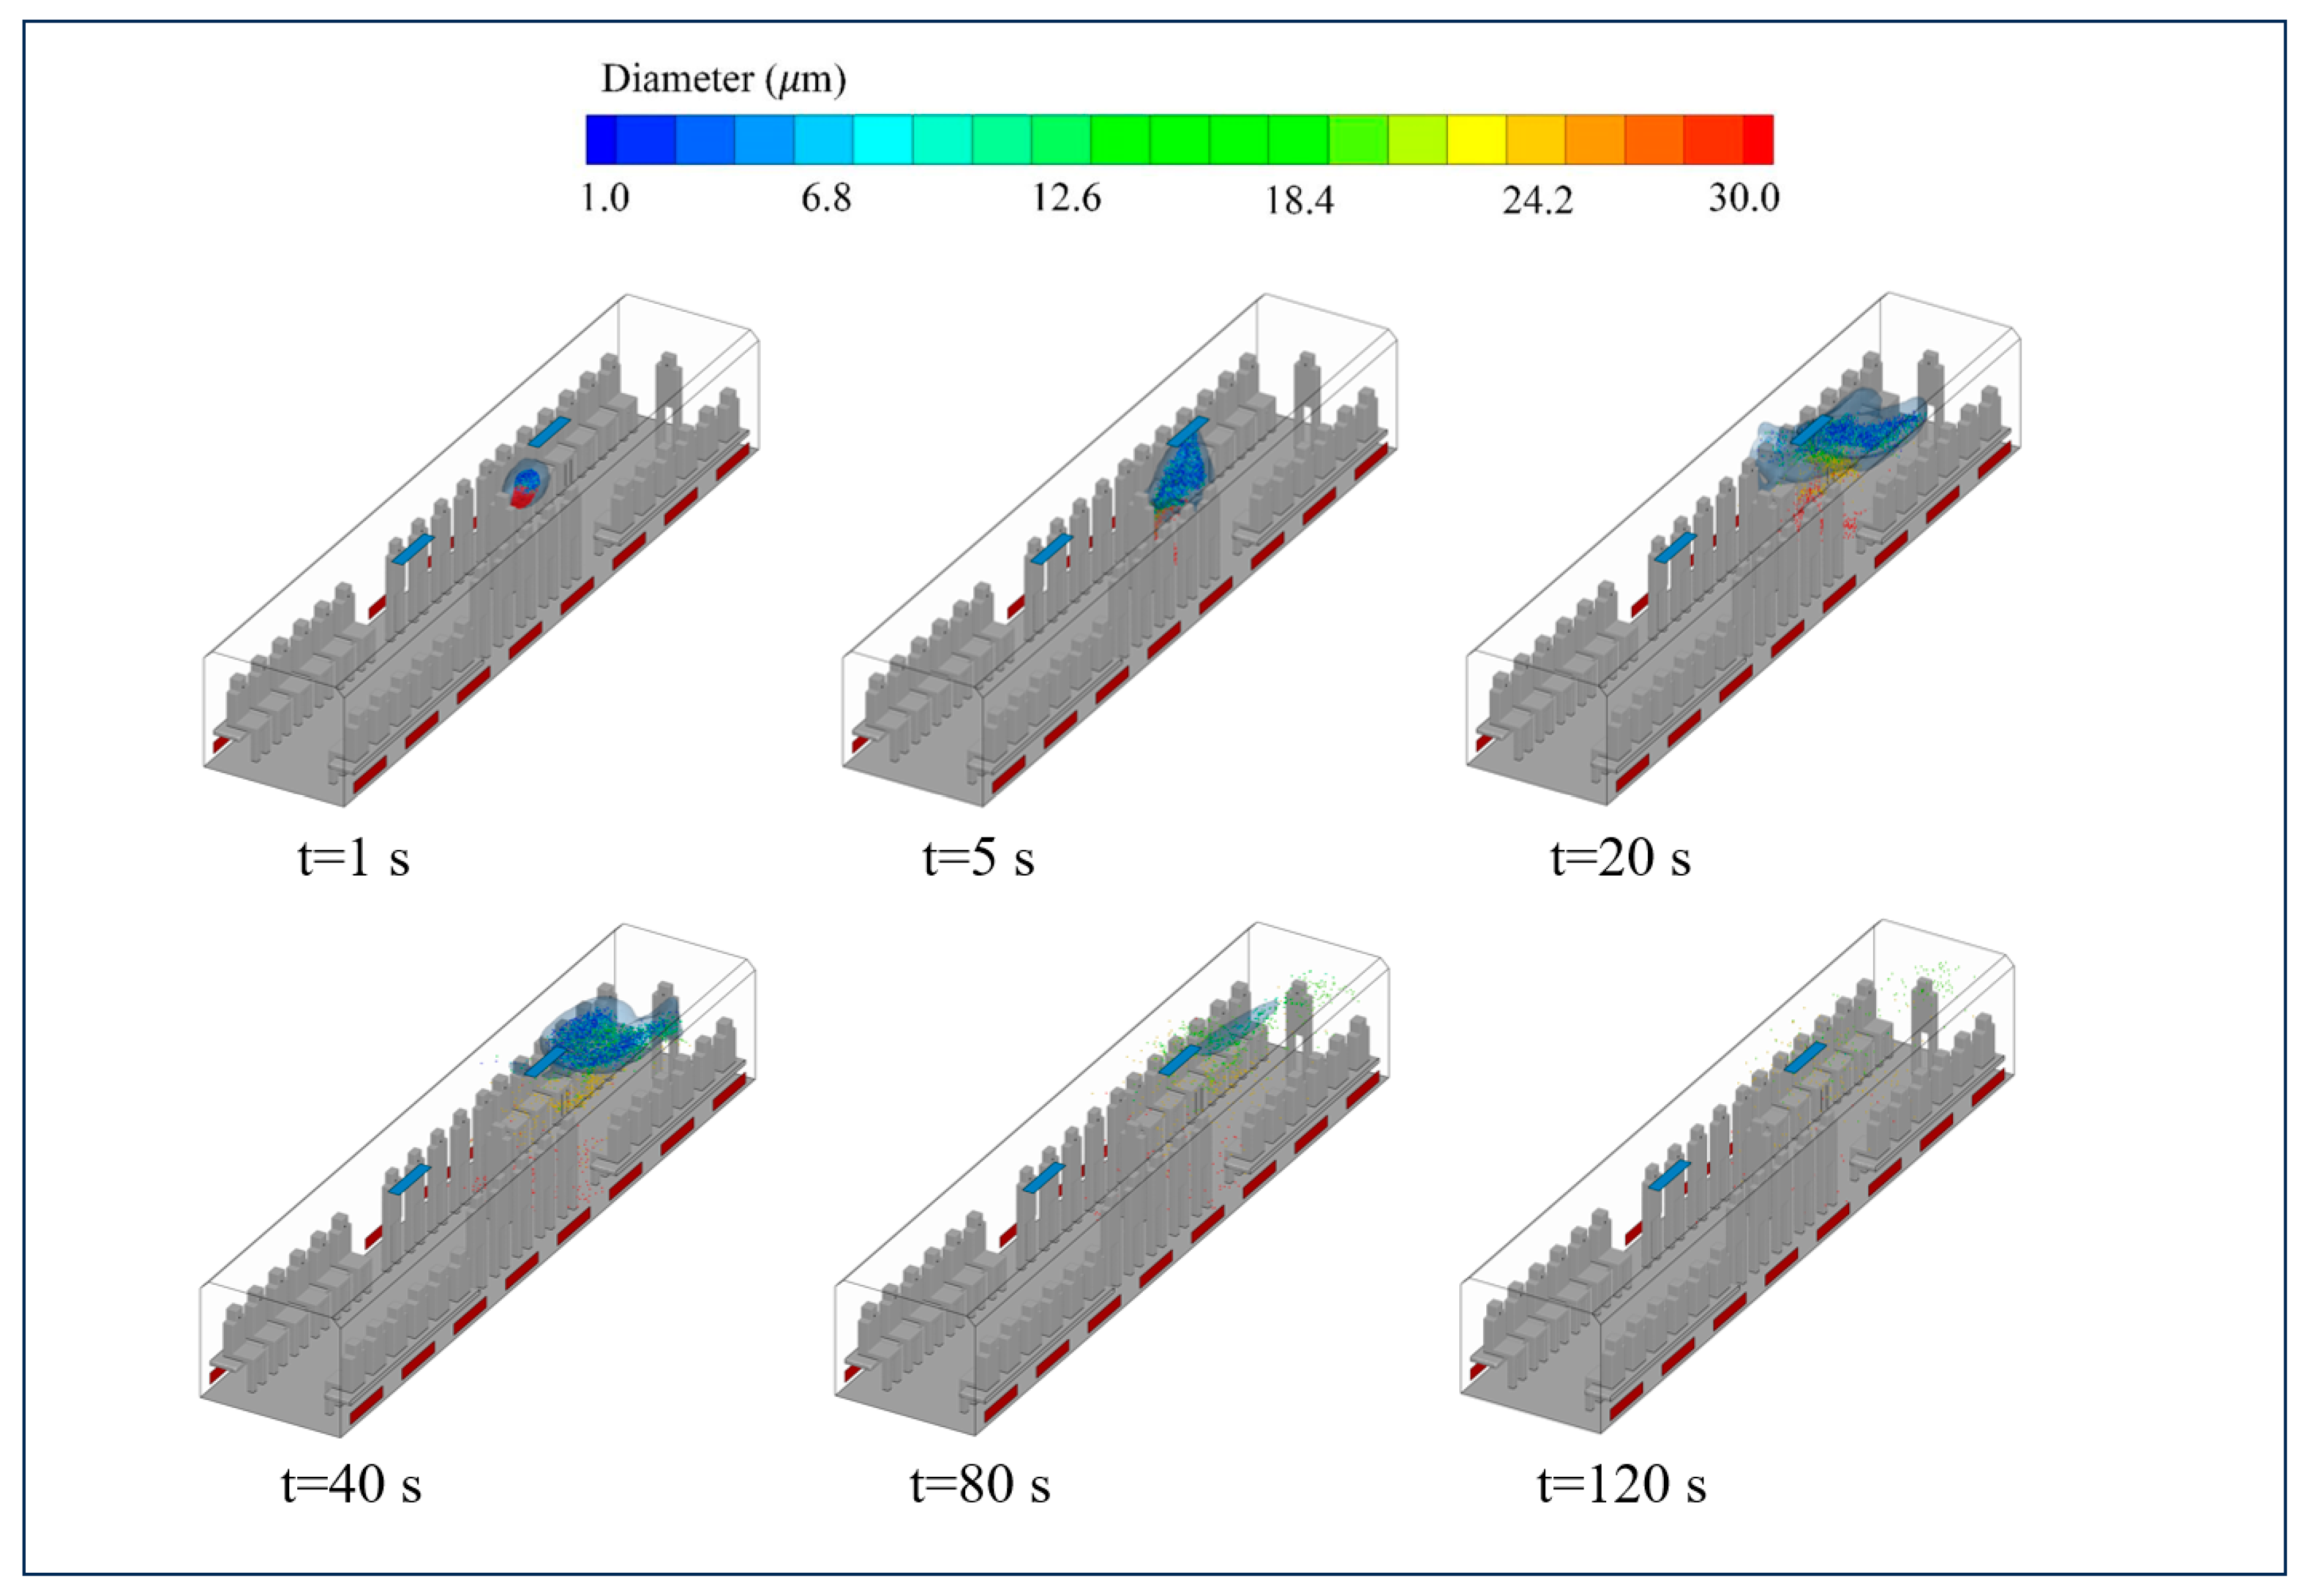
3.3. Spatiotemporal Distribution of Cough Droplets Under the SFRC System

Compared to the MV system, the SFRC method has a stronger ventilation effect, with a more distinctive distribution of droplets. Figure 8 illustrates the droplet nucleus distribution in Case 1, where the air supply velocity of the SFRC system is 0.2 m/s. Notably, at t = 5 s, the droplets move more quickly towards the return air vents, with droplets larger than 30 µm disappearing. Due to evaporation, most droplets shrink to nuclei smaller than 15 µm, rising due to the combined effects of exhaled airflow and thermal plume, then spreading out upon nearing the ceiling. Under the influence of the SFRC system, the diffused droplet nuclei quickly gather near the return air vents. At t = 80 s, most droplets in the carriage have been cleared, and droplet nuclei are more uniform. This contrasts sharply with Case 4 and Case 6, demonstrating the superiority of ceiling return air in removing contaminants (as can also be observed from the diffusion range of the tracer gas).

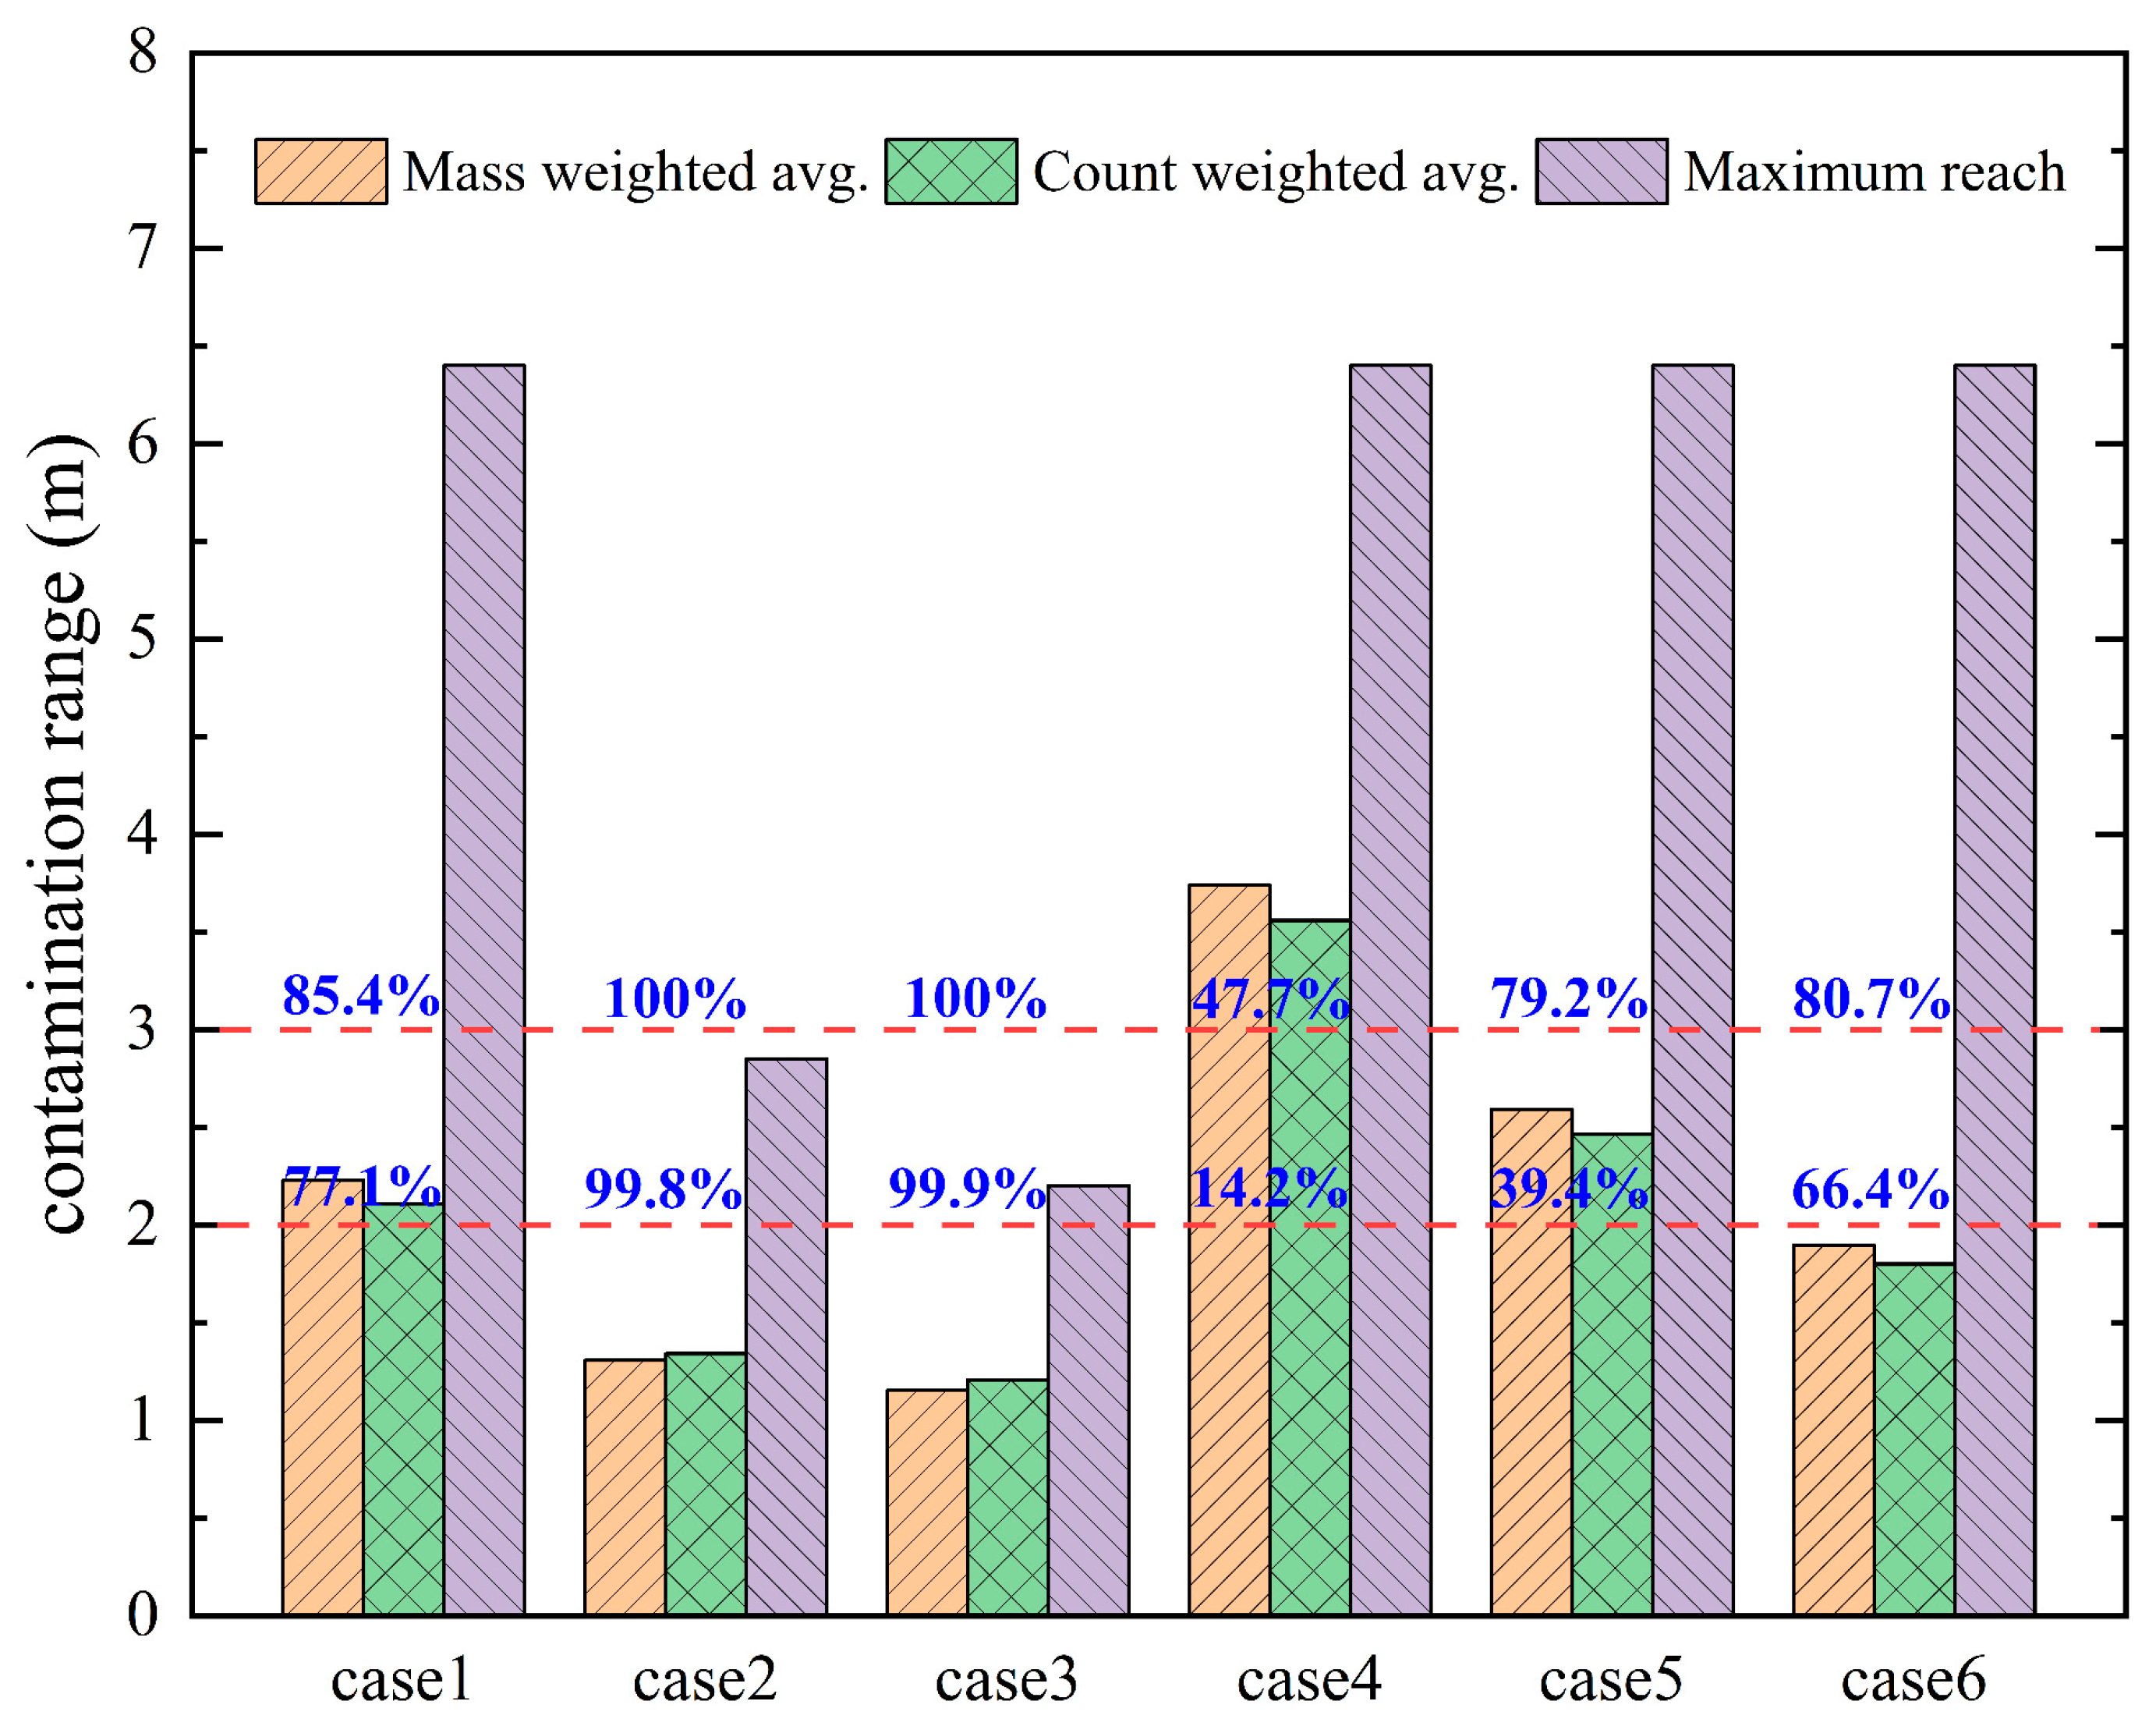
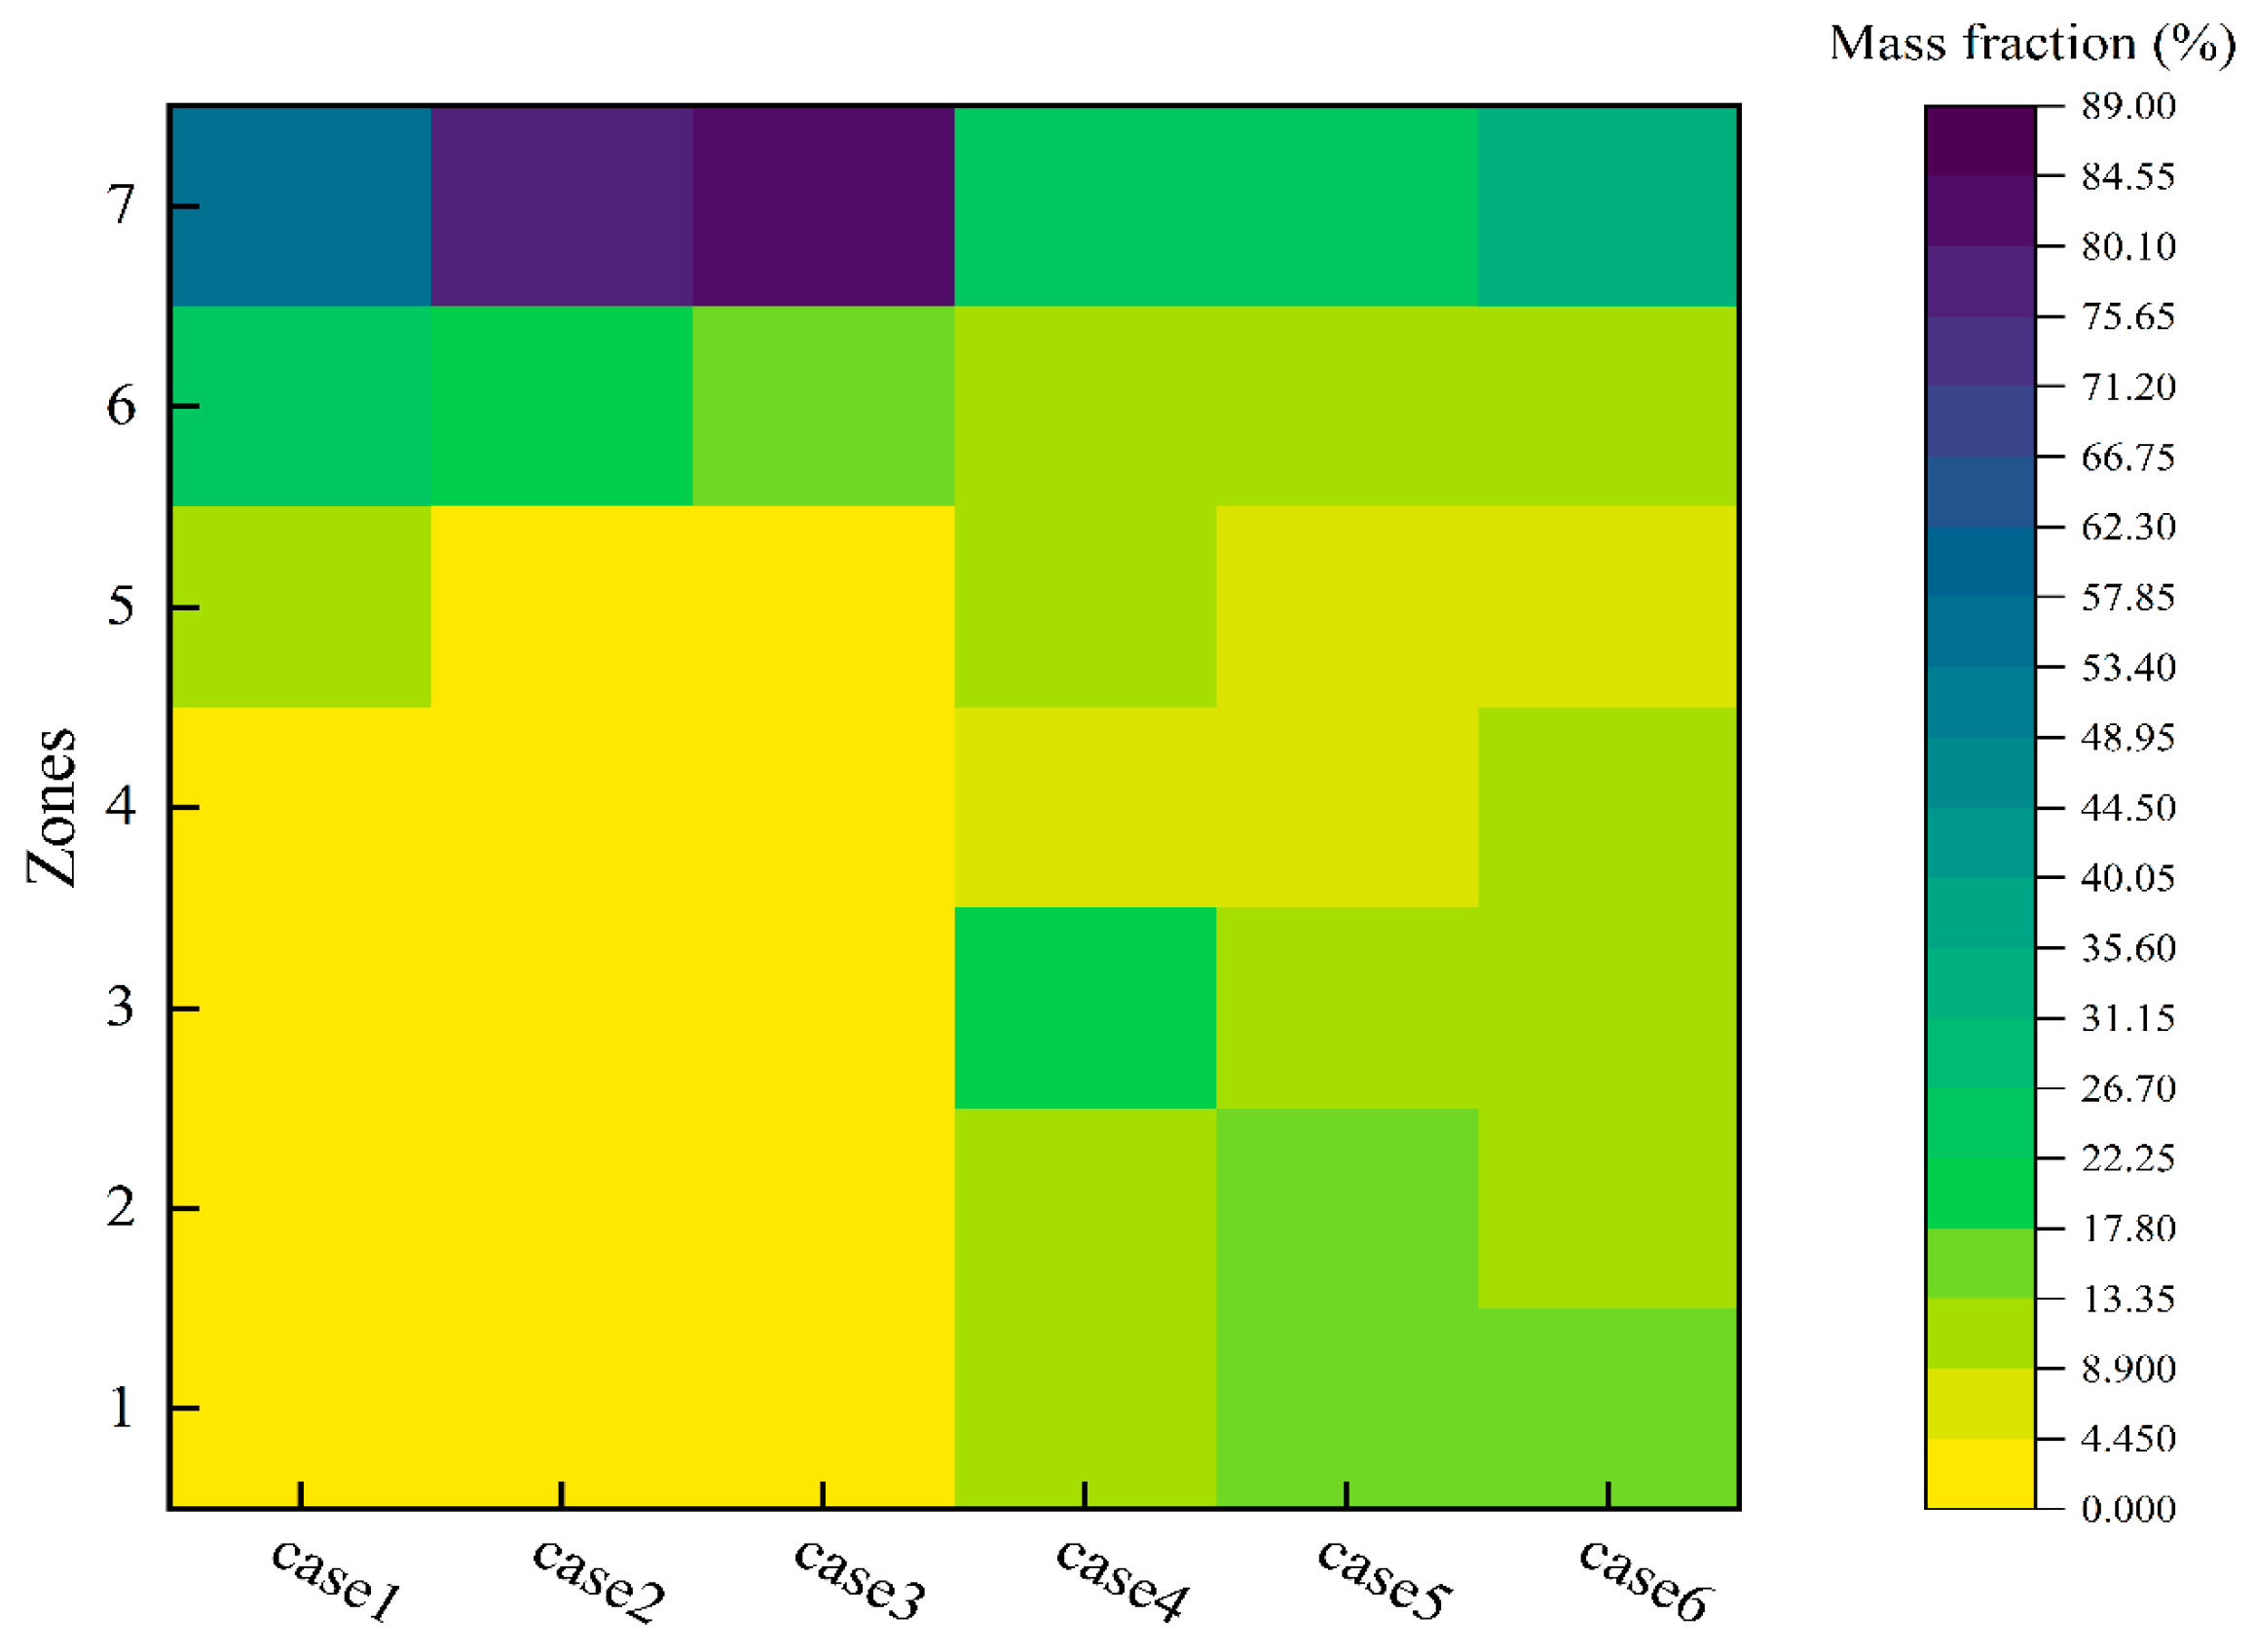
3.4. Average Contamination Range and Maximum Reach

Figure 9 illustrates the spectrum of pollutants and the maximum dispersion of cough particles across different ventilation methods. It is notable that the calculated pollutant ranges for the two ventilation methods differ significantly. Under the SFRC method, the pollutant range is smaller and decreases with increasing wind speed.
Both the maximum reach of cough particles under the MV method and at low wind speeds in the SFRC method exhibit relatively high values. Figure 9 shows that for the SFRC system at low wind speeds, approximately 77.1% of particles are within a 2 m range, while in the other two wind speed conditions, nearly 99.9% of particles settle within 3 m. Only a few instances reach distances beyond 3 m. In the MV system, when the air supply velocity is V = 0.8 m/s, only 47.7% of particles are within the 3 m threshold, while the majority of particles flow farther away, significantly increasing the infection risk for passengers at a distance. After increasing the wind speed, approximately 20% of particles still reach even farther distances. At low wind speeds, both ventilation methods have high values for the maximum particle reach.
The mass-weighted average pollution range serves as an important indicator for assessing infection risk, and Figure 9 clearly shows the differences between the two ventilation methods. Under the same air supply conditions, the mass-weighted average pollution range for the SFRC method is consistently lower than that of the MV system and remains within the social distancing threshold of 2 m. Under high wind speeds, the infection distance is significantly less than the social distancing threshold of 3 m. At a distance of 1 m from the infected individual, there is a higher risk of infection; however, the larger area of the carriage indicates the safety of this ventilation method. The SFRC system has a faster and more efficient pollutant removal capability, ensuring greater safety for passengers. The mass-weighted average range of the MV system consistently falls within the safety threshold of 2–3 m. Regardless of changes in the three wind speeds, the pollution ranges remain quite similar, and at a wind speed of 1.6 m/s, a high infection risk still exists.

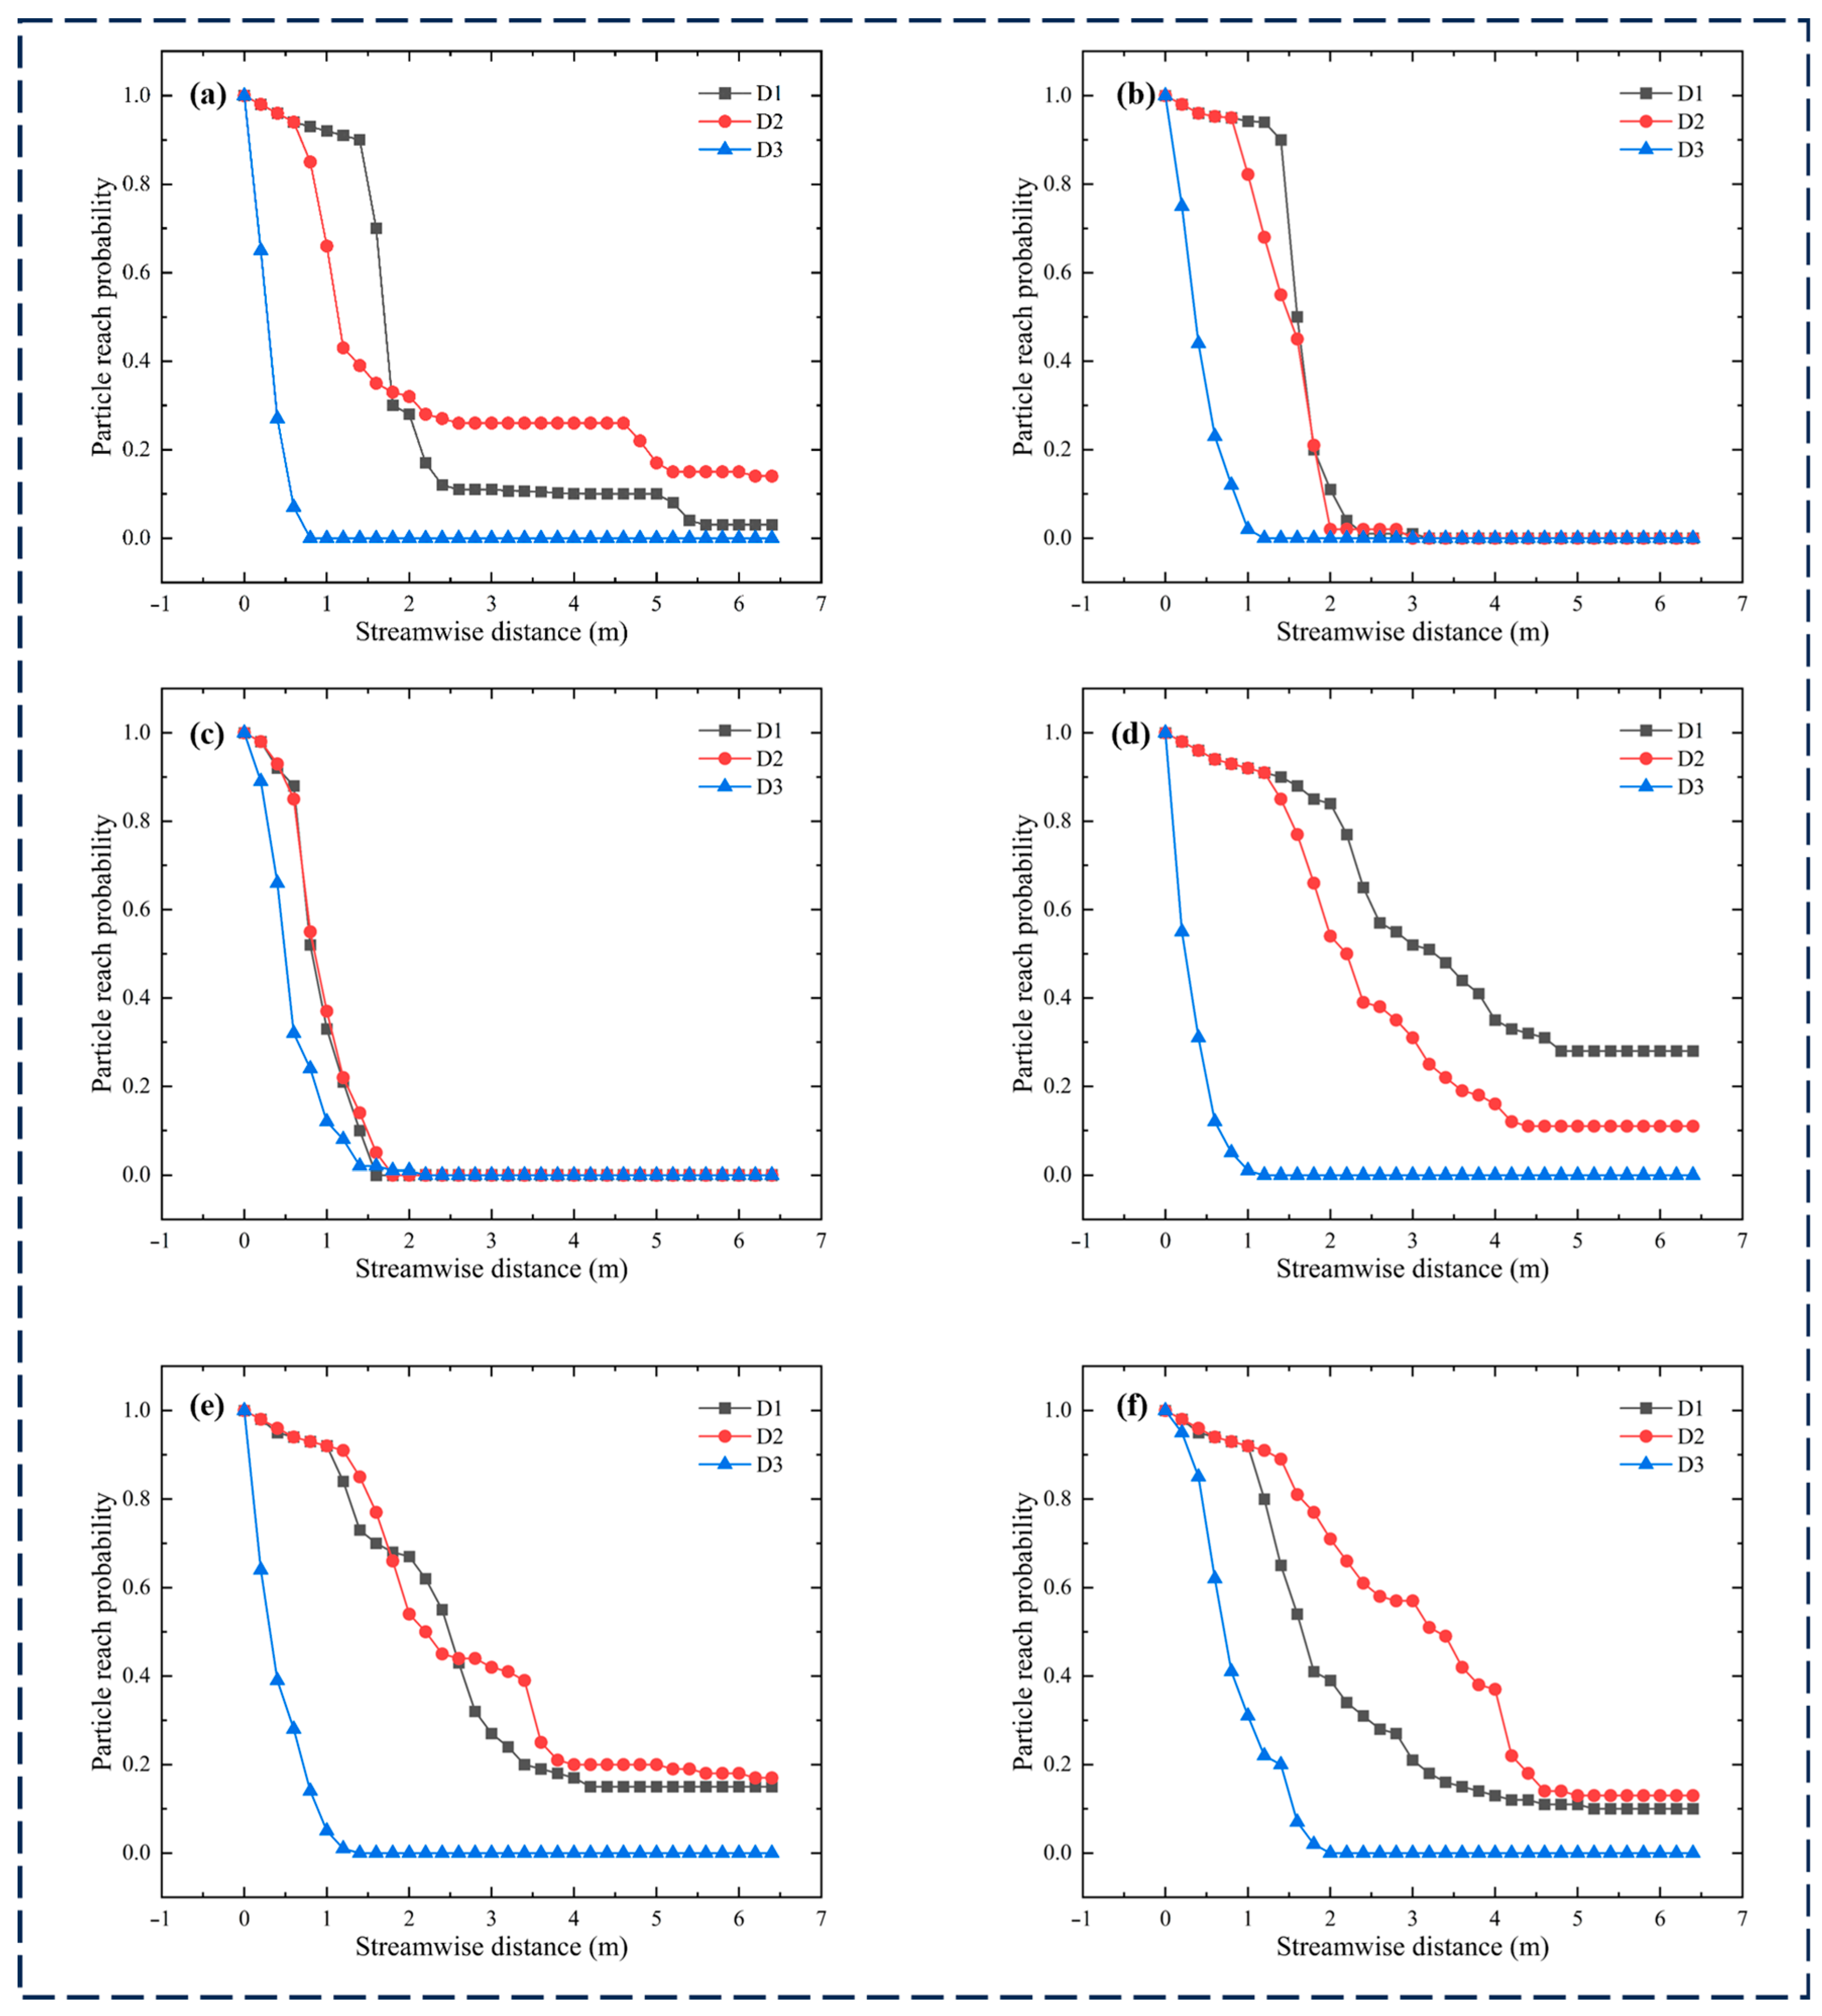
3.5. Particle Reach Probability

Figure 10 presents a quantitative comparison of the PRP under six scenarios with different ventilation methods. For the purpose of statistical data analysis, particle sizes were divided into 20 size intervals. However, for brevity, only three key intervals are listed. In the PRP legend, category D1 denotes aerosol particles (diameter < 5 µm), D2 encompasses the intermediate size range of 30–50 µm, while D3 denotes the maximum size in the cough diameter distribution of this study (diameter 100 µm). The overall trend shown in Figure 10 indicates that the PRP decreases as the diameter decreases. This suggests that particles with greater mass are more likely to settle closer to the coughing source, while lighter particles tend to remain suspended in the air. Cases (a)–(c) correspond to the SFRC system, where it can be observed that particle sizes within the aerosol range exhibit a strong tendency to remain airborne even at a distance of 4 m from the infected individual.
Although the situations of the two ventilation systems differ slightly, this trend is consistently observed across the six examples. Another extreme is that, at different air supply speeds, the largest particles in diameter distribution for both ventilation methods settle at distances of less than 2 m from the ground. Regarding Figure 10, in the MV system (d)–(f), neither intermediate nor smaller diameter particles exhibit a tendency to settle at close distances, and the flow distances are significantly greater than those in the SFRC system. The overall trend of PRP variations for different particle sizes remains unchanged; however, within the social safety distance of 2–3 m, both intermediate and small diameter particles show a higher probability of reaching their destination, with no significant differences in the sedimentation distances of the final particles in the distribution.
By comparing Figure 10c and Figure 10f, several conclusions can be drawn. Figure 10c,f illustrates the effect of different ventilation methods on PRP under the same high air supply speed. For example, in the SFRC system, the sedimentation distance for D2 particles is nearly 200% shorter than that in the MV system. Additionally, at lower air supply speeds, the PRP of medium-sized aerosol particles increases significantly. This clearly demonstrates that improving ventilation under a more efficient system reduces the risk of airborne transmission.

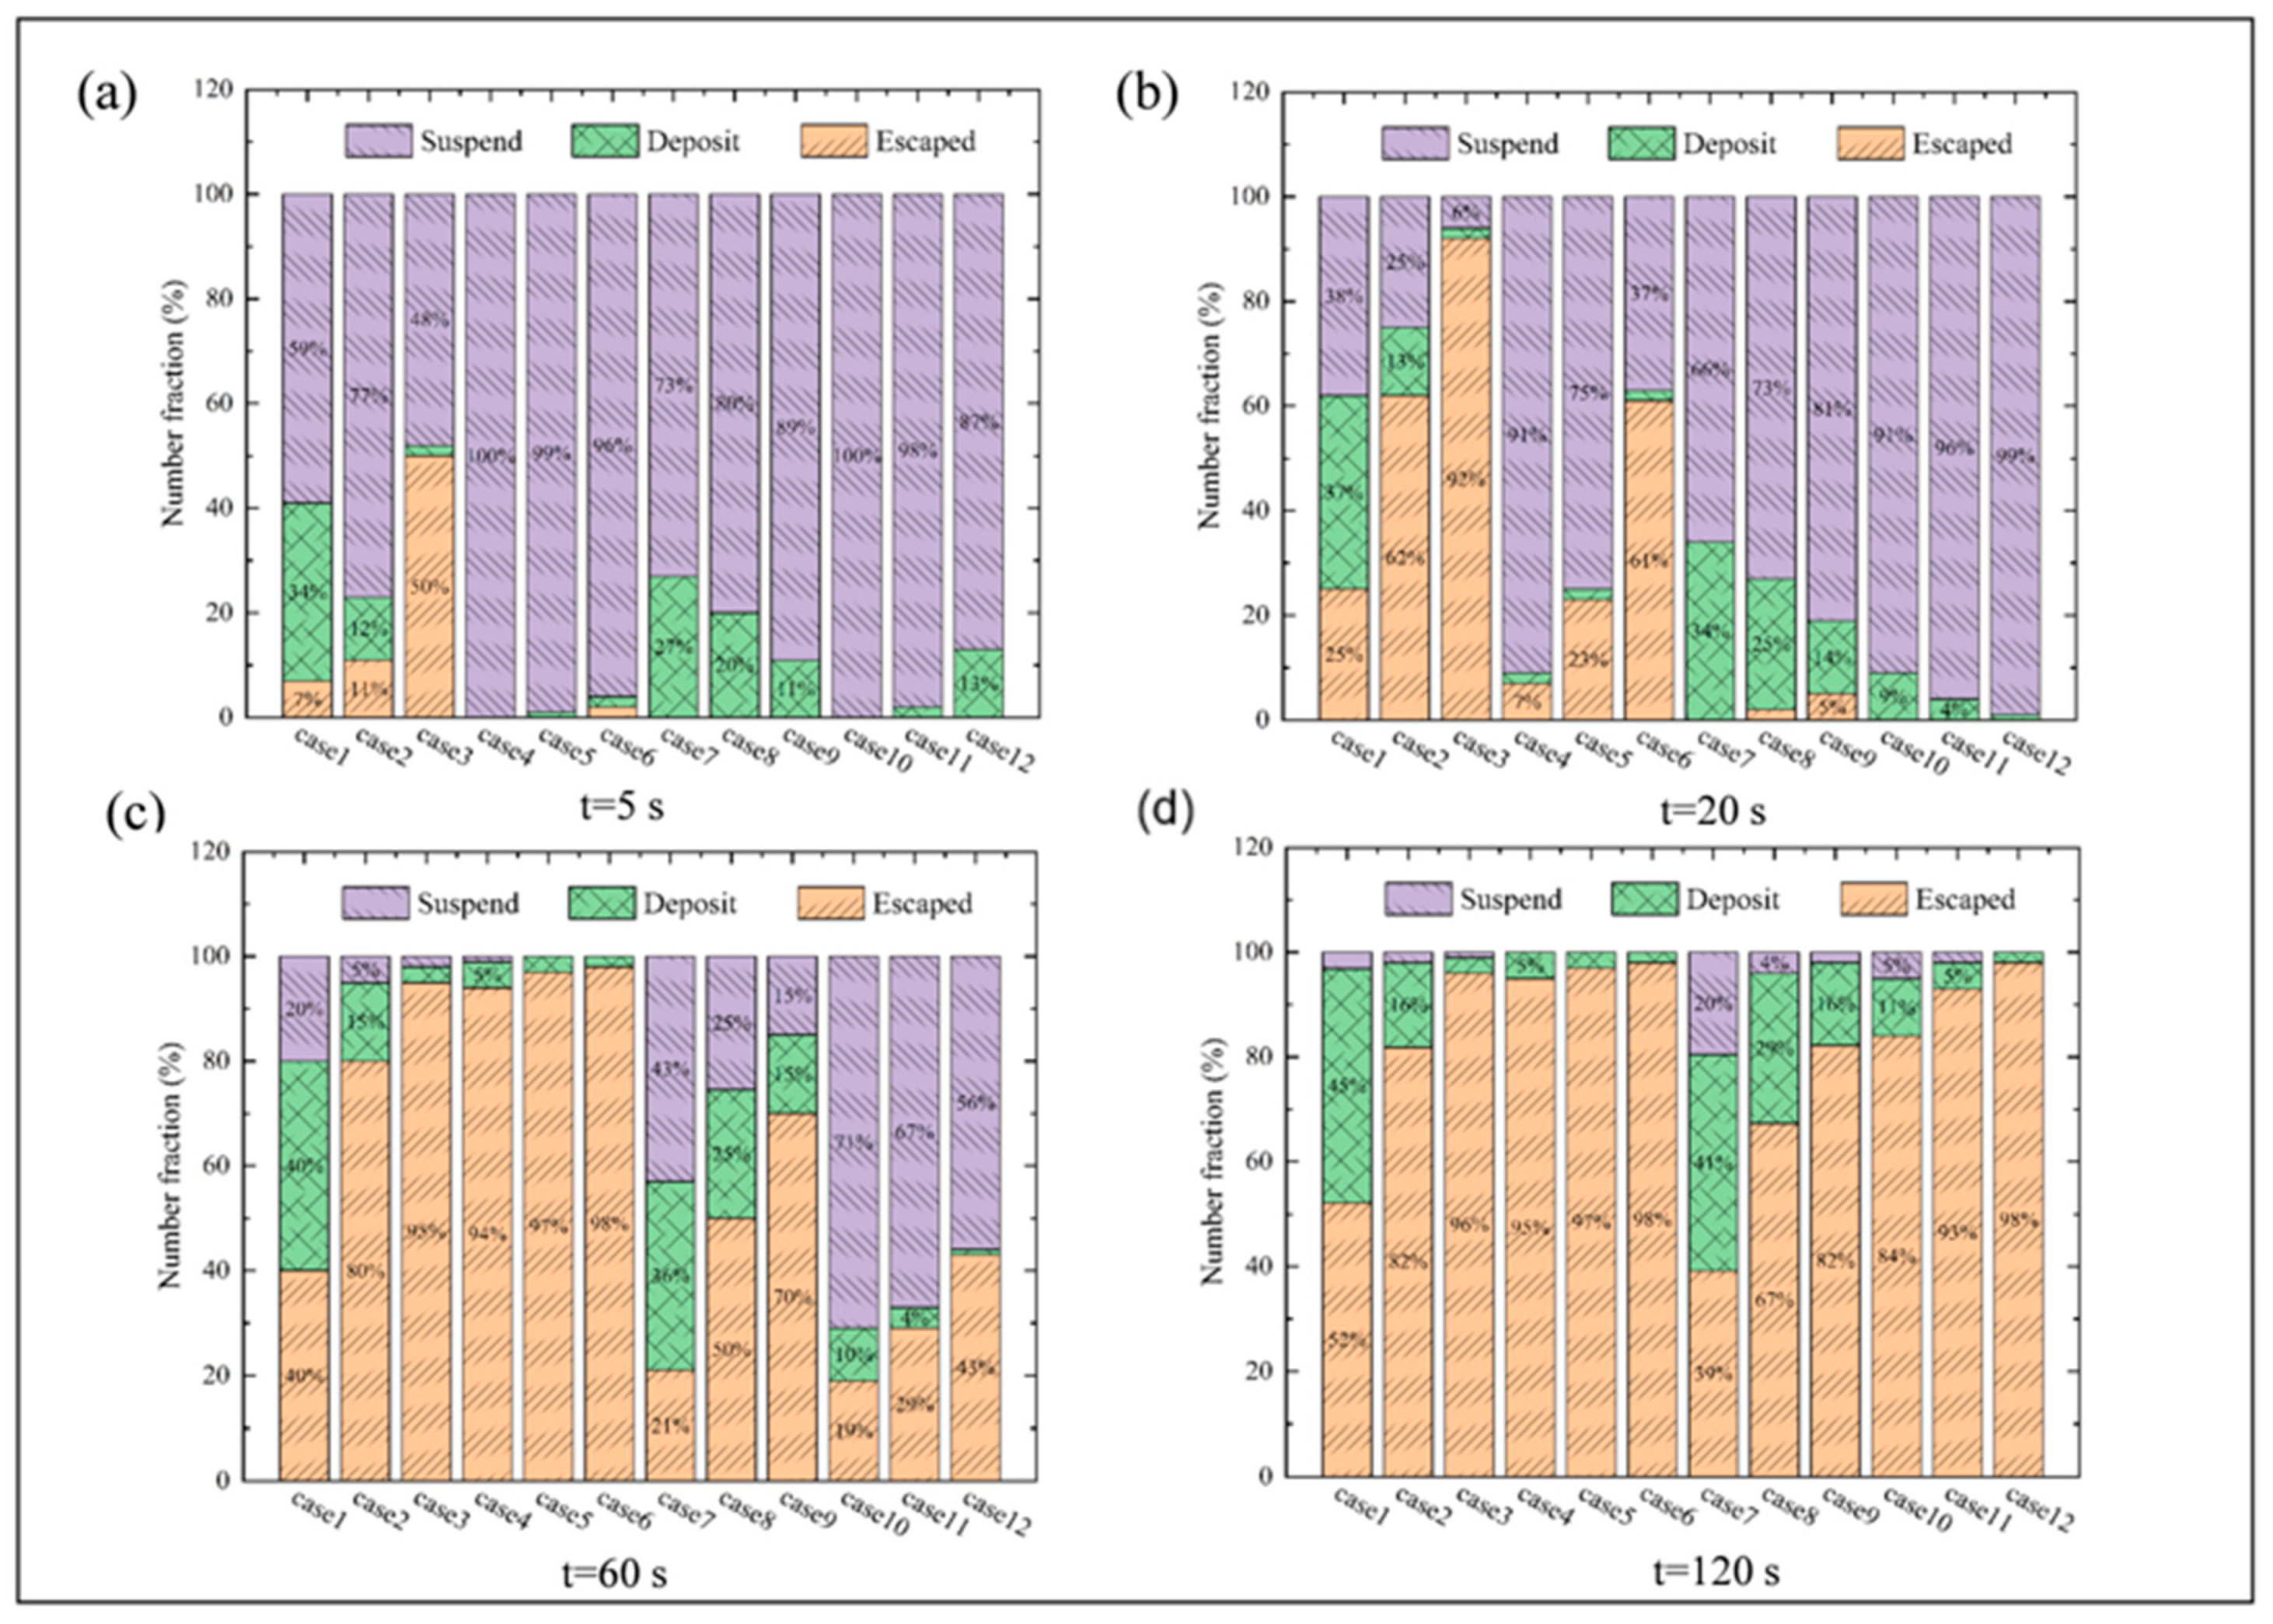
3.6. Characteristics of Air Supply Velocity on the Deposition, Suspension, and Expulsion of Cough Droplets from Patient

To objectively evaluate the dispersion of droplet nuclei within a carriage, Figure 11 shows the proportion of suspended, deposited, and escaped droplet nuclei as a percentage of the total release at four different time points: 5 s, 20 s, 60 s, and 120 s. The results indicate that due to the patient’s coughing and the continuous breathing of other passengers, the number of suspended, deposited, and escaped droplet nuclei inside the subway car increases over time. At all four time points, the number of suspended droplets in the SFRC system is significantly lower than in the MV system. At the early stages of droplet dispersion, the escaped and deposited droplet nuclei behave oppositely in comparison to the MV system. For example, at t = 20 s, the suspended, escaped, and deposited droplet fractions in Case 1 were 38%, 25%, and 37%, respectively, while in Case 4, they were 66%, 0%, and 34%. This is related to the distribution of droplet nuclei under the two ventilation methods and air supply speeds. When the SFRC method is used, most droplet nuclei accumulate near the ceiling and are effectively removed by the return air vent in the ceiling. When using the MV method, the droplet nuclei disperse over a wider area, concentrating near the passengers’ heads, resulting in less effective removal of the droplet nuclei.
The temporal distribution of droplet nuclei varies depending on the air supply rate. In the case of the SFRC air supply system, at the initial moment, the largest discrepancies in the proportions of suspended, escaped, and deposited droplet nuclei were 29%, 43%, and 32%, respectively. At t = 120 s, the maximum differences were 6%, 14%, and 44%. In the case of the MV air supply system, the maximum discrepancies in the fractions of suspended, escaped, and deposited droplet nuclei were 16%, 0%, and 16%, respectively. Over time, many droplet nuclei remained suspended inside the subway carriage. At t = 60 s, the maximum differences in suspended, escaped, and deposited droplet nuclei were 28%, 49%, and 21%. Even at t = 120 s, droplet nuclei had not been fully removed in the MV air supply system with lower air supply speed. These data indicate that different air supply methods and speeds have a significant impact on the distribution of droplet nuclei inside the subway carriage. Droplet evaporation is directly influenced by temperature and relative humidity, which in turn are influenced by various other factors; but, the evaporation time into droplet nuclei is brief and the diffusion time scale is much longer than the evaporation time scale. This study uses typical summer air supply temperatures and relative humidity conditions. Therefore, the effect of relative humidity on droplets is not considered.
Figure 12 shows the proportion of droplet nuclei across different vertical heights. The subway carriage, with a height of Z = 2.1 m, was divided into seven regions, each with a vertical height of 30 cm. It can be observed that under the SFRC air supply system, at a height of 0–1.5 m (where Z = 1.5 m represents the breathing zone for standing passengers), the droplet distribution is uniform and the quantity is very small, with a proportion below 4.45%. At lower wind speeds, the proportion of droplet nuclei reached about 20%, with most droplet nuclei concentrated near the ceiling, above head level. The higher the air supply speed, the more nuclei accumulate near the ceiling.
For the MV air supply system, the droplet nuclei were evenly distributed throughout the entire vertical area. This also indicates that the evenly distributed droplet nuclei near the return air outlets at the head and tail of the car are harder to remove. However, the return air outlets in the SFRC system, where droplet nuclei concentrate near the ceiling, are more effective at removing pollutants. This figure mainly illustrates the concentration levels of pollutants in the vertical direction for the two air supply systems. The absolute concentration of pollutants can be inferred from the concentration of tracer gas in Figure 13a. The y-axis represents the normalized average concentration. In the figure, it is clear that the pollutant concentration in the SFRC air supply system is significantly lower than in the MV system. The tracer gas concentration in the low-speed Case 1 is lower than in the high-speed Case 4. It can also be observed that the pollutant concentration in each case increases gradually. Throughout the process, the higher the air supply speed, the lower the pollutant concentration, and the fewer suspended droplet nuclei. Higher air supply speeds lead to greater efficiency in pollutant removal. At t = 65 s, the concentration in the SFRC system stabilizes and approaches zero. In contrast, under the MV system, pollutants still remain in the subway car at t = 120 s, with Case 4 at a low air speed of V = 0.8 m/s being the worst-performing scenario. Increasing ventilation rates helps remove droplet nuclei from the subway car through the exhaust, reducing both deposition and suspension of the droplets.
To track the dispersion of the contaminated fluid, a tracer gas with a density of 1.977 kg/m3 and a mass diffusion coefficient of 2.5 × 10⁻⁵ kg/m·s was introduced into the simulation. The tracer gas was incorporated into the model domain using a user-defined function (UDF) and was assigned a velocity inlet boundary condition. By implementing this UDF, a tracer gas jet was generated at the mouth of the coughing passenger, oriented at a 90° angle to the mouth plane, with a jet velocity of 13 m/s, a temperature of 310.15 K, and a duration of 0.2 s [36].
Figure 13b shows the inhalation of droplet nuclei at the mouth level. It is clear from the figure that the fewest droplet nuclei are inhaled in Case 3, and under high air speed conditions, droplet nuclei are only inhaled around 28 s. However, it is observed that in the same SFRC system, Case 1 with low air speed inhaled the largest amount of droplet nuclei at 5 s, indicating that even in an advanced ventilation system, an appropriate air speed must be set to achieve optimal contaminant removal performance. The variations in cases 4 to 6 are similar with minimal fluctuations, and remain constant over a long period, which is due to the more uniform distribution and higher number of suspended droplet nuclei in the MV system. From case 1 to 3, the number of inhaled droplet nuclei initially rises and then falls over time, with an overall decreasing trend. Under the appropriate air speed, the SFRC system only begins to inhale particles after 60 s, while in the MV system, particle inhalation is more stable, with little variation in the number of inhaled droplet nuclei when changing the air speed.
The vertical axis M * represents the normalized average mass concentration, which can be calculated using Equation (12).
M * = M a v e M m a x
In the equation, Mave represents the area-weighted average mass concentration within the target region (plane), while Mmax is the maximum area-weighted average mass concentration observed across all conditions during the entire simulation period.

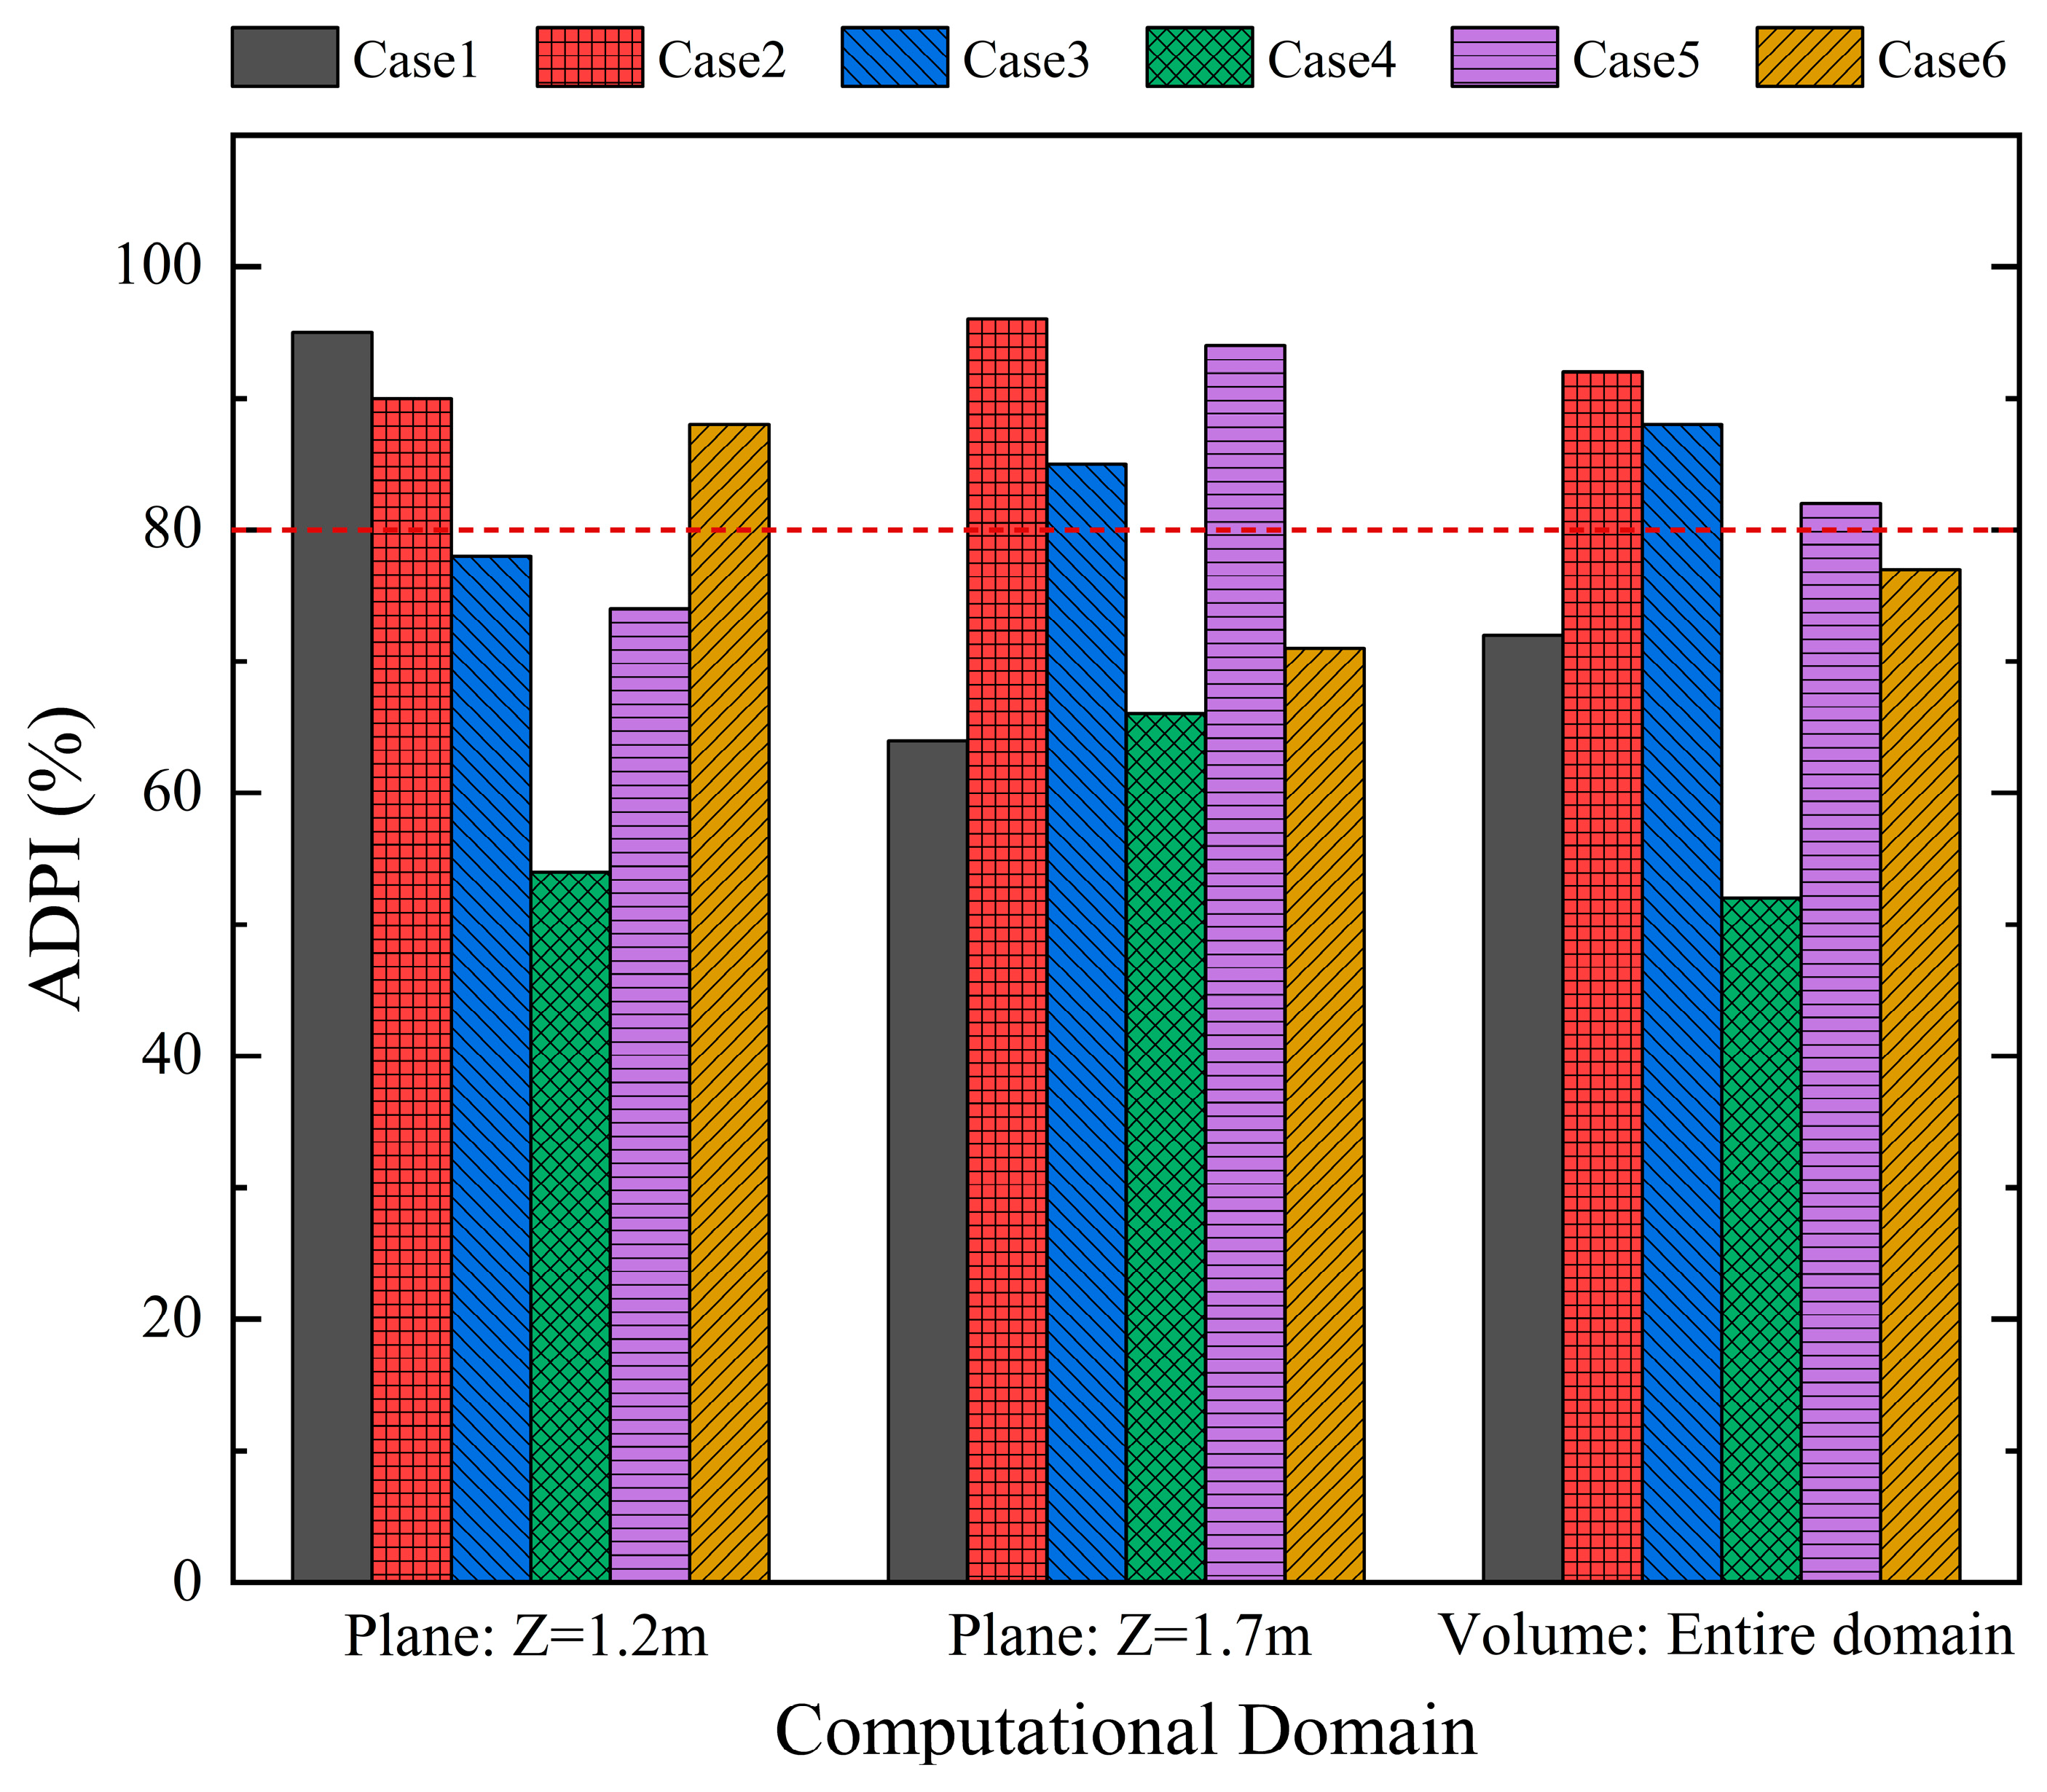
3.7. Analysis of Energy Consumption and Comfort in Different Ventilation Systems

The energy consumption of a ventilation system consists of the energy required for air transportation and the energy consumed for air conditioning. The energy consumption for air transportation refers to the energy required for the fan to drive airflow through the ducts, which can be calculated using Equation (13).
P F = k Q 3
In the equation, PF represents the energy consumption for air transportation (kW) and k is a coefficient determined by the fan type. The energy consumption for air conditioning refers to the energy required to handle the load inside the subway carriages. The energy consumption for air conditioning can be calculated using Equations (14) and (15).
P C = Q L C O P
Q L = c p ρ Q Δ t
In the equation, PC represents the energy consumption for air conditioning (kW), QL is the HVAC system load (kW), COP is the coefficient of performance of the air conditioning system, cp is the specific heat capacity of air at constant pressure (kJ/(kg·K)), ρ is the air density (kg/m3), Q is the fresh air volume (m3/s), and Δt is the temperature difference between the outlet of the total heat exchanger in the HVAC system and the return air inlet of the subway carriages.
In this study, when calculating ventilation energy consumption, COP was set to 4.2, cp was set to 1.013 kJ/(kg·°C) (corresponding to dry air at 25 °C), and air density was dynamically calculated using the incompressible ideal gas state equation. The outdoor design temperature was set to 34.8 °C (according to the relevant standard GB 50736-2012) [39]. The coefficient k was set to 0.8. It was assumed that the HVAC system included a total heat exchanger, with a heat exchange temperature difference of 2 °C. Details can be found in Table 4.
Since the temperature remains constant, the primary factor affecting energy consumption is the air supply velocity. As shown in Table 5, when both ventilation systems operate at the same air supply velocity, the SFRC system demonstrates a higher overall energy-saving rate than the MV system. Based on the boundary conditions of the supply and return air outlets of both ventilation systems, the SFRC system exhibits lower energy consumption during the air-conditioning process. This may be attributed to differences in the area of the supply and return air outlets. The table indicates that at the maximum air velocity, the SFRC system achieves energy savings of 9.59%, while at a moderate air velocity, the energy savings reach 34.91%. For the MV system, apart from the low-air velocity condition where energy consumption in the air-conditioning process remains the same, no significant energy-saving advantage is observed. Compared to previous indicators such as CR and PRP, the SFRC system demonstrates greater efficiency and safety.
As a common mode of daily transportation, the airflow distribution inside subway cars plays a significant role in passenger comfort. Given the confined space within the carriage, it is particularly important to examine discomfort caused by airflow effects. We employed the Air Diffusion Performance Index (ADPI) to comprehensively compare the airflow distribution performance of two ventilation systems, aiming to determine the more comfortable air supply method.
ADPI is defined as the percentage of measurement points within the target area (e.g., the occupant activity zone) that meet the effective air supply temperature and velocity requirements, as shown in Equation (16): [42]
A D P I = j = 1 M   P E D T j i = 1 N   P i × 100 %
where Pi represents the measurement points in the target area (i = 1, 2, …N, where N is the total number of Pi); PEDT represents the measurement points that meet the temperature and velocity requirements (j = 1, 2, …, M, where M is the number of PEDT); and EDT is the effective draft temperature (°C) employed to evaluate the degree of blowing sensation in work area, as follows:
E D T = ( t x t m ) 9.1 ( ν x 0.15 )
where tx represents the air temperature of the measurement points (°C); tm represents the indoor mean temperature (°C); and vx represents the air velocity of the measuring points (m/s). When the EDT value varies between −2.2 °C and 2 °C and the air speed is greater than 0.2 m/s, most people can feel comfortable (in warm circumstances). Figure 14 presents the ADPI values for three different air supply velocities under two ventilation methods in this study. As shown in Figure 14, during summer conditions at Z = 1.2 m, the ADPI value of the SFRC system is generally higher than that of the MV system. However, when the air supply velocity is too high (V = 0.4 m/s), the ADPI value of the SFRC system falls below 80%. Although an ADPI value above 70% is generally considered acceptable for airflow distribution performance [43], an optimal air velocity is closer to the ideal comfort level. At this height, the SFRC system with low air velocity provides greater comfort, improving airflow distribution performance by 47% compared to the MV system, while medium air velocity improves performance by 18.7%. Since the SFRC system adopts a downward air supply method, with supply outlets closer to the breathing zone, discomfort occurs at higher air velocities. For standing occupants, both ventilation systems perform best at medium air velocities (V = 0.3 m/s for SFRC and V = 1.2 m/s for MV). However, from an overall perspective, the SFRC system still outperforms the MV system, with an improvement of 5% in airflow distribution performance. In addition to considering the typical breathing zone and the head-level region for standing occupants, we also examined the overall airflow distribution. As shown in the figure, at the overall level, the disadvantages of low air velocity are pronounced, as ADPI values fail to meet the 70% threshold. Although airflow distribution performance is higher at high velocities for both ventilation systems, it remains inferior to that at medium air velocities. Considering additional factors such as pollutant removal efficiency and the PRP index, higher air velocities perform better overall. Therefore, it is recommended to increase the air supply velocity as much as possible while maintaining comfort to achieve a safer indoor environment.

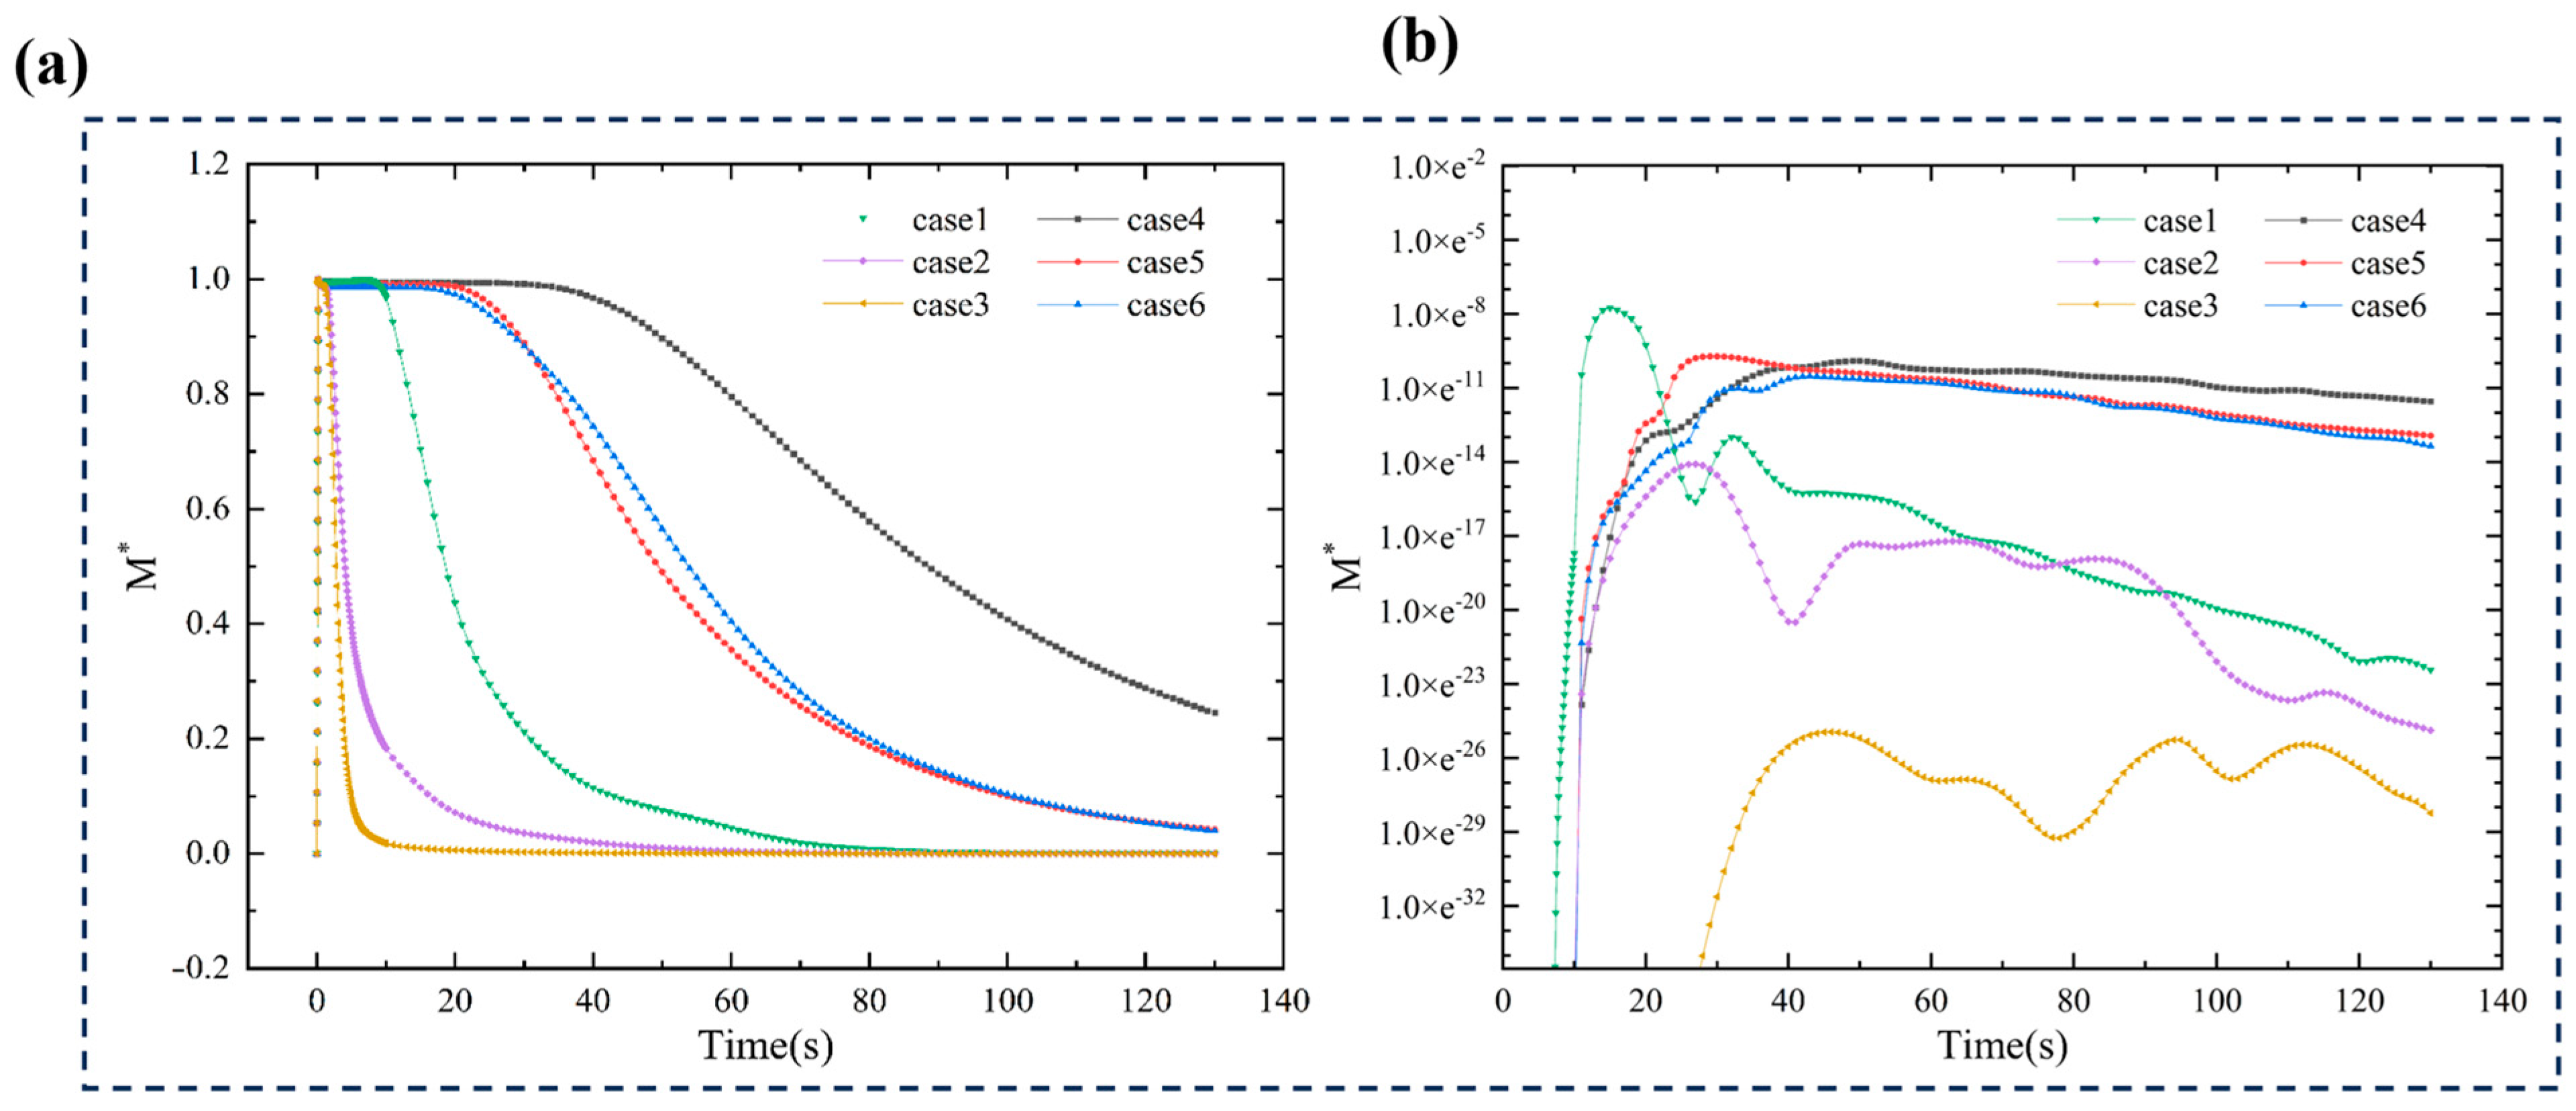
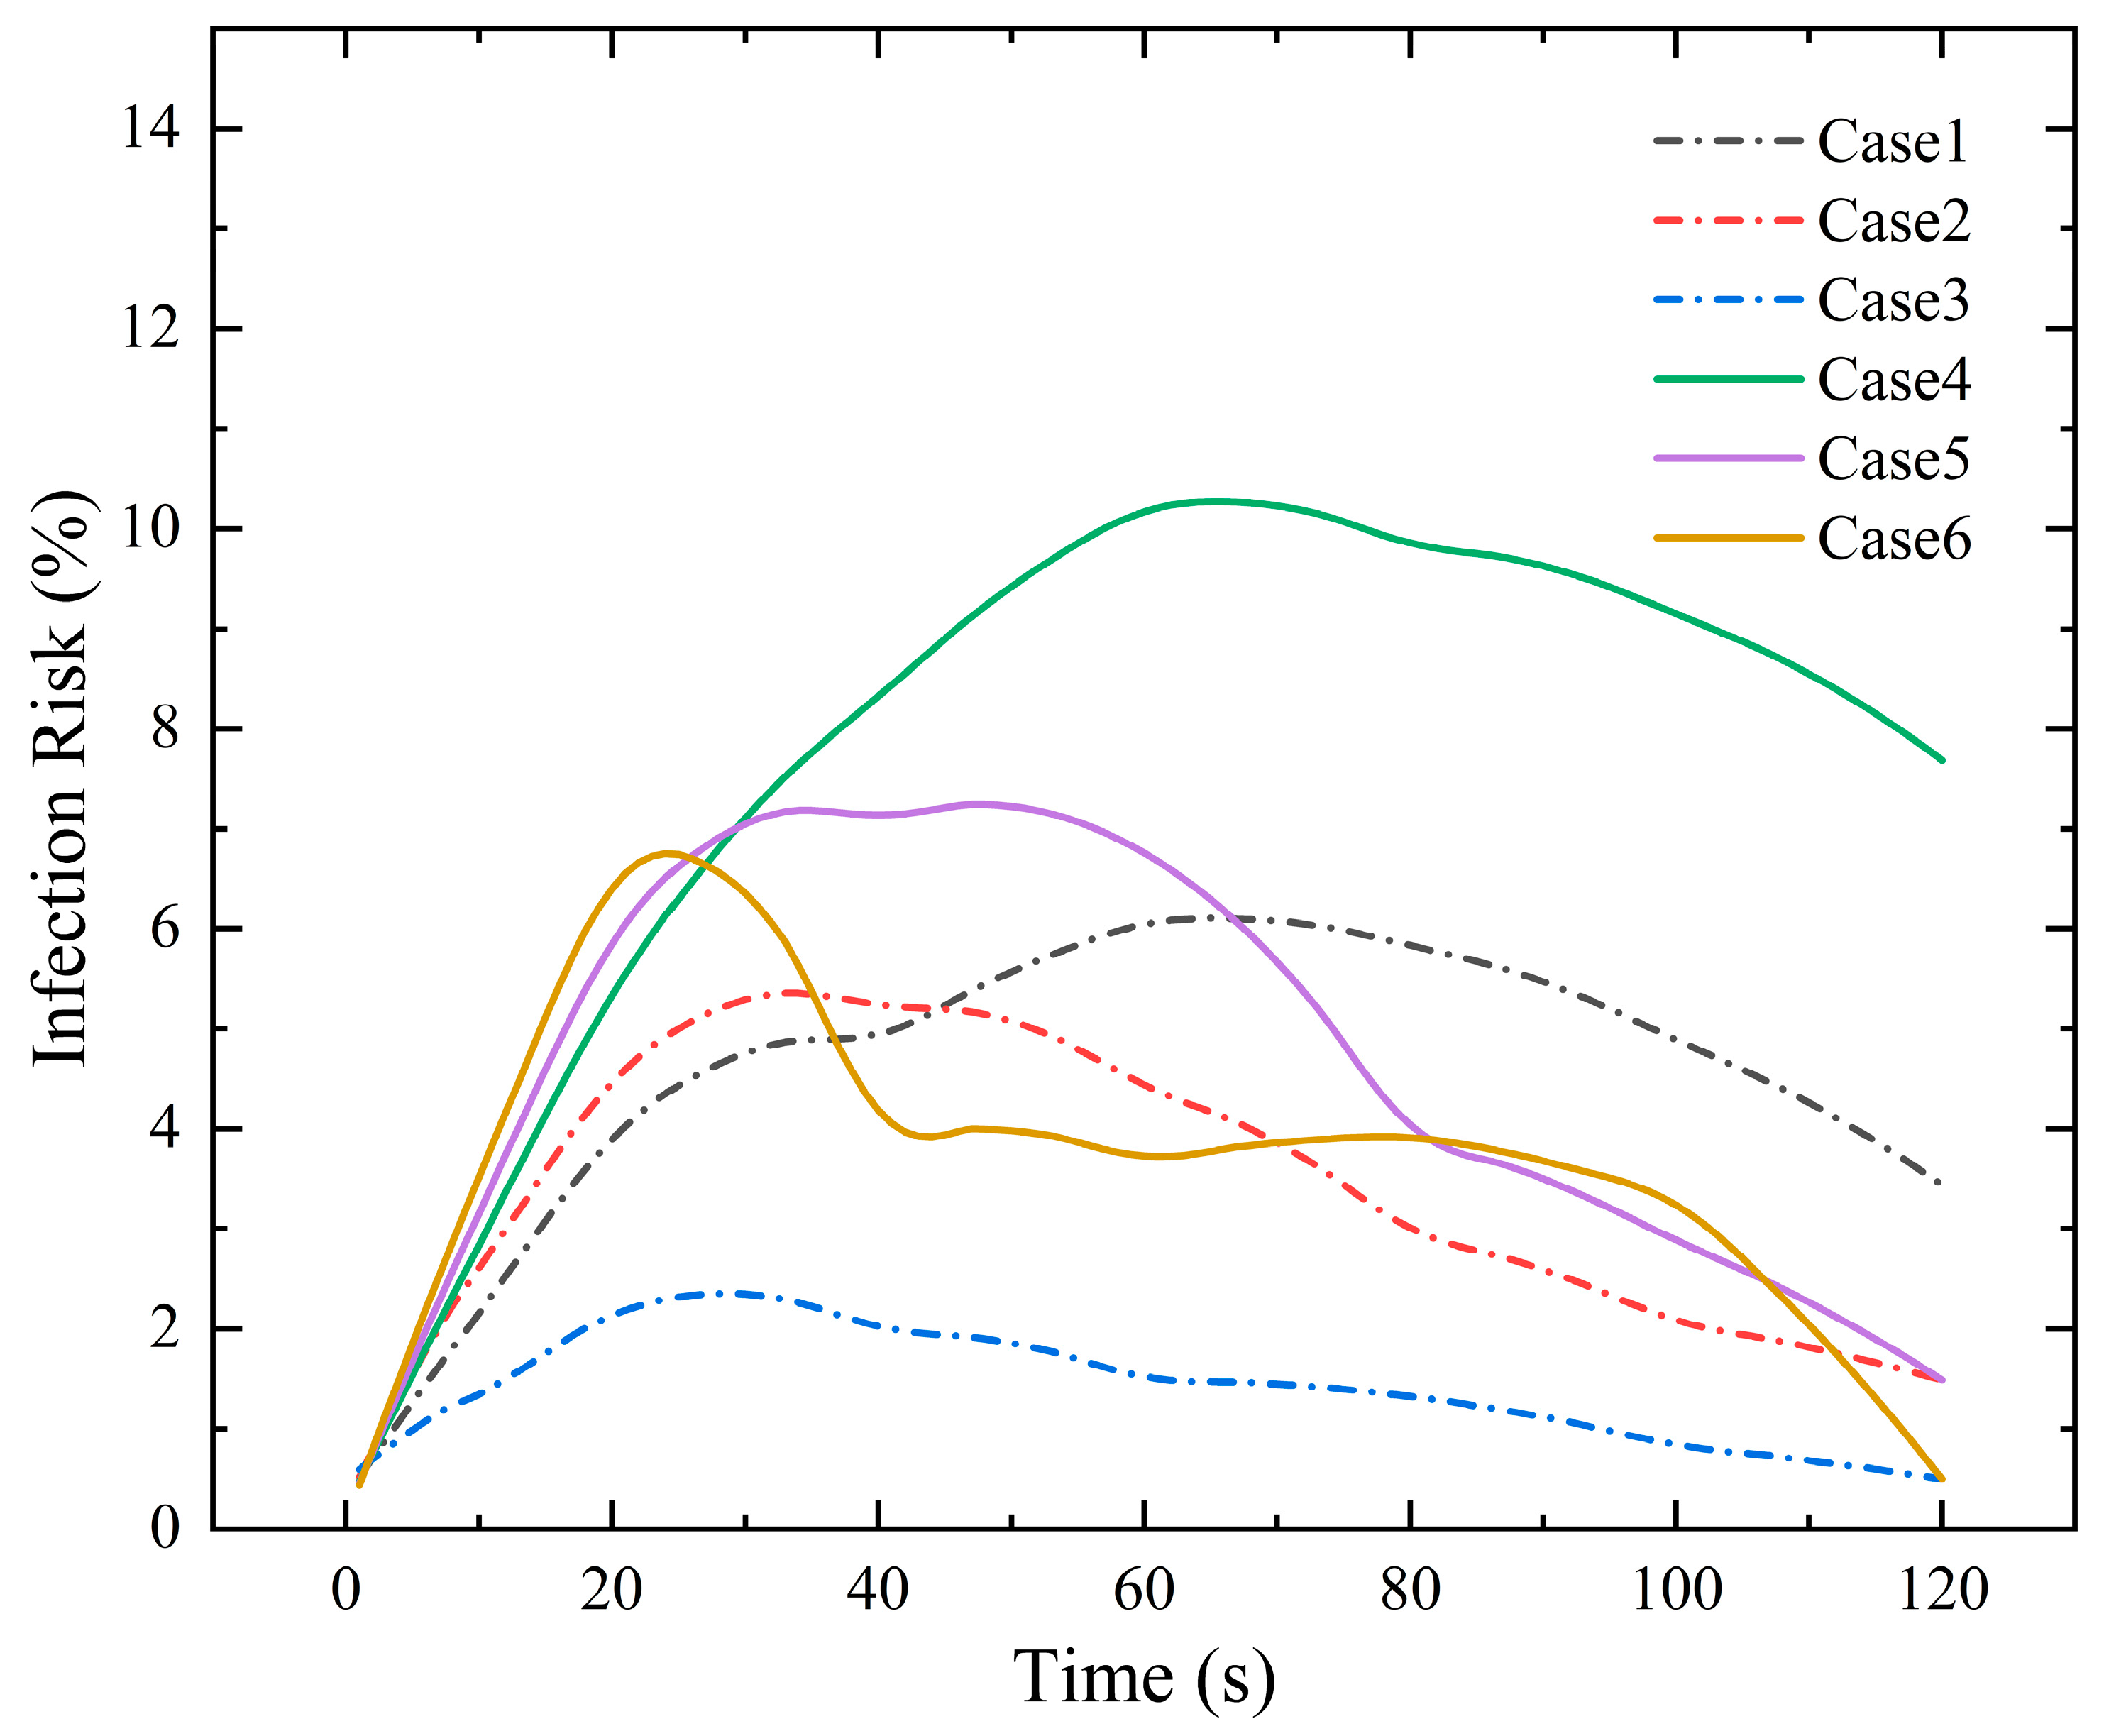
3.8. Analysis of the Infection Risk Prediction Model

This study primarily investigates droplet transmission from the perspective of ventilation systems and airflow. To better present the research findings, an epidemiological model is introduced to analyze the specific impact of droplet transmission on infection rates. Assessing infection risk may provide greater value for epidemiological and public health research. This study aims to ensure that the cumulative infection risk in the target area remains below a specific threshold within a given time frame through infection-resistant ventilation. A non-steady-state indoor infection risk prediction model based on the Wells–Riley model is employed in this study. As shown in Equation (18), the steady-state Wells–Riley model determines infection risk primarily by considering the number of infected individuals, quanta generation rate, pulmonary ventilation rate, exposure time, and indoor ventilation rate.
P = N S = 1 e I q p t / Q
In the equation, P represents the infection risk; N denotes the number of infected individuals in the next generation; S represents the number of susceptible individuals in the current generation; I is the total number of infected individuals in the current generation; q refers to the quantum generation rate per infected individual (quanta/h), which depends on the type of disease and individual physiological conditions; p is the pulmonary ventilation rate of a susceptible individual (m3/h); t represents the total exposure time (hours); and Q is the indoor fresh air ventilation rate (m3/h).
The steady-state Wells–Riley model is commonly applied when the number of air exchanges during an individual’s exposure period is sufficiently high. However, when assessing the impact of short-duration events such as coughing and sneezing on infection risk, the steady-state W-R model tends to significantly overestimate the risk. Therefore, a non-steady-state form of the W-R model must be used to accurately evaluate infection risk.
Wang et al. [44] proposed a non-steady-state Wells–Riley (W-R) model based on human behavior, which is suitable for accurately predicting infection risk caused by short-duration events such as sneezing and coughing. The probability of a susceptible individual becoming infected can be calculated using Equation (19).
P = 1 exp μ = 1 exp p θ 1 θ 2   C T = 1 d θ + θ 2 θ 3   C T = 2 d θ + . . . + θ X θ X + 1   C T = X d θ
In the equation, μ represents the total number of quanta inhaled by an individual over the total exposure duration. θ denotes time (hours), measured from the moment the quanta are initially released. CT=X represents the instantaneous quantum concentration at the beginning of the X time interval. In this study, infection risk is calculated using the aforementioned non-steady-state Wells–Riley equation.
It can be observed from Figure 15 that, for all conditions, the infection risk probability initially increases and then decreases. In the MV system, the infection probability is highest at low air velocity, reaching a peak of 10.4% at t = 60 s when the droplets spread. Afterward, the virus particles gradually move toward the return air outlet and are expelled from the carriage, causing the infection probability to decrease gradually, with a relatively smooth fluctuation. At medium and high air velocities, the fluctuations are more intense. From Figure 6, it is evident that droplets spread more intensively between t = 20 s and t = 40 s, remaining in the space for a longer duration. As they do not flow to the return air outlet in time, a sharp increase in infection probability occurs. Subsequently, due to the effect of wind speed, the droplets flow to the return air outlet and are expelled. From this, it is clear that wind speed is a critical factor in droplet spread and infection risk, especially in confined spaces. For the SFRC air supply system, although droplet release due to coughing inevitably increases infection risk, the rise in risk probability is slower and the risk value is much lower compared to the MV system. At the same air velocity, the infection risk decreases by 6.4%, with the maximum difference reaching 8%. Compared to the same air velocity, the SFRC system exhibits a more stable infection probability, which decreases to below 5% in a shorter time. In the optimal condition (Case 3), the infection probability drops to below 2% after t = 45 s. From the perspectives of pollutant removal efficiency, infection risk, and comfort, this condition is the optimal one, providing a more comfortable and safer carriage environment.

4. Discussion

4.1. Analysis of Particle Behavior in the MV and SFRC Systems

While existing studies have examined the dispersion of aerosol droplets exhaled by occupants in various indoor and outdoor environments, research on the potential infection risk in subway carriages is still limited. The results indicated that ventilation methods significantly affect droplet dispersion within the carriage. Compared to other indoor environments, the MV method may increase the exposure risk to aerosol droplets within the carriage. Therefore, more suitable ventilation strategies are needed to control the spread of respiratory infectious diseases. The SFRC method is recommended for use in subway carriages.
In this study, CFD methods were used to simulate the distribution of droplet nuclei in subway carriages under two ventilation methods (MV and SFRC). By comparing three different air supply velocities, the good ventilation performance of SFRC was validated. Figure 6 and Figure 7 show that the diffusion range of the MV method varies at different air supply velocities due to the horizontal temperature differences in the breathing zone affecting the evaporation rate. Figure 6 and Figure 7 illustrate that the dispersion and accumulation of particles differ for MV and SFRC at the same air supply velocity. For the SFRC system, due to the combined effects of exhaled airflow and thermal plumes, particles tend to disperse more towards the ceiling and then spread outwards, effectively removing pollutants.
As shown in Figure 9, both the MV method and the SFRC method at low wind speeds exhibit a larger maximum reach for cough particles. When the air supply velocity of the SFRC method is increased, the maximum reach of the particles significantly decreases. This trend can be attributed to the similar patterns of particle emission during a single cough and the superiority of the ventilation method in effectively suppressing pollutant spread. For the conventional MV system, particles were observed to reach greater flow distances. This may be due to the smaller influence of inlet velocity in the duct and the distance of the return air outlet from the infected individual, leading to less suppression of particles, resulting in farther spread that is difficult to remove. Additionally, at low wind speeds, both ventilation methods exhibit a larger maximum reach for particles, as lower wind speeds allow buoyancy to dominate, causing lighter particles to rise almost vertically, resulting in wider dispersion of smaller particles.
As shown in Figure 10, the conditions of the two ventilation systems differ slightly, but this trend is consistent across the six examples. However, minor variations in deposition lengths were observed under both ventilation methods. It was observed that the droplet deposition distance in the SFRC system is slightly closer than that in the MV system. This can be attributed to the air conditioning flow field having a greater effect on heavier particles, as it is closer to the position of the infected individual. Consequently, heavier particles in this range fall to the ground over shorter flow distances. This conclusion is also supported by the PRP diagrams for intermediate diameters, which show a significant distance in the flow direction under high air supply velocities in the SFRC system, where PRP reaches zero. Figure 11 shows the quantities of suspended, deposited, and escaping droplet nuclei at different time intervals. The distribution of droplet nuclei varies over time based on the air supply velocity. The number of suspended, deposited, and escaping droplet nuclei varies significantly at 5 s, 20 s, 60 s, and 120 s for different ventilation methods, due to differences in the position and area of the return air outlets. The SFRC return air outlet is more centralized and larger, while droplet nuclei mainly diffuse upwards, resulting in higher removal efficiency.
Figure 12 shows the proportion of droplet nuclei in the vertical direction. It can be observed that under the SFRC air supply system, most droplet nuclei are concentrated near the ceiling, above the heads of occupants, with higher air supply velocities resulting in greater accumulation of droplet nuclei at the ceiling. In contrast, for the MV air supply system, the distribution of droplet nuclei is uniform throughout the vertical region. This also indicates that uniformly distributed droplet nuclei are more difficult to remove when the return air outlets are located at the head and tail of the carriage ceiling, while the SFRC system, with its return air outlets near the ceiling where droplet nuclei are concentrated, facilitates pollutant removal. Figure 13a shows the concentration of tracer gas, indicating the proportion of absolute pollutant concentration. The vertical axis represents normalized average concentration. It is clearly observed in the figure that the pollutant concentration in the SFRC air supply system is significantly lower than that in the MV system, and each case shows an increasing trend in pollutant concentration. Throughout the process, higher air supply velocities correlate with lower pollutant concentrations and fewer suspended droplet nuclei, resulting in greater pollutant removal efficiency. Increasing the ventilation rate aids in removing droplet nuclei from subway carriages through the exhaust, reducing both deposition and suspension of droplet nuclei. The decline in instantaneous concentration is relatively slow, which also indicates that a large proportion of pollutants at vertical heights does not necessarily imply high absolute concentration.

4.2. Limitations of This Study

This study reveals the transmission mechanisms and distribution of droplets under different ventilation systems in a subway carriage, highlighting the dispersion range of particles and safety thresholds, The objective is to guide the design of ventilation systems and the disinfection of subway carriages. It does not account for whether non-infected passengers entering the subway carriage are equipped with adequate personal protective equipment, nor does it assess the exposure risks associated with this scenario. Due to limited conditions, it was not possible to conduct experiments such as dose–response modeling for infection risk assessment, nor could the actual number of pathogens inhaled by patients entering the respiratory system be quantified. Future work should consider the impact of other activities of patients, such as speaking and coughing while walking, different postures, and actions like talking or sneezing on droplet distribution. More detailed ranges of air supply parameters and return air outlet positions should be considered. Systematically addressing the effects of these behaviors in future research is crucial.

5. Conclusions

This study employed the Euler–Lagrange method to analyze droplet dispersion in a subway carriage. It simulated droplet creation, propagation, and removal from coughing, and the effect of air supply on droplet dispersion was analyzed to determine the optimal ventilation system. The subsequent findings may be inferred:
The coupling of turbulent airflow generated by coughing with thermal plumes is crucial for the initial spread of droplets. Smaller droplets (initial diameter less than 30 μm) are airborne for a longer period, while larger droplets (initial diameter greater than 80 μm) are mainly affected by gravity and settle quickly after release.
Under different ventilation systems, droplet nuclei in the SFRC system are mainly distributed near the ceiling, while in the MV system, the distribution is more uniform. The number of droplet nuclei in the ceiling return air of the SFRC system is lower than that in the MV system, but the opposite is true for deposition and escape. Different ventilation systems have a significant impact on virus transmission in enclosed spaces. PRP curves show that increasing air supply speed can significantly reduce the concentration of aerosols and larger particles. In the SFRC system, an air speed of V = 0.8 m/s provides optimal performance, with lower droplet arrival probability, suspension rates, and pollutant concentrations within the safe social distance of 2–3 m.
Air supply speed is critical to the distribution of droplet nuclei in subway cars. As the air speed increases, the observed data shows a decrease in suspended droplet nuclei, along with an increase in escaped droplet nuclei, and the range of pollutants decreases with increasing air speed, showing a lateral diffusion trend. (In the MV system, air speed increases from 0.8 m/s to 1.6 m/s due to the return air area being one-quarter the size of the SFRC system’s air inlet). It is advisable to reduce the air supply temperature slightly, while maintaining thermal comfort.
The SFRC air supply system provides passengers with a gentler airflow experience. Compared to the MV system, the droplet nuclei suspension rate drops by 18%, allowing for quicker and more efficient removal of droplets, reducing the likelihood of other passengers inhaling viral particles and thus lowering infection risks. The average pollutant spread is reduced by 60%. At higher air speeds, 99.9% of particles do not travel beyond 2 m, while in the MV system, at lower air speeds, over 53% of particles travel more than 3 m. The results show that midsized particles can travel farther and remain suspended for longer.
Energy consumption, as an important indicator for evaluating the performance of transportation systems, was analyzed for three air supply velocities under two ventilation methods. The conclusion is that the SFRC air supply method results in lower energy consumption during the air conditioning process, making it more energy efficient. Additionally, the ADPI values for the SFRC system are higher than those for the MV system, making it a more comfortable air supply method. We conducted a quantitative analysis of infection risk, and the infection probability with the SFRC air supply method decreased by an average of 6.4%, with a maximum reduction of 8%. Considering energy consumption, comfort, and safety, the SFRC air supply method with high wind speed (V = 0.4 m/s) is an excellent choice for subway carriages.

Author Contributions

Conceptualization, G.F.; methodology, X.W. (Xinkai Wu) and G.F.; software, X.J., X.W. (Xingyu Wan) and G.F.; validation, R.L. and H.R.; data curation, R.L. and H.R.; writing—original draft preparation, X.W. (Xinkai Wu); writing—review and editing, X.W. (Xinkai Wu); visualization, X.W. (Xinkai Wu). All authors have read and agreed to the published version of the manuscript.

Funding

This research received no external funding.

Institutional Review Board Statement

Not applicable.

Informed Consent Statement

Not applicable.

Data Availability Statement

All data used in this work can be found in this document. The data that support the findings of this study are available from the corresponding author upon reasonable request.

Conflicts of Interest

The authors declare no conflicts of interest.

References

  1. Mao, Y.H.; Ma, J.L.; Wang, S.X.; Liang, J.D.; Liang, J.Z. A stratum ventilation system for pollutants and an improved prediction model for infection in subway cars. Atmos. Pollut. Res. 2022, 13, 101354. [Google Scholar] [CrossRef]
  2. Morawska, L.; Milton, D.K. It is Time to Address Airborne Transmission of COVID-19. Clin. Infect. Dis. 2020, 71, 2311–2313. [Google Scholar] [CrossRef]
  3. Peng, N.N.; Chow, K.W.; Liu, C.H. Computational study on the transmission of the SARS-CoV-2 virus through aerosol in an elevator cabin: Effect of the ventilation system. Phys. Fluids 2021, 33, 103325. [Google Scholar] [CrossRef] [PubMed]
  4. Liu, Y.; Ning, Z.; Chen, Y.; Guo, M.; Liu, Y.; Gali, N.K.; Sun, L.; Duan, Y.; Cai, J.; Westerdahl, D.; et al. Aerodynamic analysis of SARS-CoV-2 in two Wuhan hospitals. Nature 2020, 582, 557–560. [Google Scholar] [CrossRef] [PubMed]
  5. Morawska, L.; Cao, J. Airborne transmission of SARS-CoV-2: The world should face the reality. Environ. Int. 2020, 139, 105730. [Google Scholar] [CrossRef]
  6. Shin, H.W.; Kang, D.H. Estimation of airborne infection risk in a school classroom according to operation of a floor-standing type ventilation system. J. Build. Eng. 2023, 78, 107649. [Google Scholar] [CrossRef]
  7. Zhou, Y.; Ji, S. Experimental and numerical study on the transport of droplet aerosols generated by occupants in a fever clinic. Build. Environ. 2021, 187, 107402. [Google Scholar] [CrossRef]
  8. Wang, F.; Zhang, T.T.; You, R.; Chen, Q. Evaluation of infection probability of Covid-19 in different types of airliner cabins. Build. Environ. 2023, 234, 110159. [Google Scholar] [CrossRef]
  9. Gralton, J.; Tovey, E.; McLaws, M.-L.; Rawlinson, W.D. The role of particle size in aerosolised pathogen transmission: A review. J. Infect. 2011, 62, 1–13. [Google Scholar] [CrossRef]
  10. Zayas, G.; Chiang, M.C.; Wong, E.; MacDonald, F.; Lange, C.F.; Senthilselvan, A.; King, M. Cough aerosol in healthy participants: Fundamental knowledge to optimize droplet-spread infectious respiratory disease management. BMC Pulm. Med. 2012, 12, 11. [Google Scholar] [CrossRef]
  11. Chao, C.Y.H.; Wan, M.P.; Morawska, L.; Johnson, G.R.; Ristovski, Z.D.; Hargreaves, M.; Mengersen, K.; Corbett, S.; Li, Y.; Xie, X.; et al. Characterization of expiration air jets and droplet size distributions immediately at the mouth opening. J. Aerosol Sci. 2009, 40, 122–133. [Google Scholar] [CrossRef] [PubMed]
  12. Wei, J.; Li, Y. Airborne spread of infectious agents in the indoor environment. Am. J. Infect. Control 2016, 44, S102–S108. [Google Scholar] [CrossRef]
  13. Han, M.; Ooka, R.; Kikumoto, H.; Oh, W.; Bu, Y.; Hu, S. Measurements of exhaled airflow velocity through human coughs using particle image velocimetry. Build. Environ. 2021, 202, 108020. [Google Scholar] [CrossRef]
  14. Kwon, S.-B.; Park, J.; Jang, J.; Cho, Y.; Park, D.-S.; Kim, C.; Bae, G.-N.; Jang, A. Study on the initial velocity distribution of exhaled air from coughing and speaking. Chemosphere 2012, 87, 1260–1264. [Google Scholar] [CrossRef] [PubMed]
  15. Zhu, S.; Kato, S.; Yang, J.-H. Study on transport characteristics of saliva droplets produced by coughing in a calm indoor environment. Build. Environ. 2006, 41, 1691–1702. [Google Scholar] [CrossRef]
  16. Fabian, P.; McDevitt, J.J.; DeHaan, W.H.; Fung, R.O.P.; Cowling, B.J.; Chan, K.H.; Leung, G.; Milton, D.K. Influenza virus in human exhaled breath: An observational study. PLoS ONE 2008, 3, e2691. [Google Scholar] [CrossRef] [PubMed]
  17. Tang, J.W.; Nicolle, A.D.; Klettner, C.A.; Pantelic, J.; Wang, L.; Suhaimi, A.B.; Tan, A.Y.L.; Ong, G.W.X.; Su, R.; Sekhar, C.; et al. Airflow dynamics of human jets: Sneezing and breathing—Potential sources of infectious aerosols. PLoS ONE 2013, 8, e59970. [Google Scholar] [CrossRef]
  18. Liu, Z.J.; Di, Y.; Hu, L.N.; He, J.Z.; Cao, G.Q. Bacteria-carrying particles diffusion in the operating room due to the interaction between human thermal plume and ventilation systems: An experimental-numerical simulation study. Energy Build. 2022, 270, 112277. [Google Scholar] [CrossRef]
  19. Luo, Q.Q.; Ou, C.Y.; Hang, J.; Luo, Z.W.; Yang, H.Y.; Yang, X.; Zhang, X.L.; Li, Y.G.; Fan, X.D. Role of pathogen-laden expiratory droplet dispersion and natural ventilation explaining a COVID-19 outbreak in a coach bus. Build. Environ. 2022, 220, 109160. [Google Scholar] [CrossRef]
  20. Liu, Z.; Chu, J.; Li, H.; Huang, Z.; Liu, H.; Jiang, C.; Sun, T.; Xiao, X.; He, J. Evaluation of different computational methods for numerical simulation of aerosol distribution in the operating room. J. Build. Eng. 2024, 96, 110575. [Google Scholar] [CrossRef]
  21. Luo, X.L.; Huang, X.Y.; Feng, Z.B.; Li, J.; Gu, Z.L. Influence of air inlet/outlet arrangement of displacement ventilation on local environment control forum earthed relics within site museum. Energy Build. 2021, 246, 111116. [Google Scholar] [CrossRef]
  22. Wu, F.; Yu, C.; Xu, R.; Li, H. Numerical Simulation of Droplet Dispersion and Passenger Infection Risk Assessment in a Subway Carriage. Appl. Sci. 2024, 14, 590. [Google Scholar] [CrossRef]
  23. Zee, M.; Davis, A.C.; Clark, A.D. Computational fluid dynamics modeling of cough transport in an aircraft cabin. Sci. Rep. 2021, 11, 23329. [Google Scholar] [CrossRef] [PubMed]
  24. Zhang, T.; Fan, M.; Liu, S. Impact of Seat Inclination and Misalignment on Airborne Pollutant Transport in a Single-Aisle Aircraft Cabin. Appl. Sci. 2022, 12, 4538. [Google Scholar] [CrossRef]
  25. Dao, H.T.; Kim, K.S. Behavior of cough droplets emitted from Covid-19 patient in hospital isolation room with different ventilation configurations. Build. Environ. 2022, 209, 108649. [Google Scholar] [CrossRef]
  26. Castellini, J.E.; Faulkner, C.A.; Zuo, W.; Lorenzetti, D.M.; Sohn, M.D. Assessing the use of portable air cleaners for reducing exposure to airborne diseases in a conference room with thermal stratification. Build. Environ. 2022, 207, 108441. [Google Scholar] [CrossRef]
  27. Su, W.; Yang, B.; Melikov, A.; Liang, C.; Lu, Y.; Wang, F.; Li, A.; Lin, Z.; Li, X.; Cao, G.; et al. Infection probability under different air distribution patterns. Build. Environ. 2022, 207, 108555. [Google Scholar] [CrossRef]
  28. Li, K.; Kang, L.; Guo, K.; Song, L.; Zhang, X.; Xu, W. Risk assessment of respiratory droplet infections caused by coughing in various indoor dynamic environments. J. Build. Eng. 2023, 80, 108116. [Google Scholar] [CrossRef]
  29. Ye, J.; Ai, Z.; Zhang, C. A new possible route of airborne transmission caused by the use of a physical partition. J. Build. Eng. 2021, 44, 103420. [Google Scholar] [CrossRef]
  30. Wang, C.; Holmberg, S.; Sadrizadeh, S. Impact of door opening on the risk of surgical site infections in an operating room with mixing ventilation. Indoor Built Environ. 2021, 30, 166–179. [Google Scholar] [CrossRef]
  31. Romano, F.; Marocco, L.; Gusten, J.; Joppolo, C.M. Numerical and experimental analysis of airborne particles control in an operating theater. Build. Environ. 2015, 89, 369–379. [Google Scholar] [CrossRef]
  32. Chen, C.; Zhao, B. Some questions on dispersion of human exhaled droplets in ventilation room: Answers from numerical investigation. Indoor Air 2010, 20, 95–111. [Google Scholar] [CrossRef] [PubMed]
  33. GB 50157-2013; Code for Design Metro. Beijing Urban Construction Design and Research Institute: Beijing, China, 2013.
  34. de Dear, R.J.; Arens, E.; Hui, Z.; Oguro, M. Convective and radiative heat transfer coefficients for individual human body segments. Int. Biometeorol. 1997, 40, 141–156. [Google Scholar] [CrossRef]
  35. Licina, D.; Pantelic, J.; Melikov, A.; Sekhar, C.; Tham, K.W. Experimental investigation of the human convective boundary layer in a quiescent indoor environment. Build. Environ. 2014, 75, 79–91. [Google Scholar] [CrossRef]
  36. Yang, L.; Li, X.; Yan, Y.; Tu, J. Effects of cough-jet on airflow and contaminant transport in an airliner cabin section. Comput. Multiph. Flows 2017, 10, 72–82. [Google Scholar] [CrossRef]
  37. Duguid, J.P. The size and the duration of air-carriage of respiratory droplets and droplet-nuclei. Epidemiology Infect. 1946, 44, 471–479. [Google Scholar] [CrossRef]
  38. Chen, R.; Haofu, C.; Junqi, W. Ventilation impacts on infection risk mitigation, improvement of environmental quality and energy efficiency for subway carriages. Build. Environ. 2022, 222, 109358. [Google Scholar] [CrossRef]
  39. GB50736-2012; Design Code for Heating Ventilation and Air Conditioning of Civil Buildings. China Academy of Building Science: Beijing, China, 2012.
  40. GB50189-2015; Design Standard for Energy Efficiency of Public Buildings. China Academy of Building Science: Beijing, China, 2015.
  41. Wang, J.; Huang, J.; Feng, Z.; Cao, S.J.; Haghighat, F. Occupant-density detection based energy efficient ventilation system: Prevention of infection transmission. Energy Build. 2021, 240, 110883. [Google Scholar] [CrossRef]
  42. Ren, C.; Xi, C.; Wang, J.; Feng, Z.; Nasiri, F.; Cao, S.-J.; Haghighat, F. Mitigating COVID-19 infection disease transmission in indoor environment using physical barriers. Sustain. Cities Soc. 2021, 74, 103175. [Google Scholar] [CrossRef]
  43. Ridouane, E.H. Evaluation of Air Mixing and Thermal Comfort from High Sidewall Supply Air Jets; Technical Report; NREL/TP-5500-48664; National Renewable Energy Lab. (NREL): Golden, CO, USA, 2011. [Google Scholar]
  44. Wang, H.; Wang, J.; Feng, Z.; Haghighat, F.; Cao, S.-J. Intelligent anti-infection ventilation strategy based on computer audition: Towards healthy built environment and low carbon emission. Sustain. Cities Soc. 2023, 99, 104888. [Google Scholar] [CrossRef]
Figure 1. General framework of this study.
Applsci 15 04919 g001
Figure 2. Model and grid of the subway carriage with SFRC method: (a) Geometry of the carriage; (b) External grid diagram; (c) Internal grid diagram.
Applsci 15 04919 g002
Figure 3. Model and grid of the subway carriage with MV method: (a) Geometry of the carriage; (b) External grid diagram; (c) Internal grid diagram.
Applsci 15 04919 g003
Figure 4. Results of mesh gird independence.
Applsci 15 04919 g004
Figure 5. Comparison of experimental and simulation results: Axial distribution of velocity and temperature.
Applsci 15 04919 g005
Figure 6. Spatiotemporal distribution of cough droplets in the carriage with an air supply velocity of 0.8 m/s under the MV system.
Applsci 15 04919 g006
Figure 7. Spatiotemporal distribution of cough droplets in the carriage with an air supply velocity of 1.6 m/s under the MV system.
Applsci 15 04919 g007
Figure 8. Spatiotemporal distribution of cough droplets in the carriage with an air supply velocity of 0.2 m/s under the SFRC system.
Applsci 15 04919 g008
Figure 9. Comparison of the maximum reach of cough particles and the range of pollutants in different ventilation systems, along with a comparison of the weighted average pollution range and maximum reach indicators.
Applsci 15 04919 g009
Figure 10. The probability of particle arrival in both ventilation systems. (a) SFRC: V = 0.2 m/s; (b) SFRC: V = 0.3 m/s; (c) SFRC: V = 0.4 m/s; (d) MV: V = 0.8 m/s; (e) MV: V = 1.2 m/s; (f) MV: V = 1.6 m/s. D1, D2, and D3 refer to small (<5 µm), intermediate (30–50 µm), and large (100 µm) particle sizes, respectively.
Applsci 15 04919 g010
Figure 11. Distribution of droplet nuclei: suspension, escape, deposition, and (a) number fraction of droplet nuclei at 5 s; (b) number fraction of droplet nuclei at 20 s; (c) number fraction of droplet nuclei at 60 s; (d) number fraction of droplet nuclei at 120 s.
Applsci 15 04919 g011
Figure 12. The distribution of droplet nuclei in the vertical direction.
Applsci 15 04919 g012
Figure 13. (a) Average concentration of tracer gas N2 in the carriage; (b) real-time inhalation of droplets at the mouth level.
Applsci 15 04919 g013
Figure 14. The ADPI values of different air supply methods (MV, SFRC) in the subway carriage under different air supply parameters.
Applsci 15 04919 g014
Figure 15. The infection probabilities of different air supply methods (MV, SFRC) in the subway carriage under different air supply parameters.
Applsci 15 04919 g015
Table 1. Information on the inlet and outlet (size and quantity) grid numbers for different ventilation methods.
Ventilation
Modes
Inlet
Size (m)
Inlet
Number
Outlet
Size (m)
Outlet
Number
Mesh Grids
MV0.5 × 0.1160.5 × 0.145,471,754
SFRC1.0 × 0.2161.0 × 0.225,504,214
Table 2. Boundary conditions for discrete phase.
NameTypeParameters
Air supply
Diffuser
Exhaust
louver
Velocity
inlet
Outflow
Turbulence
intensity = 5%
DPM: reflect
Mass fraction of H2O: 0.7%
Mass fraction of air: 99.3%
Mass fraction of N2: 100%
DPM: escape
Mouth
(patient)
Mouth
(passenger)
Occupant
Lateral wall
Ceiling
Velocity inlet
Mass flow outlet
Wall
Wall
UDF
310 K
DPM: reflect
Mass flux = 0.001715 Kg/s
DPM: escape
Stationary wall
30 W/m2
DPM: trap
Density: 2200 Kg/m3
Specific heat:
830 J/(kg·K)
0.025 m
Density: 2200 Kg/m3
Specific heat:
830 J/(kg·K)
Thermal conductivity:
0.11 W/(m·K)
DPM: trap
6 W/(m2·K)
0.025 m
Table 3. Air supply parameters and ventilation method.
Case No.Supply Air Temperature (°C)Supply Air Velocity (m/s)Ventilation Method
Case 1250.2SFRC
Case 2250.3SFRC
Case 3250.4SFRC
Case 4250.8MV
Case 5251.2MV
Case 6251.6MV
Table 4. Setting of parameters related to energy consumption calculation.
ParameterValueUnitExplanation
COP4.2 According to the relevant standard China Academy of Building Science (2015) [40]
Cp1.013kJ/(kg·°C)Corresponding to dry air at 25 °C
ρ1.169kg/m3Corresponding to dry air at 25 °C
Ti25°CAccording to the relevant standard China Academy of Building Science (2012) [39]
To34.8°CAccording to the relevant standard China Academy of Building Science (2012)
k0.8kJ·s2/m9According to the relevant literature Wang et al. (2021) [41]
Table 5. HVAC system energy consumption for each operating condition.
Case No.Energy Consumption of the Ventilation System (Kw)Energy Required for Air Transport (kW)Total Energy Consumption (kW)Comparative Energy-Saving Rate (%)
Case 10.212.953.1650.31
Case 20.713.434.1434.91
Case 31.684.075.759.59
Case 40.212.953.1650.31
Case 50.713.874.5827.99
Case 61.684.686.36/
Disclaimer/Publisher’s Note: The statements, opinions and data contained in all publications are solely those of the individual author(s) and contributor(s) and not of MDPI and/or the editor(s). MDPI and/or the editor(s) disclaim responsibility for any injury to people or property resulting from any ideas, methods, instructions or products referred to in the content.

