2. Materials and Methods
2.1. Samplings and Gravimetric Analysis
The sampling involved eight full-scale biomass treatment plants placed in Northern Italy (food waste, wastewater sludge, lignocellulosic, and agro-livestock residues) during the warm season in the same year. In particular, we sampled three composting plants processing the organic fraction of municipal solid waste (OFMSW) and other plant-based byproducts, three plants treating agro-livestock matrices, including both swine and bovine slurry and agricultural processing residues, one facility dedicated to the treatment of wastewater sludge, and one facility processing lignocellulosic waste.
PM
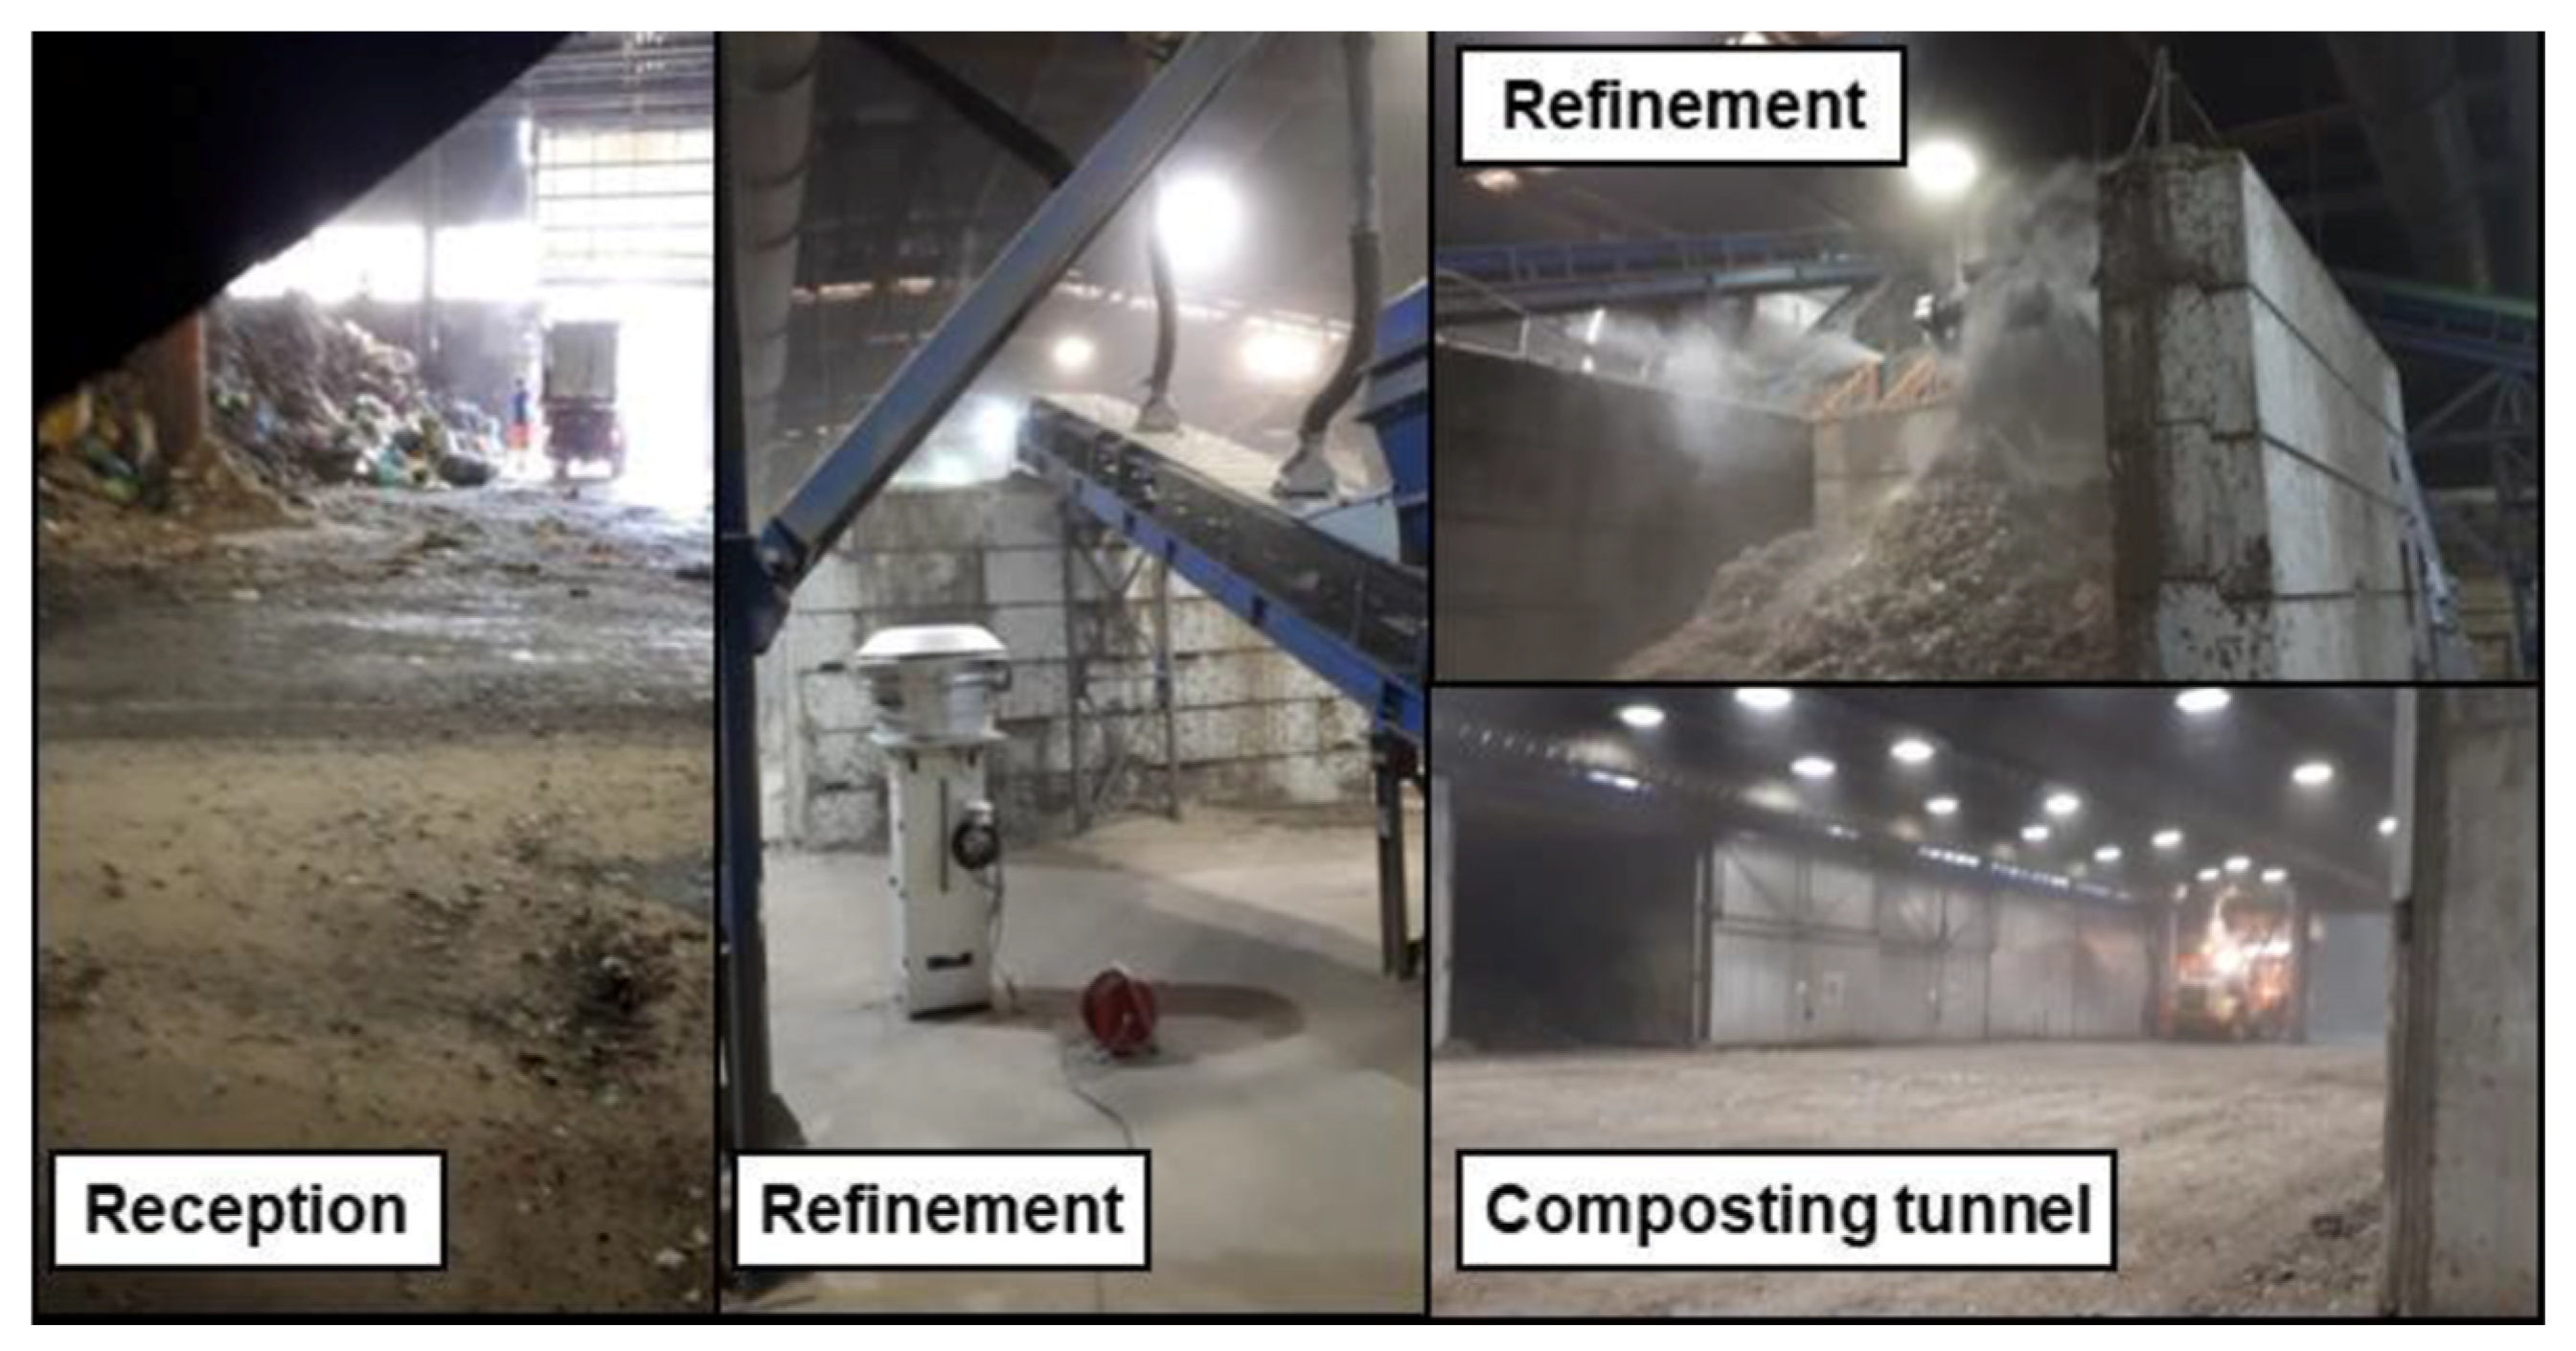
10 sub-fractionated sampling was conducted in different areas of the plants, including areas where waste materials were received, treatment areas, and finally the areas where refinement of the effluents took place (some examples are shown in
Figure 1). A high-volume cascade impactor sampler (High Volume Sampler, HVS; Airflow PM
10, Analitica Strumenti, Pesaro, Italy) was used, operating with a suction flow rate of 1.24 m
3/min, in compliance with UNI EN 12341 standards [
16]. The sampler employs a multistage impact mechanism, allowing airborne particles to pass through progressively narrower slits, thereby fractionating them based on their aerodynamic diameter onto sequentially arranged filters. The collected PM
10 was divided into six sub-fractions of equivalent aerodynamic diameter: 10–7.2 μm, 7.2–3.0 μm, 3.0–1.5 μm, 1.5–0.95 μm, 0.95–0.49 μm, and <0.49 μm. Slotted glass fiber filters (A/E type, 8 × 10, Gelman Sciences, Bloomfield Twp, MI, USA; labeled as A) were used to collect PM
0.49-10, while A4-sized filters (203 × 254 mm, Pall Corporation, New York, NY, USA; labeled as B) were used for PM
0.49 [
17].
Each sampling session lasted at least 4 h and was generally conducted twice a day (morning and afternoon), except in specific cases where only one sampling per day was performed due to logistical and organizational constraints. Each filter underwent a pre- and post-sampling conditioning process for 48 h in a desiccator with silica gel to minimize any interference humidity might introduce into weight measurements. All membranes underwent a gravimetric analysis of particulate matter by pre- and post-sampling weighing with a five-decimal analytical balance (±0.00001 g), including a blank filter as a control to assess potential weight changes not attributable to sampling. The PM concentration on each filter was calculated considering the particulate mass and the volume of air passing through the filter. The PM concentration was expressed as μg per m3 of sampled air.
The sampled filters were used to perform water-based and organic-based extractions, respectively, assess endotoxin levels and expose human embryonic lung fibroblasts (HELF) in order to evaluate the in vitro modulation of gene expression involved in DNA repair (XRCC1, ERCC1, XPA, XPF) [
18] and IL-8 production [
19].
2.2. Extraction and Quantification of Endotoxins
To extract endotoxins, portions of the original filters were cut (half of the A filters and 1/4 or 1/8 of the B filters), further sectioned into small strips, and placed in a sterile 50 mL tube with 15 mL of RPMI-1640 supplemented with 0.025% Tween-20 (Sigma-Aldrich, St. Louis, MI, USA). The tubes were then subjected to ultrasonic bath treatment for 10 min and vortexed for 30 s. These steps were repeated three times. Subsequently, the samples were centrifuged at 5000 rpm for 10 min to remove glass fibers. The supernatant was then collected and then used for endotoxin determination [
20,
21].
For endotoxin quantification, the chromogenic endpoint LAL (Limulus Amebocyte Lysate) assay (QCL-1000™ 50-648 U, Lonza, Walkersville, MD, USA) was used, along with 96-well transparent polystyrene microplates (Costar® 3596, Corning Incorporated, Corning, NY, USA). This method is based on the activation of an enzymatic cascade in Limulus triggered by endotoxins, leading to the activation of a coagulation enzyme. When mixed with a chromogenic substrate and incubated, the activated enzyme cleaves the substrate, releasing p-nitroaniline, which produces a yellow coloration.
The intensity of the yellow color was measured by spectrophotometric reading at 407 nm and 37 °C (TECAN Infinite® M200 Pro, Tecan, Seestrasse, Switzerland, I-Control™ software 1.10) and was directly proportional to the amount of endotoxin in the sample. Absolute quantitative evaluation was performed, following the supplier’s instructions, using a standard curve (five points: 1, 0.5, 0.25, 0.1, and 0.05 EU/mL) obtained from a stock solution of lyophilized endotoxins reconstituted in 1 mL of LAL Reagent Water.
The endotoxin concentration was expressed as EU (Endotoxin Unit) per 1 m3 of sampled air for each of the six PM sub-fractions. For A filters, corresponding to five sub-fractions, results were aggregated by summing the determinations from each sub-fraction.
2.3. Organic Extraction of PM100.49 and PM0.49
An organic extraction was then performed on pooled A filters and on B, (half of the A filters and 1/4 or 1/8 of the B filters), obtaining 64 samples (of which 24 were from OFMSW, 24 from agro-zootechnic, 8 from WWTP, and 8 from lignocellulosic implants). Organic extracts were obtained through 80 Soxhlet cycles with acetone, followed by solvent evaporation using a rotary evaporator (Rotavapor R-300, BUCHI, Cornaredo, Italy). Finally, the sample was resuspended in a volume of dimethyl sulfoxide (DMSO) to achieve a final concentration of 0.2 m
3/μL [
18,
22].
2.4. Exposure and Cytotoxicity Assay
Human embryonic lung fibroblasts (HELF) were obtained from the pathology section of the Regina Margherita Hospital, Turin with the collaboration of Prof. G. Gribaudo and Dr. A. Luganini, University of Turin [
18]. Such cells were maintained in culture using Eagle’s Minimum Essential Medium (MEM, 51411C Sigma-Aldrich) supplemented with 10% fetal bovine serum (FBS, F0804 Sigma-Aldrich), 1 μg/mL ampicillin/streptomycin (P4083-100 ML), and 2 mM sodium pyruvate (S8636 Sigma-Aldrich). The cells were incubated at 37 °C in a humidified atmosphere with 4–5% CO
2.
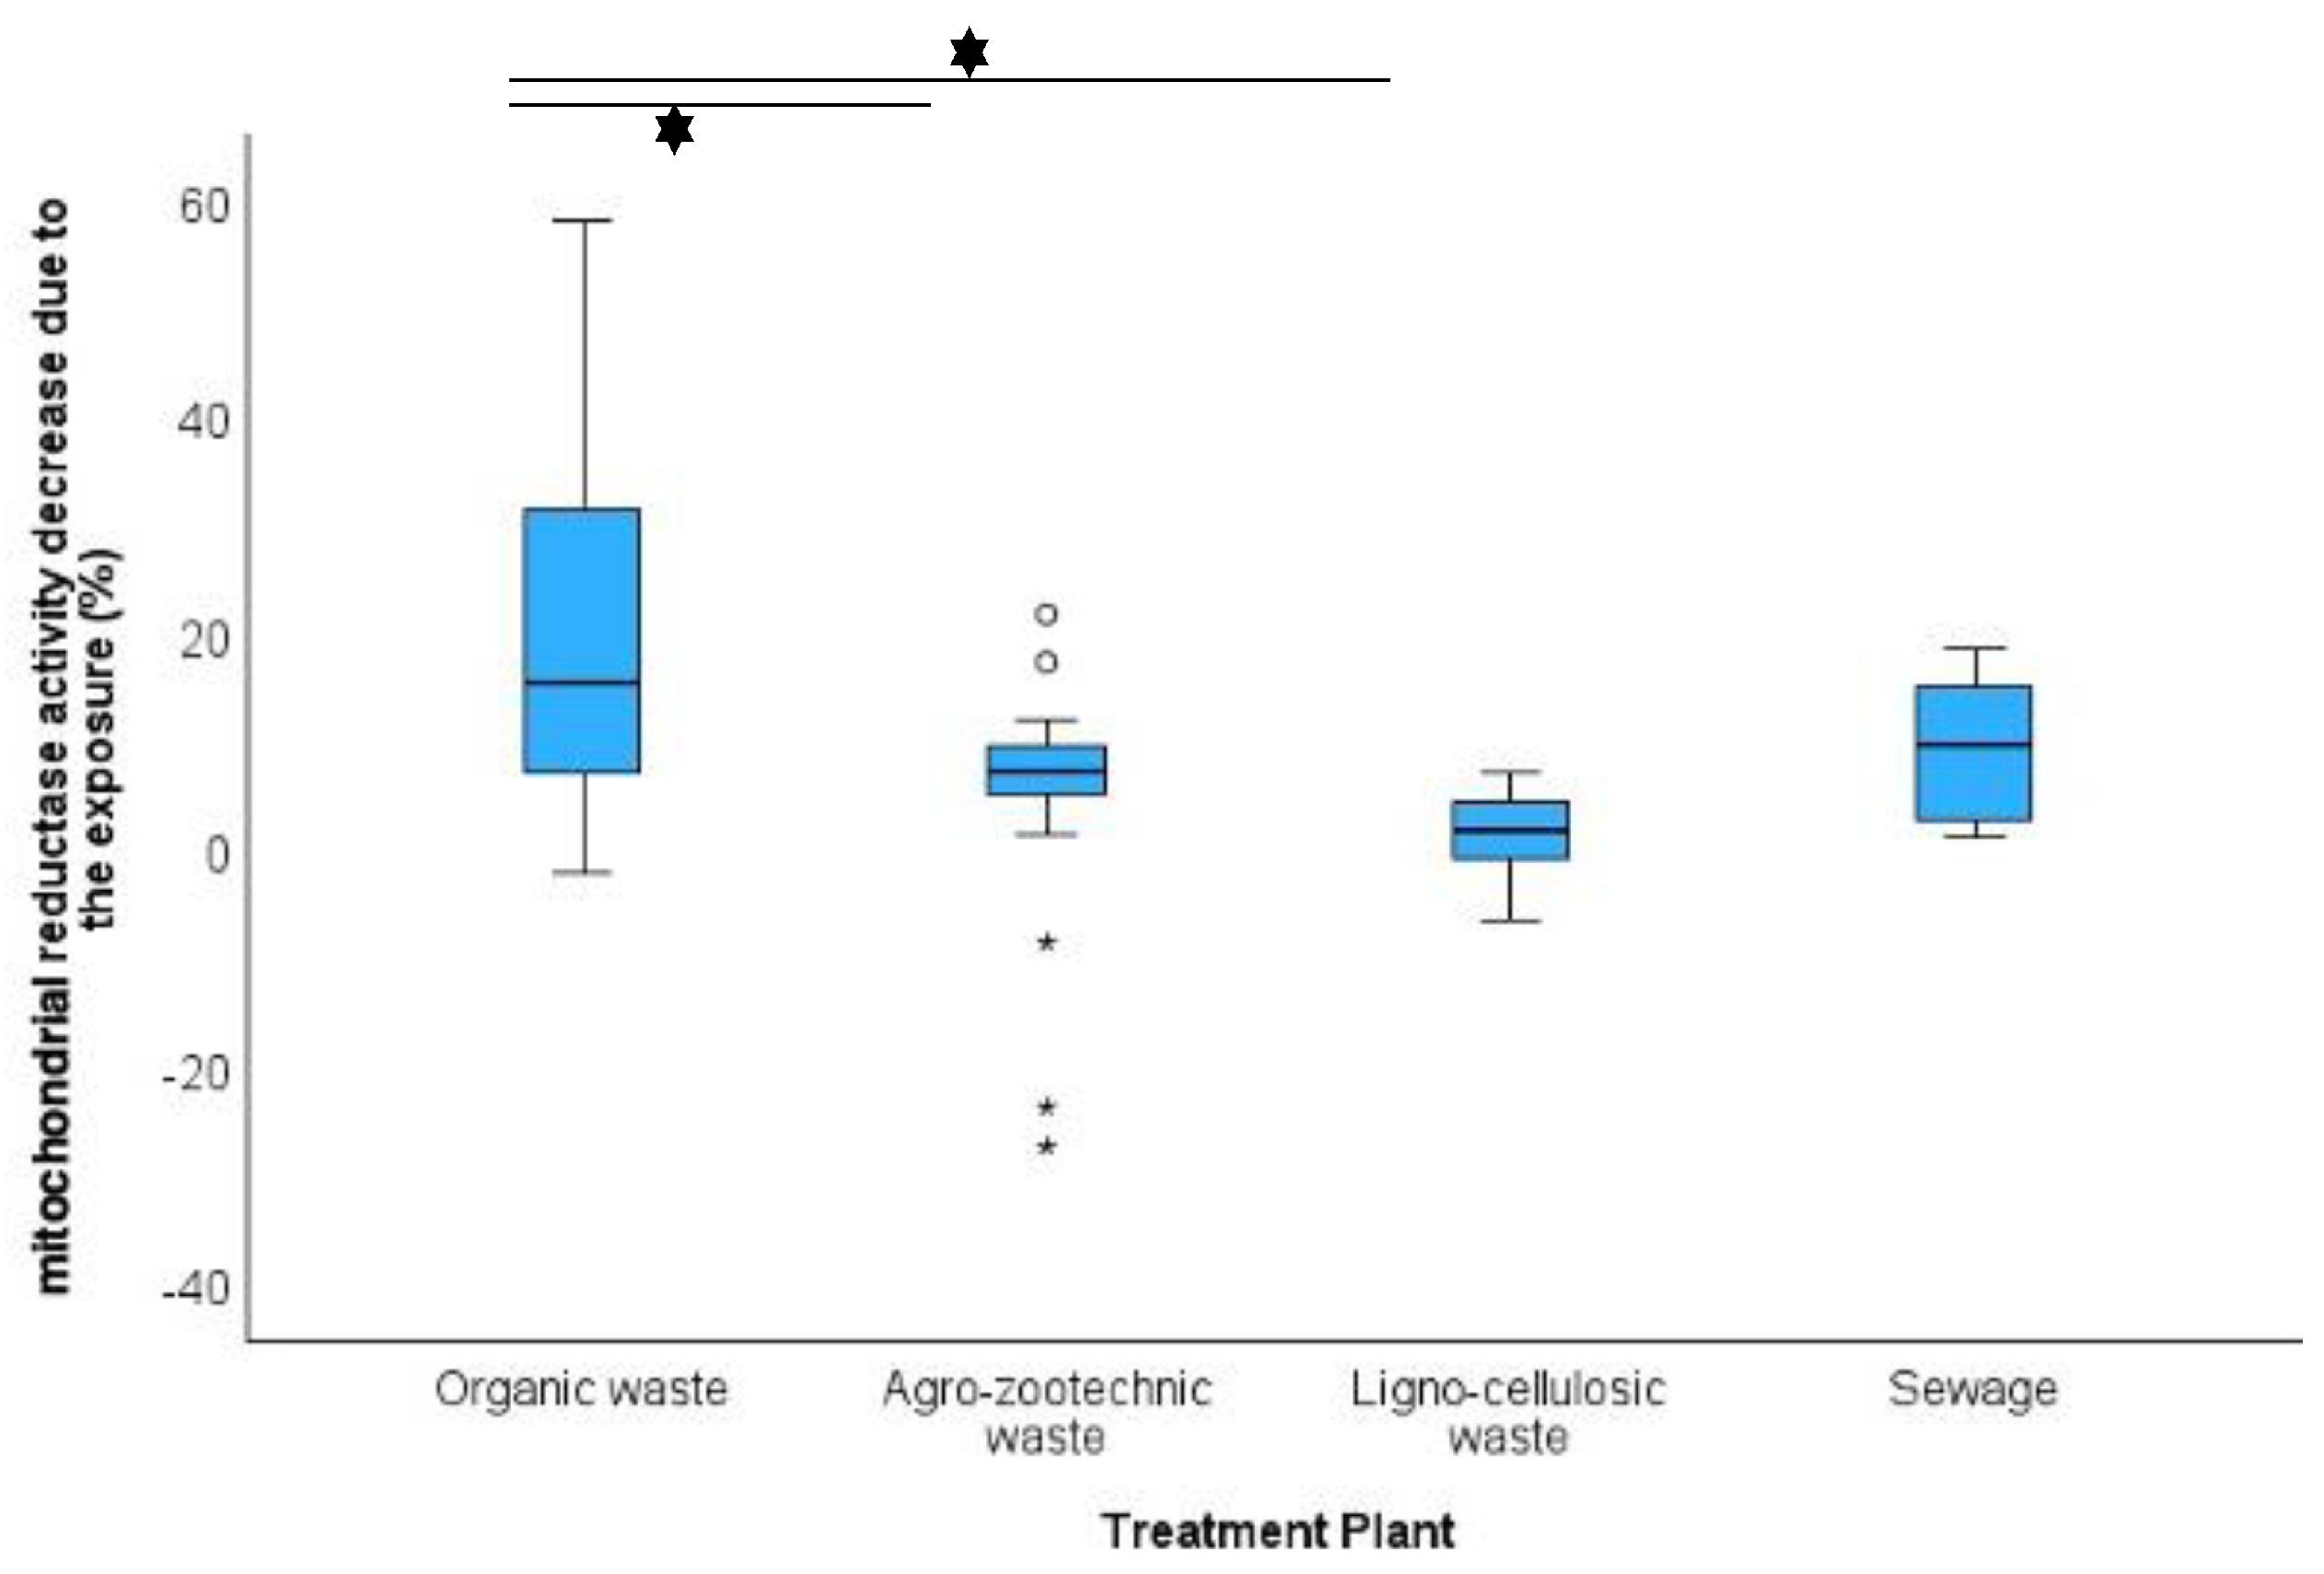
Cytotoxicity was assessed using the XTT assay with the Cell Proliferation Kit II (XTT, Sigma-Aldrich). This colorimetric assay relies on the ability of mitochondrial succinate dehydrogenase in viable cells to reduce tetrazolium salt (XTT) into formazan, a soluble, orange-colored compound. The intensity of the coloration, measured by spectrophotometry, is directly proportional to the number of metabolically active cells.
Following the kit instructions, the cells were seeded in 96-well tissue culture plates (TPP®, Europe/Switzerland) at a density of 50,000 cells per well in a volume of 200 μL of culture medium. After seeding, the cells were incubated for approximately 24 h to allow for proper growth and attachment to the plate. Starting from a medium containing 3% organic extract, the following media with 2%, 1%, 0.5%, and 0.25% PM were prepared through appropriate dilutions. The growth medium was replaced with 100 μL of medium containing the extract, performing three technical replicates for each concentration. A blank (cells exposed to medium only) and negative controls (cells exposed to 3%, 2%, 1%, 0.5%, 0.25% DMSO) were also included. After 24 h of incubation, the XTT assay was carried out following the protocol provided by the kit. To the medium containing the extract, 50 μL of XTT Labeling Mixture was added, which had been previously prepared with 5 mL of Labeling Reagent and 0.1 mL of Electron Coupling Reagent (final XTT concentration of 0.3 mg/mL). After 4 h of incubation, the plate was read using a spectrophotometer (TECAN Infinite® M200 Pro, Switzerland, I-Control™ software) at a wavelength of 492 nm, with a reference wavelength of 690 nm.
The concentration corresponding to 1% PM showed an acceptable average cytotoxicity (<20%), allowing for subsequent gene expression analysis. The results of the test were expressed as mitochondrial dehydrogenase activity, corresponding to the absorbance value obtained by substituting “1” for x in the regression equation, which was calculated by correlating the exposure dose with the observed absorbances at the five concentrations used. Furthermore, the percentage of inhibition of mitochondrial dehydrogenase activity was calculated for each sample by subtracting the y value of the regression line corresponding to cells exposed to the blank reading.
2.5. Extraction of Nucleic Acids
Cells were seeded at a density of 5 × 10⁵ cells/mL in 6-well plates (Corning® Costar® TC-Treated Multiple Well Plates) and incubated for 48 h. For each extraction, four plates were used, for a total of 10 PM samples and their respective controls (cells exposed to medium only or exposed to 1% DMSO). For each sample of the organic extract, a growth medium containing 1% PM was prepared by adding 70 μL of each extract to 7 mL of medium. After 48 h of incubation, the growth medium was replaced with 3 mL of medium containing the extract, and the cells were exposed to the extract for 24 h in the incubator.
The quantity of nucleic acids extracted was assessed using a spectrophotometer (TECAN Infinite® M200 Pro, Switzerland, I-Control™ software), with the appropriate NanoQuant plate (Tecan Trading AG, Switzerland), reading the absorbance at 260 nm. The results were expressed as ng/μL, and the minimum extract concentration considered quantifiable and suitable for subsequent expression analyses was 1 ng/μL.
RNA mean concentrations were 118.47 ng/μL and 72.78 ng/μL of the PM0.49 and PM0.49-10, respectively. RNA samples were stored at −80 °C pending further reverse transcription and gene expression analysis.
2.6. Gene Expression
All RNA extracts were reverse transcribed using the iScript™ Reverse Transcription Supermix for RT-qPCR (Bio-Rad, Hercules, CA, USA), following the protocol for single cDNA synthesis reactions for each sample. The reaction mixture contained 4 μL of iScript RT Supermix and an appropriate volume of MilliQ water (autoclaved and prepared for expression analysis) to reach a final reaction volume of 20 μL.
The reactions were incubated in a T100™ Thermal Cycler (Bio-Rad) following the thermal protocol provided by the kit and including priming (5 min at 25 °C), reverse transcription (20 min at 46 °C), and enzyme inactivation (1 min at 95 °C).
The gene expression levels of XRCC1, XPA, ERCC1, XPF, and IL8 were evaluated using GAPD and HPRT1 as housekeeping genes. Quantitative Real-Time PCR was performed using the SsoAdvanced™ Universal SYBR® Green Supermix (Bio-Rad) on the CFX96™ Real-Time System (Bio-Rad).
For each reaction, 2 μL of cDNA sample was combined with a reaction mix containing 10 μL of SsoAdvanced SYBR Green Supermix, 0.5 μL of forward and reverse primers (
Table 1) (at a concentration of 4 μM), and 7 μL of MilliQ water, resulting in a final reaction volume of 20 μL in each well of the plate.
The protocol used included an initial polymerase activation step for 30 s at 98 °C, followed by 40 cycles of: denaturation at 95 °C for 10 s, annealing/extension at 60 °C for 30 s, plate reading, and finally, generating a melting curve between 65 °C and 95 °C (increasing by 0.5 °C every 2–5 s).
The primers used for each target gene expression are shown in
Table 1. To calculate gene expression modulation, the ΔΔCt method was used. The results were expressed as the increase or decrease in gene expression following exposure to PM. Finally, to normalize the data distribution and perform statistical tests, the Log10 (2
−(ΔΔCt)) was calculated [
18,
23].
Table 1.
Description of each gene target’s functions and the primers included in the gene expression analysis.
Table 1.
Description of each gene target’s functions and the primers included in the gene expression analysis.
| Gene Function | Primers | 5’-3′ Sequence | Ref. |
|---|
| Hypoxanthine phosphoribosyltransferase 1. It allows cells to recycle purines | HPRTI_f
HPRTI_r | TGACACTGGCAAAACAATGCA GGTCCTTTTCACCAGCAAGCT | [24] |
Glyceraldehyde-3-phosphate
dehydrogenase | GAPD_f
GAPD_r | TGCACCACCAACTGCTTAGC
GGCATGGACTGTGGTCATGAG | [24] |
| DNA excision repair protein ERCC-1 is involved in nucleotide excision repair (NER). It creates a cut at the 3′ end of the damage site and forms an enzymatic complex with XPF | ERCC1_f ERCC1_r | GGGAATTTGGCGACGTAATTC
GCGGAGGCTGAGGAACAG | [25] |
| Together with ERCC1, it creates a cut on both sides of the damage site leading to the removal of a piece of DNA | XPF_f
XPF_r | TGACCCTAGCAAGCCTTTCTCTCT
GGGGCACCAGAGAATCCGTAGTC | [25] |
| It recognizes damage and functions as a scaffold for other proteins, NER involved | XPA_f XPA_r | GAGTTTCAACCCAGGTCTTCTCATTTT AATGGTAACAGTGAGTAGTAGTAGTGC | [25] |
| Involved in the repair of single-strand breaks in DNA due, for example, to exposure to ionizing radiation and alkylating agents. Involved in BER | XRCC1_f
XRCC1_r | GCAAACCCCGAGGAGAAGGCA
ACTGCTGGAACCTGGCCCTGC | [26,27,28] |
| Chemotactic factor for neutrophils, often associated with inflammation and oxidative stress in the lungs | IL-8_f
IL-8_r | TGCCAAGGAGTGCTAAAG CTCCACAACCCTCTGCAC | [19] |
2.7. Statistical Analysis
For statistical analysis, the IBM SPSS Statistics Package, version 29.0.1.0 (IBM Corp., Endicott, NY, USA) was used. First, a general descriptive analysis of the obtained data was conducted. Subsequently, a comparison of means was performed using Student’s t-test for independent or paired samples when applicable.
ANOVA was used for multivariate analysis, assuming equal variances, followed by Tukey’s post-hoc test for multiple comparisons. To evaluate correlations between variables, the Spearman’s rho coefficient was calculated. Differences between means and correlations were considered statistically significant at a p-value < 0.05 and highly significant with a p-value < 0.01. For the statistical analyses, the different sampling areas were grouped into two categories: one including reception, selection, composting, refining, and tunnel (influent group) and the second including sludge, methanization, and output (treated group). Similarly, the different plants were grouped into four groups based on similarities: composting plants treating organic fraction municipal waste (group 1), plants treating agro-livestock matrices (group 2), the plant treating lignocellulosic waste (group 3), and the plant treating wastewater sludge (group 4). As for the season, samples taken from March 21 to September 20 were categorized as “spring-summer,” while those from September 21 to March 20 were categorized as “autumn-winter.”
4. Discussion
The uniqueness of this research can be recognized in two key aspects. First, human embryonic lung fibroblasts were used as the cellular model. These are a rarely employed model in PM toxicity studies, which more commonly rely on immortalized epithelial or tumorigenic cell lines. In a recent study, J. Lee et al. emphasized the importance of using normal human cell lines to better assess toxicological effects in a physiologically relevant context [
30,
31]. Second, unlike most studies, which focus on urban PM, this research examined industrial PM, specifically that derived from biomass treatment plants. These facilities are widespread and expanding across Europe and beyond, and the composition of the PM they generate is markedly different from urban PM, being primarily biological in nature.
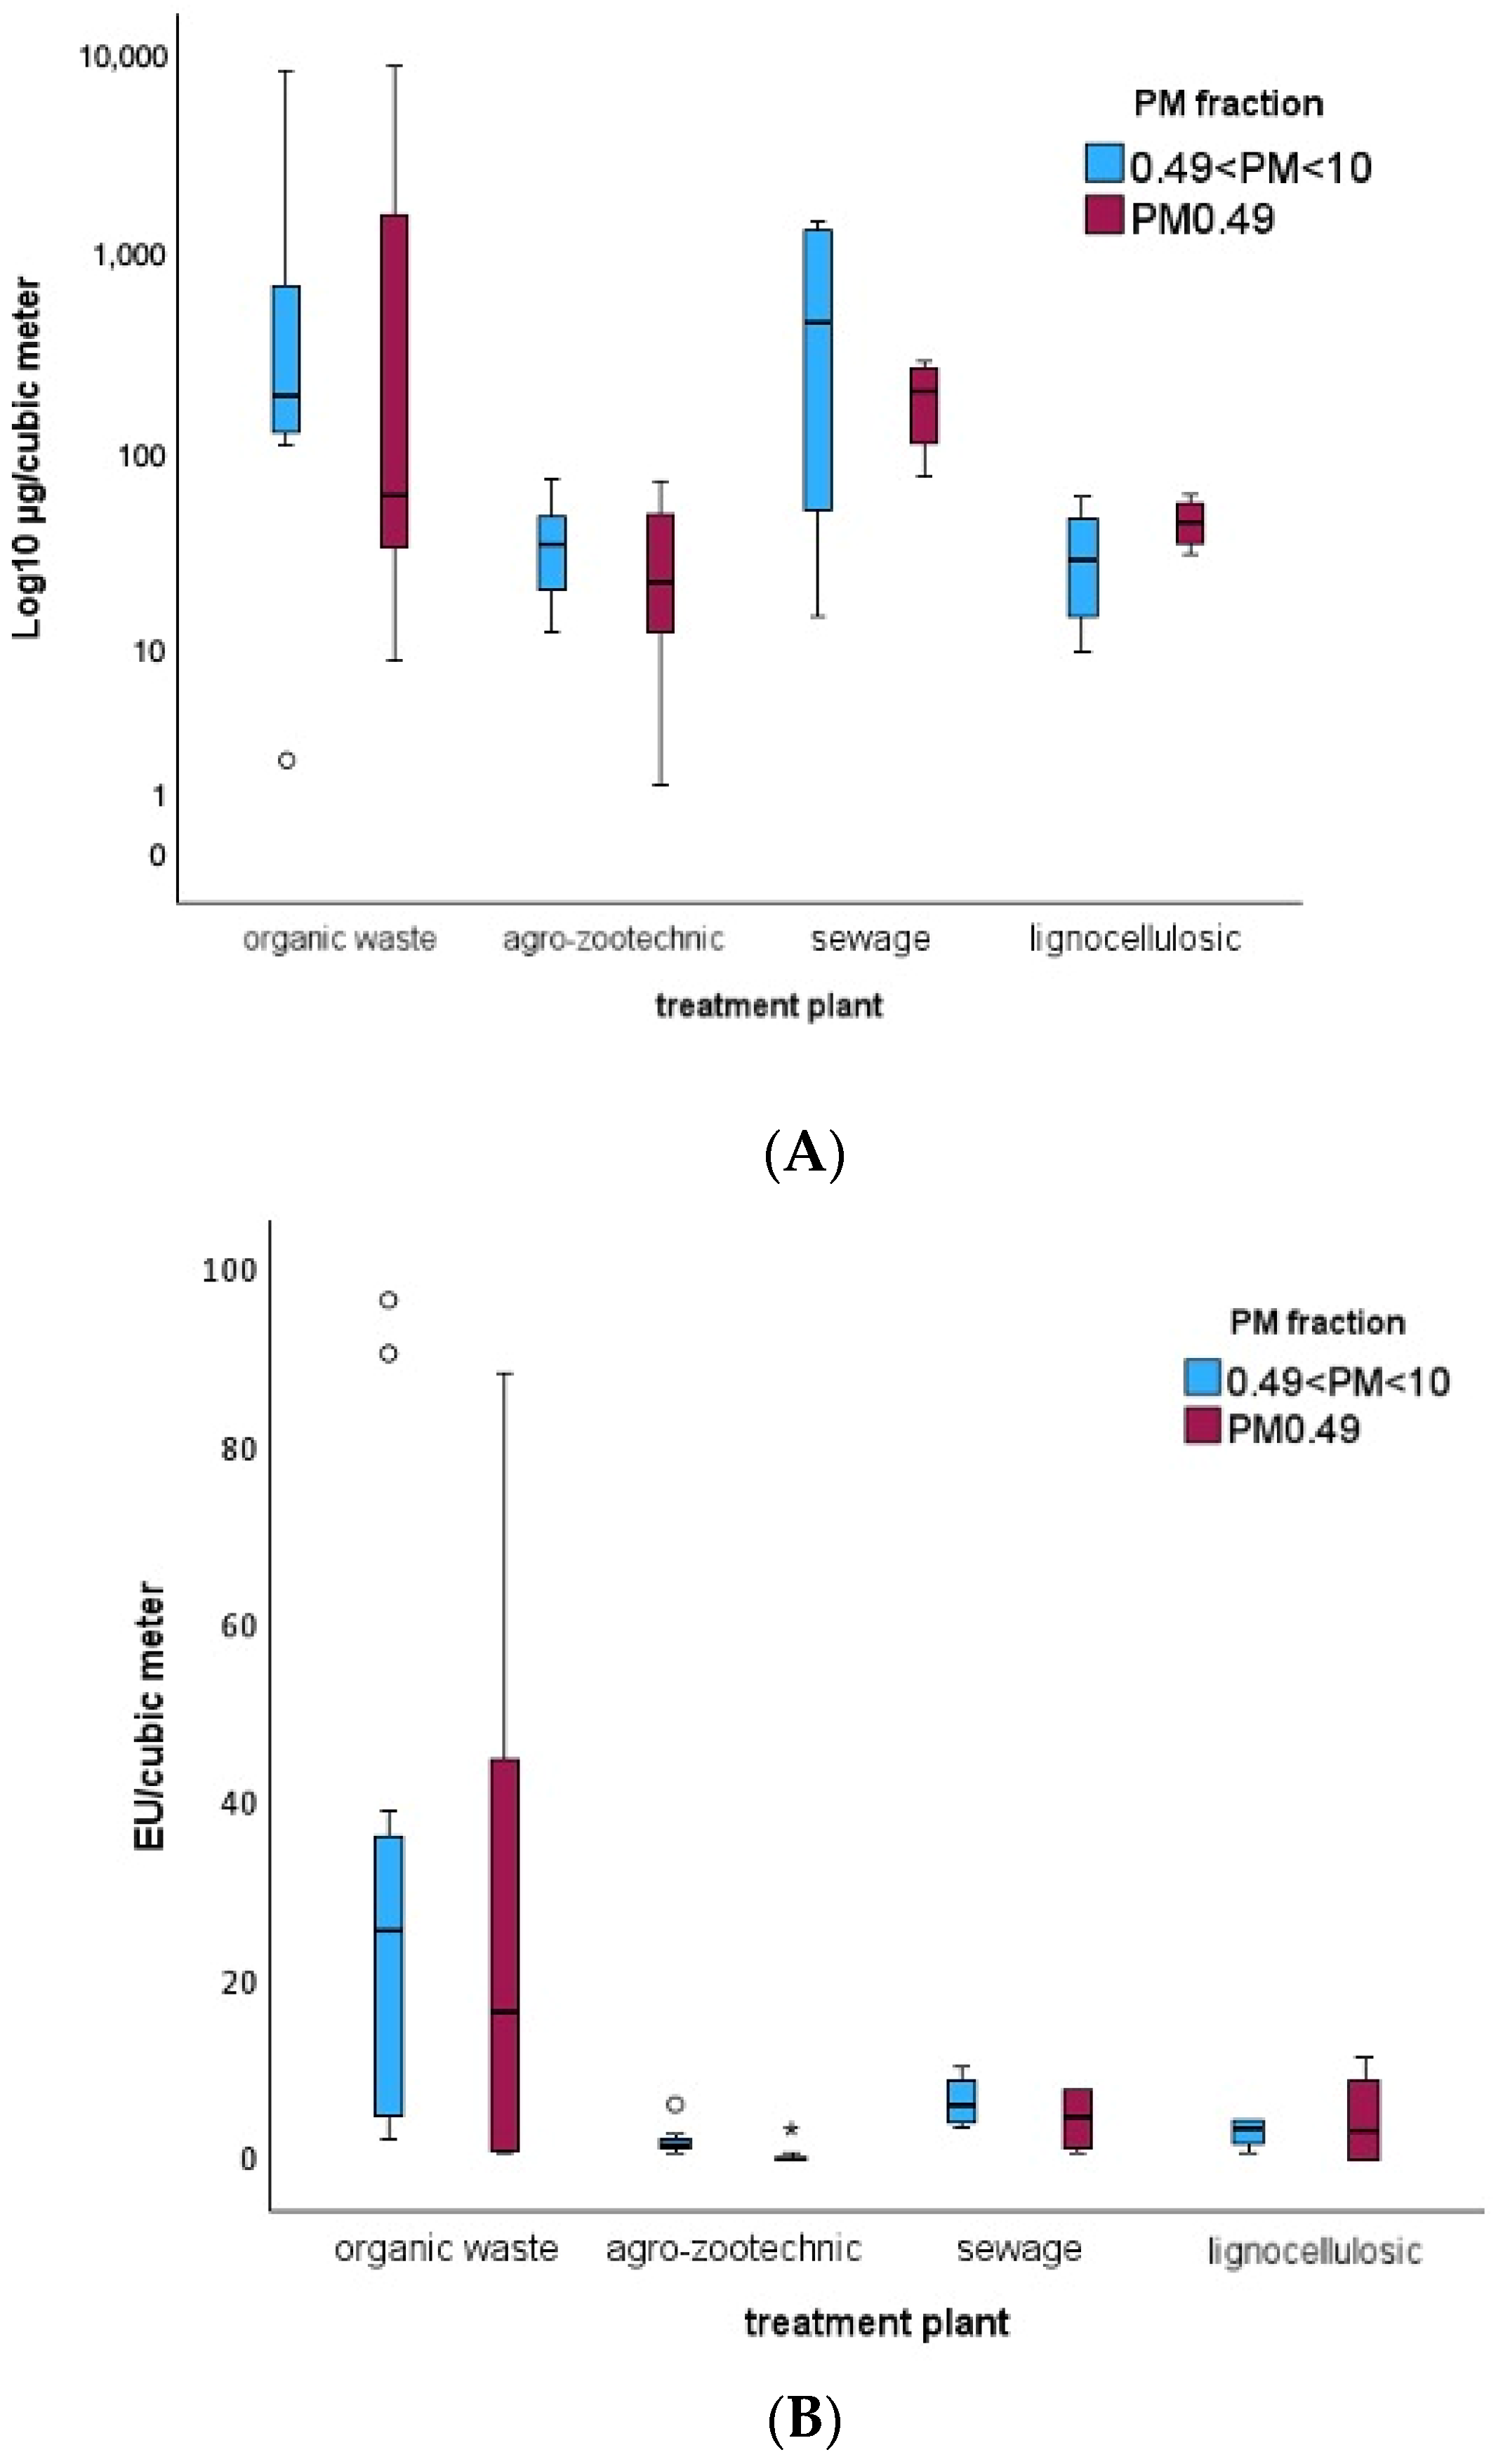
Organic waste composting plants exhibit the highest and most significant levels of airborne PM and endotoxins. This is expected due to the intrinsic characteristics of these facilities, both in terms of the quantity and composition of the processed material and the type of treatment, which involves the continuous movement and overturning of organic matter. This process generates a substantial amount of dust, including coarse particles that are visibly detectable by personnel involved in sampling. Additionally, composting plants are predominantly indoor, whereas other plant types are semi-outdoor or outdoor, leading to differences in ventilation and contaminant dispersion. In these same plants, the cytotoxic activity of PM was significantly higher compared to other facilities, such as agro-zootechnical or lignocellulosic matrix plants. This effect is likely attributable to both the higher PM concentration—given the significant direct correlation between these two variables—and the composition of the airborne mixture in these plants.
In most cases during the sampling period, the occupational exposure limits for respirable and inhalable dust, as well as endotoxins [
29], were not exceeded. However, one composting plant significantly surpassed these thresholds, while a second similar facility exceeded the EU/m
3 limits during one sampling day. Additionally, data indicate higher contamination levels (PM and endotoxins) and greater cytotoxicity in the biomass entry, storage, and treatment areas compared to the product exit areas. The most polluted areas were identified as the refinement zone and the composting tunnel, which aligns with the greater biomass movement occurring during the early treatment stages.
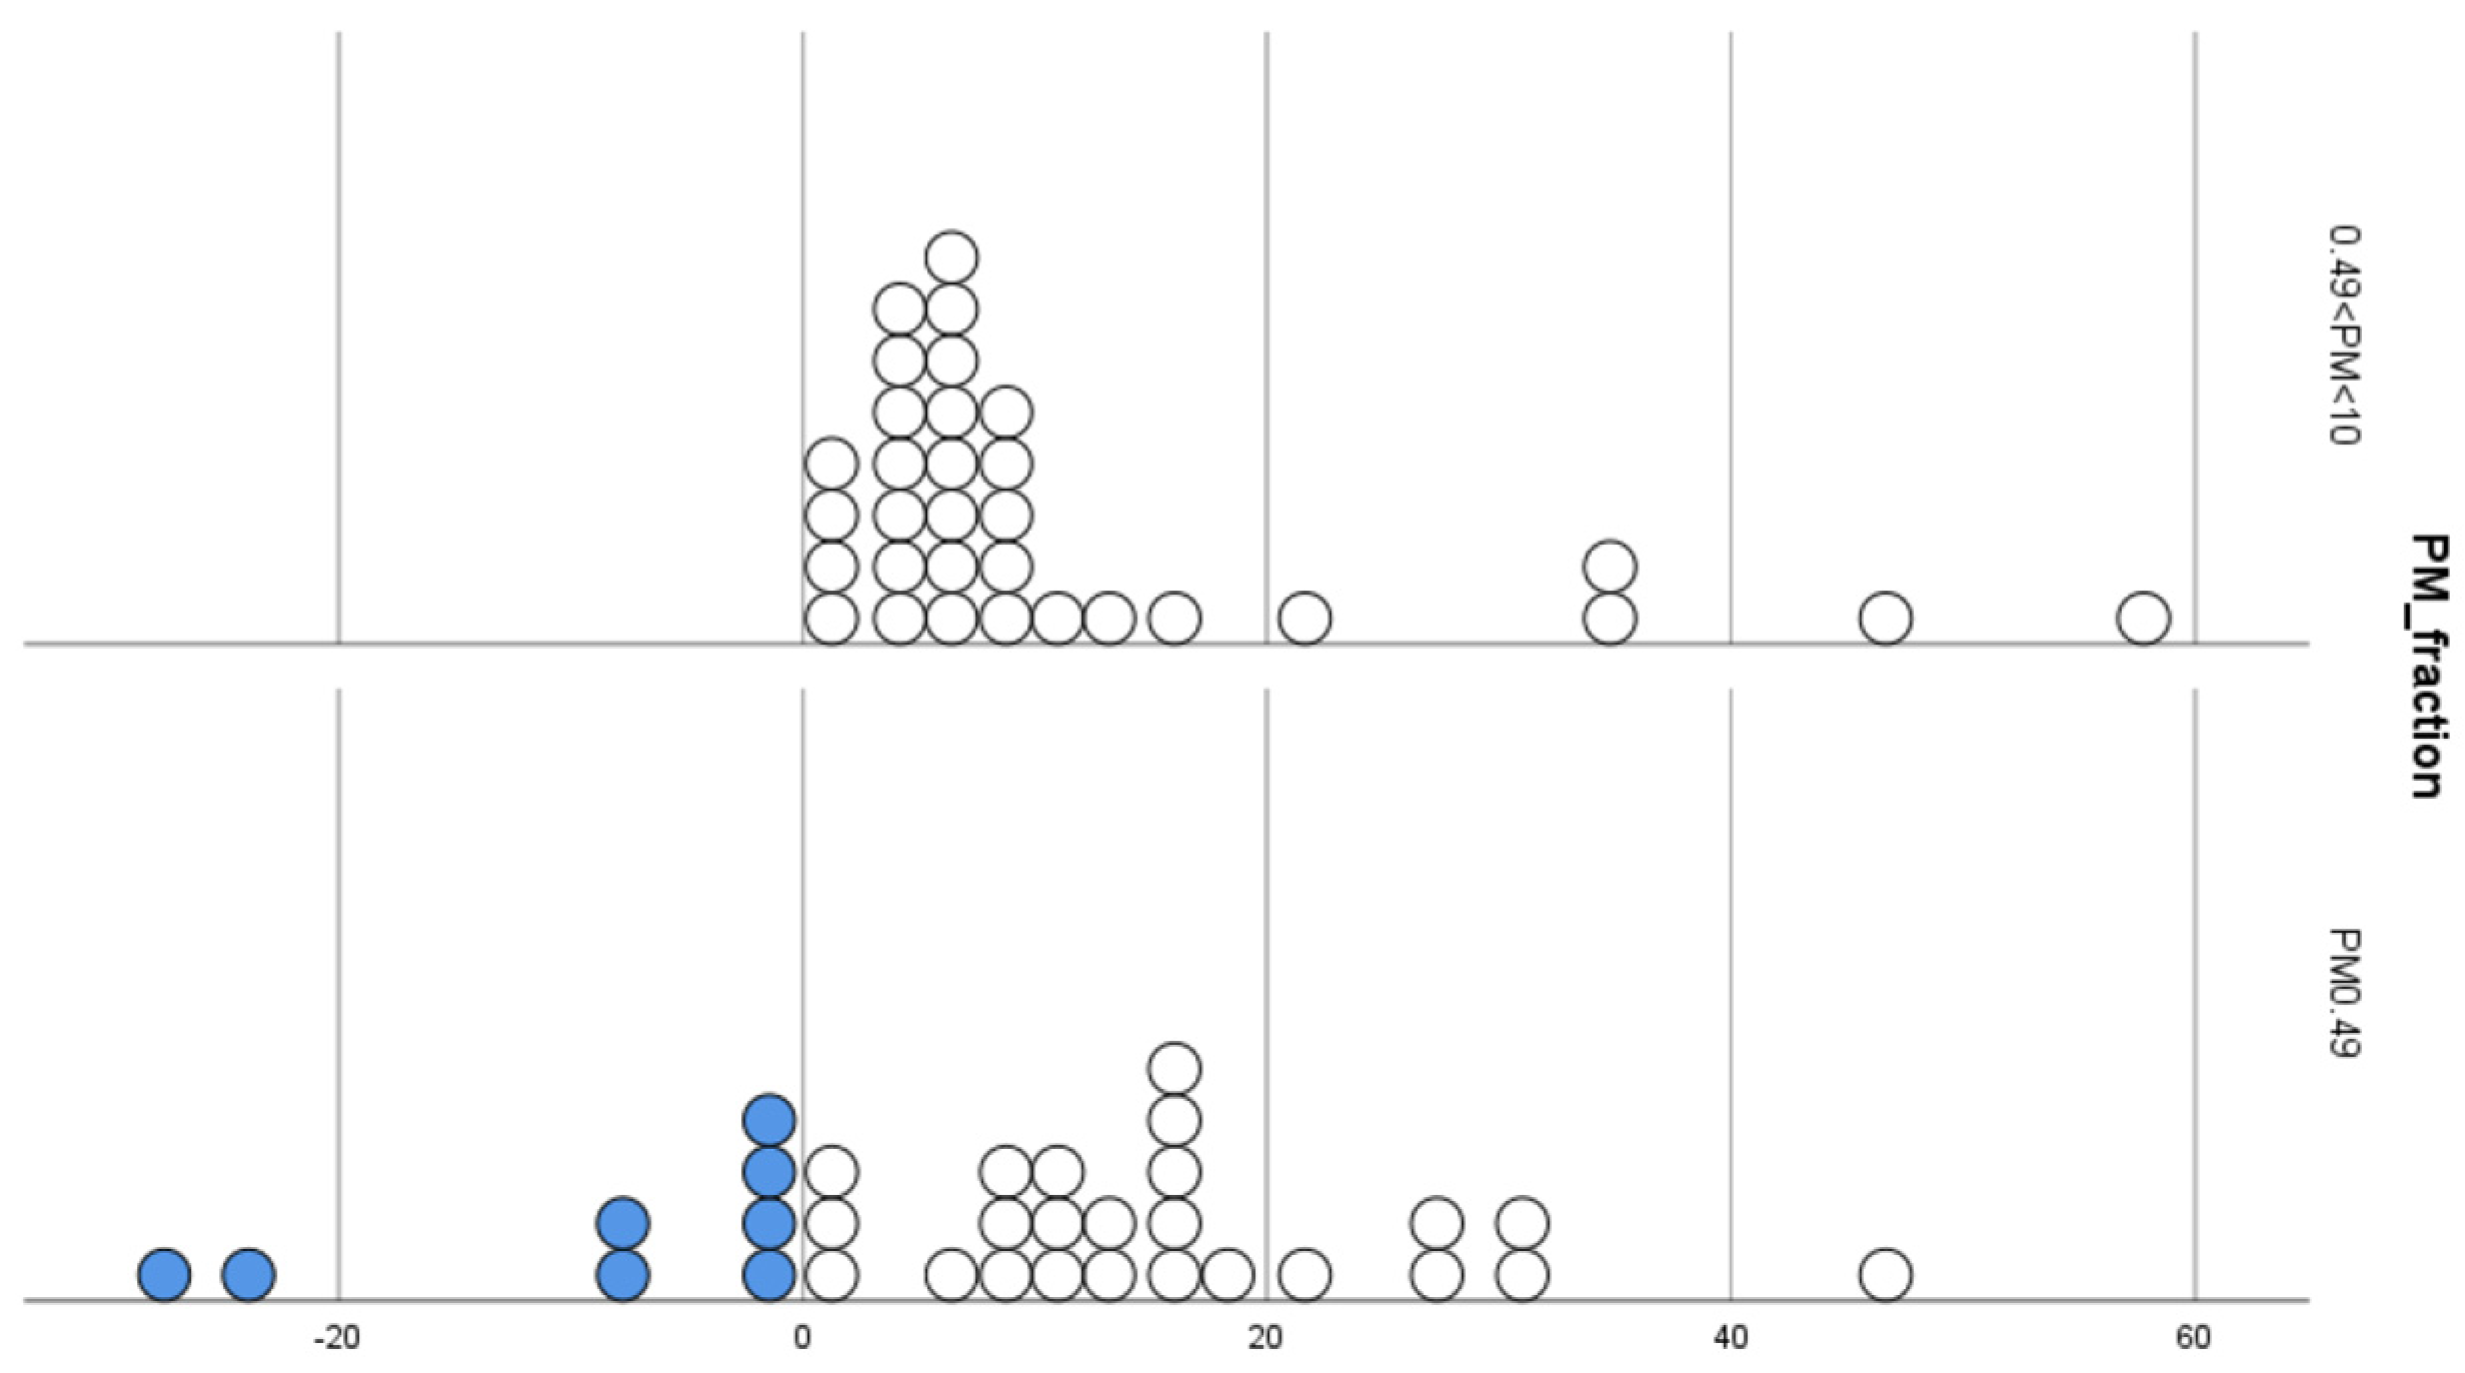
A key biological finding emerged from the XTT assay. To assess potential biological modulation without excessive cell death, cells were exposed to 1% organic PM extract, a sub-lethal dose. Relative to the control (cells exposed only to culture medium), in most cases, a mild cytotoxic effect was observed, with cell viability decreasing between 0% and 20%. Interestingly, in some cases, PM exposure appeared to increase mitochondrial dehydrogenase activity, as indicated by negative delta values, with a maximum induction of 27.5%. This effect was exclusively observed in eight samples, all derived from the finest PM fraction (PM0.49). The mechanisms by which PM exerts its toxicity are closely linked to mitochondrial activity, as mitochondria are the primary producers of ROS and among the most common cellular targets for oxidative damage (e.g., mtDNA damage, lipid peroxidation, and protein oxidation). Evidence from in vitro studies shows that PM generally has an inhibitory effect on mitochondrial activity, particularly reducing the functionality of certain enzymes, including succinate dehydrogenase, which is responsible for the reduction of the salt in the XTT assay, as observed for most of the samples evaluated.
On the other hand, it is important to consider the presence of a strong biological component within the mixture used in this study. As recent studies have shown, this biological component significantly influences the toxicity and oxidative potential of PM, with opposing effects depending on the microbial species present. For example, Samake et al. [
32] observed, in cell-free systems, that the oxidative potential of certain chemical species in PM decreased gradually with increasing concentrations of
S. epidermidis and other bacterial species, likely due to the ability of the bacterial cell wall to chelate these chemical components and inhibit their reactivity. In contrast, high concentrations of
A. fumigatus spores and other fungal species increased the oxidative potential of PM.
However, it is also known that cytotoxicity assays using tetrazolium salts (e.g., XTT, MTT) are influenced by numerous factors that can perturb cellular and mitochondrial homeostasis, potentially leading to partial reprogramming of cellular metabolism, which may sometimes cause confounding effects in interpreting results. Among these factors, plant extracts (which contain polyphenols, flavonoids, etc.) are potential contributors, demonstrating the ability to directly reduce XTT salt through the presence of free -SH groups, thus overestimating cell viability. It cannot be ignored that the PM samples used in our study, due to their derivation from plants treating organic biomass, may contain plant-derived components that contributed to these effects. However, this effect was observed only in a few PM0.49 samples, so it cannot be generalized to all of the extracts.
Another study evaluated the oxidative effects of tert-butylhydroquinone (t-BHQ) on Madin–Darby Bovine Kidney cells using the XTT assay [
33]. The authors explain that pro-oxidant agents, such as t-BHQ, at low doses, can induce the transcription of phase II detoxifying enzymes through the Nrf2-ARE pathway (nuclear factor E2-related factor; antioxidant responsive elements), promoting cytoprotection against oxidative damage. In such studies, exposure of MDBK cells to t-BHQ at low doses induces an apparent increase in cell viability, which was not observed with the crystal violet (CV) staining.
Numerous studies have shown that the toxicity mechanisms of PM are also closely linked to the activity of the Nrf2 transcription factor mentioned above, which plays a key role in protecting the cell from oxidative damage and inflammation. There is in vitro and in vivo evidence demonstrating that organic chemical components of PM
2.5 significantly induce activation of this pathway [
34,
35].
The predominant component of the PM under study is of biological origin. It cannot be ignored that organic components such as PAHs (polycyclic aromatic hydrocarbons), which may also originate from the use of transport vehicles within the plants, are present in trace amounts and, along with the biological components, enhance the oxidizing nature of the sample. These effects were, furthermore, observed only in PM0.49 samples, the finest fraction, which carries these organic components in higher amounts compared to coarse PM.
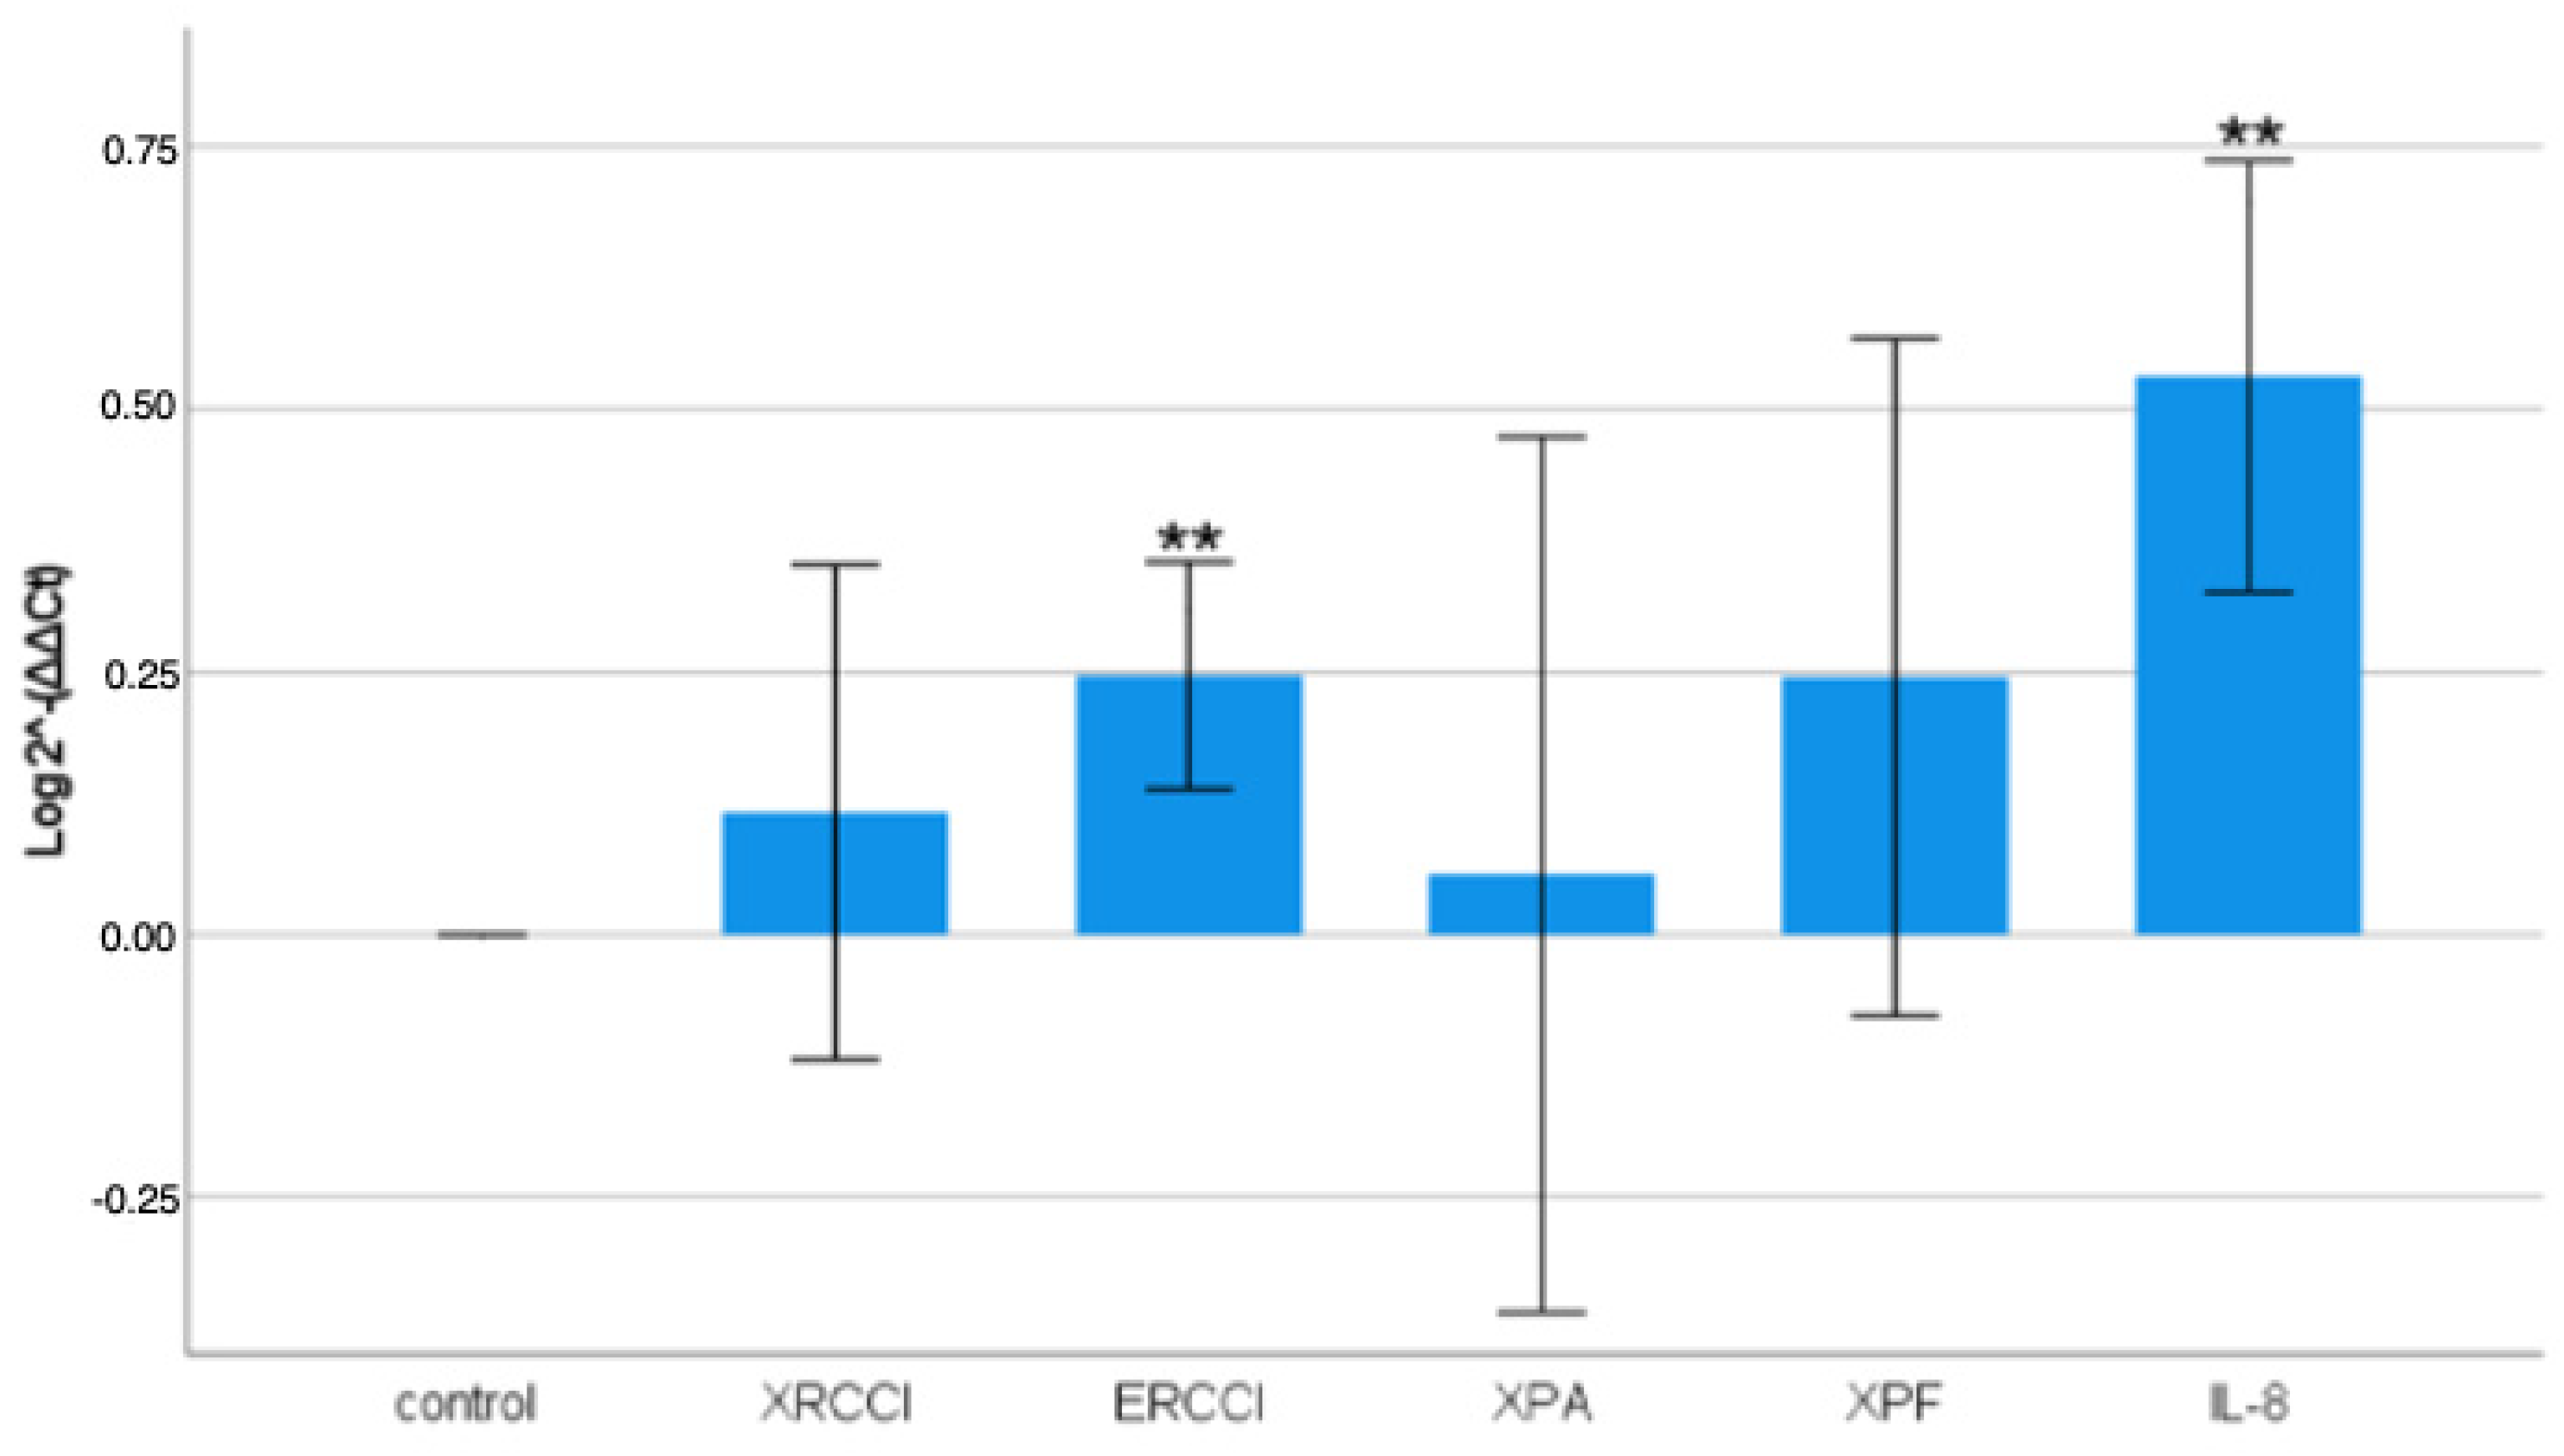
The gene expression analysis revealed that PM had a quite modulatory effect on all of the genes examined, but it had a highly significant impact on the expression of ERCC1 and IL-8, with transcript increases of 25% and 53%, respectively. In contrast, XRCC1, XPF, and XPA showed a mild increase in expression, but the biological response was highly variable. This suggests that the high heterogeneity of the pollutant compound mixture in PM10 airborne particles may lead to inconsistent biological effects, sometimes even opposing ones.
The XRCC1 protein plays a crucial role as a scaffold in various enzymatic complexes for DNA repair, particularly in the processes of NER (Nucleotide Excision Repair) and BER (Base Excision Repair). The expression of XRCC1 increased by just over 10%, but this increase was very mild and, as confirmed by other studies, it can range from mild induction to actual inhibition in response to PM exposure.
The ERCC1, XPF, and XPA proteins are involved in the NER process, with XPA (Xeroderma Pigmentosum Group A) recognizing the damage and stabilizing the structure around the lesion. ERCC1 forms a heterodimer with XPF to make a cut at the 5’ site of the lesion. The expression of XPA showed a very low average increase, resulting in higher variability, making it not a good marker for damage. Other studies confirmed that PM exposure did not induce a high response for XPA [
36], indicating that this protein may not be a sensitive indicator of genomic damage in this condition.
XPA and XPF are regulated similarly in expression, as expected, since both operate in the same DNA repair mechanism.
A recent study evaluated a causal link between prenatal exposure to pollutants, including PM
2.5, and the methylation of promoters of DNA repair genes, analyzing placental DNA samples. The authors observed a significant association between PM
2.5 exposure and methylation of the XPF promoter, which led to a reduction in expression, while the ERCC1 promoter remained unaffected. The authors suggest that PM
2.5 exposure might have caused a loss of stability in the endonuclease complex, which, although it could still perform the incision at the 5’ site of the damage, a task mainly performed by ERCC1, it cannot carry out optimal repair due to the lack of the essential stabilizing action of XPF. This provides a potential mechanism of PM-induced damage, which impairs proper genomic damage repair processes by altering the stability of the complexes that operate in these processes [
36].
IL-8 showed the highest and most significant induction in expression, highlighting the elevated inflammatory potential of the analyzed samples. IL-8 is a chemokine that attracts neutrophils and plays a key role in innate defense against bacterial infections, making it an excellent marker of lung inflammation. Elevated levels of IL-8 are associated with the development of chronic obstructive pulmonary diseases, bronchitis, fibrosis, asthma, and allergies [
37,
38]. Recently, it has been shown that human lung fibroblasts exposed to various inflammatory stimuli increase IL-8 production and other inflammatory chemokines or cytokines through the overexpression and heightened sensitivity of the TRPA1 receptor (transient receptor potential channel ankyrin 1), normally expressed at the neuronal level, contributing to an allergic/asthmatic phenotype and airway hyperresponsiveness [
32]. Additionally, another study found that this receptor is also associated with inflammatory lung damage induced by PM
2.5 [
28]. Numerous studies show that PM (particularly PM
2.5 and PM
0.1) alters normal immune defenses at the lung level through the induction of inflammatory mechanisms, both in vitro and in vivo, with IL-8 being one of the most commonly upregulated chemokines. The production of inflammatory cytokines stimulated by PM may sometimes be the cause of increased severity in pre-existing pulmonary inflammatory diseases. Capistrano et al. [
39] infected human lung fibroblasts exposed to biomass combustion PM extracts and observed significantly increased production of IL-8 compared to unexposed cells, suggesting a potential synergistic mechanism between PM effects and viral infections, leading to exacerbated inflammation through IL-8 production. This aspect is even more relevant from a health perspective in occupational settings, where exposure to potential viral, bacterial, or fungal agents is more frequent, especially in biomass treatment sectors, as shown by numerous cases of infectious diseases (e.g., aspergillosis). Therefore, IL-8 confirms its role as a crucial inflammation marker for exposure to environmental pollutants.
The results show a highly significant positive correlation between the IL-8 expression increase and the endotoxin concentration in each sample, while no significant correlation with the PM
10 mass was observed. These findings align with the literature, in which the negative impact of particulate matter on human health is more closely associated with the chemical and biological composition of PM than its mass. Endotoxins have an inherently inflammatory nature and are powerful activators of the NLRP3 inflammasome complex, which, through caspase 1 activation, is responsible for the release of pro-inflammatory cytokines and interleukins. J. Liu et al. [
39] evaluated the inflammatory potential of airborne endotoxins emitted from composting plants, finding significantly elevated concentrations near the plants, as well as in surrounding areas. Cells exposed to bioaerosol extracts released high amounts of IL-8 and IL-6, which correlated significantly with endotoxin levels. When the cells were treated with Polymyxin B (a specific endotoxin inhibitor), the pro-inflammatory effect was inhibited, and the cytokine stimulation was found to be higher for airborne endotoxins than for commercially purified
E. coli endotoxins.
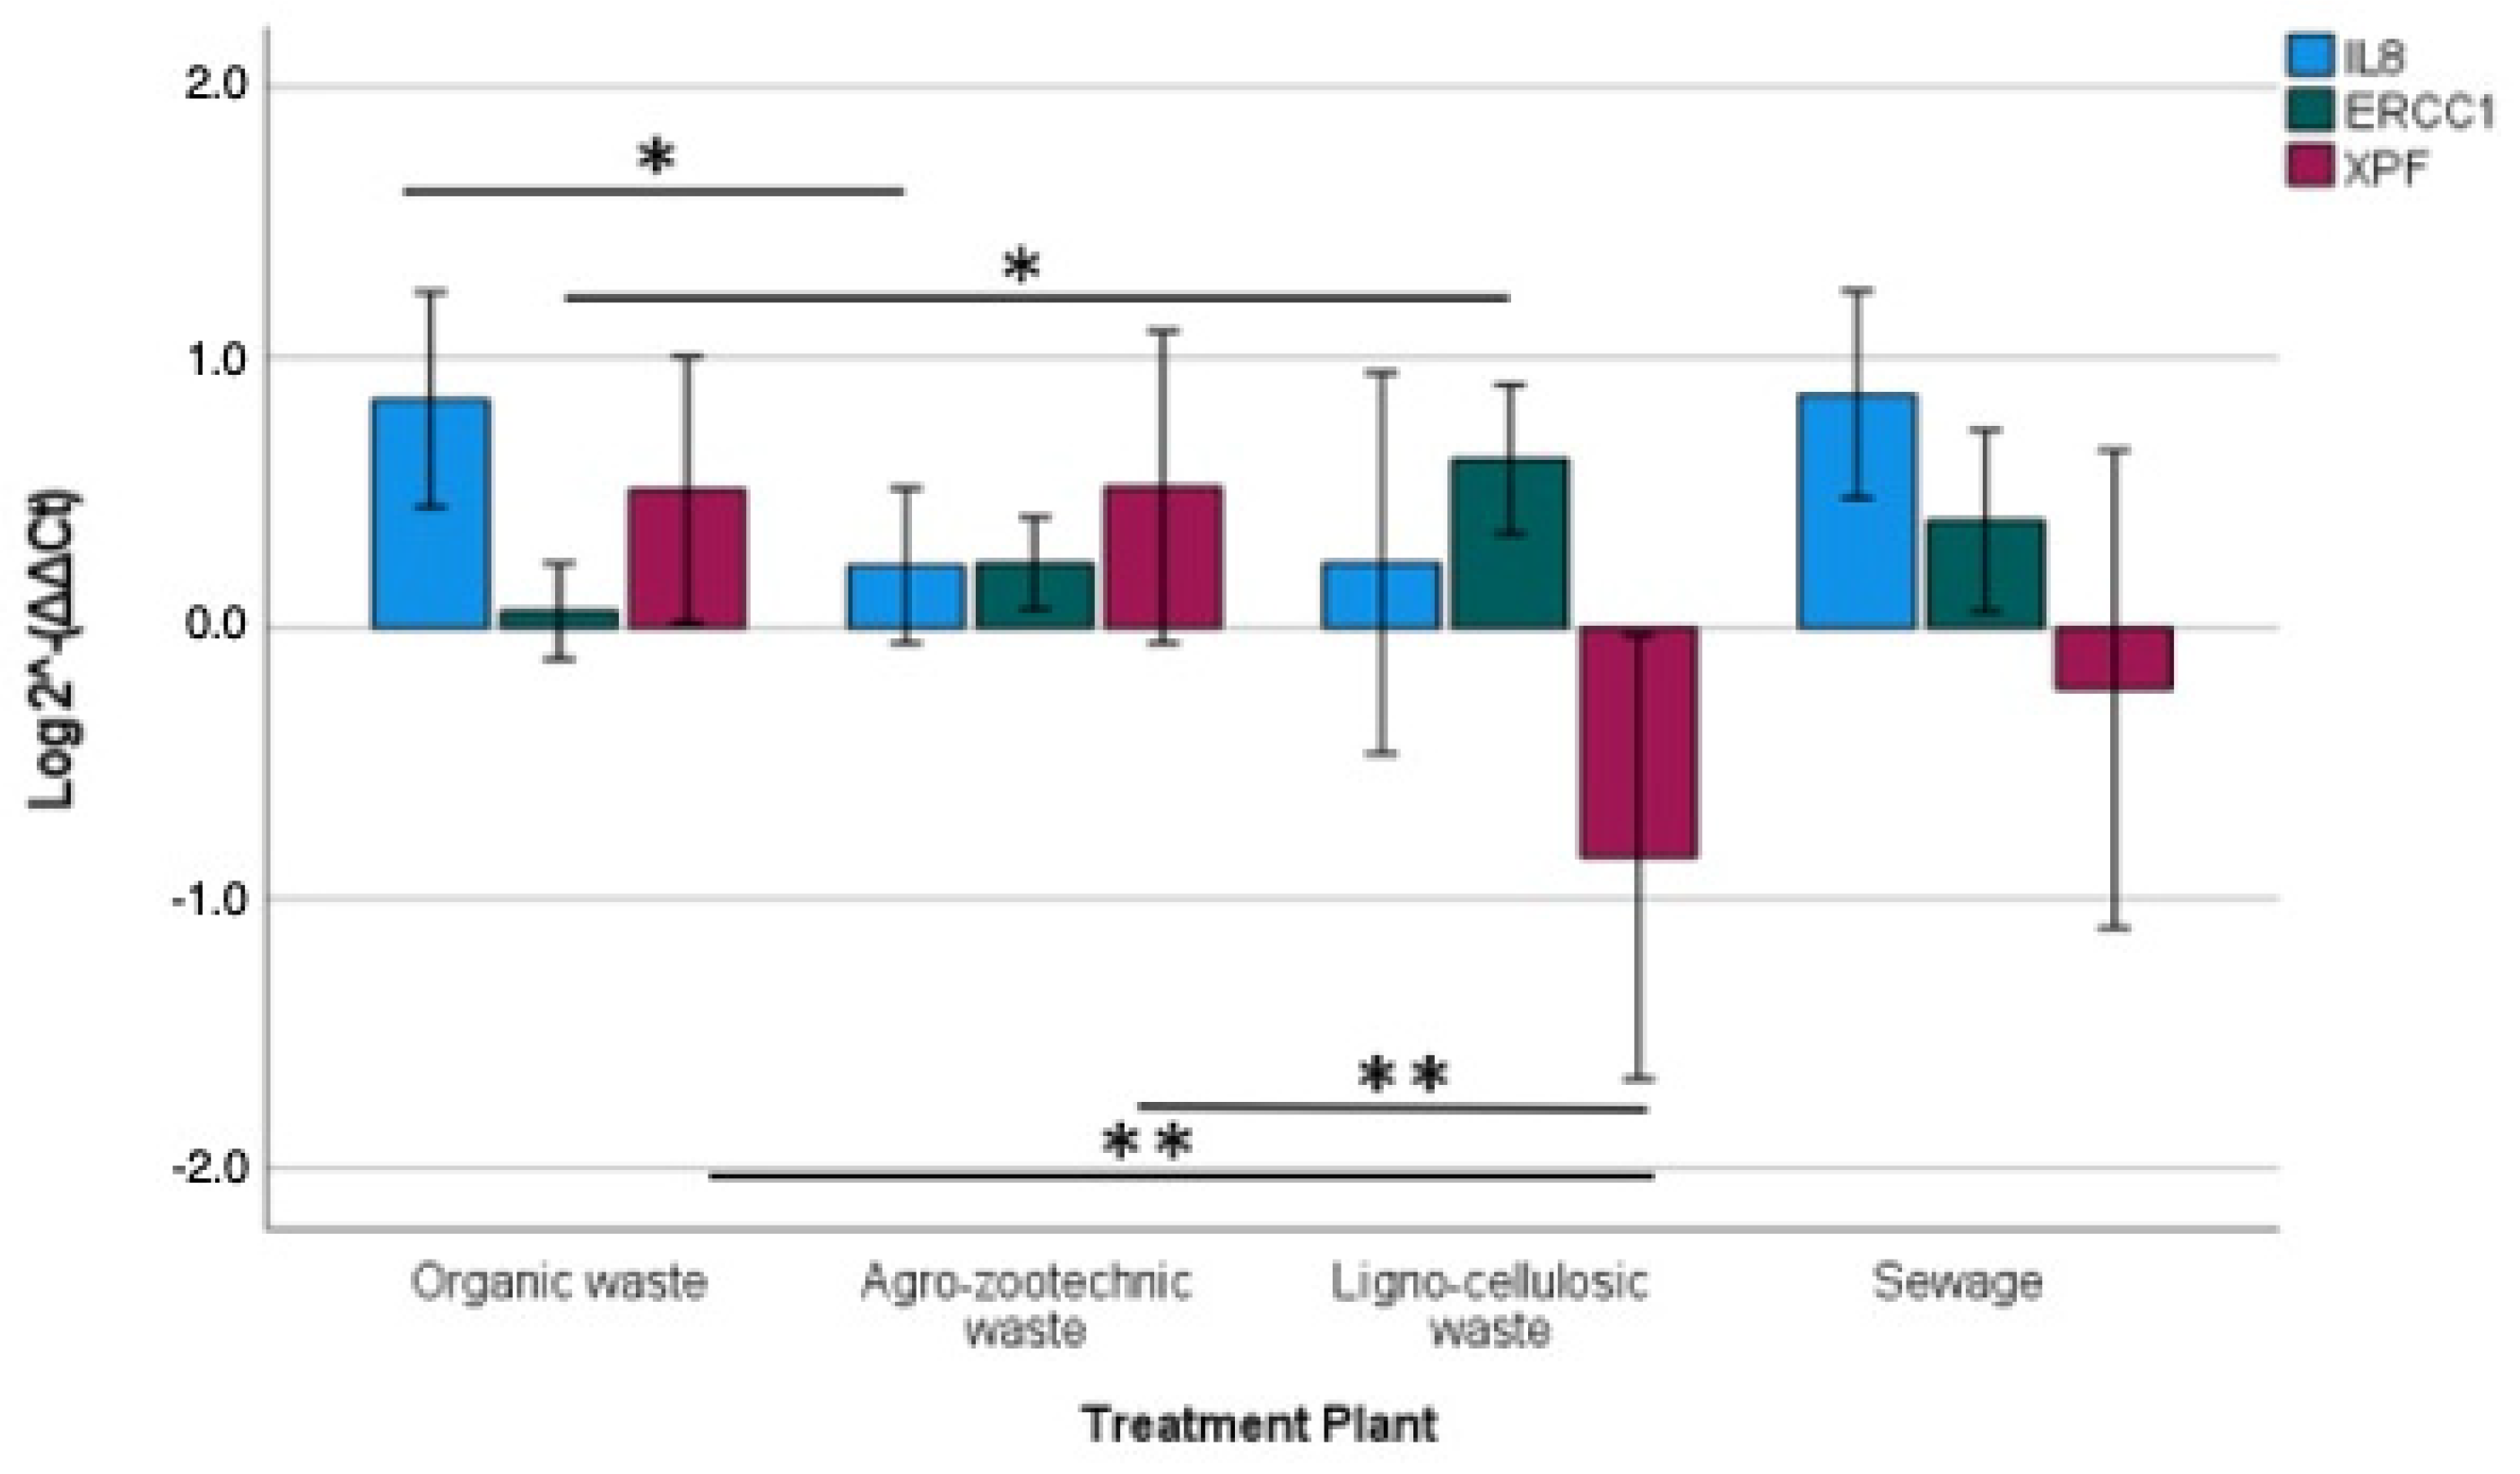
A significant variation in gene expression was found when considering the types of plants. Normally, air and bioaerosol characterization in these environments reveals different compositions of airborne microbial communities in various plants and specific operational areas within them. This leads to heterogeneity in the overall PM composition and, consequently, in the resulting biological effects. A previous study conducted on similar plants revealed significantly higher microbial contamination in the air in organic waste treatment plants, with a prevalence of bacterial species in biomass entry and storage areas compared to plants treating different matrices, where the fungal component predominated [
17,
40]. Therefore, gene expression, cytotoxic activity, and PM concentration and endotoxins seem to differ significantly based on the plant type or specific operational phase, rather than the PM fraction. Specifically, IL-8 was significantly induced by PM from composting plants, which appear to produce more inflammatory PM, while XPF was significantly down-regulated by PM from lignocellulosic matrix plants, where ERCC1 significantly increased, indicating a PM that seems to impair genomic damage repair mechanisms more than others.
Although full-scale biomass treatment plants are rarely assessed for genotoxic potential, this study presents several limitations. One of the main issues is the lack of characterization of the biological and chemical components of the particulate matter. While the identification of individual agents could provide valuable insights, the objective of this study was to assess the genotoxicity of the complex, multi-component pollution mixtures typical of the waste treatment methods examined, rather than to isolate a specific microbial or chemical signature.
Another limitation is the inability to provide a mechanistic interpretation of the observed genotoxic effects, which would be desirable in future research. This study focused on organic extracts of particulate matter, which have been shown in the literature to have the strongest association with genotoxic effects. However, we cannot rule out the potential contribution of aqueous extracts, typically examined for reactive oxygen species (ROS) activity. Future research could include parallel sampling streams, one dedicated to extract-based genotoxic assays and another reserved for molecular endpoints.
Furthermore, the analytical techniques employed in this study could be expanded. Incorporating methods such as RNA sequencing or western blotting could provide complementary evidence. Additionally, validating the findings across multiple cell lines would strengthen the reliability of the data. For a genotoxicity study, it is crucial to select a genetically stable cell line, ideally derived from non-cancerous tissue, such as the HELF line, not so easy to find. Lastly, while gene expression modulation serves as an early biological response that precedes direct DNA damage—such as that detectable through the Comet assay—incorporating additional genotoxic endpoints would strengthen the overall case and provide a more comprehensive evaluation of the genotoxic risks associated with biomass treatment emissions.


 ).
).