4.1. Determination of Simulation Parameters for the Temporary Support Robot
According to the working environment of the TSR, we set the relevant parameters for the surrounding rock of the working face, as shown in
Table 1. The minimum allowable value of the support strength of the TSR to the roof,
pmin = 0.02 MPa, is calculated by Equation (21). The uniaxial compressive strength of the floor material is taken as
σb = 4.1 MPa; the coefficient is
C = 0.05; and the minimum allowable value of the support strength of the TSR to the roof,
pmax ≈ 0.2 MPa, is calculated by Equation (22).
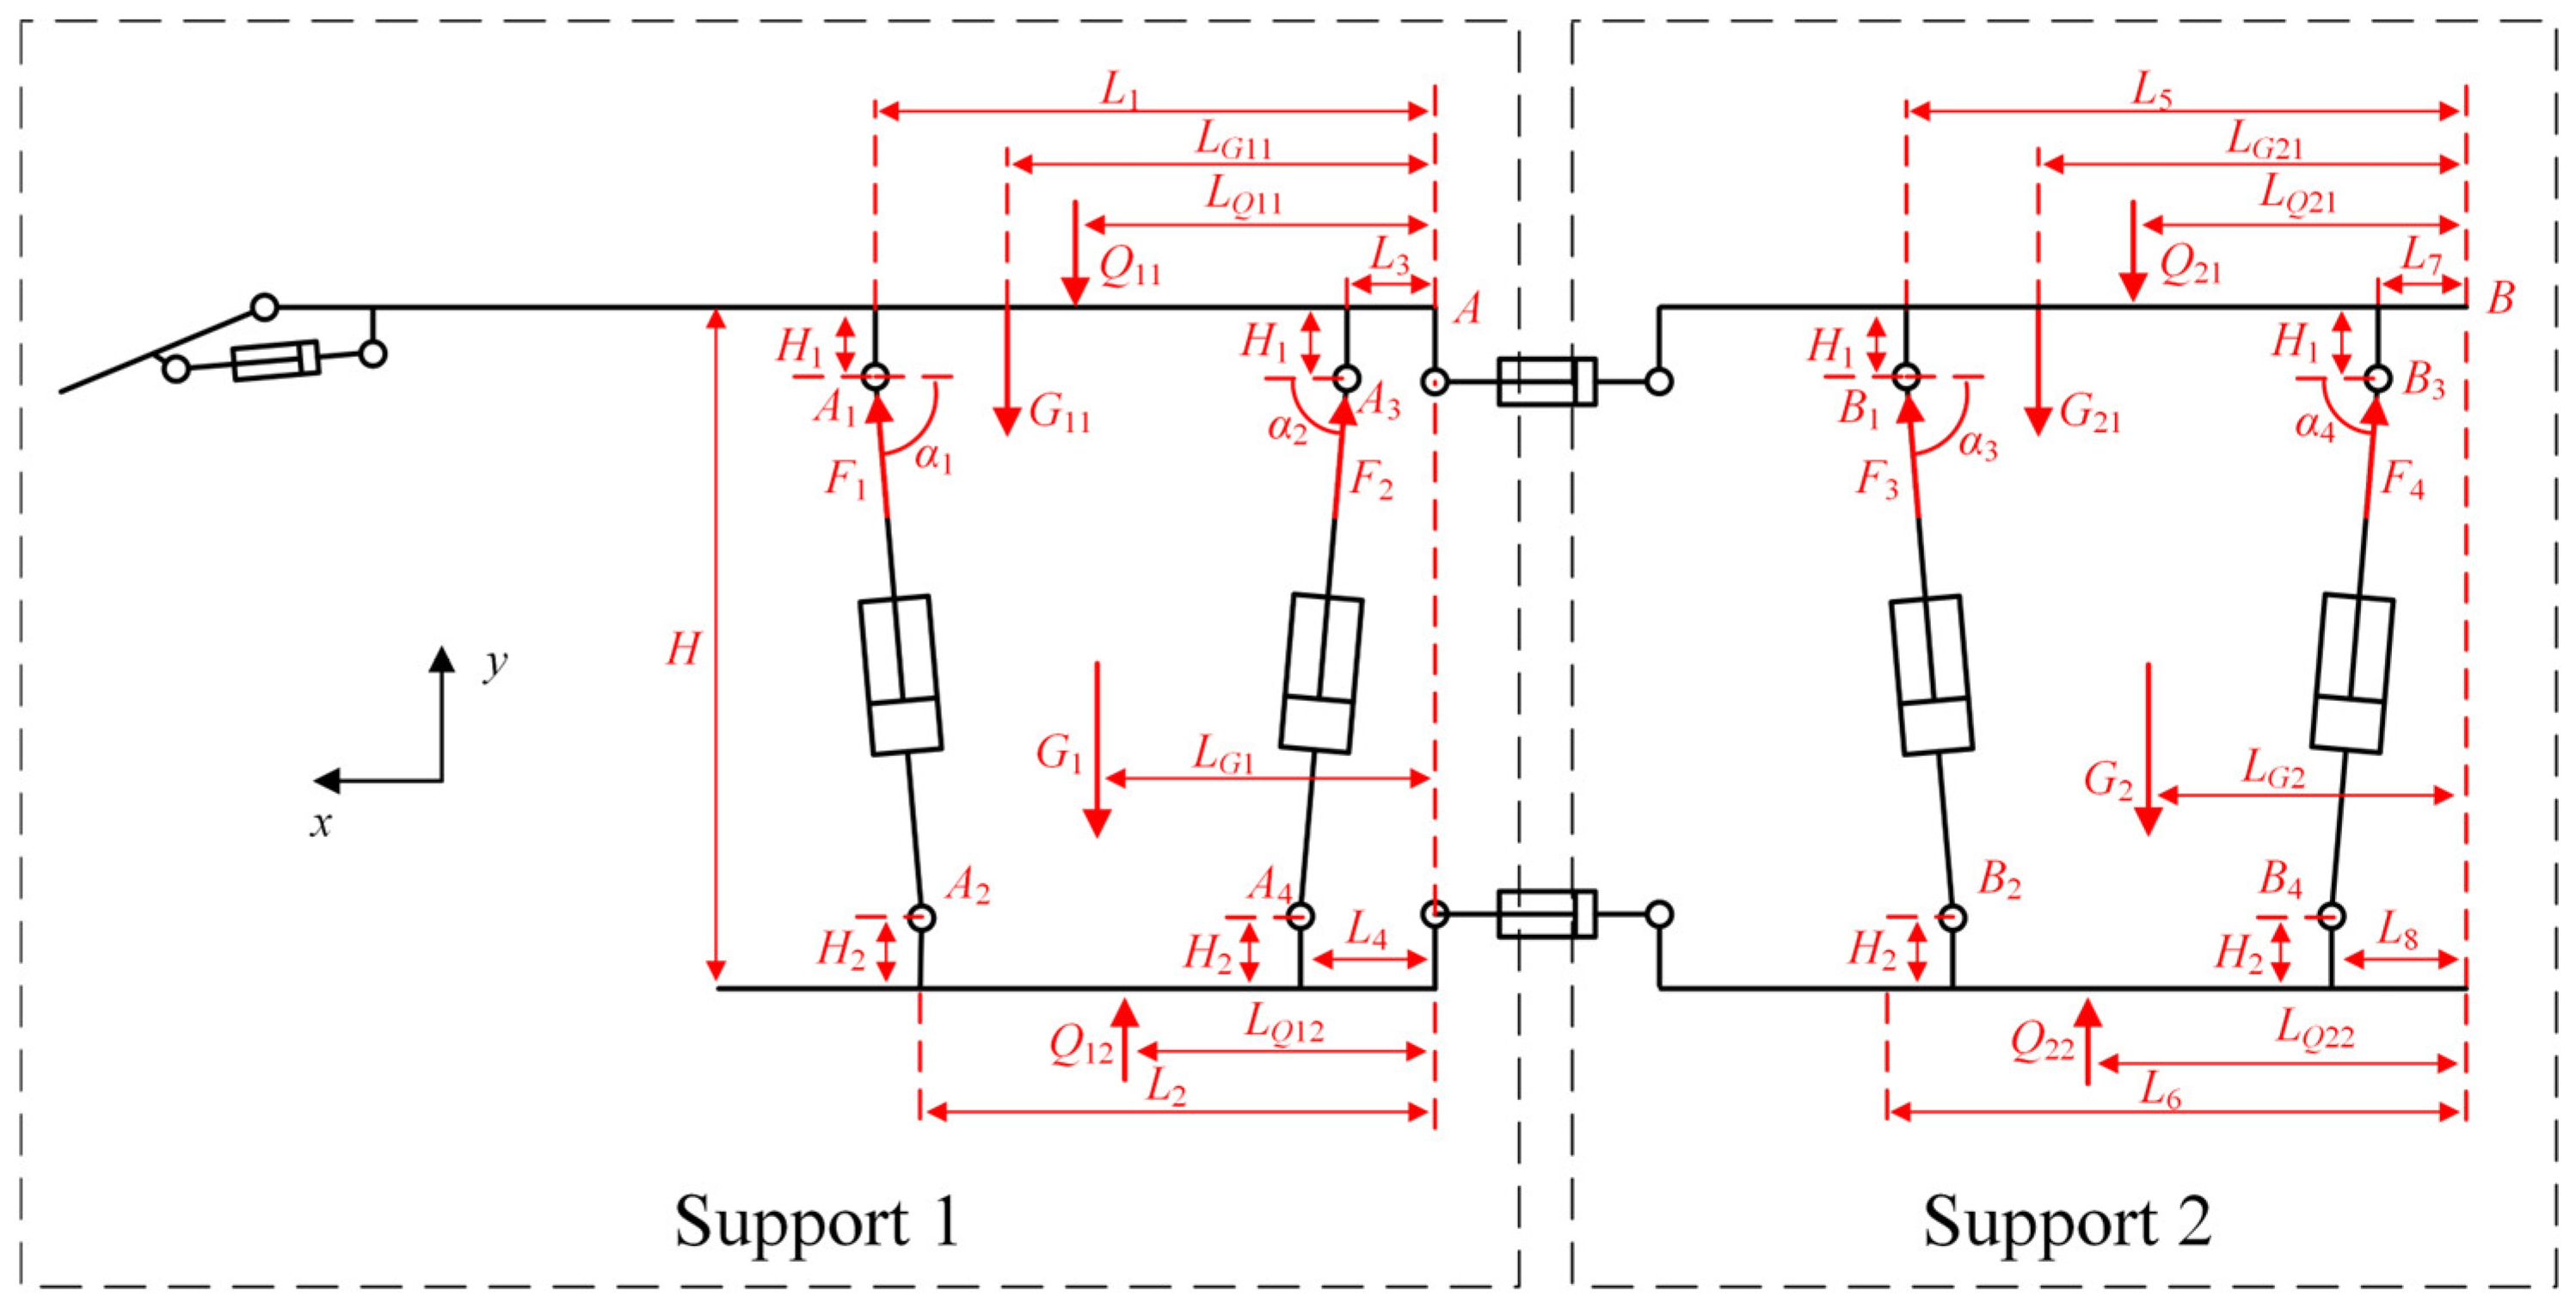
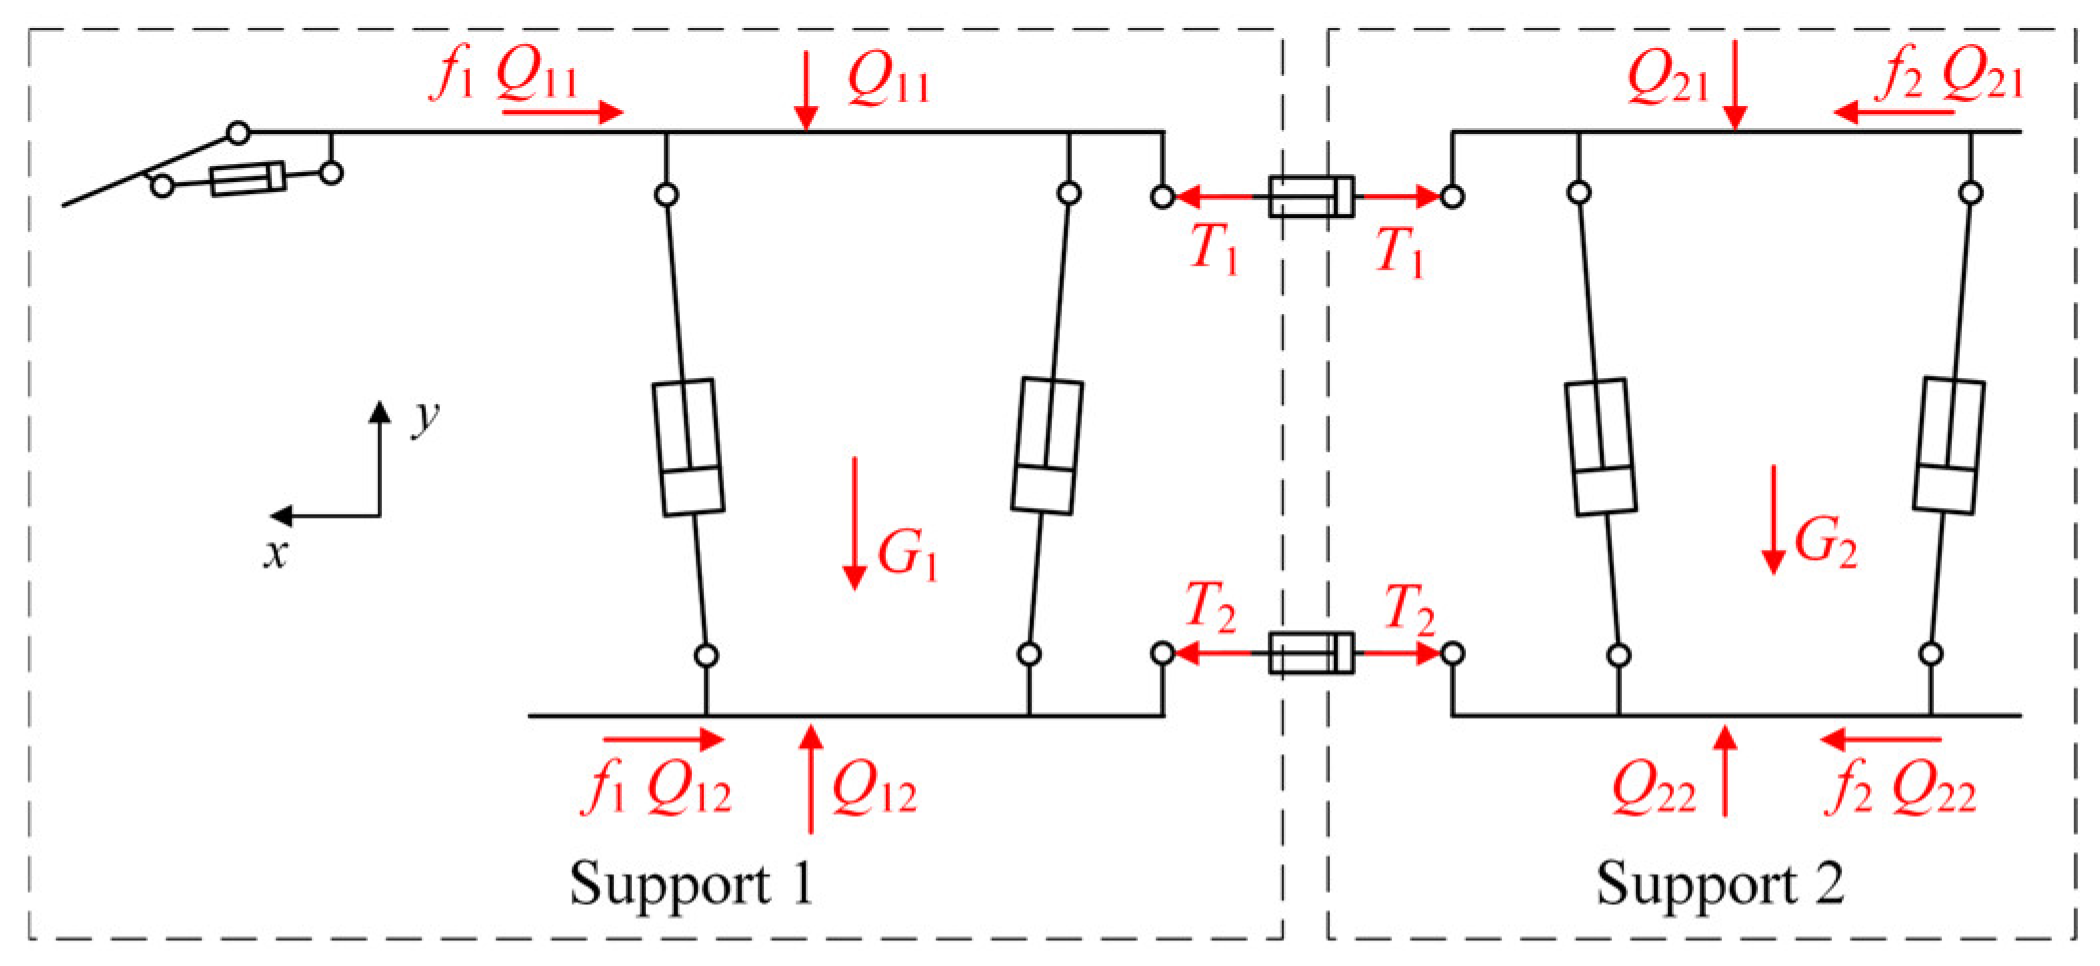
To analyze the boundary conditions of the driving under pressure dynamic model of the TSR under given conditions and to obtain the relationship between the specific pressure of the top beam and base of support 1 and support 2 on surrounding rock, the boundary conditions of the driving under pressure dynamic model of the TSR are simulated. Relevant parameters are shown in
Table 2. It is assumed that the support strength of the TSR to the roof cannot be less than 0.02 MPa, and the specific pressure in contact with the surrounding rock cannot be greater than 0.2 MPa. To ensure the stability of the driving under pressure motion process of the TSR, the acceleration of support 1 and support 2 during movement is taken not to exceed 0.2 m/s
2. According to the cooperation mode between the TSR and the cutting robot, the TSR’s width is 2 m. The space length required for the cutting robot and scraper conveyor located below the top beam of support 1 is at least 3 m, and the length of the top beam and floor of support 2 are the same. Then, the area relationship between the top beam and base of support 1 is
S11 −
S12 = 6 m
2, and the area relationship between the top beam and base of support 2 is
S21 =
S22. The supporting force of support 1 and support 2 is the largest during stable support. Therefore, the specific pressure of the base of support 1 and support 2 against the floor during stable support 1s is taken as
P12s =
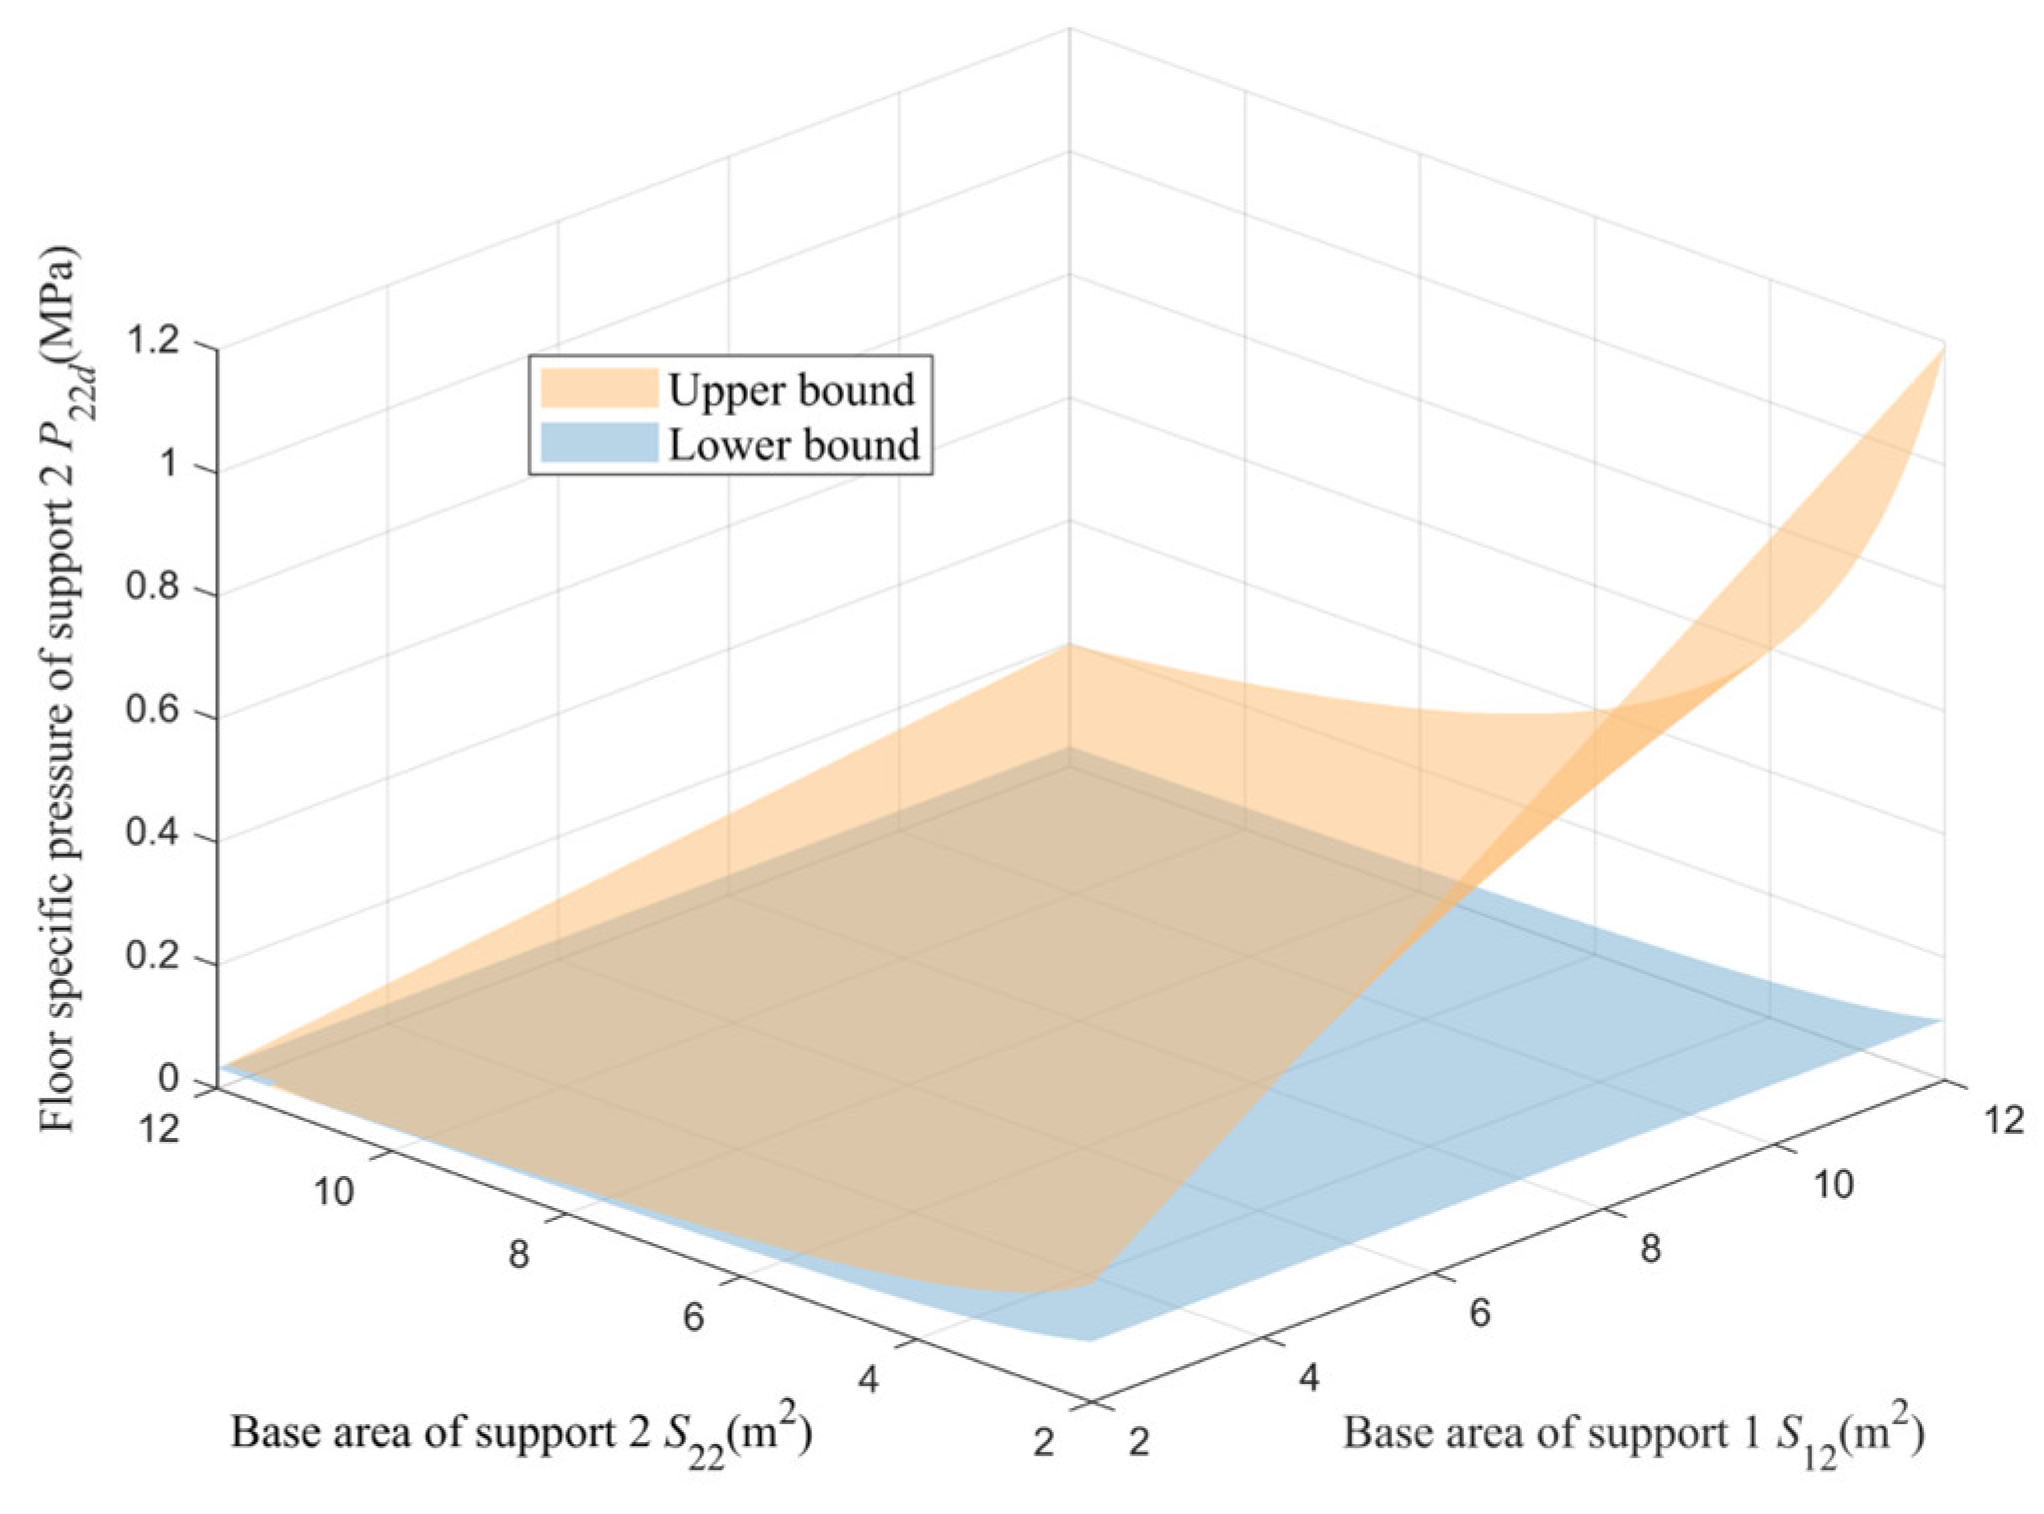
P22s = 0.2 MPa. From Equation (13), the value range of the specific pressure
P12d of the base of support 1 against the floor during the state of driving under pressure and the value range of the specific pressure
P22d of the base of support 2 against the floor during in the state of driving under pressure can be obtained, as shown in
Figure 8 and
Figure 9, which vary with the area
S12 of the base of support 1 and the support area
S22 of support 2.
Analyzing
Figure 8 and
Figure 9, it can be seen that when the ratio of the base area of support 1 to support 2 is smaller, the value range of
P12d is larger, and the value range of
P22d is smaller. When the ratio of the base area of support 1 to support 2 is larger, the value range of
P12d is smaller, and the value range of
P22d is larger. The upper limit of
P12d and
P22d determines the critical value at which support 1 and support 2 can drive under pressure, and the lower limit determines the critical value for ensuring that the roof does not collapse during the driving under pressure process of support 1 and support 2.
Taking the area of support 1’s top beam as
S11 = 8 m
2; the area of support 1’s base as
S12 = 9 m
2; the area of support 2’s top beam as
S21 = 8 m
2; and the area of support 2’s base as
S21 = 8 m
2, the value range of the specific pressure of the base of support 1 and support 2 against the floor can be calculated by Equation (14) as 0.056 MPa <
P12d < 0.22 MPa and 0.038 MPa <
P22d < 0.17 MPa. For ease of analysis, the angles of the supporting cylinders for both support 1 and support 2 are set to 90 degrees. The other parameters of the TSR are listed in
Table 3.
4.2. Finite Element Simulation of the Temporary Support Robot and the Floor
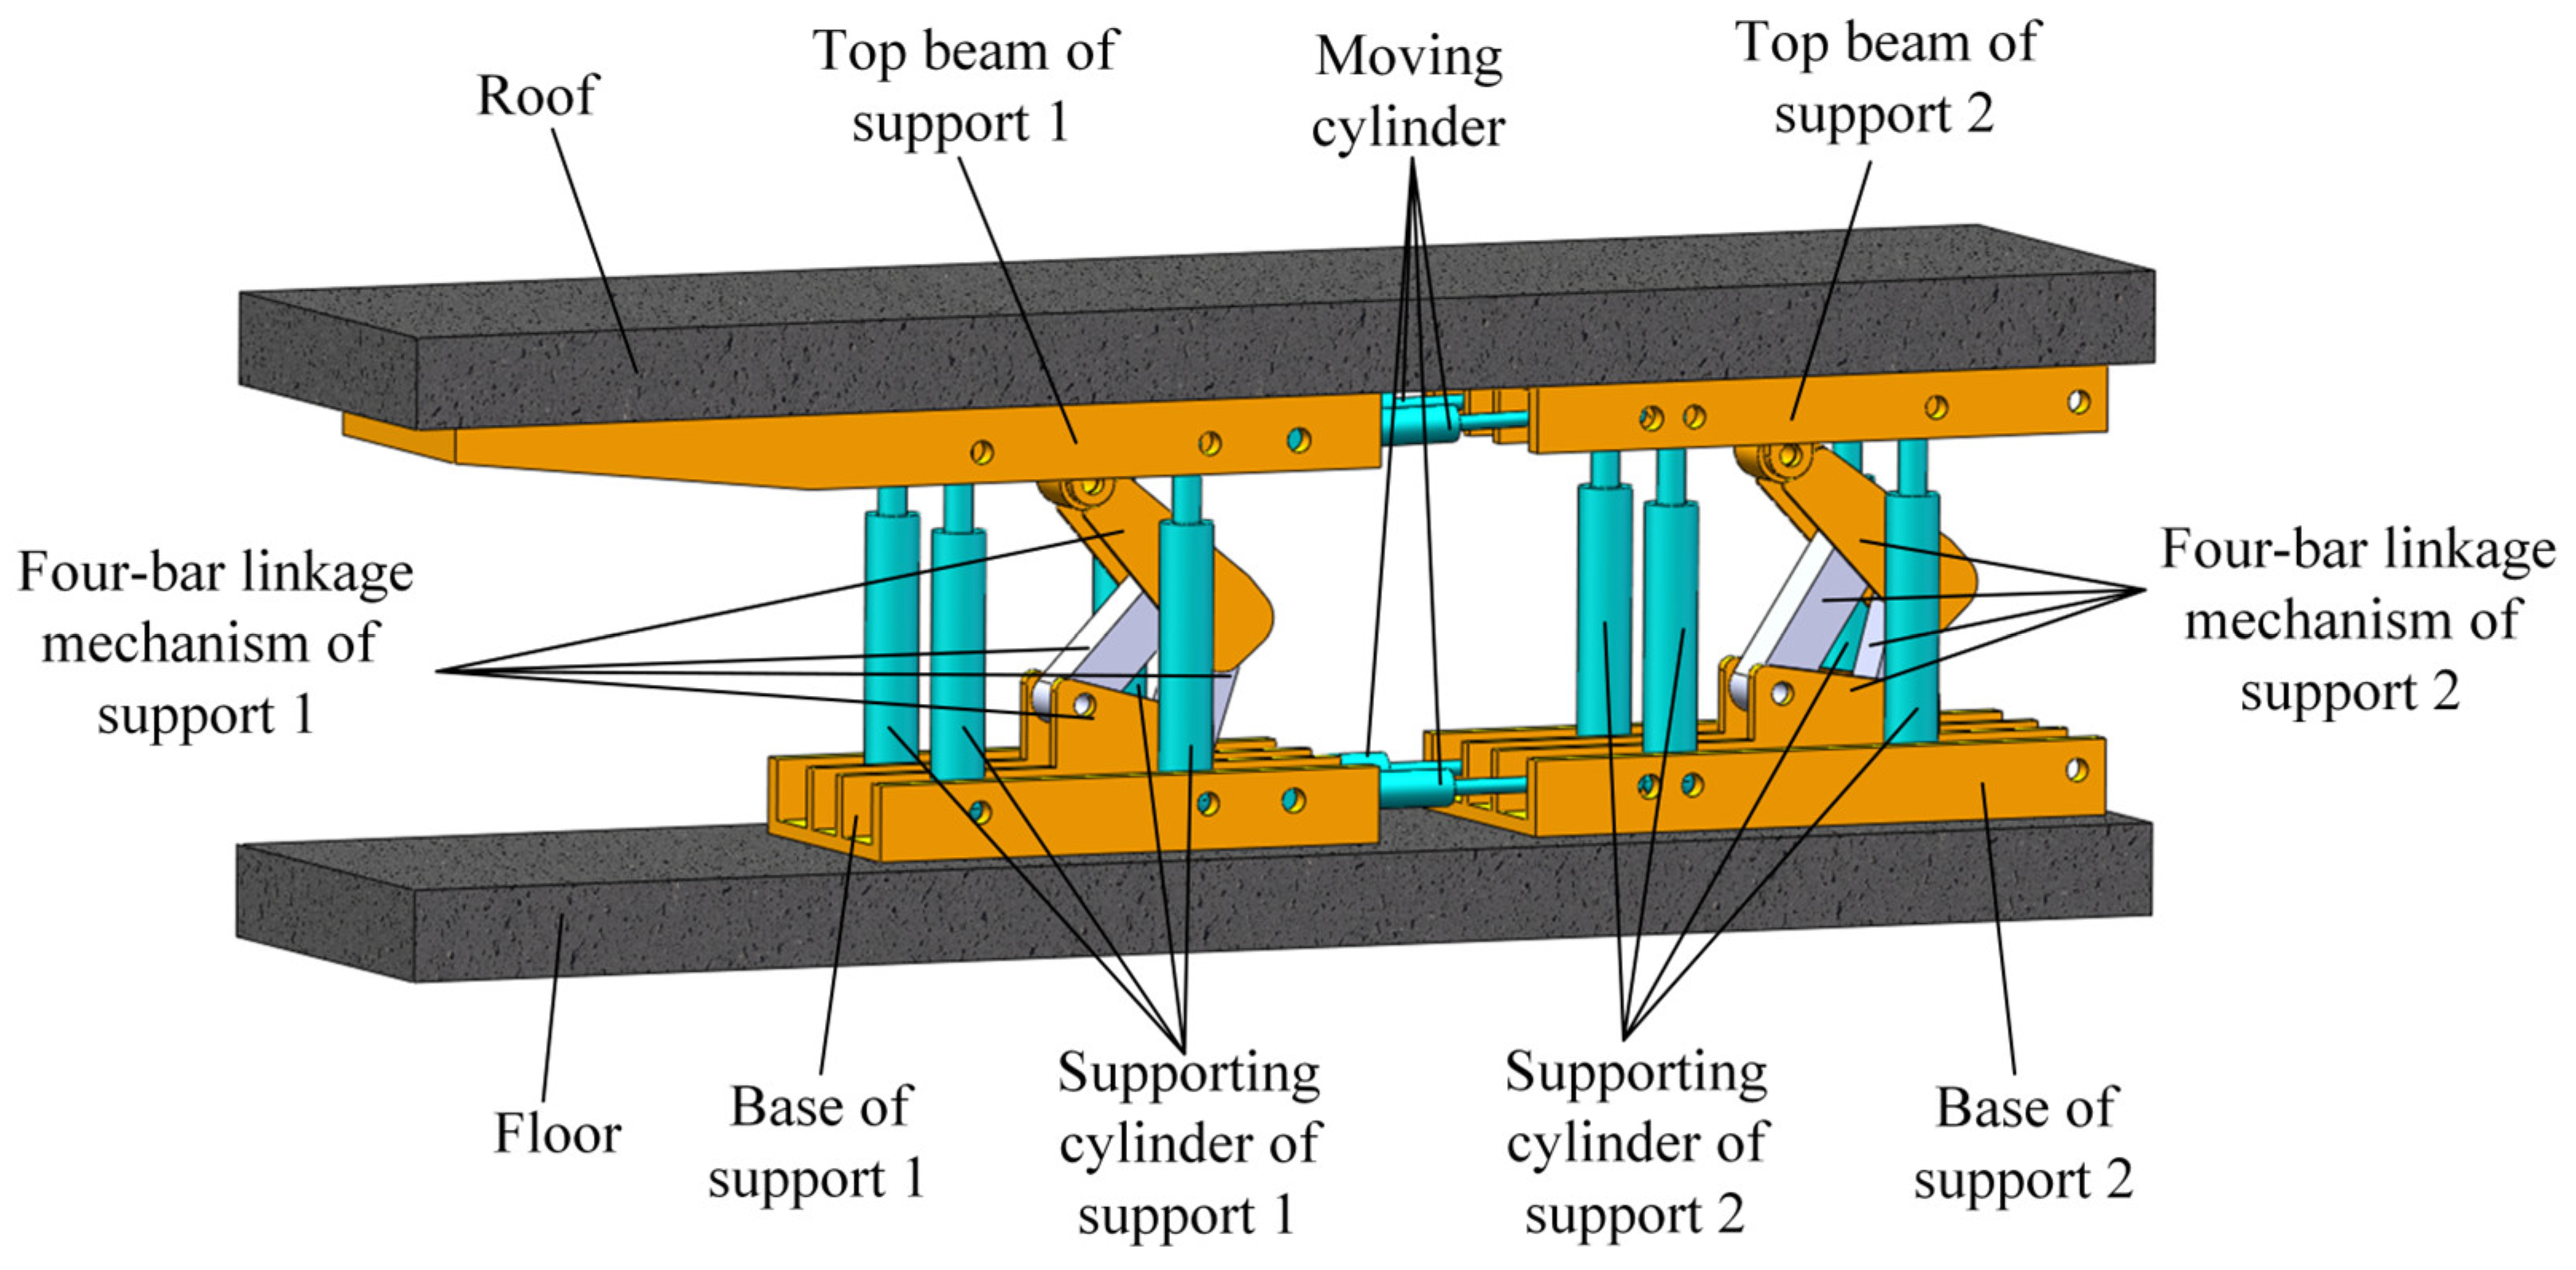
To analyze whether the stresses on the TSR itself and the floor under stable support conditions meet the strength requirements, the stress characteristics of the floor and the TSR were simulated and analyzed using finite element analysis. In the finite element analysis process, the model constructed in
Section 2.3 of the TSR was imported into the ANSYS Workbench 2023 R1 software, omitting non-load-bearing components such as support columns; small structures like lifting rings and mounting holes were ignored; the effects of rounded corners and welding on the load-bearing characteristics of the support were not considered; and equivalent loads were used to replace the column structure. The relevant parameters of the simulation model are consistent with those described in
Section 4.1.
According to the actual working environment of the TSR, appropriate parameters are selected, and the relevant parameters are shown in
Table 4. Based on this, the automatic mesh generation function in the software was used to mesh the simulation models of the TSR and its corresponding floor, resulting in a finite element model with 29,282 elements and 13,631 nodes for support 1, and a model with 25,762 elements and 11,204 nodes for support 2. When the TSR achieves a bottom pressure of 0.2 MPa, it can be calculated using the pressure formula and Equation (2) that the bottom pressure of support 1 on the roof is approximately 0.1 MPa. Similarly, when the TSR reaches a bottom pressure of 0.2 MPa, it can be calculated using the pressure formula and Equation (5) that the bottom pressure of support 2 on the roof is approximately 0.18 MPa. Based on the model shown in
Figure 4, a simulation analysis of the load on the top beam was conducted, as illustrated in
Figure 4 and
Figure 10.
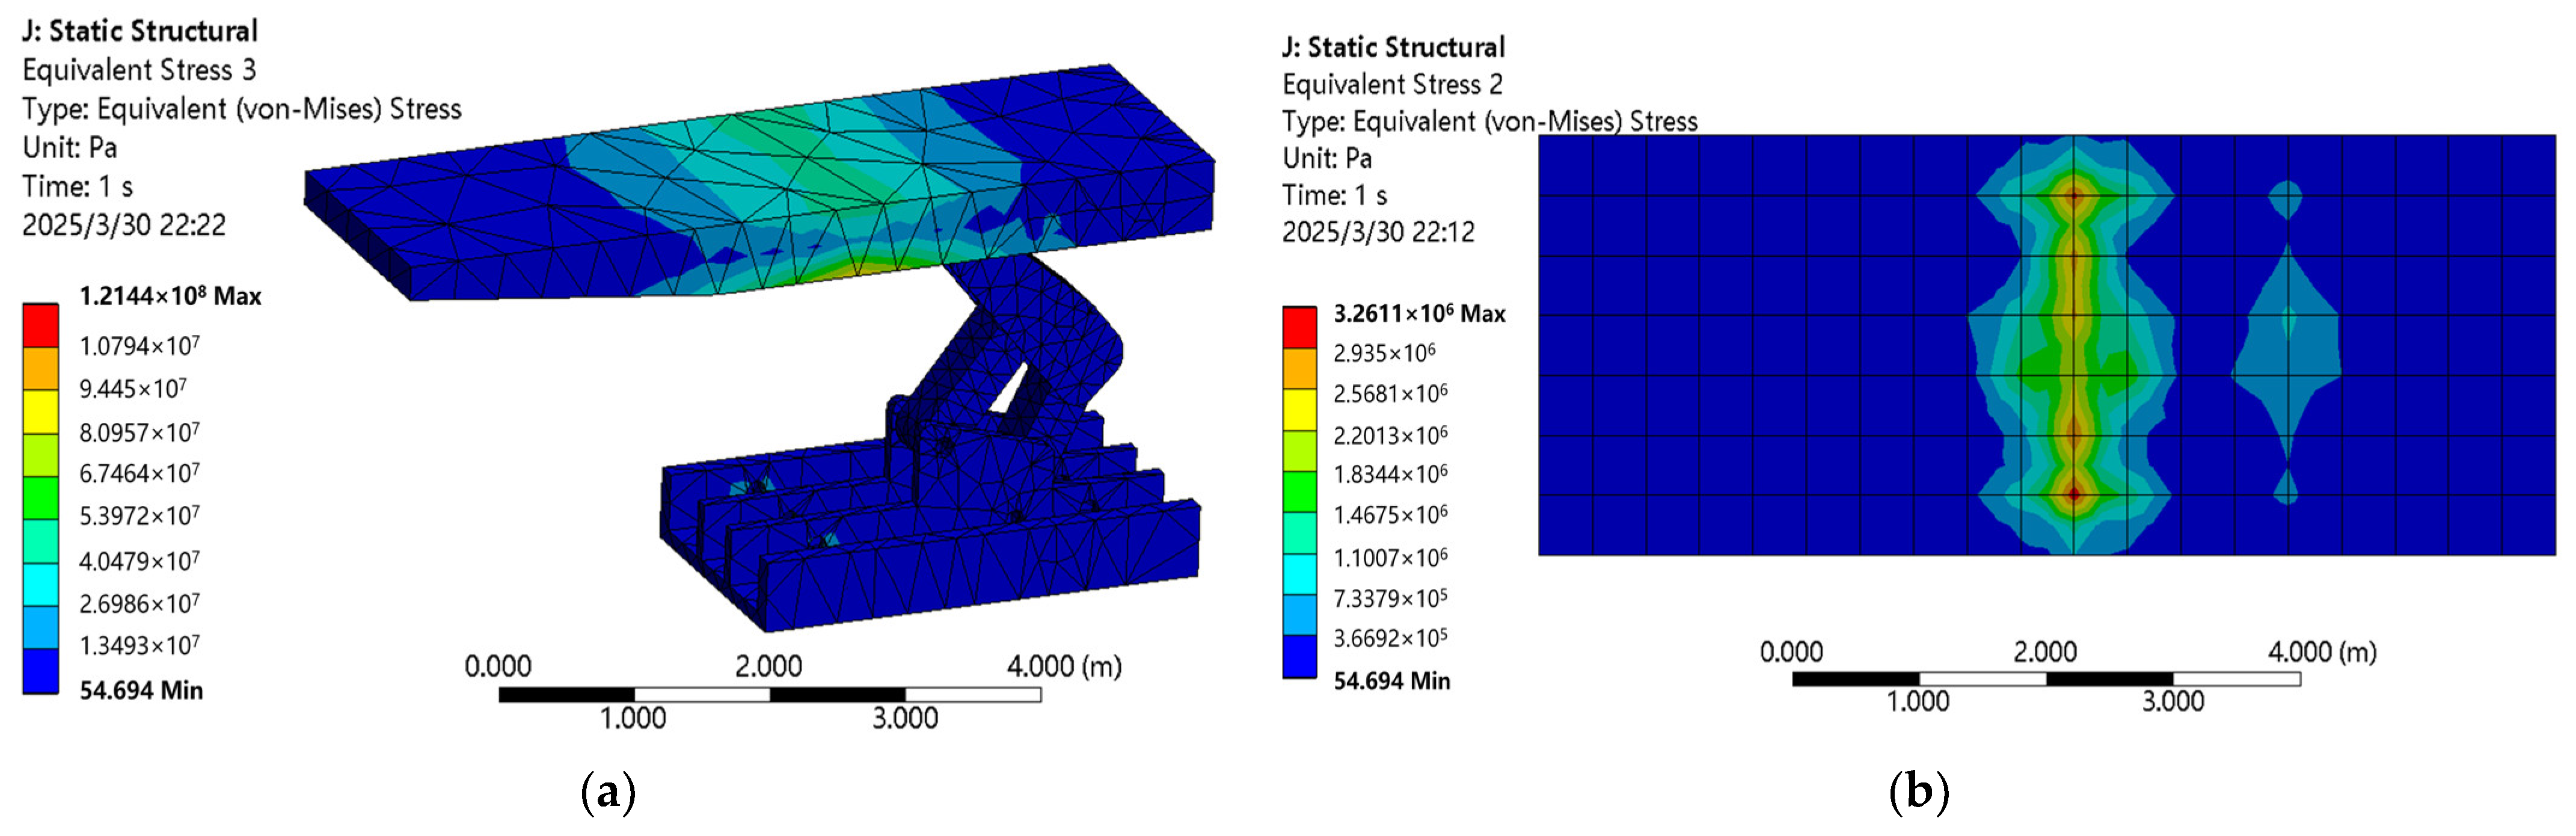
Figure 10 shows the simulation results under a uniform load of 0.1 MPa applied to the top beam of support 1, where
Figure 10a represents the stress cloud diagram of support 1 and
Figure 10b represents the stress cloud diagram of the floor under support 1.
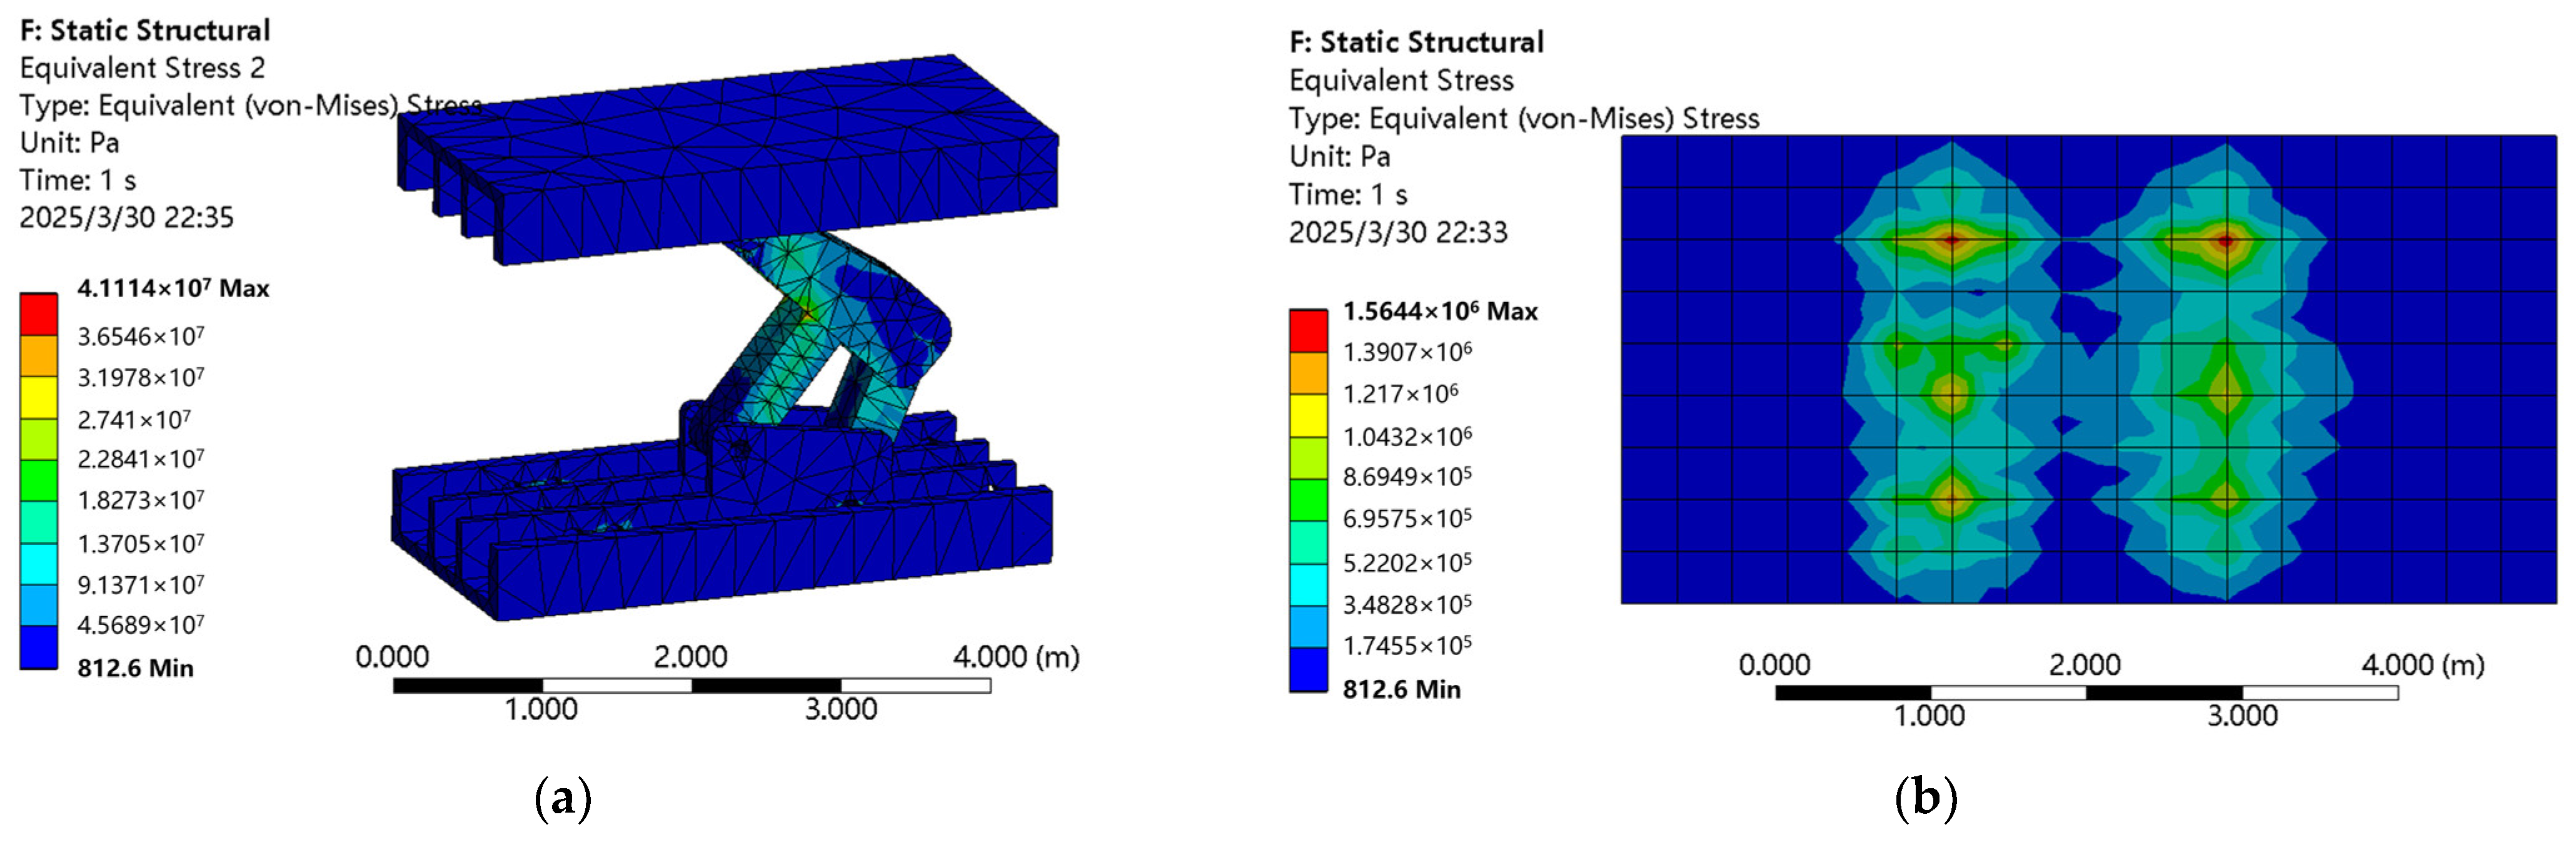
Figure 11 shows the simulation results under a uniform load of 0.18 MPa applied to the top beam of support 2, with
Figure 11a representing the stress cloud diagram of support 2 and
Figure 11b representing the stress cloud diagram of the floor under support 2.
From
Figure 10a, it can be seen that under a uniform load of 0.1 MPa applied to the top beam of support 1, the overall stress on support 1 is within the range of 121 MPa, which is below the yield strength of Q690. The peak stress is concentrated on the rib plate at the hinge between the top beam and the support cylinder, indicating that this part of the structure is more prone to damage under these conditions. The displacement of support 1 is within the range of 11 mm. From
Figure 10b, it can be seen that regarding the stress conditions of the floor, the stress on the surface of the floor is within the range of 3.26 MPa, which is below the uniaxial compressive strength limit of the floor material. The peak stress is concentrated at the front end of the base of support 1. Therefore, under the 0.1 MPa loading condition on the top beam, the stress on the structure of support 1 is less than the yield strength of its material, meeting the strength requirements of the support, and the stress value on the floor is less than its uniaxial compressive strength, ensuring that the floor will not be damaged.
From
Figure 11a, it can be seen that under a uniform load of 0.18 MPa applied to the top beam of support 2, the overall stress on support 2 is within the range of 41 MPa, with a peak value below the yield strength of Q690, concentrated on the four-bar mechanism, indicating that this part of the structure is more prone to damage under these conditions. From
Figure 11b, it can be noted that regarding the stress conditions of the floor, the stress on the surface of the floor is within the range of 1.56 MPa, which is below the uniaxial compressive strength limit of the floor material, with peaks mainly concentrated at the installation position of the support cylinder on the base of support 2. Therefore, under a loading condition of 0.18 MPa, the stress on the structure of support 2 is less than the yield strength of its material, satisfying the strength requirements of the support, and the stress value on the floor is less than its uniaxial compressive strength, ensuring that the floor will not be damaged.
4.3. Critical Value Simulation of Boundary Conditions for Driving Under Pressure Dynamic Model
Import the model constructed in
Section 2.3 of the TSR into the Adams View 2018 software. The driving under pressure process of support 1 and support 2 is simulated and analyzed using the Adams software to obtain the pushing force of the moving cylinder and the critical values of the movement of support 1 and support 2 to verify the accuracy of the boundary conditions of the driving under pressure dynamic model. The relevant parameters of the simulation model are consistent with those described in
Section 4.1. The contact stiffness between the surrounding rock and the TSR is 1 × 10⁸ N/m, the damping coefficient is 1 × 10
5 Ns/m, and the penetration depth is 0.1 mm.
When support 1 is in the state of driving under pressure, it is known from the value range of the specific pressure of the base of support 1 against the floor, 0.056 MPa <
P12d < 0.22 MPa, that the specific pressure
P12d of the base of support 1 against the floor falls within the range of the maximum allowable specific pressure of 0.2 MPa for the contact between the TSR and the surrounding rock, enabling driving under pressure action. Therefore, two cases,
P12d = 0.1 MPa and
P12d = 0.2 MPa, are used for the simulation analysis. When support 2 is stably supporting, its base is under the specific pressure P
22s = 0.2 MPa. Assuming
F1 =
F2 and
F3 =
F4, it can be calculated from Equations (2) and (5) that the working resistance of each supporting cylinder of support 2 is approximately 423 kN, and the maximum friction force generated by contact with the surrounding rock is approximately 1033 kN. When
P12d = 0.1 MPa, the specific pressure of the top beam of support 1 against the roof,
P11d, is approximately 0.045 MPa, satisfying the support conditions. Currently, each supporting cylinder of support 1 has a working resistance of approximately 175.5 kN, and the maximum friction force generated by contact with the surrounding rock is 427 kN. When
P12d = 0.2 MPa, the specific pressure of the top beam of support 1 against the roof,
P11d, is approximately 0.1 MPa, satisfying the support conditions. Currently, each supporting cylinder of support 1 has a working resistance of approximately 376 kN, and the maximum friction force generated by contact with the surrounding rock is 907 kN. A gradually increasing pushing force is applied synchronously to the four moving cylinders for simulation, and the variation in the displacement of support 1 and support 2, as well as the friction between them and the surrounding rock with the resultant pushing force, are shown in
Figure 12 and
Figure 13.
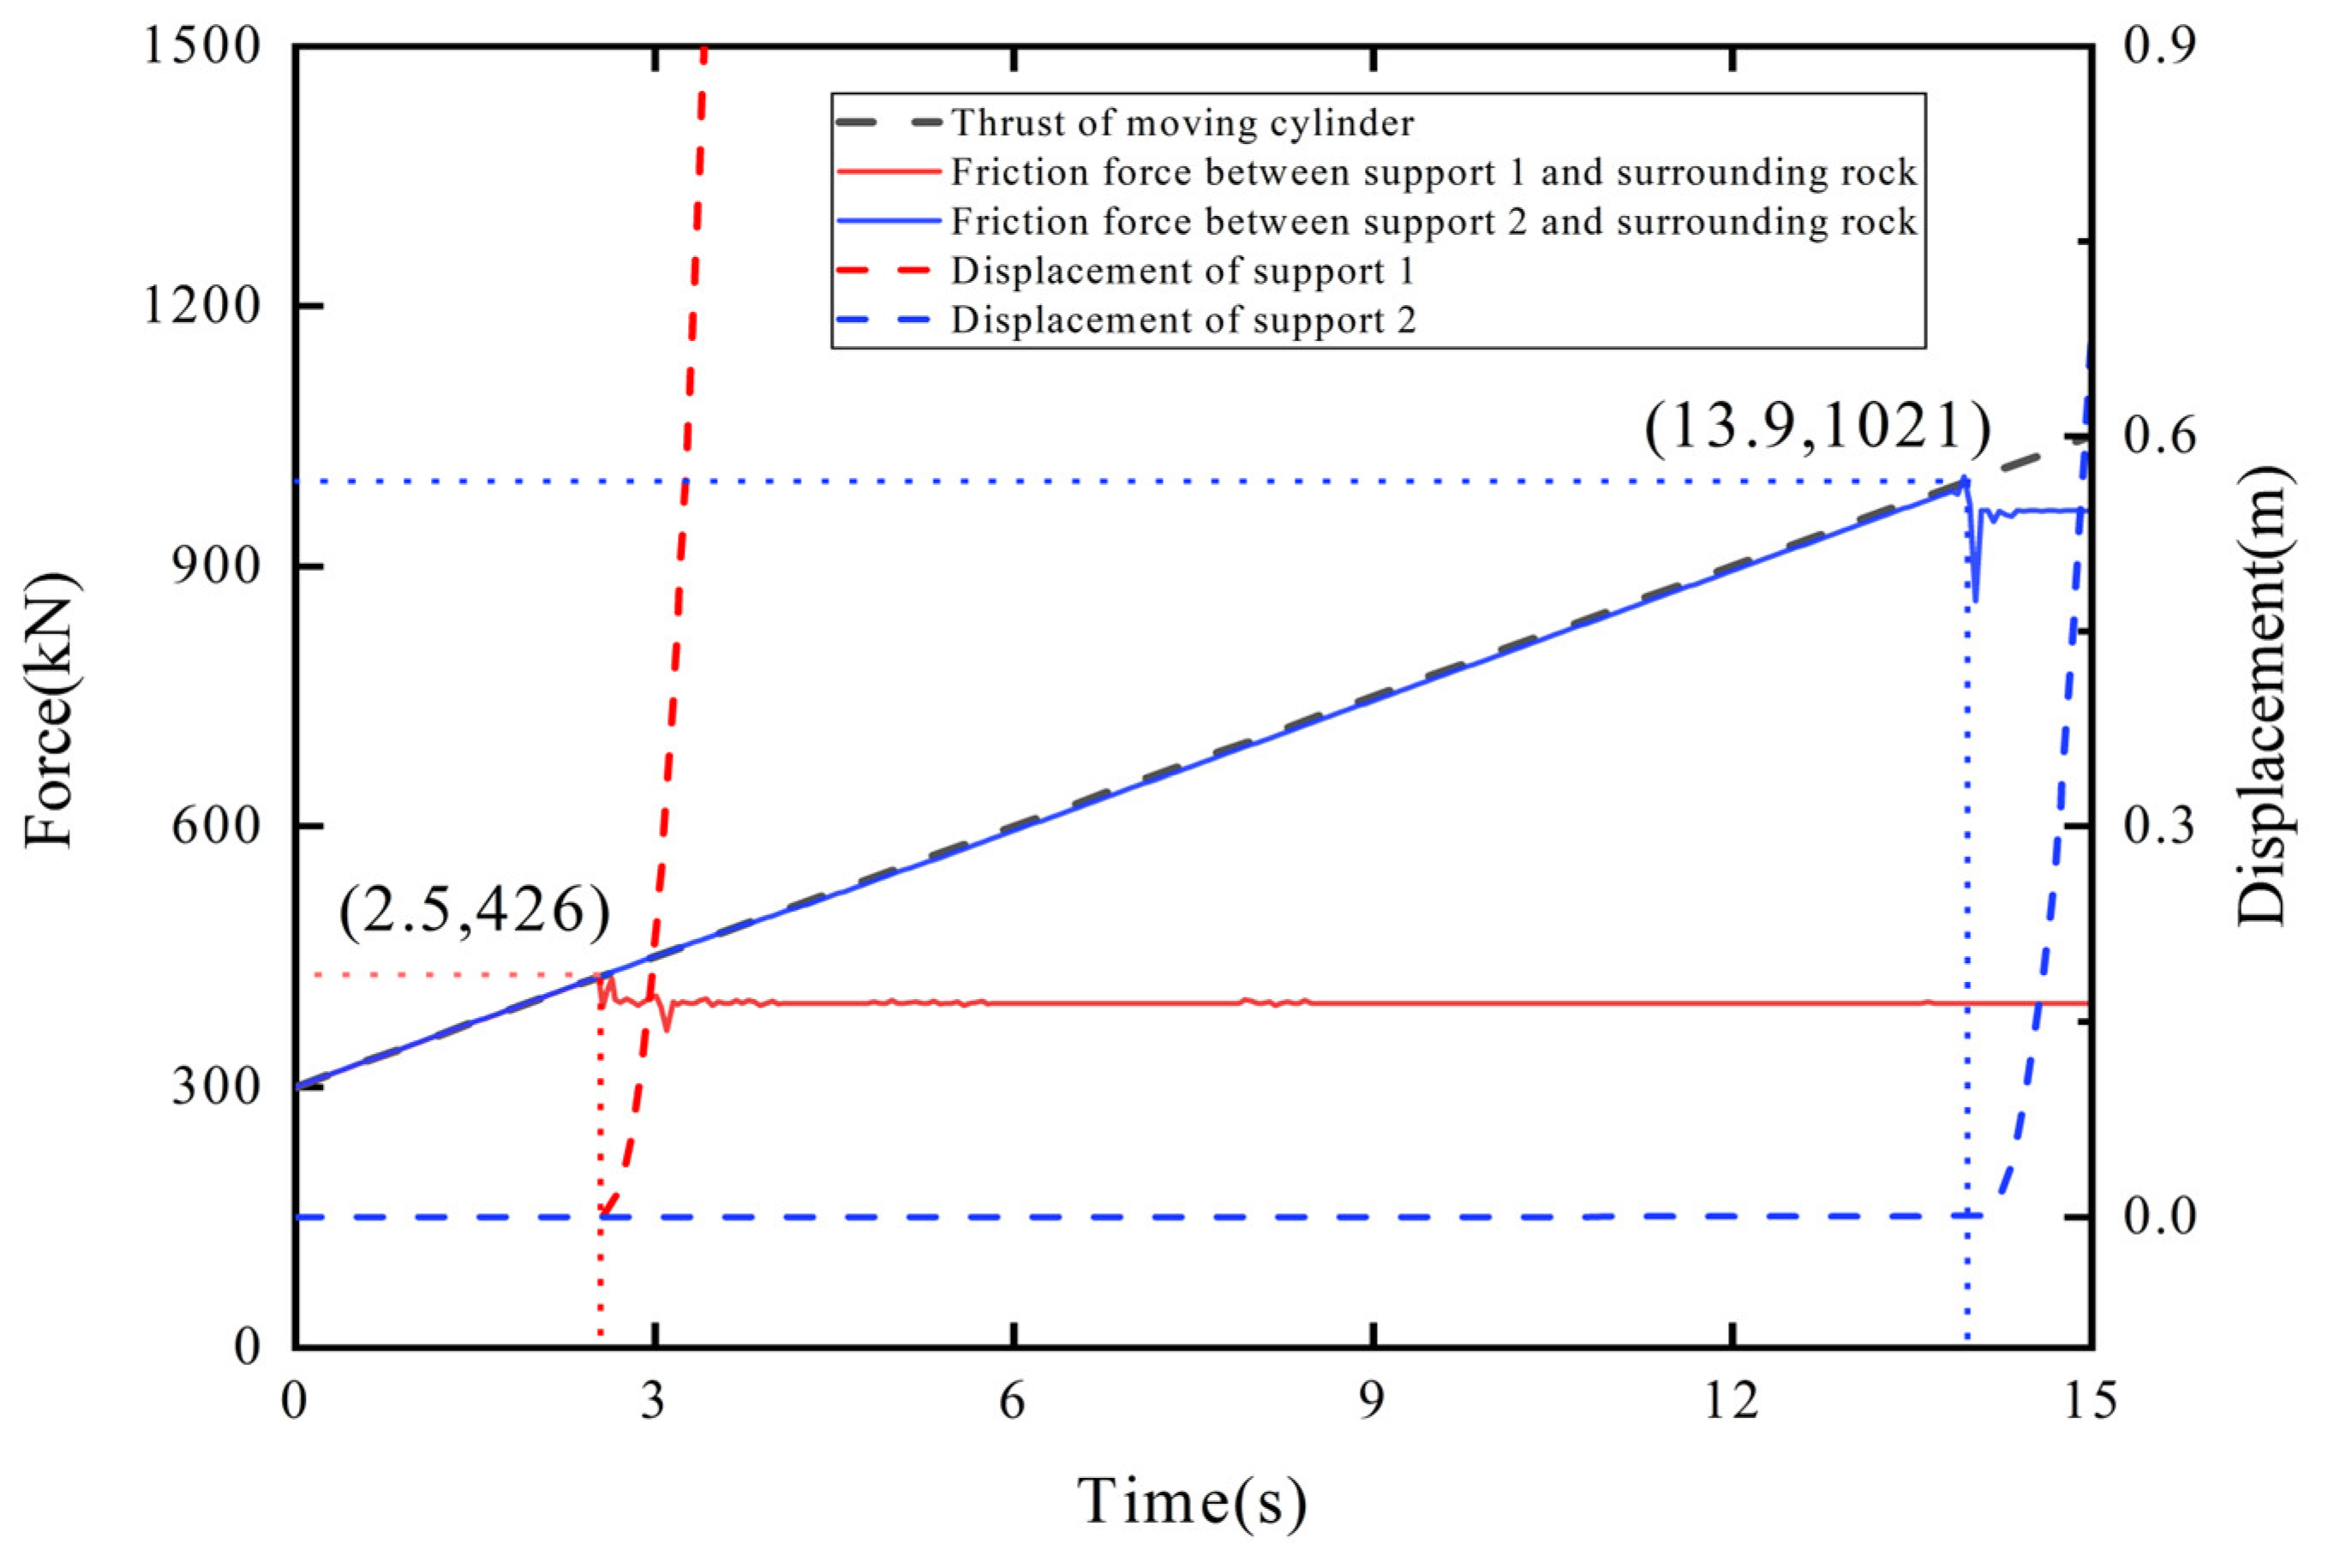
Analyzing
Figure 12, it can be seen that under the condition that the specific pressure of the base of support 1 against the floor is
P12d = 0.1 MPa, when the pushing force of the moving cylinder exceeds 426 kN, the friction force between support 1 and the surrounding rock reaches its maximum value, and support 1 begins to move. The friction force between support 2 and the surrounding rock continues to increase with the pushing force of the moving cylinder, and support 2 remains stationary. At this time, support 1 can normally drive under pressure. When the pushing force of the moving cylinder exceeds 1021 kN, the friction force between support 2 and the surrounding rock reaches its maximum value, and support 2 begins to move. At this time, support 1 cannot drive under pressure. Analyzing
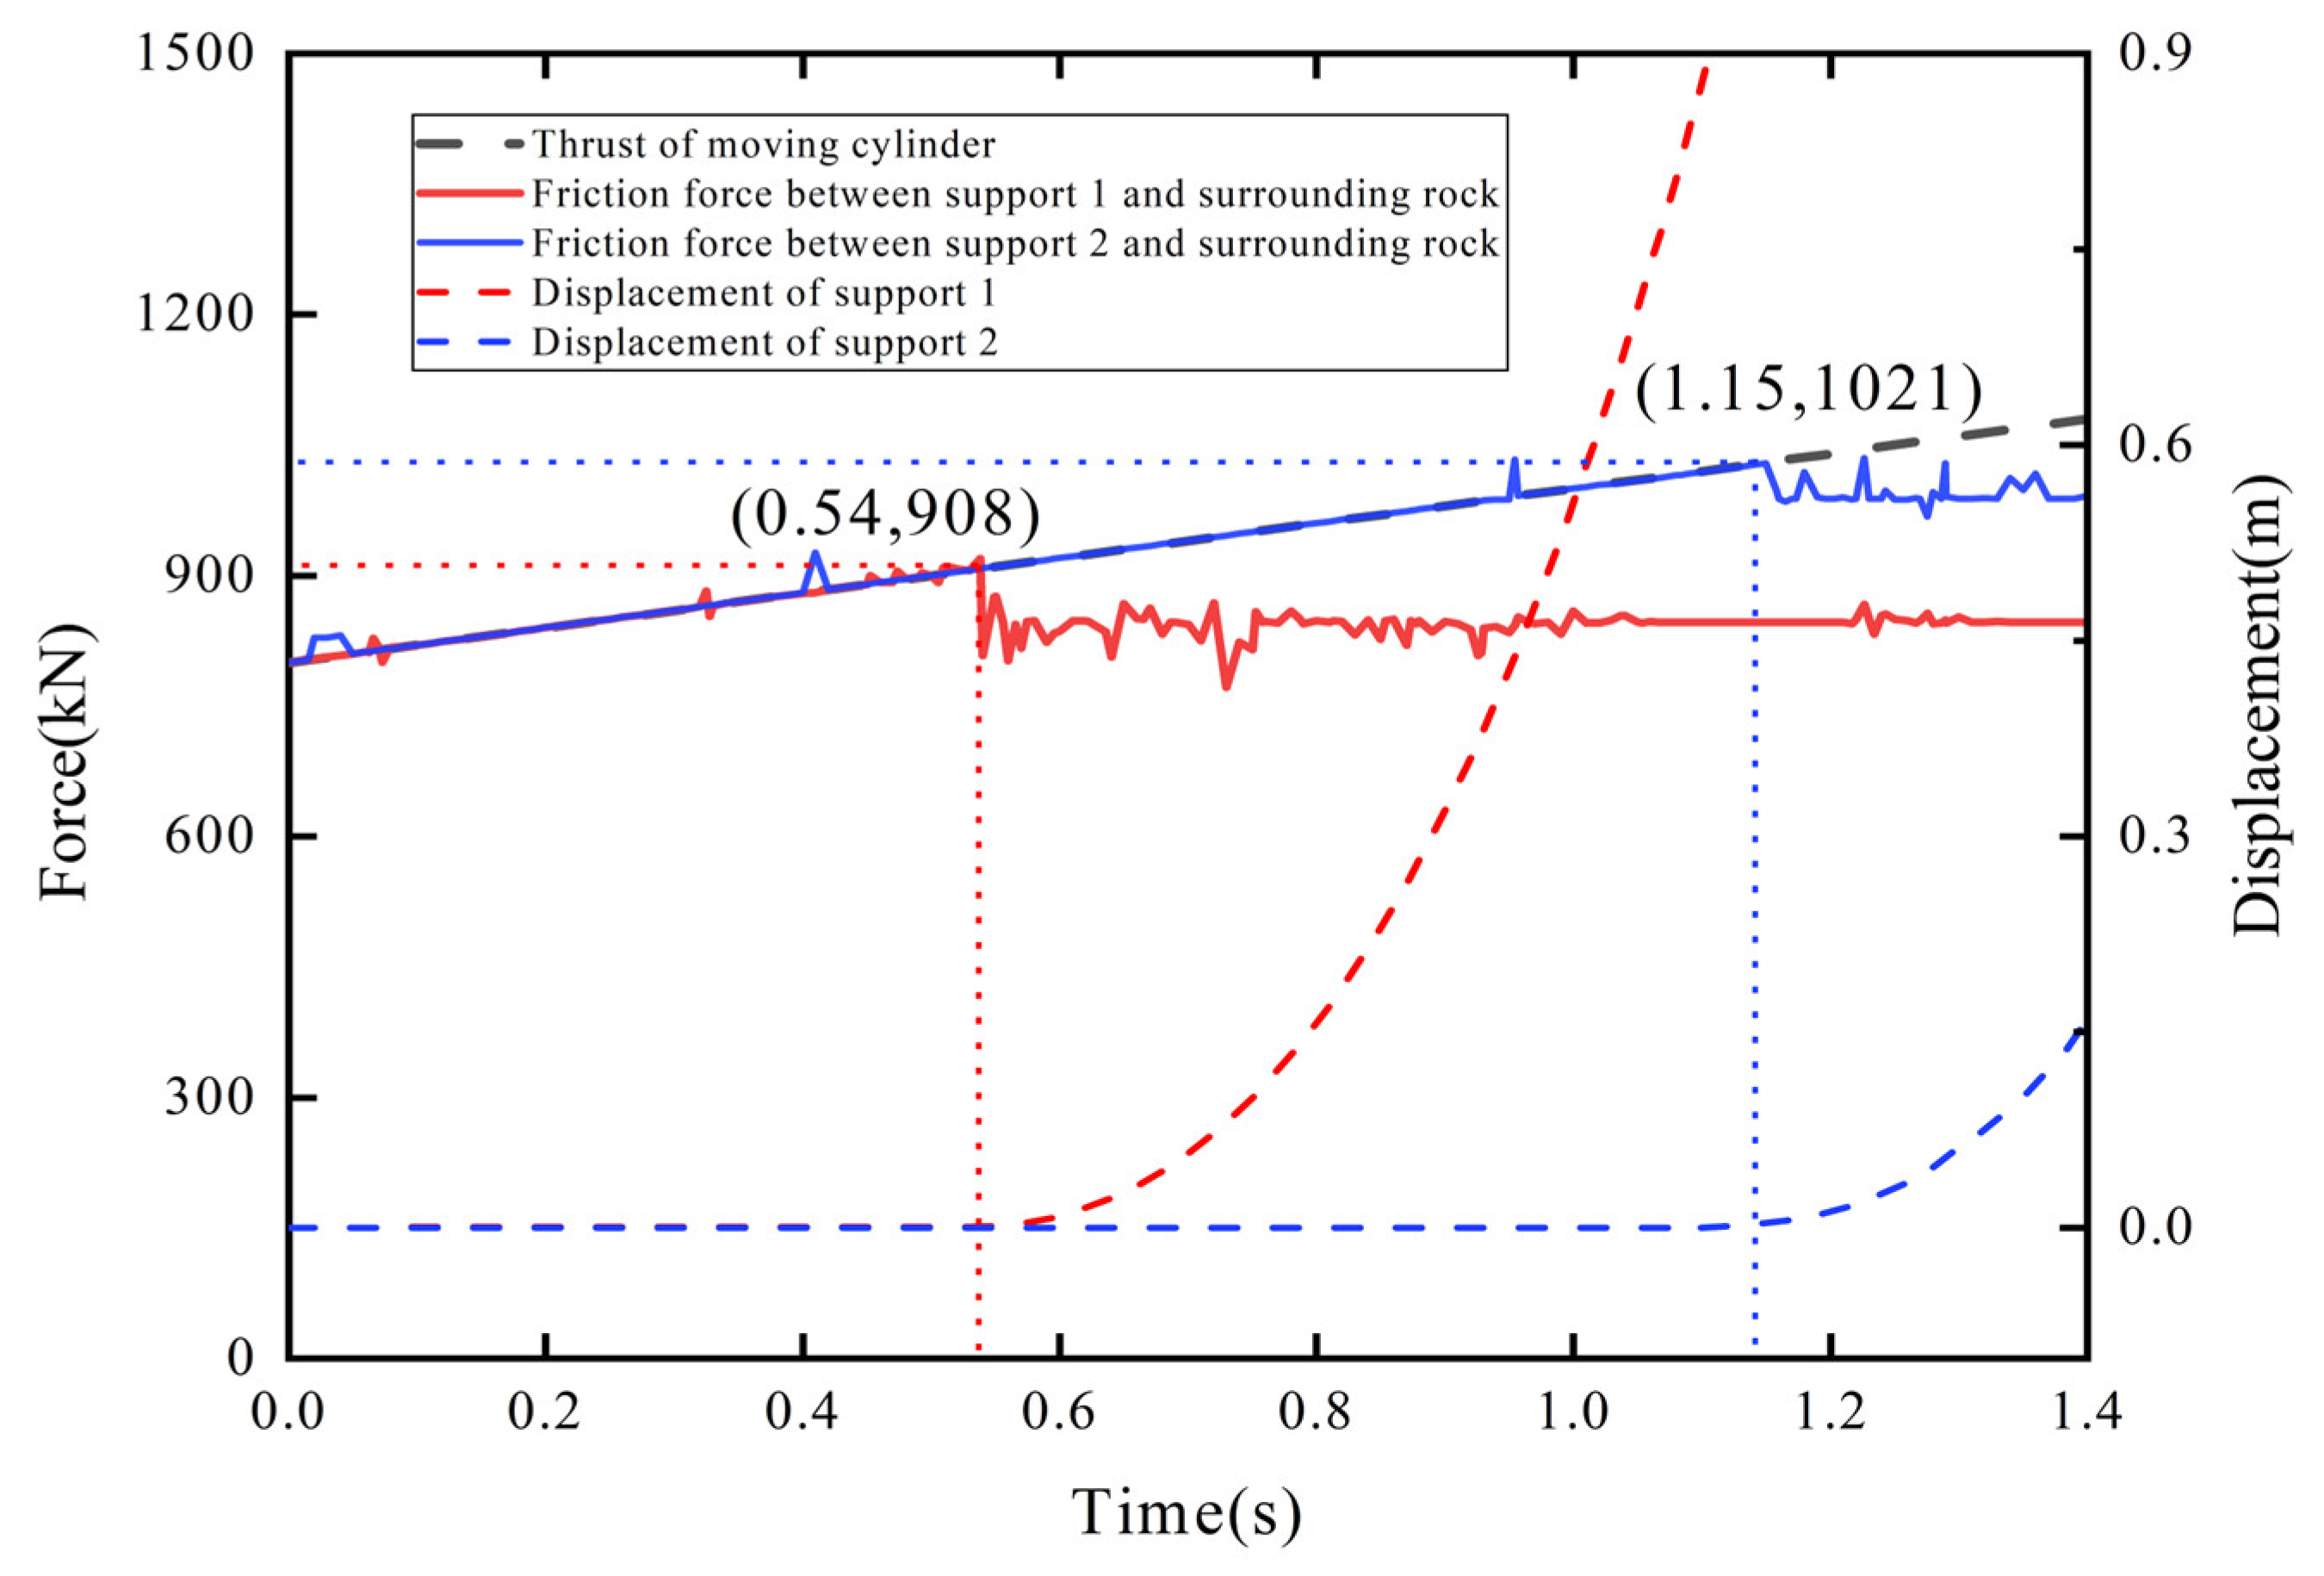
Figure 13, it can be seen that under the condition that the specific pressure of the base of support 1 against the floor is
P12d = 0.2 MPa when the pushing force of the moving cylinder exceeds 908 kN, the friction force between support 1 and the surrounding rock reaches its maximum value, and support 1 begins to move. The friction force between support 2 and the surrounding rock continues to increase with the pushing force of the moving cylinder, and support 2 remains stationary. At this time, support 1 can normally drive under pressure. When the pushing force of the moving cylinder exceeds 1031 kN, the friction force between support 2 and the surrounding rock reaches its maximum value, and support 2 begins to move. At this time, support 1 cannot drive under pressure. Compared with the theoretical values, the maximum error of the maximum friction force between support 1 and support 2 and the surrounding rock obtained by simulation is 1.2%, less than 5%.
When support 2 is in the state of driving under pressure, it is known from the value range of the specific pressure of the base of support 2 against the floor, 0.038 MPa <
P22d < 0.17 MPa, that support 2 is in the state of driving under pressure when the specific pressure
P22d of the base of support 2 against the floor is taken in the range of 0.038 MPa to 0.17 MPa; support 2 cannot drive under pressure when the specific pressure
P22d of the base of support 2 against the floor is taken in the range of 0.17 MPa to 0.2 MPa. Therefore, two cases,
P22d = 0.1 MPa and
P22d = 0.19 MPa, are used for the simulation analysis. When support 1 is stably supporting, its base is under the specific pressure P
12s = 0.2 MPa. Assuming
F1 =
F2 and
F3 =
F4, it can be calculated from Equations (2) and (5) that each supporting cylinder of support 1 has a working resistance of approximately 376 kN, and the maximum friction force generated by contact with the surrounding rock is approximately 908 kN. When
P22d = 0.1 MPa, the specific pressure of the top beam of support 2 against the roof, P
21d, is approximately 0.082 MPa, satisfying the support conditions. Each supporting cylinder of support 2 has a working resistance of approximately 198 kN, and the maximum friction force generated by contact with the surrounding rock is 492 kN. When
P22d = 0.19 MPa, the specific pressure of the top beam of support 2 against the roof, P
21d, is approximately 0.17 MPa, satisfying the support conditions. Currently, each supporting cylinder of support 1 has a working resistance of approximately 401 kN, and the maximum friction force generated by contact with the surrounding rock is 979 kN. A gradually increasing pushing force is applied synchronously to the four moving cylinders for simulation, and the variation in the displacement of support 1 and support 2, as well as the friction between them and the surrounding rock with the resultant pushing force, are shown in
Figure 14 and
Figure 15.
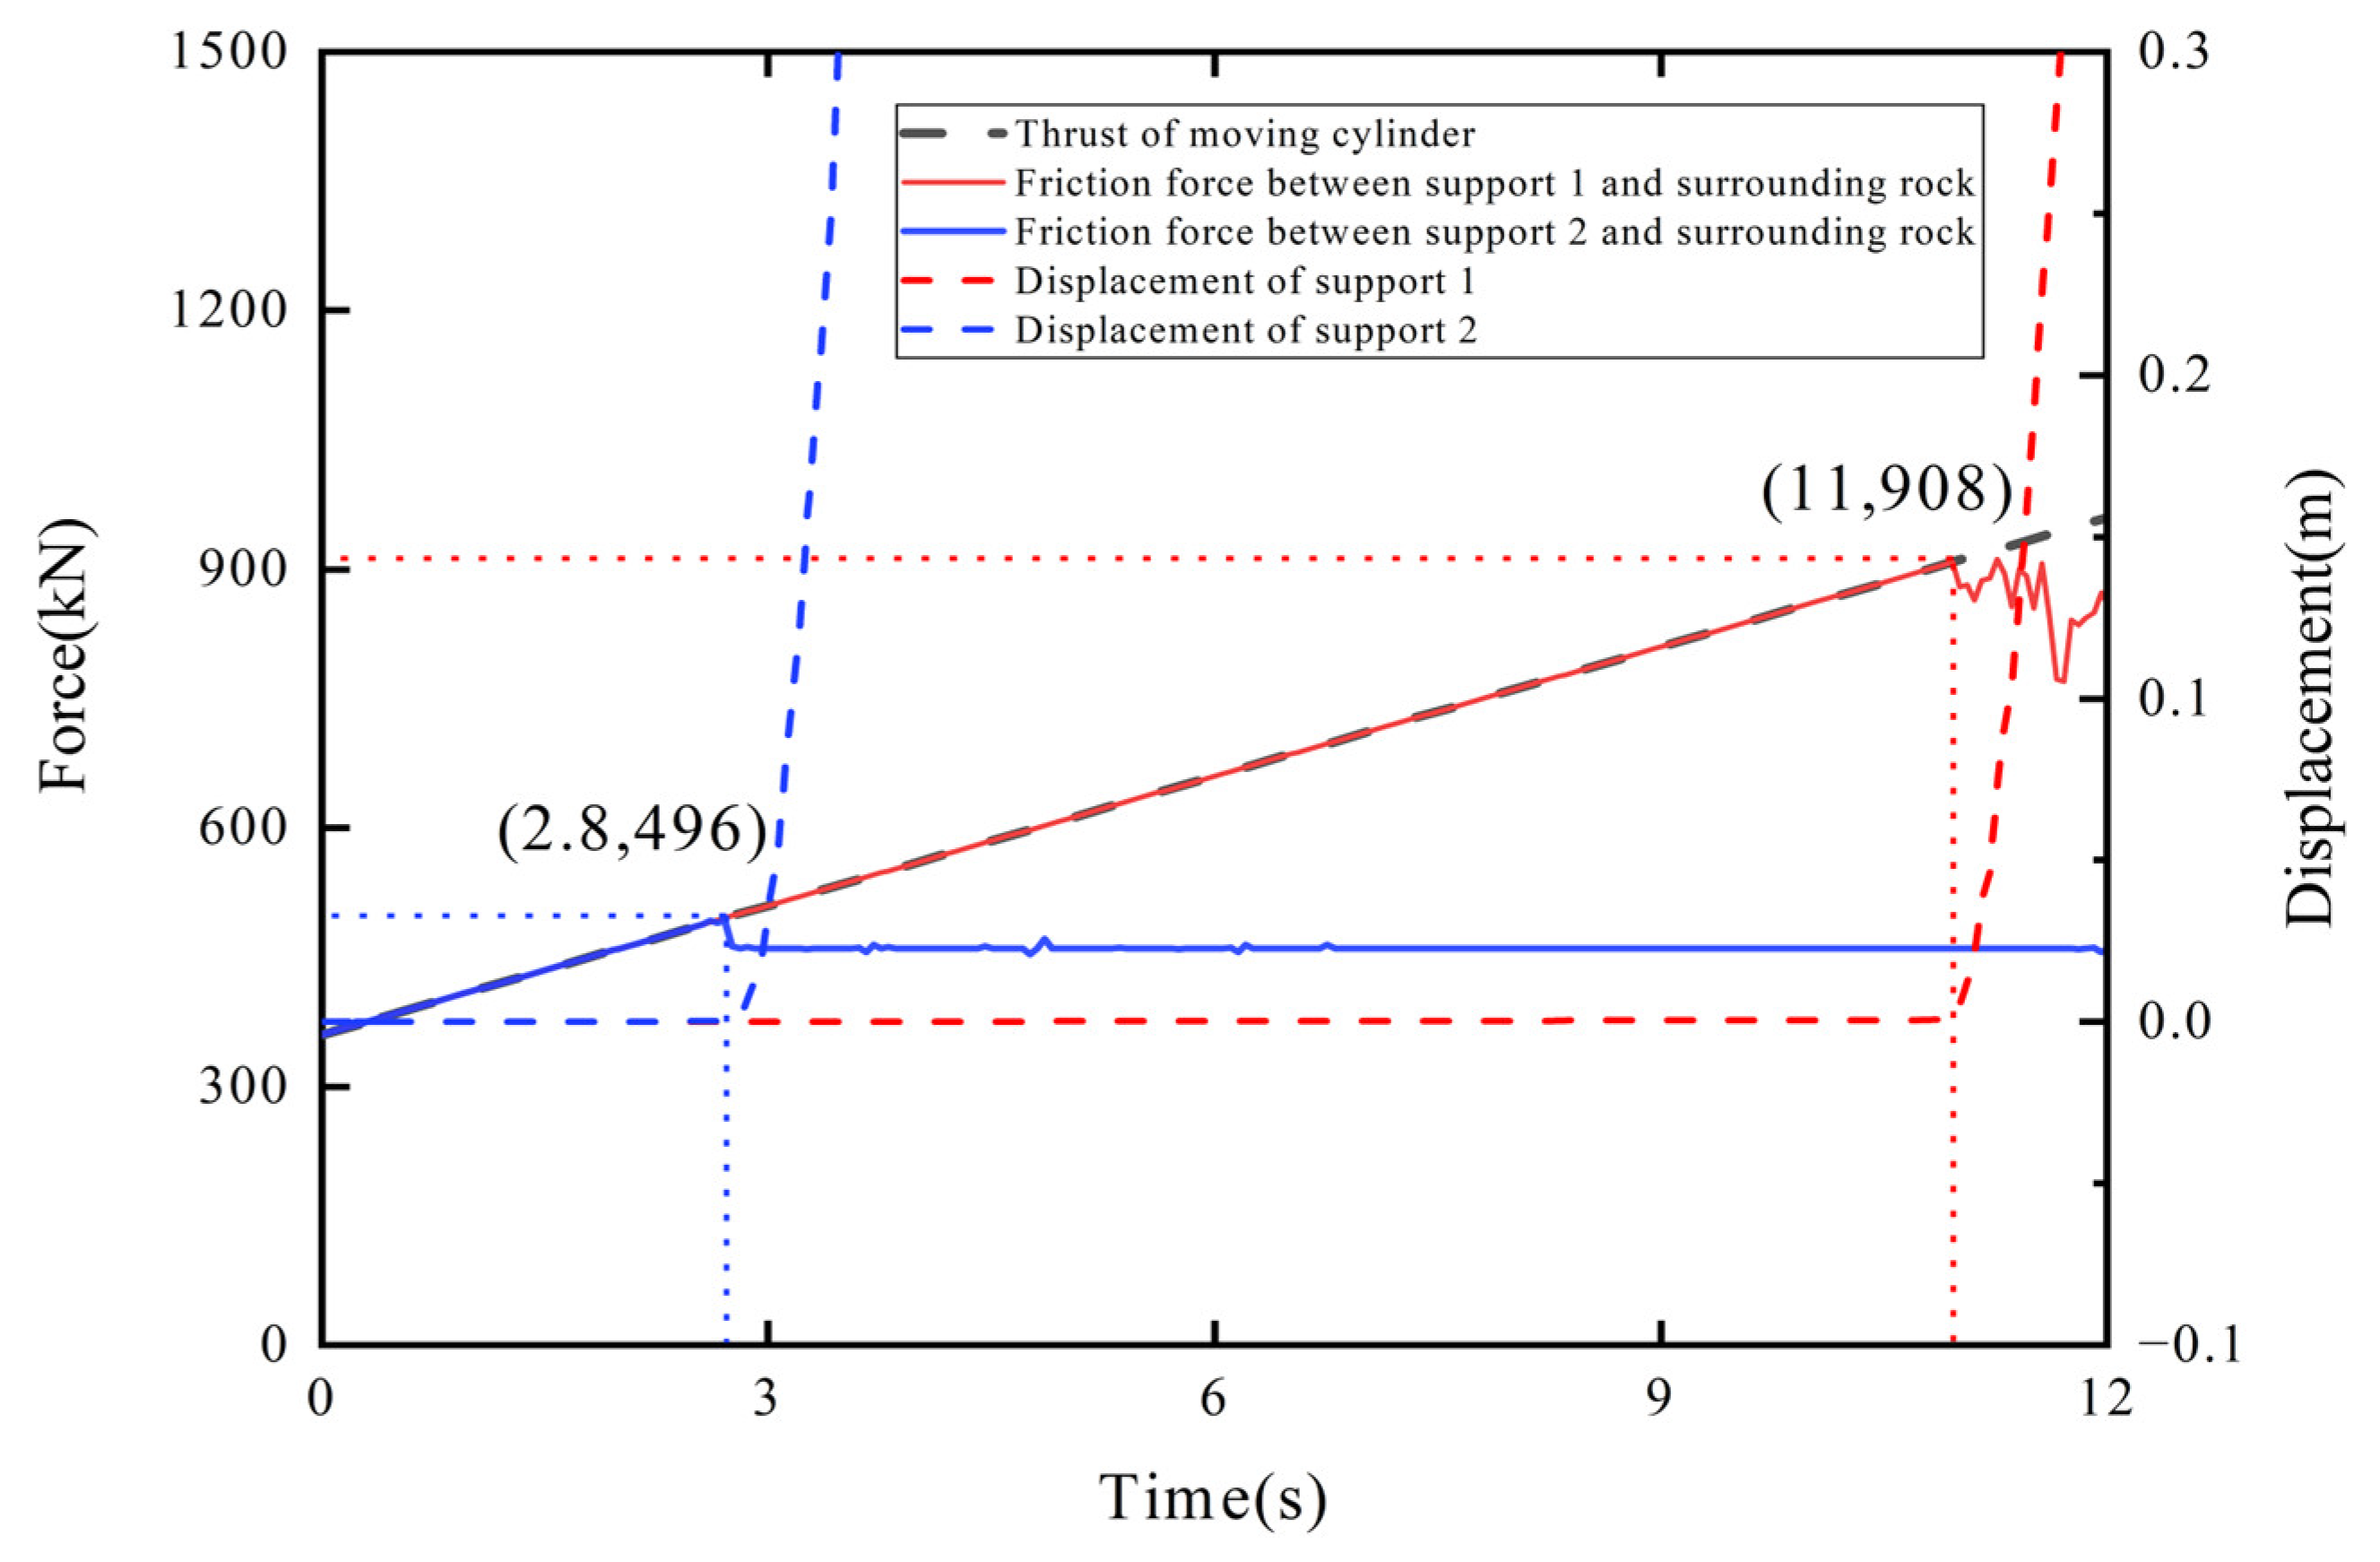
Analyzing
Figure 14, it can be seen that under the condition that the specific pressure of the base of support 2 against the floor is
P12d = 0.1 MPa, when the pulling force exceeds 496 kN, the friction force between support 2 and the surrounding rock reaches its maximum value, and support 2 begins to move. The friction force between support 1 and the surrounding rock continues to increase with the pulling force of the moving cylinder, and support 1 remains stationary. At this time, support 2 can normally drive under pressure. When the pulling force exceeds 908 kN, the friction force between support 1 and the surrounding rock reaches its maximum value, and support 1 begins to move. At this time, support 2 cannot drive under pressure.
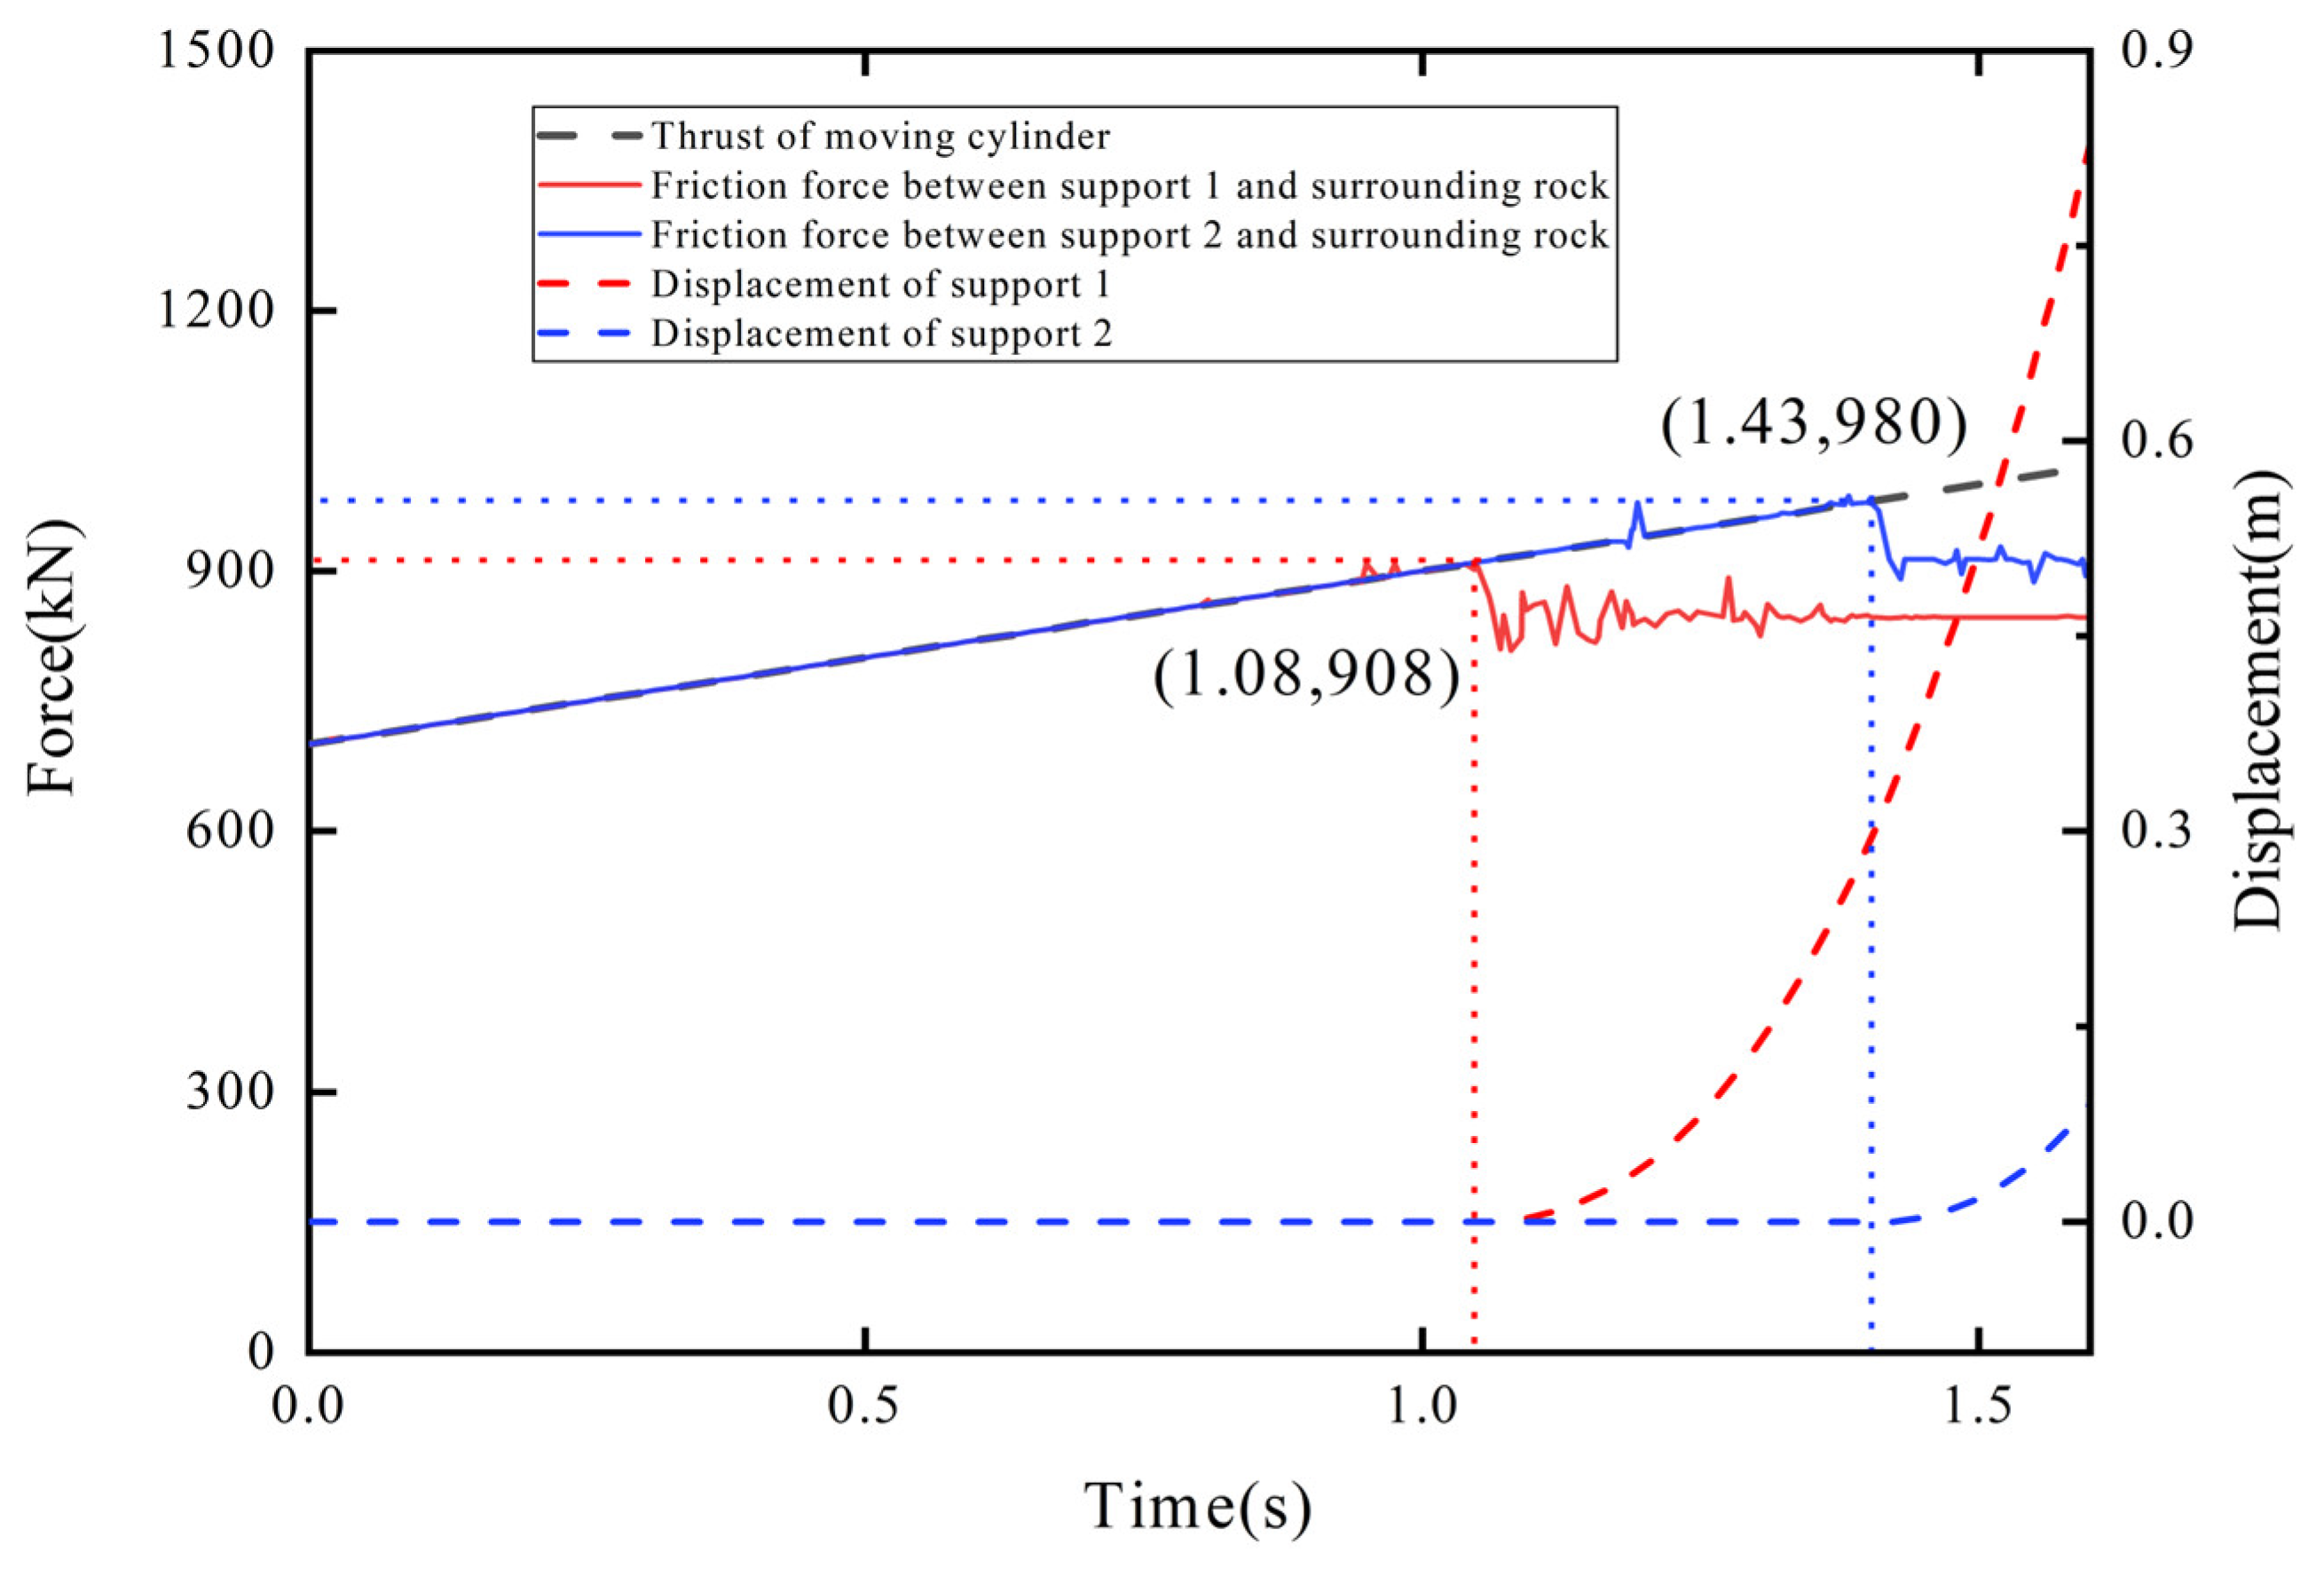
Analyzing
Figure 15, it can be seen that under the condition that the specific pressure of the base of support 2 against the floor is
P12d = 0.19 MPa when the pulling force exceeds 908 kN, the friction force between support 1 and the surrounding rock reaches its maximum value, and support 1 begins to move. The friction force between support 2 and the surrounding rock continues to increase with the pulling force of the moving cylinder, and support 2 remains stationary. When the pulling force exceeds 980 kN, the friction force between support 2 and the surrounding rock reaches its maximum value, and support 2 begins to move. Therefore, support 2 cannot be driven under pressure under this condition. Compared with the theoretical values, the maximum error of the maximum friction force between support 1 and support 2 and the surrounding rock is 1%, which is less than 5%.
4.4. Simulation of Driving Under Pressure Dynamic Model
To analyze the variation in the pushing and pulling forces of the moving cylinder, as well as the supporting force of the top beam of support 1 and support 2 on the roof, and to verify the accuracy of the dynamic model during the driving under pressure motion of support 1 and support 2, the driving under pressure process and its dynamic model of the TSR are simulated through the Adams software based on the simulation model of the boundary condition simulation experiment of the driving under pressure dynamic model taking
P12s =
P22s = 0.2 MPa. The effective area of the piston rod in the piston chamber of the push hydraulic cylinder compared to the effective area of the piston rod in the rod chamber typically ranges from 1.2 to 2. Therefore, the ratio of the thrust to the pull force provided by the push hydraulic cylinder is also between 1.2 and 2. Taking the effective area ratio of the piston chamber piston rod to the rod chamber piston rod as 1.3, during pressurized operation of the temporary support robot, in order to achieve a more rational distribution of thrust and pull force of the push hydraulic cylinder,
P12d is set to 0.1 (MPa). Based on the parameters of the virtual prototype model of the TSR, and assuming that support 1 and support 2 are in uniform motion, the maximum thrust required for support 1 is calculated to be approximately 427 (KN) using the pressure formula, Equations (2) and (9). Consequently, the maximum pull force for support II during pressurized operation is about 427/1.3 ≈ 328 (KN). Further calculations using the pressure formula, Equations (5) and (10), indicate that
P22d is approximately 0.07 (MPa), with both
P12d and
P22d remaining within their respective value ranges. And, the critical Stribeck velocity
vst = 0.01 m/s, a step function of the displacement of the moving cylinder piston rod relative to the cylinder, is constructed in the Adams software as a driver for simulation. The displacement increases from 0 m to 0.8 m within 0 to 60 s and decreases from 0.8 m to 0 m within 70 s to 130 s. The simulation time is 140 s. The displacement curve of the moving cylinder piston rod relative to the cylinder and the displacement variation in support 1 and support 2 obtained by simulation are shown in
Figure 16. Using the MATLAB R2023a software, the displacement data of support 1 and support 2 are substituted into their respective dynamic models to simulate two cases: considering the Stribeck friction theory and not considering the Stribeck friction theory (when the Stribeck friction theory is not considered, take
f1 =
f2 = 0.28). The theoretical values of the pushing and pulling forces of the moving cylinder are obtained. The force value pushing support 1 is positive, and the force value pulling support 2 is negative. The pushing and pulling forces of the moving cylinder obtained by the Adams simulation are compared with them, and the results are shown in
Figure 17.
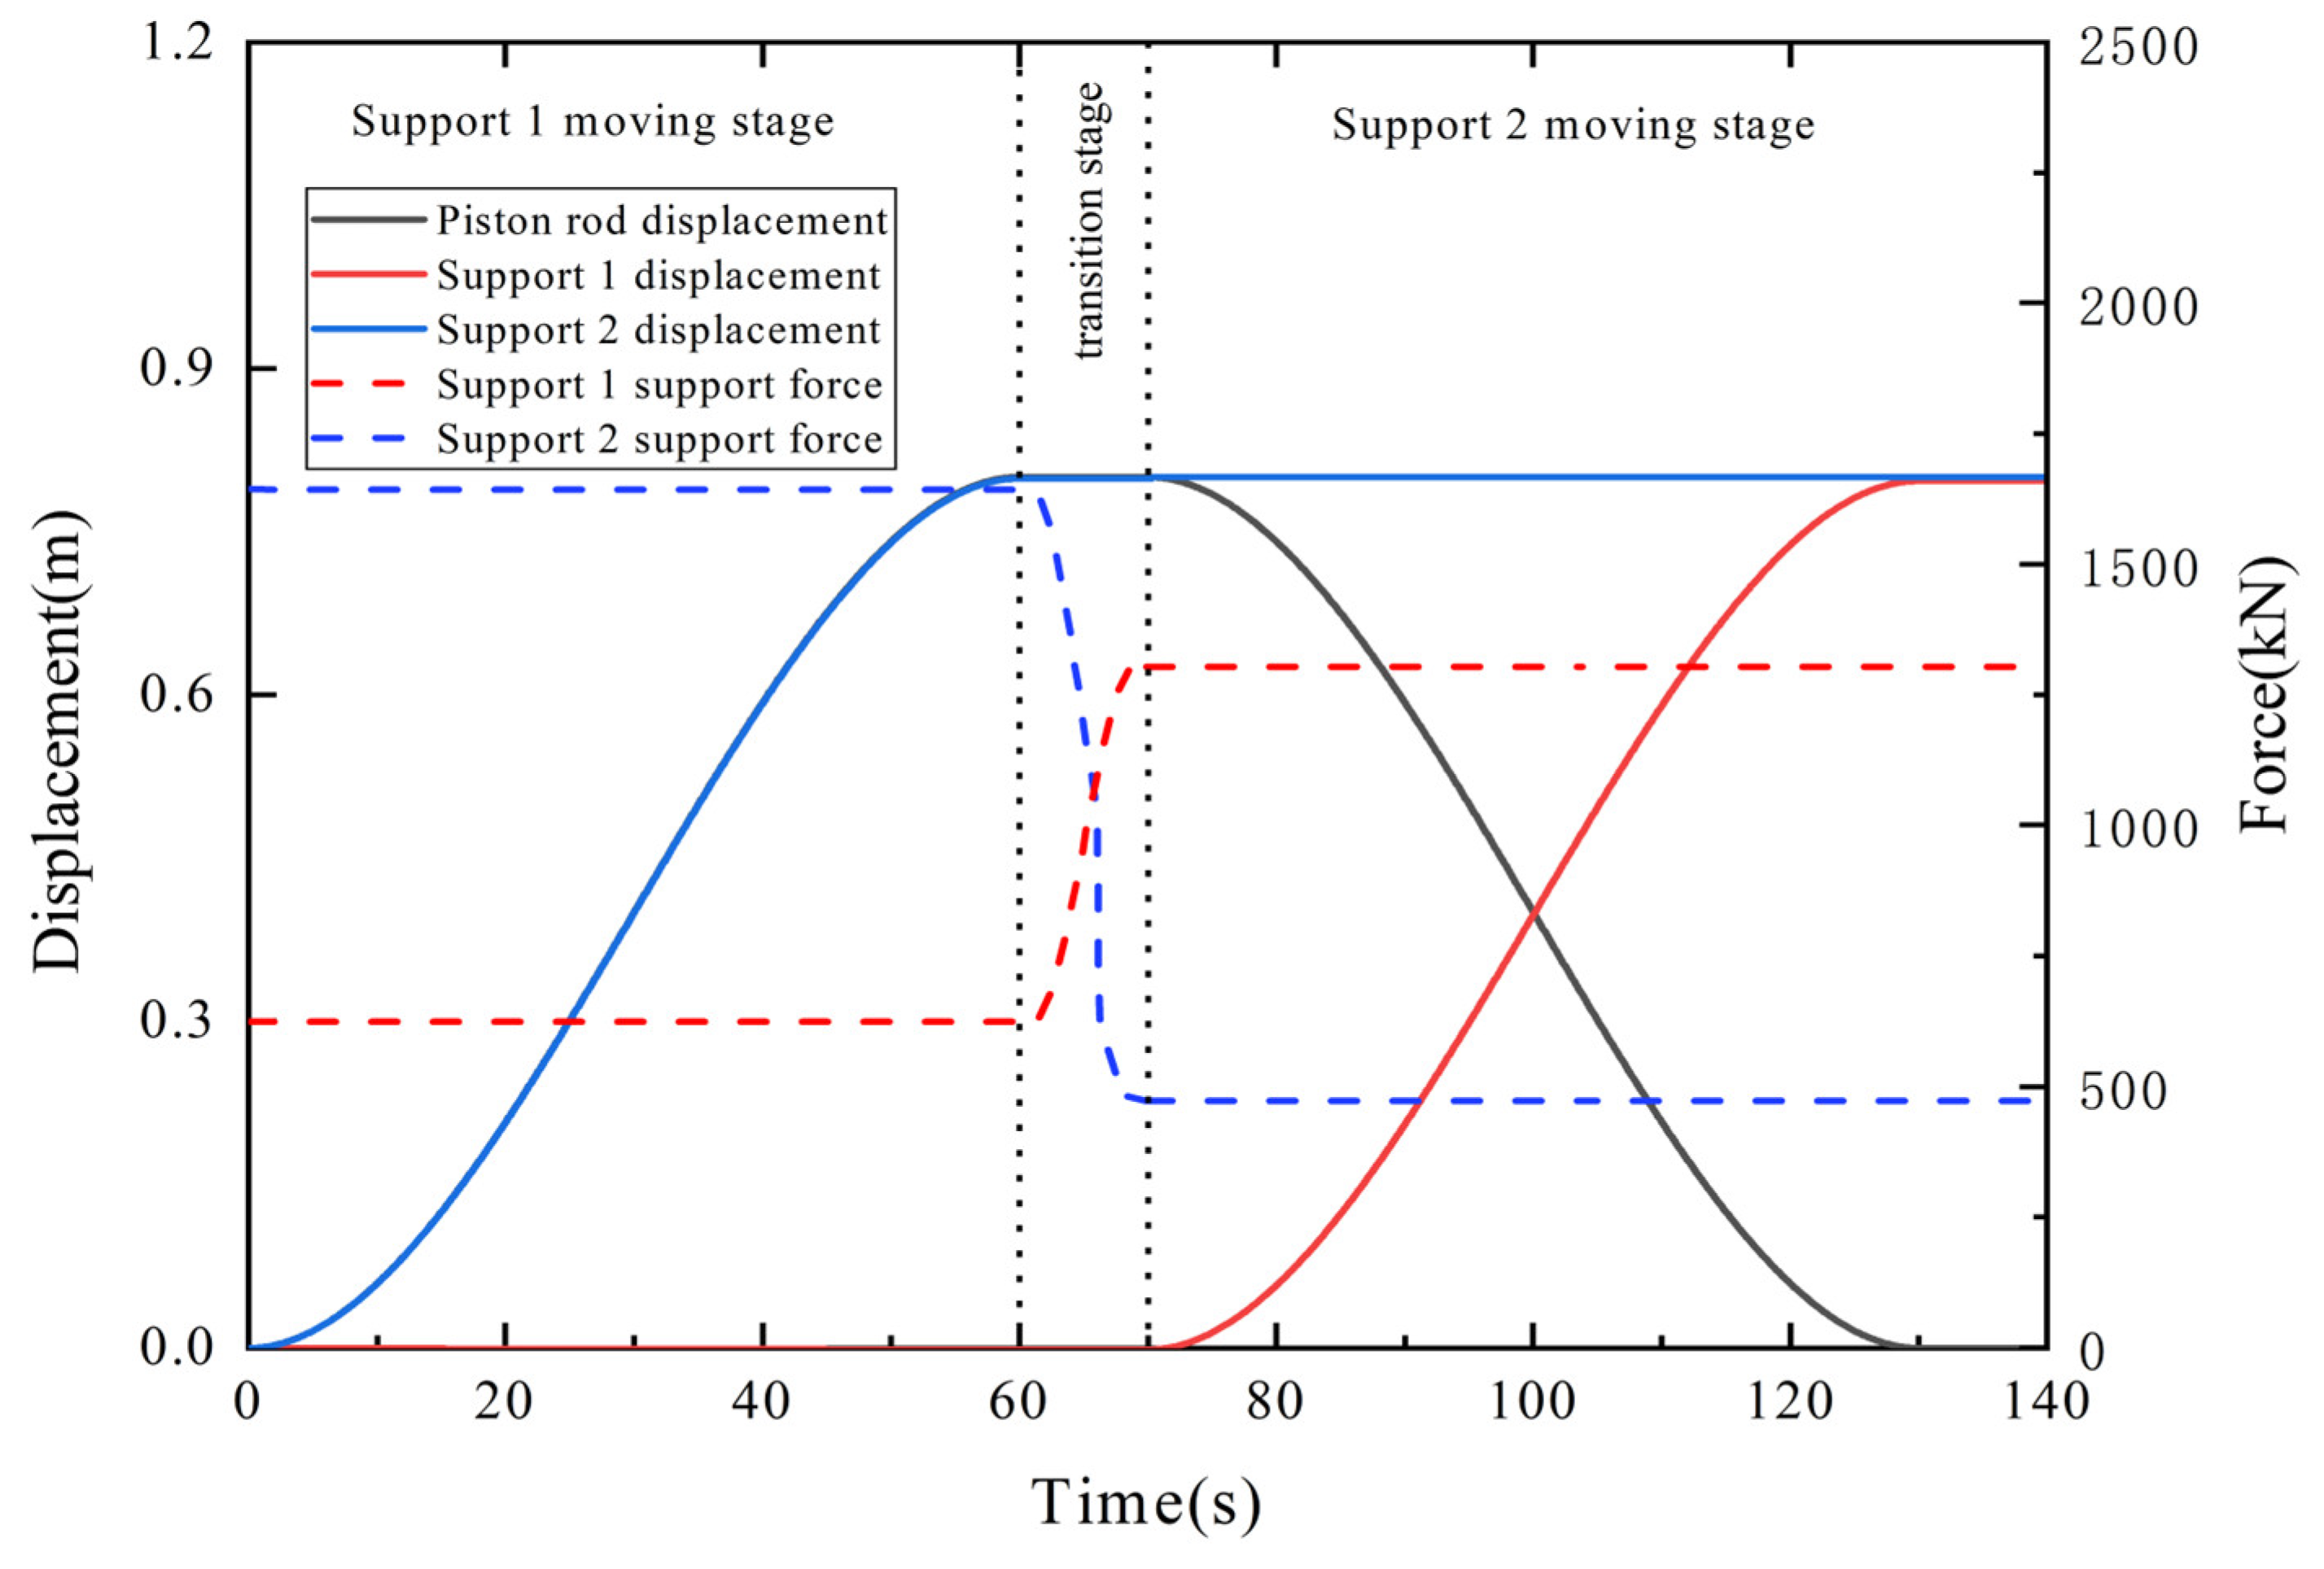
As shown in
Figure 16, the stage from 0 s to 60 s is the driving under pressure stage of support 1. In this stage, driven by the moving cylinder, the speed of support 1 gradually increases from zero within 0 s to 16 s, remains constant within 16 s to 44 s, and gradually decreases to zero within 44 s to 60 s, with a displacement of 0.8 m during the whole process. The stage from 60 s to 70 s is the transition stage. The stage from 70 s to 130 s is the driving under pressure stage of support 2. In this stage, pulled by the moving cylinder, the speed of support 2 gradually increases from zero between 70 s and 86 s, remains constant between 86 s and 114 s, and gradually decreases to zero between 114 s and 130 s, with a displacement of 0.8 m during the whole process. The supporting force of the top beam of support 1 on the roof is 623 kN within 0 s to 60 s, gradually increases to 1303 kN within 60 s to 70 s, and remains stable. The supporting force of the top beam of support 2 on the roof is 1643 kN within 0 s to 60 s, gradually decreases to 473 kN within 60 s to 70 s, and remains stable.
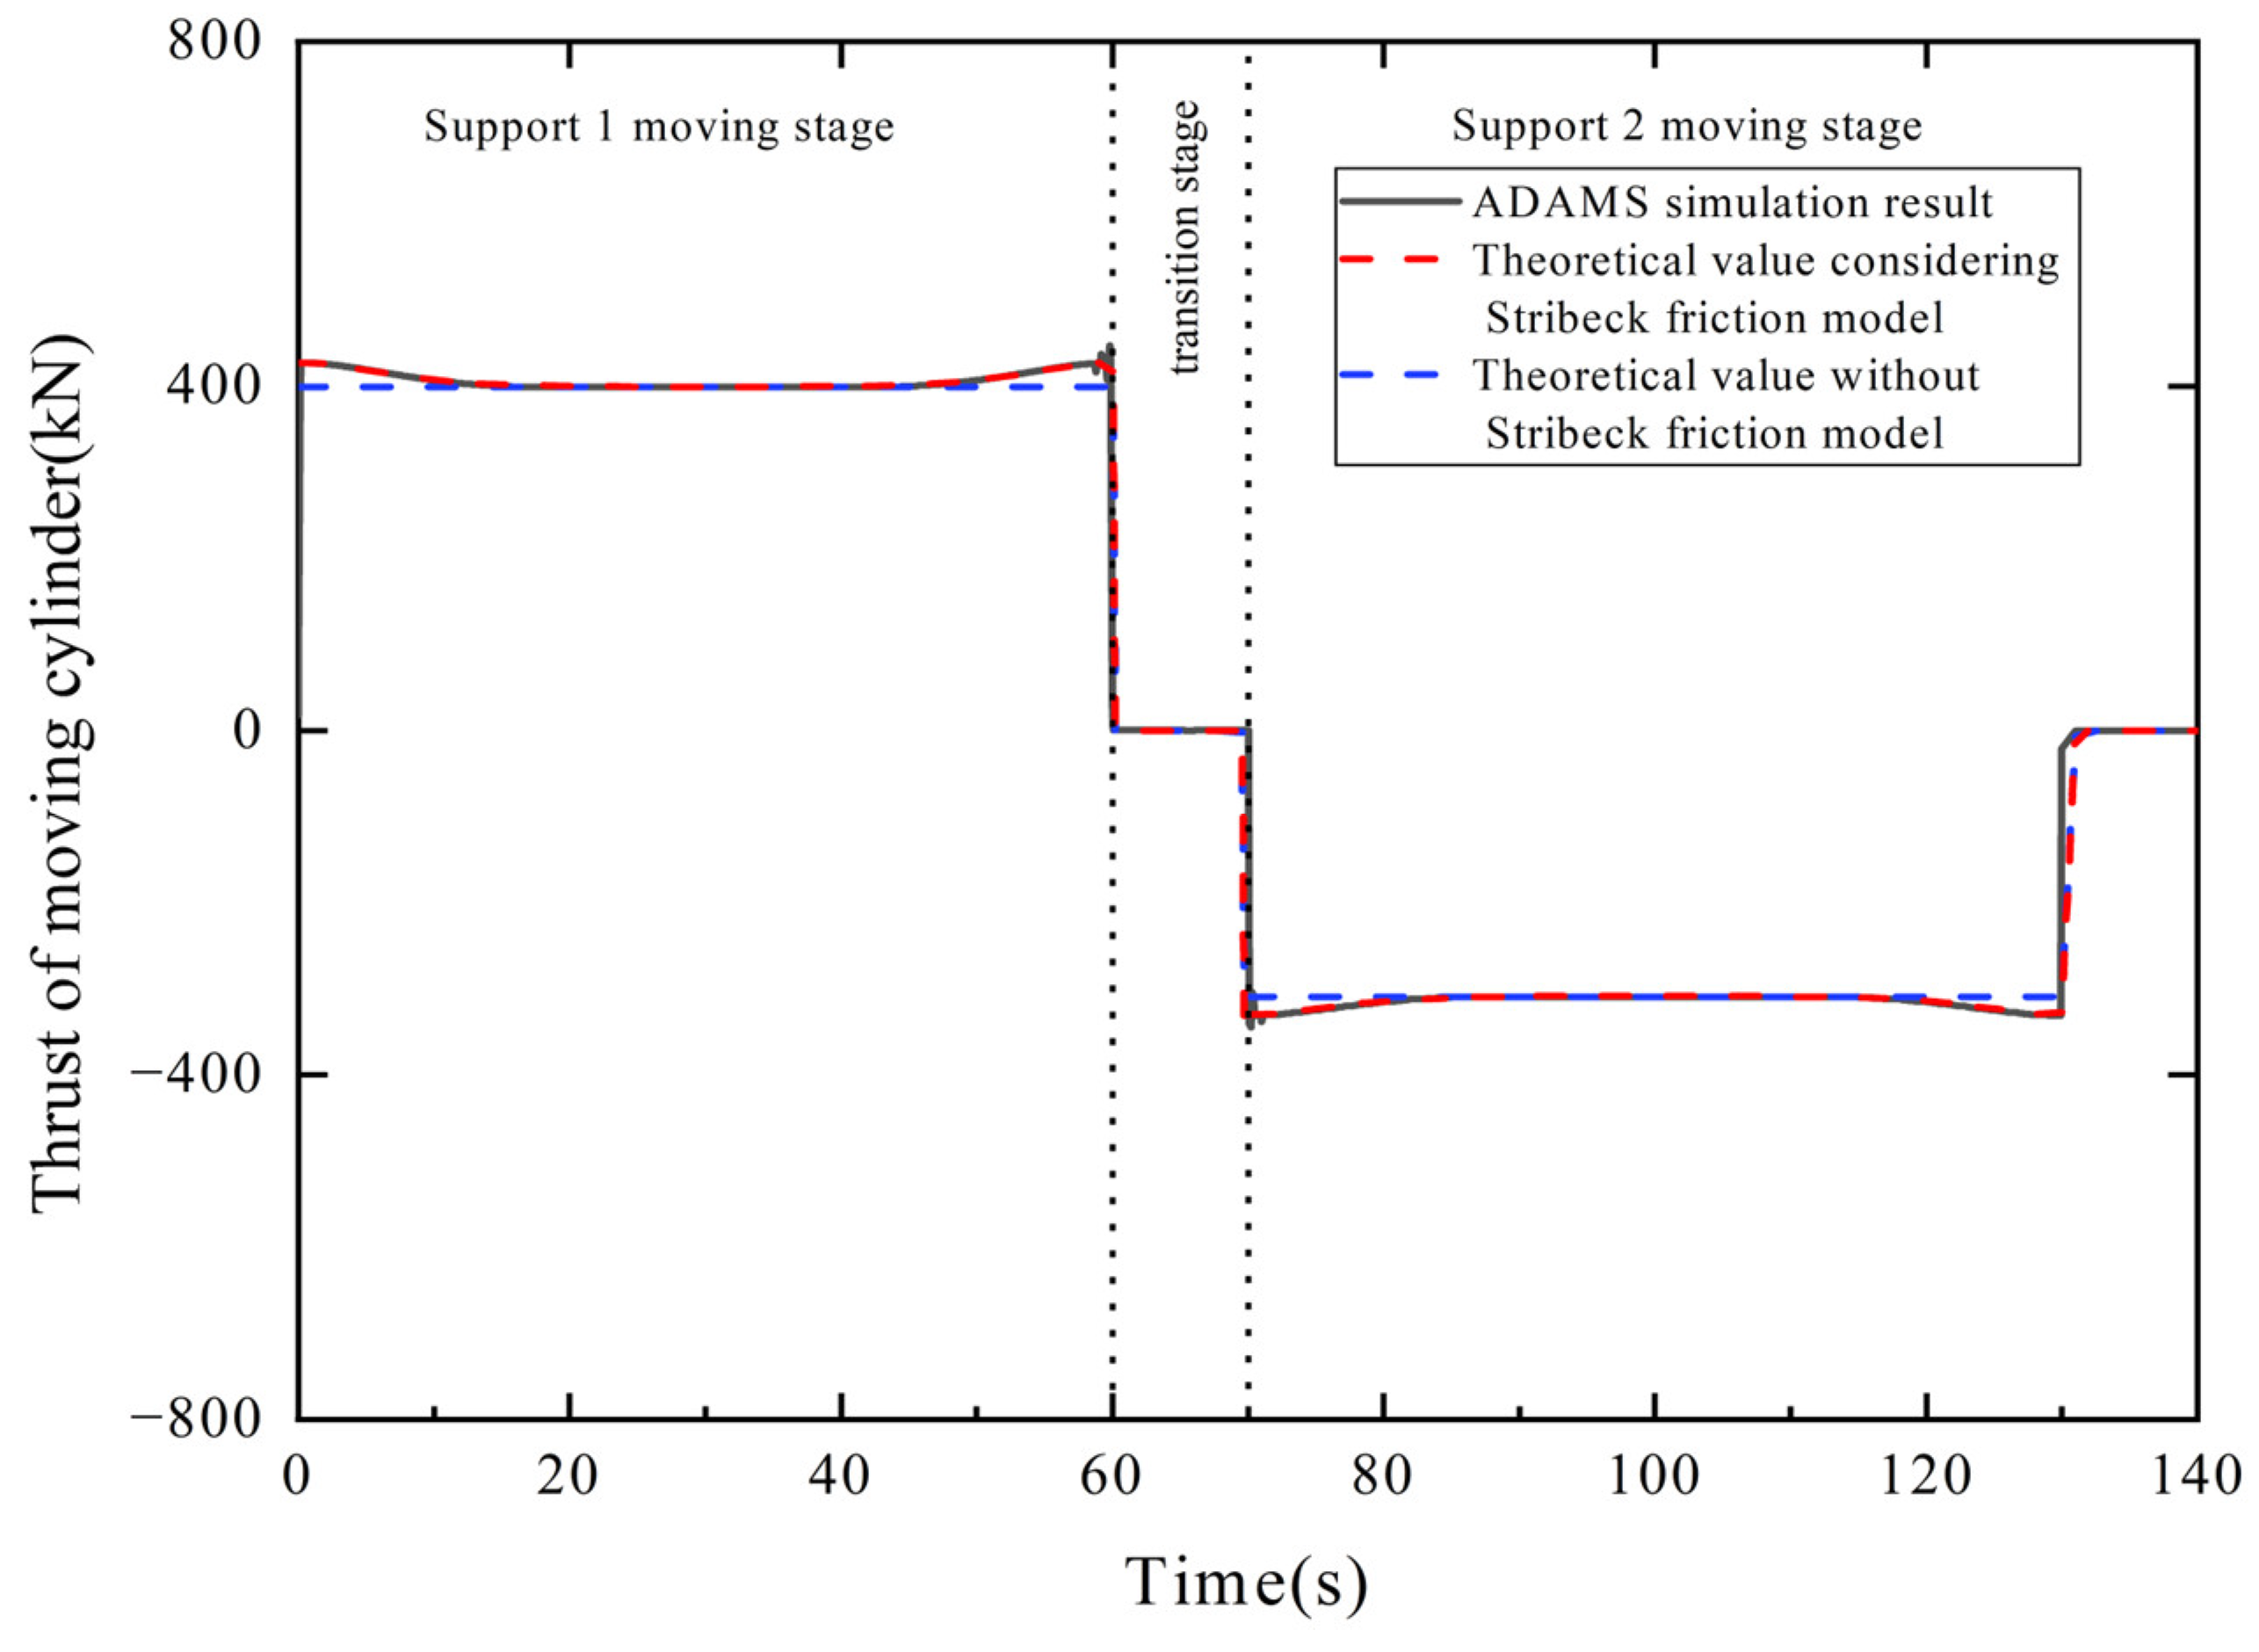
As shown in
Figure 17, the pushing force value of the moving cylinder obtained by simulation gradually decreases from 426 kN to 398 kN within 0 s to 16 s, remains stable within 16 s to 44 s, and gradually increases from 399 kN to 426 kN within 44 s to 60 s. The force value decreases to 0 N at 60 s. At 70 s, the pushing force of the moving cylinder changes to pulling force, and the force value is 333 kN, which decreases from 333 kN to 305 kN within 70 s to 86 s, remains stable within 86 s to 114 s, and increases from 305 kN to 330 kN within 114 s to 130 s, and remains constant at 0 N after 130 s. The theoretical values of the pushing and pulling force of the moving cylinder in the dynamic model of driving under pressure considering the Stribeck friction theory gradually decrease from 427 kN to 399 kN within 0 s to 16 s, remain stable within 16 s to 44 s, gradually increase from 399 kN to 427 kN within 44 s to 60 s, and remain constant at 0 N within 60 s to 70 s. At 70 s, the pushing force of the moving cylinder changes to pulling force, and the force value is 331 kN, which decreases from 331 kN to 309 kN within 70 s to 86 s, remains stable within 86 s to 114 s, increases from 309 kN to 331 kN within 114 s to 130 s, and remains constant at 0 N after 130 s. The theoretical value of the pushing and pulling force of the moving cylinder in the driving under pressure dynamic model without considering the Stribeck friction theory is 398 kN within 0 s to 60 s and 0 N within 60 s to 70 s. From 70 s to 130 s, the pushing force of the moving cylinder changes to the pulling force with a force of 309 kN and remains constant at 0 N after 130 s.
The simulation results show that the theoretical value of the dynamic model of driving under pressure, considering the Stribeck friction theory, has the same trend as the pushing force value of the moving cylinder obtained by the simulation, and its maximum error is 1.3%, which does not exceed 5%. The maximum error between the theoretical value of the driving under pressure dynamic model without considering the Stribeck friction theory and the pushing force value of the moving cylinder obtained by the simulation is 7.8%. Therefore, considering the Stribeck friction theory can make the driving under pressure dynamic model reflect the real values of pushing and pulling force required by support 1 and support 2 during the driving under pressure process of TSR more accurately.


 ,
, 

