1. Introduction
Hand gestures are a significant aspect of human communication, enriching interactions by offering additional expressive capabilities. They allow individuals to visually convey emotions or intentions that may be challenging to express through speech. In certain contexts, gestures even serve as an effective alternative to verbal communication or complement it. They are particularly useful in environments with high noise levels, where visual communication is more practical, and in settings that require silence. Furthermore, hand gestures provide a valuable means of communication for individuals with speech impairments or pronunciation difficulties.
In recent years, hand gestures have been increasingly explored as a means of interaction between humans and computers (HCI). Automatic recognition of hand gestures enables the recording, analysis, and classification of specific hand or arm movements using computer algorithms. The most prevalent methodology for capturing hand gestures is the camera-based approach, which employs an optical camera. This approach aims to detect entire hands, fingertips, pens, or handheld devices.
Hand gestures for HCI are often designed without finger or wrist movements when the number of commands is limited. In such cases, the accuracy of hand gesture recognition systems in camera-based approaches primarily depends on the precise detection of pen tips or fingertips. Once the tips are accurately detected, hand positions can be easily tracked across consecutive video frames [
1]. This tracking enables hand gesture recognition to be treated similarly to handwritten character recognition, which has achieved high levels of accuracy over the past few decades. Various techniques have been proposed, including linear discriminant analysis, multi-layer perceptron, tangent distance, and support vector machines [
2,
3]. Recent research indicates that convolutional neural networks can achieve accuracies exceeding 99% in handwritten character recognition [
4,
5].
Consequently, various techniques have been explored to enhance hand detection accuracies in camera-based systems. Color information was effectively utilized to identify the pen tip position in [
6], assuming a fixed pen color during the experiments. A similar approach was employed to detect hand regions by predefining hand color in a controlled environment [
7].
To further improve hand gesture recognition, the detection of hands or fingertips can be enhanced by replacing the optical camera with a depth sensor, which provides additional depth information about the object. For instance, the software development kit (SDK) of a Kinect sensor was utilized to detect hand positions, while the fingertip positions were calculated from hand and depth data [
8,
9]. The Kinect sensor has also been used to track fingertip positions and recognize tapping gestures, demonstrating its effectiveness in gesture recognition [
10]. Similarly, an alternative approach to hand tracking involving depth measurement with an ultrasonic transceiver has been introduced [
11].
Despite these advancements, camera- and depth sensor-based methods have inherent limitations, as they typically require users to remain within the field of view of the sensor. Although head-mounted cameras, as proposed in [
12], alleviate this constraint to some extent, they still present practical challenges.
An alternative method for recording hand gestures involves the use of accelerometer and gyroscope sensors, which provide users with greater freedom of movement. As these sensors are integrated into most modern smartwatches and fitness bands, users can utilize them as input devices with minimal effort. Furthermore, this approach remains stable regardless of lighting conditions.
However, a major challenge associated with accelerometer- and gyroscope-based methods is the accurate determination of sensor positions within the global coordinate system. Due to sensor movement or rotation during data acquisition, accelerometer values are aligned with the local coordinate system of the sensors. To address this issue, an automated coordinate conversion methodology was proposed in [
12]. However, this approach requires the availability of ground truth traces, which are often not readily accessible.
The accuracy of accelerometer- and gyroscope-based methods is inferior to that of camera-based methods. For instance, camera-based approaches have achieved a maximum accuracy of 99.571% for Arabic numbers and 16 directional symbols [
7] and 95% for English letters and Arabic numbers [
8]. In particular, 98.1% accuracy was achieved for six directive gestures at distances of up to 25 m. This result was obtained using a Graph Vision Transformer (GViT) with an RGB camera and HQ-Net for super-resolution [
13]. Additionally, an accuracy of 77% was recorded for 15 sign language gestures using SNN with STBP on an event-camera dataset (DVS_Sign_v2e) [
14]. In contrast, accelerometer- and gyroscope-based methods achieved 79.6% accuracy for Japanese Katakana (46 letters) using the K-nearest neighbor (K-NN) method [
15], 88.1% for Japanese Hiragana (46 letters) with the hidden Markov model (HMM) [
16], and 89.2% by combining K-NN with dynamic time warping (DTW) techniques [
17]. Recently, sensor-based approaches have been improved through deep learning models, such as ABSDA-CNN with a 64-channel EMG sensor, achieving an accuracy of 88.91% for inter-session gesture recognition [
18]. Some sensor-based approaches have achieved high accuracy by integrating multiple devices. For instance, Shin et al. achieved an accuracy of 95.3% using a combination of RGB cameras, depth sensors, EMG, and EEG [
19].
Sensor-based gesture recognition systems are often expected to operate asynchronously without the need for explicit triggers. In such cases, distinguishing between target and non-target classes is crucial to prevent unintended activations and ensure accurate recognition. Specifically, non-target classes consist of actions that resemble target gestures but commonly occur in everyday activities, making them more challenging to differentiate. Proper identification of these patterns is essential to minimize false positives and ensure reliable system performance in real-world scenarios. Previous research has predominantly ignored non-target actions, collecting and training data exclusively for target actions. However, it is also important to prevent non-target actions from being classified as target actions in addition to recognizing target actions.
Classifying non-target actions can be considered a form of out-of-distribution (OOD) detection or anomaly detection, which has been widely studied in recent decades.
Table 1 summarizes representative works [
20,
21,
22,
23,
24,
25,
26,
27,
28,
29,
30,
31,
32] in these domains. Much of the prior research has focused on image-based tasks [
20,
21,
22,
26,
30], while studies on time-series data, such as sensors and gestures, have been relatively limited. These studies on time-series signals have primarily addressed anomaly detection by identifying irregularities within temporal patterns [
20,
23,
24,
25,
31]. In addition, some efforts have been made to improve the robustness of classification models to abnormal variations [
28,
29]. Recent findings further suggest that conventional OOD detection approaches are insufficient for handling complex time-series scenarios involving unseen semantic categories [
32]. Zhang et al. addressed this by treating certain time-series classes as OOD and evaluating the model’s ability to recognize them [
29]. In their study, a subset of classes within a multi-class dataset was designated as OOD, and the model was tested on its ability to classify these unseen OOD classes.
Building on this, the present study explores a more challenging setting in which OOD classes exhibit patterns that closely resemble those of the target classes, thereby increasing the difficulty of discrimination. OOD classes were designed to have similar patterns to the target classes and were tested while they were untrained. The proposed approach focuses on evaluating various training strategies to achieve reliable recognition of non-target activities.
The remainder of this paper is organized as follows. The collected data and proposed method are described in
Section 2, followed by the presentation of experimental results and related discussions in
Section 3. Finally, the study concludes with
Section 4.
2. Materials and Methods
This section describes the dataset, preprocessing procedures, neural network architecture, and experimental design employed in this study.
2.1. Dataset
In this study, data were collected from 20 participants aged between 19 and 27. All participants were right-handed and wore a smartwatch on their right wrist during the experiment. The study protocol was approved by the Institutional Review Board (IRB) of Pukyong National University (#1041386-202104-HR-12-01).
The collected data captured right-arm movements in a three-dimensional space, encompassing motion characteristics in the anterior/posterior, medial/lateral, and vertical directions. The target movements were performed according to predefined directional instructions, which included upper-left, upper-right, lower-left, lower-right, and triangular patterns. Each movement consisted of three distinct sub-movements, with a brief pause of approximately 0.5 s between sub-movements to emphasize its distinctive features. All target patterns incorporated pauses and directional changes at either right or acute angles.
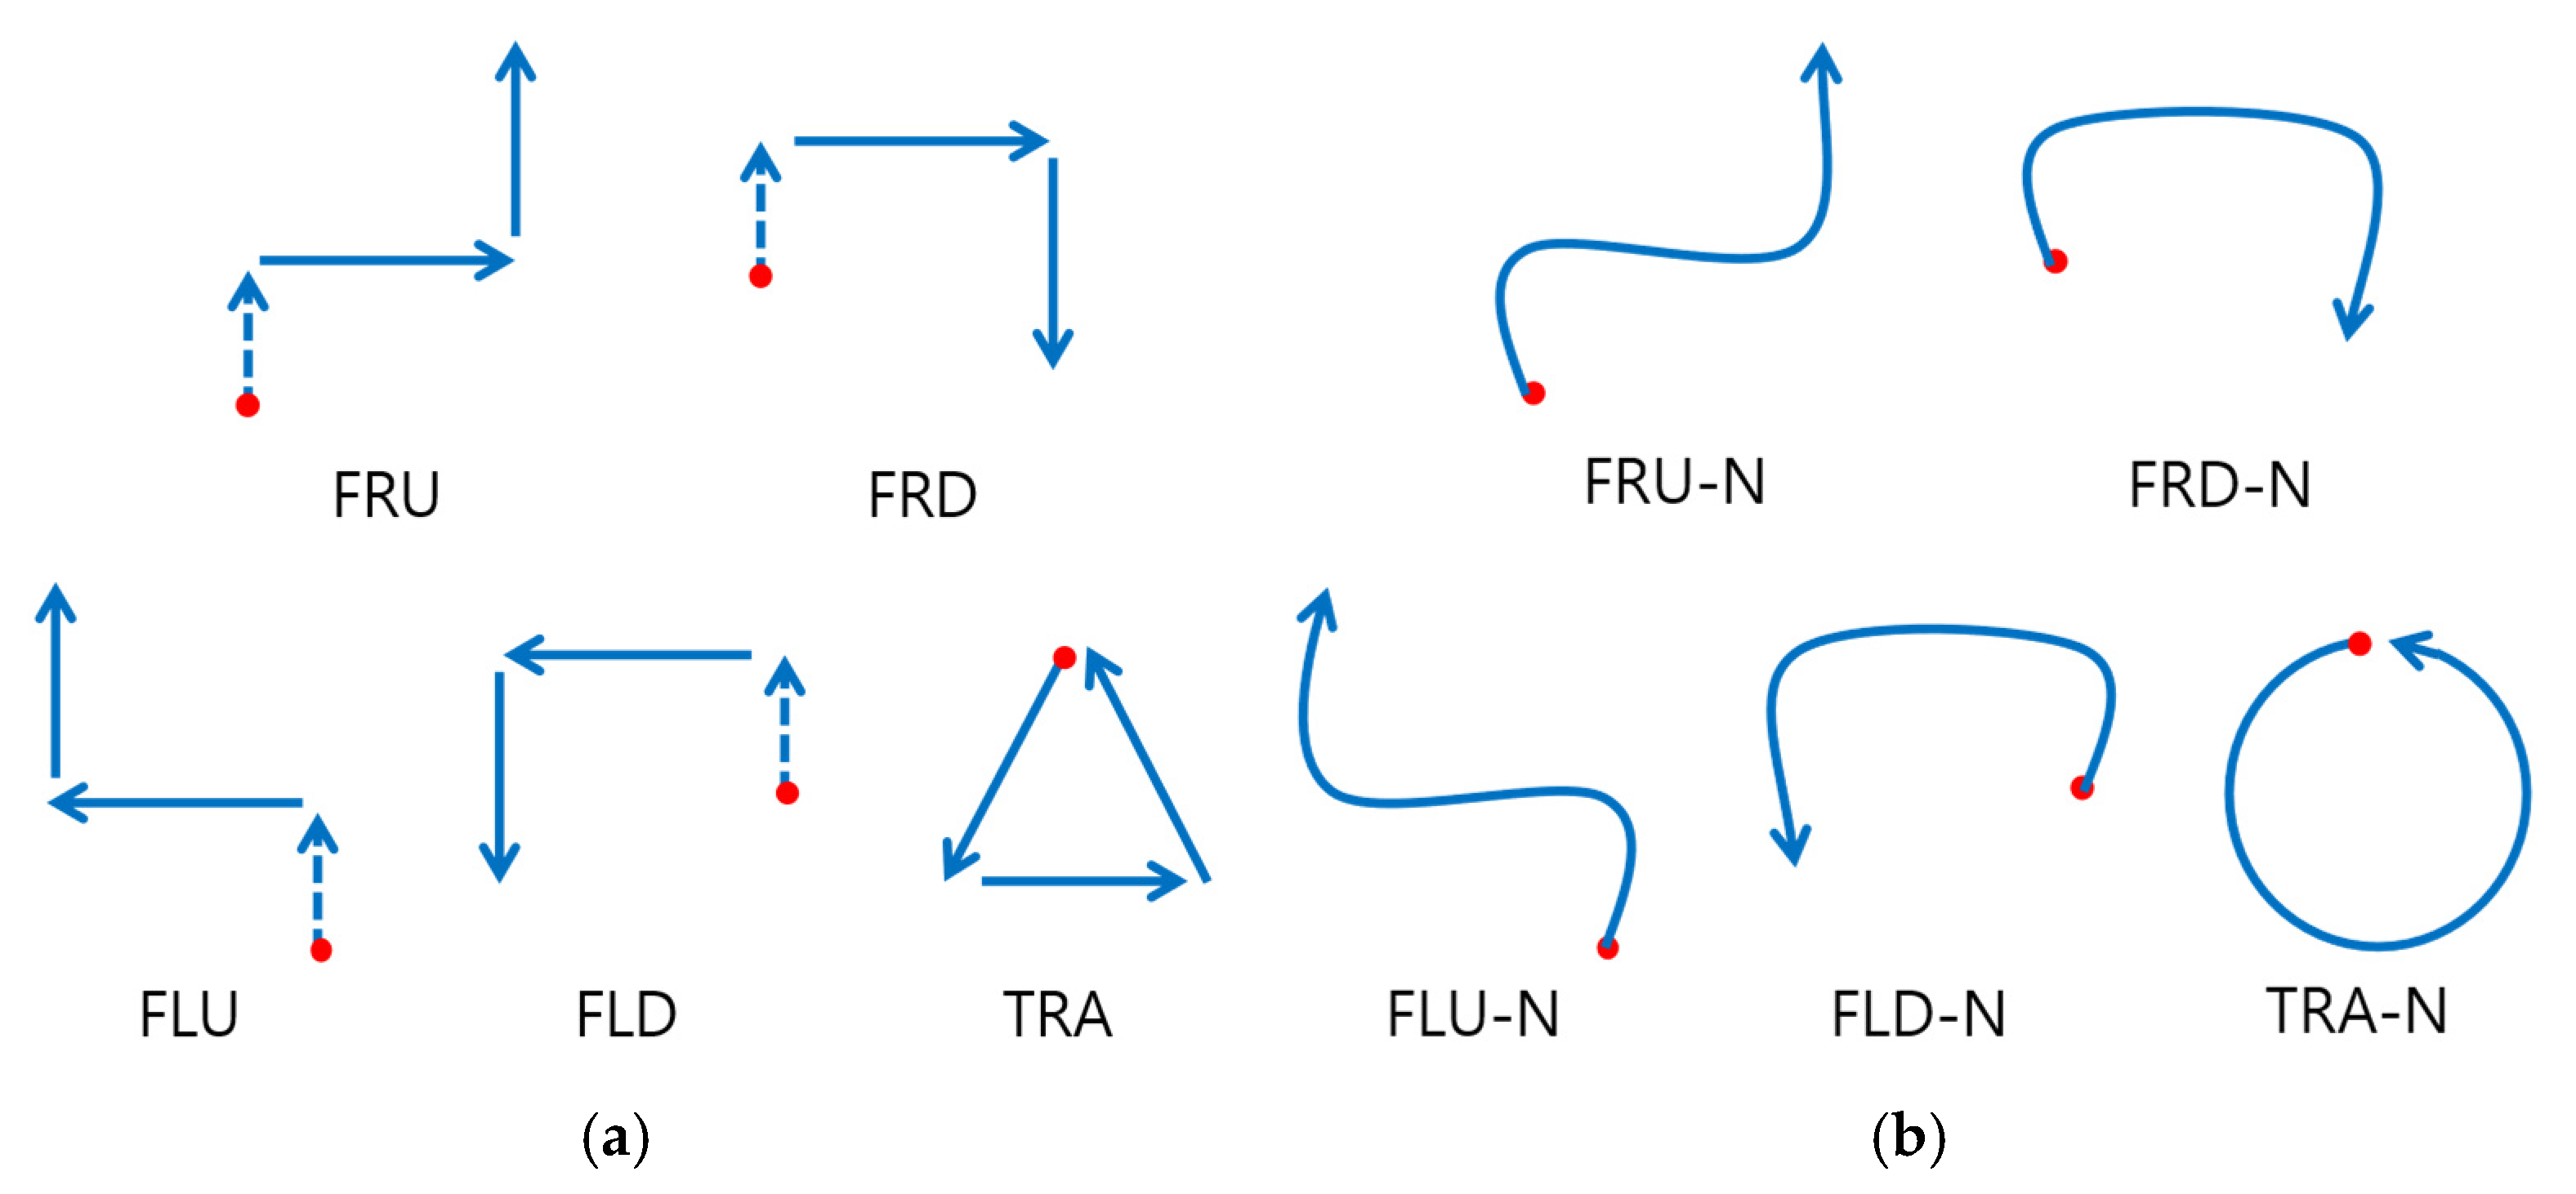
The movements were labeled using alphabetical notations, where “F” denotes a forward movement, “R” and “L” indicate rightward and leftward movements, and “U” and “D” represent upward and downward movements. The target movement set included four fundamental patterns (FRU, FRD, FLU, FLD) along with a triangular movement pattern (TRA) (
Figure 1a). The forward movement was added to the four fundamental patterns to serve as a potential trigger for future studies. This design also ensures that each pattern consists of three segments, making them structurally comparable to the triangular movement (TRA). Each participant performed 5 distinct target movements 10 times, resulting in a total of 1000 target movement samples.
Non-target movements are defined as actions that do not correspond to the predefined target movements. These movements closely resemble target movements, which increases the likelihood of misclassification. Non-target movements were derived from the five target movements by intentionally omitting specific distinguishing features, such as pauses or directional changes. Each non-target movement corresponds to a specific target movement.
The primary objective of designing non-target movements was to assess whether the model could accurately classify unseen non-target movements by understanding the general characteristics of target and non-target movements. Unlike target movements, which include momentary pauses at corners and sharp directional changes, non-target movements were executed in a continuous and smooth, curved manner (
Figure 1b). For instance, in the FRU, FRD, FLU, FLD, and TRA movements, the non-target versions were designed to move fluidly without interruptions, with the triangular pattern replaced by a circular motion.
Non-target movement data were collected from 11 out of the 20 participants, with each participant performing 15 non-target movements, yielding a total of 165 non-target samples.
The data were collected using sensors embedded in a smartwatch, which measured accelerometer and gyroscope values in three-dimensional space. Each movement was recorded for a duration of three seconds at a sampling rate of 50 Hz. The collected data were transmitted from the smartwatch to a smartphone and subsequently transferred to a PC via a wired connection or Wi-Fi. The sampling rate was limited to 50 Hz due to transmission constraints between the smartwatch and the smartphone used in this experiment, which occasionally caused data loss at higher frequencies.
The experimental setup consisted of an LG Watch W7 smartwatch (LG Electronics, Seoul, Republic of Korea), a Nexus 5X smartphone (LG Electronics, Seoul, Republic of Korea), and a PC. Data collection was conducted using Android Studio Arctic Fox (
Figure 2).
2.2. Data Standardization and Data Augmentation
The collected data varied in length due to measurement errors from the recording device. To ensure consistency, all samples were standardized to a fixed length of 150 using zero-padding. If a sample had fewer than 150 values, the existing data remained unchanged, and the missing values were filled with zeros to reach 150. Zero-padding was applied to enable consistent input dimensions for convolutional layers, while dropout layers were used to mitigate potential overfitting or artifacts caused by the added padding signals.
Data augmentation is a widely used technique in machine learning to artificially expand the training dataset by applying various transformations to the existing data [
33,
34,
35]. This approach enhances model generalization by introducing variability and reducing overfitting, which is particularly beneficial in time-series data, where data collection can be costly and time-consuming. Several augmentation techniques—such as Gaussian Noise [
33], Cut-out [
34], Time Shift [
35], and Window Warp [
36]—have been utilized for time-series data to enhance its diversity. In the context of this study, data augmentation is expected to improve the model’s robustness in recognizing both target and non-target movements under varying conditions.
The dataset consists of six classes; five classes correspond to the predefined target movements, while the sixth class includes all non-target movements. This classification enables the model to distinguish specific gestures from a broad range of non-target movements.
2.3. Neural Network Architecture
A deep learning model is proposed for the classification of unseen non-target movements, as illustrated in
Figure 3. The proposed model is based on a combination of convolutional neural networks (CNN) and bidirectional long short-term memory (Bi-LSTM) layers, which are well-suited for analyzing time-series data. The network architecture comprises four convolutional blocks, where each block consists of three one-dimensional (1D) convolutional layers followed by a max-pooling layer. The convolutional layers in each block have a kernel size of 3, with the number of filters progressively increasing to 8, 16, 32, and 64 across the four blocks. Each convolutional block is followed by a max-pooling layer that applies a pooling size of 3 with a stride of 2, which progressively reduces the dimensionality of the feature maps.
After the final convolutional block, the model incorporates two bidirectional LSTM layers with 64 and 32 units, respectively, to effectively capture temporal dependencies in the input sequences. Subsequently, two dropout layers are applied with a dropout ratio of 0.5 to prevent overfitting during training. The final classification is performed through two fully connected layers. The first layer contains 200 units and the output layer consists of 6 units, corresponding to the classification of target and non-target movements. The filter sizes, number of filters, and dropout ratios were empirically determined through extensive experimental evaluations to optimize the model’s performance.
The choice of this architecture was guided by the need to balance classification performance and computational efficiency, particularly given the size and characteristics of the dataset. The CNN module captures local spatial features of the movement signals, while the Bi-LSTM layers learn temporal dependencies by utilizing both past and future signals. This combination enhances the model’s ability to distinguish between target and non-target movements. A combination of CNN and Bi-LSTM was chosen over more recent architectures such as Transformer or GRU because it provides a good trade-off between model complexity and accuracy for relatively small-scale gesture data. In preliminary trials, the proposed architecture showed stable training and competitive accuracy, making it suitable for the problem setting in this study.
The proposed model utilizes a four-layer 1D CNN with increasing filter sizes (8, 16, 32, 64) to extract spatial features, followed by max-pooling (3, 2) and dropout (0.5) to reduce overfitting. These architectural choices were based on prior studies in time-series classification and confirmed through preliminary experiments. A kernel size of 3 was selected to capture fine-grained local features, while the increasing number of filters across layers allows the model to learn progressively higher-level representations. The dropout rate of 0.5 is a widely used heuristic that provides a good balance between regularization and model capacity. Bidirectional LSTM layers (64, 32 units) capture temporal dependencies in both directions, and fully connected layers (200, 6) perform final classification, maintaining a balance between efficiency and generalization.
A loss function was designed to improve classification performance by considering both class identification errors and the distinction between target and non-target patterns. The total loss function consists of two components: the categorical cross-entropy loss for class identification and an additional loss term that enhances the separation between target and non-target classes.
The first component, the class identification loss, is formulated as follows:
where
represents the total number of samples,
denotes the number of classes.
is the ground-truth label for sample
and class
, and
is the predicted probability of the sample belonging to class
. This term ensures that the model effectively learns to classify each sample into the correct class by minimizing the negative log-likelihood of the correct class probability.
To reinforce the distinction between target and non-target patterns, an additional target loss term is introduced. This term is defined as:
where
and
represent the target labels, indicating whether the sample belongs to one of the five target classes (FRU, FRD, FLU, FLD, and TRA) or the non-target class. All the non-target classes are considered as a single class. The predicted probability values
and
are obtained by aggregating the softmax outputs for the target classes into a single probability while maintaining the probability of the non-target class. These predicted target values,
and
, are defined as
where
denotes the predicted output of the model for each class. This formulation is designed to ensure that the model explicitly learns to distinguish between target and non-target patterns.
The final loss function is expressed as the weighted sum of these two terms:
where
is a weighting factor that controls the contribution of the target loss term to the overall loss. By incorporating both loss terms, the proposed loss function aims to enhance classification accuracy while ensuring a robust differentiation between target and non-target classes.
2.4. Experimental Setting
In this paper, we aim to assess the model’s ability to distinguish between target and non-target movements effectively. To achieve this, the model was trained using only four classes of non-target movements. The remaining class was excluded from the training phase to evaluate its ability to recognize unseen non-target movements (
Figure 4). The experimental dataset consists of five target movements and five non-target movements, which were utilized to train and evaluate the model. During the testing phase, the trained model was evaluated with unseen non-target movements to determine how well they were classified.
Each non-target class consisted of a total of 33 samples, resulting in 132 samples being used for training and the remaining 33 samples for testing (
Table 2). A similar approach was applied to the target movements, where 33 samples were allocated for testing, and the remaining samples were used for training. To ensure the reliability of the validation process, the selection of target data was performed randomly and repeated 10 times. For non-target patterns, the experiment was repeated five times by leaving each class as an unseen class in turn. Consequently, a total of 50 experimental iterations were conducted for each model, enhancing the robustness of the evaluation.
3. Results
The classification performance of the proposed model was evaluated using precision, recall, and F1-score metrics (
Table 3). The results indicate that the model achieved an overall precision, recall, and F1-score of 0.8592, 0.8459, and 0.8423, respectively. When considering only target patterns, the model exhibited an average precision of 0.8497, recall of 0.8885, and F1-score of 0.8643. In contrast, for non-target patterns, the model achieved a higher precision of 0.9071 but significantly lower recall (0.6327) and F1-score (0.7323). This discrepancy suggests that while the model is effective in maintaining high precision for non-target patterns, it tends to exhibit lower recall, implying that some non-target patterns are misclassified as target patterns.
A detailed analysis of individual test conditions reveals variations in model performance across different excluded non-target patterns. The model’s recall is notably lower when classifying the TRA-N pattern, with a value of 0.3758, resulting in an F1-score of 0.5141. This phenomenon appears to be attributed to the unique characteristics of the TRA pattern. Unlike other movement patterns, which follow distinct directional shifts, the TRA pattern is designed with a continuous circular motion. Consequently, when the TRA-N pattern is excluded from the training data, the model struggles to classify it accurately during testing. In contrast, other non-target patterns maintain a similar fundamental movement style, differing only in direction, making their classification less challenging.
Among target patterns, the model performed consistently well, achieving the highest F1-score of 0.9728 for the TRA movement, while the lowest F1-score was observed for the FLU movement (0.8379). The model’s performance on unseen non-target patterns also varied depending on the excluded class, with the highest F1-score (0.8016) observed for the FLD-N pattern and the lowest (0.5141) for TRA-N.
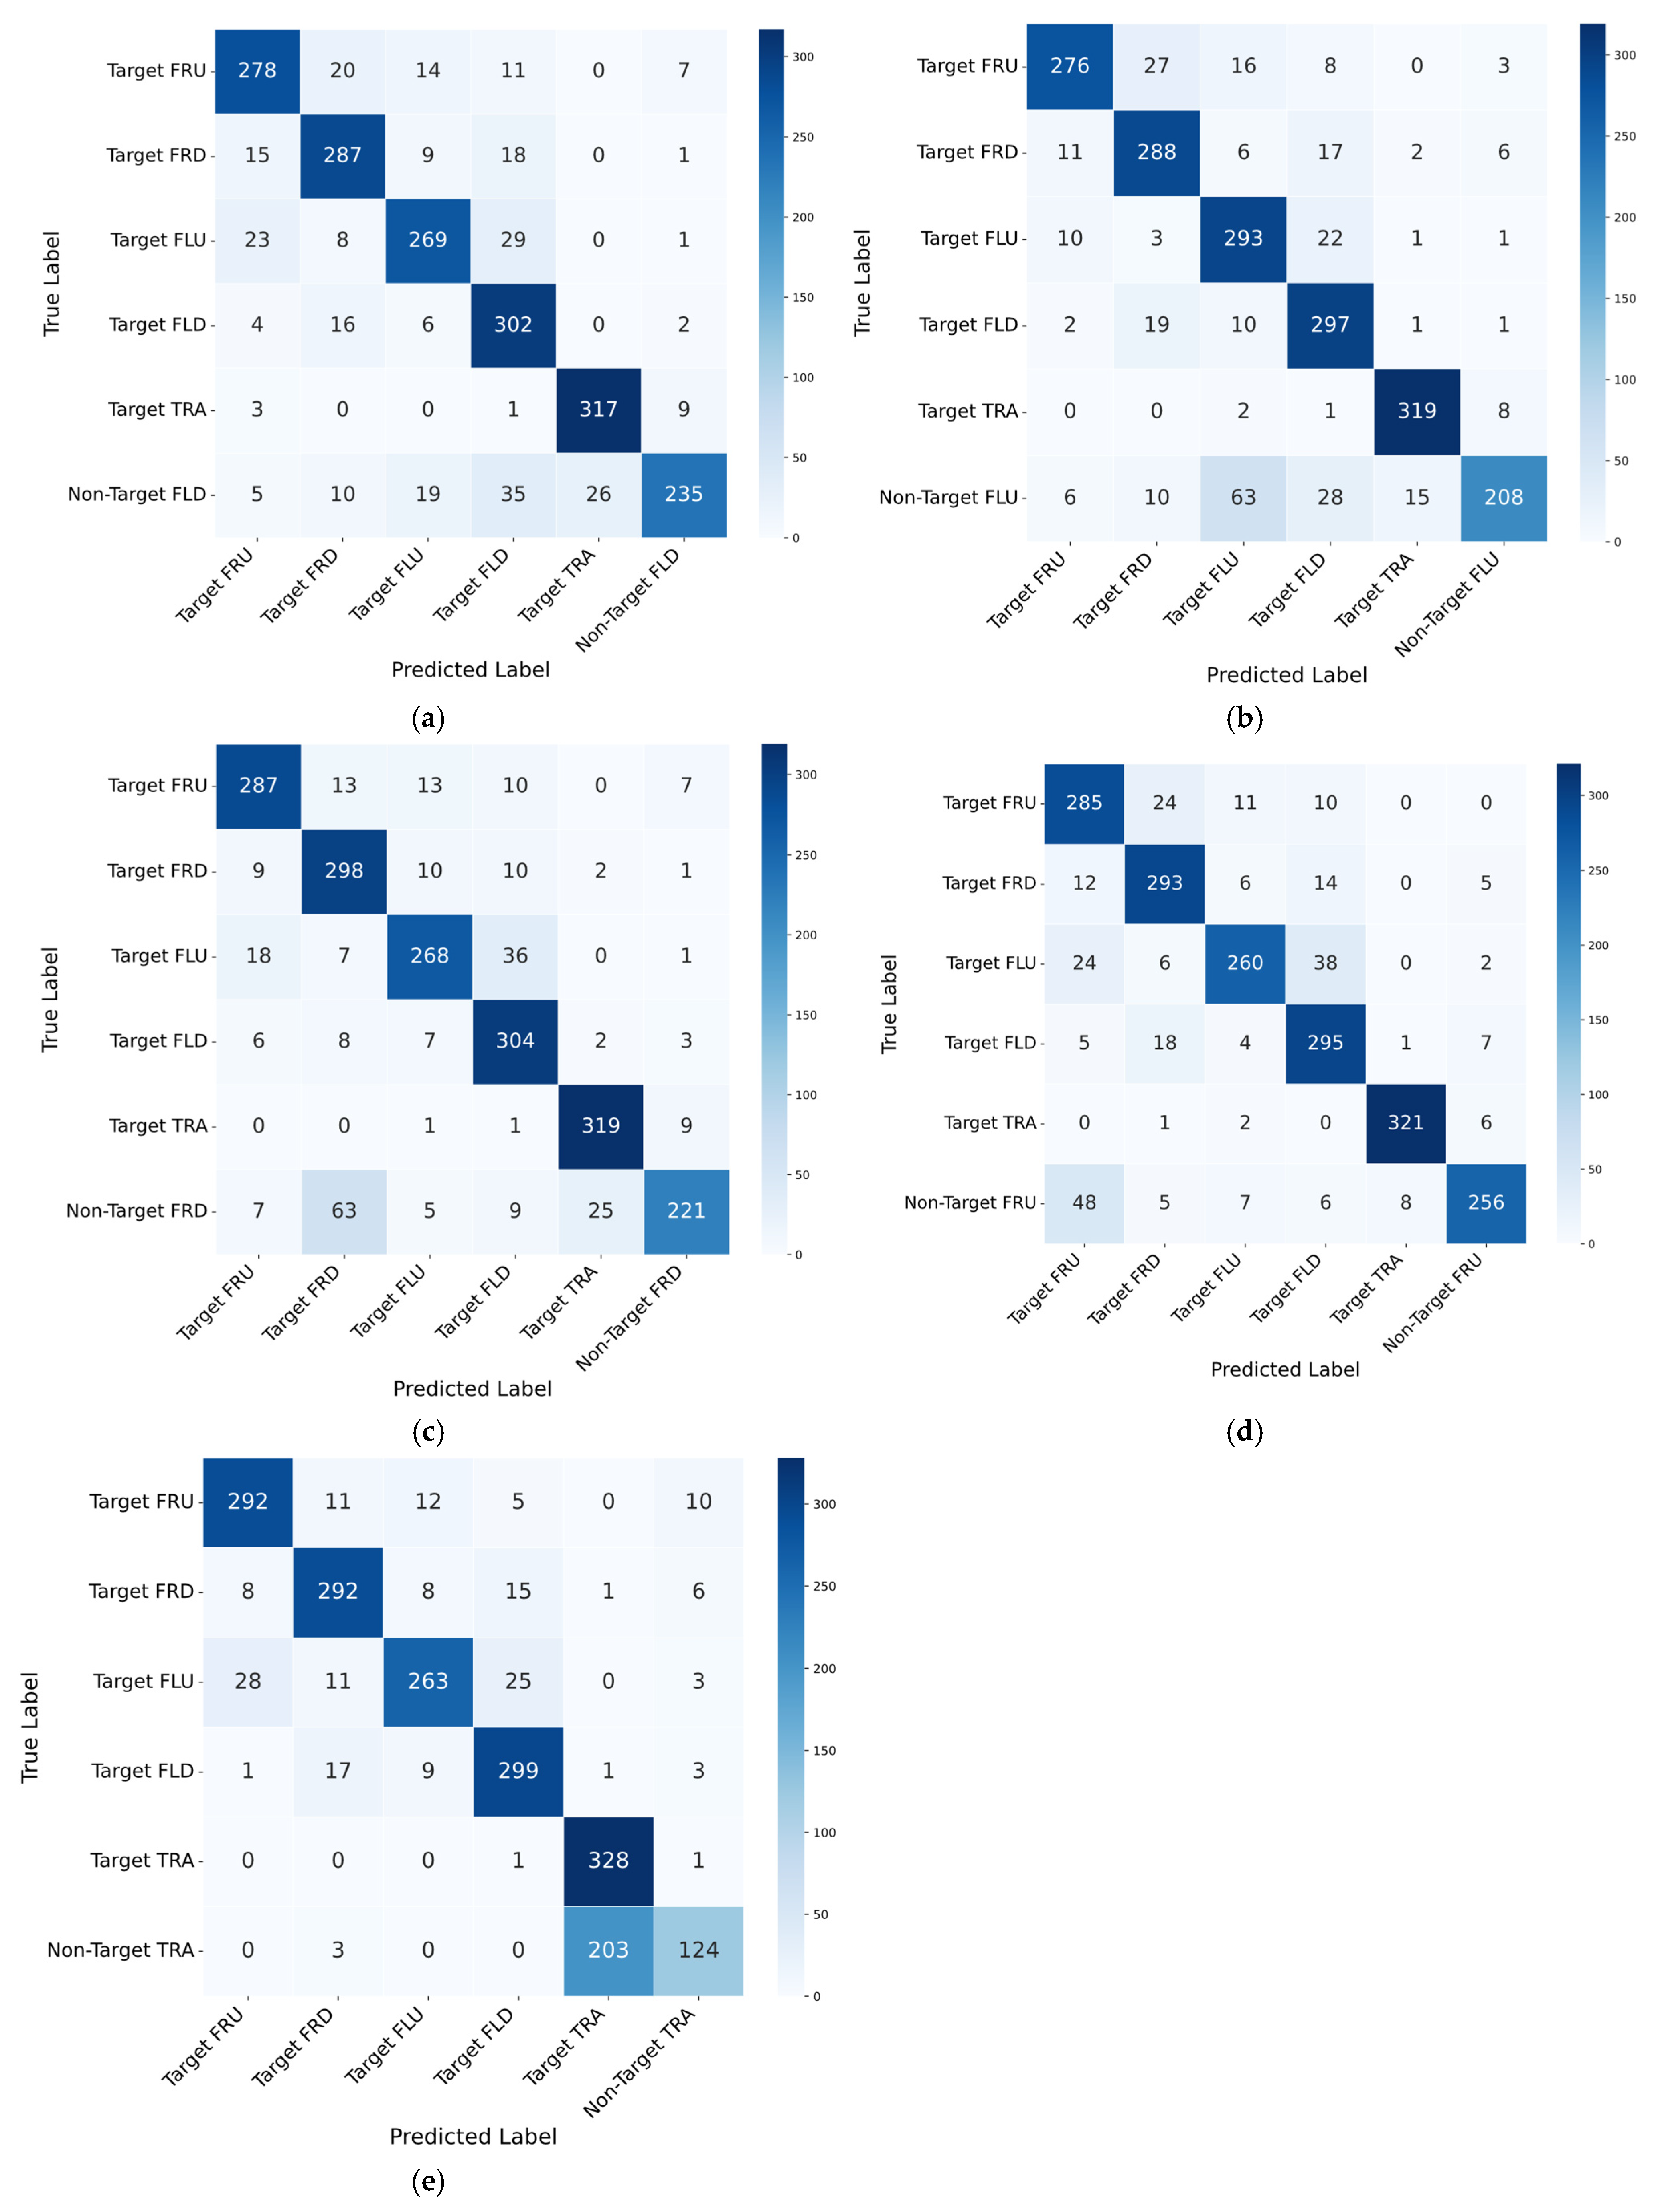
To further evaluate the classification performance of the proposed model, confusion matrices were analyzed across the five different experimental settings. Each setting was validated ten times (
Figure 5). The rows indicate the actual class labels, while the columns represent the predicted class labels.
The overall results indicate that the model effectively classifies target movements, with most instances correctly assigned to their respective target categories. However, variations in misclassification patterns were observed depending on the excluded non-target pattern. In particular, the model demonstrated strong classification performance for the TRA movement, consistently achieving high accuracy across all settings. The distinct motion characteristics of this pattern likely contribute to its robust classification. Conversely, FLU and FRU exhibited relatively higher misclassification rates, primarily due to their similar movement trajectories. This pattern of confusion suggests that the model struggles to distinguish between certain target movements when they exhibit overlapping motion characteristics.
Figure 6 presents the accuracy and loss curves for both the training and validation phases. Although an increase in validation loss was observed, this does not necessarily indicate deteriorating performance. The rise in loss could occur due to correct predictions made with low confidence. The smooth convergence of the accuracy curves supports the model’s stability throughout training.
Table 4 presents the classification performance of the proposed model with different data augmentation methods. The results indicate that data augmentation positively influenced model performance, with varying degrees of improvement depending on the augmentation technique used. Without augmentation, the model achieved an average F1-score of 0.6604, with relatively poor performance on non-target patterns. This suggests that the model struggles to generalize effectively to unseen non-target movements in the absence of augmentation.
Among the tested augmentation methods, Gaussian Noise led to the highest overall performance, with an average F1-score of 0.7323. This method significantly improved classification accuracy across all non-target patterns, particularly FRU-N (0.8411) and FLD-N (0.8016). The improved performance suggests that introducing noise enhances the model’s robustness by preventing overfitting to specific movement characteristics.
Time Shift augmentation also improved model performance, achieving an average F1-score of 0.6897. Notably, this method enhanced the classification of FRD-N (0.8130) and TRA-N (0.6439), suggesting that shifting temporal features allows the model to better capture movement variations. However, performance on FLU-N (0.5850) and FLD-N (0.6172) remained relatively low, indicating that some patterns may be more sensitive to temporal shifts.
In contrast, Cut-out augmentation resulted in the lowest average F1-score (0.6236), with particularly poor performance on FLD-N (0.5444) and TRA-N (0.4673). The sharp decline in these scores suggests that randomly removing portions of the data may have disrupted key motion features, making it more difficult for the model to learn meaningful representations.
A two-way repeated measures ANOVA was conducted to examine the effects of augmentation methods and non-seen patterns on performance, using SPSS Statistics (version 29). A significant main effect of augmentation method was observed, , , with a large effect size (), indicating that different augmentation methods resulted in significant differences in performance. Post-hoc comparisons using Bonferroni correction revealed that Gaussian Noise significantly outperformed the condition without augmentation () and Cut-out (), while Time Shift also demonstrated a significantly higher F1-score than Cut-out (). These findings suggest that augmentation techniques, particularly Gaussian Noise, play a crucial role in improving model performance, whereas Cut-out resulted in the lowest accuracy.
These findings highlight the importance of selecting an appropriate augmentation method to improve model robustness. While Gaussian Noise and Time Shift contributed to notable performance gains, Cut-out led to a reduction in classification accuracy for certain patterns. The results suggest that augmentation strategies should be carefully tailored to the characteristics of the unseen dataset to maximize their effectiveness.
4. Discussion
The results demonstrate that the model was able to generalize well to unseen non-target movements while maintaining high classification accuracy for target patterns. This implies that the model may have effectively learned the characteristics of non-target movements, which often exhibit smooth curving trajectories. The use of Bi-LSTMs to capture long-term temporal dependencies in movement patterns and convolutional modules to extract local features may have contributed to a more balanced representation of both target and non-target patterns. Additionally, the target loss function introduced to distinguish between target and non-target patterns is likely to have been effective, leading to improved classification performance. However, the reduced recall for certain non-target patterns suggests that further refinement is necessary. Such refinement could enhance the model’s capability to distinguish between target and non-target classes more effectively.
An analysis of the confusion matrices revealed that classification performance on non-target movements varied significantly depending on the excluded class. In most cases, non-target movements were frequently misclassified as target movements, indicating a challenge in distinguishing between these categories. This trend was particularly evident for the TRA-N pattern, which showed the lowest recall among non-target movements. A considerable number of TRA-N samples were classified as target movements, supporting the earlier observation that TRA-N is inherently difficult to separate from target gestures. This difficulty likely arises due to the unique circular trajectory of TRA, which differs from the directional shifts observed in other patterns. When TRA-N was excluded from the training data, the model struggled to establish a clear distinction, leading to a high misclassification rate. Consequently, the absence of this pattern in training data severely hindered the model’s ability to generalize its classification criteria.
These findings highlight several key insights regarding the model’s classification behavior. While the model demonstrates strong classification performance for most target patterns, it faces challenges in distinguishing non-target movements, particularly when they share trajectory similarities with target movements. The variation in confusion matrices across different experimental conditions underscores the impact of the excluded non-target pattern on overall classification performance. This suggests that the model relies on learned representations that are influenced by the specific set of training samples.
Table 5 compares the F1 scores of well-known state-of-the-art deep learning models and the proposed model for unseen non-target gesture classification. To adapt image-based models such as VGG16 and ConvNext for 1D data, the original 2D convolutional layers were replaced with 1D convolutions. Additionally, Gaussian augmentation was applied to all models to enhance their robustness.
Most traditional models demonstrated relatively lower performance in classifying FLD, FLU, FRD, and FRU compared to TRA. This trend indicates that conventional models tend to classify completely different patterns from the seen classes as out-of-distribution, while their classification accuracy decreases when encountering patterns that resemble the target gestures. This phenomenon suggests that models struggle to distinguish between non-target gestures that share similar characteristics with the target classes.
Furthermore, even the recently proposed models tailored for 1D signals, such as MordenTCN and RobustTSF, exhibited a similar tendency. RobustTSF, which is known for its robustness against noise and outliers, also showed reduced accuracy when classifying non-target gestures resembling the target classes.
The proposed model, however, achieved a 1.0%p higher average accuracy compared to RobustTSF. Unlike conventional models, the proposed approach demonstrated better performance in identifying unseen data that closely resemble target gestures. This improvement can be attributed to the model’s architecture and the loss function designed specifically to handle such cases. On the other hand, the proposed model showed the lowest performance when classifying TRA among all models, indicating a limitation that warrants further research to improve model robustness in this aspect.
To further enhance classification performance, future improvements may involve integrating additional feature representations or refining training strategies. One potential approach could be increasing the diversity of non-target samples during training to improve the model’s ability to generalize across unseen movements. Additionally, incorporating temporal dynamics more effectively through advanced sequence modeling techniques may help mitigate the observed misclassification trends.
Non-target data used in this study were intentionally designed to closely resemble target gestures while differing in subtle ways. This makes their classification inherently more difficult than distinguishing gestures that are entirely dissimilar. While gestures that are obviously distinct from the target set can often be detected using methods such as anomaly detection, our focus is on the more challenging case where structural similarities exist. Previous work, such as [
29], has examined OOD classification with EMG-based gestures that are clearly different from target actions. In contrast, the present study focuses on the harder scenario where non-target gestures exhibit similar spatial or temporal structures to the target classes. This setting reflects practical scenarios where non-target actions may not be entirely novel but rather slight variations of known gestures. The results demonstrate that the proposed approach effectively addresses this challenge. Nonetheless, we acknowledge the importance of evaluating model generalizability to completely novel gestures, which could be further explored in future work.
In addition, the limited number of participants posed another challenge to the model’s generalizability. Deep learning models typically require large and balanced datasets to achieve robust performance. However, this study was constrained by a relatively small sample size—20 participants in the target group and 11 in the non-target group—which could potentially hinder generalization. To address this, the model architecture was intentionally kept compact to reduce complexity while preserving performance. Furthermore, the loss function played a key role in maintaining training effectiveness; one of its two components treated the output as a binary classification task, which helped stabilize learning even under class imbalance.
5. Conclusions
The classification of unseen non-target data refers to a model’s ability to distinguish untrained movements that resemble common daily actions. This capability is essential in real-world gesture recognition systems, especially in asynchronous settings where unintended activations must be prevented.
To address this challenge, this study designed an experiment that focused on classifying unseen non-target movements using motion data. Unlike previous studies that primarily focused on target recognition or used conventional target gestures as non-target data, this study explicitly designed unseen non-targets: five non-target patterns corresponding to each of the five target movements. Through these experiments, we aimed to assess the model’s ability to generalize classification criteria beyond the predefined training set. The proposed method was validated using arm movement data from 20 participants in the target group and 11 in the non-target group, achieving an average F1-score of 84.23%, with a non-target classification score of 73.23%.
The proposed approach demonstrated the ability to recognize untrained movements, enabling the model to adapt to novel actions and unexpected scenarios. The results also showed that non-target gestures resembling target gestures are prone to misclassification, which can be mitigated by data augmentation and a loss factor that emphasizes non-target filtering. Additionally, the choice of augmentation method is critical, as certain techniques may distort training signals and reduce performance on unseen data.
Future research should aim to improve the classification of unseen non-target patterns by addressing the limitations of training diversity. Although all unseen patterns in this study shared the characteristic of smooth movement, the proposed model struggled to distinguish some signals from target signals. A deeper understanding of this issue could be achieved by further investigating the impact of different movement patterns on classification performance. In addition, the non-target patterns used in this study were defined as smoothed versions of target movements, intentionally removing pauses and angular changes. While this design emphasizes subtle differences, it does not fully reflect the variability of natural movements that may be exhibited by real users. Future work should consider incorporating more diverse and unconstrained non-target gestures to better simulate real-world behavior.


