Article

Seismic Signals of the Wushi MS7.1 Earthquake of 23 January 2024, Viewed Through the Angle of Hydrogeochemical Characteristics

1
United Laboratory of High-Pressure Physics and Earthquake Science, Institute of Earthquake Forecasting, China Earthquake Administration, Beijing 100036, China
2
School of Earth Sciences and Resources, China University of Geosciences, Beijing 100083, China
*
Authors to whom correspondence should be addressed.
Appl. Sci. 2025, 15(9), 4791; https://doi.org/10.3390/app15094791
Submission received: 5 March 2025 / Revised: 14 April 2025 / Accepted: 21 April 2025 / Published: 25 April 2025
(This article belongs to the Section Earth Sciences)

Abstract

:
On 23 January 2024, a MS7.1 earthquake struck Wushi County, Xinjiang Uygur Autonomous Region, marking the largest seismic event in the Southern Tianshan (STS) region in the past century. This study investigates the relationship between hydrothermal fluid circulation and seismic activity by analyzing the chemical composition and origin of fluids in natural hot springs along the Maidan Fracture (MDF). Results reveal two distinct hydrochemical water types (Ca-HCO3 and Ca-Mg-Cl). The δD and δ18O values indicating spring water are influenced by atmospheric precipitation input and altitude. Circulation depths (621–3492 m) and thermal reservoir temperatures (18–90 °C) were estimated. Notably, the high 3He/4He ratios (3.71 Ra) and mantle-derived 3He content reached 46.48%, confirming that complex gas–water–rock interactions occur at fracture intersections. Continuous monitoring at site S13 (144 km from the epicenter of the Wushi MS7.1 earthquake) captured pre-and post-seismic hydrogeochemical fingerprints linked to the Wushi MS7.1 earthquake. Stress accumulation along the MDF induced permeability changes, perturbing hydrogeochemical equilibrium. At 42 days pre-Wushi MS7.1 earthquake, δ13C DIC exceeded +2σ thresholds (−2.12‰), signaling deep fracture expansion and CO2 release. By 38 days pre-Wushi MS7.1 earthquake, Na+, SO42−, and δ18O surpassed 2σ levels, reflecting hydraulic connection between deep-seated and shallow fracture networks. Ion concentrations and isotope values showed dynamic shifts during the earthquake, which revealed episodic stress transfer along fault asperities. Post-Wushi MS7.1 earthquake, fracture closure reduced deep fluid input, causing δ13C DIC to drop to −4.89‰, with ion concentrations returning to baseline within 34 days. Trace elements such as Be and Sr exhibited anomalies 12 days before the Wushi MS7.1 earthquake, while elements like Li, B, and Rb showed anomalies 24 days after the Wushi MS7.1 earthquake. Hydrochemical monitoring of hot springs captures such critical stress-induced signals, offering vital insights for earthquake forecasting in tectonically active regions.

1. Introduction

The interplay between geothermal fluids and seismic activity has become an increasingly important topic in seismotectonic research. Fault zones serve as preferential pathways for the ascent of deep crustal fluids, while those fluids can reciprocally influence fault stability through changes in pore pressure and effective normal stress. This two-way feedback mechanism creates a dynamic link between fluid migration and fault mechanics. Geothermal springs, as the surface expressions of such deep fluid systems, offer invaluable geochemical archives of subsurface processes, including tectonic stress perturbation, permeability evolution, and crustal fluid redistribution.
In tectonically active regions such as Turkey [1], the United States [2], Japan [3,4], Italy [5,6,7], Iceland [8], Morocco, China, and other countries [9,10,11,12,13,14,15,16,17,18], a growing number of studies have documented pre- and post-seismic hydrochemical anomalies in hot springs and groundwater systems. These anomalies encompass a range of physicochemical signals, including fluctuations in dissolved gases such as CO2, He, and H2 [19,20,21], major ion concentrations [8,22], stable isotopic compositions (δD, δ18O) [23,24,25], and trace elements like boron, lithium, and radon [26,27]. Such variations are frequently interpreted as sensitive responses of crustal fluids to tectonic stress accumulation and release. Numerous field observations support this interpretation. In Turkey, spring water levels and solute concentrations shifted prior to the Mw 7.7 and 7.6 Kahramanmaraş earthquakes, likely due to changes in aquifer pressure and permeability. During the 2014 South Napa earthquake in California, new springs and streams appeared, attributed to co-seismic disruption of flow paths. In Japan, increased spring discharge and gas anomalies occurred during earthquake swarms in the Matsushiro region and the Noto Peninsula, consistent with deep fluid migration. Italian studies have linked temporal variations in CO2 degassing, boron levels, and groundwater tables in the Apennines to local seismicity and evolving fault stress fields. In northern Iceland, multi-year monitoring revealed pre-seismic changes in ion concentrations, water temperature, and pH, reflecting enhanced water–rock interaction and crustal deformation. Similar geochemical responses have also been reported along fault systems in Morocco and China. These hydrogeochemical anomalies are widely attributed to stress-induced increases in fracture permeability, fault-valve behavior, or fluid overpressure, which facilitate the upward migration of deep-sourced fluids. In the aftermath of earthquakes, permeability recovery and pressure re-equilibration can further alter flow paths and chemical signatures [9,28,29,30]. Collectively, these findings highlight the diagnostic potential of hydrogeochemical monitoring in understanding subsurface processes during earthquake preparation and recovery.
The 2024 Wushi MS7.1 earthquake represents the largest seismic event in the Southern Tianshan (STS) region in the past century. Previous research focused on the seismic sequence characteristics, co-seismic deformation, fault kinematics, rupture directivity, and aftershock distribution using methodologies such as high-precision hypocenter relocation, InSAR (Interferometric Synthetic Aperture Radar), strain and tilt monitoring, and integrated geophysical surveillance systems [31,32,33,34,35,36,37,38,39,40,41]. These studies have identified the Maidan Fault (MDF) as the causative structure, describing the event as a reverse-strike-slip event with a subordinate left-lateral component. Anomalous variations in crustal deformation, gas emissions, and ionospheric have also been documented in association with this event. However, the mechanistic linkages between deep-seated fluid and fault activity in the STS remain inadequately understood.
Therefore, this study focuses on the hydrothermal system associated with the MDF, where natural gas and thermal water samples were collected pre-seismic and post-seismic event. By integrating multi-proxy geochemical analyses, stable isotopic, and structural interpretations, this study aims to elucidate the role of deeply sourced fluids in modulating fault zone mechanics and provide novel insights into fluid-driven seismic processes. The findings are expected to contribute to a deeper understanding of fluid–fault coupling and support improved earthquake hazard assessment in tectonically active regions.

2. Background

The study area (73°–80° E, 39°–42° N) lies within the STS orogenic belt (Figure 1). The MDF, acting as the root structure of the Keping Retrograde Thrust Tectonics, demarcates the boundary between the STS orogeny and the Tarim Basin [42,43]. The MDF has remained active since the Holocene, undergoing substantial deformation attributed to the southward back-thrusting of the Tianshan, the northward convergence of the Pamir Plateau, the clockwise rotation of the Tarim block, and associated intracontinental subduction processes [31,33,37,40]. Seismicity within the STS is primarily concentrated along the mountain front, particularly in an active fault like the Koping Fault. In contrast, the deep-seated MDF, despite its critical tectonic role, typically exhibits lower seismicity, with notable exceptions including the MS 6.5 Wushi North (1969), the MS6.4 Wushi (1897), and the MS5.4 Ahaqi (2009) earthquakes [42].
Geologically, the STS orogenic belt marks the collisional interface between the southern Central Asian Orogenic Belt (CAOB) and the Tarim Craton, comprising three major tectonic units: (1) the Tarim Craton, (2) the STS accretionary orogenic belt, and (3) the Middle Tianshan (MTS) Massif [44]. The Tarim Craton, one of China’s three oldest cratonic blocks, lies at the Eurasian core, bounded by the Tianshan Mountains to the north and the Kunlun–Altun Mountains to the south [45,46]. The craton’s interior is largely blanketed by Cenozoic sedimentary cover, with basement exposures along its periphery. The northwestern Tarim Craton preserves a continuous stratigraphic record from the Late Precambrian to the Devonian, dominated by shallow marine and terrestrial tuffs and sandstones. Notable unconformities include Ordovician–Silurian sequences overlain by Carboniferous and Permian deposits [44,47,48,49]. Additionally, Archean to Paleoproterozoic metamorphic complexes in the Kuruktag region form the ancient basement of the northern Tarim Craton, transitioning into mid-Paleoproterozoic marine siliciclastic formations, limestones, and plagioclase-rich sequences widespread in the central region [45,46,48].
The STS orogenic belt, situated between the Tarim Craton and the Yili-MTS Massif [50,51], consists of Precambrian basement rocks, Paleozoic sediments, high-pressure to ultra-high-pressure metamorphic rocks, ophiolites, island-arc volcanics, and granitic intrusions [44,50,52,53]. Its geological evolution is marked by extensive accretion and subduction events, as reflected in the stratigraphic successions ranging from Silurian to Carboniferous units and the widespread presence of ophiolites and metamorphic complexes from north to south [44,54]. The southern STS orogenic belt is characterized by Paleozoic formations, particularly Silurian and Devonian strata, as well as Permian volcanic sequences and fluvial deposits that remain tectonically disjointed from earlier stratigraphic units [44].
The MTS Massif, bounded by the Nikolaev Line–Narathi North Fracture and the MTS South Rim Fault, represents a microcontinental block consisting of Precambrian basement rocks and a Paleozoic continental arc system [53,55]. A representative of this massif is Baluntai area, where Cambrian basement rocks are prominently exposed. These formations include plagioclase–hornblende schists and chlorite–quartz schists from the early to middle Archean, transitioning to hornblende–actinolite schists, quartz–biotite schists, and Neoproterozoic carbonates (limestones and dolomites) in later periods [44,56]. The Paleozoic sequences within the ZTS Massif are primarily Silurian, Devonian, and Carboniferous, consisting of schists, carbonates, volcanic breccias, siliciclastics, tuffaceous siltstones, conglomerates, sandstones, and pyroclastic deposits [42,44,53].
This complex geological framework highlights the prolonged tectonic evolution of the STS orogenic belt, shaping both its seismicity and geothermal activity. Understanding its structural characteristics is essential for unraveling seismic fluid dynamics, fault-controlled fluid migration, and the interplay between lithospheric deformation and hydrothermal circulation.

3. Sampling and Analytical Methods

From 28 January to 3 February 2024, a seven-day field campaign was conducted to investigate post-seismic hydrogeochemical changes. A total of 16 hot spring water samples (S1–S16) and two gas samples (G1, G2) were collected from the MDF and its surrounding areas, with G1 corresponding to S1 and G2 to S13. Among them, G1 corresponds to S1, located at the intersection of the Taraz-Fergana Fault (TFF) and MDF, while G2 corresponds to S13, situated solely along the MDF. Due to the emergency nature of the investigation and logistical constraints in this remote region, only two gas samples were obtained. Despite the limited dataset, the selected sites provide valuable spatial contrasts for understanding gas migration behaviors under differing fault conditions. Data for S17 and S18 were obtained from previous study [57].
At each sampling location, three replicate subsamples were gathered for the analysis of major ions and hydrogen and oxygen isotopes (δ18O and δD). Before collecting the samples, each bottle was rinsed three times with the sample water. The water was subsequently filtered through a 0.22 μm filter membrane and transferred into 100 mL polyethylene bottles. These bottles were sealed with parafilm to prevent contamination from the surrounding air. To maintain the stability of trace elements, 1–2 drops of 14M nitric acid were added, adjusting the pH to below 2. Samples were then stored in a refrigerator. The water temperature (T) was measured at a depth of 20 cm using a calibrated Handheld Precision Digital Thermometer PR710A (accuracy ±0.1 °C), after allowing 5 min for thermal equilibration in flowing water. Meanwhile, pH and conductivity were assessed using a Thermo Scientific™ Orion Star™ A325 multiparameter meter (with an accuracy of 0.01, Thermo Fisher Scientific, Waltham, MA, USA). Continuous monitoring at S13 (144 km from the epicenter of the Wushi MS7.1 earthquake) (Figure 1) included water sampling every three days.
All water samples were transported to the Earthquake Prediction Laboratory of the China Earthquake Administration for hydrogeochemical analysis. Major cations (Mg2+, Ca2+, K+, Na+) and anions (SO42−, Br, Cl, NO3) were analyzed using an ion chromatograph (Thermo Scientific Dionex AQUION IC, Thermo Fisher Scientific, Waltham, MA, USA) equipped with an AS40 automatic sampler. The analysis achieved ±2% precision, with a detection limit of 0.01 mg/L. HCO3 and CO32− concentrations were measured using a ZDJ-100 potentiometric titrator (Beijing Xianqu Weifeng Technology Development Co., Ltd., Beijing, China) with 0.05 mol/L HCl, employing 0.1% methyl orange and 1% phenolphthalein as indicators, achieving a reproducibility of ±2%. Trace elemrnts (Li, B, Al, Ba, Ge, Rb, Cs, V, Be, Mo, Cr, Sr, and Sb) were analyzed using an Agilent 8900 ICP-QQQ (Agilent Technologies, Santa Clara, CA, USA). The analytical precision, expressed as the relative standard deviation (RSD), was within 5% [58]. Oxygen (δ18O) and hydrogen (δD) isotopes were analyzed using a Picarro L2140-I liquid water and vapor isotope analyzer (Picarro Inc., Santa Clara, CA, USA), referenced to Vienna Standard Mean Ocean Water (V-SMOW). National reference standards (GBW04458, 04459, 04460 [59]) were used, with analytical precision of δD < ±0.05‰ and δ18O < ±0.015‰. δ13C in dissolved inorganic carbon (δ13C DIC) was analyzed following a closed-system approach. Water samples containing at least 50 μg of carbon were purged with helium to remove residual CO2 and then transferred into pre-evacuated, helium-flushed Labco Exetainer tubes (Labco Limited, Lampeter, UK). One milliliter of 85% phosphoric acid was injected into each tube, and the reaction was carried out under sealed conditions to prevent isotopic exchange with atmospheric CO2 [60]. After a 24 h reaction period, the resulting CO2 was extracted, purified, and analyzed using a Picarro G2201-I Carbon Isotope Analyzer (Picarro Inc., Santa Clara, CA, USA), with the international standard NBS-18 [61] as a reference. The overall analytical uncertainty was less than 0.1‰. The charge balance error was within ±10%, ensuring reliable major ion data [30].
ib % = cations   anions 0.5 ( cations + anions ) × 100
Gas samples were collected via the upward air venting method to minimal contamination. A glass bottle was connected to a funnel and filled with spring water to remove air bubbles. The bottle was then inverted, allowing hot spring gases to displace the water entirely. After filling, the funnel was detached underwater, and the bottle was sealed to prevent leakage or contamination. Gas samples were analyzed at the Lanzhou Oil and Gas Resources Research Center, Chinese Academy of Sciences, for composition, helium isotope ratios (3He/4He and 4He/20He), and δ13C in CO213C CO2). Gas composition was determined using a MAT 271 mass spectrometer (Thermo Fisher Scientific, Bremen, Germany; RSD < 5%). δ13C was analyzed using a gas chromatograph (Agilent 6890) coupled with a Thermo Fisher Scientific Delta Plus XP stable isotope ratio mass spectrometer (Thermo Fisher Scientific, Bremen, Germany). δ13C values were reported relative to the Vienna Pee Dee Belemnite (PDB) standard, with a measurement error of ±0.2‰. Helium isotopes were analyzed after a two-stage separation and purification process for He and Ne, utilizing a Noblesse rare gas isotope mass spectrometer [62]. 3He/4He and 4He/20Ne were measured in static mode and calibrated to air standard, with ±3% analytical error [63].

4. Results

The chemical and isotopic compositions of the spring waters are summarized in Table S1. Spring temperatures range from 4.7 to 50 °C. The dominant cations are ordered as Na+ > Ca2+ > Mg2+ > K+ > Li+, with Na+ concentrations ranging from 10.42 to 1018.80 mol/L, Ca2+ from 20.93 to 538.95 mg/L, Mg2+ from 6.95 to 116.15 mg/L, K+ from 1.18 to 39.49 mg/L, and Li+ from 0 to 3.16 mg/L. The primary anions follow the order Cl > HCO3 > SO42− > NO3 > F > Br. Cl concentrations range from 9.50 to 2195.86 mg/L, HCO3 from 118.58 to 1959.57 mg/L, SO42− from 76.03 to 797.38 mg/L, NO3 from 0 to 34.04 mg/L, F from 0.64 to 4.89 mg/L, and Br from 0 to 4.89 mg/L. The measured pH values range from 6.39 to 8.17, indicating neutral to slightly alkaline conditions. Conductivity ranges from 539 to 3635 μs/cm. δ18O and δD values ranged from −13.22‰ to −6.16‰ and −93.34‰ to −29.81‰, respectively. SiO2 concentrations range from 3.19 to 47.12 mg/L, reflecting varying degrees of water–rock interaction and geothermal input.
Hydrochemical anomaly thresholds were established using time-series monitoring data from the S13 spring. Here, the background concentrations were defined by the mean values, while anomalous levels were determined using ±2σ (standard deviation) thresholds. The mean concentration of Na+ is 466.73 mg/L, Cl is 137.67 mg/L and SO42− is 155.42 mg/L. The mean value of δ18O is −10.20‰, δD is −64.70‰, and δ13C DIC is −3.60‰. The mean concentrations of 13 trace elements (Li, B, Al, Ba, Ge, Rb, Cs, V, Be, Mo, Cr, Sr, and Sb) in spring water is 688.57, 4987.94, 32.47, 91.29, 19.21, 26.37, 45.60, 0.07, 0.03, 0.17, 0.18, 480.28, and 0.05 μg/L. More detailed information can be seen in Tables S2 and S3.
The O2 concentrations of the gas samples from S1 and S13 are 0.31% and 0.02%, respectively, indicating minimal atmospheric contamination. The helium isotope ratios further confirm negligible atmospheric contamination during sampling and analysis. The 4He/20Ne ratios (46 and 737) significantly exceeded the atmospheric ratio (0.32) (Table 1). The gas composition is CO2-dominated at S1 and N2-dominated at S13. The δ13C values of CO2 are −4.182‰ at S1 and −10.3‰ at S13.

5. Discussion

5.1. Hydrochemical Characteristics and Evolution of Spring Water

To investigate the origins, circulation pathways, and geochemical evolution of spring waters in the MDF system, a multi-method analytical framework was applied. Major ion compositions were analyzed using Piper diagrams to classify hydrochemical types and assess potential mixing processes. Stable isotopes (δD and δ18O) were utilized to trace recharge sources, evaluate circulation depth, and identify potential evaporative enrichment. The Na-K-Mg ternary diagram was employed to evaluate the chemical maturity of geothermal fluids, while geothermometric modeling was conducted to estimate deep reservoir temperatures and infer the depth of thermal water circulation. This integrated approach allows for a comprehensive interpretation of the spatial dynamics governing both cold and thermal spring systems.

5.1.1. Hydrochemical Facies and Mixing Indicators

Piper diagram analysis indicates that cold springs in the study area are predominantly enriched in Ca2+ and Mg2+, with Ca2⁺ being the dominant cation. Only the thermal springs S13 and S14, along with cold springs S6, S7, and S16, fall within the Na+ and K+ enriched zones (Figure 2), indicating the presence cation exchange processes. These cold springs are mainly of the Ca-HCO3 and Ca-Mg-Cl types, typically reflecting interactions with carbonate lithologies or contributions from young, recently recharged groundwater. Elevated Ca2+ concentrations likely result from carbonate mineral dissolution, releasing Ca2+ and HCO3 and forming Ca-HCO3 type waters. Mg2+ enrichment may arise from geochemical reactions with dolomite [CaMg(CO3)2] or other Mg-rich carbonates.
Thermal spring S13 belongs to the Na-HCO3 type, whereas S14 and cold spring samples S6, S7, and S16 exhibit Na-Cl characteristics. These discrepancies likely result from hydrothermal activity, evaporation, or extended water-rock interaction. The enrichment of Na⁺ and K⁺ indicates active ion exchange, particularly in environments with feldspathic or clay-rich host rocks (e.g., illite, montmorillonite), which modulate Na⁺ and Ca2⁺ concentrations and affect the carbonate equilibrium HCO3 and CO32−. In Na-Cl waters, elevated Na⁺ is associated with ion exchange with sodium-rich minerals (e.g., albite) in surrounding rocks [30,66,67].
The Na-HCO3 and Na-Cl types in S13 and S14 suggest hydrothermal influences or evaporative concentration. Evaporation processes can enhance total dissolved solids, particularly in semi-confined aquifers or zones with active surface–groundwater interaction, raising conductivity and altering ion composition. Hydrothermal processes play a critical role in modifying the fluid chemistry. Rising thermal fluids, when mixing with cold spring water, can markedly alter ionic ratios. These fluids transport dissolved gases (e.g., CO2, H2S) and minerals (e.g., sulfates, chlorides) [68,69], altering cation (Ca2+, Mg2+, Na⁺) and anion (Cl⁻, SO42−, HCO3⁻) balances. The following chemical equations illustrate these reactions:
CaMg(CO3)2(s) + 2CO2(aq) + 2H2O(l)→Ca2+(aq) + Mg2+(aq) + 4HCO3(aq)
NaAlSi3O8(s) + 4CO2(aq) + 4H2O(l)→Na+(aq) + Al(OH)4(aq) + 3SiO2(aq) + 2HCO3(aq)
CaSO4(s) + CO2(aq) + H2O(l)→Ca2+(aq) + SO42−(aq)
Variability in groundwater flow paths and water–rock interactions likely drive distinct hydrochemical signatures. Na⁺ and K⁺ enriched samples (S13, S14, S6, S7, S16) reflect progressive geochemical evolution under complex hydrogeological settings, where multi-directional fluid migration occurs along varied lithologies. In the MDF, extended water–rock interactions and complex flow paths may enhance ion concentration diversity. Tectonic activity (e.g., fault activation) may promote mixing between thermal and cold springs, forming hybrid waters with distinct chemical signatures. These mixed compositions may display anomalous signatures, indicating diverse hydrogeological conditions and flow trajectories.

5.1.2. Isotopic Tracing of Recharge and Flow Depth

The δ18O–δD relationship shows that local meteoric water plots below the Global Meteoric Water Line (GMWL) likely reflect evaporative enrichment due to the region’s arid climate and continental interior location. Atmospheric moisture is primarily derived from westerly circulation with significant contributions from local evaporative recycling [58]. Most groundwater samples plot to the left of both the global and local meteoric lines, suggesting recharge primarily from meteoric precipitation with potential inputs from glacial meltwater or fracture-zone derived deep groundwater [57]. The δ-values of hot springs S13 and S14 fall closer to the local meteoric line, indicating deeper circulation and isotopic homogenization due to prolonged subsurface residence and geothermal heating. In contrast, the shallower cold springs exhibit more depleted isotope values consistent with rapid recharge and minimal interaction. Isotope values increase with decreasing elevation (Figure 3), likely due to altitude-driven isotope fractionation. Oxygen drift is accounted for, and groundwater recharge elevation (H) is determined using δD-elevation relationships.
H = (δG + δP)/k + h
where δG represents the δD value of the sampling point, δP is the δD value of local precipitation, k is the atmospheric δD gradient (−0.25‰/100 m), and h is the elevation of springs (m). The isotope-weighted mean δD of Hetian precipitation (−41‰) was used [57]. Calculated recharge elevations (1435–4033 m, avg. 2514 m) align with expected glacial meltwater origins, confirming elevation effects on isotope composition.

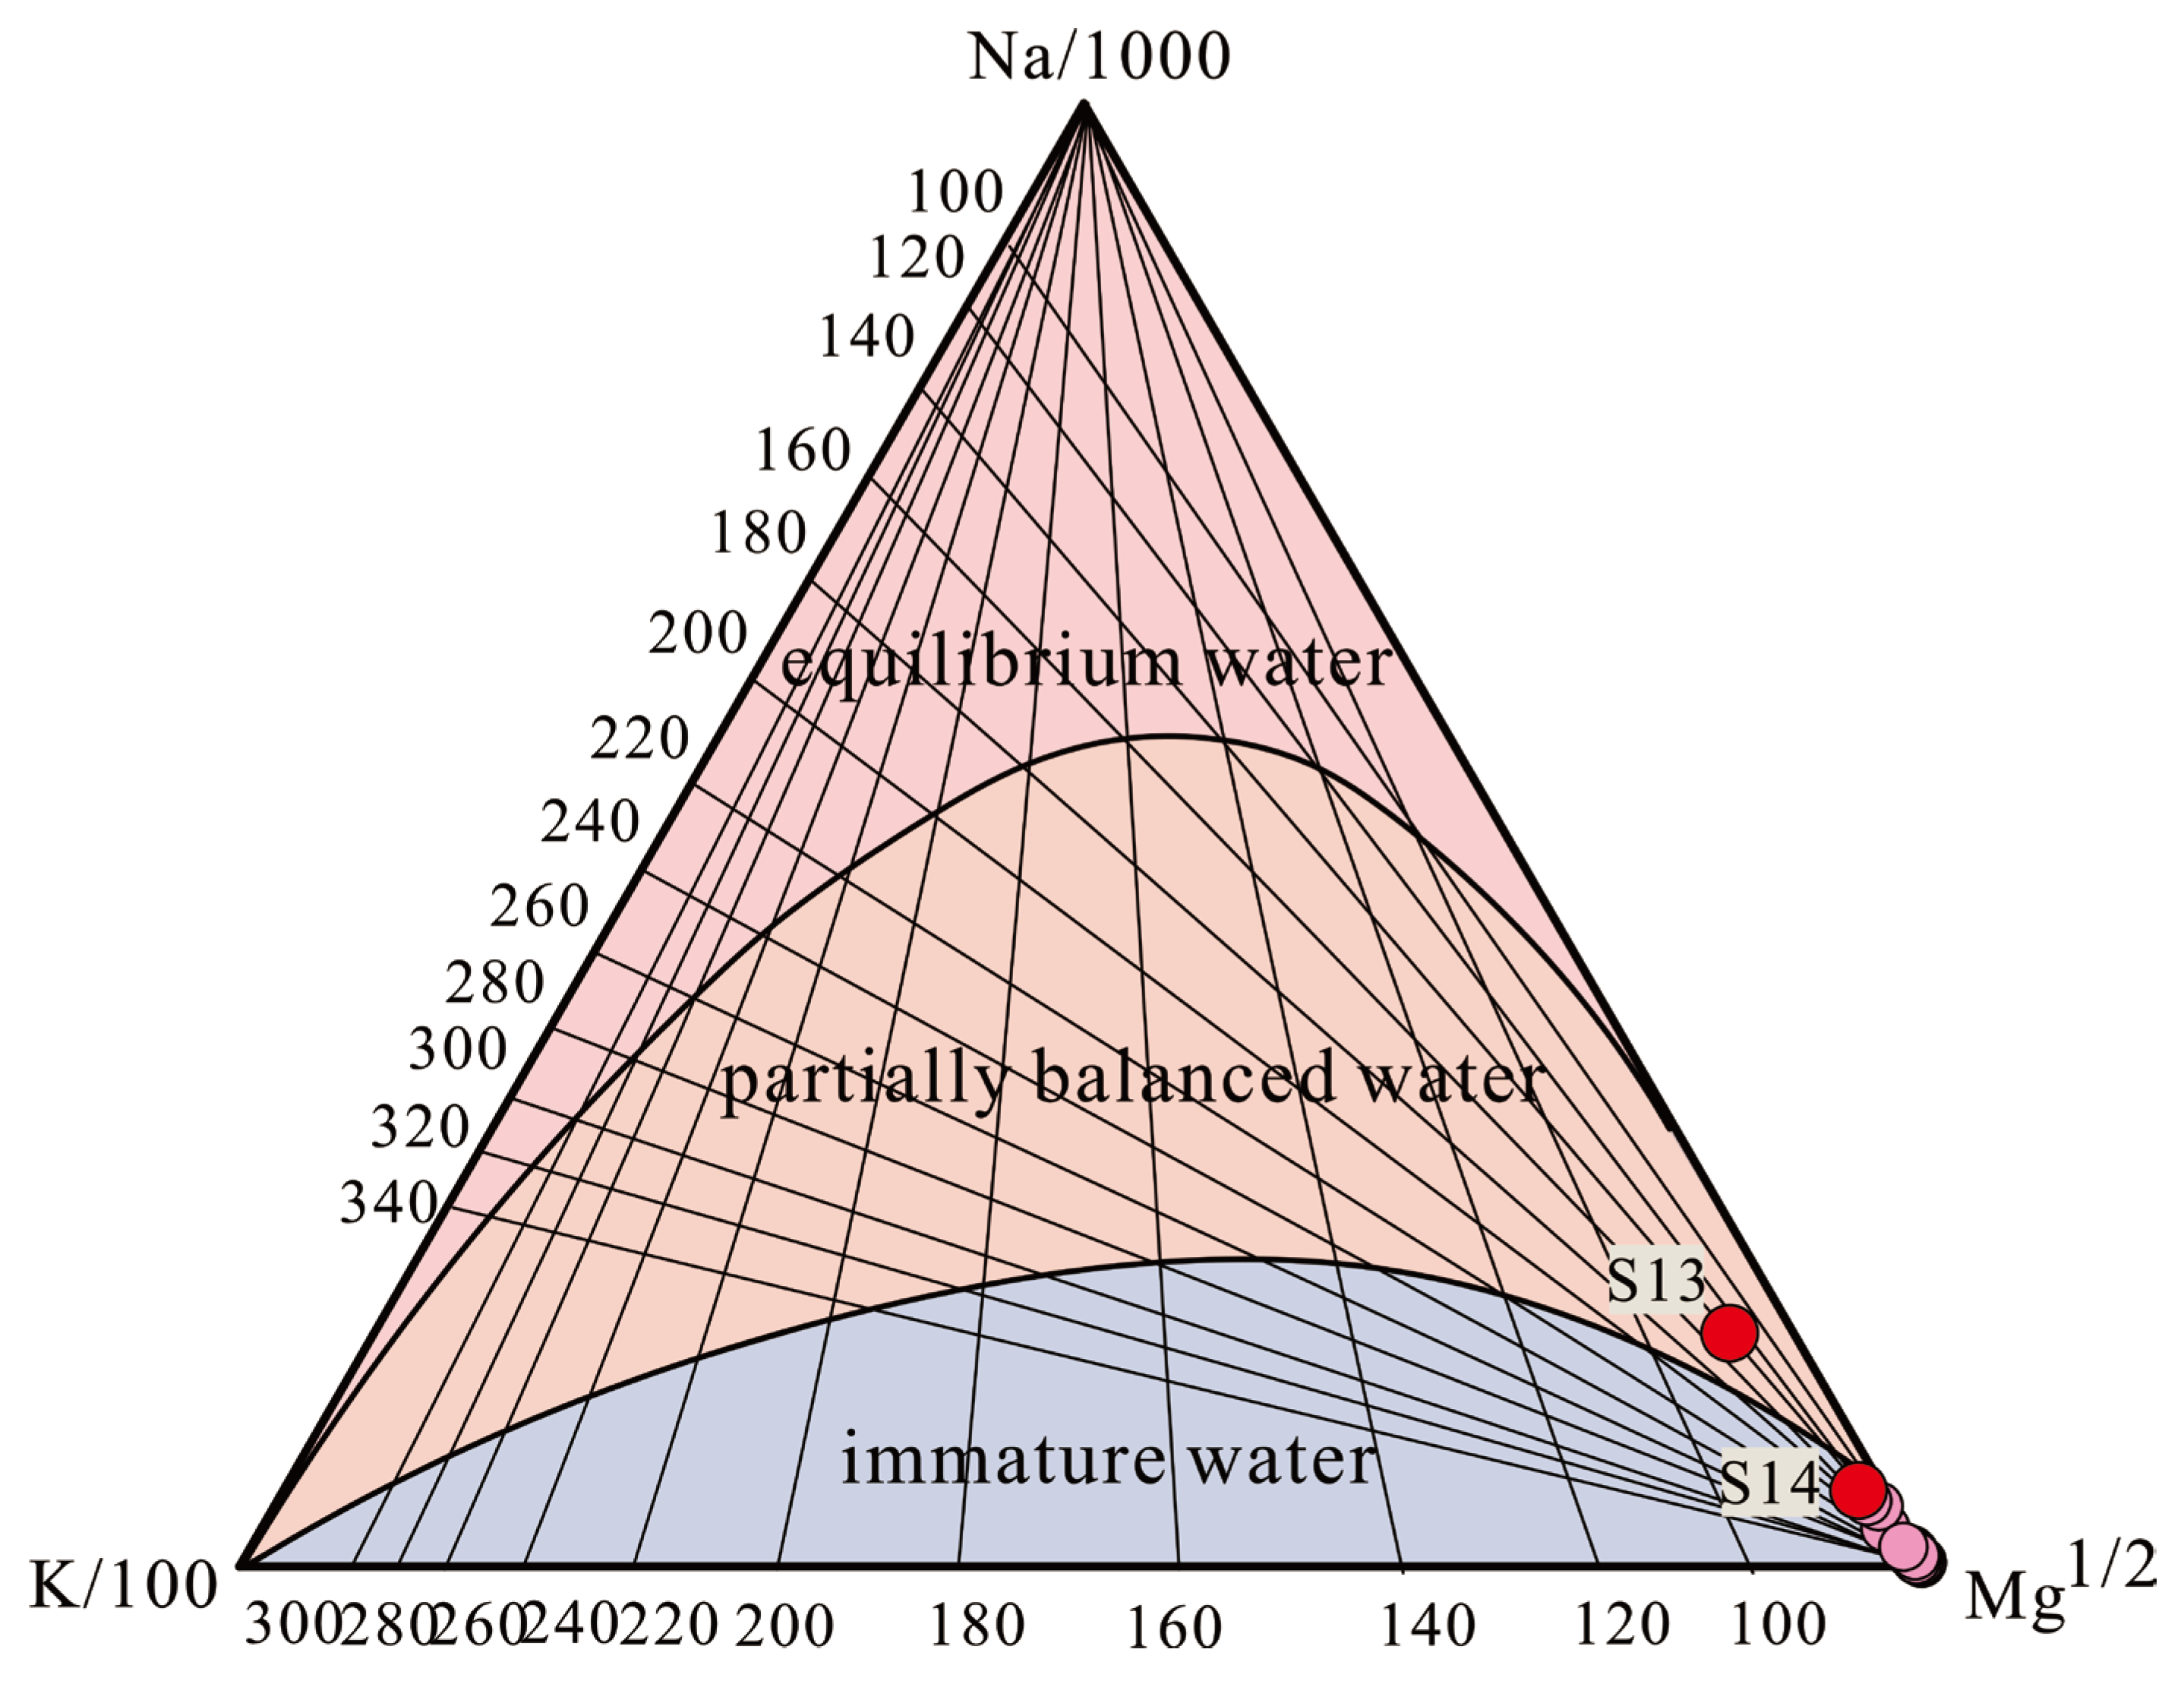
5.1.3. Fluid Maturity and Geothermal Equilibrium

The Na-K-Mg triangulation is a useful tool for assessing the reaction time and chemical maturity of geothermal fluids during water–rock interaction [70]. As shown in Figure 4, sample S13 falls within the partial equilibrium zone, and S14 lies near this boundary, indicating ongoing but incomplete water–rock equilibration. All remaining samples are immature, implying limited residence times and shallow circulation systems. Magnesium is a sensitive indicator in this diagram, as it is rapidly removed in mature geothermal systems. Elevated Mg2⁺ concentrations in S13 and S14 imply short fluid–rock interaction periods and low chemical maturity. This suggests limited hydraulic connectivity to deep reservoirs and supports classification as an intermediate geothermal system. Cold springs show uniformly immature signatures, indicative of shallow meteoric recharge and minimal subsurface interaction.

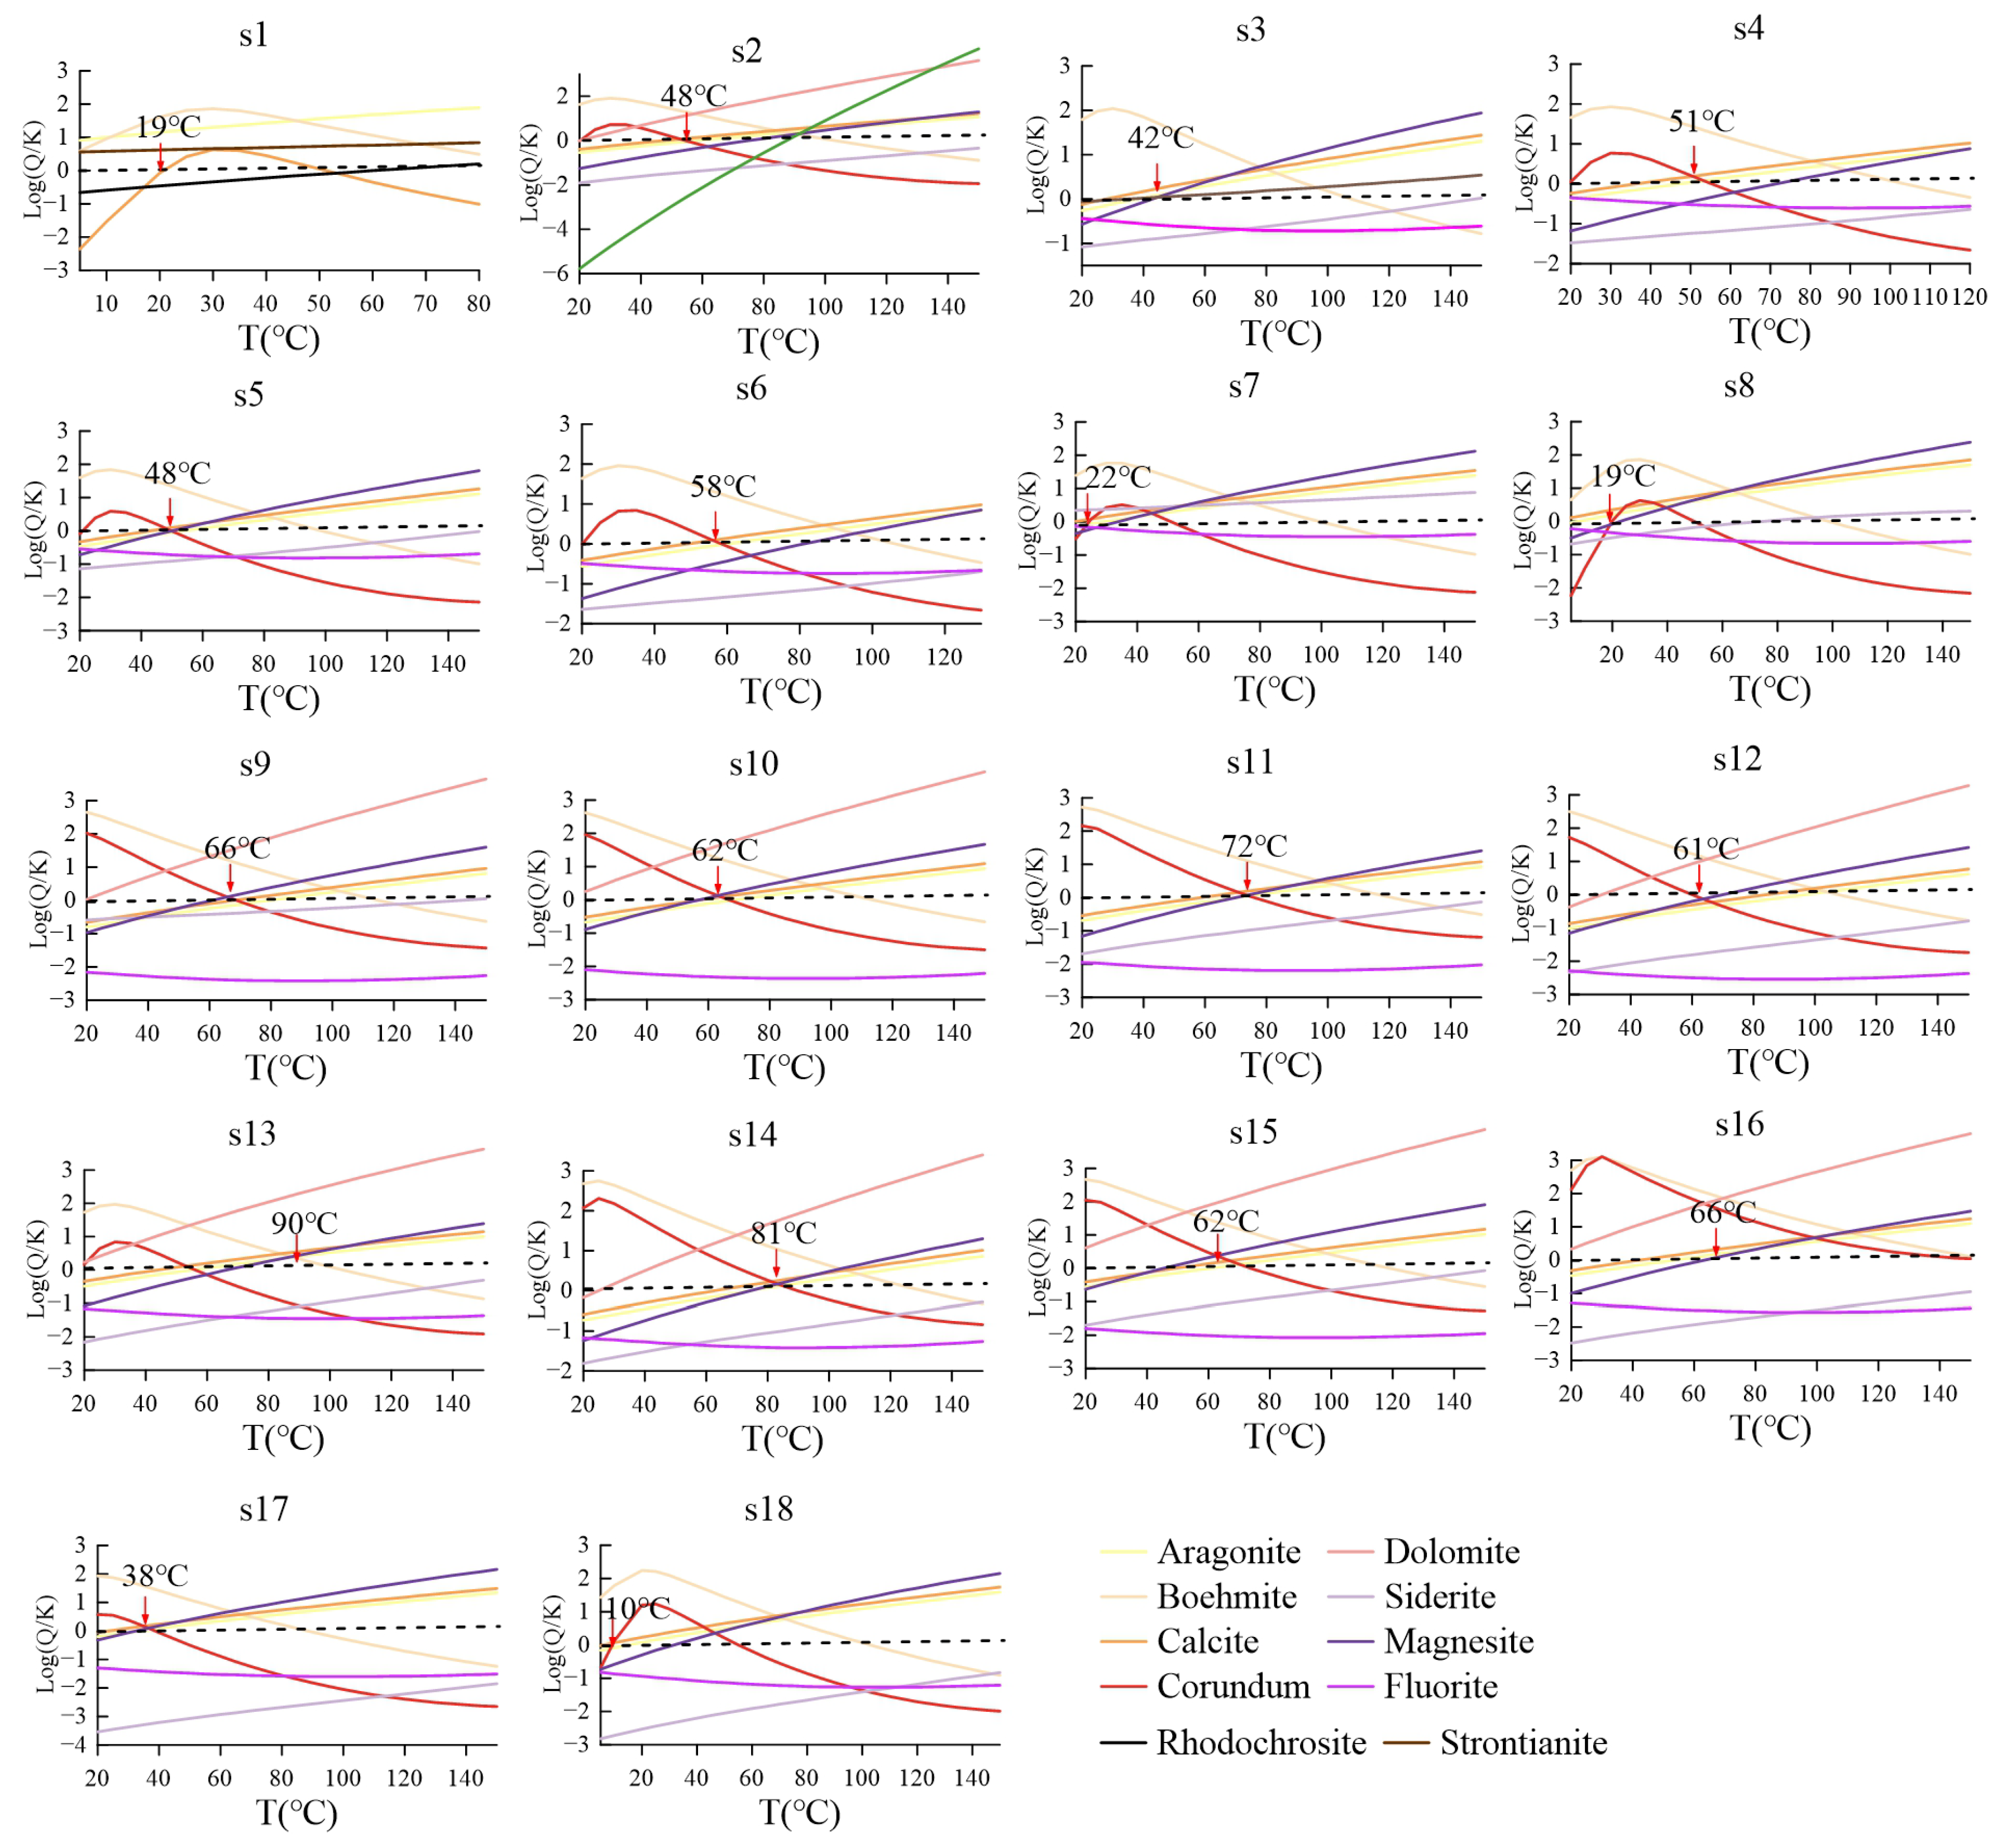
5.1.4. Reservoir Temperature and Circulation Depth Estimates

Cation geothermometers require chemical equilibrium for reliable deep reservoir temperature estimates. As shown in Figure 4, none of the samples exhibit full equilibrium, due to dilution or mixing between deep thermal fluids and shallow cold waters. Therefore, cation geothermometers may over- or under-estimate true reservoir temperatures in such settings. In immature systems, silica-based geothermometers are more suitable [71], although their accuracy depends on silica phase equilibrium (e.g., quartz vs. chalcedony vs. amorphous silica). To improve estimation, a multi-mineral equilibrium method is used to determine the temperature at which all selected minerals (e.g., quartz, chalcedony, calcite) reach saturation (SI = 0), representing the deep reservoir temperature (Figure 5). The depth of sub-thermal water circulation is estimated using
H = T - T 0 g + h
The average temperature in the study area is taken as 3 °C, the geothermal temperature gradient is 2.5 °C/100 m, and the depth of the normothermic zone is 30 m [57]. As seen in Table 2, the study area’s hot springs have reservoir temperatures of 18–90 °C and circulation depths of 621–3492 m. Most of the hot springs are classified as medium-low temperature geothermal resources, with only S13 classified as a medium-high temperature geothermal resource. The remaining hot springs have shallow circulation depths and are characterized by immature water, likely mixed with shallow cold water.

5.2. Isotopic Characteristics and Genesis of Spring Gas

To constrain the origin and migration pathways of gases within the Maidan Fault system, we integrated noble gas and carbon isotope data with geophysical evidence, particularly Poisson’s ratio anomalies. This multi-proxy approach enables distinction between mantle- and crustal-derived volatiles and reveals structural controls on fluid ascent.
In natural environment, tritium (3He) is a primordial isotope, while deuterium (4He) predominantly originates from the radioactive decay of uranium (U) and thorium (Th). The 3He/4He ratio serves as a tracer for helium sources: mantle-derived helium (1.1 × 10⁻⁵ to 1.4 × 10⁻⁵), crustal helium (2 × 10⁻⁸), and atmospheric helium (1.39 × 10⁻⁶) [22,64]. The mantle helium percentage is estimated using the atmospheric correction (Rc/Ra) derived from the observed 3He/4He values. The combined analysis of 3He/4He and 4He/20Ne ratios provides insights into helium origin and atmospheric mixing (Figure 6a). Sample S1 exhibits 46.48% mantle-derived helium, indicating significant interaction with deep-sourced gases during ascent. This is likely driven by active tectonism or geothermal flux that facilitates mantle gas migration along fault conduits. Conversely, S13 contains only 5.01% mantle helium, indicating limited deep gas interaction. Instead, S13 helium primarily derives from U-Th decay, indicating stronger crustal influence. This implies a relatively quiescent tectonic environment, or alternatively, enhanced trapping of radiogenic helium with shallow fracture networks.
The δ13C CO2 values in thermal springs provide further constraints on carbon sources. Different reservoirs have distinct δ13C CO2 values: Mid-Ocean Ridge Basalt (MORB) has a δ13C CO2 value of −6.5‰, carbonate has a δ13C CO2 value of 0‰, and organic sources have a δ13C CO2 value of −30‰ [30,64]. However, isotopic fractionation during CO2 migration complicates unambiguous source attribution [11,64]. Thus, dual-parameter plots of δ13C CO2 versus CO2/3He ratios are employed to apportion carbon sources (Figure 6b). Quantitative deconvolution of CO2 origins in S1 (Table 1) reveals (1) Carbonate dissolution (82.7%): the moderately enriched δ13C CO2 value (−4.2‰) and high CO2/3He ratio (3.49 × 10¹⁰) are indicative of extensive fluid–rock interaction with carbonate-rich basement lithologies. (2) MORB input (4.3%): slight δ13C depletion and Rc/Ra = 3.71 (46.48% mantle He) suggest active mantle degassing through reactivated faults at the TFF-MDF intersection. (3) Organic sources (13.0%): minor inputs inferred from residual isotope depletion δ13C CO2 signature. These observations indicate that S1 is influenced by deep-sourced mantle gases, facilitated by hydrothermal alteration and calc–silicate breakdown, with mantle-derived volatiles migrating upward along structurally reactivated zones consistent with active subduction processes beneath the STS orogen [42,44,63]. In contrast, S13 exhibits a δ13C CO2 value of −10.3‰, aligning closely with the calcite precipitation trend at approximately 170 °C. This suggests that CO2 in S13 arises primarily from thermal decomposition of carbonates and temperature-driven fluid–rock reactions. The alignment with the calcite equilibrium line in Figure 6b further indicates CO2 fractionation during precipitation processes within a thermally moderated system.
Poisson’s ratio anomalies offer complementary evidence for fluid presence and mechanical crustal properties. As shown in Figure 7, the high Poisson’s ratio (4%) at S1 implies notable fluid enrichment and crustal plasticity, facilitating the ascent of deep-origin gases. S1 is situated at the intersection of the TFF and MDF, a tectonically active zone. Seismic and geophysical studies [54,55,72,73,74] have identified low p- and s- wave velocities and high conductivity zones at this intersection, supporting the presence of a fluid-rich, deformable crust conducive to deep fluid migration. Elevated 3He/4He ratios at S1 further confirm mantle-derived gas input. In contrast, S13 exhibits a significantly low Poisson’s ratio (–8%), indicative of a more rigid crust with limited tectonic activity. The higher wave velocities observed suggest intact rock structures and thinner sedimentary layers, which act as barriers to deep gas ascent. Located solely along the MDF, S13 likely experiences less structural deformation, limiting vertical migration of mantle-derived fluids. Thus, S13’s gas composition is dominated by shallow crustal contributions, such as carbonate decomposition and hydrothermal reactions.
The isotopic and geophysical data converge to indicate that S1 is strongly influenced by mantle-derived and carbonate-sourced volatiles transported through reactivated fault zones, whereas S13 is dominated by crustal helium and thermally evolved CO2 in a more structurally confined setting. These results highlight the importance of combining isotopic signatures with physical crustal properties to distinguish gas origins and infer fault–fluid coupling mechanisms in seismically active regions.

5.3. Interpretation of Earthquake-Induced Anomalies

5.3.1. Major Ions and Isotopic Perspectives on Earthquake Anomalies

Tectonic stress accumulation in fault zones progressively alters permeability structures and fluid migration pathways, disrupting hydrogeochemical equilibrium prior to seismic rupture [8,30,67]. Continuous monitoring at S13 captured systematic anomalies in Na+, Cl, and SO42− concentrations and δ18O, δD, and δ13C DIC isotopic values months before the Atushi MS5.4 earthquake and Wushi MS7.1 earthquake (Figure 8). Between May 29 and August 15, 2023, stress accumulation along the MDF triggered aseismic creep and intermittent stick-slip events, causing pre-seismic fluctuations in major ion concentrations without surpassing the shear strength of the fault’s locked segment. During this period, δ13C DIC values remained stable (−2.84‰ to −4.37‰), indicating a persistent deep-sourced fluid regime.
Forty-one days pre-Atushi MS5.4 earthquake, a transient drop in Na⁺ concentrations (below 2σ) indicated the activation of shallow secondary fractures, allowing infiltration of low-temperature meteoric water, likely from snowmelt, into the hydrothermal system [23,25,75]. Thirty-nine days pre-Atushi MS5.4 earthquake, a sustained decline in δ18O marked the onset of fracture opening, enhancing the influx of deep-seated fluids and intensifying water–rock interaction. Thirteen days pre-Atushi MS5.4 earthquake, δD, δ18O, and Na⁺ concentrations rose concurrently, indicating the simultaneous activation of both shallow and deep fractures systems under transmission tectonic stress. This sequential pattern delineates the rupture preparation phase of the Atushi fault: initial shallow fracture dilation triggered by meteoric water infiltration, followed by deeper fracture preparation and ascent of high-temperature fluids. These findings also suggests that MDF was approaching a critical stress threshold, with the Atushi MS5.4 earthquake functioning as a foreshock adjustment for the Wushi MS7.1 earthquake. It is worth noting that in both events, Na⁺ concentrations initially dropped below the −2σ threshold, followed by a gradual rebound prior to the mainshock; however, this rebound was more sustained and pronounced in the Wushi sequence, reflecting deeper fracture activation and stronger fluid ascent.
Forty-two days pre-Wushi MS7.1 earthquake, δ13C DIC peaked beyond +2σ (−0.78‰), indicating the expansion of deep fracture that facilitated upwelling of 13C-rich CO2—potentially derived from high-temperature decarbonation of carbonate rocks or mantle-sourced fluids—leading to δ13C DIC enrichment [29]. Thirty-eight days pre-Wushi MS7.1 earthquake, Na+ and SO42− concentrations and δ18O exceeded the −2σ threshold and showed progressive increases, reflecting synchronized rupture of deep and shallow fracture and complex mixing with high-salinity deep fluids and cold meteoric waters. Between 23 days pre-Wushi MS7.1 earthquake and the mainshock, these parameters exhibited secondary decline–increase fluctuations, interpreted as multi-phase stress release and dynamic fracture network adjustments. Persistent CO2 from depth continued to promote intense water–rock interactions, accelerating mobilization of major ions. Twenty-four days post-Wushi MS7.1 earthquake, fracture closure curtailed deep fluid input, causing negative anomalies in ion concentration and δ13C DIC (−4.89‰), signaling reestablishment of a shallow hydrogeochemical equilibrium. Ion and isotope fluctuations during the 38–23 days pre-seismic interval further indicate asynchronous activation of fractures at different depths. Initial deep-fracture fluid upwelling (synchronous increase in Na+, SO42−, δ18O) followed by shallow cold water mixing (δ18O, ion decline) reflects a competitive mechanism, highlighting spatiotemporal heterogeneity in multi-scale rupture propagation. Comparable hydrogeochemical anomalies have also been observed across tectonically diverse regions. Prior to the 2023 Mw7.7 and 7.6 Kahramanmaraş earthquakes in Türkiye, İnan et al. (2024) documented sustained increases in Cl and SO42− and a pronounced δD decline in Ayran spring waters six months before the events [1]. In the Matsushiro earthquake swarm in Japan, Zandvakili and Nishio (2024) observed increasing trends in major ions (Na, K, Al, Cl, Br, B, SiO4) and isotopic signatures (δD, δ18O, δ13C) in fault-zone wells [3]. Similarly, in northern Iceland, variations in major cations and isotopes were reported four to six months before two M > 5 earthquakes in 2012 and 2013 [25]. These cross-regional cases reinforce the interpretation that pre-seismic stress promotes vertical migration of deep, ion-rich fluids and alters hydrochemical baselines, validating the universality of this mechanism.
Compared to the Atushi MS5.4 earthquake, the hydrogeochemical responses of the Wushi MS7.1 earthquake was notably more sustained and intense. The S13 monitoring site, located along the MDF where the Wushi MS7.1 earthquake nucleated, exhibited hydrogeochemical anomalies lasting from 38 days before to 24 days after the earthquake, with significantly higher intensity and duration than the Atushi MS5.4 earthquake, confirming the observation that “monitoring sites within the same tectonic belt are more sensitive to the main shock”.

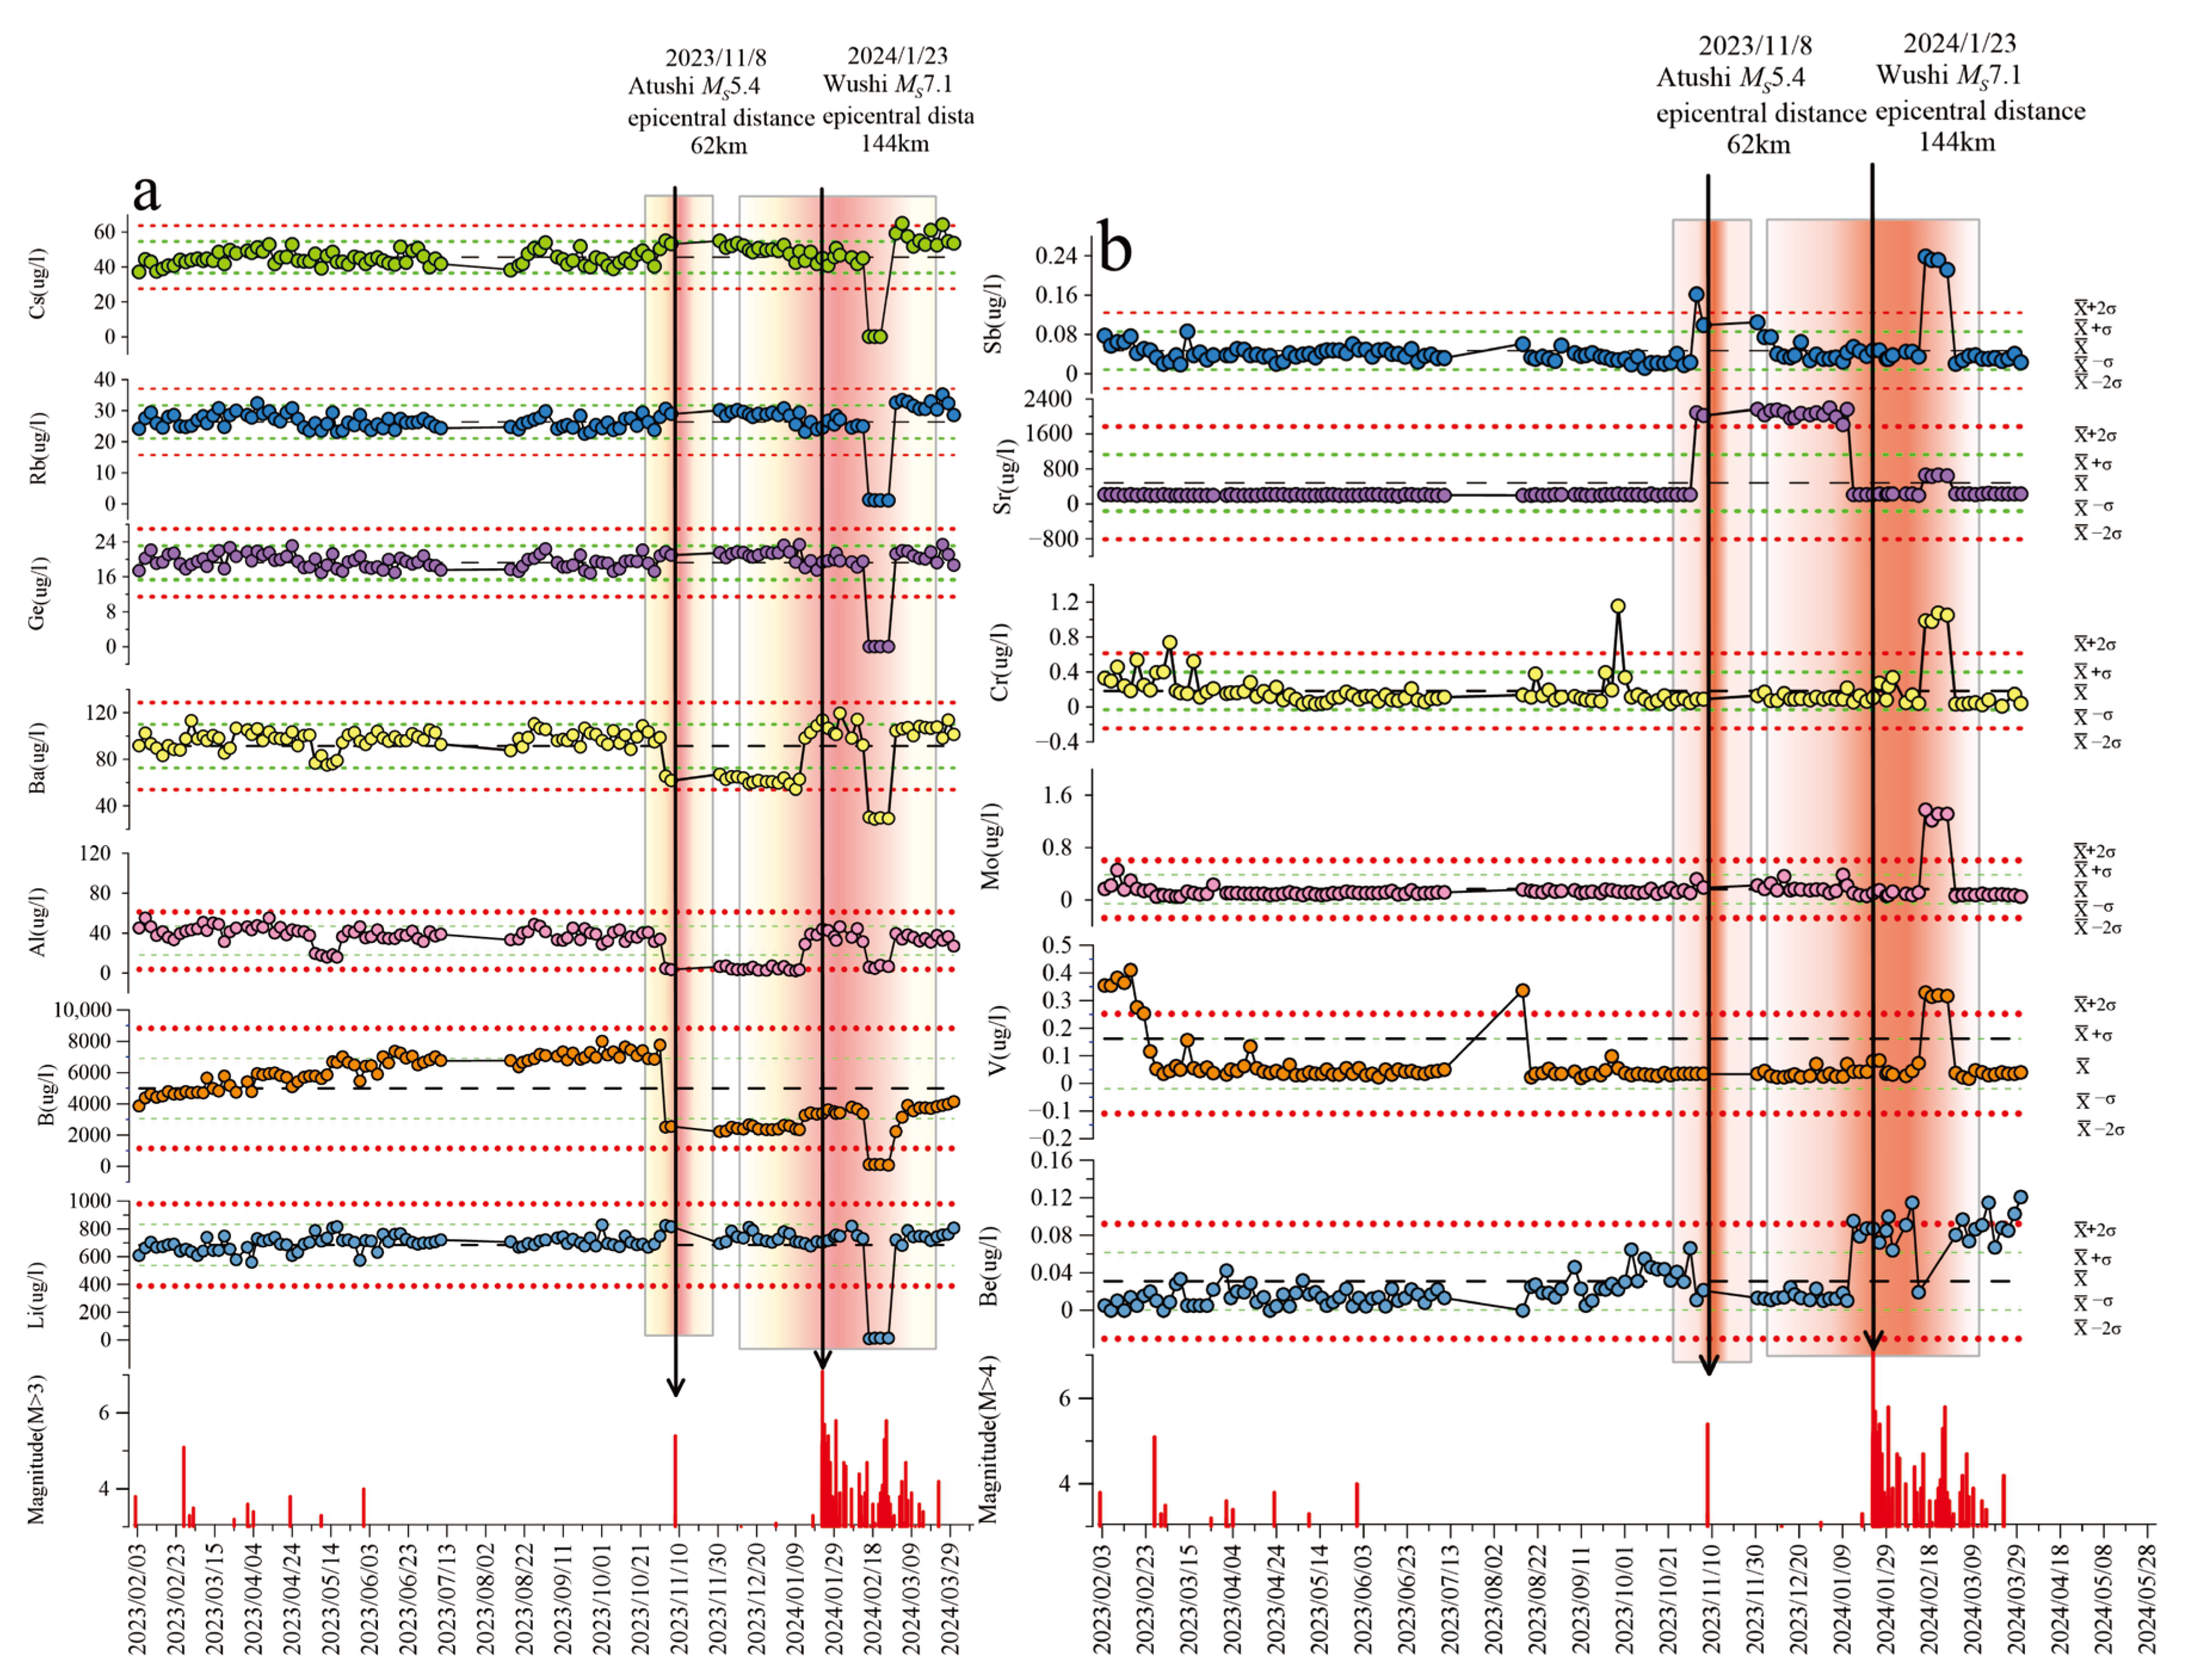
5.3.2. Trace Element Signatures of Earthquake Anomalies

This section examines trace element dynamics in hot spring waters associated with the Wushi MS7.1 earthquake to elucidate the geochemical mechanisms underpinning seismic stress–strain processes. Trace elements are categorized based on their post-seismic trends: (1) Li, B, Al, Ba, Ge, Rb, and Cs exhibited notable declines (Figure 9a); (2) Be, V, Mo, Cr, Sr, and Sb showed significant enrichment (Figure 9b). These divergent element behaviors, coupled with major ion anomalies, reflect the interplay between deep-seated and near-surface fracture systems [30,37], which jointly drive hydrogeochemical re-equilibration during seismic cycles.
For the first group, five days before the Atushi MS5.4 earthquake, concentrations of Ba, Al, and B dropped sharply (<−2σ), indicating rapid expansion of shallow fractures and subsequent mixing with low-temperature meteoric water [25,76,77]. This influx of cold snowmelt diluted trace element concentrations, while oxidation of pyrite generated SO42−, inducing BaSO4 oversaturation and precipitation, further contributing Ba depletion. These anomalies coincided with δD and δ18O depletions (cold water influx) and a Na+ concentration drop (dilution signature), supporting shallow fracture-mediated mixing. Between 38 and 12 days pre-Wushi MS7.1 earthquake, these elements fluctuated near baseline, suggesting partial deep-fracture connectivity. The positive δ13C DIC anomaly reflects continuous deep-sourced CO2 influx. During this phase, the input of high-temperature geothermal fluids partially offset dilution effects, maintaining elevated Li, B, and Rb levels [17]. After the Wushi MS7.1 earthquake (post-day 24), negative δ13C DIC anomaly and pH drop (to 6.3) indicated reduced deep fluid input due to deep fracture closure. This led to significant depletion of Li, B, Rb, and Cs. Under mildly acidic conditions, Al and Ge were adsorbed onto Fe-hydroxides, while sustained SO42− enrichment (Figure 9) promoted BaSO4 precipitation. By day 34 after the Wushi MS7.1 earthquake, concentrations of these elements returned to their average levels.
For the second category of elements, five days before the Atushi MS5.4 earthquake, Sr and Sb concentrations surged above +2σ, likely driven by stress-induced dissolution of near-surface carbonates (calcite, aragonite) [17] and plagioclase, releasing Sr2+. This enrichment persisted until 12 days pre-Wushi MS7.1 earthquake, indicating sustained activation of secondary fracture network [65,78]. Concurrent oxygen influx into shallow fractures oxidized stibnite (Sb2S3), mobilizing Sb as Sb(OH)6. Twelve days pre-Wushi MS7.1 earthquake, Be concentrations exceeded +2σ and continued rising, likely due to the propagation of secondary fracture within the principal fault zone. These fractures facilitated both mechanical disruption and acidic leaching of Be-bearing minerals (e.g., beryl), with mildly acidic conditions (pH 6.3; Table S2) enhancing Be2+ release. Post-Wushi MS7.1 earthquake (day 24), further mechanical and geochemical weathering of Be-rich minerals occurred within shallow fractures, resulting in additional Be2+ mobilization. At this stage, Sr also slightly increased, reflecting contributions from both deep granitic sources (as inferred from pre-Wushi MS7.1 earthquake δ18O anomalies) [8,13] and near-surface carbonate dissolution. Simultaneously, Cr and V concentrations rose as the pH approached the zero-point charge of Fe/Mn oxides (pH 6–7), promoting the desorption of CrO42− and VO43−. Mild acidity also reduced Sb(OH)3 adsorption, enhancing Sb mobility. Oxygen penetration facilitated pyrite (FeS2) oxidation, generating SO42− and H+, and mobilizing MoO42− and Sb(OH)6. Elevated SO42− concentrations suppressed molybdate re-adsorption, sustaining Mo enrichment. By day 34 post-Wushi MS7.1 earthquake, concentration of all trace elements except Be returned to baseline. The persistent Be enrichment suggests incomplete sealing of shallow fracture closure.
The contrasting post-seismic behaviors of trace elements—namely, the depletion of Li, B, and Rb, and the enrichment of Be and Sr—can be attributed to differences in their geochemical mobility, mineral-hosting environments, and response to fracture evolution. Highly mobile elements such as Li⁺ and B(OH)3 are more susceptible to dilution following deep fluid shutoff, while Be2⁺ and Sr2⁺ are likely sourced from mechanically activated shallow fractures and readily released through acid-driven mineral dissolution [17]. In addition, element-specific adsorption and desorption dynamics under shifting pH and redox conditions further contribute to these variations. These results highlight the importance of disequilibrium fluid–rock interactions and fracture-controlled fluid transport in shaping hydrochemical responses to seismic events. Trace element anomalies, exhibiting a “concentration–time coupling” pattern, delineate the full rupture cycle from pre-slip to post-earthquake adjustment. Integrating trace element and major ion anomalies offers a critical geochemical perspective on deep–shallow fault interactions, aiding in earthquake preparation and foreshock identification.

5.4. Modeling of Fluid Circulation Processes

A conceptual model (Figure 10) of fluid circulation in the STS region is proposed, constructed based on regional topography and geological settings (Figure 1). Geothermal waters are primarily recharged by atmospheric precipitation from the Tianshan Mountains. As these waters percolate through the subsurface, dissolution of reservoir mineral enriches the geothermal fluids with various chemical components. The migration of deep fluids is governed by the spatial configuration and activity of fault systems, regional stress fields, and rock permeability, all of which are influenced by the uplift of the STS Mountains and the subsidence of the Tarim Basin. Seismological and geophysical investigations [54,55,72,73,74] have identified a mid-crustal low-velocity, high-conductivity anomaly beneath the Tianshan orogen, suggesting the upward migration of mantle-derived fluids ascend through faults and discharge at the surface as thermal springs, indicating that mantle materials are transported to the crust via fault-facilitated pathways and ultimately released as geothermal discharges. Meteoric water infiltrates and circulates within deep reservoirs characterized by high geothermal gradients. It subsequently ascends along fault networks and mixes with shallow, colder groundwater within near-surface faults systems. This vertical fluid migration facilitates geothermal energy releases, drives extensive water–rock interactions, and alter both chemical and isotopic composition of the circulating fluids. The interplay between deep fluid upwelling and shallow mixing processes governs geothermal activity in the southern Tianshan region. This model provides insights into the regional tectonic-hydrothermal framework and serves as a foundation for hydrogeological and geothermal resource assessments. Continued multidisciplinary investigations are essential for evaluating the feasibility of geothermal exploitation and improving the predictive capacity for seismically induced hydrogeochemical responses.

6. Conclusions

In this study, the geochemical characteristics analysis of thermal waters and gases collected along the MDF leads to the following conclusions:
[1] 
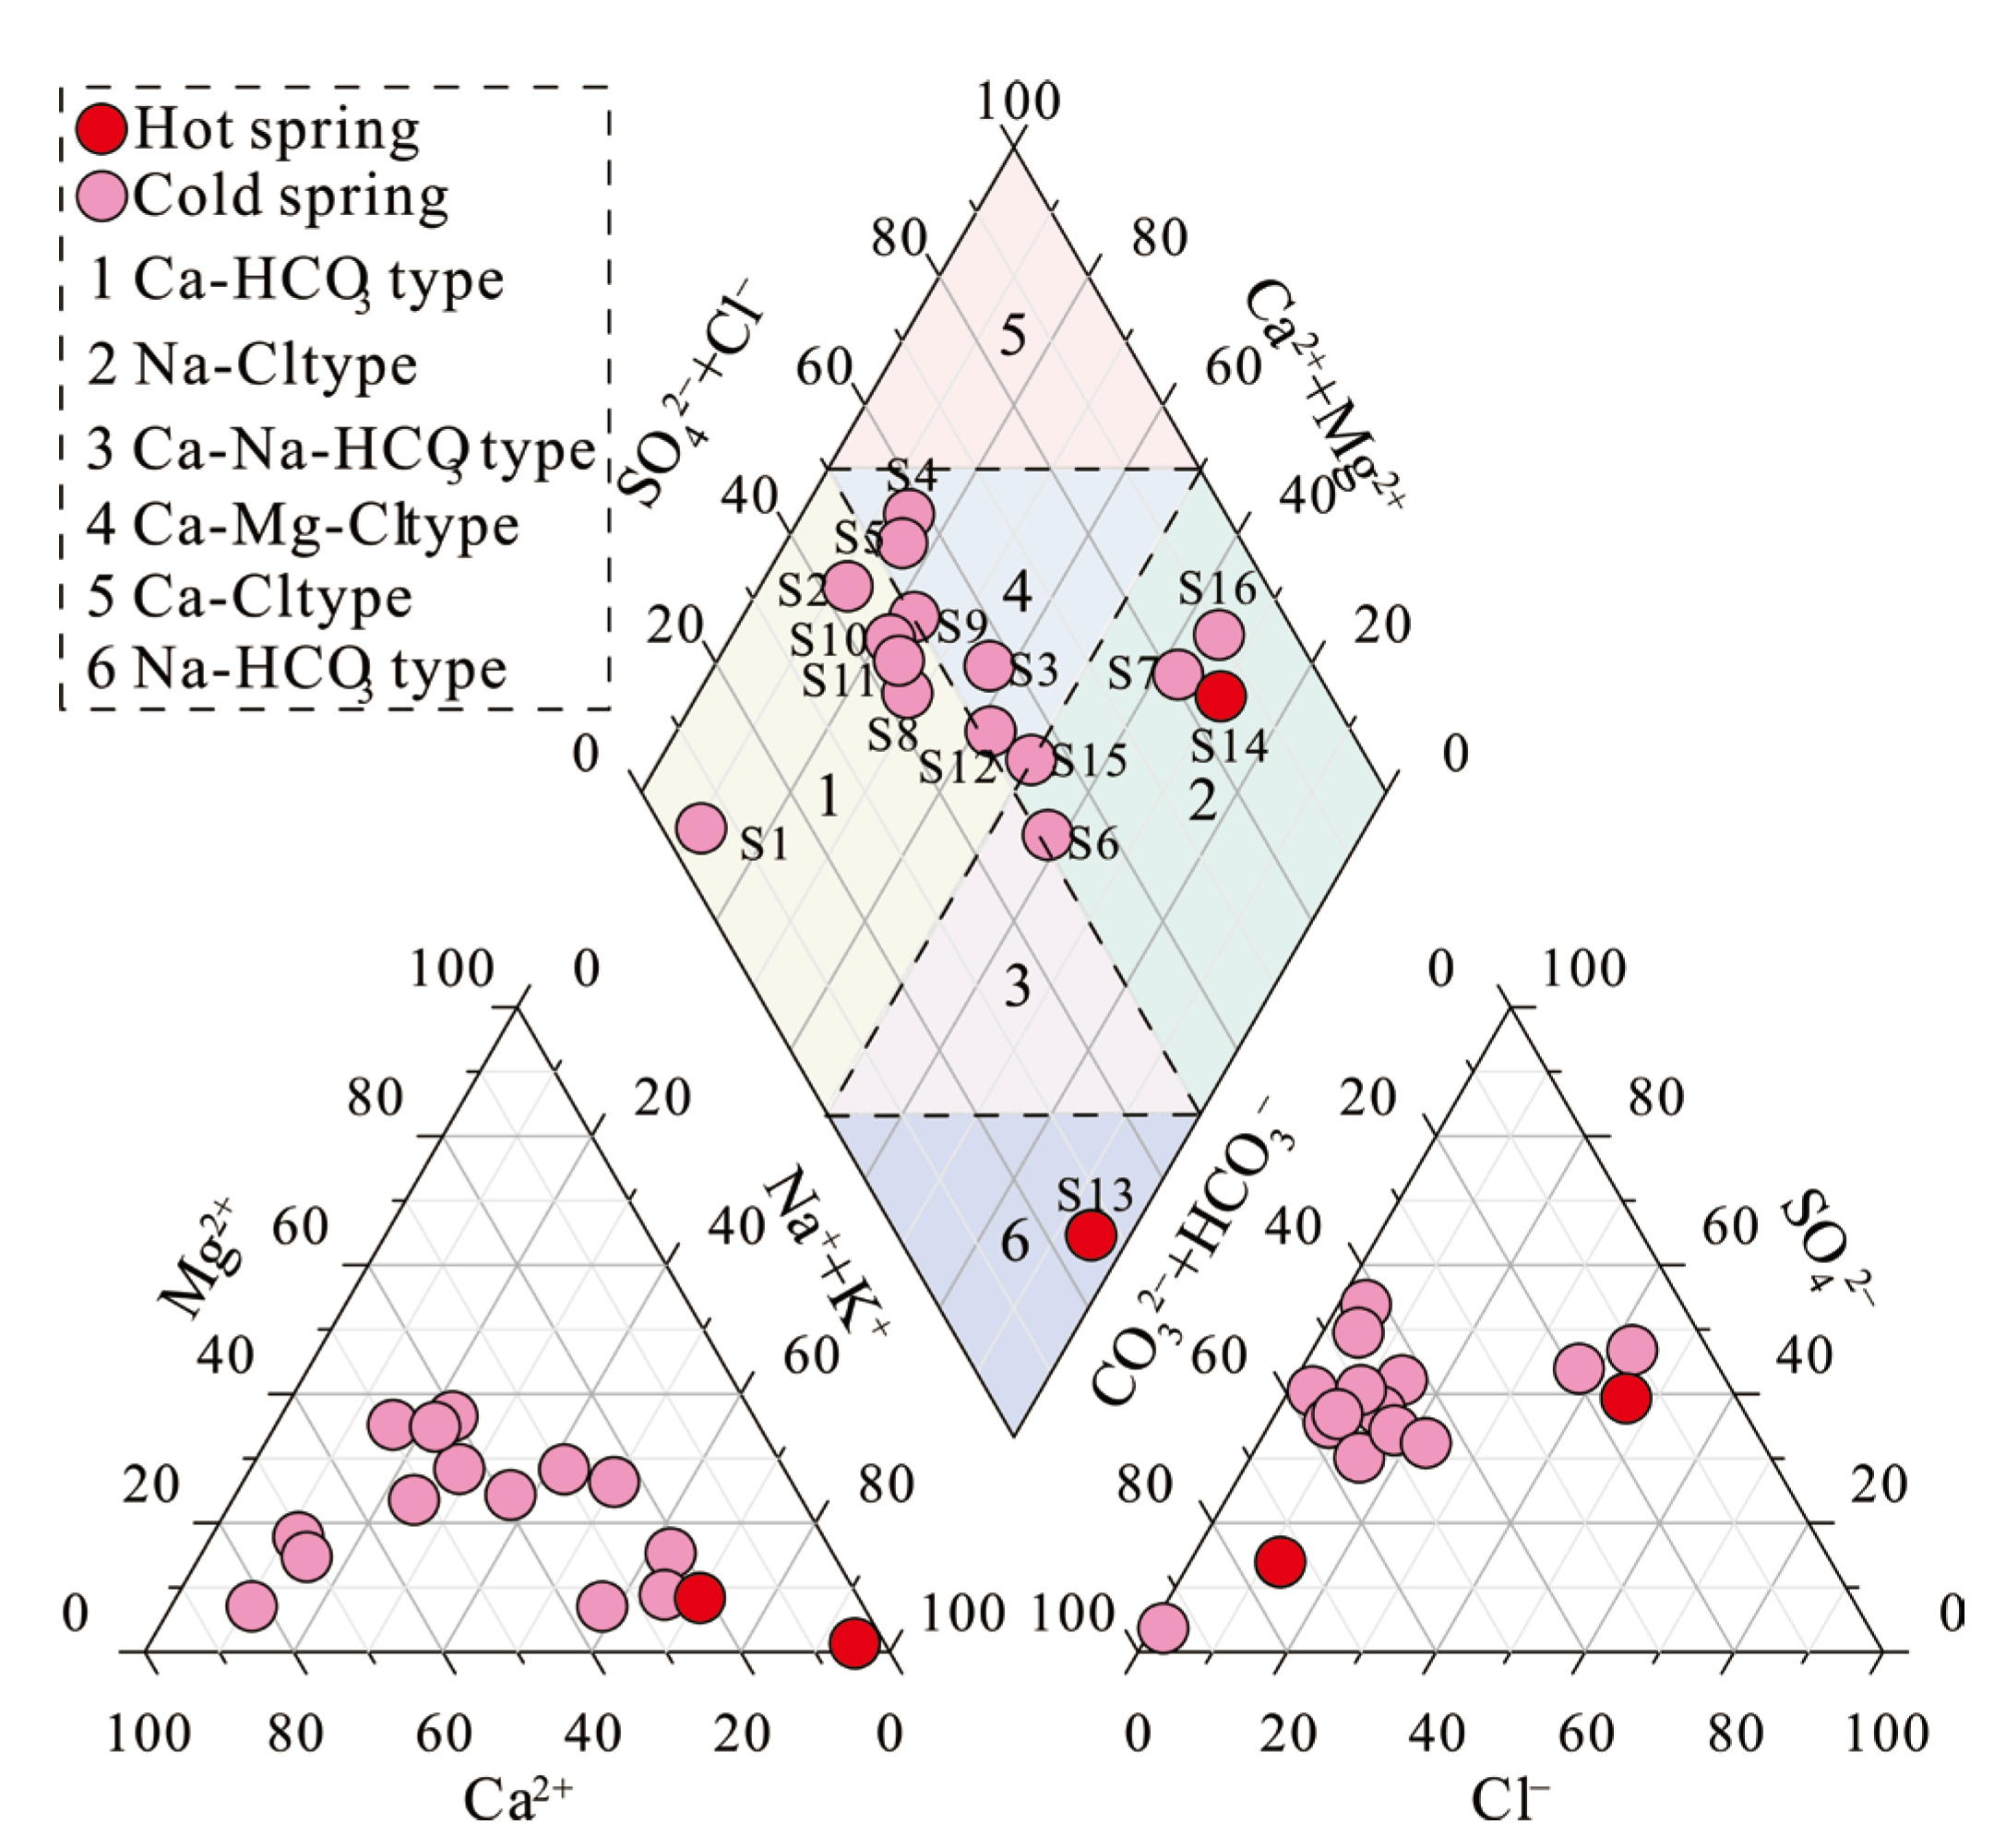
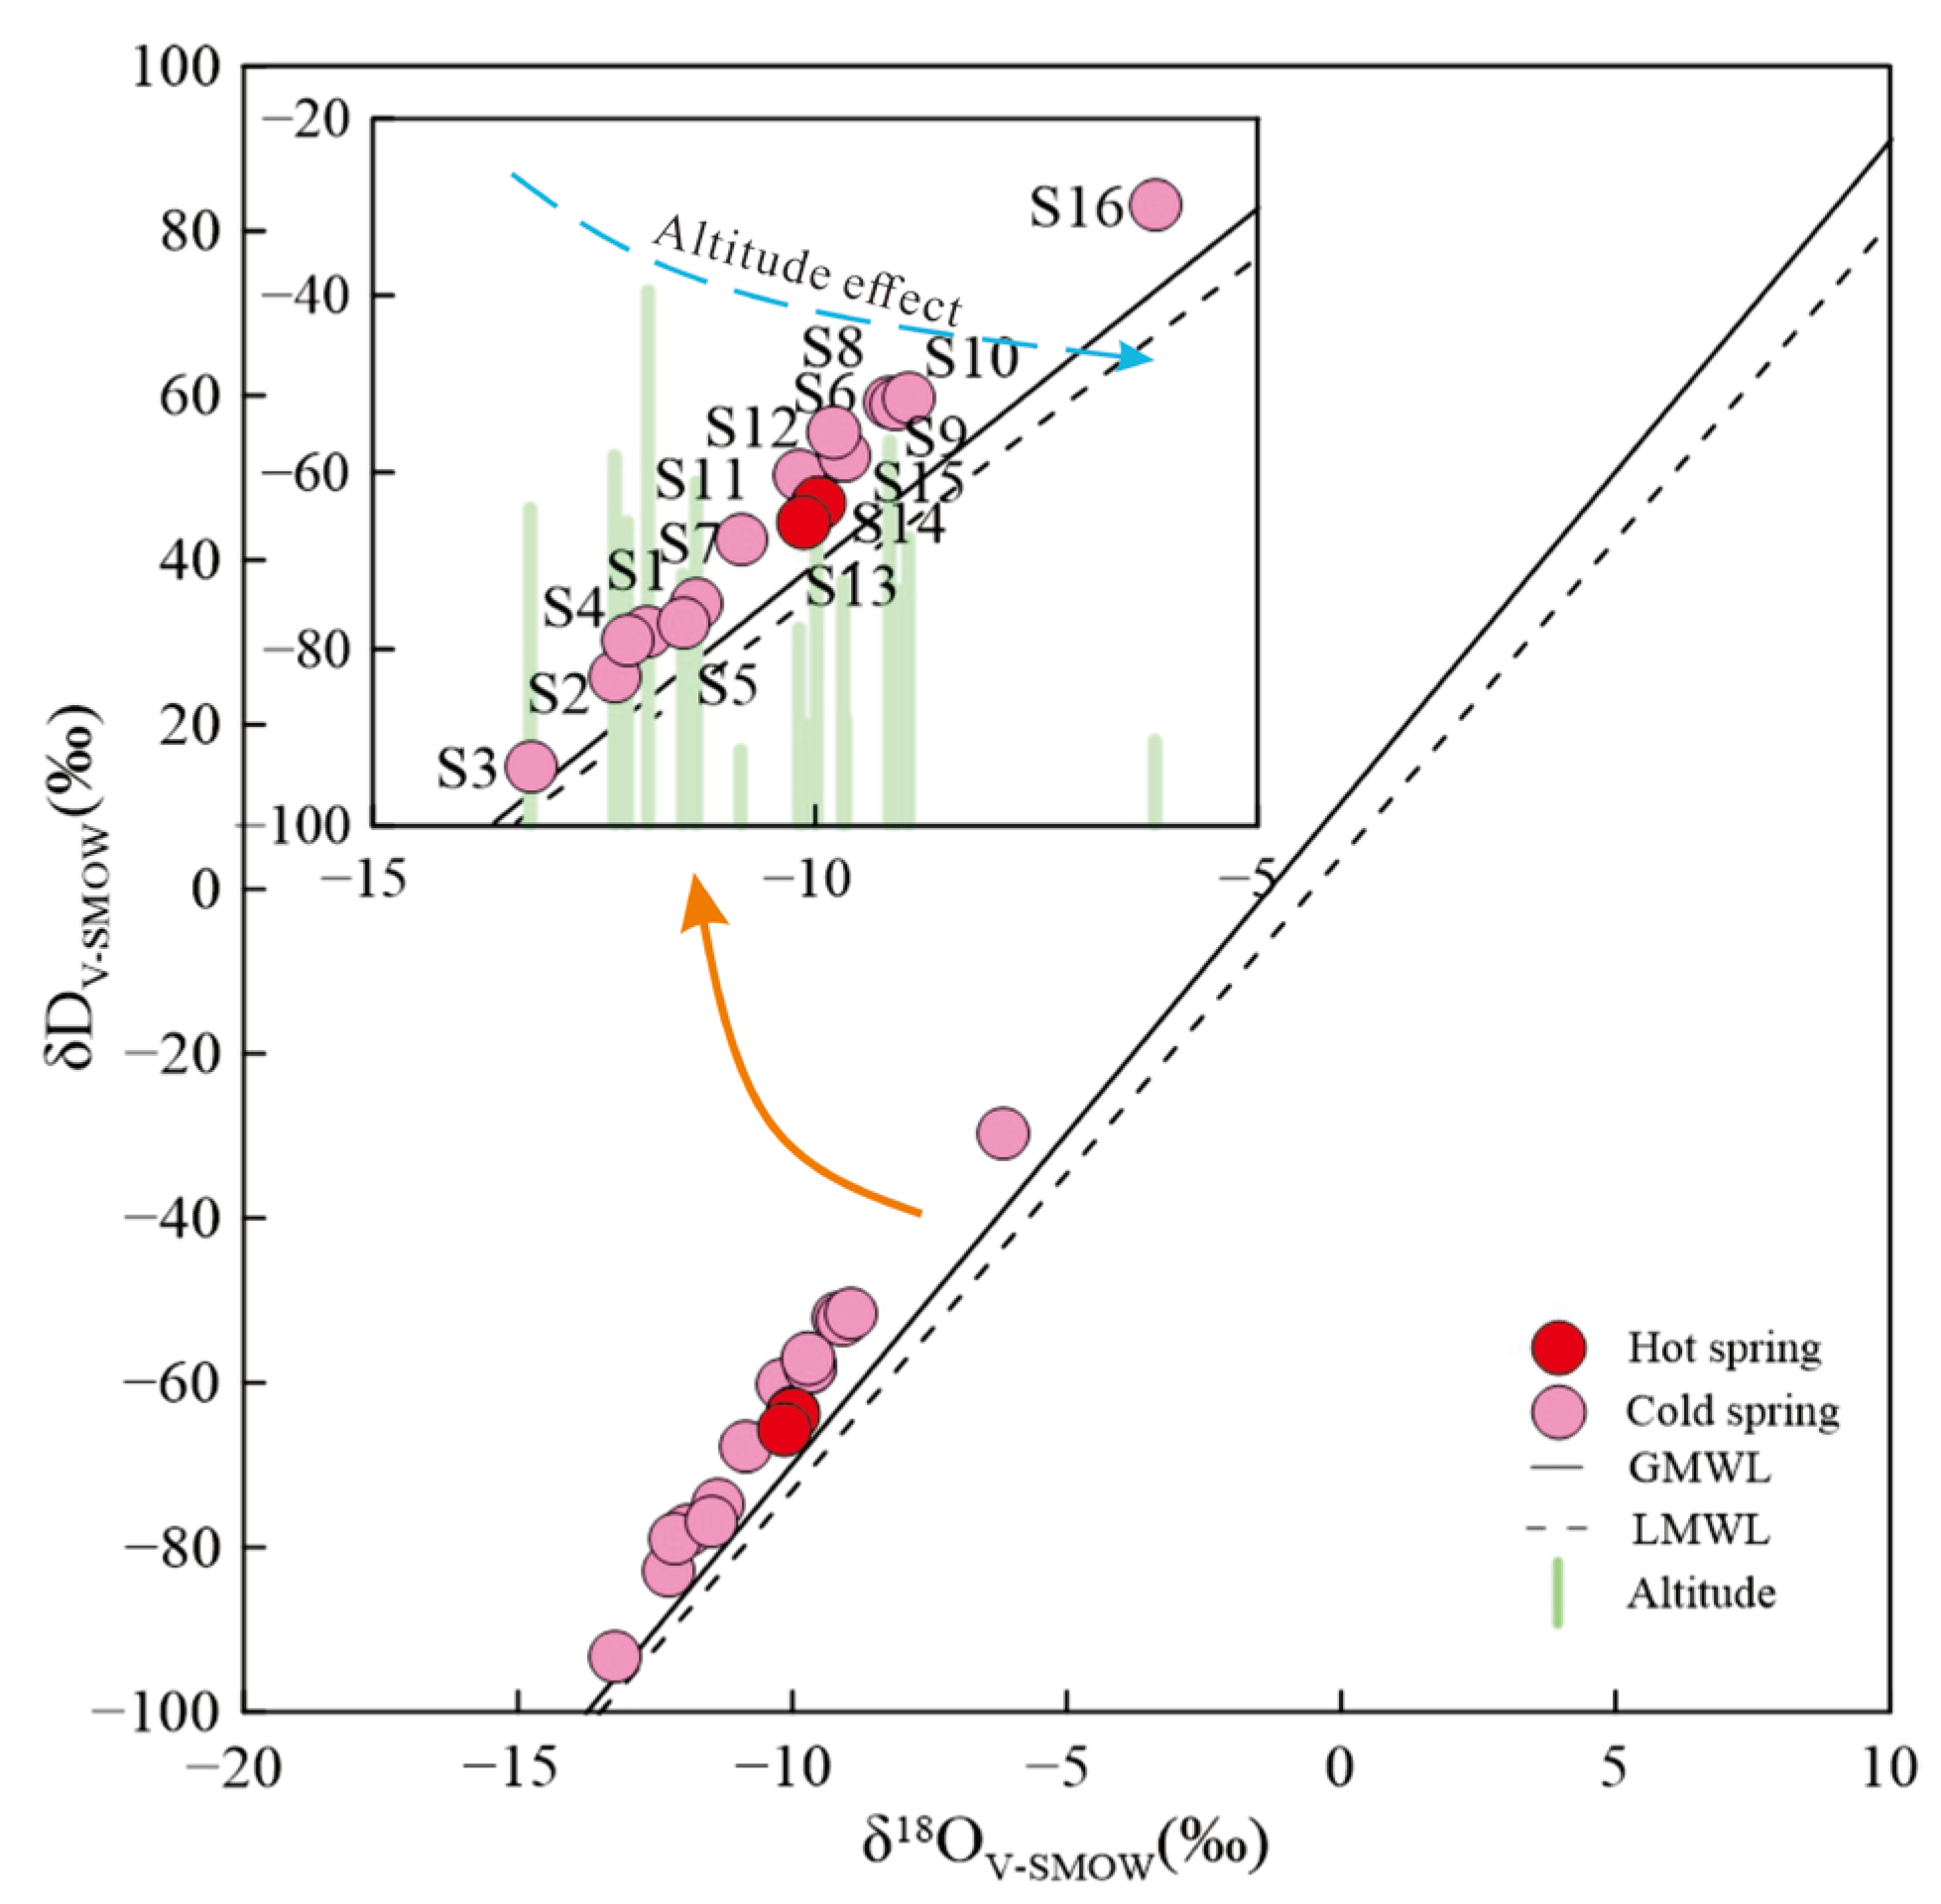
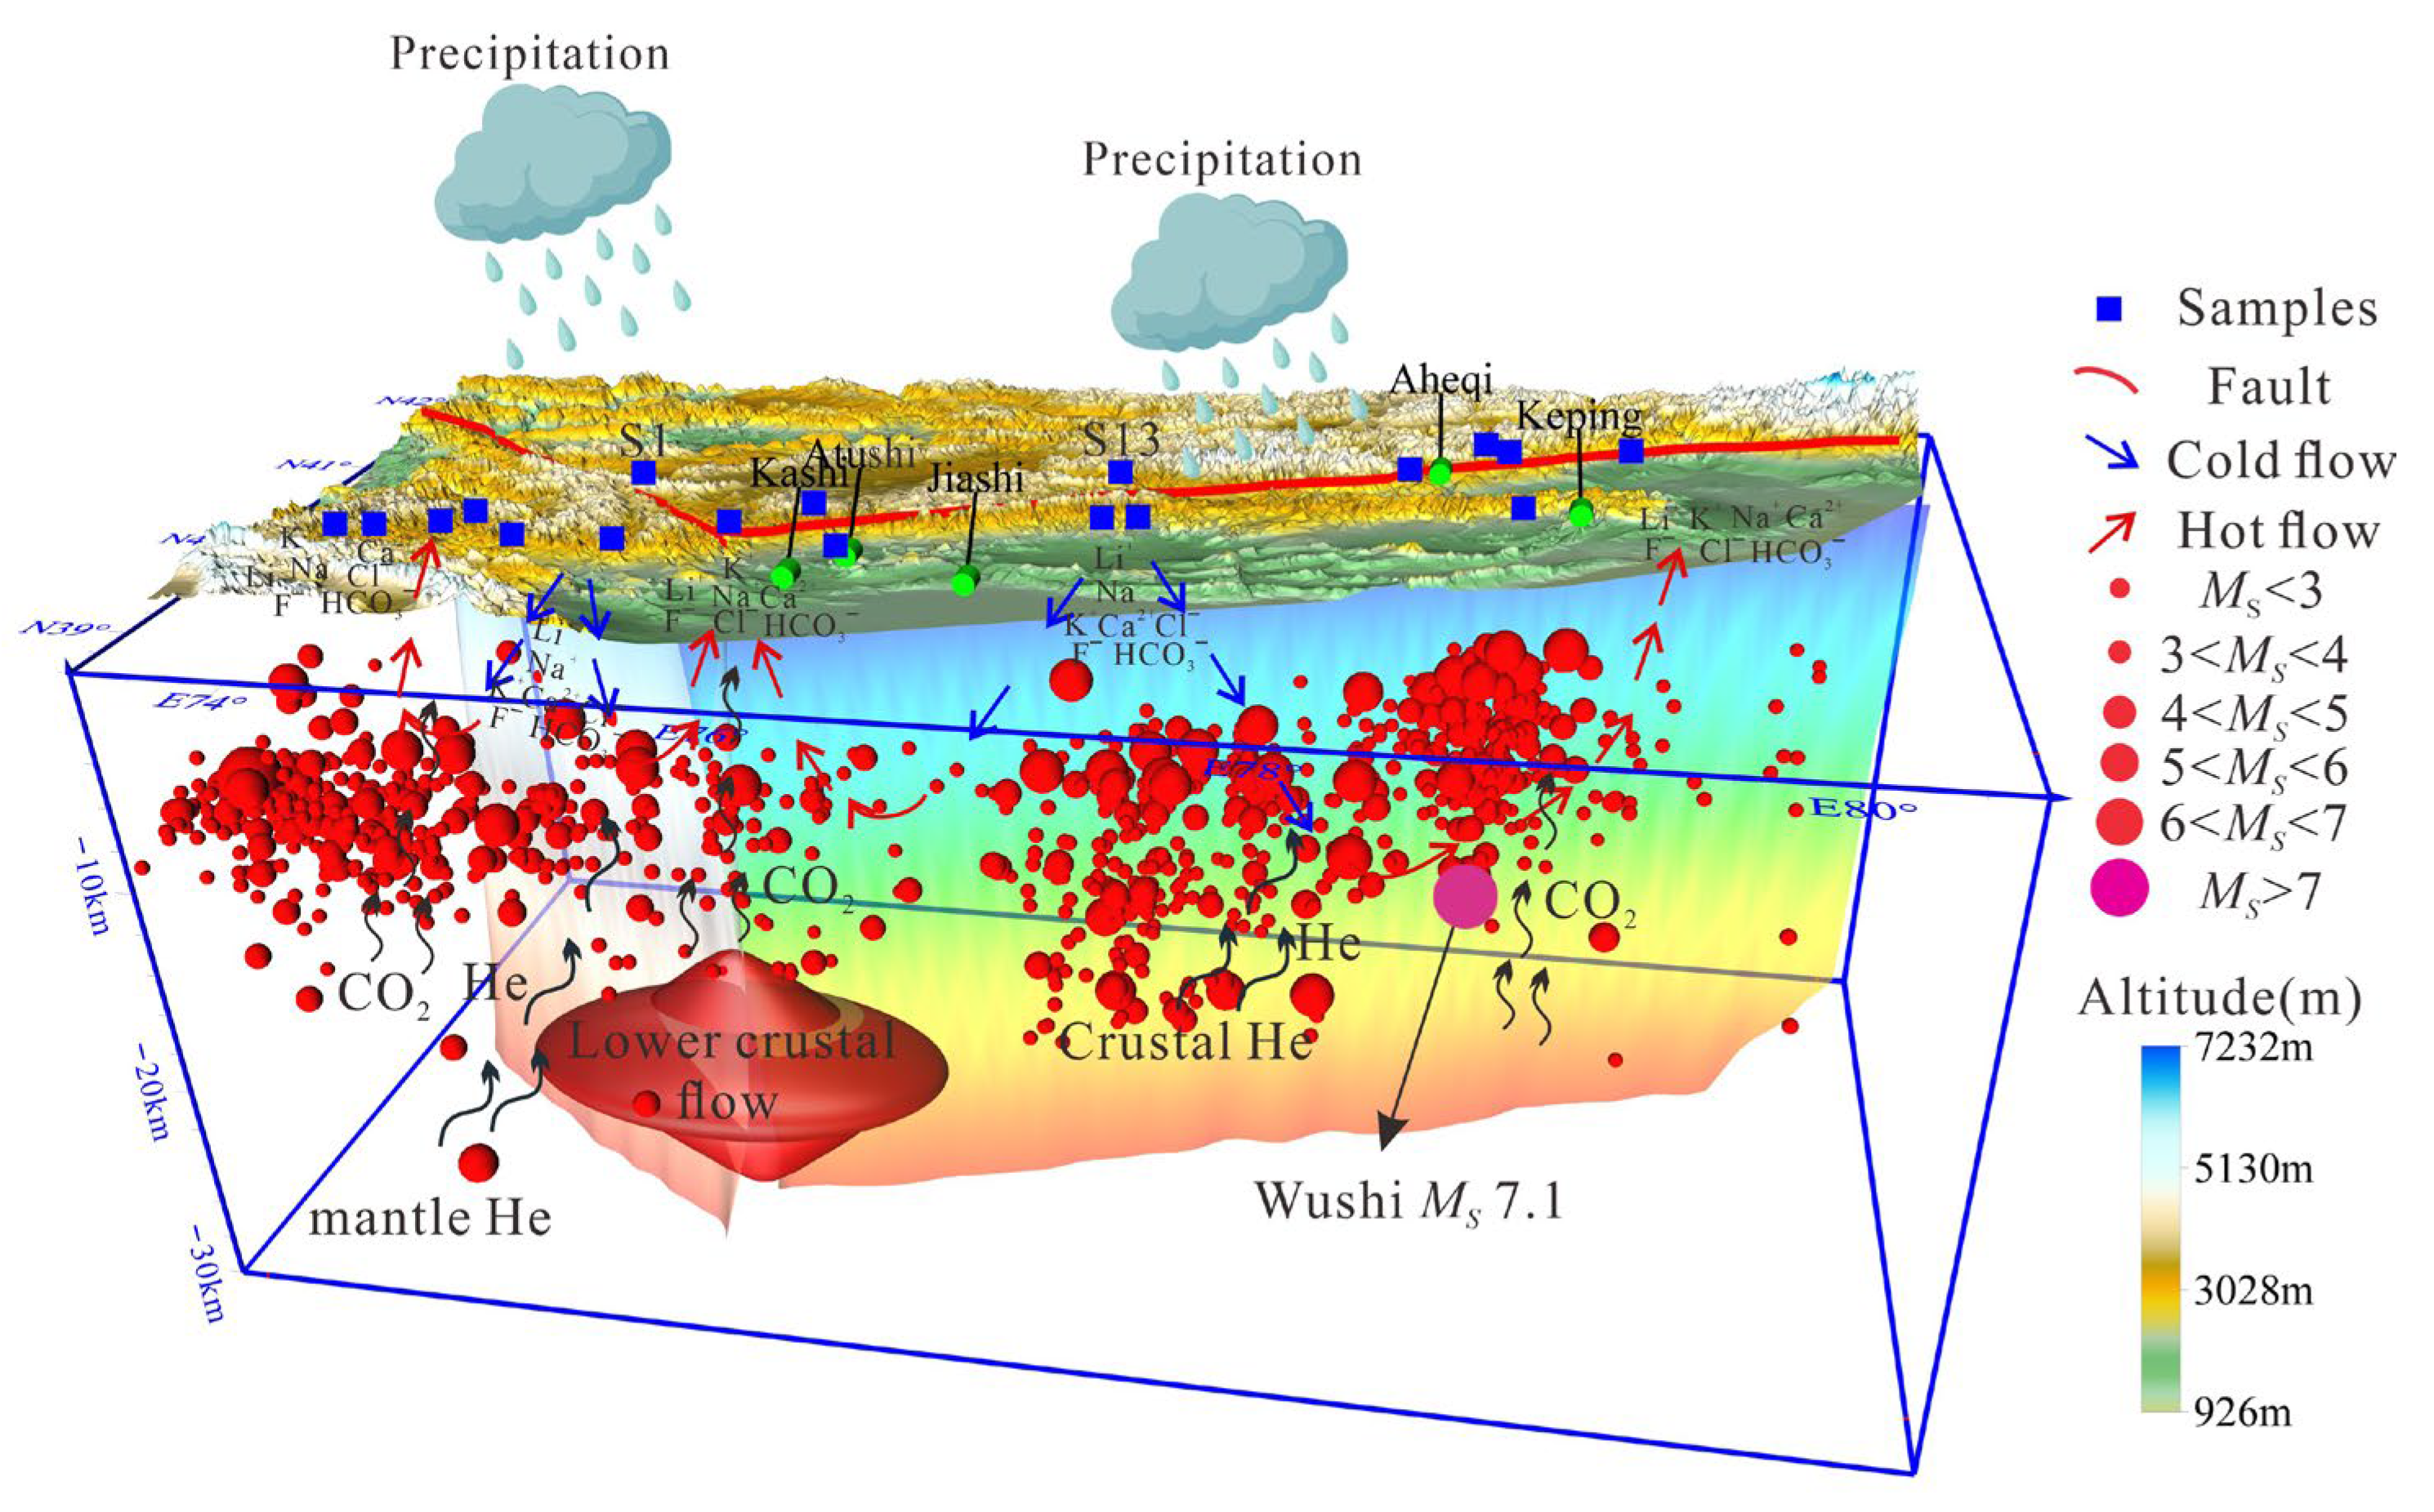
The hydrogen and oxygen isotope values of the springs in the STS area reveal that the thermal springs primarily originate from atmospheric precipitation and melting snow of the Tianshan Mountains, with a distinct altitudinal effect. The analysis of water chemical types indicates that cold springs are mainly of the Ca-HCO3 and Ca-Mg-Cl types, while thermal springs are of the Na-HCO3 and Na-Cl types. The circulation depth of the springs range from 477 to 4772 m, suggesting that shallow water bodies undergo deep circulation along the fault zone and react fully with the surrounding rocks, carrying a wealth of deep information.
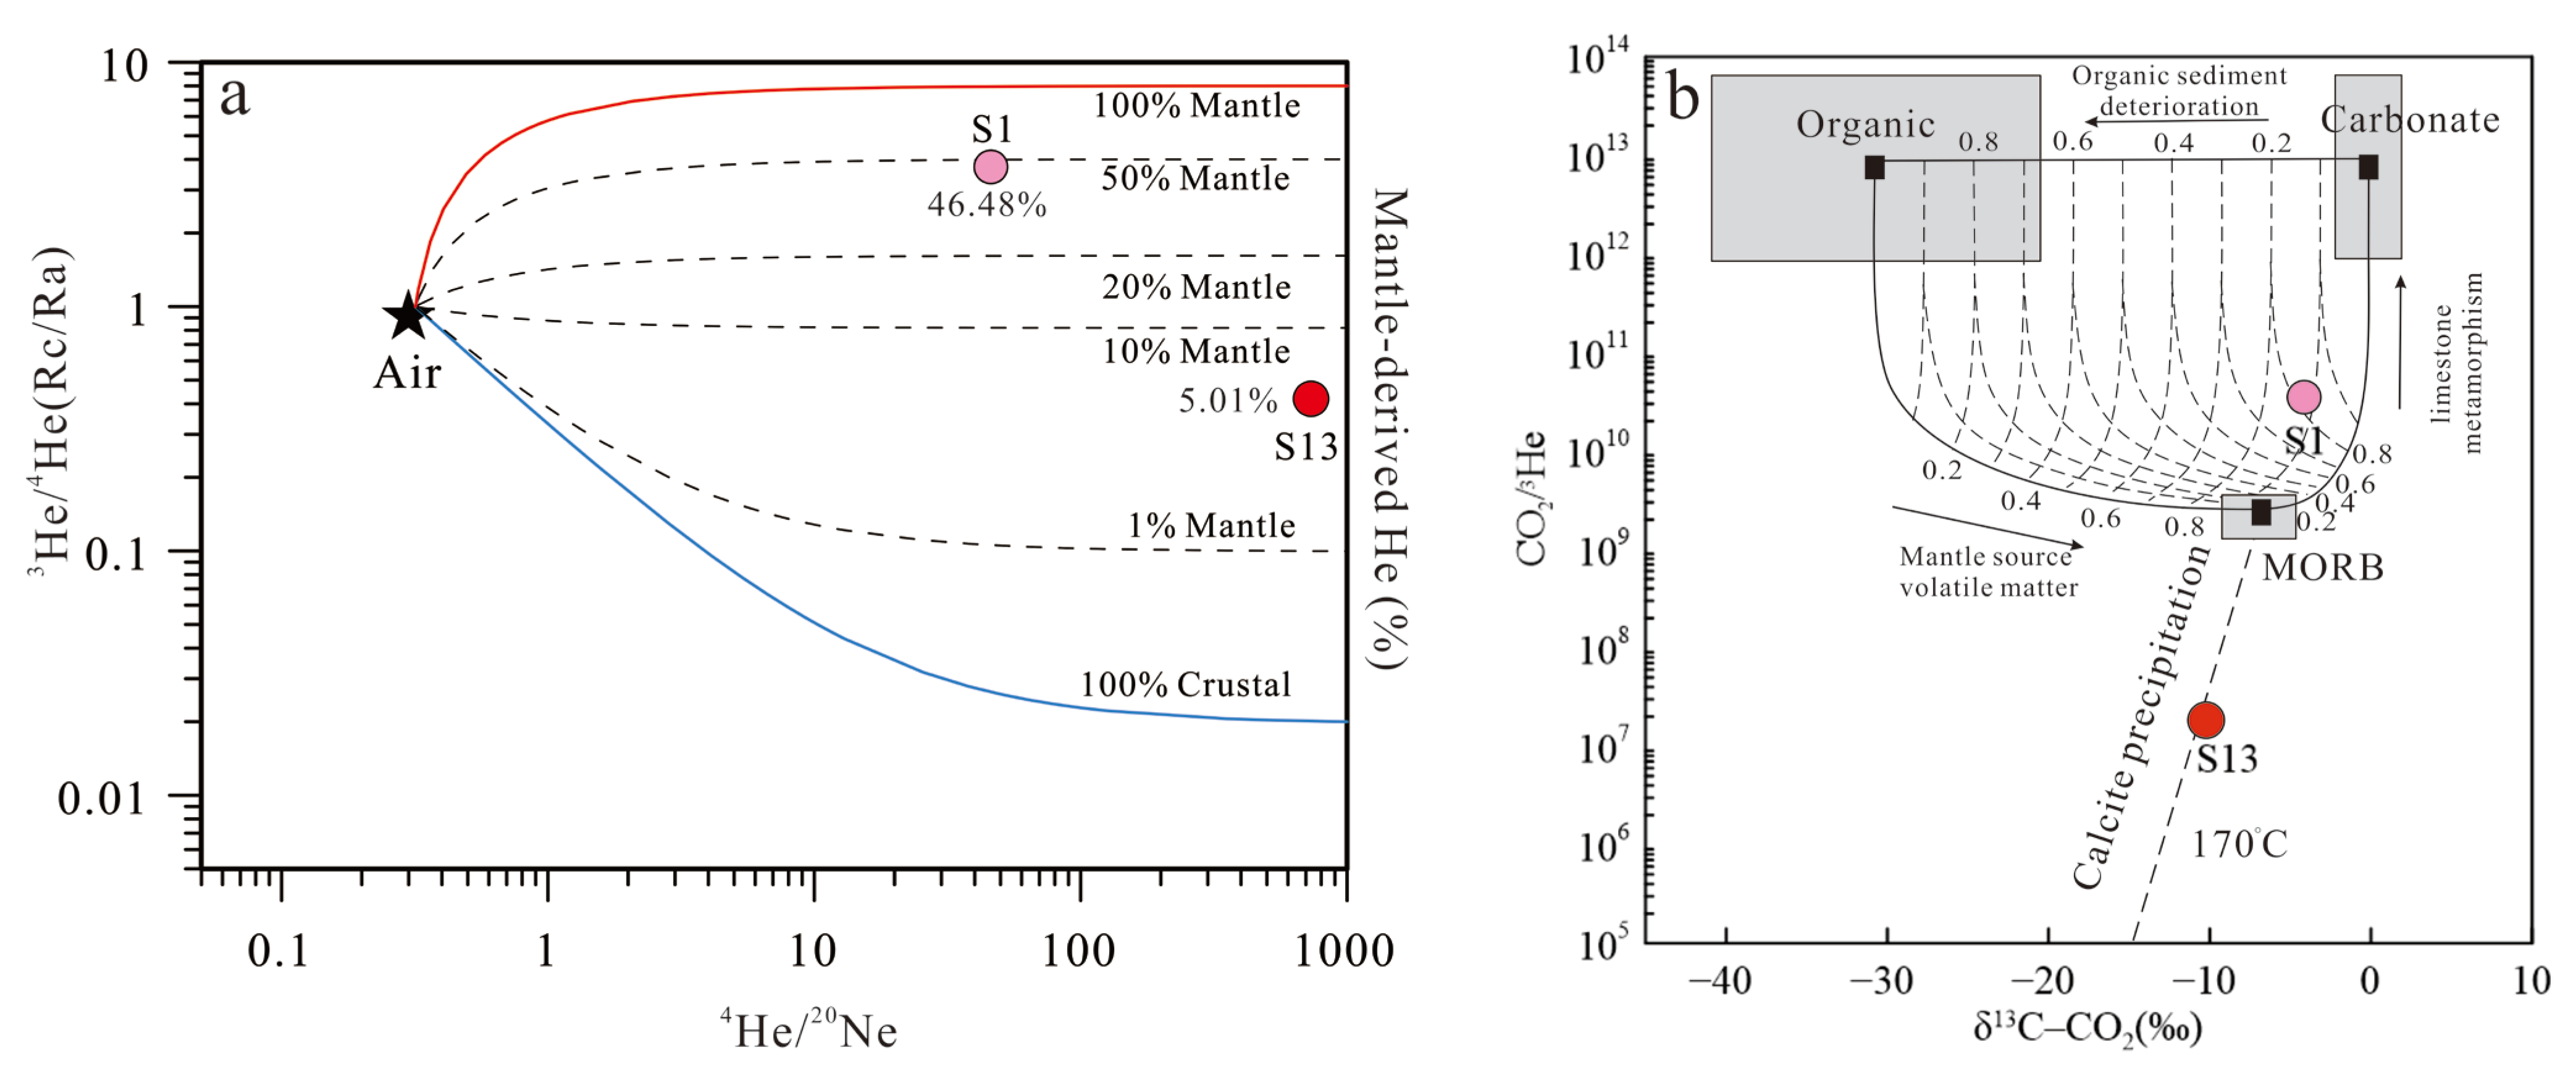
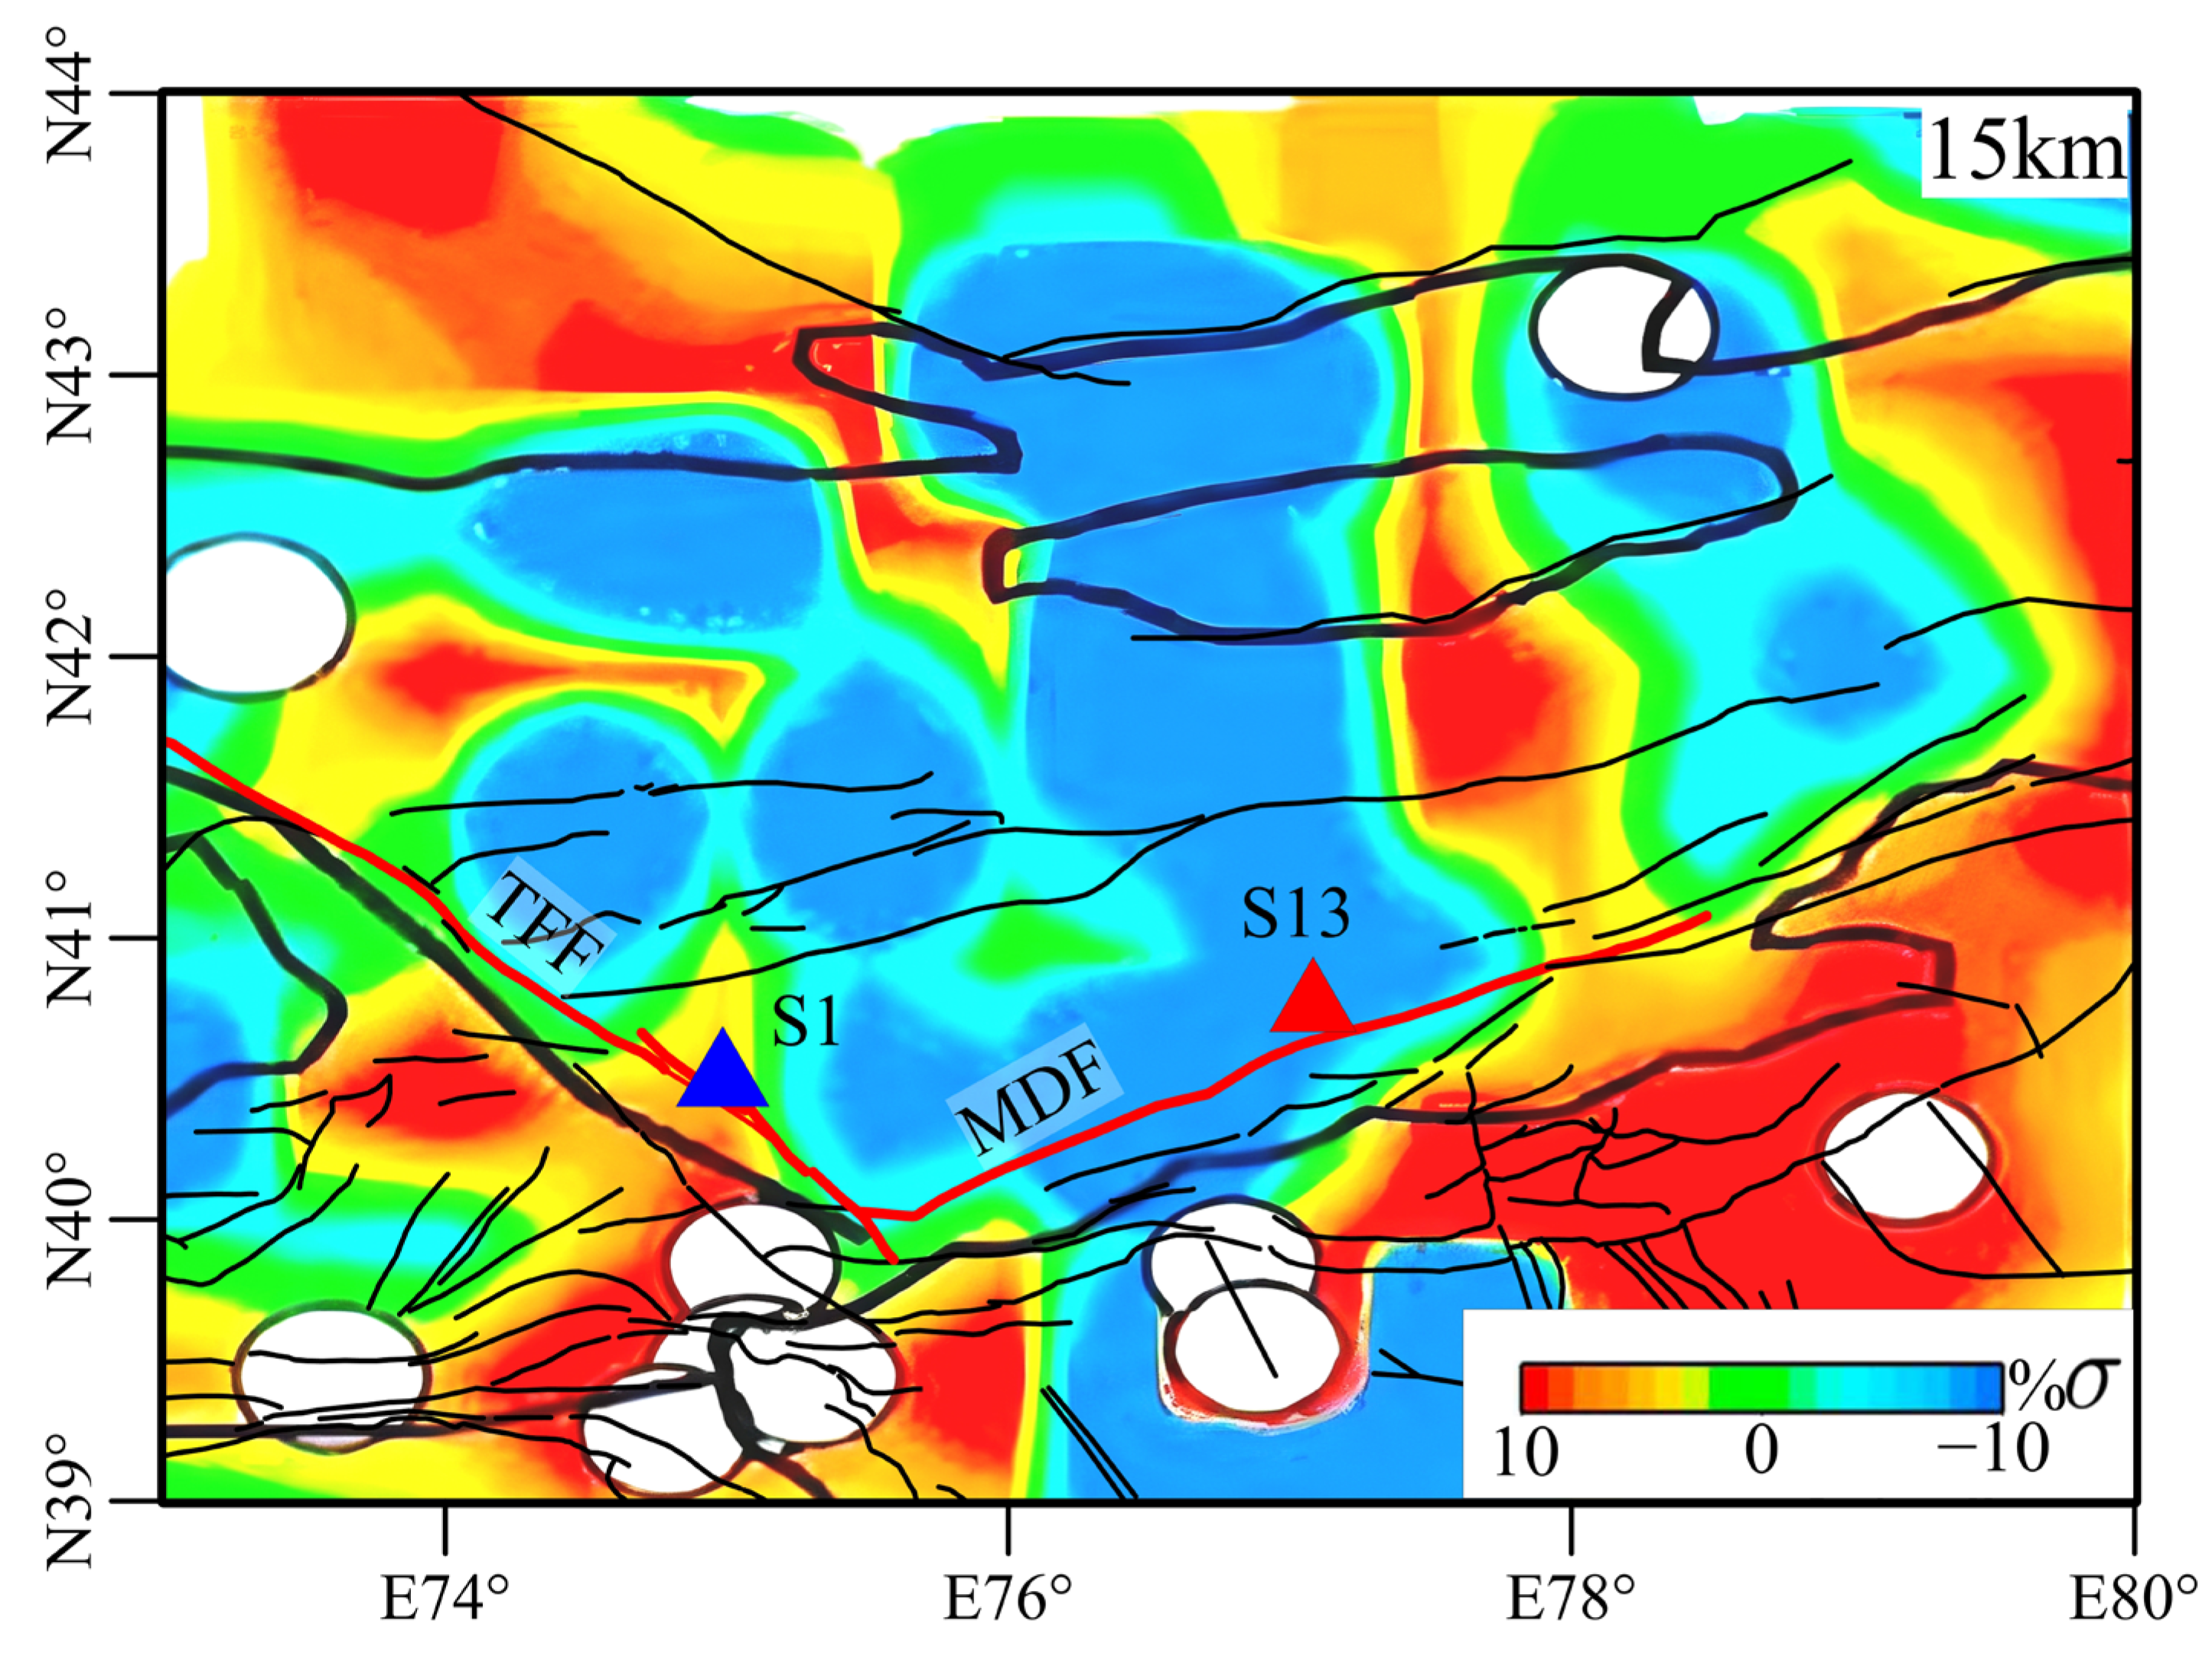
[2] 
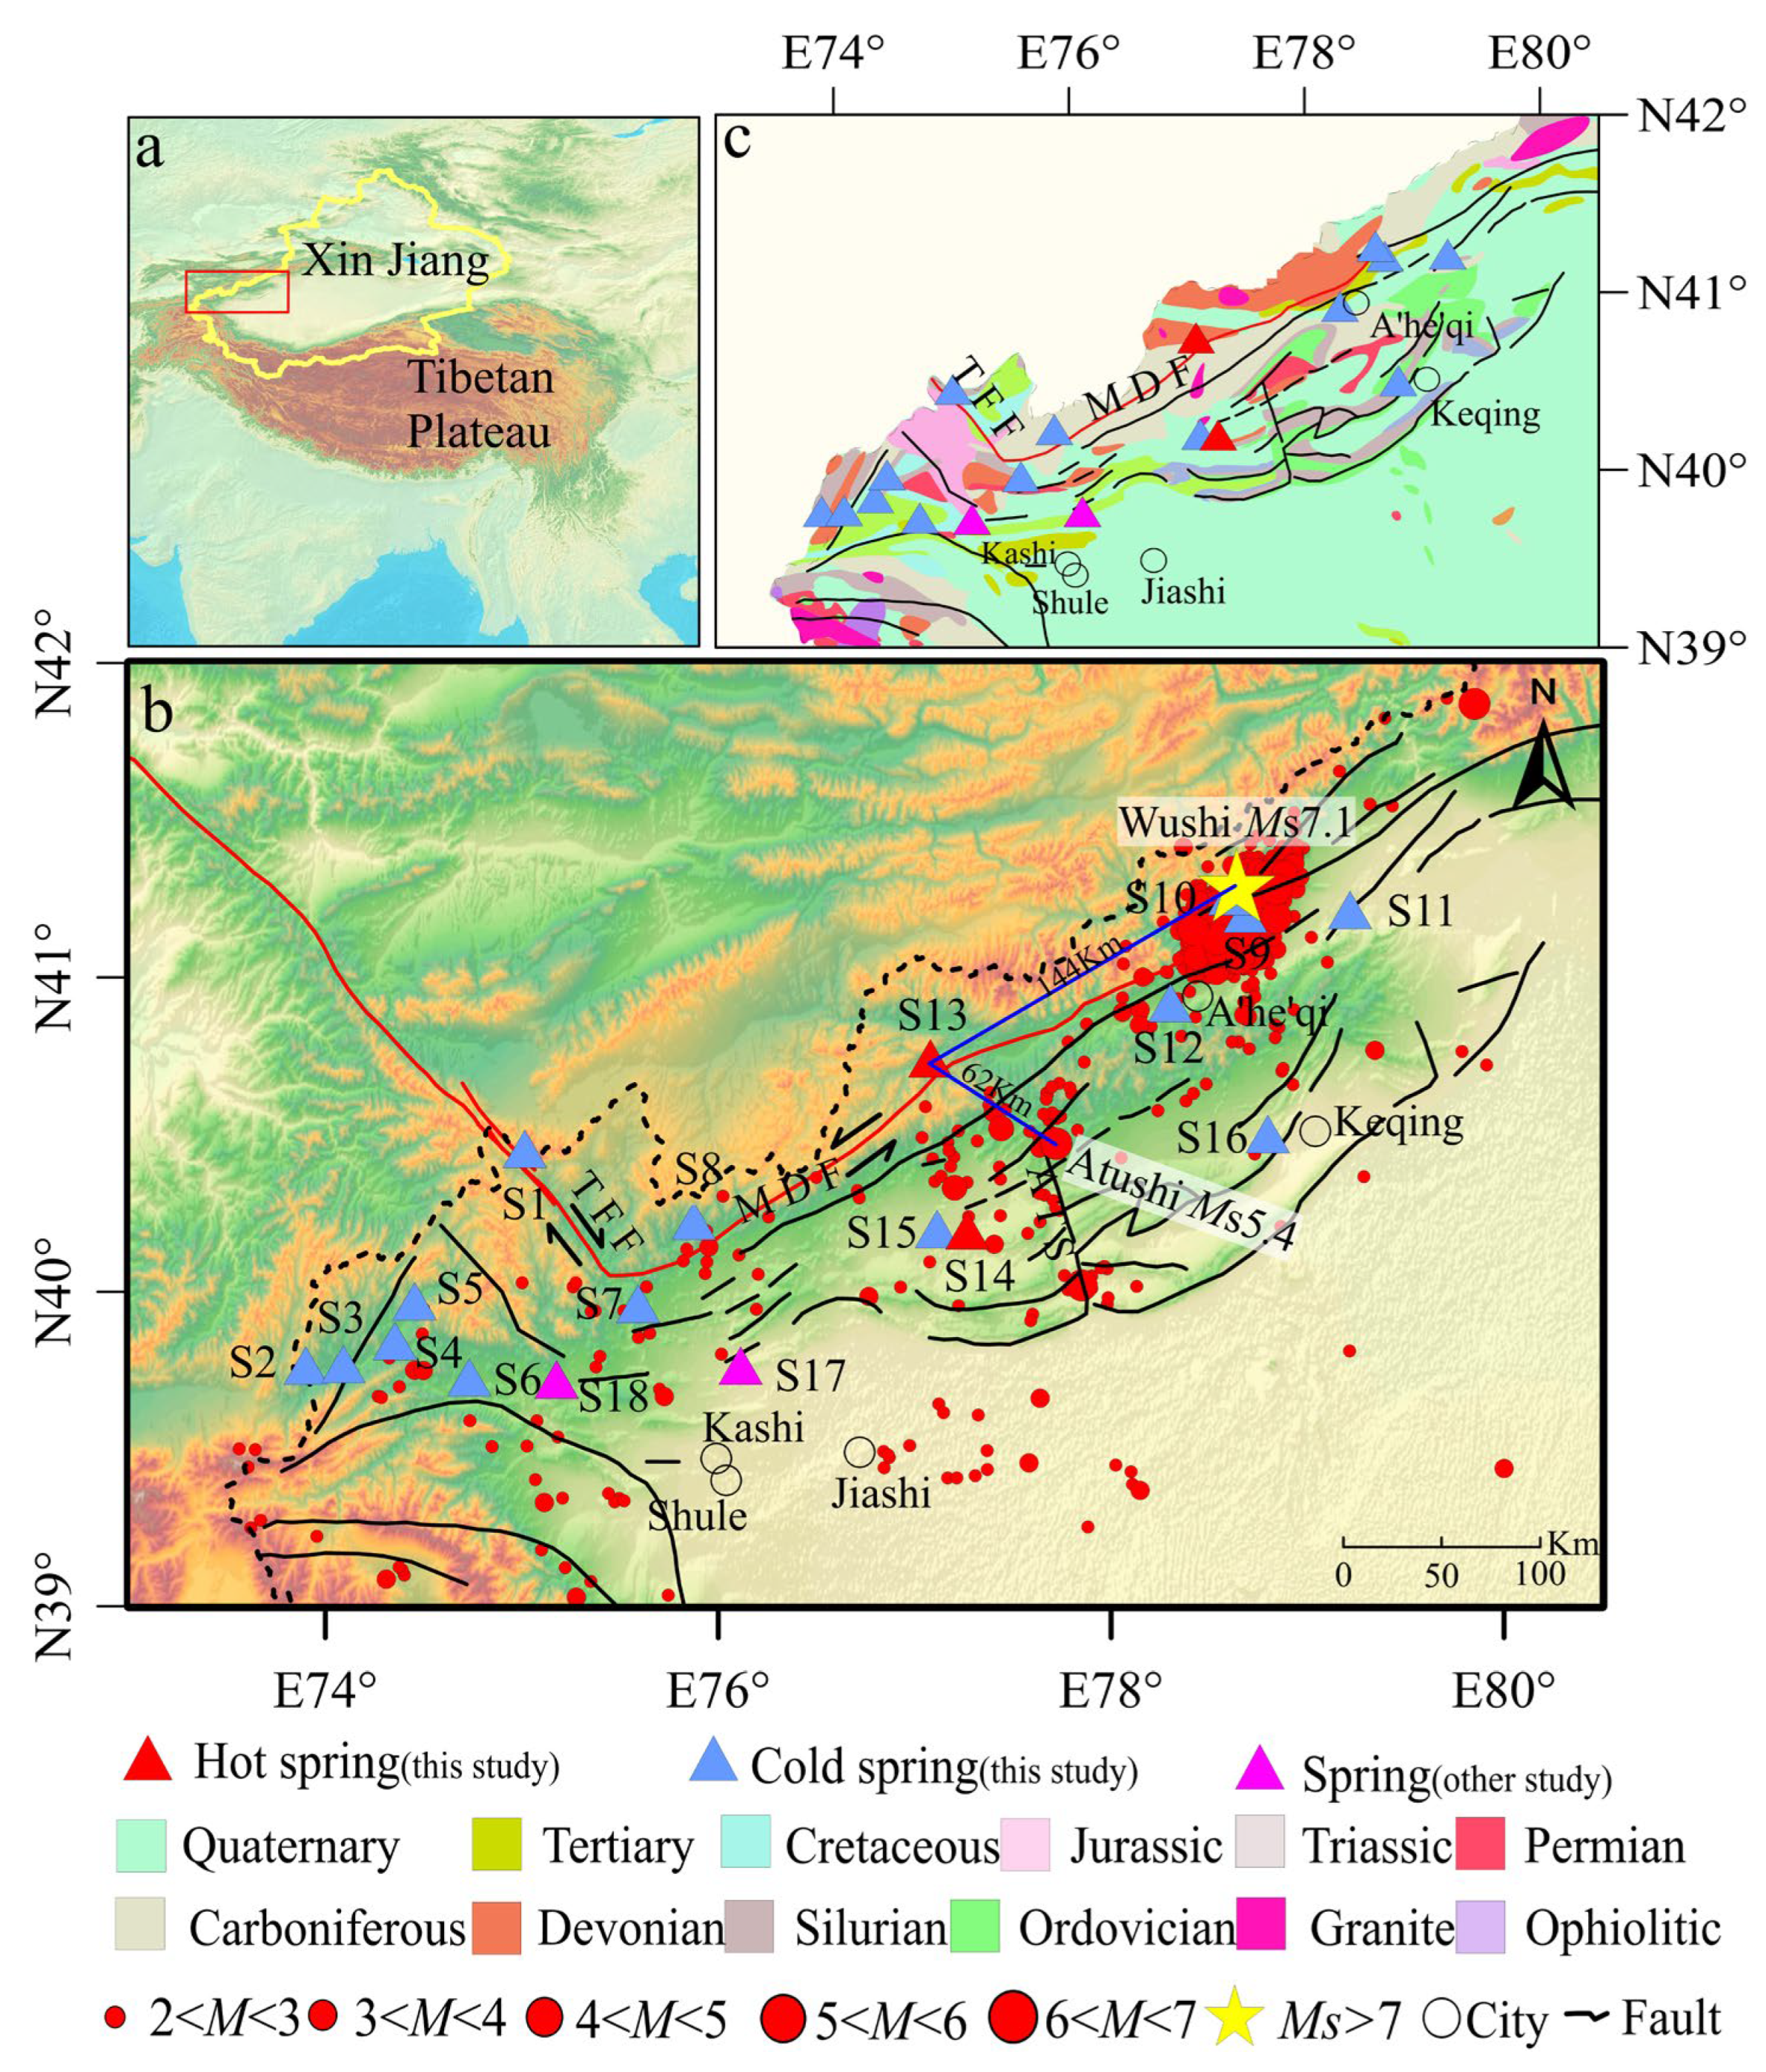
The higher 3He/4He ratios (0.42 Ra and 3.71 Ra) in the thermal spring gases indicate that the mantle-derived helium proportion at S1 is as high as 46.48%, suggesting active deep fluid migration and potential geothermal or tectonic activity in the intersection area of the TFF and MDZ. In contrast, the gases at S13 mainly originate from the crust, showing a lower mantle contribution and weaker tectonic activity. The high Poisson’s ratio at S1 is associated with the enrichment of deep fluids and intense tectonic activity, while the low Poisson’s ratio at S13 reflects the rigidity of the crust and limitations in fluid enrichment, with the gas source primarily being a mixture of shallow crustal gases and gases from the decomposition of organic matter.
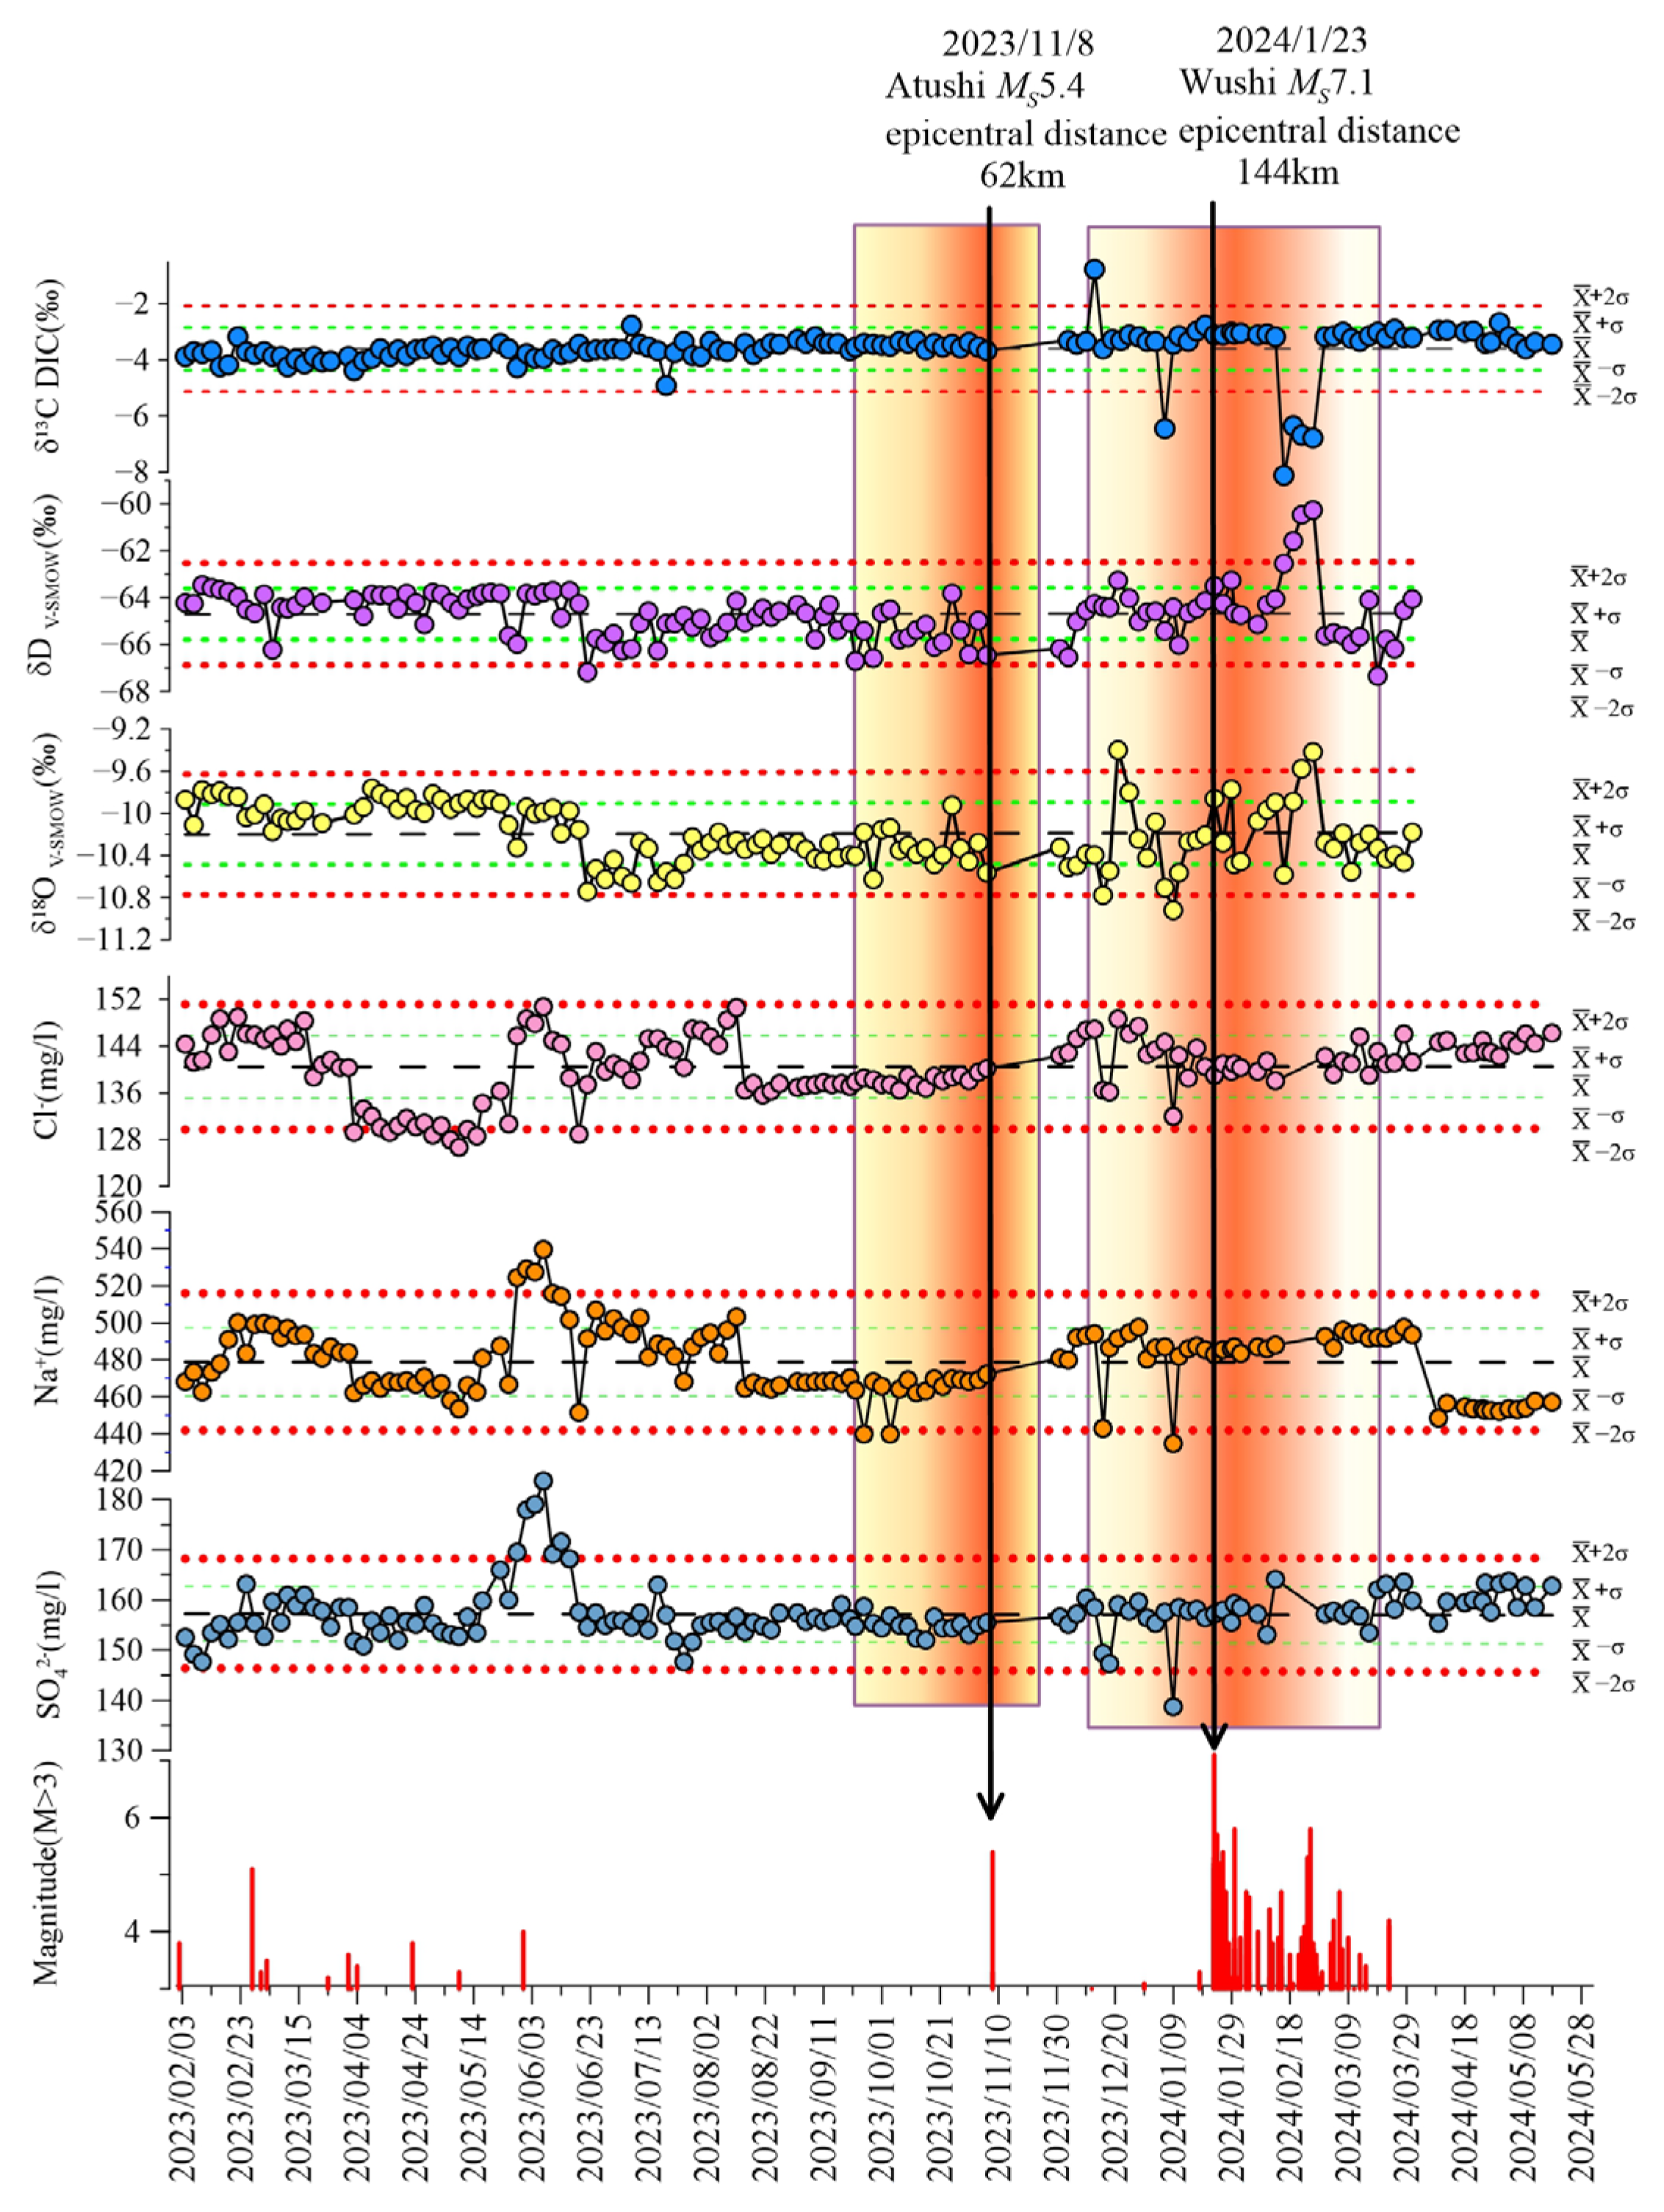
[3] 
There is a close relationship between seismic activity and the distribution of thermal springs in the study area. The consistency between seismic density and intensity and the distribution of thermal springs suggests that seismic activity may influence the hydrogeological characteristics of the thermal springs. Monitoring shows ions and isotopes anomalies, along with trace elements fluctuations, linking seismic events to hydrogeochemistry. These findings highlight the potential of hot spring water chemistry as a valuable precursor for seismic activity, providing critical insights for earthquake forecasting and hydrothermal system dynamics.
[4] 
The impact of seismic activity on the hydrochemical characteristics of thermal springs is complex and variable. The widespread influence of the Wushi MS7.1 earthquake on the groundwater system indicate that the relationship between seismic activity and fluid anomaly response is regulated by a combination of stress field characteristics, fault locations, and fluid migration pathways, rather than a simple positive correlation with earthquake magnitude.
This study not only deepens the understanding of the hydrogeochemical characteristics of the groundwater in the STS area but also provides valuable data support for the study of groundwater response mechanisms before and after the Wushi earthquake, revealing the complex interaction between seismic activity and the groundwater system, which has significant scientific implications for earthquake prediction and geological disaster assessment. However, due to the limited spatial and temporal coverage of the sampling, certain short-term and localized hydrochemical responses may not have been fully captured. Even so, the results provide a valuable foundation for future studies on fault-fluid interactions and seismic precursors.

Supplementary Materials

The following supporting information can be downloaded at: https://www.mdpi.com/article/10.3390/app15094791/s1, Table S1: Data of fluid geochemical components in the study area; Table S2: Continuous monitoring data of S13 major ions and isotopes; Table S3: Continuous monitoring data of S13 trace elements.

Author Contributions

Conceptualization, J.L. and M.H.; methodology, J.T.; software, Y.W.; validation, Y.Y., H.Y. and B.Y.; formal analysis, S.C. and R.L.; investigation, G.X. and W.Z.; resources, X.Z.; data curation, Z.Z.; writing—original draft preparation, Z.Z.; writing—review and editing, X.Z. and J.D.; visualization, Z.Z.; supervision, Y.C. and J.D.; project administration, X.Z.; funding acquisition, X.Z. All authors have read and agreed to the published version of the manuscript.

Funding

The work was funded by Central Public-interest Scientific Institution Basal Research Fund (CEAIEF2022030205, CEAIEF20240405, CEAIEF2022030200), National Key Research and Development Project (2024ZD1000503), the National Natural Science Foundation of China (41673106), IGCP Project 724.

Institutional Review Board Statement

Not applicable.

Informed Consent Statement

Not applicable.

Data Availability Statement

The data presented in this study are available in the article and on request from the corresponding author. The data are not available publicly due to the use of the laboratory equipment.

Conflicts of Interest

The authors declare no conflicts of interest.

References

  1. İnan, S.; Çetin, H.; Yakupoğlu, N. Spring water anomalies before two consecutive earthquakes (Mw7.7 and Mw7.6) in Kahramanmaraş (Türkiye) on 6 February 2023. Nat. Hazards Earth Syst. Sci. 2024, 24, 397–409. [Google Scholar] [CrossRef]
  2. Wang, C.Y.; Manga, M. New streams and springs after the 2014 Mw6.0 South Napa earthquake. Nat. Commun. 2015, 6, 7597. [Google Scholar] [CrossRef] [PubMed]
  3. Zandvakili, Z.; Nishio, Y. Origin of spring waters in the Matsushiro area: Implications for the 1965–1967 earthquake swarm and subsequent “water eruption”. Geochem. J. 2024, 58, 184–193. [Google Scholar] [CrossRef]
  4. Umeda, K.; Yamazaki, Y.; Sumino, H. Geochemical Signature of Deep Fluids Triggering Earthquake Swarm in the Noto Peninsula, Central Japan. Geophys. Res. Lett. 2024, 51, e2024GL108581. [Google Scholar] [CrossRef]
  5. Tarantino, S.; Poli, P.; D’Agostino, N.; Vassallo, M.; Festa, G.; Ventafridda, G.; Zollo, A. Non-linear elasticity, earthquake triggering and seasonal hydrological forcing along the Irpinia fault, Southern Italy. Nat. Commun. 2024, 15, 9821. [Google Scholar] [CrossRef]
  6. Chiodini, G.; Cardellini, C.; Di Luccio, F.; Selva, J.; Frondini, F.; Caliro, S.; Rosiello, A.; Beddini, G.; Ventura, G. Correlation between tectonic CO2 Earth degassing and seismicity is revealed by a 10-year record in the Apennines, Italy. Sci. Adv. 2020, 6, eabc2938. [Google Scholar] [CrossRef]
  7. Franchini, S.; Agostini, S.; Barberio, M.D.; Barbieri, M.; Billi, A.; Boschetti, T.; Pennisi, M.; Petitta, M. HydroQuakes, central Apennines, Italy: Towards a hydrogeochemical monitoring network for seismic precursors and the hydro-seismo-sensitivity of boron. J. Hydrol. 2021, 598, 125754. [Google Scholar] [CrossRef]
  8. Skelton, A.; Liljedahl-Claesson, L.; Wästeby, N.; Andrén, M.; Stockmann, G.; Sturkell, E.; Mörth, C.M.; Stefansson, A.; Tollefsen, E.; Siegmund, H.; et al. Hydrochemical Changes Before and After Earthquakes Based on Long-Term Measurements of Multiple Parameters at Two Sites in Northern Iceland—A Review. J. Geophys. Res. Solid Earth 2019, 124, 2702–2720. [Google Scholar] [CrossRef]
  9. Ntarmouchant, A.; Jeddi, E.M.; Carvalho, M.R.; Bento dos Santos, T.M.; Smaili, H.; Cotrim, B.; Cachapuz, P.; Driouch, Y.; Mali, B.; Ntarmouchant, N.; et al. Thermal springs associated with the Melilla-Fès-Smaala-Oulmès fault (Morocco): The role of fluid geochemistry in identifying a major active geodynamic structure. Appl. Geochem. 2024, 170, 106085. [Google Scholar] [CrossRef]
  10. Scott, B.E.; Newell, D.L.; Jessup, M.J.; Grambling, T.A.; Shaw, C.A. Structural Controls on Crustal Fluid Circulation and Hot Spring Geochemistry Above a Flat-Slab Subduction Zone, Peru. Geochem. Geophys. Geosyst. 2020, 21, e2020GC008919. [Google Scholar] [CrossRef]
  11. Kulongoski, J.T.; Hilton, D.R.; Barry, P.H.; Esser, B.K.; Hillegonds, D.; Belitz, K. Volatile fluxes through the Big Bend section of the San Andreas Fault, California: Helium and carbon-dioxide systematics. Chem. Geol. 2013, 339, 92–102. [Google Scholar] [CrossRef]
  12. Sturrock, C.P.; Catlos, E.J.; Miller, N.R.; Akgun, A.; Fall, A.; Gabitov, R.I.; Yilmaz, I.O.; Larson, T.; Black, K.N. Fluids along the North Anatolian Fault, Niksar basin, north central Turkey: Insight from stable isotopic and geochemical analysis of calcite veins. J. Struct. Geol. 2017, 101, 58–79. [Google Scholar] [CrossRef]
  13. Tang, J.; Zhou, X.; Zhang, Y.; Tian, J.; He, M.; Li, J.; Dong, J.; Yan, Y.; Liu, F.; Ouyang, S.; et al. Hydrogeochemistry of Fault-Related Hot Springs in the Qaidam Basin, China. Appl. Sci. 2023, 13, 1415. [Google Scholar] [CrossRef]
  14. Zhou, H.; Zhou, X.; Su, H.; Li, Y.; Liu, F.; Ouyang, S.; Yan, Y.; Bai, R. Hydrochemical Characteristics of Earthquake-Related Thermal Springs along the Weixi–Qiaohou Fault, Southeast Tibet Plateau. Water 2022, 14, 132. [Google Scholar] [CrossRef]
  15. Zhou, R.; Zhou, X.; Li, Y.; He, M.; Li, J.; Dong, J.; Tian, J.; Li, K.; Yan, Y.; Ouyang, S.; et al. Hydrogeochemical and Isotopic Characteristics of the Hot Springs in the Litang Fault Zone, Southeast Qinghai-Tibet Plateau. Water 2022, 14, 1496. [Google Scholar] [CrossRef]
  16. Ma, X.; Zhang, L.; Chen, Z.; Shao, Y.; Chen, J.; Ba, R.; Zhang, M.; Martinelli, G.; Pinti, D.L.; Zhou, X.; et al. Geochemical characteristics of natural springs within the Lenglongling fault zone related to the Menyuan MS6.9 earthquake on January 8, 2022, NW China. Appl. Geochem. 2023, 158, 105767. [Google Scholar] [CrossRef]
  17. Bai, Y.; Wang, G.; Shi, Z.; Zhou, X.; Yan, X.; Zhang, S.; Mao, H.; Wang, C. Hydrogeochemical changes with emphasis on trace elements in an artesian well before and after the September 8, 2018 MS5.9 Mojiang Earthquake in Yunnan, southwest China. Appl. Geochem. 2024, 167, 106013. [Google Scholar] [CrossRef]
  18. Na, J.; Cen, C.; Shi, Z.; Feng, B. Distinct response of deep and shallow geothermal reservoir temperature following earthquakes in the Kangding Fault zone hydrothermal system. J. Hydrol. Reg. Stud. 2024, 52, 101743. [Google Scholar] [CrossRef]
  19. Fischer, T.; Matyska, C.; Heinicke, J. Earthquake-enhanced permeability - evidence from carbon dioxide release following the ML3.5 earthquake in West Bohemia. Earth Planet. Sci. Lett. 2017, 460, 60–67. [Google Scholar] [CrossRef]
  20. Kim, C.Y.; Yu, S.; Oh, Y.Y.; Chae, G.; Yun, S.T.; Shinn, Y.J. Short-Term Monitoring of Geogenic Soil CO2 Flux in a Non-Volcanic and Seismically Inactive Emission Site, South Korea. Frontiers in Earth Science 2021, 8, 599388. [Google Scholar] [CrossRef]
  21. Umeda, K.; Asamori, K.; Kusano, T. Release of mantle and crustal helium from a fault following an inland earthquake. Appl. Geochem. 2013, 37, 134–141. [Google Scholar] [CrossRef]
  22. Luo, Z.; Zhou, X.; He, M.; Liang, J.; Li, J.; Dong, J.; Tian, J.; Yan, Y.; Li, Y.; Liu, F.; et al. Earthquakes evoked by lower crustal flow: Evidence from hot spring geochemistry in Lijiang-Xiaojinhe fault. J. Hydrol. 2023, 619, 129334. [Google Scholar] [CrossRef]
  23. Reddy, D.V.; Nagabhushanam, P.; Sukhija, B.S. Earthquake (M5.1) induced hydrogeochemical and δ18O changes: Validation of aquifer breaching-mixing model in Koyna, India. Geophys. J. Int. 2011, 184, 359–370. [Google Scholar] [CrossRef]
  24. Zhang, L.; Guo, L.; Wang, Y.; Liu, D.; Liu, Y.; Li, J. Continuous monitoring of hydrogen and oxygen stable isotopes in a hot spring: Significance for distant earthquakes. Appl. Geochem. 2020, 112, 104488. [Google Scholar] [CrossRef]
  25. Skelton, A.; Andrén, M.; Kristmannsdóttir, H.; Stockmann, G.; Mörth, C.-M.; Sveinbjörnsdóttir, Á.; Jónsson, S.; Sturkell, E.; Guðrúnardóttir, H.R.; Hjartarson, H.; et al. Changes in groundwater chemistry before two consecutive earthquakes in Iceland. Nat. Geosci. 2014, 7, 752–756. [Google Scholar] [CrossRef]
  26. Igarashi, G.; Saeki, S.; Takahata, N.; Sumikawa, K.; Tasaka, S.; Sasaki, Y.; Takahashi, M.; Sano, Y. Groundwater radon anomaly before the kobe earthquake in Japan. Science 1995, 269, 60–61. [Google Scholar] [CrossRef]
  27. Wakita, H.; Nakamura, Y.; Sano, Y. Short-term and intermediate-term geochemical precursors. Pure Appl. Geophys. 1988, 126, 267–278. [Google Scholar] [CrossRef]
  28. Chen, Z.; Du, J.G.; Zhou, X.C.; Yi, L.; Liu, L.; Xie, C.; Cui, Y.J.; Li, Y. Hydrochemistry of the Hot Springs in Western Sichuan Province Related to the Wenchuan MS8.0 Earthquake. Sci. World J. 2014, 2014, 901432. [Google Scholar] [CrossRef]
  29. Liang, J.; Yu, Y.; Shi, Z.; Li, Z.; Huang, Y.; Song, H.; Xu, J.; Wang, X.; Zhou, X.; Huang, L.; et al. Geothermal springs with high δ13CCO2-DIC along the Xianshuihe fault, Western Sichuan, China: A geochemical signature of enhanced deep tectonic activity. J. Hydrol. 2023, 623, 129760. [Google Scholar] [CrossRef]
  30. Yan, Y.; Zhang, Z.; Zhou, X.; Wang, G.; He, M.; Tian, J.; Dong, J.; Li, J.; Bai, Y.; Zeng, Z.; et al. Geochemical characteristics of hot springs in active fault zones within the northern Sichuan-Yunnan block: Geochemical evidence for tectonic activity. J. Hydrol. 2024, 635, 131179. [Google Scholar] [CrossRef]
  31. Chen, J.; Xiong, P.; Wu, H.; Zhang, X.; Zhang, X.; Zhang, T.; Ruan, Q. Pre-seismic anomalies and co-seismic disturbance induced by the 2024 Mw7.1 Wushi earthquake: Multi-GNSS observations and modeling. Geomat. Nat. Hazards Risk 2024, 15, 2422024. [Google Scholar] [CrossRef]
  32. Ding, Y.; Liu, X.; Dai, X.; Yin, G.; Yang, Y.; Guo, J. D-InSAR-Based Analysis of Slip Distribution and Coulomb Stress Implications from the 2024 Mw7.01 Wushi Earthquake. Remote Sens. 2024, 16, 4319. [Google Scholar] [CrossRef]
  33. Guan, P.; Lei, J.; Zhao, D. Relocation of the 2024 MS7.1 Wushi, Xinjiang, China earthquake sequence and implications for seismogenic structure. J. Asian Earth Sci. 2025, 279, 106456. [Google Scholar] [CrossRef]
  34. Guo, N.; Wu, Y.; Zhu, S.; Chen, C. Coseismic deformation and interseismic strain accumulation of the 2024 MS7.1 Wushi earthquake in Xinjiang, China. Adv. Space Res. 2024, 74, 1586–1594. [Google Scholar] [CrossRef]
  35. Li, M.; Yan, H.; Liu, T. Automatically Detected CSES Ionospheric Precursors Before Part of the Strong Aftershocks of the 23 January 2024 Wushi MS7.1 Earthquake in Northwest China. Remote Sens. 2024, 16, 4182. [Google Scholar] [CrossRef]
  36. Li, Y.; Li, W.; Xu, Q.; Xu, S. Coseismic deformation and slip distribution of the 2024 MS7.1 Wushi earthquake based on InSAR observations. J. Chengdu Univ. Technol. Sci. Technonogy Ed. 2024, 51, 641–653. [Google Scholar]
  37. Qiu, J.; Sun, J.; Ji, L. The 2024 Mw7.1 Wushi Earthquake: A Thrust and Strike-Slip Event Unveiling the Seismic Mechanisms of the South Tian Shan’s Thick-Skin Tectonics. Remote Sens. 2024, 16, 2937. [Google Scholar] [CrossRef]
  38. Yin, X.; Wang, S.; Liang, X.; Ma, G. Impact of fault complexity on aftershock decay:a case study of the Wushi MS7.1 earthquake,2024. China Earthq. Eng. J. 2024, 46, 965–972,991. [Google Scholar]
  39. Yu, S.; Li, Z.; Zhao, P.; Luo, J.; Yang, Y. Source Parameters and Seismogenic Fault Model of the 2024 Mw7.0 Wushi (Xinjiang, China) Earthquake Revealed by InSAR Observations. Pure Appl. Geophys. 2024, 182, 1149–1162. [Google Scholar] [CrossRef]
  40. Zhang, B.; Qian, L.; Li, T.; Chen, J.; Xu, J.; Yao, Y.; Fang, L.; Xie, C.; Chen, J.; Liu, G.; et al. Geological disasters and surface ruptures of january 23, 2024 MS7.1 Wushi earthquake, Xinjiang, China. Seismol. Geol. 2024, 46, 220–234. [Google Scholar]
  41. Zhu, S.; Zhan, W.; Liu, X.; Liang, H. Deformation characteristics before the M7.1 earthquake in Wushi, Xinjiang, from GNSS observation data. China Earthq. Eng. J. 2024, 46, 973–981. [Google Scholar]
  42. Jia, Q. Activity Characteristics since Late Quaternary and Seismic Risk of Aheqi Segment of Maidan Fault. Ph.D. Thesis, Lanzhou Institute of Seismology, China Earthquake Administration, Lanzhou, China, 2015. (In Chinese). [Google Scholar]
  43. Wu, C.; Zheng, W.; Zhang, P.; Zhang, Z.; Jia, Q.; Yu, J.; Zhang, H.; Yao, Y.; Liu, J.; Han, G.; et al. Oblique Thrust of the Maidan Fault and Late Quaternary Tectonic Deformation in the Southwestern Tian Shan, Northwestern China. Tectonics 2019, 38, 2625–2645. [Google Scholar] [CrossRef]
  44. Liu, G. Paleozoic Crustal Growth and Evolution in the South Tianshan Orogenic Belt—Constraits from Geochronology and Hf Isotopic Composition of Detrital Zircons from the Modern River. Ph.D. Thesis, China University of Mining and Technology, Jiangsu, China, 2021. [Google Scholar]
  45. He, J.; Zhu, W.; Ge, R.; Zheng, B.; Wu, H. Detrital zircon U-Pb ages and Hf isotopes of Neoproterozoic strata in the Aksu area, northwestern Tarim Craton: Implications for supercontinent reconstruction and crustal evolution. Precambrian Res. 2014, 254, 194–209. [Google Scholar] [CrossRef]
  46. Liu, W.; Zou, Y.; Tian, W.; Jiang, T.; Yan, W.; Nance, R.D.; Zhou, X. The origin and tectonic evolution of the late Neoproterozoic rift basin in the Tarim Craton, NW China. J. Asian Earth Sci. 2024, 262, 106011. [Google Scholar] [CrossRef]
  47. Wu, L.; Guan, S.; Ren, R.; Zhang, C.; Feng, X. Neoproterozoic glaciations and rift evolution in the northwest Tarim Craton, China: New constraints from geochronological, geochemical, and geophysical data. Int. Geol. Rev. 2021, 63, 1–20. [Google Scholar] [CrossRef]
  48. Yang, S.; Jia, D.; Chen, H.; Sun, C.; Yin, H.; Fan, X.; Zhang, Y.; Lin, X.; Chen, Z.; Shen, L.; et al. The Role of the Curved Southern Asian Margin Between the Tarim and Tajik Cratons During the Evolution of the Pamir, Insights From Sandbox Modeling. Tectonics 2024, 43, e2023TC008054. [Google Scholar] [CrossRef]
  49. Zhang, C.; Li, H. The Tarim Craton in the Northwest of China. Int. Geol. Rev. 2023, 65, 607–643. [Google Scholar] [CrossRef]
  50. Alexeiev, D.V.; Biske, Y.S.; Wang, B.; Djenchuraeva, A.V.; Getman, O.F.; Aristov, V.A.; Kroener, A.; Liu, H.; Zhong, L. Tectono-Stratigraphic framework and Palaeozoic evolution of the Chinese South Tianshan. Geotectonics 2015, 49, 93–122. [Google Scholar] [CrossRef]
  51. Liu, G.; Jiang, B.; Guo, R.; Gong, X.; Guo, M.; Cui, T. U-Pb age and Hf isotopic composition of detrital zircons from the modern river of the South Tianshan orogenic belt and their implications for Palaeozoic tectonic and crustal evolution. Geol. J. 2020, 55, 7114–7131. [Google Scholar] [CrossRef]
  52. Sass, P.; Ritter, O.; Ratschbacher, L.; Tympel, J.; Matiukov, V.E.; Rybin, A.K.; Batalev, V.Y. Resistivity structure underneath the Pamir and Southern Tian Shan. Geophys. J. Int. 2014, 198, 564–579. [Google Scholar] [CrossRef]
  53. Gilligan, A.; Roecker, S.W.; Priestley, K.F.; Nunn, C. Shear velocity model for the Kyrgyz Tien Shan from joint inversion of receiver function and surface wave data. Geophys. J. Int. 2014, 199, 480–498. [Google Scholar] [CrossRef]
  54. Lü, Z.; Lei, J.; Zhao, L.; Fu, X.; Chen, J.; Li, G.; Kong, Q. Crustal deformation of intermontane basins beneath Central Tien Shan revealed by full-wave ambient noise tomography. Tectonophysics 2021, 821, 229143. [Google Scholar] [CrossRef]
  55. Kong, W.; Huang, L.; Li, Y.; Tian, Y. A numerical study of contemporary crustal deformation partitioning across the Southwestern Tian Shan orogen. Tectonophysics 2024, 891, 230529. [Google Scholar] [CrossRef]
  56. Xiao, W.; Windley, B.F.; Allen, M.B.; Han, C. Paleozoic multiple accretionary and collisional tectonics of the Chinese Tianshan orogenic collage. Gondwana Res. 2013, 23, 1316–1341. [Google Scholar] [CrossRef]
  57. Yan, Y.; Zhou, X.; Zhu, C.; Li, J.; Liu, F.; Ouyang, S.; Jiang, L. Hydrogeochemical Features of the Hot Spring Water before and after the 2020,Jiashi, Xinjiang MS6.4 Earthquake. Earthquake. J. Seismol. Res. 2022, 45, 229–240. [Google Scholar]
  58. Pang, Z. Mechanism of water cycle changes and implications on water resources regulation in Xinjiang Uygur autonomous region. Quat. Sci. 2014, 34, 907–917+906. [Google Scholar]
  59. GBW04458, GBW04459, GBW04460; Hydrogen and Oxygen Isotope Water Standards. National Research Center for Certi-fied Reference Materials: Beijing, China, 2012.
  60. Jin, Y.; Liu, W.; Liu, Y.; Zhang, M.; Xu, S. Flux and genesis of dissolved inorganic carbon in thermal springs from the Lancang fault zone, southwestern Yunnan. Adv. Earth Sci. 2024, 39, 945–956. [Google Scholar]
  61. NBS-18; Calcite Mineral 13C and 18O. National Institute of Standards and Technology: Gaithersburg, MD, USA, 1982.
  62. Cao, C.; Zhang, M.; Tang, Q.; Lu, Z.; Wang, Y.; Du, L.; Li, Z. Geochemical Characteristics and Implications of Shale Gas in Longmaxi Formation, Sichuan Basin, China. Nat. Gas Geosci. 2015, 26, 1604–1612. [Google Scholar] [CrossRef]
  63. Wang, S.; Zhou, X.; Tian, J.; He, M.; Li, J.; Dong, J.; Li, L.; Li, Z.; Xing, L.; Zheng, G. Constraints on geological structures and dynamics along the Tian Shan-Pamir orogenic belt with helium isotopes in hot springs. Appl. Geochem. 2024, 160, 105859. [Google Scholar] [CrossRef]
  64. Zhou, X.; Liu, L.; Chen, Z.; Cui, Y.; Du, J. Gas geochemistry of the hot spring in the Litang fault zone, Southeast Tibetan Plateau. Appl. Geochem. 2017, 79, 17–26. [Google Scholar] [CrossRef]
  65. Hosono, T.; Hartmann, J.; Louvat, P.; Amann, T.; Washington, K.E.; West, A.J.; Okamura, K.; Böttcher, M.E.; Gaillardet, J. Earthquake-induced structural deformations enhance long-term solute fluxes from active volcanic systems. Sci. Rep. 2018, 8, 14809. [Google Scholar] [CrossRef] [PubMed]
  66. Yao, B.; Zhou, X.; Qiu, D.; Du, J.; He, M.; Tian, J.; Zeng, Z.; Wang, Y.; Yan, Y.; Xing, G.; et al. Geochemical Characteristics of Trace Elements of Hot Springs in the Xianshuihe–Xiaojiang Fault Zone. Water 2024, 16, 680. [Google Scholar] [CrossRef]
  67. Zhu, R.; Yang, F.; Zhou, X.; Tian, J.; Zhang, Y.; He, M.; Li, J.; Dong, J.; Li, Y. Anomaly Detection Using Machine Learning in Hydrochemical Data From Hot Springs: Implications for Earthquake Prediction. Water Resour. Res. 2024, 60, e2023WR034748. [Google Scholar] [CrossRef]
  68. Zhuang, S.; Wang, G.; Zhou, X.; Shi, Z.; Yuan, D.; Tian, J.; He, M.; Zeng, Z.; Yan, Y.; Yao, B.; et al. Deciphering the distribution and enrichment of arsenic in geothermal water in the Red River Fault Zone, southwest China. J. Hazard. Mater. 2024, 485, 136756. [Google Scholar] [CrossRef]
  69. Xie, X.; Zhang, M.; Liu, W.; Liu, Y.; Lang, Y.; Xu, S. Active CO2 emissions from thermal springs in the Karakoram fault system and adjacent regions, western Tibetan Plateau. Appl. Geochem. 2024, 161, 105896. [Google Scholar] [CrossRef]
  70. Giggenbach, W.F. Geothermal solute equilibria - derivation of Na-K-Mg-Ca geoindicators. Geochim. Cosmochim. Acta 1988, 52, 2749–2765. [Google Scholar] [CrossRef]
  71. Arnold, Y.P.; Cabassi, J.; Tassi, F.; Caffe, P.J.; Vaselli, O. Fluid geochemistry of a deep-seated geothermal resource in the Puna plateau (Jujuy Province, Argentina). J. Volcanol. Geotherm. Res. 2017, 338, 121–134. [Google Scholar] [CrossRef]
  72. Lei, J. Seismic tomographic imaging of the crust and upper mantle under the central and western Tien Shan orogenic belt. J. Geophys. Res. 2011, 116, B09305. [Google Scholar] [CrossRef]
  73. Li, Y.; Shi, L.; Gao, J. Lithospheric structure across the central Tien Shan constrained by gravity anomalies and joint inversions of receiver function and Rayleigh wave dispersion. J. Asian Earth Sci. 2016, 124, 191–203. [Google Scholar] [CrossRef]
  74. Sychev, I.V.; Koulakov, I.; Sycheva, N.A.; Koptev, A.; Medved, I.; El Khrepy, S.; Al-Arifi, N. Collisional Processes in the Crust of the Northern Tien Shan Inferred From Velocity and Attenuation Tomography Studies. J. Geophys. Res. Solid Earth 2018, 123, 1752–1769. [Google Scholar] [CrossRef]
  75. Han, B.; Chen, X.; Pan, Y.; Wang, C.; Shi, M.; Chu, X. Diffusion Model of Cement Slurry in Porous Media Considering Porosity Variation and Percolation Effect. Appl. Sci. 2023, 13, 1919. [Google Scholar] [CrossRef]
  76. Li, Y.; Liu, G.; He, J.; Zhong, H. Activation of Persulfate for Groundwater Remediation: From Bench Studies to Application. Appl. Sci. 2023, 13, 1304. [Google Scholar] [CrossRef]
  77. Shi, Z.; Zhang, H.; Wang, G. Groundwater trace elements change induced by M5.0 earthquake in Yunnan. J. Hydrol. 2020, 581, 124424. [Google Scholar] [CrossRef]
  78. Chen, Y.; Liu, J. Groundwater trace element changes were probably induced by the ML3.3 earthquake in Chaoyang district, Beijing. Front. Earth Sci. 2023, 11, 1260559. [Google Scholar] [CrossRef]
Figure 1. (a) Tectonic position of the STS under the Cenozoic India–Eurasian plate collision. (b) Distribution map of sampling sites in the study area. (c) Lithology distribution map of the study area. Abbreviations: TFF: Taraz–Fergana Fault, MDF: Maidian Fault, ATS: Atushi Fault. S13 hot spring is a continuous monitoring site.
Applsci 15 04791 g001
Figure 2. Piper trilinear diagram of hot spring water samples.
Applsci 15 04791 g002
Figure 3. Stable isotope δD and δ18O (‰V-SMOW) values for water samples.
Applsci 15 04791 g003
Figure 4. Na-K-Mg ternary diagrams.
Applsci 15 04791 g004
Figure 5. Variation pattern of reservoir mineral saturation index (log (Q/K)) with temperature.
Applsci 15 04791 g005
Figure 6. (a) Plot of 4He/20Ne versus Rc/Ra ratio. Mixing lines between the atmosphere and upper mantle, as well as between the atmosphere and crust, were calculated using the following end-member compositions. Air: 3He/4He = 1.4 × 10⁻⁶; 4He/20Ne = 0.318, upper mantle: 3He/4He = 12 × 10−6; 4He/20Ne = 100,000, old continental crust: 3He/4He = 0.02 × 10⁻⁶; 4He/20Ne = 100,000 [64]. (b) Plot of δ13C CO2 values versus CO2/3He ratio. The end-member compositions for Organic (O), MORB (M), and Carbonate (C) are as follows: O: δ13C CO2 = −30‰; CO2/3He = 1 × 10¹³, M: δ13C CO2 = −6.5‰, CO2/3He = 2 × 10⁹; C: δ13C CO2= 0‰; CO2/3He= 1 × 10¹³. Binary mixing trajectories between M and C, M and O, and C and O are illustrated in the diagram [63].
Applsci 15 04791 g006
Figure 7. Poisson’s ratio anomalies in the study area. Modified from (Lei, 2011) [71].
Applsci 15 04791 g007
Figure 8. Long-term monitoring of Na+, Cl, SO42−, δ18O, δD, and δ13C DIC concentration changes at S13 hot springs and the magnitude and date of M > 3.0 earthquakes in related tectonic region.
Applsci 15 04791 g008
Figure 9. Long-term monitoring of trace elements concentration changes at S13 hot springs and the magnitude and date of M > 3.0 earthquakes in related tectonic regions. (a) Li, B, Al, Ba, Ge, Rb, and Cs concentrations, (b) Be, V, Mo, Cr, Sr, and Sb concentrations.
Applsci 15 04791 g009
Figure 10. Conceptual model of fluid circulation in the study area.
Applsci 15 04791 g010
Table 1. Geochemical components of gases in the study area.
SampleHeH2CO2CH4O2N2Ar3He/4He4He/20NeCO2/3Heδ13C CO2a R/Rab Rc/Rac Mantle PercentCO2
ppmppm%%%%% %d Oe Cf M
S1(G1)7.61.198.060.010.321.620.025.20 × 10−6463.49 × 1010−4.23.713.7346.4813.082.74.3
S13(G2)6607.0146.640.720.0288.321.055.82 × 10−77371.73 × 107−10.30.420.425.01---
‘-’ represent no data. The data of S13 gas are quoted in [64]. a R/Ra is measured as 3He/4He ratio divided by the 3He/4He ratio in air = 1.39 × 10⁻⁶ [64,65]. b X-valueBubbling gas = (4He/20Ne)measured/(4He/20Ne)air, Rc/Ra is the air corrected He isotope ratio = [(R/Ra × X) − 1]/(X − 1) [65]. c Mantle percent = mantle derived He. d O = CO2 (%) Organic. e C = CO2 (%) Carbonate. f M = CO2 (%) Mid-Ocean Ridge Basalt (MORB).
Table 2. Multi-method reservoir temperature estimation.
SampleQuartz, No Steam Loss (°C)Quartz, Maximum Steam Loss (°C)Chalcedony (°C)Multicomponent Chemical Equibria (°C)Average Reservoir Temperature (°C)Average Reservoir Deepth (m)
S136.193.4044.4919.0026941
S26.15-16.9448.0018621
S332.950.1341.5542.00291076
S416.82-26.7951.0024856
S523.05-32.5148.0026946
S624.04-33.4258.00291065
S750.2317.7257.1522.00371381
S826.02-35.2319.0020712
S914.35-24.5266.0026959
S1014.92-25.0462.0025930
S1123.75-33.1572.00321199
S1222.38-31.9161.00291063
S1399.0668.93100.1890.00903492
S1453.5221.1160.1081.00542067
S1555.0022.6361.4242.00451720
S1641.068.3548.9066.00411553
S1721.60-31.1938.0023818
S1831.14-39.9010.0020720
‘-’ represent No data.
Disclaimer/Publisher’s Note: The statements, opinions and data contained in all publications are solely those of the individual author(s) and contributor(s) and not of MDPI and/or the editor(s). MDPI and/or the editor(s) disclaim responsibility for any injury to people or property resulting from any ideas, methods, instructions or products referred to in the content.

