Article

Cracking Behavior of Fiber-Reinforced Concrete Beams Made of Waste Sand

by
Jacek Domski
1,*,
Joanna Laskowska-Bury
1,* and
Anna Dudzińska
2
1
Faculty of Civil Engineering, Environmental and Geodetic Sciences, Koszalin University of Technology, Śniadeckich 2, 75-453 Koszalin, Poland
2
Faculty of Civil Engineering, Kraków University of Technology, ul. Warszawska 24, 31-155 Kraków, Poland
*
Authors to whom correspondence should be addressed.
Appl. Sci. 2025, 15(9), 4790; https://doi.org/10.3390/app15094790
Submission received: 28 February 2025 / Revised: 22 April 2025 / Accepted: 23 April 2025 / Published: 25 April 2025

Abstract

:
This report presents the results of cracking tests on concrete beams. The test specimens were created in ten different series. Each series comprised two beams, six cylinders, and twelve cubic samples intended for the determination of strength properties. These samples varied in terms of the type of concrete mixture (fiber-reinforced fine aggregate concrete and plain concrete), the applied steel fibers (50/0.8 mm and 30/0.55 mm), the longitudinal reinforcement ratio in beams (0.6%, 0.9%, 1.3%, and 1.8%), and the inclusion (or exclusion) of compressed reinforcement and vertical stirrups. The fine aggregate concrete was made from waste sand, which is a byproduct of the hydroclassification process of gravel. The use of this sand in fiber concrete will help reduce the exploitation of natural resources and lower carbon dioxide emissions. Based on four-point beam bending tests, the study experimentally determined cracking moments, crack spacing, and crack width. Additionally, these results were compared with calculations proposed by L. Vandewalle and Domski, as well as with the methods outlined in Eurocode 2. The analyses conducted show that the best agreement between the research results and the calculations was obtained for Domski’s proposal. It follows that the average percentage error was 38.4%, indicating the safe use of this method.

1. Introduction

In recent decades, the search for and use of sustainable materials with increasingly enhanced properties has become a trend. This trend spans various fields of science and includes numerous materials, particularly concrete, which is the most widely used material in construction [1,2,3,4,5,6]. Unfortunately, the brittleness of concrete increases as its strength rises. The higher the strength of concrete, the lower its plasticity. This relationship has a significant disadvantage. A compromise between these two contradictory properties of concrete can be achieved by adding fibers.
The main purpose of using steel fibers in concrete elements, aside from improving mechanical properties, is to limit cracks arising under the influence of external and internal loads [7,8,9,10,11,12,13,14,15,16,17]. One of the parameters describing the formation of cracks in “small beams” made of fiber-reinforced concrete is the so-called crack resistance index (minimum value 1) [18]. This index is the ratio of the energy absorbed (the area under the force-displacement curve) during a given deformation to the energy associated with the occurrence of the first crack. It determines the ability of an element to absorb loads within a specific deformation range [19]. This index is compared with that of a perfectly elastic material, which has values of 5, 10, 30, or 100 for I5, I10, I30, and I100, respectively [18,20]. Another parameter used to describe the cracking state in “small beams” made of fiber-reinforced concrete is the moment of the appearance of the first crack [21,22]. This moment is most often determined based on the load-strain relationship at the point where the curve deviates from the straight line. Most standards contain this interpretation (ASTM C 1018 [21], NBN B 15-238 [23], JCI Standard SF-4 [24]) and recommendations (CUR, DBV) for testing fiber-reinforced concrete “beams”, regardless of their size. Numerous studies have verified the calculation methods included in the standards [16,25,26,27,28,29,30,31,32]. Unfortunately, these methods are not applicable to the calculation of full-size elements, such as beams with longitudinal reinforcement and steel fibers, because it is often not possible to clearly define the cracking moment based on the load-deflection relationship [33]. There are also established methods for calculating the cracking limit state for reinforced concrete beams with the addition of steel fibers [34,35,36,37,38,39,40,41,42,43,44,45,46,47,48,49]. Most of these methods consider the static equilibrium of forces in a beam fragment before and after cracking. Differences in the individual methods include, among others, how the cooperation between reinforcing bars and fiber-reinforced concrete is taken into account, as well as the assumptions regarding different boundary properties of the cracked and non-cracked cross-sections.
This study presents the results of tests on the cracking limit state of reinforced fiber-reinforced concrete beams made from waste sand, which continue the investigations presented earlier in articles [50,51]. The average crack spacing (srmExp) and crack widths (wkExp) determined in the tests were compared with the values obtained using the method in the previous EC2 standard [52], the Vandewille proposal [41], its modification [53], and the current EC2 standard [54]. The aggregate used in the study was waste sand generated from the hydroclassification process. This is a process of obtaining coarse aggregate by washing it out of deposits. The effect of using the hydroclassification process on natural aggregates is that it leaves heaps of washed sand devoid of coarse fractions. The excavations created in this way should undergo costly reclamation. An alternative to reclaiming former excavations may be the possibility of using waste sand as an aggregate for concrete. This sand is classified as waste, consistent with the definition provided in the waste catalog of the Polish Geological Institute [55]. Moreover, analysis of the results from the conducted tests showed that this waste sand meets the requirements for mineral aggregates recommended for the production of concrete [56,57]. The sustainable use of aggregate raw materials and the utilization of waste sand can significantly reduce further environmental degradation. Utilizing waste sand in concrete production can lead to a gradual reduction in waste sand heaps.

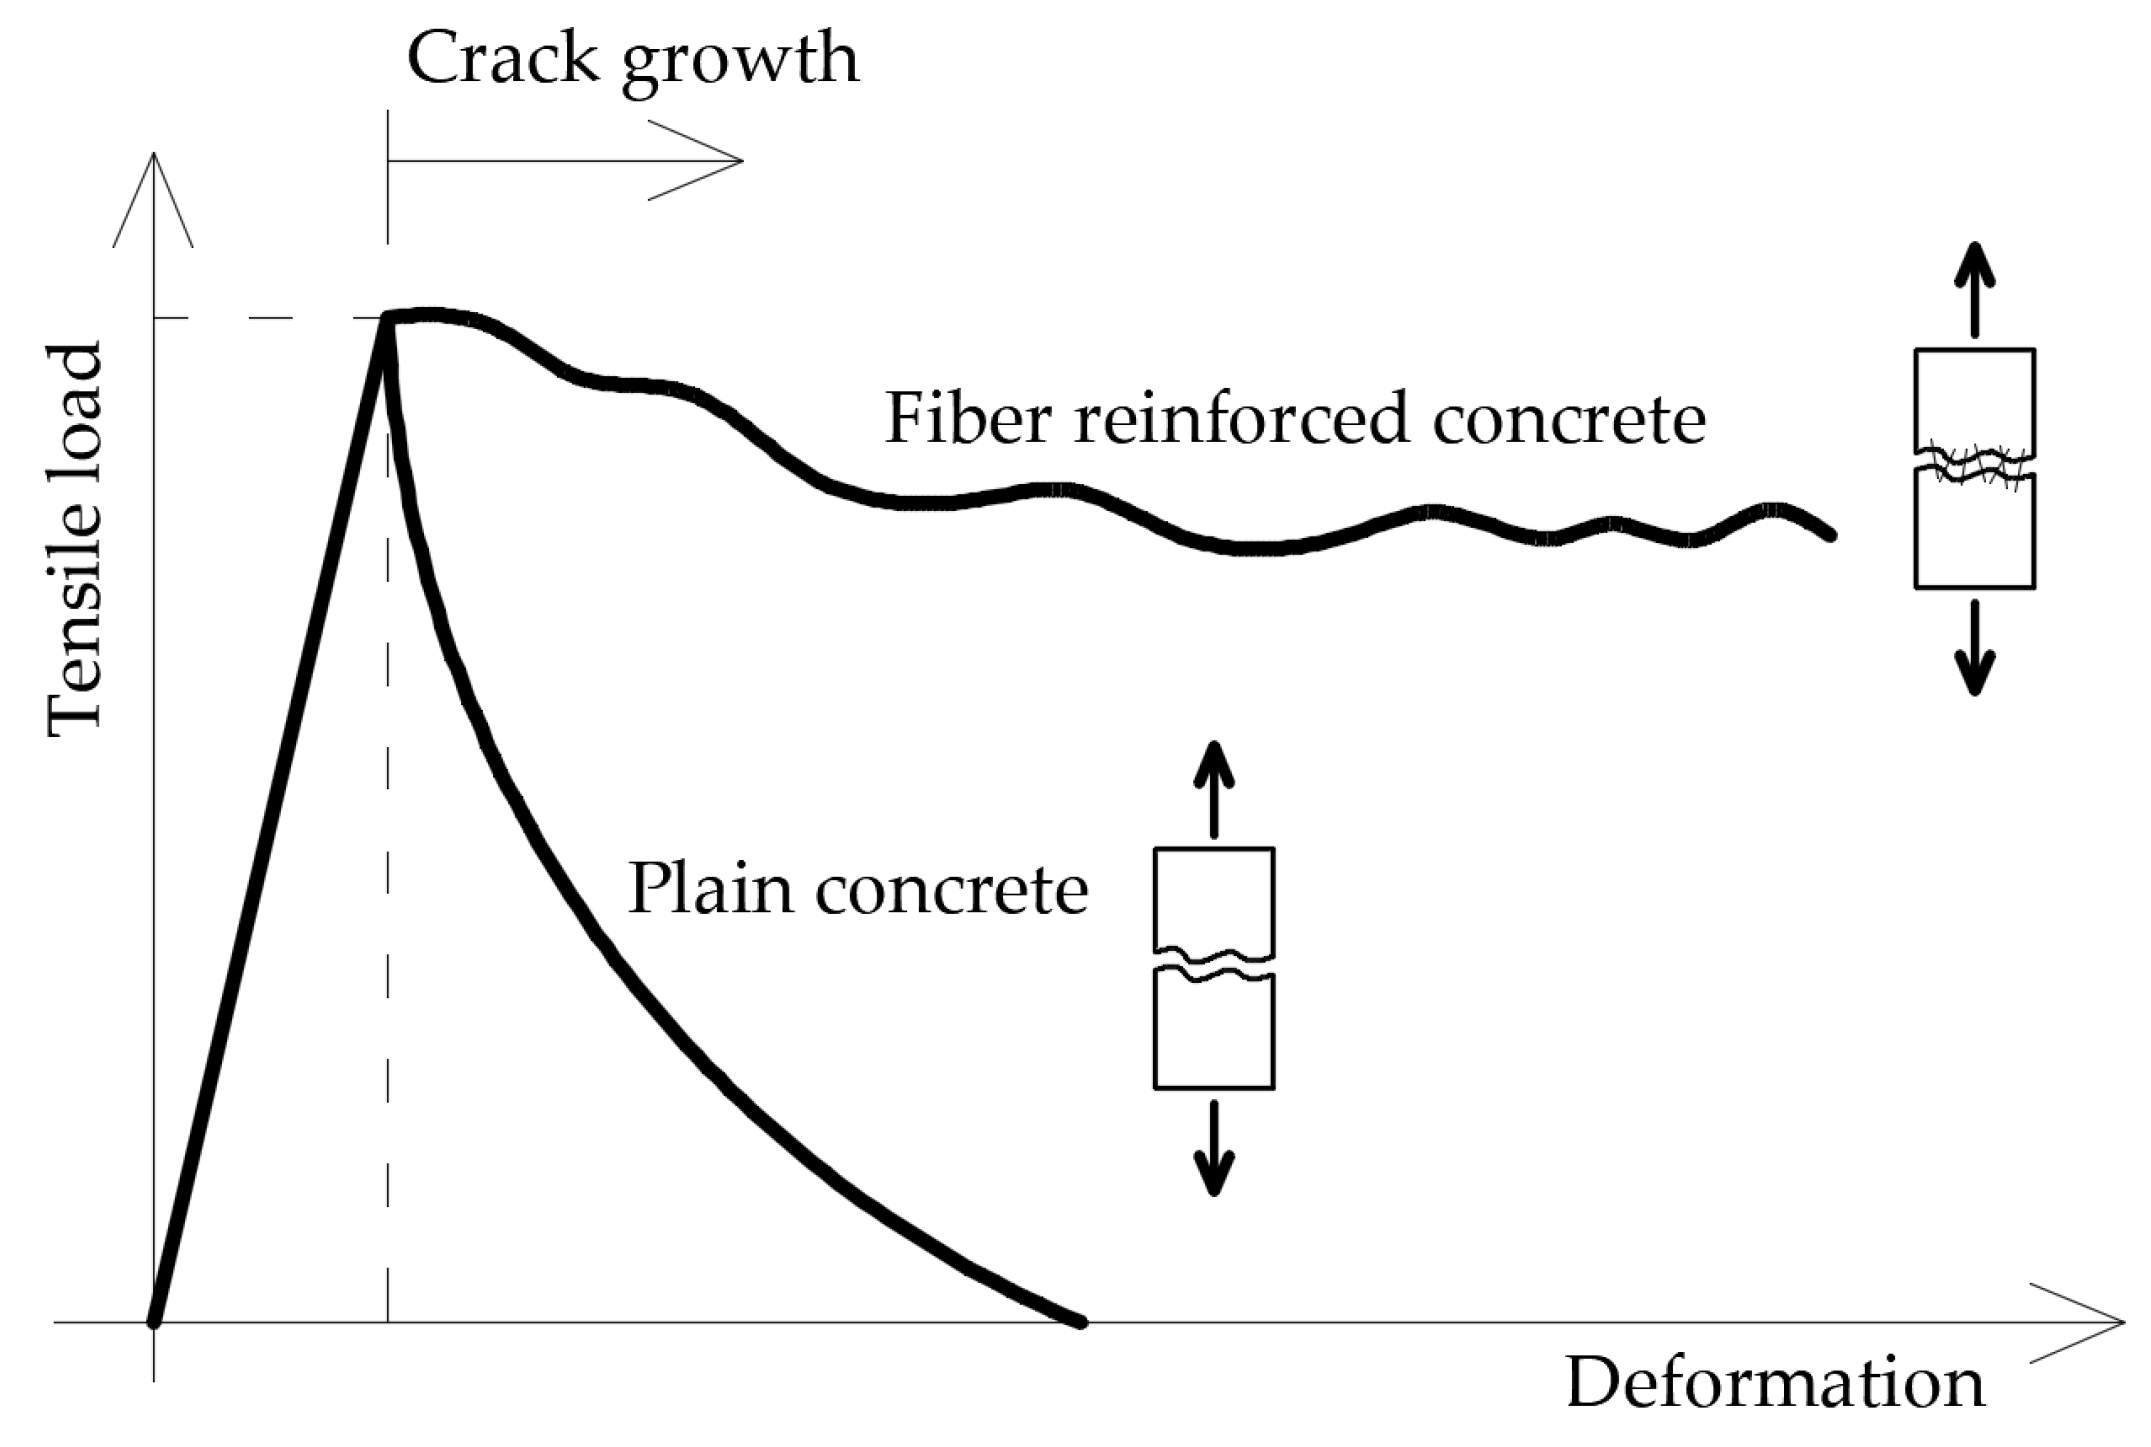
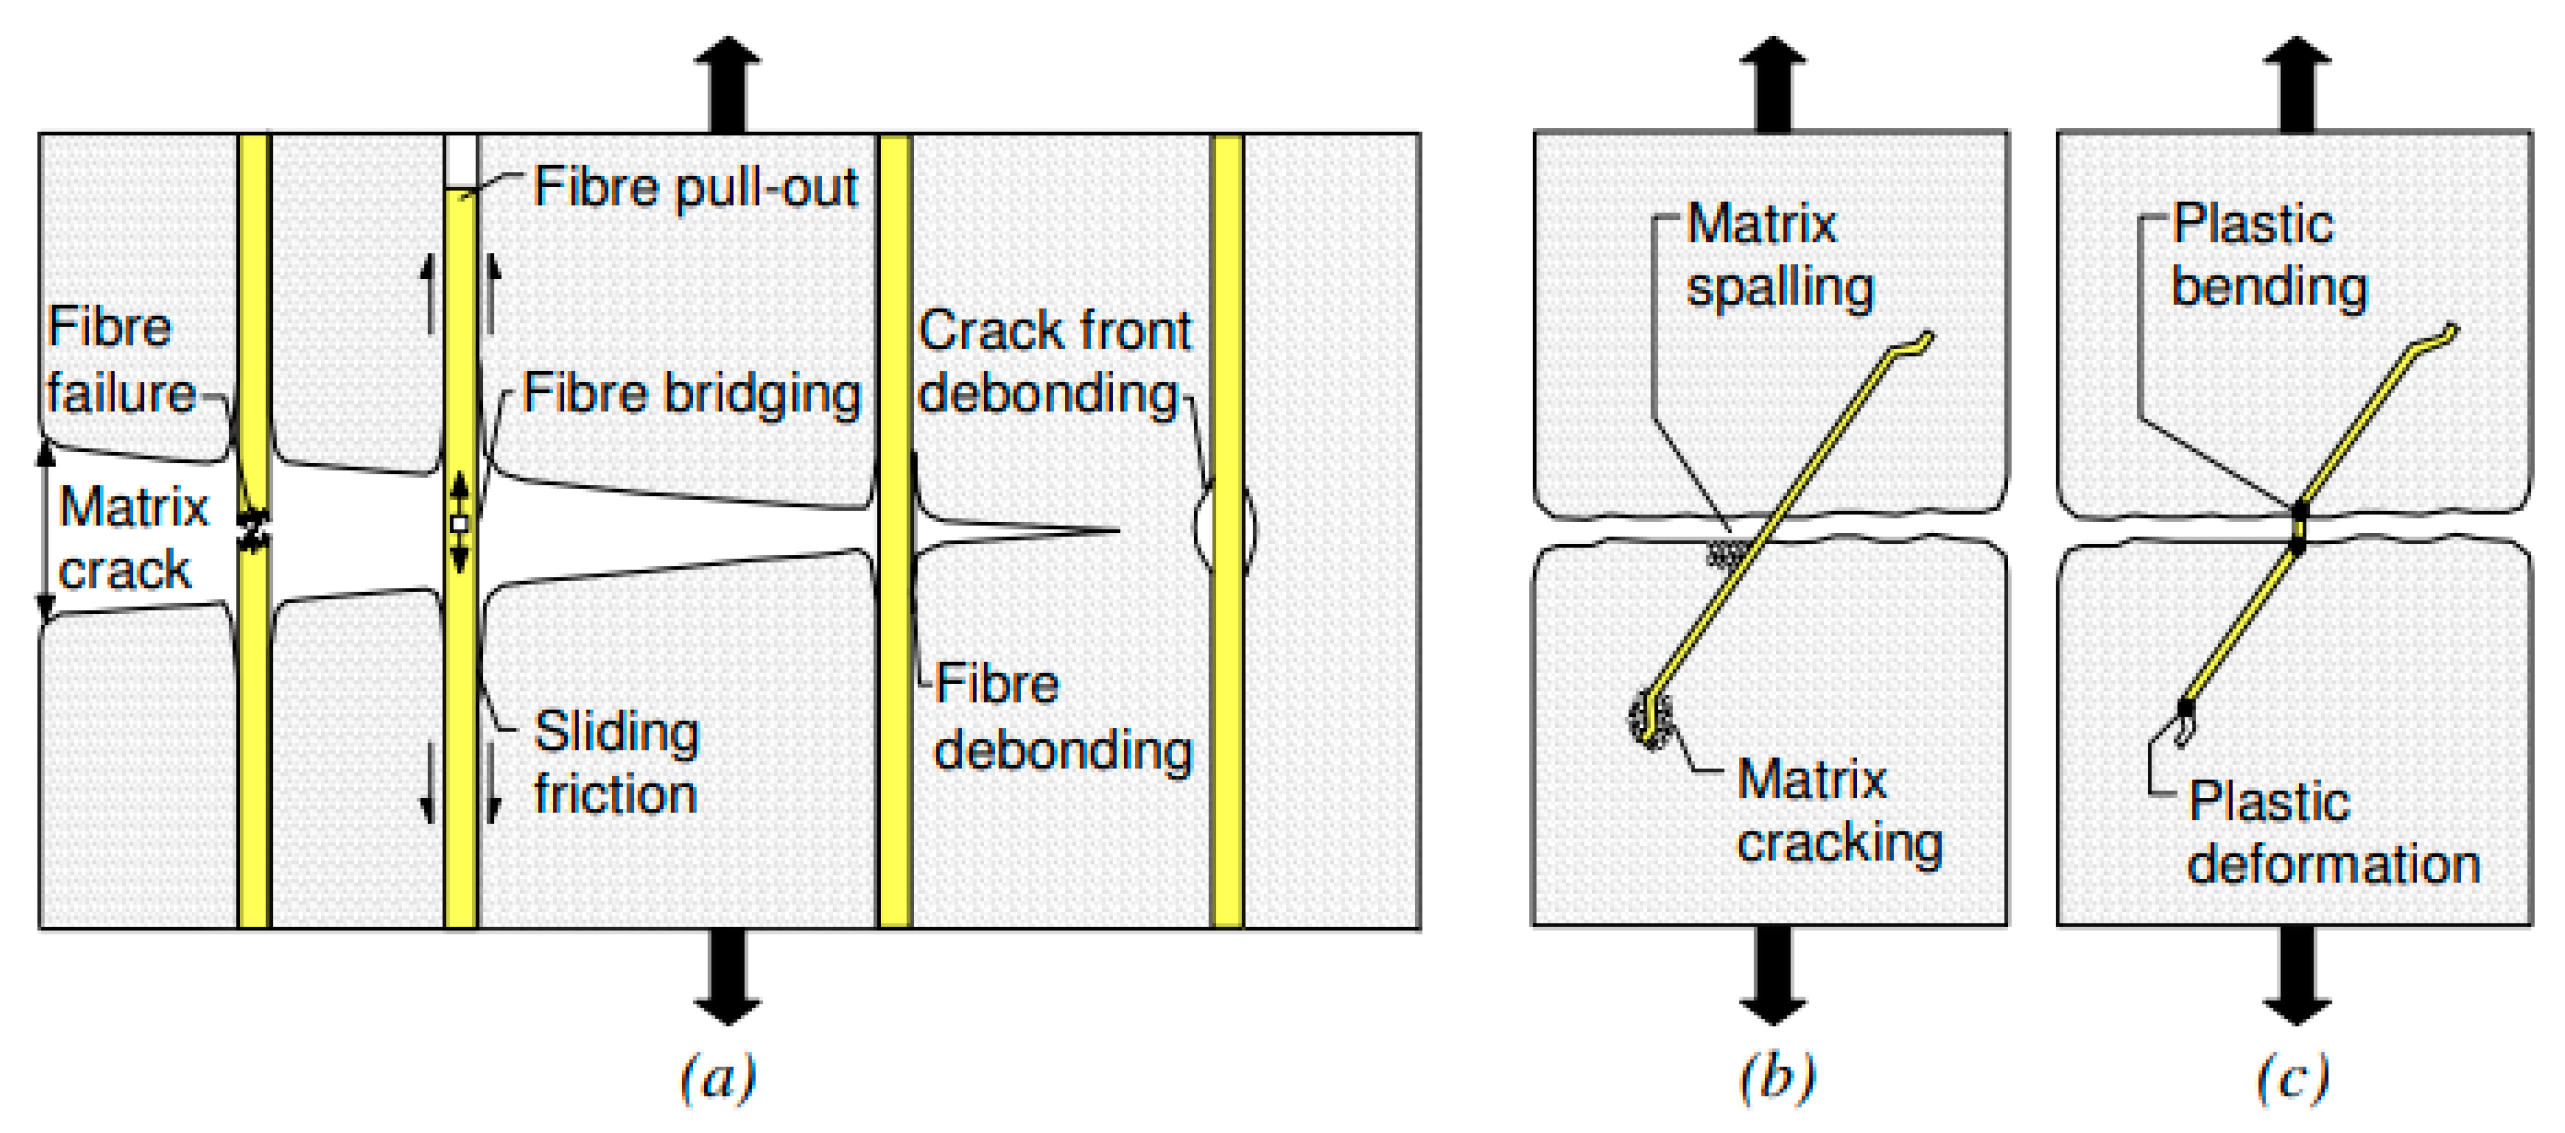
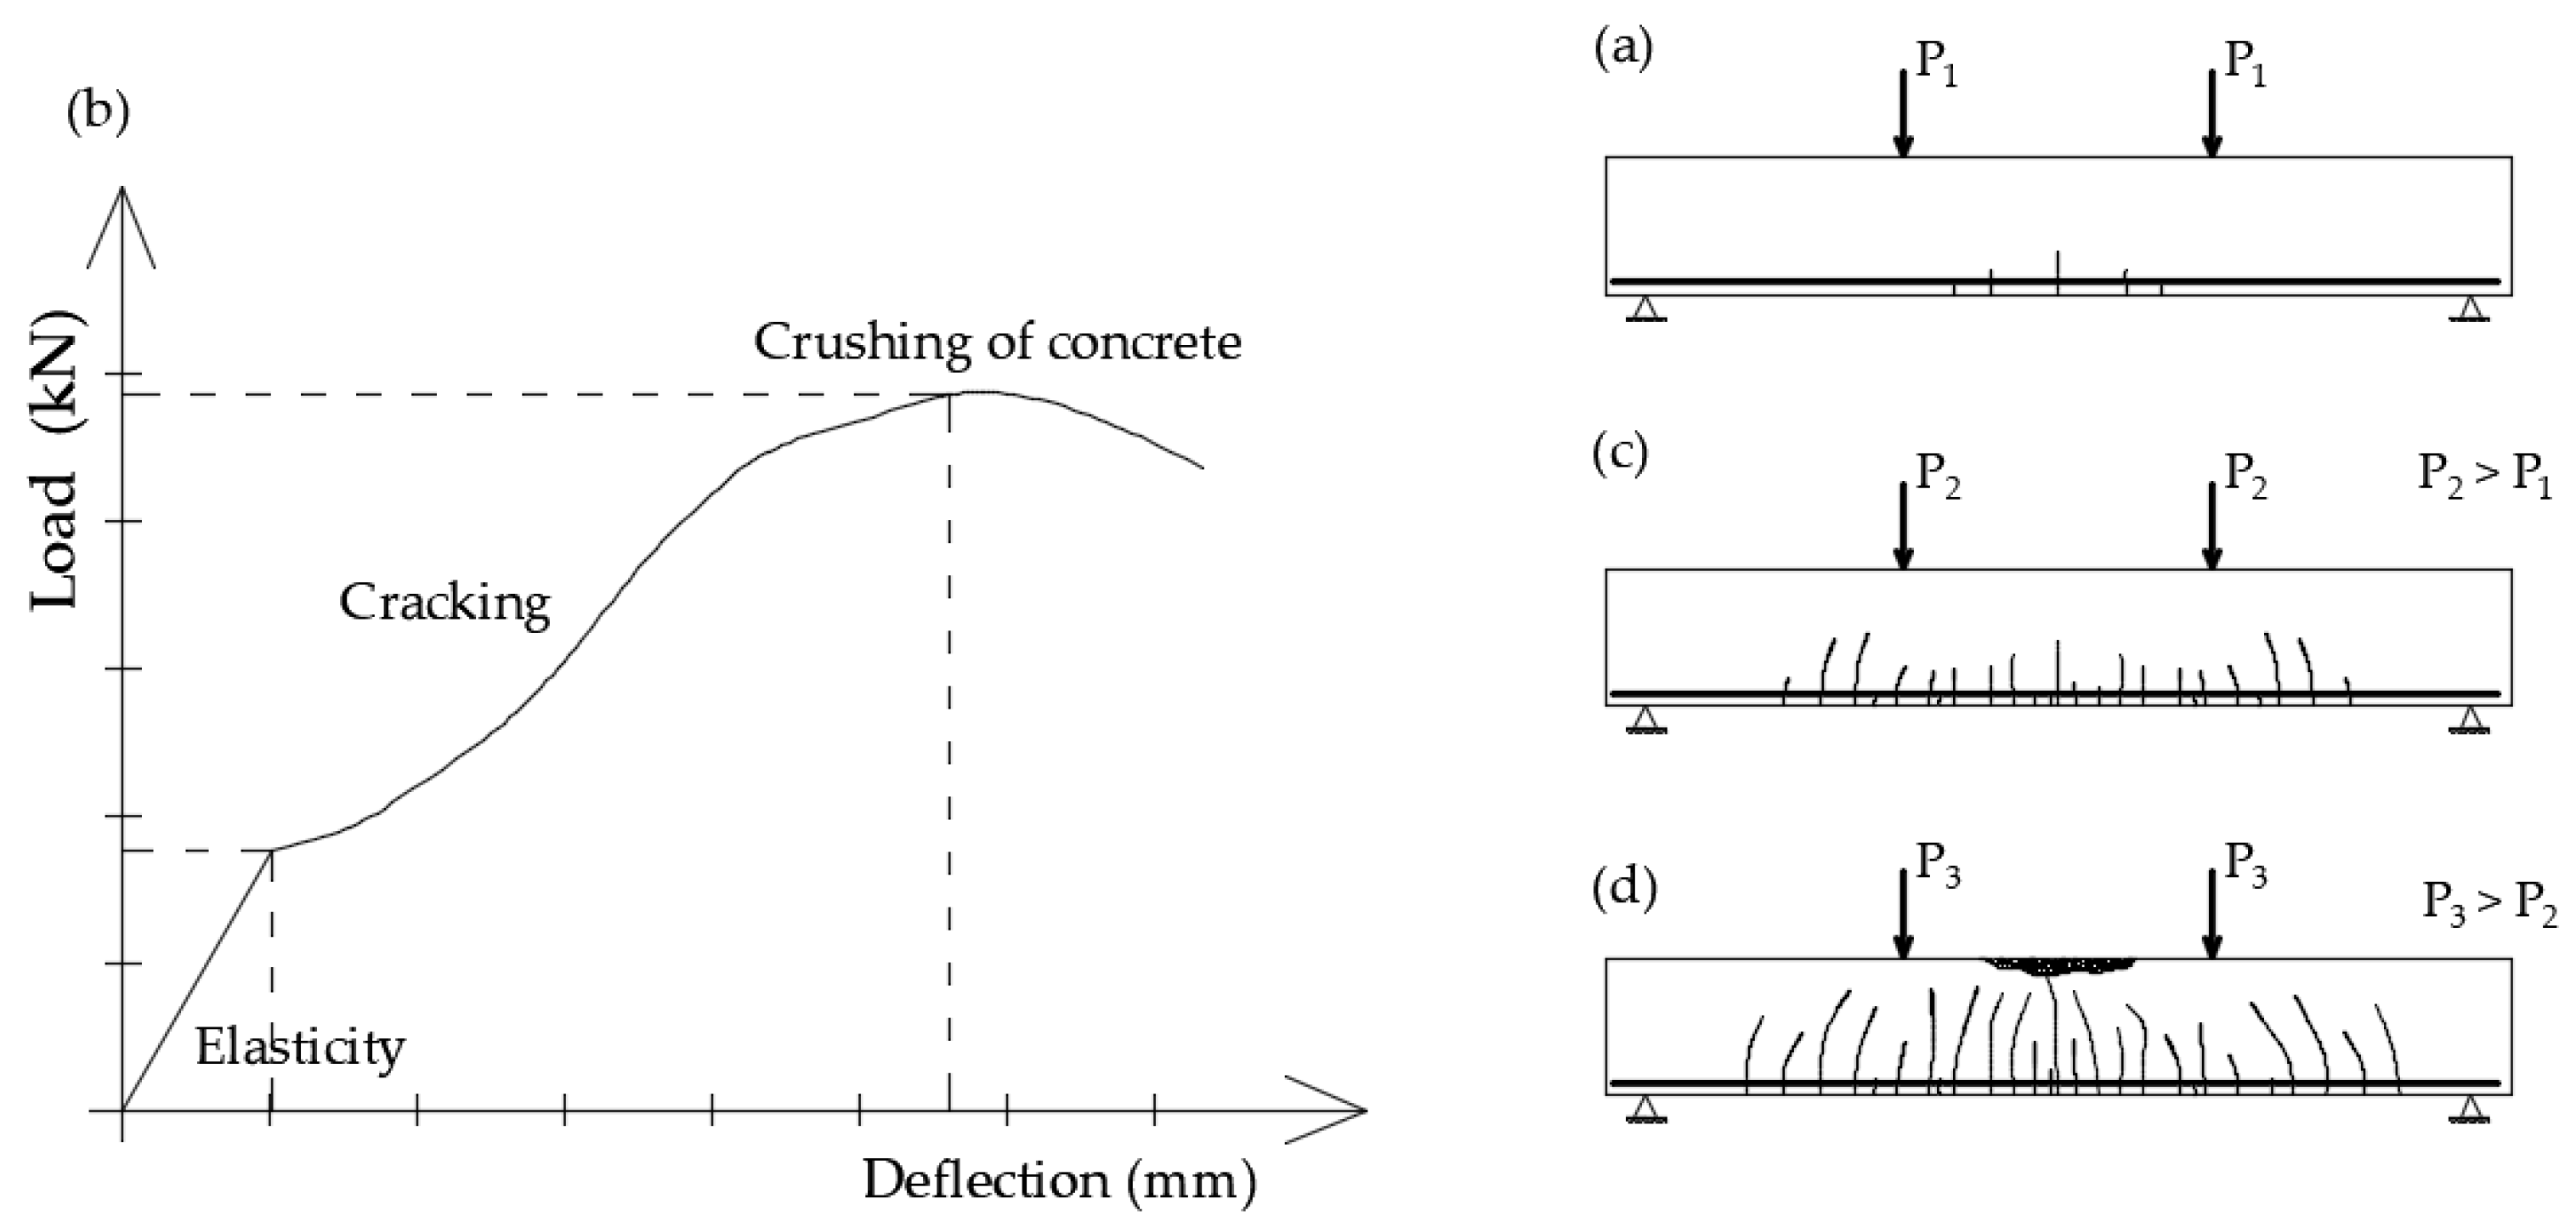
2. Mechanisms of Cracks

Concrete is a fundamental building material classified as a brittle substance. To enhance its homogeneity, short steel fibers are incorporated, resulting in the formation of fiber-reinforced concrete. One of the primary advantages of fiber-reinforced concrete is its capacity to transfer tensile stresses across cracks. The inclusion of dispersed reinforcement in the matrix transforms the originally brittle material into a more ductile one [13,58,59,60]. Figure 1 illustrates the force-deformation relationship of axially stretched samples made from both ordinary concrete and fiber-reinforced concrete. The results indicate that the addition of fibers prevents the sudden failure typical of conventional concrete elements. This improved performance is attributed to the ability of the fibers to distribute stresses at points of discontinuity within the concrete [12,17,31]. Figure 2 depicts the distribution of tensile stresses across cracks for both ordinary and fiber-reinforced concrete.
The fiber interlinking, akin to aggregate interlinking, is influenced by a variety of factors. In evaluations aimed at assessing the effectiveness of fibers, a single fiber positioned perpendicular to a crack is analyzed. This fiber is assumed to play a role in energy dissipation through several mechanisms, which include: the rupture of the matrix and its debonding, the detachment of the fiber-matrix interface, friction between the fiber and matrix post-bonding (fiber pullout), the breakage of the fiber itself, as well as abrasive wear and plastic deformation or yielding of the fiber (see Figure 3). The mechanical performance of fiber-reinforced composites (FRC) is certainly affected by the quantity of fibers, their orientation, and significantly by their behavior during pullout in relation to the applied load (or load–displacement characteristics). Specifically, fiber pullout is contingent on the type and mechanical/geometric properties of the fibers, the mechanical characteristics of the fiber-matrix interface, the angle of the fiber relative to the load direction, and the mechanical properties of the matrix itself [12,13,15,16,31,45,60,63,64,65,66,67].
When analyzing the behavior of a reinforced concrete element, two fundamental situations can be identified: one in which the element is uncracked and another in which it is cracked. The transition from the first situation to the second depends on the tensile strength of the concrete, which is evidenced by the appearance of the first crack. This initial crack typically forms in the area where the bending moment is at its maximum and the shear force is relatively low. The cracks generally develop in a direction that is more or less perpendicular to the bending stress. Consequently, the element is classified as being in phase I (uncracked). As illustrated in the load-deflection diagram, there comes a point where the behavior transitions from linear to nonlinear (see Figure 4b), indicating a move to phase II (cracking).
The cracking mechanism of reinforced concrete elements involves the appearance of the first crack at the point of maximum bending moment and the lowest tensile strength of the concrete matrix. Subsequent cracks emerge adjacent to the first one, continuing in this manner until a stabilized crack pattern is achieved. This means that no new cracks develop, and only the existing ones widen and extend their range [50]. In the case of reinforced concrete elements additionally reinforced with dispersed reinforcement, the process of crack formation and development is similar to that in reinforced concrete elements, but not identical. There is a noticeable difference in the development of cracks and their widths. Cracks in reinforced concrete-fiber concrete elements are more perpendicular to the tensile reinforcement, and their spacing and widths are more regular. This indicates that this material is more homogeneous [41,45,47,53].

3. Materials and Methods

The compositions of the fine aggregate fiber concrete mixtures were established based on the guidelines outlined in [69]. These guidelines are based on experimentally determined relationships between the actual volume of water and pores in the concrete mixture and the properties of sand concrete. Subsequently, the established composition of the sand concrete mixture was modified by adding a superplasticizer and steel fibers. The water content was adjusted to obtain a mixture with a plastic consistency, in accordance with the recommendations [70]. The composition of plain (commercial) concrete was designed for a target cube strength of 45 MPa.
The final compositions of the mixtures used in the tests are presented in Table 1.
The test specimens were produced in 10 series. These varied in the type of concrete mixture (fiber-reinforced fine aggregate concrete and plain concrete), the steel fibers used (50/0.8 mm and 30/0.55 mm), the longitudinal reinforcement ratio (ρL) in beams (0.6%, 0.9%, 1.3%, and 1.8%), and the application (or absence) of compressive reinforcement, as well as stirrups oriented vertically to the element axis spaced every 130 mm (see Table 2). Each series of test specimens contained 2 beams, 6 cylinders, and 12 cubic samples intended for the determination of strength properties. They were demolded 24 h after the concrete was poured. The thermal and humidity conditions during the preparation and curing of the test specimens were uniform. The tests were conducted 28 days after molding.
The test for the limit state of cracking caused by a temporary load was conducted on beams with dimensions of 15 × 20 × 330 cm. The beams were subjected to two concentrated forces applied at one-third of the span through a steel traverse. The load scheme of the tested beams is illustrated in Figure 5.
The longitudinal reinforcement of the beams was made of ribbed steel (34GS grade) with diameters of 8, 10, 12, and 14 mm, while the transverse reinforcement was made of smooth steel (St3SX-b grade) with a diameter of 4.5 mm. Small-sized elements, such as cubes and cylinders, were used to determine the basic strength properties of the concrete.

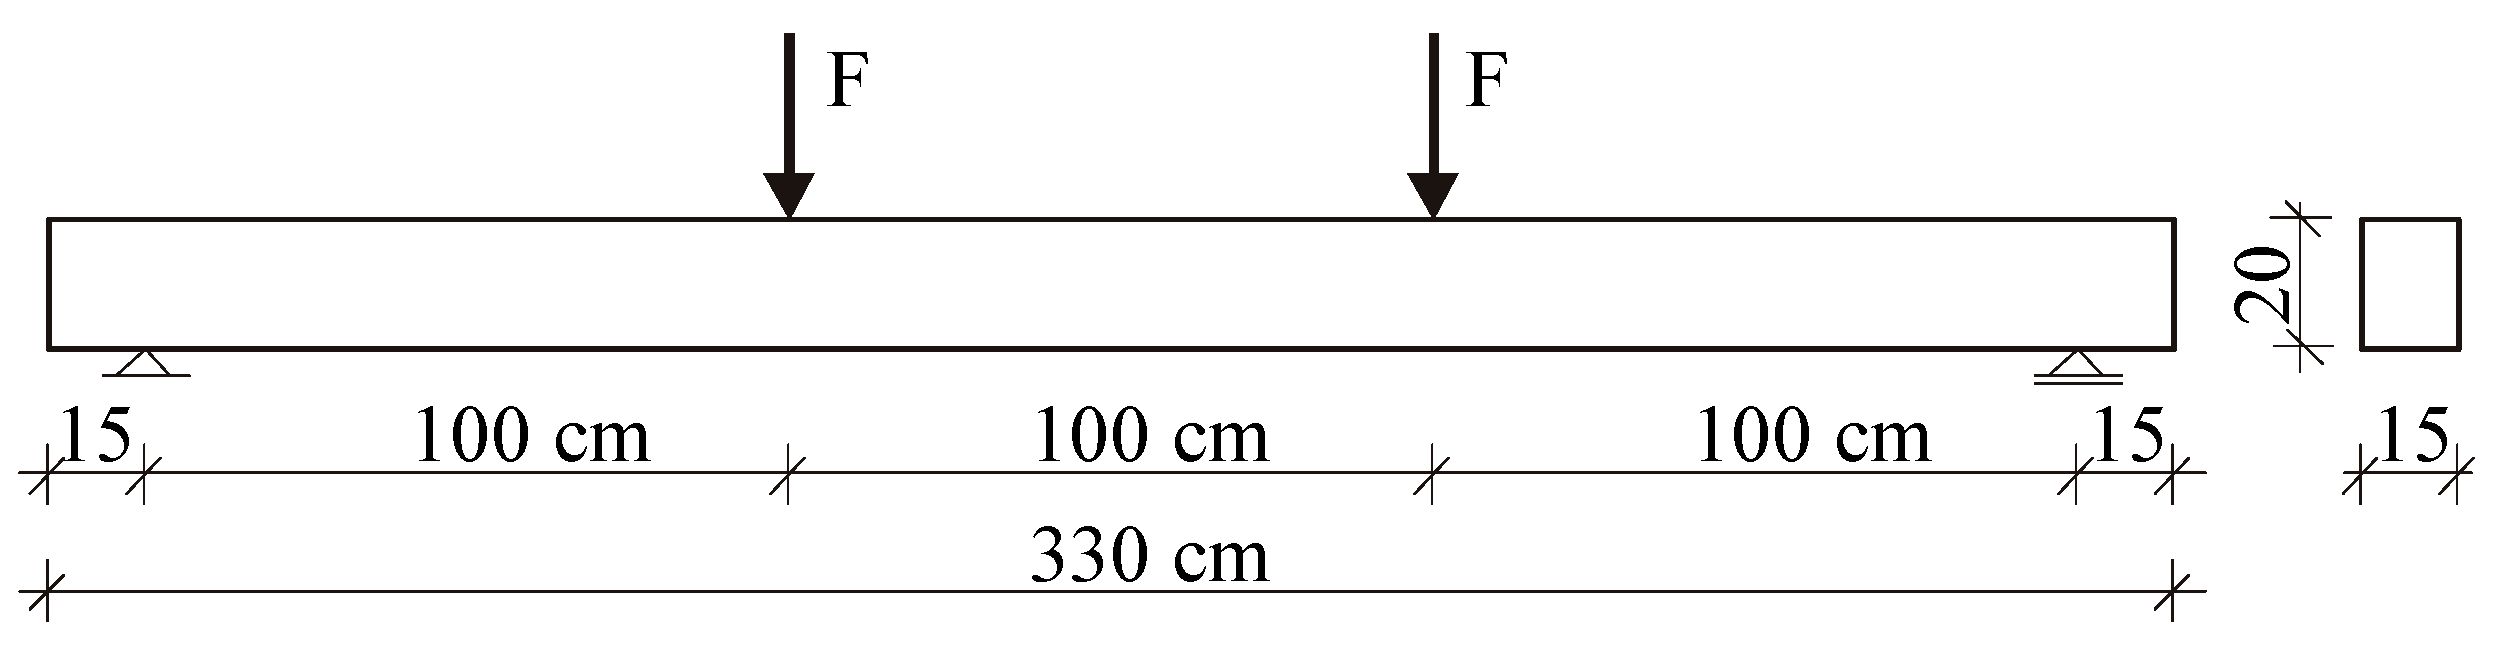
4. Methodology of Research

Compressive strength was determined using cylindrical samples (fc) and cube samples (fc,cube) according to EN 12390-3 [72]. Tensile splitting strength (fct,sp) was determined using type B cube samples according to EN 12390-6 [73]. The modulus of elasticity in compression (Ec) was determined following the requirements of EN 12390-13 [74]. Samples (selected series A and B) on the test stands are shown in Figure 6.
The test stand for beam elements consisted of a steel frame structure, a hydraulic actuator (slidably mounted to the upper part of the frame) and a load control system (Figure 7).
The forces were applied using a steel traverse loaded with a hydraulic actuator that had a capacity of 246 kN. Two supports were placed on the lower beam of the frame: a hinged-sliding support and a hinged-non-sliding support. They were designed to allow for the measurement of the reaction using tensometric force gauges with a range of 100 kN. The applied load was controlled by reading the beam’s support reactions using the SAD 256 computer data acquisition system. This system was also used to measure the deformations of the beam’s tension reinforcement. The measurements were recorded using electro-resistance strain gauges glued to the tensioned bars before the concrete was poured. TFs-5/120 foil strain gauges were used, which have a resistance of 120.3 Ω ± 0.2% and a deformation sensitivity coefficient (k) equal to 2.15 ± 0.5%. The cracking moment of the cross-section was determined by observing the side surfaces of the beams using a magnifying glass with five times magnification, as well as based on the strain diagram of the tensile reinforcement as a function of the load obtained from the SAD 256 system [51].
The spacing of cracks was determined based on linear measurements taken at the level of the centroid of the tensile reinforcement. The measurements of crack width were carried out at the level of the tensile reinforcement using a microscope with a basic scale of 0.02 mm, characterized by a 36× magnification (Microscope WF10x, PZO Polish Opticial Factory, Warsaw, Poland). With this device, cracks with a width of up to 4 mm can be measured. Measurements of crack width and extension were carried out during several loading phases. The number of phases was selected based on the calculated load capacity of the beams and depended on the degree of longitudinal reinforcement. Table 3 presents the loading phases for each beam.

5. Test Results and Their Analysis

The t-Student distribution [75] and Dixon’s test were used to analyze the test results. Dixon’s test was employed to detect the presence of any gross errors in the data set. For each sample, it was checked whether the extreme values belonged to the population of results under consideration. Assuming a normal distribution for each tested property, the mean value, standard deviation, and coefficient of variation were determined using the t-Student test [75]. The t-test is the most commonly used method for assessing differences between the means of two groups. When samples from a given series were collected at different times due to technological constraints, the t-test was applied to determine whether the results could be combined into a single population. The t-test can also be used in the case of very small samples to determine statistical parameters, provided that the distribution of variables is assumed to be normal.
A significance level of α = 0.05 and a tolerance of υ = 10% were assumed in the analyses. It was found that all the analyzed samples had a sufficient number of results to be considered representative. The results of the strength feature tests are presented in Table 4.
The mechanical properties of the ribbed steel used for the longitudinal reinforcement of the beams were also tested. The yield strength, tensile strength, and modulus of elasticity of the reinforcing bars were determined. The results are presented in Table 5. The tests indicated that the ribbed steel used in this study exhibited a distinct yield point.
The primary parameter in reinforced concrete theory that describes the transition of a bent element from the first to the second phase of loading is the cracking moment. The results of tests and analyses concerning the cracking moment are presented in [50,51]. Figure 8 provides a graphical comparison of the experimentally determined cracking moments (Mexp) with those calculated (Mcr) in according with [52,54,76,77].
The studies published in [50,51] demonstrated that, for fiber-sand concrete beams with varying longitudinal reinforcement ratios (ρL) of 0.6%, 0.9%, and 1.3%, only slight differences in cracking moments were observed. This suggests that the magnitude of the cracking load is primarily determined by the tensile strength of the fiber-reinforced fine aggregate concrete matrix.
In a properly designed and manufactured fiber-reinforced concrete element, the beneficial effects of steel fibers become apparent after the first crack appears. The use of appropriately effective reinforcement with steel fibers leads to the dispersion of cracks, whereby wide and sparse cracks are replaced with so-called micro-cracks [78]. This also results in a reduction in the distance between cracks [41]. Figure 9 illustrates the average crack spacing (srmExp) in the section of the constant bending moment (Med) (the area between the forces is shown in Figure 1) across the different load phases.
Figure 9 shows that the average crack spacing (srmExp) in the section of constant bending moment (Med) decreases with increasing load. The crack stabilization moment was not the same for all beams. Its calculated values, consistent with [79] (80% of the ultimate moment), were underestimated because, practically until the moment of beam destruction, single cracks were formed. However, these did not significantly affect the average spacing, even with a large number of perpendicular cracks. Examples of crack spacing for beams from selected series are shown in Figure 10, Figure 11, Figure 12, Figure 13 and Figure 14.
In the tested beams containing steel fibers, the observed crack patterns on the section of the constant bending moment do not differ substantially from one another, except for the beams with the highest reinforcement ratio (ρL) of 1.8%. Aside from this case, the longitudinal reinforcement ratio (ρL), which ranges from 0.6% to 1.3%, slightly affected the average crack spacing and their range during the individual loading phases. This is most likely because the tensile strength of the fiber-reinforced fine aggregate concrete matrix determines the crack morphology [33]. No significant influence of the reinforcement in the compression zone or the stirrups used on the number, spacing, and extent of cracks during the individual loading phases was observed (as analyzed in beams from series A and D). Comparing beams made of ordinary concrete (series F) with identically dimensioned elements (in terms of dimensions and reinforcement) made of fiber-reinforced fine aggregate concrete (series B—fibers 50/0.8 mm and series J—fibers 30/0.55 mm), it can be seen that at the same load level, the number of cracks is almost the same; however, their spacing and course are more regular in beams with the addition of fibers. This is likely due to the fact that fiber-reinforced concrete is a more homogeneous material than ordinary concrete [78]. The spacing of perpendicular cracks measured during the tests in the individual loading stages for selected beams with different fibers is presented in Table 6 and Table 7.
According to [80], the limit state of crack spacing corresponds to the load at which the number of cracks stabilizes. This condition is equivalent to establishing a specific distance between cracks. Further increases in load only result in an increase in the width of the cracks. A comparison of the results from the crack spacing (srmExp) tests in the stabilized phase with the calculated results from various authors for beams with steel fibers is presented in Table 8 and Figure 15. The data from the tests conducted by L. Vandewalle and D. Dupont [81], I. Kovács and G. L. Balázs [82], as well as our own, are included in this comparison. These results are contrasted with the crack spacing calculated according to EC2 [52], the method proposed by L. Vandewalle [41], his detailing [53], and the guidelines set forth in the current EC2 standard [54].
The graph in Figure 15 demonstrates that the method for calculating crack spacing included in EC2 [52] yields values that are, on average, 39% higher than the measured values. The method proposed by L. Vandewalle [41] results in a slight overestimation, averaging 20% higher than the measured values. The proposal outlined in [53] is closer to the measured crack spacings, differing by an average of 19%. In contrast, the method included in EC2 [54] provides values that are, on average, 100% higher than the measured ones. However, it is important to note that the crack spacing determined according to [54] represents the maximum spacing, rather than the average spacing, as is the case with the other methods [41,52,53].
The process of crack formation in elements with dispersed reinforcement involves changes in microstructure. Initially, so-called microcracks are formed, which later connect, resulting in the development of larger cracks. The function of the fibers is to reduce stress concentration in the concrete and to transfer the load across the cracks. According to [80], the phenomenon of microcracking should not be considered as cracking in any case. Therefore, in this article, the minimum crack width is defined as 0.01 mm. The observed phenomenon of cracking was noted along the entire length of the beam (Figure 10, Figure 11, Figure 12, Figure 13 and Figure 14). However, the analysis focused on the section between the applied forces (of pure bending), where only cracks perpendicular to the longitudinal axis of the element formed. Figure 16 illustrates the ratios of the maximum crack width at a given phase to the maximum width (wkExp) observed in the last tenth load phase (X) within the section of constant bending moment.
The increase in the maximum crack width due to changes in loading is different for beams with extreme tensile reinforcement ratios. (ρL). The higher the reinforcement ratio, the more nonlinear the relationship presented in Figure 16 becomes. This is because, as the tensile reinforcement ratio (ρL) increases, the number of cracks also increases, and consequently, their maximum crack width decreases. This phenomenon can be disrupted by the simultaneously increasing diameter of the tensile reinforcement, which leads to a reduction in the number of cracks [83].
Another significant parameter in the analysis of cracking is the ratio of the maximum crack width to the average value. This relationship was defined by J. Ferry Borges [79] for ordinary concrete beams with a probability of 95% and a coefficient of variation of 0.4. In the studied beams, the variability index of crack widths measured for all load phases ranged from 0.3 to 0.5 (except for beam F-1, for which a value of 0.6 was obtained). Figure 17 shows the ratios of the maximum crack widths to the average widths for the different load phases of fiber-reinforced sand concrete beams, and the value of the coefficient β adopted in [79] for ordinary concrete is indicated.
The relationship between the average (wk) and maximum crack widths (wkmax) along the section of constant bending moment was examined. A correlation coefficient of 0.95 was obtained, indicating a strong linear correlation. Subsequently, using the least squares method, a relationship between the average and maximum crack opening widths was determined, resulting in a linear equation with a slope coefficient of 1.55 and a y-intercept of 0.005. This form suggests that, at zero average crack spacing, there is a maximum crack equal to 0.005 mm. Therefore, it was checked whether this value is statistically significantly different from zero. For this purpose, an appropriate significance test based on Student’s t-statistic [75] was used. It showed that the slope coefficient of the line is not significantly different from zero at a 10% significance level. Thus, the value of the coefficient β can be practically accepted as equal to 1.55, bearing in mind that it pertains to fiber-reinforced sand concrete beams under loads ranging from the cracking moment to approximately 0.8 of the destructive moment.
The analyzed coefficient was verified by comparing it with the research results contained in Project No. BE 97-4163 (Brite Euram BRPR-CT98-0813-2002) [84]. It examined fiber-reinforced concrete beams with ρL = 0.25; 0.5; 1.0%, using RC 65/60 BN fibers at amounts of 25 and 50 kg/m3 and RC 80/60 BP fibers at 60 kg/m3. The considerations were limited to a maximum crack opening width of 0.3 mm, as this is the limit value provided in EC2 [52]. To determine whether the proposed value of the coefficient β is valid for the derived research results, a significance test based on Student’s t-statistic [75] was used. It showed that at a 10% significance level, it can be accepted that the proposed value β = 1.55 is also appropriate for fiber-reinforced concrete beams. Figure 18 presents a comparison of the average and maximum crack opening widths obtained from the research according to Project [84] and from own studies. The graph marks the value of the coefficient β according to [52] and, as well as according to the author’s proposal, for beams with steel fibers.
Most of the proposals for calculating the average crack width of perpendicular cracks, at the level of the tensile reinforcement axis, are based on the condition of equality of elongations of steel and concrete over the average segment between cracks. In the phase of stabilized cracking, in sections located halfway between cracks, no mutual displacement of steel relative to concrete is observed. The difference in elongations of both materials over a segment equal to half the distance between cracks is equal in magnitude to half the average crack width. Neglecting the small elongation of concrete relative to the elongation of reinforcement and assuming the average elongation of steel over the analyzed segment (between cracks), the values of crack widths can be calculated, among other methods, as the product of the average distance between cracks and the average strain of the tensile reinforcement, or as the product of the maximum spacing and the difference in strains in steel and concrete. Another important factor affecting the crack width is therefore the value of the average stresses in the reinforcing steel. The calculated method for determining it according to EC 2 [52,54] assumes a triangular stress diagram in the compressed zone. Figure 19 presents a comparison of the average stresses in the tensile reinforcement determined based on strain measurements with stresses calculated for successive loading levels (from the cracking moment to approximately 0.8 of the ultimate moment).
It was found that the stresses in the tensile reinforcement determined based on the tests were only slightly dependent on the reinforcement of the compressed zone of the cross-section and on the type of steel fibers used (comparison of beams A, D, and K). In the next analysis, it was checked whether the relationship between the examined stresses is linear. The correlation coefficient was determined to be 0.95, indicating a strong linear relationship. Using the least squares method, the equation of the line was determined, and it was checked whether it statistically differs from the optimal relationship (y = x) between the analyzed stresses. For this purpose, a significance test based on Student’s t-statistic was applied. At the accepted significance level of 10%, it was shown that the hypothesis was correct, meaning that the difference between the analyzed stresses is statistically insignificant. Based on this, it can be concluded that the methods for determining the width of crack opening, taking into account the effect of fibers on the stresses σs and σsr, are not applicable here. Of course, it should be noted that this conclusion is valid with respect to the analyzed fiber-reinforced concrete beams.
In the given load conditions, not all cracks reach full development. As the load increases, a tendency to equalize their widths is observed. Cracks with a smaller width show greater increases in width than those with a larger initial width. The same methods were consistently used to analyze the crack width as for the average spacing. The section of constant moment (between forces) was considered, in which only perpendicular cracks occurred. Figure 20 shows the relations between the measured and calculated average and maximum crack widths in the section between forces.
The comparison shows that the calculated values are definitely higher than the measured ones. From a practical point of view, the most important is the analysis of the crack width for the utility moment (MEks) (it was assumed in the range of 0.56 ÷ 0.67 of the ultimate moment (Mmax)), presented in Table 9.
The smallest crack widths were obtained for beams with the highest tensile reinforcement ratio (ρL), i.e., 1.8% (beams G and H). The influence of the slenderness of the steel fibers on the change in crack width was practically negligible. The analysis of the test results for beams with a longitudinal reinforcement ratio ρL = 0.9% (series: B, F and J) shows that the smallest value of the maximum crack width was obtained for elements with fibers of 30/0.55 mm (J), while comparable values were obtained for beams made of ordinary concrete and fine aggregate concrete with fibers of 50/0.8 mm. This relationship also occurs in the remaining elements (except for beam G–1), indicating that shorter fibers lead to a reduction in the maximum crack width, despite the lower tensile strengths obtained from the mechanical property tests. The presence of compressive reinforcement did not show any influence on the maximum crack width (analysis of beams A and D). The maximum perpendicular crack widths (on the constant moment section) calculated according to EC2 [52] were larger than the values obtained from the tests by an average of 75.5%. A better agreement between the measured and calculated widths was achieved for the values determined by the formula proposed by L. Vandewille [41], which takes into account the influence of the slenderness of the steel fibers, as well as for calculations according to EC2 [54]. However, the greatest convergence of calculated crack widths with the test results was obtained using the method described in [53]. The average percentage error in this case was −38.4%, which is a satisfactory result, considering that the cracking state is characterized by highly stochastic values with a large dispersion of results.

6. Conclusions

Through the tests and analysis presented above, the following conclusions were formulated:
  • The modification of the fine aggregate concrete mixture with steel fibers and superplasticizer significantly improves the tensile and compressive strengths of the matrix. For the initially designed sand concrete of class C12/15, the compressive strengths of the fiber-reinforced sand concrete corresponding to classes C25/30 and C30/37 were achieved, specifically for sand concrete with fibers measuring 30/0.55 mm and 50/0.8 mm, respectively.
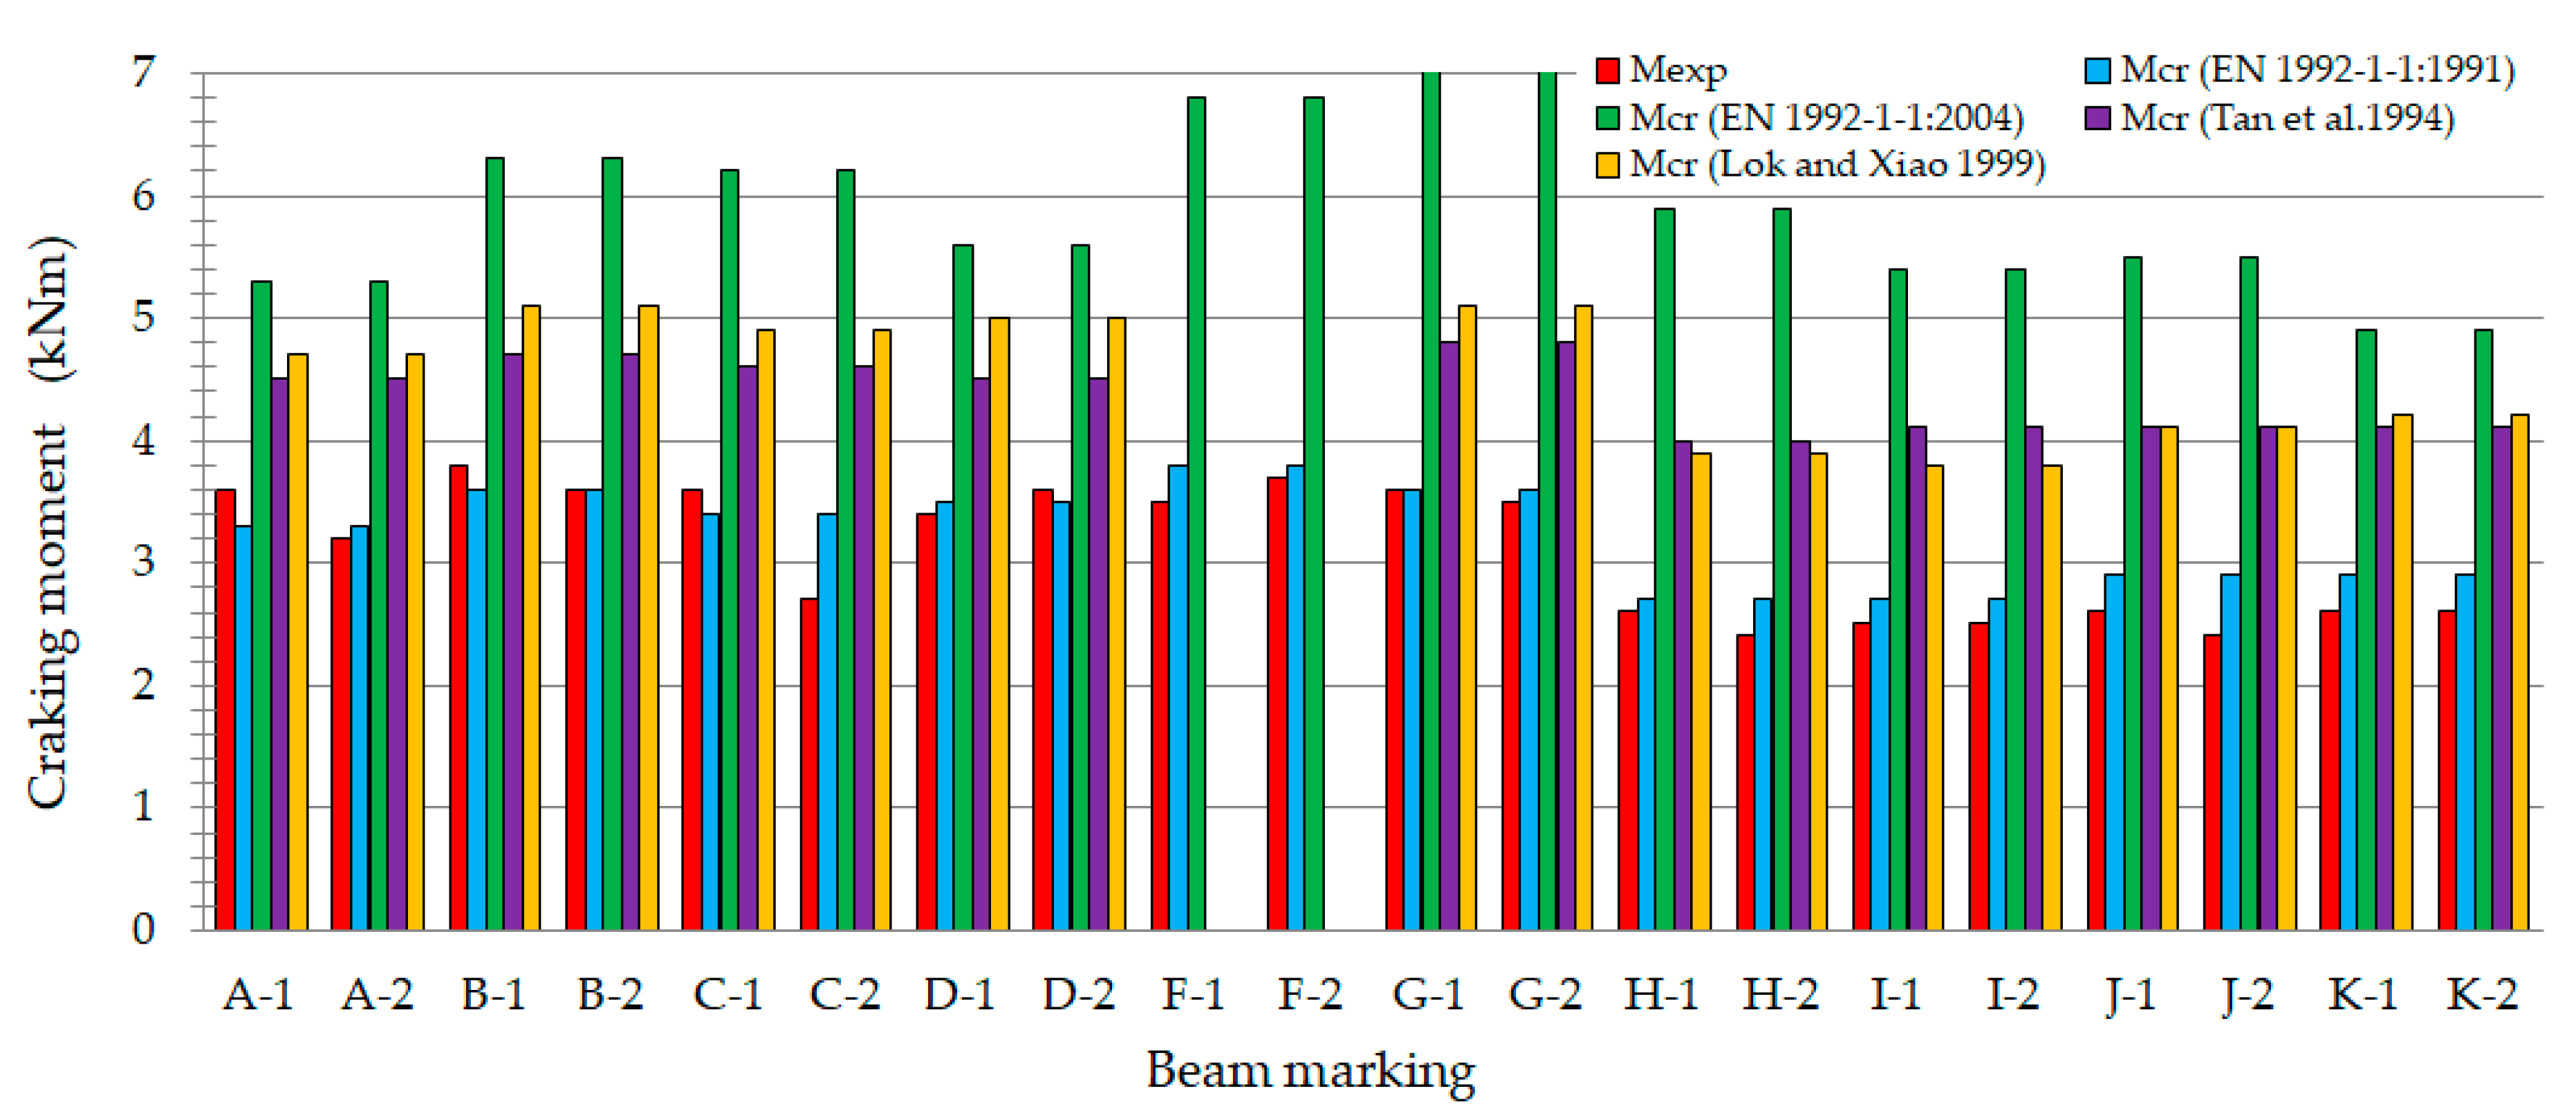
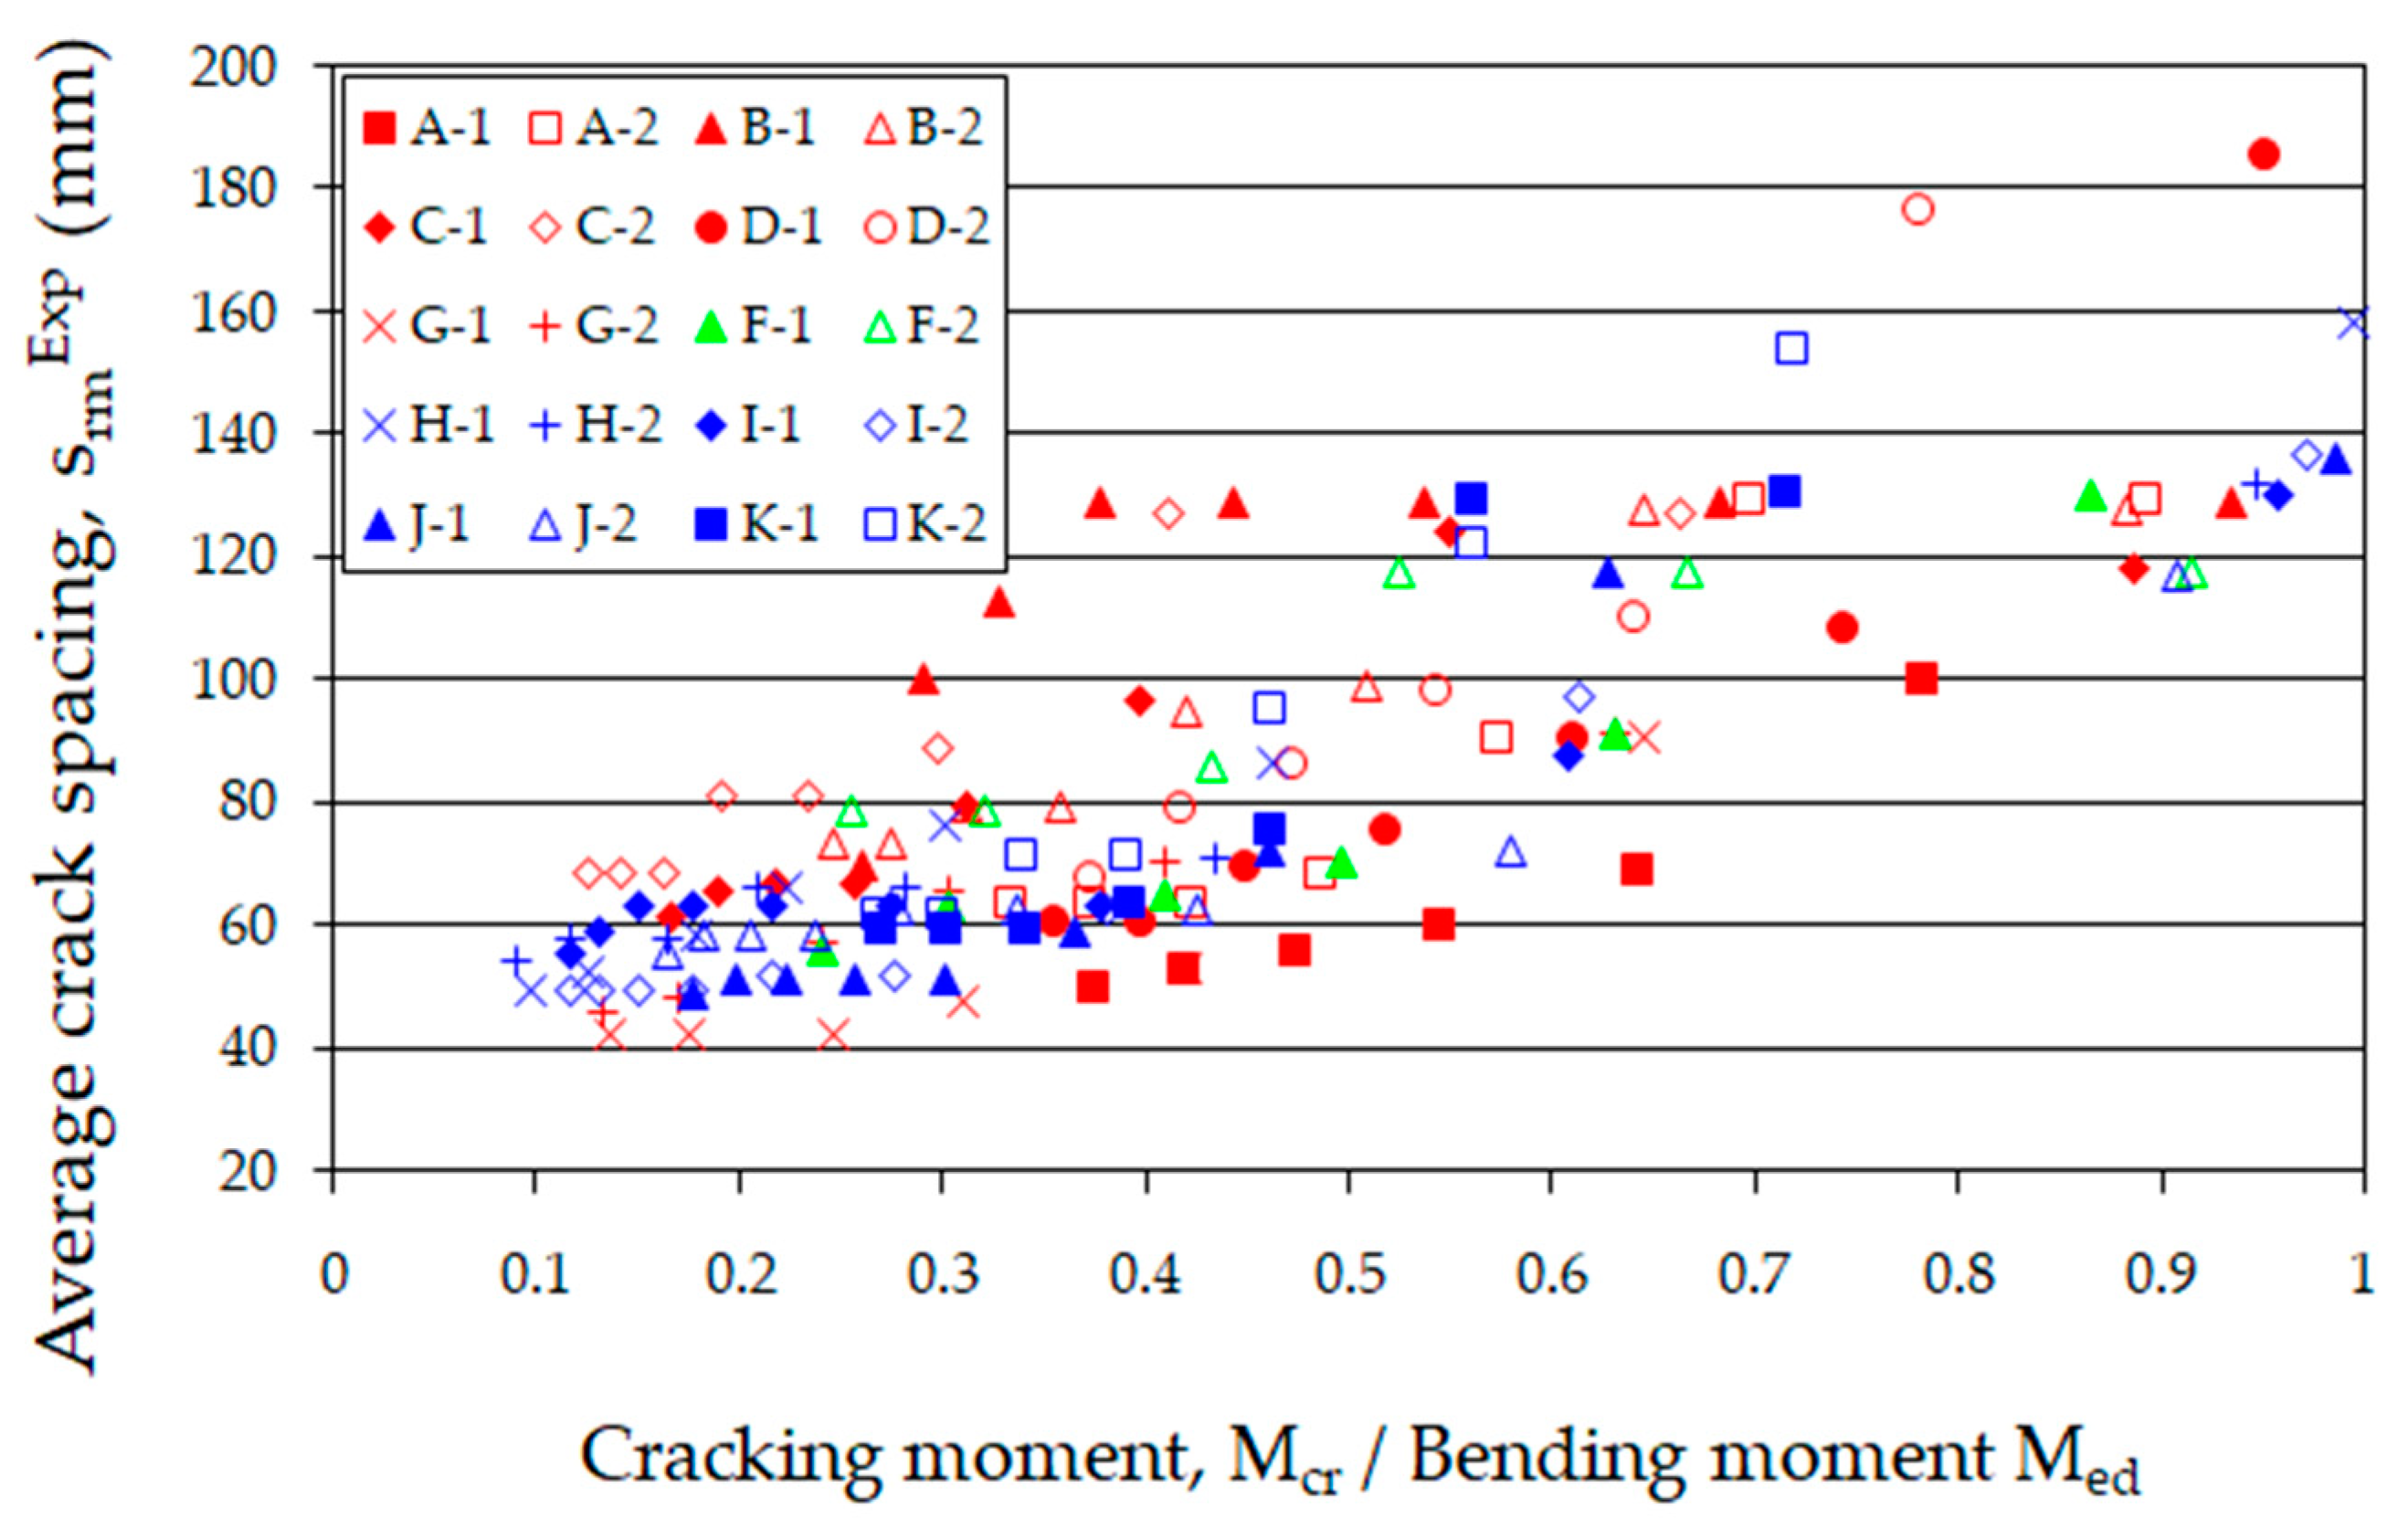
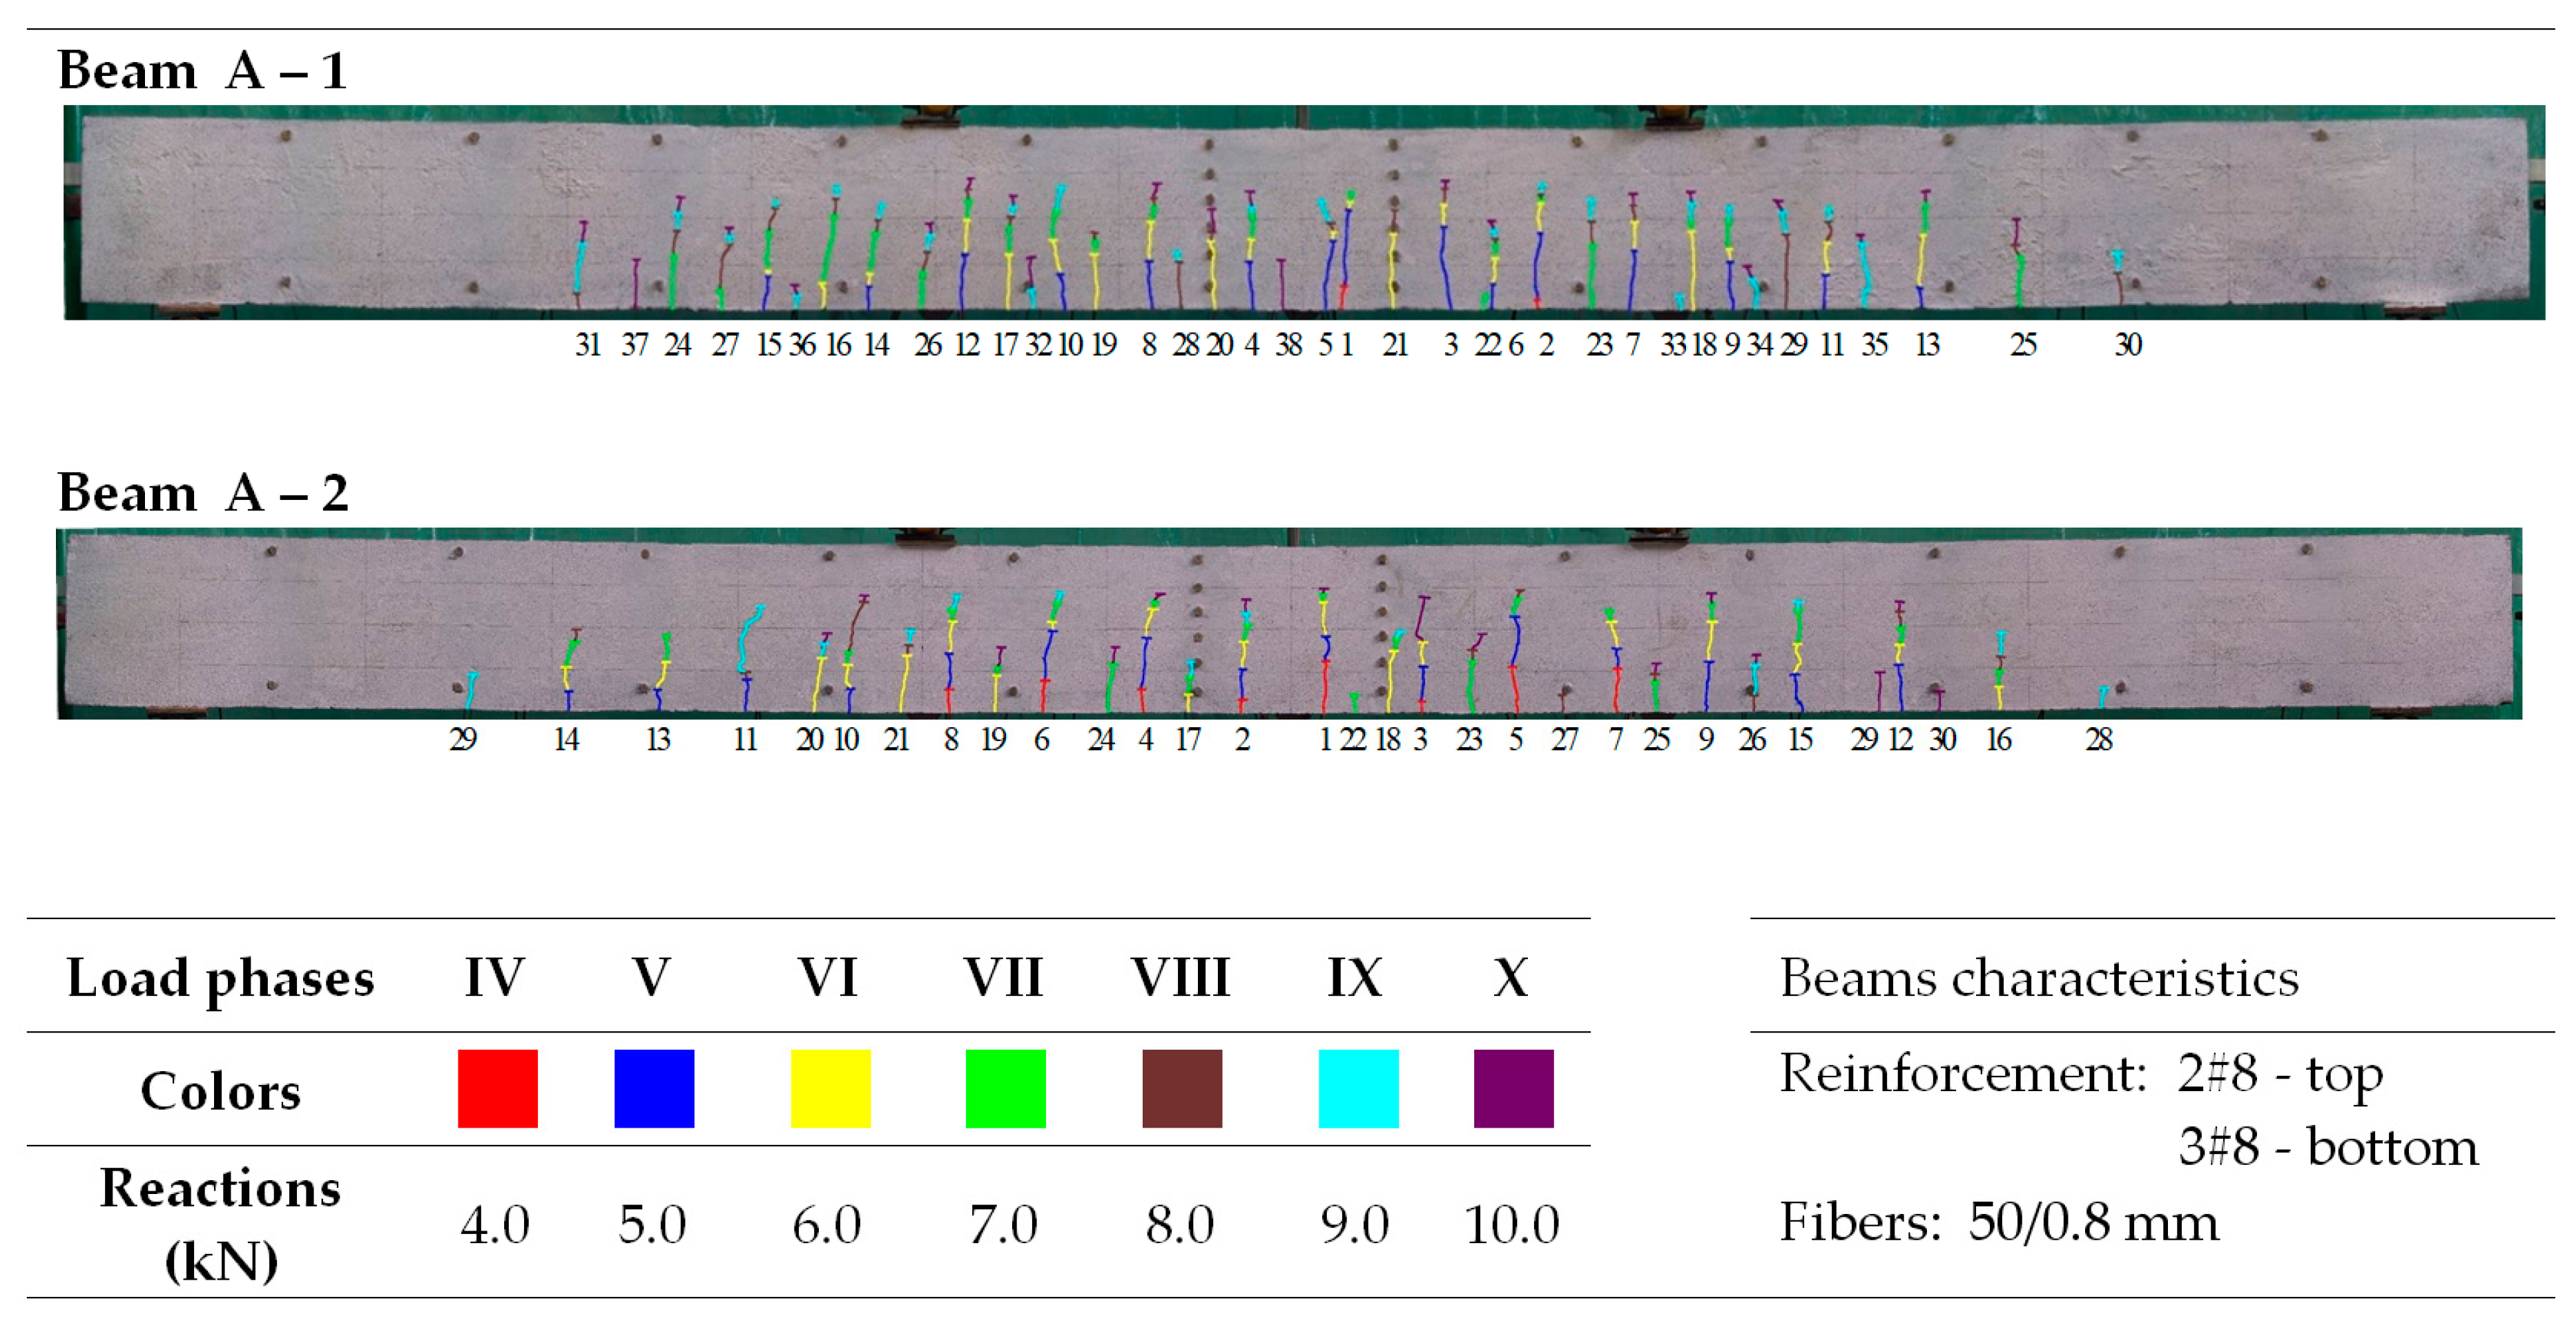
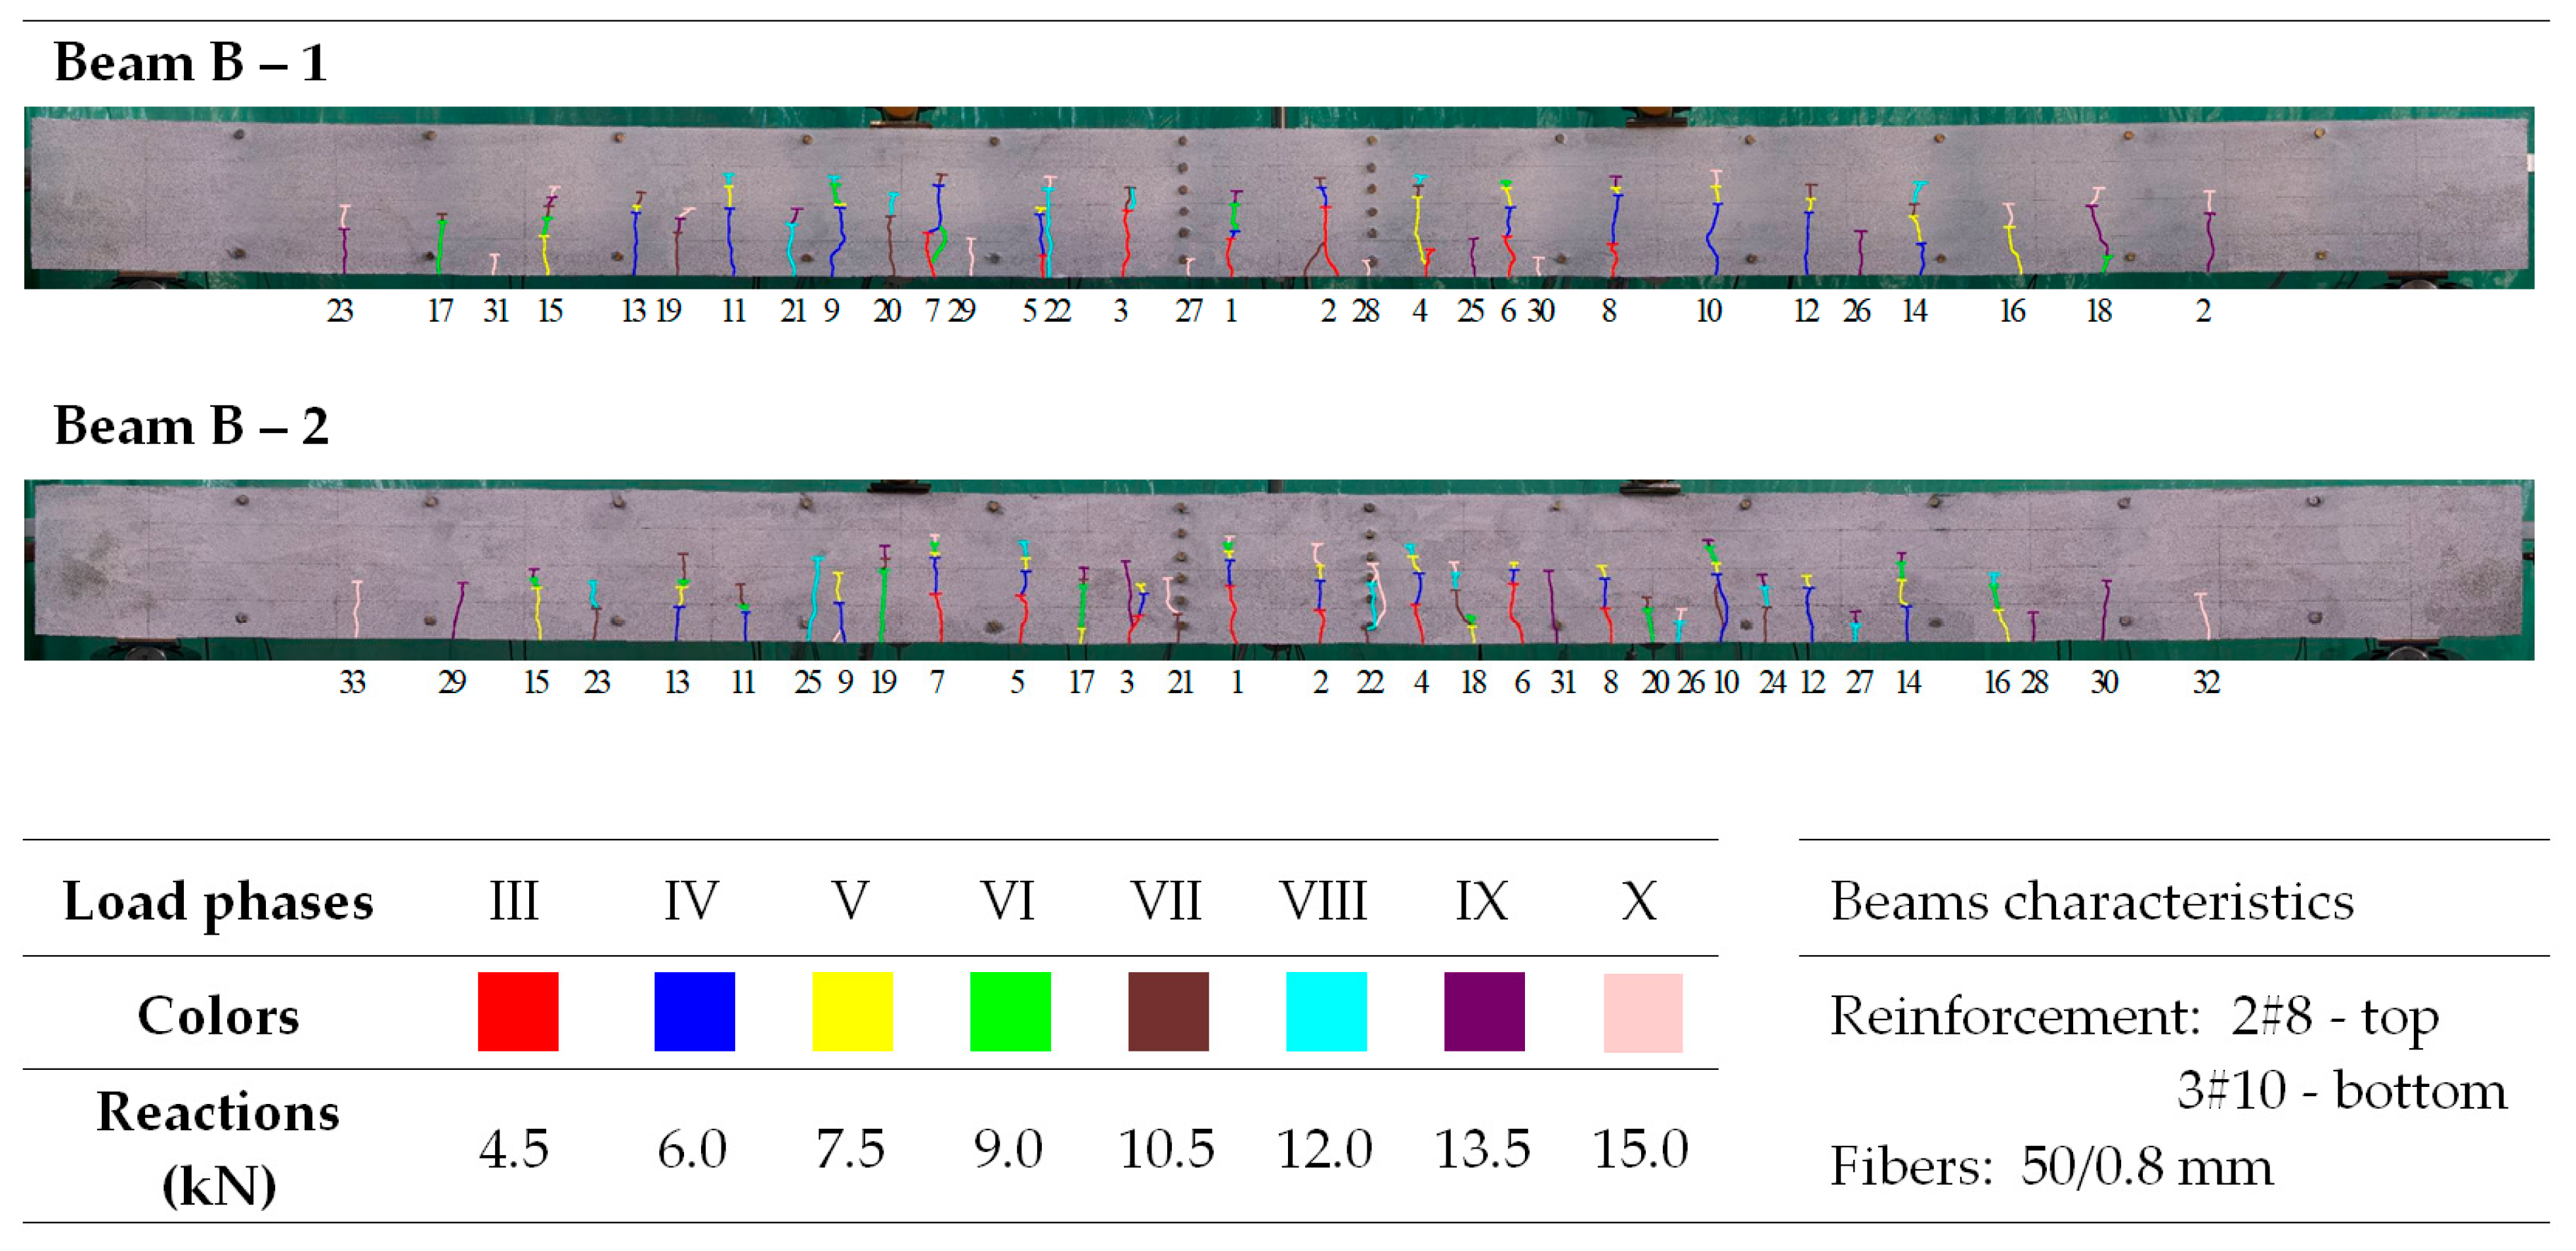
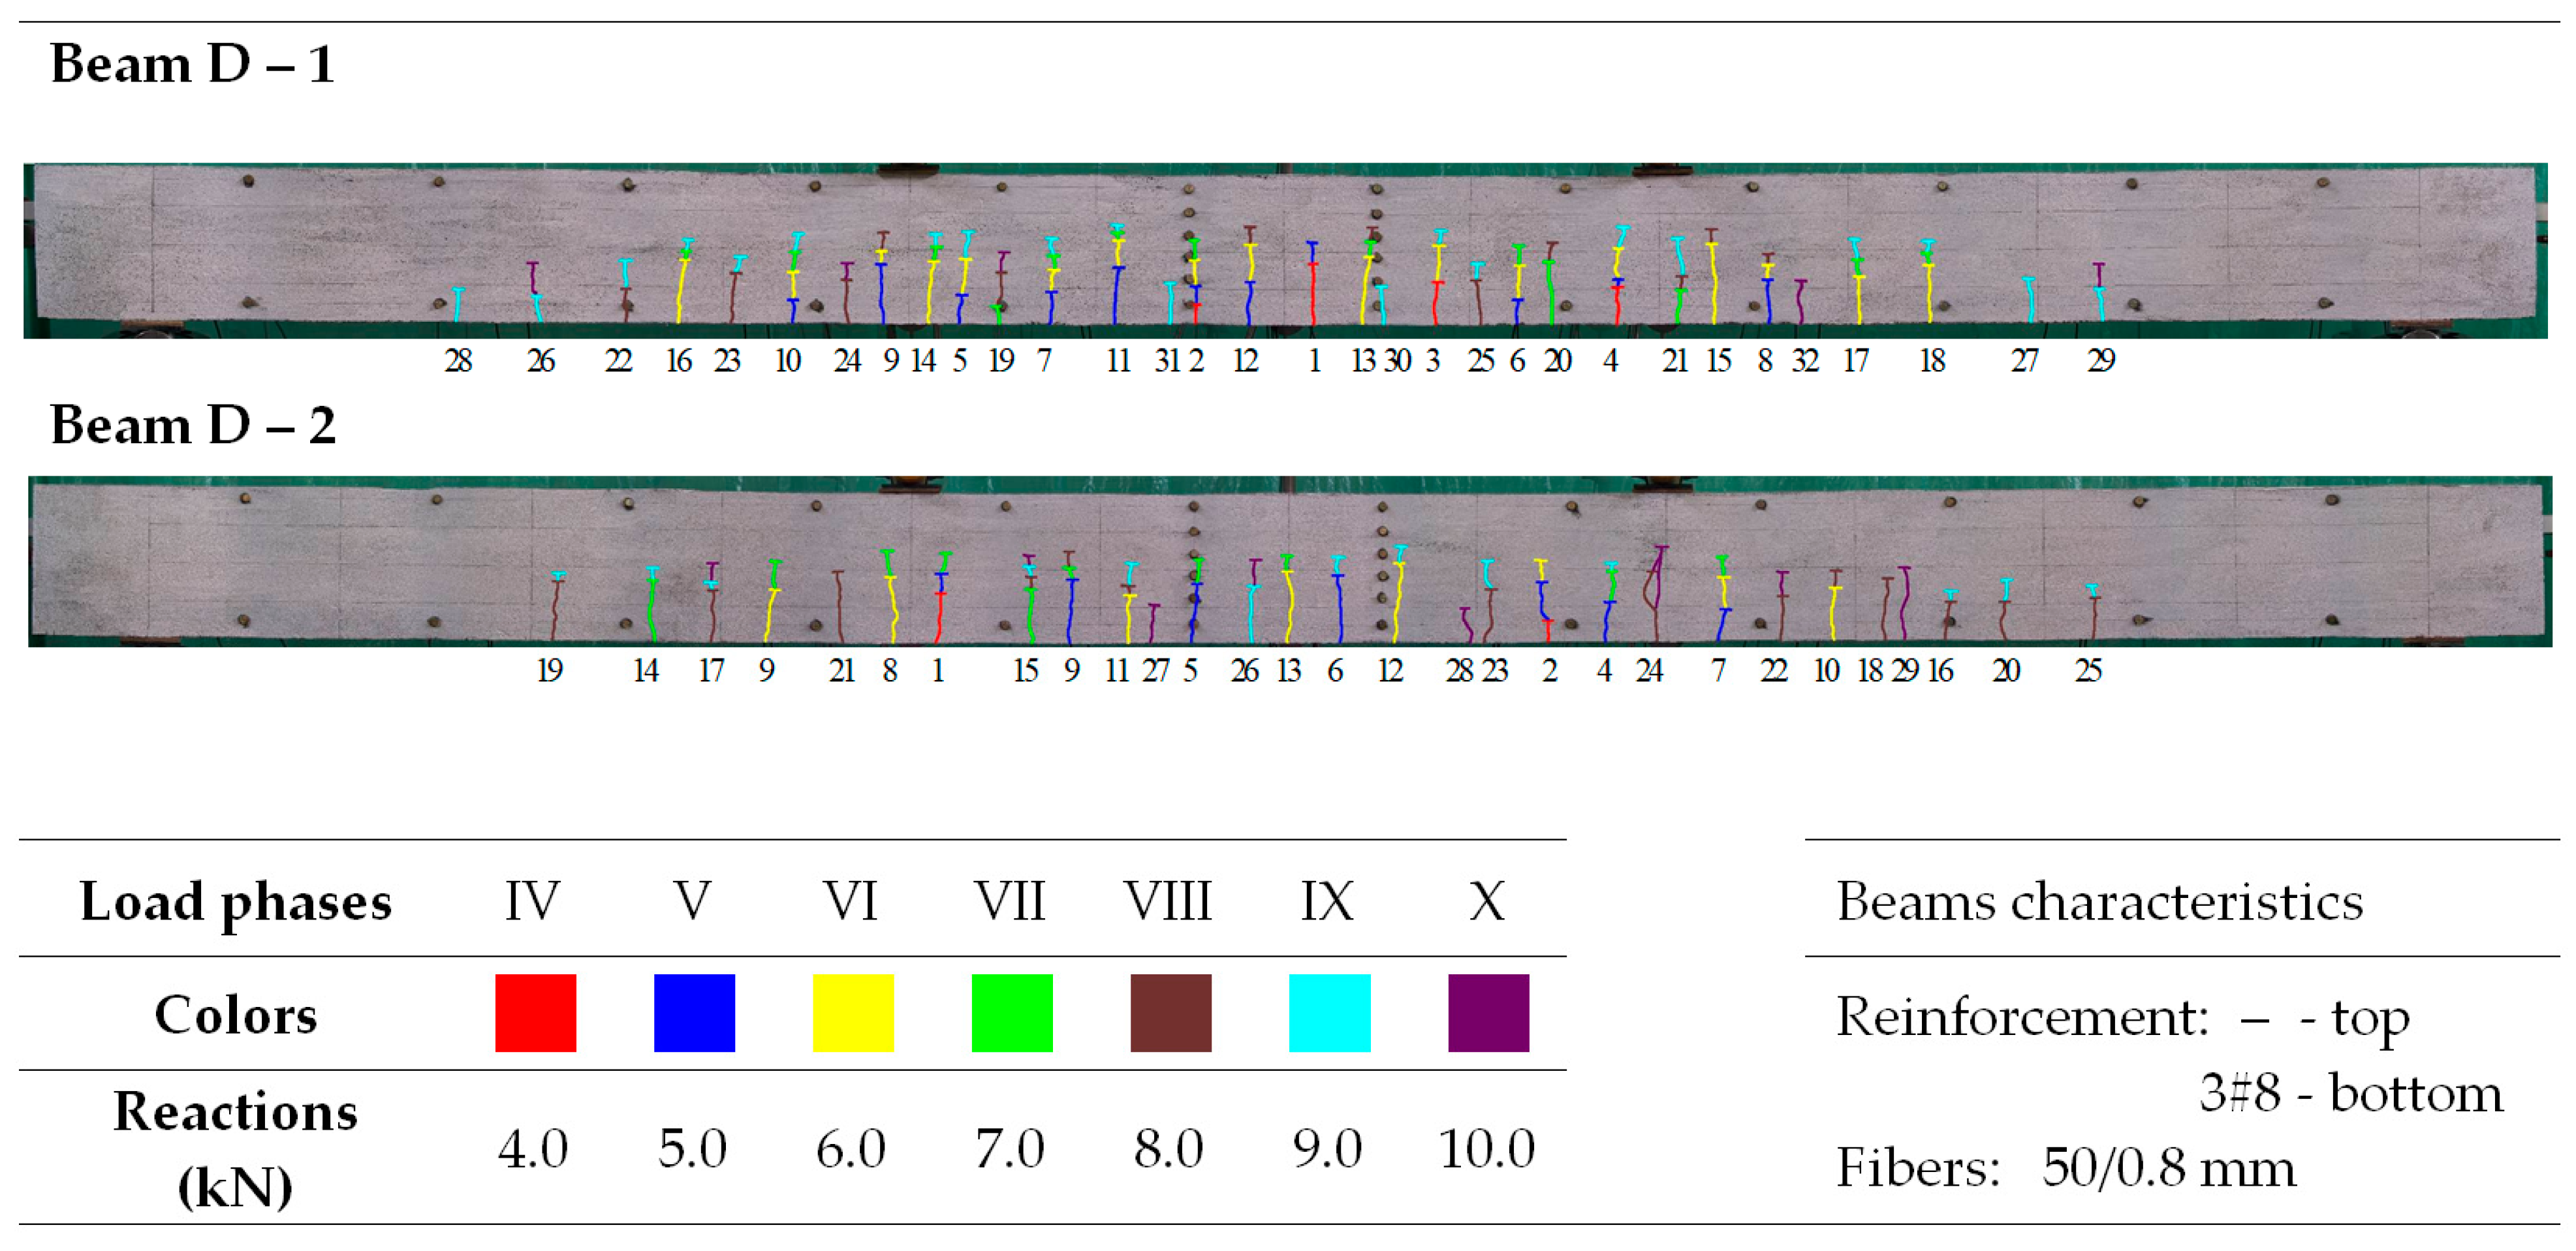
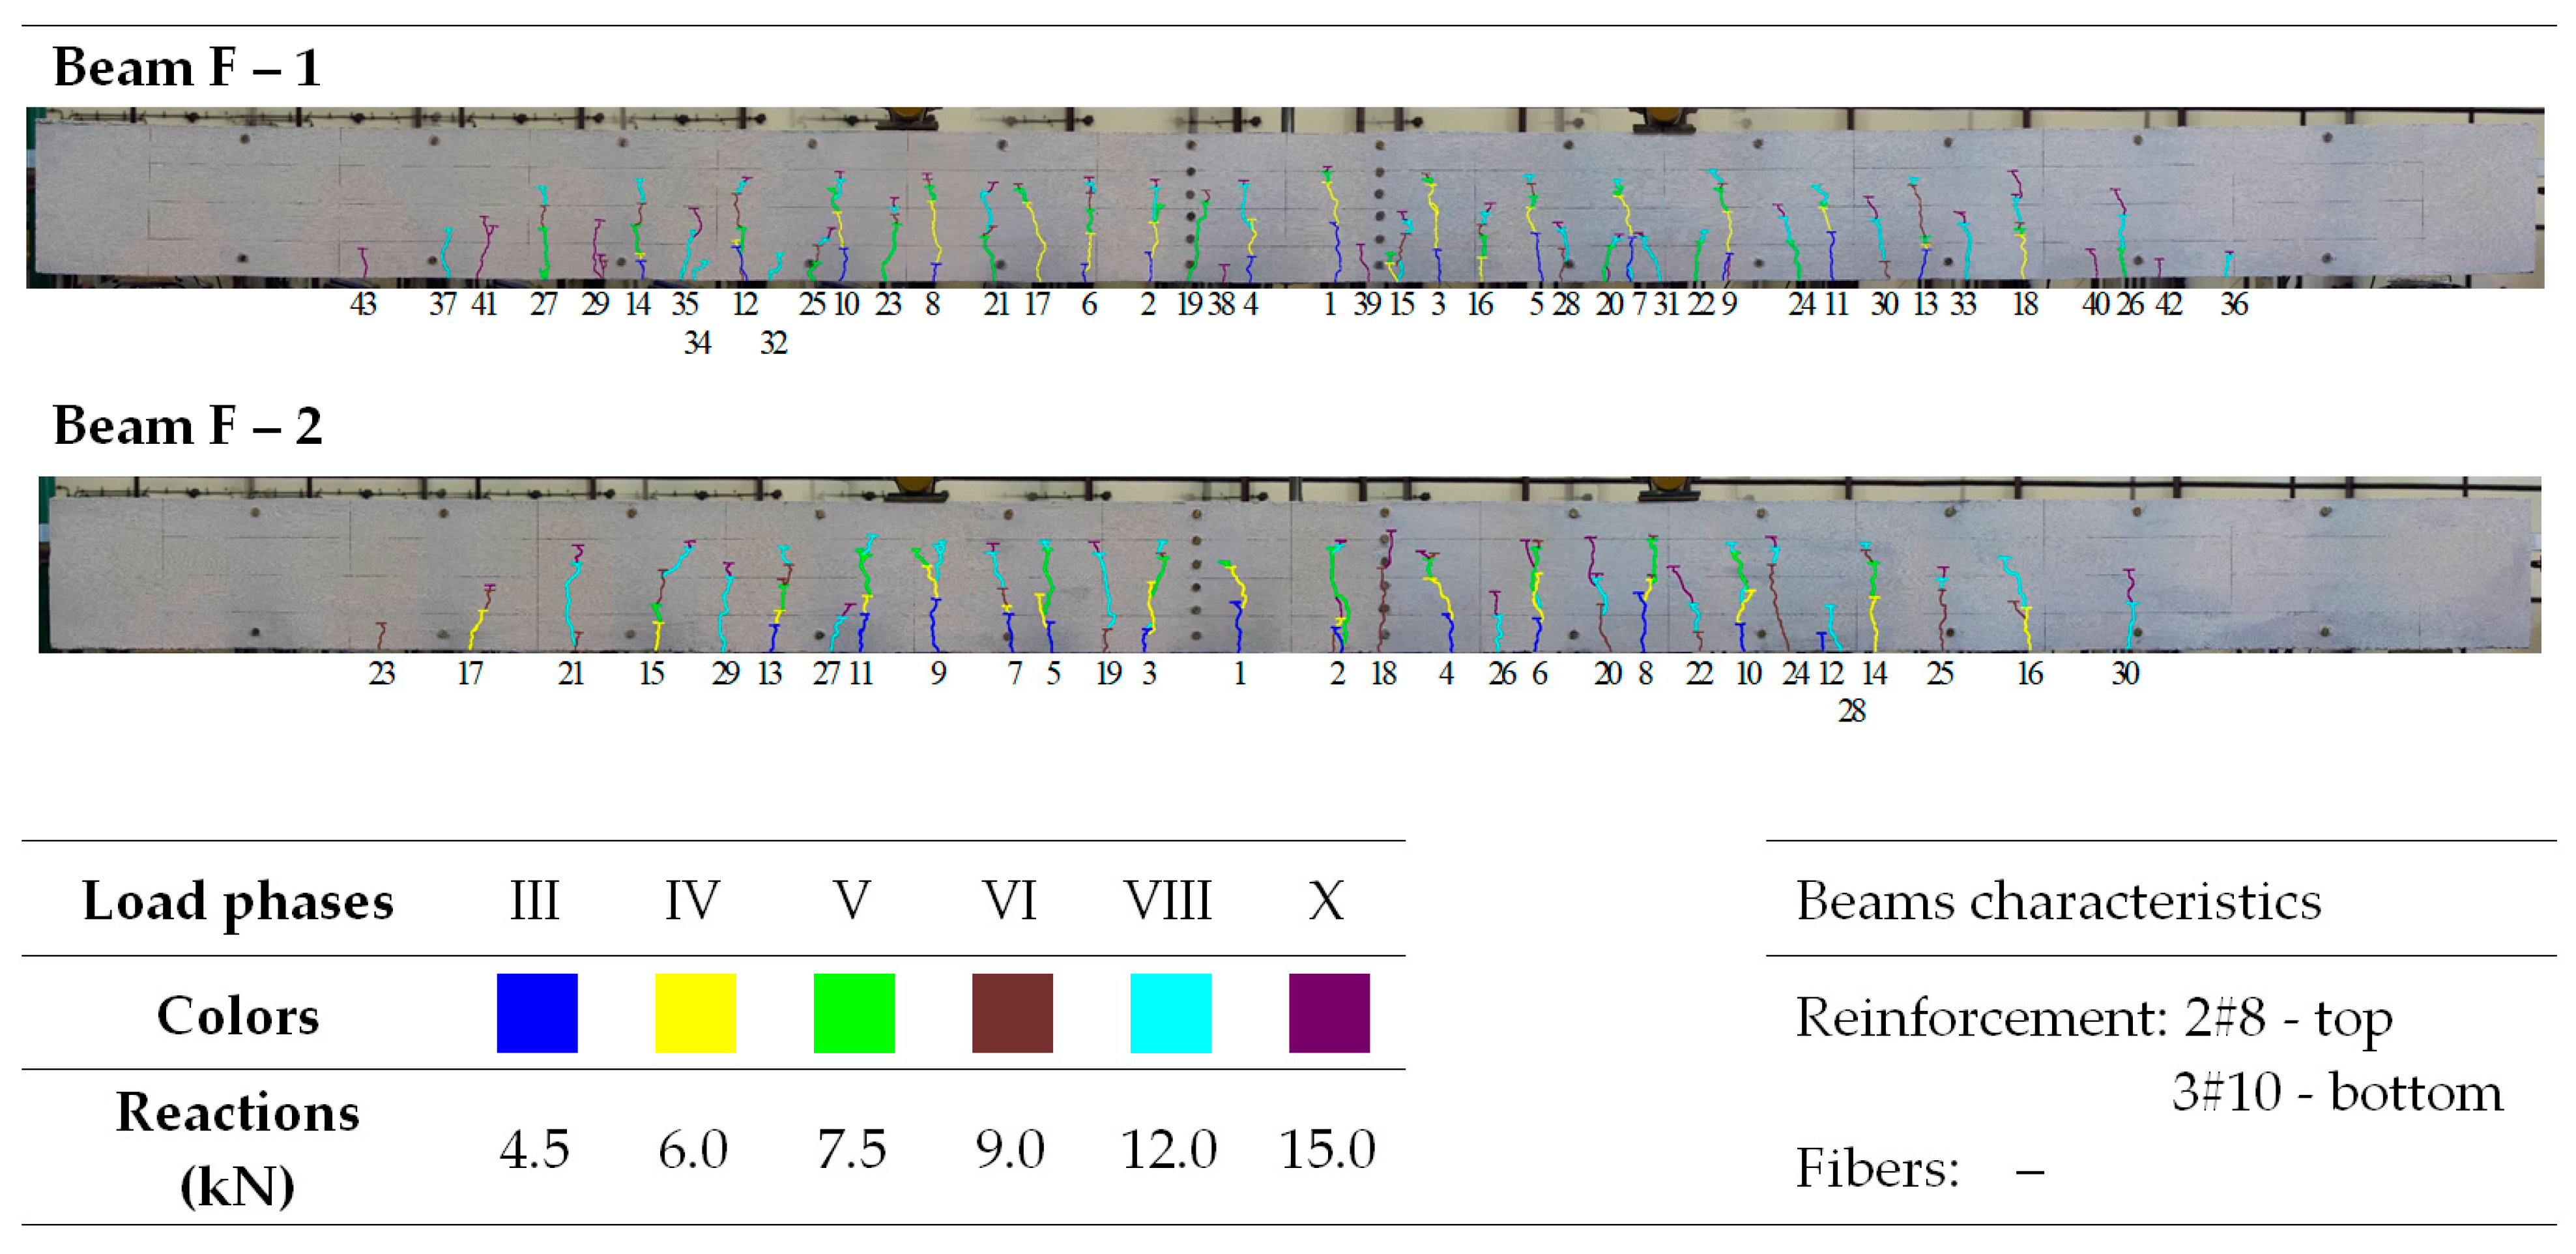
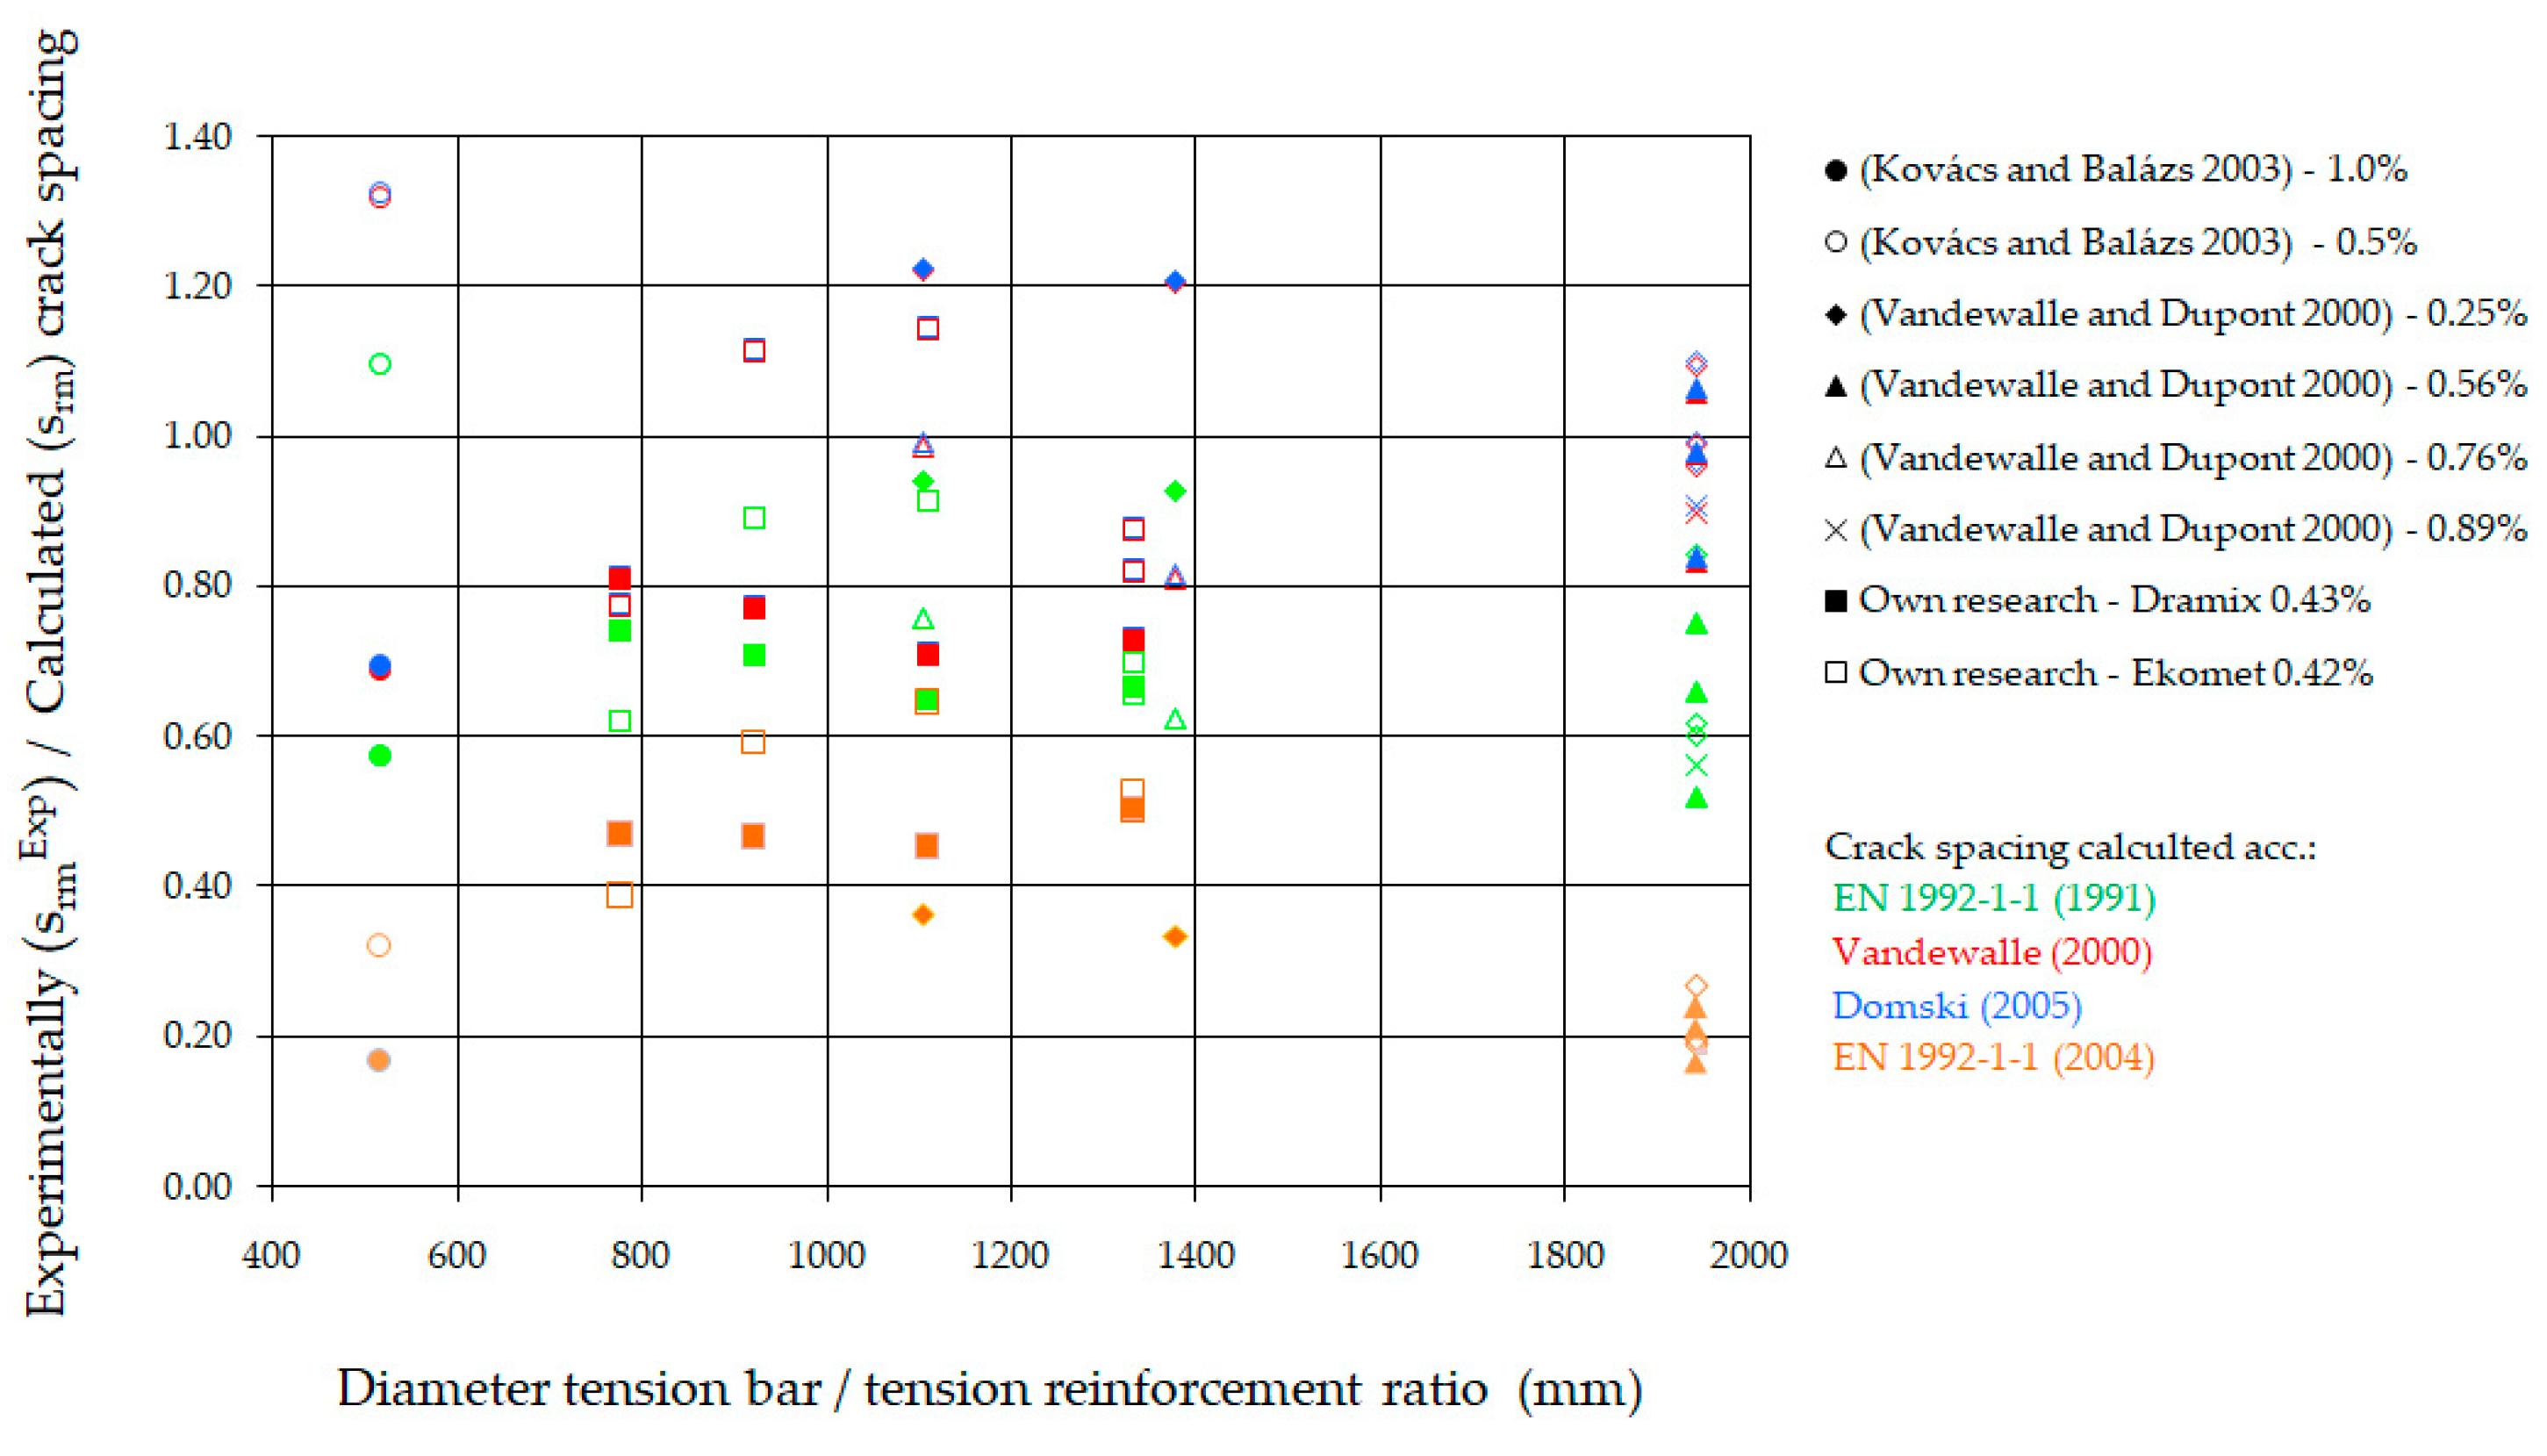
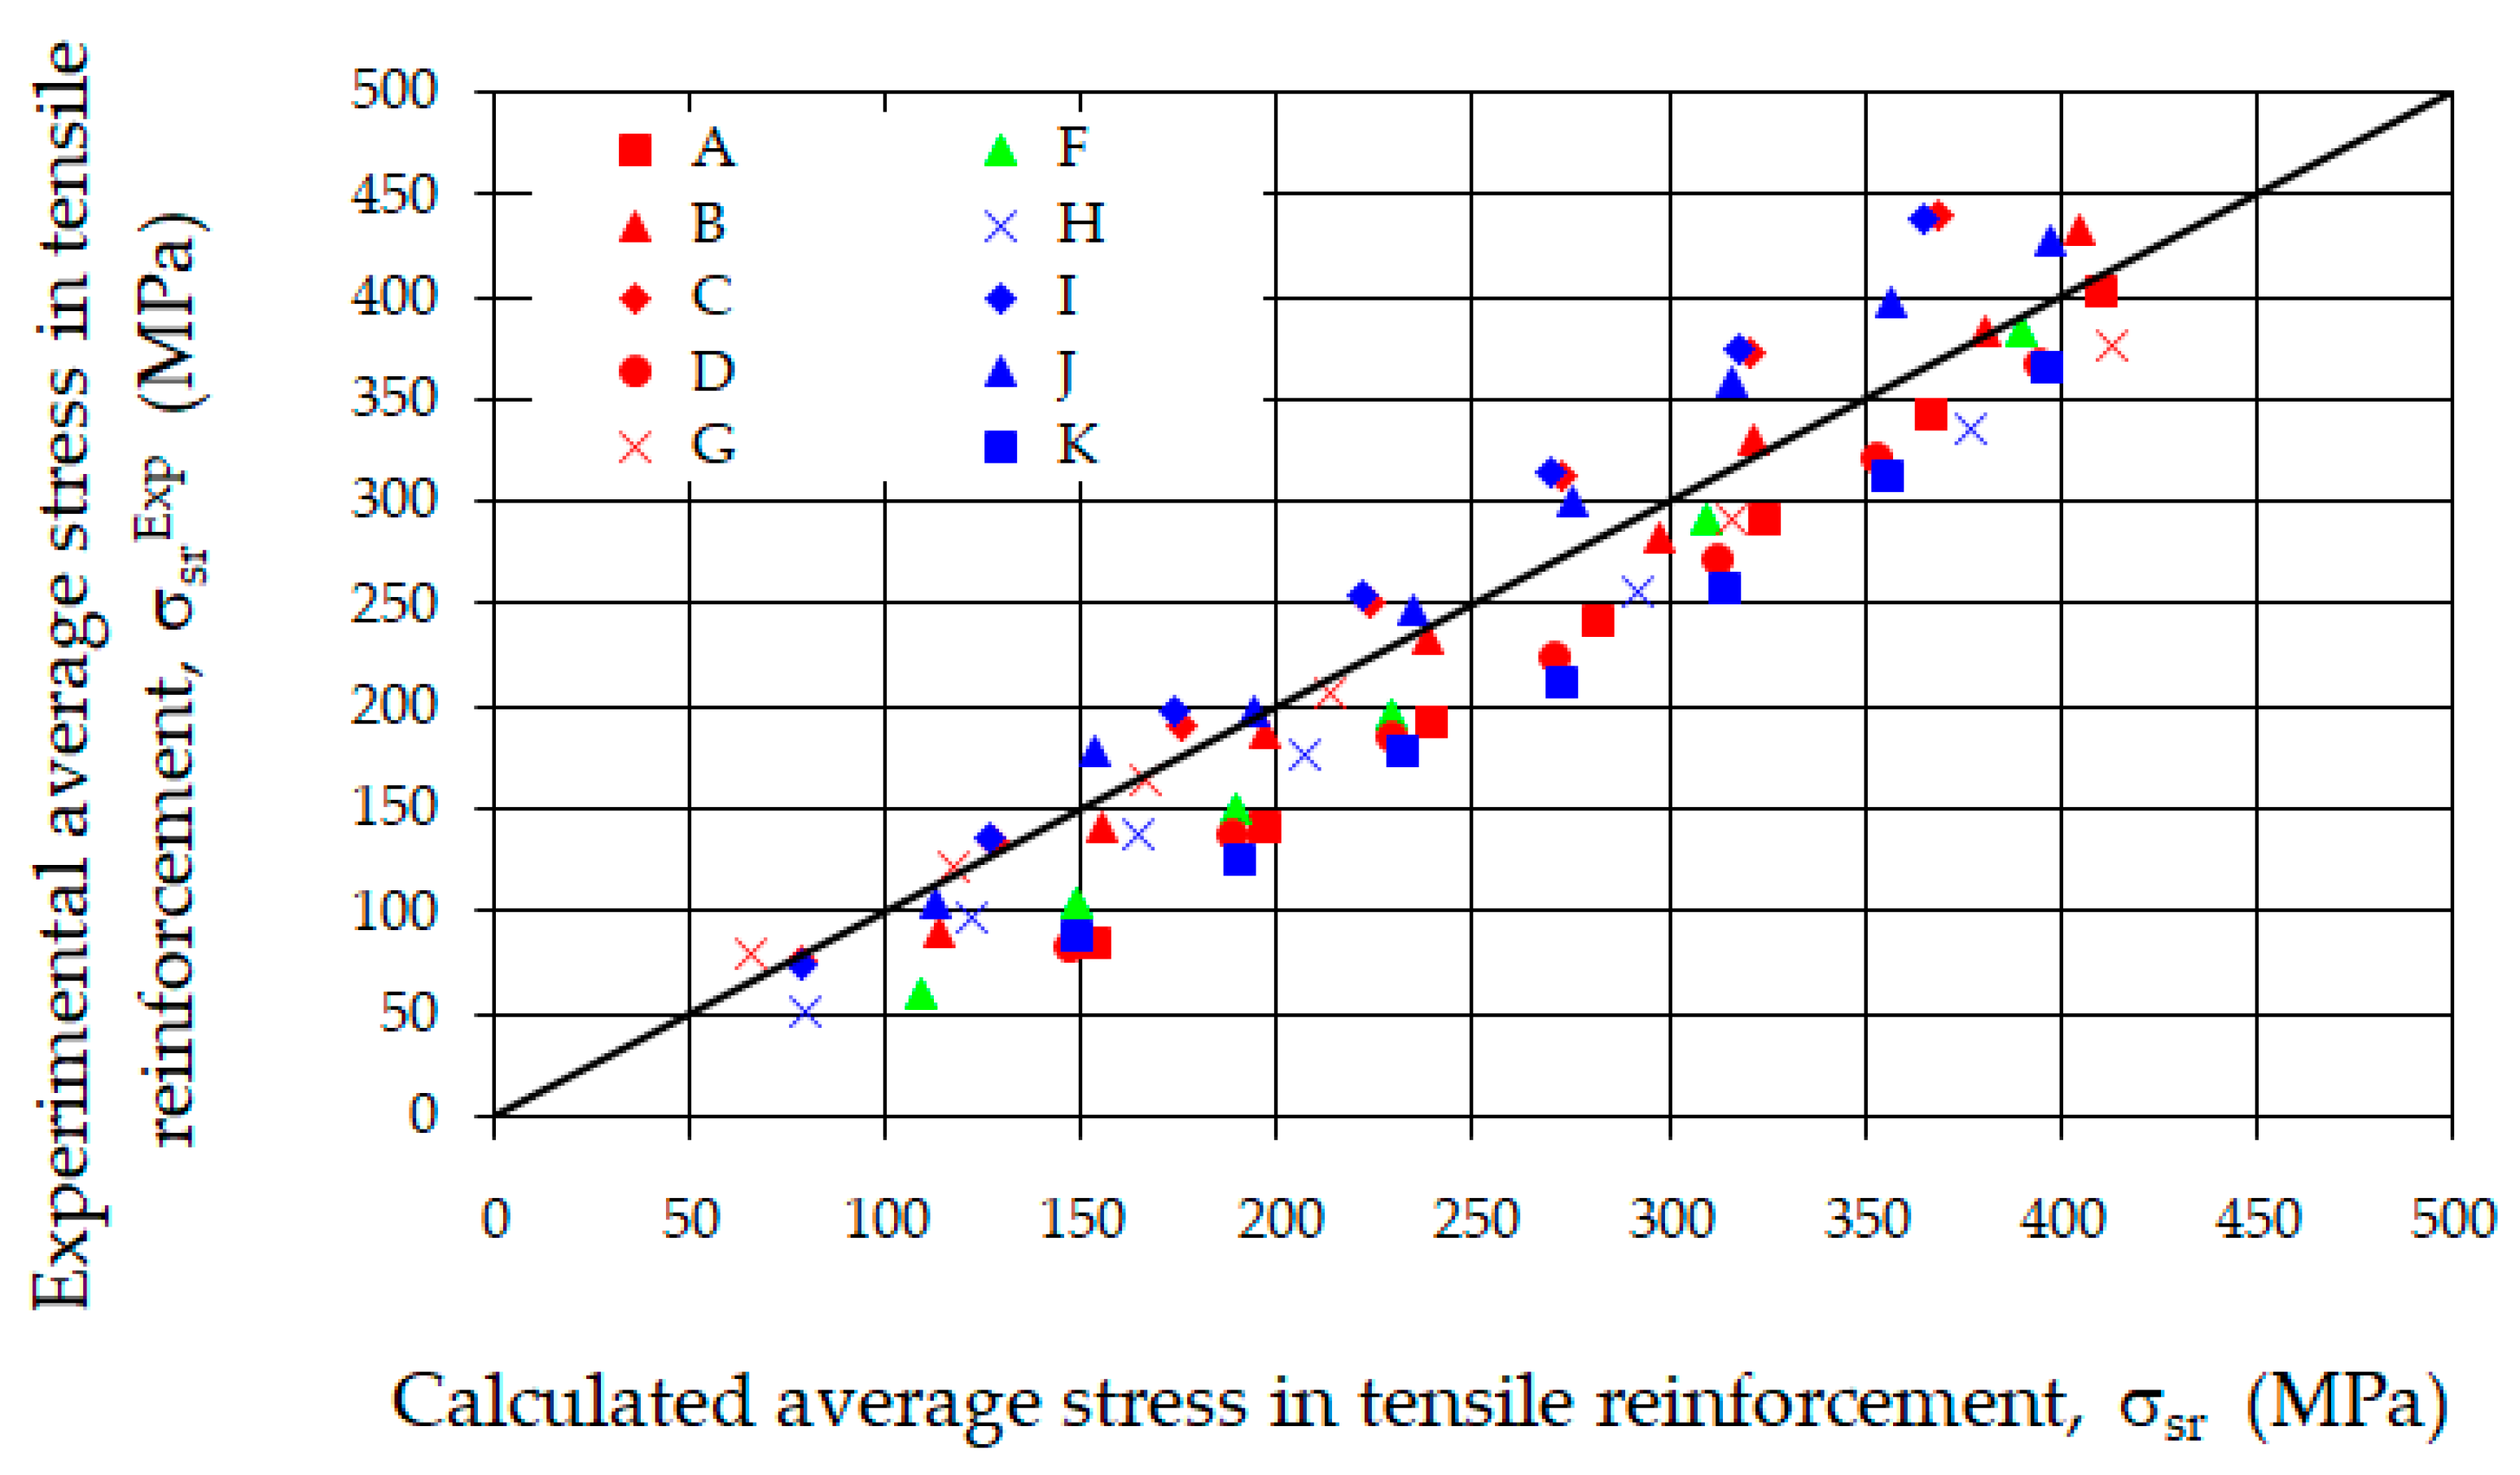
  • Analyzing the crack spacing on the section of constant moment, it can be observed that the best agreement between measurements and calculations was achieved using Domski’s method [53]. This method produces a slight overestimation, averaging 19% above the measured values.
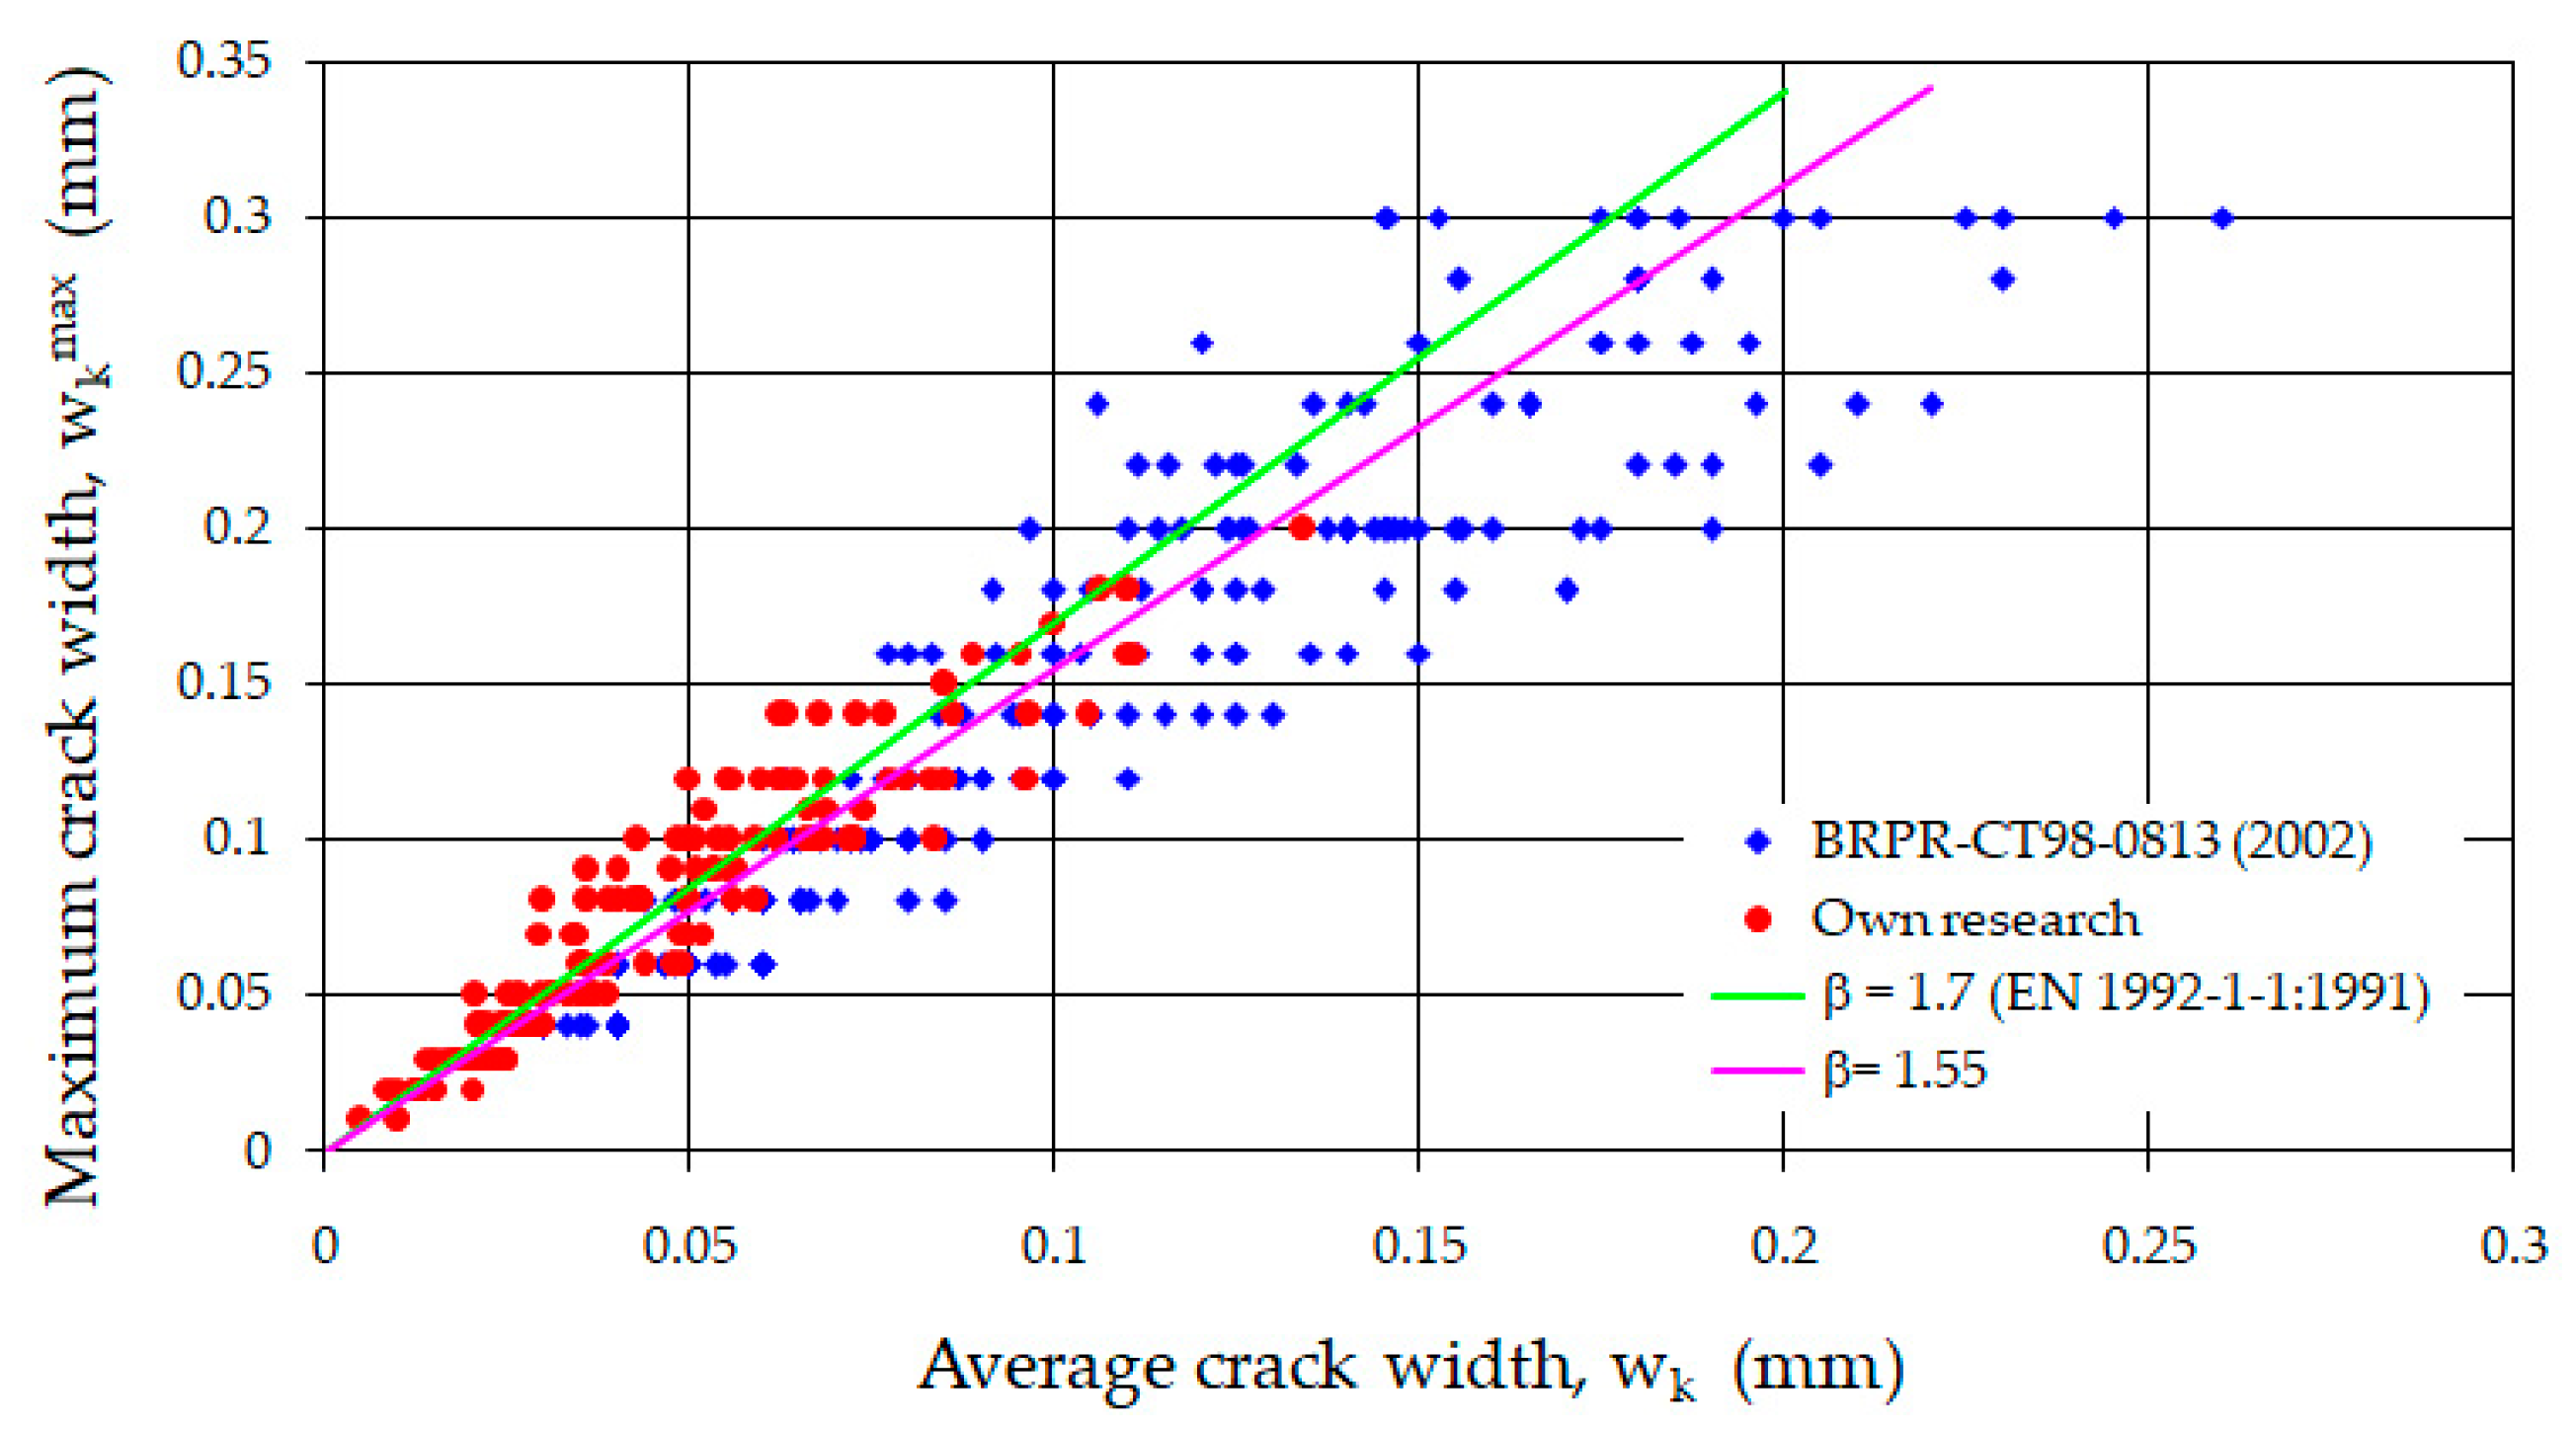
  • The highest correspondence between the calculated crack widths and the test results were obtained for the proposal included in [53]. The average percentage error was 38.4%, with the lowest standard deviation being 45.1%. In contrast, the method outlined in EC2 [52] showed the lowest agreement with the experimental results, yielding an average error of 75.5% with a standard deviation of 58.5%. Therefore, in this case, it is advisable to use the method proposed in [53], which yields satisfactory results.
  • The plain (commercial) concrete used in the tests, which had a declared compressive strength class of C35/45, exhibited higher strength properties compared to the two lower-class fiber-reinforced sand concretes (C25/30 and C30/37). Despite this, the widths of perpendicular cracks in the beams made of fine aggregate fiber-reinforced concrete and ordinary concrete were similar. Based on the tests conducted, it can be concluded that beams made of fine aggregate concrete (using waste sand) with steel fibers meet the requirements for ordinary concrete elements concerning the limit state of cracking.
  • The waste sand used in the tests proved to be a fully valuable fine-grained aggregate. Its use in the production of structural fiberconcrete will help reduce the exploitation of natural resources and lower CO2 emissions.

Author Contributions

Conceptualization, J.D., J.L.-B. and A.D.; methodology, J.D.; software, A.D.; validation, J.D., J.L.-B. and A.D.; formal analysis, J.L.-B.; investigation, J.L.-B. and A.D.; resources, J.D. and J.L.-B.; data curation, J.D.; writing—original draft preparation, J.D. and J.L.-B.; writing—review and editing, A.D.; visualization, J.L.-B.; supervision, J.D. All authors have read and agreed to the published version of the manuscript.

Funding

This research received no external funding.

Institutional Review Board Statement

Not applicable.

Informed Consent Statement

Not applicable.

Data Availability Statement

The authors are making the research results available. They are located on private computers. If you wish to access them, please contact the corresponding author.

Acknowledgments

The authors would like to thank the employees and students involved in the research.

Conflicts of Interest

The authors declare no conflicts of interest.

Abbreviations

The following abbreviations are used in this manuscript:
MexpExperimentally cracking moments
McrCracking moments
MedBending moment
MmaxBending moment corresponding to the ultimate load
MEksBending moment corresponding to the utility load
σsrAverage stress in tensile reinforcement
σsrExpExperimental average stress in tensile reinforcement
srmAverage crack spacing
srmExpExperimentally crack spacing
wkCrack width
wkExpExperimentally crack width
wkmaxMaximum crack width
fct,spTensile splitting strength
fc,cubeCompressive cube strength
fcCompressive cylinder strength
EcStatic modulus of elasticity
ρLLongitudinal reinforcement ratio

References

  1. Nuge, T.; Fazeli, M.; Baniasadi, H. Elucidating the enduring transformations in cellulose-based carbon nanofibers through prolonged isothermal treatment. Int. J. Biol. Macromol. 2024, 275, 133480. [Google Scholar] [CrossRef] [PubMed]
  2. Mohajerani, A.; Hui, S.-Q.; Mirzababaei, M.; Arulrajah, A.; Horpibulsuk, S.; Kadir, A.A.; Rahman, M.T.; Maghool, F. Amazing types, properties, and applications of fibers in construction materials. Materials 2019, 12, 2513. [Google Scholar] [CrossRef]
  3. Navaratnam, S.; Selvaranjan, K.; Jayasooriya, D.; Rajeev, P.; Sanjayan, J. Applications of natural and synthetic fiber reinforced polymer in infrastructure: A suitability assessment. J. Build. Eng. 2023, 66, 105835. [Google Scholar] [CrossRef]
  4. Amran, M.; Huang, S.-S.; Onaizi, A.M.; Makul, N.; Abdelgader, H.S.; Ozbakkaloglu, T. Recent trends in ultra-high performance concrete (UHPC): Current status, challenges, and future prospects. Constr. Build. Mater. 2022, 352, 129029. [Google Scholar] [CrossRef]
  5. Siddika, A.; Mamun, M.A.A.; Alyousef, R.; Amran, Y.H.M. Strengthening of reinforced concrete beams by using fiber-reinforced polymer composites: A review. J. Build. Eng. 2019, 25, 100798. [Google Scholar] [CrossRef]
  6. Abidnejad, R.; Baniasadi, H.; Fazeli, M.; Lipponen, S.; Kontturi, E.; Rojas, O.J.; Mattos, B.D. High-fiber content composites produced from mixed textile waste: Balancing cotton and polyester fibers for improved composite performance. Int. J. Biol. Macromol. 2025, 292, 139227. [Google Scholar] [CrossRef]
  7. Flaga, K.; Piwowarczyk, K. Crack resistance of reinforced concrete beams additionally reinforced with steel fibers. In Proceedings of the XLI Conference N-T KILiW PAN i KN PZITB, Kraków-Krynica, Poland, 19–24 September 1995; pp. 37–44. (In Polish). [Google Scholar]
  8. Altun, F.; Haktanir, T.; Ari, K. Effects of steel fiber addition on mechanical properties of concrete and RC beams. Constr. Build. Mater. 2007, 21, 654–661. [Google Scholar] [CrossRef]
  9. Mangat, P. Tensile strength of steel fiber reinforced concrete. Cem. Concr. Res. 1976, 6, 245–252. [Google Scholar] [CrossRef]
  10. Song, P.S.; Hwang, S. Mechanical properties of high-strength steel fiber-reinforced concrete. Constr. Build. Mater. 2004, 18, 669–673. [Google Scholar] [CrossRef]
  11. Yao, W.; Li, J.; Wu, K.R. Mechanical properties of hybrid fiber-reinforced concrete at low fiber volume fraction. Cem. Concr. Res. 2003, 33, 27–30. [Google Scholar] [CrossRef]
  12. Khan, M.; Cao, M.; Ali, M. Cracking behaviour and constitutive modelling of hybrid fibre reinforced concrete. J. Build. Eng. 2020, 30, 101272. [Google Scholar] [CrossRef]
  13. More, F.M.D.S.; Subramanian, S.S. Impact of Fibres on the Mechanical and Durable Behaviour of Fibre-Reinforced Concrete. Buildings 2022, 12, 1436. [Google Scholar] [CrossRef]
  14. Wang, D.; Ju, Y.; Shen, H.; Xu, L. Mechanical properties of high performance concrete reinforced with basalt fiber and polypropylene fiber. Constr. Build. Mater. 2019, 197, 464–473. [Google Scholar] [CrossRef]
  15. Marcalikova, Z.; Cajka, R.; Bilek, V.; Bujdos, D.; Sucharda, O. Determination of mechanical characteristics for fiber-reinforced concrete with straight and hooked fibers. Crystals 2020, 10, 545. [Google Scholar] [CrossRef]
  16. Almusallam, T.; Ibrahim, S.M.; Al-Salloum, Y.; Abadel, A.; Abbas, H. Analytical and experimental investigations on the fracture behaviour of hybrid fiber reinforced concrete. Cem. Concr. Compos. 2016, 74, 201–217. [Google Scholar] [CrossRef]
  17. Banthia, N.; Nandakumar, N. Crack growth resistance of hybrid fiber reinforced composite. Cem. Concr. Compos. 2003, 25, 3–9. [Google Scholar] [CrossRef]
  18. ACI PRC-544.2-17; Report on the Measurement of Fresh State Properties and Fiber Dispersion of Fiber-Reinforced Concrete. American Concrete Institute: Farmington Hills, MI, USA, 2017.
  19. Jasiczak, J.; Mikołajczyk, P. Technology of Concrete Modified with Admixtures and Additives. Review of Domestic and Foreign Trends; Poznań University of Technology Publishing House: Poznań, Poland, 1997. (In Polish) [Google Scholar]
  20. Brandt, A.M.; Kasperkiewicz, J.; Glinicki, M. Basics of Using Fibre Concrete with Steel Fibres; PAN IPPT Mechanics Centre: Warsaw, Poland, 2001. (In Polish) [Google Scholar]
  21. ASTM C 1018-97; Standard Test Method for Flexural Toughness and First-Crack Strength of Fiber-Reinforced Concrete (Using Beam with Third-Point Loading). American Society for Testing and Materials: West Conshohocken, PA, USA, 1997.
  22. Kobayashi, K.; Cho, R. Test method for estimating first crack strength of steel fibre reinforced concrete. In Proceedings of the Rilem Symposium Testing and Test Methods of Fibre Cement Composites, Sheffield, UK, 5–7 April 1978; pp. 417–422. [Google Scholar]
  23. NBN B 15-238; Tests on Fibre Reinforced Concrete. Bending Test on Primatic Samples. Belgian Standard, IBN: Brussels, Blgium, 1992.
  24. JCI-SF4; Method of Test for Flexural Strength and Flexural Toughness of Fiber Reinforced Concrete. Japan Concrete Institute: Tokyo, Japan, 1984.
  25. Balaguru, P.; Narahari, R.; Patel, M. Flexural Toughness of Steel Fibre Reinforced Concrete. ACI Mater. J. 1992, 89, 541–546. [Google Scholar]
  26. Chen, L.; Mindess, S.; Morgan, D.R. Specimen geometry and toughness of steel-fibre-reinforced concrete. J. Mater. Civ. Eng. 1994, 6, 529–541. [Google Scholar] [CrossRef]
  27. Gopalaratnam, V.S.; Gettu, R. On the characteristic of flexural toughness in fiber reinforced concretes. Cem. Concr. Comp. 1995, 17, 239–254. [Google Scholar] [CrossRef]
  28. Johnson, C.D.; Skarendahl, A. Comparative flexural performance evaluation of steel fibre-reinforced concretes according to ASTM C1018 shows importance of fibre parameters. Mater. Struct. 1992, 25, 191–200. [Google Scholar] [CrossRef]
  29. Nataraja, M.C.; Dhang, N.; Gupta, A.P. Toughness characterization of steel fibre-reinforced concrete by JSCE approach. Cem. Concr. Res. 2000, 30, 593–597. [Google Scholar] [CrossRef]
  30. Zhu, D.Q.; Tang, A.P.; Wan, C.L.; Zeng, Y.S.; Wang, Z. Investigation on the flexural toughness evaluation method and surface cracks fractal characteristics of polypropylene fiber reinforced cement-based composites. J Build. Eng. 2021, 43, 103045. [Google Scholar] [CrossRef]
  31. Li, B.; Chi, Y.; Xu, L.; Shi, Y.; Li, C. Experimental investigation on the flexural behavior of steel-polypropylene hybrid fiber reinforced concrete. Constr. Build. Mater. 2018, 191, 80–84. [Google Scholar] [CrossRef]
  32. Giaccio, G.; Tobes, J.M.; Zerbino, R. Use of small beams to obtain design parameters of fibre reinforced concrete. Cem. Concr. Compos. 2008, 30, 297–306. [Google Scholar] [CrossRef]
  33. Piątek, Z.; Domski, J.; Staszak, I. Cracking of sand-fibre concrete beams. In Proceedings of the L Conference N-T KILiW PAN i KN PZITB, Krynica, Poland, 12–27 September 2004; Volume 3, pp. 75–84. (In Polish). [Google Scholar]
  34. Ibrahim, O.T.; Luxmore, A.R. Control of cracks width by inclusion of fibres in conventionally reinforced concrete. Int. J.Cem. Com. 1979, 1, 77–89. [Google Scholar]
  35. Ibrahim, O.T.; Luxmore, A.R. Control of cracks in reinforced concrete using steel fibres. In Proceedings of the Rilem Symposium FRC 86 Third International Symposium on Developments in Fibre Reinforced Cement and Concrete, Sheffield, UK, 13–17 July 1986. [Google Scholar]
  36. Al-Taan, S.A.; Al-Feel, J.R. Prediction of crack width in fibrous reinforced concrete members. In Fiber Reinforced Cements and Concretes. Recent Developments; Elsevier Science Publishers Ltd.: Essex, UK, 1989; pp. 209–218. [Google Scholar]
  37. Tan, K.H.; Paramasivam, P.; Tan, K.C. Cracking characteristics of reinforced steel fiber concrete beams under short- and long-term loadings. Adv. Cem. Based Mater. 1995, 2, 127–137. [Google Scholar] [CrossRef]
  38. Nemegeer, D.; Vandewalle, L.; Van Nieuwenburg, D.; Van Gysel, A.; Vyncke, J.; Deforche, E. Dramix guideline: Design of concrete structures—Steel wire fibre reinforced concrete structures with or without ordinary reinforcement. Infrastuct. Het Leefmilieu 1995, 4, 227–239. [Google Scholar]
  39. Nemegeer, D. Dramix: Design Guidelines for Dramix Steel Wire Fibre Reinforced Concrete; N.V. Bekaert S.A.: Harelbeke, Belgium, 1997. [Google Scholar]
  40. Rilem, T.C. 162-TDF. Test and design methods for steel fibre reinforced concrete: σ–ε Design method. Mater. Struct. 2003, 36, 560–567. [Google Scholar] [CrossRef]
  41. Vandewalle, L. Cracking behaviour of concrete beams reinforced with a combination of ordinary reinforcement and steel fibers. Mater. Struct. 2000, 33, 164–170. [Google Scholar] [CrossRef]
  42. Padmarajaiah, S.K.; Ramaswamy, A. Crack-width prediction for high-strength concrete fully and partially prestressed beam specimens containing steel fibers. ACI Struct. J. 2001, 98, 852–861. [Google Scholar]
  43. Brite Euram BRPR-CT98-0813; Test and Design Methods for Steel Fibre Reinforced Concrete. Subtask 7.2 Final Rep. Project funded by the European Community under the Industrial & Materials Technologies Programme (Brite-Euram II). K.U. Leuven Research and Development: Leuven, Belgium, 2002.
  44. Rilem, T.C. 162-TDF. Test and design methods for steel fibre reinforced concrete: Bending test. Mater. Struct. 2002, 35, 579–582. [Google Scholar] [CrossRef]
  45. Dupont, D. Modelling and Experimental Validation of the Constitutive Law (se) and Cracking Behaviour of Steel Fibre Reinforced Concrete. Ph.D. Thesis, Catholic University of Leuven, Leuven, Belgium, 2003. [Google Scholar]
  46. Dupont, D.; Vandewalle, L. The cracking behaviour of SFRC beams containing longitudinal reinforcement. In Proceedings of the 7th International Symposium on Brittle Matrix Composites, Warsaw, Poland, 13–15 October 2003; pp. 253–262. [Google Scholar] [CrossRef]
  47. Wei, Z.; Wang, T.; Li, H.; Dong, T.; Li, Z.; Guo, X. Study of the flexural behavior of basalt fiber-reinforced concrete beams with basalt fiber-reinforced polymer bars and steel bars. Case Stud. Constr. Mater. 2025, 22, e04433. [Google Scholar] [CrossRef]
  48. Liu, X.; Sun, Y.J.; Wu, T.; Liu, Y. Flexural cracks in steel fiber-reinforced lightweight aggregate concrete beams reinforced with FRP bars. Compos. Struct. 2020, 253, 12752. [Google Scholar] [CrossRef]
  49. Hamrata, M.; Boulekbache, B.; Chemrouk, M.; Amziane, S. Flexural cracking behavior of normal strength, high strength and high strength fiber concrete beams, using Digital Image Correlation technique. Constr. Buil. Mater. 2016, 106, 678–692. [Google Scholar] [CrossRef]
  50. Domski, J. Cracking of sand-fibre concrete beams under immediate loading. Engin. Constr. 2008, 64, 316–319. (In Polish) [Google Scholar]
  51. Domski, J. Cracking moment in steel fibre reinforced concrete beams based on waste sand. Ovidius Univ. Ann. Constantza Ser. Civ. Eng. 2011, 13, 29–34. [Google Scholar]
  52. ENV 1992-1-1; Eurocode 2: Design of Concrete Structures—Part 1 : General Rules and Rules for Buildings. European Union: Brussels, Belgium, 1991.
  53. Domski, J. Nośność Ugięcie i Zarysowanie Belek Piaskobetonowych z Włóknami Stalowymi pod Obciążeniem Doraźnym. Ph.D. Thesis, Koszalin University, Koszalin, Poland, 2005. [Google Scholar]
  54. EN 1992-1-1; Eurocode 2: Design of Concrete Structures—Part 1-1: General Rules and Rules for Buildings. European Union: Brussels, Belgium, 2004.
  55. Available online: http://geoportal.pgi.gov.pl/odpady/wytwarzanie (accessed on 20 February 2025).
  56. Głodkowska, W.; Laskowska-Bury, J. Proposition for Determining the Residual Strength of Fiber-Reinforced Cement Composite. Materials 2022, 15, 7546. [Google Scholar] [CrossRef]
  57. Domski, J.; Zakrzewski, M. Deflection of steel fiber reinforced concrete beams based on waste sand. Materials 2020, 13, 392. [Google Scholar] [CrossRef] [PubMed]
  58. Bentur, A.; Mindess, S. Fiber Reinforced Cementitious Composites, 2nd ed.; CRC Press: London UK, 2006. [Google Scholar]
  59. Holschemacher, K.; Mueller, T.; Ribakov, Y. Effect of steel fibers on mechanical properties of high strength concrete. Mater. Des. 2010, 31, 2604–2615. [Google Scholar] [CrossRef]
  60. Balendran, R.V.; Zhou, F.P.; Nadeem, A.; Leung, A.Y.T. Influence of steel fibres on strength and ductility of normal and lightweight high strength concrete. Build. Environ. 2002, 37, 1361–1367. [Google Scholar] [CrossRef]
  61. Michels, J. Bearing capacity of steel fiber reinforced concrete flat slabs. Ph.D. Thesis, Unilu—University of Luxembourg, Luxembourg, Luxembourg, 2009. [Google Scholar]
  62. Rilem, T.C. 162-TDF: Test and design methods for steel fibre reinforced concrete. Design of steel fibre reinforced concrete using the σ-w method: Principles and applications. Mater. Struct. 2002, 35, 262–278. [Google Scholar] [CrossRef]
  63. Alberti, M.G.; Enfedaque, A.; Gálvez, J.C. On the mechanical properties and fracture behaviour of polyolefin fiber-reinforced self-compacting concrete. Constr. Build. Mater. 2014, 55, 274–288. [Google Scholar] [CrossRef]
  64. Barros, J.A.O.; Cruz, J.S. Fracture energy of steel fiber-reinforced concrete. Mech. Adv. Mat. Struct. 2001, 8, 29–45. [Google Scholar] [CrossRef]
  65. Soutsos, M.N.; Le, T.T.; Lampropoulos, A.P. Flexural performance of fibre reinforced concrete made with steel and synthetic fibres. Constr. Build. Mater. 2012, 36, 704–710. [Google Scholar] [CrossRef]
  66. Yoo, D.Y.; Yoon, Y.S.; Banthia, N. Flexural response of steel-fibre-reinforced concrete beams: Effects of strength, fiber content, and strain-rate. Cem. Concr. Compos. 2015, 64, 84–92. [Google Scholar] [CrossRef]
  67. Plagué, T.; Desmettre, C.; Charron, J.P. Influence of fiber type and fiber orientation on cracking and permeability of reinforced concrete under tensile loading. Cem Concr Res. 2017, 94, 59–70. [Google Scholar] [CrossRef]
  68. Löfgren, I. Fibre-Reinforced Concrete for Industrial Construction—A Fracture Mechanics Approach to Material Testing and Structural Analysis. Ph.D. Thesis, Chalmers University of Technology, Göteborg, Sweden, 2005. [Google Scholar]
  69. Piątek, Z.; Bartnik, E.; Bierut, W.; Borjaniec, W.; Kamyno, R.; Kuncer, K.; Szyszko, A. Design Methods of Sand Concrete Developed Within the Framework of the B-219 Problem Entitled “Application of Sand Concrete for Conventionally Produced Prefabricated Building Elements”; Central Research and Development Centre of the Concrete Industry CEBET: Warsaw, Poland, 1981. (In Polish) [Google Scholar]
  70. ACI 544.3R-93 (Reapproved 1998); Guide for Specifying, Proportioning, Mixing, Placing and Finishing Steel Fiber Reinforced Concrete. Manual of Concrete Practice, American Concrete Institute: Farmington Hills, MI, USA, 2005.
  71. EN 12350-3:2019; Testing Fresh Concrete. Part 3: Vebe Test. European Union: Brussels, Belgium, 2021.
  72. EN 12390-3; Testing Hardened Concrete—Part 3 Compressive Strength of Test Specimens. European Union: Brussels, Belgium, 2019.
  73. EN 12390-6; Testing Hardened Concrete—Part 6: Tensile Splitting Strength of Test Specimens. European Union: Brussels, Belgium, 2023.
  74. EN 12390-13; Testing Hardened Concrete—Part 13: Determination of Secant Modulus of Elasticity in Compression. European Union: Brussels, Belgium, 2021.
  75. Benjamin, J.R.; Cornell, C.A. Probability, Mathematical Statistics and Decision Theory for Engineers; Wyd. N.-T.: Poland, Warsaw, 1977. [Google Scholar]
  76. Tan, K.H.; Paramsivam, P.; Tan, K.C. Instantaneous and long-term deflections of steel fibre reinforced concrete beams. ACI Struct. J. 1994, 91, 384–393. [Google Scholar]
  77. Lok, T.S.; Xiao, J.R. Flexural strength assessment of steel fibre reinforced concrete. ASCE J. Mat. Civ. Eng. 1999, 11, 188–196. [Google Scholar] [CrossRef]
  78. Brandt, A.M.; Babut, R.; Kasperkiewicz, J.; Marks, M. Selected Issues in Composite Mechanics; Białystok University of Technology: Białystok, Poland, 1982. (In Polish) [Google Scholar]
  79. Kubicki, J. The width of cracks perpendicular to the axis of reinforced concrete elements according to the project PrPN-B-03264. Engin. Constr. 1997, 12, 611–614. (In Polish) [Google Scholar]
  80. Mianowski, K.M. Cracking of Concrete Elements with Dispersed Reinforcement Under Tension; ITB PWN: Warsaw, Poland, 1976. (In Polish) [Google Scholar]
  81. Vandewalle, L.; Dupont, D. Prediction of crack widths in ordinary reinforced concrete elements containing steel fibres. In Proceedings of the 6th International Symposium on Brittle Matrix Composites, Warsaw, Poland, 9–11 October 2000; pp. 52–61. [Google Scholar]
  82. Kovács, I.; Balázs, G.L. Structural behaviour of steel fibre reinforced concrete. FIB Struct. Concr. 2003, 4, 57–63. [Google Scholar] [CrossRef]
  83. Piątek, Z.; Bierut, W.; Borjaniec, W. Concrete Structures. Part I. Dimensioning of Concrete and Reinforced Concrete Sections; WSInż: Koszalin, Poland, 1993. (In Polish) [Google Scholar]
  84. Brite Euram BRPR-CT98-0813. Test and Design Methods for Steel Fibre Reinforced Concrete. Final Report of Subtask 4.1: Trial Beams in Bending and Bending with Compression. Project funded by the European Community under the Industrial & Materials Technologies Programme (Brite-Euram II); K.U. Leuven Research and Development: Leuven, Belgium, 2002. [Google Scholar]
Figure 1. Relationship between force-elongation of an axially stretched sample made from ordinary concrete and fiber-reinforced concrete [61].
Applsci 15 04790 g001
Figure 2. Stress distribution of tensile stresses across a crack for ordinary concrete and fiber-reinforced concrete, according to RILEM TC-1 62-TDF [62].
Applsci 15 04790 g002
Figure 3. Schemes of work of fibers in the matrix: (a) the Cook-Gordon effect, (b) behavior of the matrix, (c) deformation fiber [68].
Applsci 15 04790 g003
Figure 4. Concrete beam reinforced with flexible bars in four-point bending test: (a) the initial load phase, where the first cracks appear; (b) the load-deflection diagram illustrating the response of the beam; (c) the formation of additional cracks as a result of increased loading; (d) failure of the beam characterized by crushing in the compression zone [68].
Applsci 15 04790 g004
Figure 5. Geometry and static scheme of the tested beams.
Applsci 15 04790 g005
Figure 6. The selected cubic samples during the tests: (a) compressive strength (fc,cube) (series A, sample 3), (b) splitting tensile strength (fct,sp) (series B, sample 5).
Applsci 15 04790 g006
Figure 7. The stand for testing beams (series B, beam B-2).
Applsci 15 04790 g007
Figure 8. Comparison of the experimentally determined cracking moments (Mexp) and those calculated (Mcr) [52,54,76,77].
Applsci 15 04790 g008
Figure 9. The average crack spacing during individual load phases of the tested beams.
Applsci 15 04790 g009
Figure 10. Morphology of cracks in individual loading phases (series A beams)—# means the diameter of the reinforcement.
Applsci 15 04790 g010
Figure 11. Morphology of cracks in individual loading phases (series B beams)—# means the diameter of the reinforcement.
Applsci 15 04790 g011
Figure 12. Morphology of cracks in individual loading phases (series D beams)—# means the diameter of the reinforcement.
Applsci 15 04790 g012
Figure 13. Morphology of cracks in individual loading phases (series F beams)—# means the diameter of the reinforcement.
Applsci 15 04790 g013
Figure 14. Morphology of cracks in individual loading phases (series J beams)—# means the diameter of the reinforcement.
Applsci 15 04790 g014
Figure 15. Crack spacing stabilized for various (percentage) steel fiber content [41,52,53,54,81,82].
Applsci 15 04790 g015
Figure 16. Change in maximum crack width as a function of moment.
Applsci 15 04790 g016
Figure 17. Change in maximum crack width in the individual loading phases as a function of moment.
Applsci 15 04790 g017
Figure 18. Comparison of average and maximum crack width [52,84].
Applsci 15 04790 g018
Figure 19. Comparison of calculated and experimental average stress in tensile reinforcement.
Applsci 15 04790 g019
Figure 20. Comparison of calculated and experimental average and maximum crack width [41,52,53,54].
Applsci 15 04790 g020
Table 1. Composition of the concrete mixtures used in tests [50,51].
Plain Commercial ConcreteFiber-Reinforced Fine Aggregate Concrete
M1M2
Components (kg/m3)Components(kg/m3)
Cement CEM I 32.5 R410Cement CEM II/B-V 32.5 R374378
Water188Water150140
Superplasticizer1.89Superplasticizer4.084.13
Aggregate (0–2)646Waste sand (0–4)18351855
Aggregate (2–8)576Steel fibers loose 50/0.8 mm 33-
Aggregate (8–16)523Steel fibers glued 30/0.55 mm-34
w/c0.46Fiber-reinforcement ratio by volume (%)0.420.43
w/c0.400.37
Consistency of mixtures: plastic, V3—according to Ve-Be method [71]. M1—Series: A, B, C, D, G; M2—Series: H, I, J, K.
Table 2. The elements testing program.
ConcreteSeriesBeams Small-Sized Elements
Beams MarkingNumber of Elements
(pcs.)
DimensionsReinforcement
(Top,
Bottom)
Number of Samples (pcs.)Dimensions of Cubic and Cylinders
Samples
(mm)
with loose steel fibers 50/0.8AA-1
A-2
2150 × 200 × 3300 mm2 # 8
3 # 8
6 * + 6 **
3 # + 3 ##
150 × 150 × 150
150 × 450
BB-1
B-2
22 # 8
3 # 10
6 * + 6 **
3 # + 3 ##
150 × 150 × 150
150 × 450
CC-1
C-2
22 # 8
3 # 12
6 * + 6 **
3 # + 3 ##
150 × 150 × 150
150 × 450
DD-1
D-2
2
3 # 8
6 * + 6 **
3 # + 3 ##
150 × 150 × 150
150 × 450
GG-1
G-2
22 # 8
3 # 14
6 * + 6 **
3 # + 3 ##
150 × 150 × 150
150 × 450
plainFF-1
F-2
22 # 8
3 # 10
12 * + 12 **
3 # + 3 ##
150 × 150 × 150
150 × 450
with glued steel fibers 30/0.55HH-1
H-2
22 # 8
3 # 14
6 * + 6 **
3 # + 3 ##
150 × 150 × 150
150 × 450
II-1
I-2
22 # 8
3 # 12
6 * + 6 **
3 # + 3 ##
150 × 150 × 150
150 × 450
JJ-1
J-2
22 # 8
3 # 10
6 * + 6 **
3 # + 3 ##
150 × 150 × 150
150 × 450
KK-1
K-2
22 # 8
3 # 8
6 * + 6 **
3 # + 3 ##
150 × 150 × 150
150 × 450
Total number: 20 piecesTotal number:192 pieces
* cubes for testing compression strength, ** cubes for testing split tensile strength, # cylinders for testing compressive strength (cut to a height of 300 mm after 7 days), ## cylinders for testing static modulus of elasticity (cut to a height of 300 mm after 7 days).
Table 3. Load phases of beams and corresponding support reactions [kN].
SeriesLongitudinal Reinforcement Ratio (ρL)Load Phases/Reactions (kN)
IIIIIIVVVIVIIVIIIIXX
A0.62.03.04.05.06.07.08.09.010.0
B0.93.04.56.07.59.010.512.013.515.0
C1.33.04.57.09.512.014.517.019.522.0
D0.62.03.04.05,06.07.08,09,010,0
F0.93.04.56.07.59.010.512.013.515.0
G1.83.06.09.012.015.018.021.024.027.0
H1.83.06.09.012.015.018.021.024.027.0
I1.33.04.57.09.512.014.517.019.522.0
J0.93.04.56.07.59.010.512.013.515.0
K0.62.03.04.05.06.07.08.09.010.0
Table 4. Results from properties tests.
ConcreteSeriesMechanical Properties
fct,sp
(MPa)
fc,cube
(MPa)
fc
(MPa)
Ec
(GPa)
with loose steel fibers 50/0.8A3.2936.545.533.6
B3.5748.350.234.2
C3.4449.347.241.1
D3.5144.845.633.2
G3.6250.252.753.7
Plain F3.8259.751.935.9
with glued steel fibers 30/0.55H2.7436.234.832.1
I2.6935.938.128.3
J2.8937.638.425.9
K2.9438.437.530.4
Table 5. Mechanical properties of the steel bars [51].
Diameter (mm)Cross
Section
(mm2)
The Yield Point
(MPa)
Tensile Strength
(MPa)
Modulus of Elasticity
(GPa)
8.253.0424695223
10.281.1454714220
12.2116.7430678205
14.3160.6451688214
Table 6. Crack spacing in individual loading phases (beam B-2).
Marking of CrackCrack Spacing (mm)—Beam B-2
Load Phases/Reactions (kN)
IIIIVVVIVIIVIIIIXX
4.56.07.59.010.512.013.515.0
33
130
29
113
15
18277
23
105
13
93
11
12282
25
40
9
13455
19
79
7
109
5
14580
17
65
3
13365
21
68
1
119
2
13464
22
70
4
13371
18
62
6
12153
31
68
8
15057
20
9331
26
62
10
11853
24
65
12
12858
27
70
14
130
16
41
28
93
30
140
32
 
Table 7. Crack spacing in individual loading phases (beam I-1).
Marking of CrackCrack Spacing (mm)—Beam I-1
Load Phases/Reactions (kN)
IIIIIIVVVIVIIVIIIIXX
3.04.57.09.512.014.517.019.522.0
44 103
36
17412651
42
75
38
48
34
77
32
8948
43
41
20
9642
40
54
19
9847
30
51
9
2031167728
41
49
35
39
17
8743
28
44
7
21611752
26
65
15
9964
24
35
5
13364
13
69
3
13676
11
60
1
13447
22
8722
48
65
2
12159
12
62
4
14256
21
86
6
1155819
45
39
23
57
8
2519859
37
39
14
15367
25
86
10
19161
27
7419
46
55
29
56
16
18
18
13654
39
82
31
132
33
131
47
Table 8. Crack spacing in the stabilized phase in the section between the forces.
Beam
Marking
Crack Spacing (mm)(srmExp − srm)/srmExp
(%)
(srmExp − srmV)/srmExp
(%)
(srmExp − srmD)/srmExp
(%)
(srmExp − srmEC)/srmExp
(%)
ExperimentallyCalculted From:
[52][41][53][54]
srmExpsrmsrmVsrmDsrmEC
A-150.187.069.669.3113.9−73.7−38.9−38.3−127.3
A-264.0−35.9−8.8−8.3−78.0
B-169.578.062.462.1110.5−12.210.210.6−59.0
B-273.1−6.714.615.0−51.2
C-161.473.058.458.2109.7−18.94.95.3−78.6
C-268.6−6.414.915.2−59.8
D-160.792.073.673.3122.4−51.6−21.3−20.7−101.6
D-268.1−35.1−8.1−7.6−79.7
G-142.371.056.856.6113.5−67.8−34.3−33.7−168.3
G-245.7−55.4−24.3−23.8−148.3
F-155.880.0114.8−43.4−105.7
F-278.5−1.9−46.2
H-149.670.064.263.9110.5−41.1−29.4−28.8−122.8
H-254.3−28.9−18.2−17.7−103.5
I-155.674.067.867.5112.2−33.1−21.9−21.4−101.8
I-249.2−50.4−37.8−37.2−128.0
J-148.980.073.373.0114.8−63.6−49.9−49.3−134.7
J-255.2−44.9−32.8−32.2−107.9
K-159.591.083.483.1120.7−52.9−40.2−39.7−102.9
K-262.1−46.5−34.3−33.8−94.4
s r m D = 50 m m + 0.25 · k 1 · k 2 · Φ ρ r [ 52 ] · 50 L f d f [ 41 ] · 1 V f where
k1, k2, ρr, φ coefficients. cross-sectional area ratio and bar diameter, respectively, acc. [52]
Lf, df—fiber length and diameter
Vf—volume of steel fiber in the mixture
s r m E C = k 3 · c + k 1 · k 2 · k 4 · Φ ρ p , e f f [54]where
k1, k2, k3, k4—coefficients acc. [54]
c—cover to the reinforcement
ρp,eff—effective cross-sectional area ratio
φ—bar diameter
Table 9. Maximum crack width of tested beams at the utility moment.
Beams
Marking
MExp/MmaxCrack Width wk (mm)(wkExp − wk)/wkExp
(%)
(wkExp − wkV)/wkExp
(%)
(wkExp − wkD)/wkExp
(%)
(wkExp − wkEC)/wkExp
(%)
ExperimentallyCalculted From:
[52][41][53][54]
wkExpwkwkVwkDwkEC
A-10.620.090.180.140.120.12−100.0−55.6−33.3−33.33
A-20.560.12−50.0−16.70.00.00
B-10.630.140.170.140.130.14−21.40.07.10.00
B-20.610.14−21.40.07.10.00
C-10.570.100.140.110.100.15−40.0−10.00.0−50.00
C-20.580.140.021.428.6−7.14
D-10.610.100.210.170.150.14−110.0−70.0−50.0−40.00
D-20.620.10−110.0−70.0−50.0−40.00
F-10.660.140.170.15−21.4−7.14
F-20.660.12−41.7−25.00
G-10.570.040.150.120.110.12−275.0−200.0−175.0−200.00
G-20.600.09−66.7−33.3−22.2−33.33
H-10.570.080.150.140.130.12−87.5−75.0−62.5−50.00
H-20.560.09−66.7−55.6−44.4−33.33
I-10.590.090.150.140.120.15−66.7−55.6−33.3−66.67
I-20.590.07−114.3−100.0−71.4−114.29
J-10.630.120.180.170.150.16−50.0−41.7−25.0−33.33
J-20.670.11−63.6−54.5−36.4−45.45
K-10.590.100.220.200.180.14−120.0−100.0−80.0−40.00
K-20.610.12−83.3−66.7−50.0−16.67
Average error (%)−75.5−54.6−38.4−41.78
Standard deviation (%)58.549.845.154.8
Confidence interval α = 0.05 (%)−102.9 ÷ −48.1−79.4 ÷ −29.9−60.8 ÷ −15.9−64.3÷ −19.2
Length of the Interval (%)54.849.544.945.1
MEks—bending moment corresponding to the utility load, Mmax—bending moment corresponding to the ultimate load.
Disclaimer/Publisher’s Note: The statements, opinions and data contained in all publications are solely those of the individual author(s) and contributor(s) and not of MDPI and/or the editor(s). MDPI and/or the editor(s) disclaim responsibility for any injury to people or property resulting from any ideas, methods, instructions or products referred to in the content.

