Abstract
Arterial stiffness (AS) is a well-established predictor of cardiovascular events, including myocardial infarction and stroke. One of the most recognized methods for assessing AS is through arterial pulse wave velocity (aPWV), which provides valuable clinical insights into vascular health. However, its measurement typically requires specialized equipment, making it inaccessible in primary healthcare centers and low-resource settings. In this study, we developed and validated different machine learning models to estimate aPWV using common clinical markers routinely collected in standard medical examinations. Thus, we trained five regression models: Linear Regression, Polynomial Regression (PR), Gradient Boosting Regression, Support Vector Regression, and Neural Networks (NNs) on the EVasCu dataset, a cohort of apparently healthy individuals. A 10-fold cross-validation demonstrated that PR and NN achieved the highest predictive performance, effectively capturing nonlinear relationships in the data. External validation on two independent datasets, VascuNET (a healthy population) and ExIC-FEp (a cohort of cardiopathic patients), confirmed the robustness of PR and NN () across different vascular conditions. These results indicate that by using easily accessible clinical variables and AI-driven insights, it is possible to develop a cost-effective tool for aPWV estimation, enabling early cardiovascular risk stratification in underserved and rural areas where specialized AS measurement devices are unavailable.
1. Introduction
Arterial stiffness (AS) is increasingly being recognized as a high-risk marker for adverse cardiovascular events, as it indicates the loss of arterial wall elasticity and serves as a key indicator of vascular health [1]. Deterioration in arterial flexibility is linked with the risk of cardiovascular diseases, and it also impacts systemic circulation and the efficient nutrient exchange between the bloodstream and organs [2]. The primary causes of increased AS include aging, hypertension, and metabolic disorders, all of which contribute to structural changes in the arterial wall [3]. As a result, AS measurement plays a crucial role in the early identification of individuals at a high cardiovascular risk, enabling timely intervention and personalized treatment strategies.
The most widely used technique for assessing AS is through the measurement of pulse wave velocity (PWV), which evaluates the transit time of blood flow between two arteries. The European standard for assessing this parameter is the carotid–femoral PWV (cfPWV) [4], and the gold standard for measuring cfPWV is via applanation tonometry using a SphygmoCor system [5]. However, achieving precise measurements with the SphygmoCor system demands considerable expertise. Indeed, the procedure involves locating the carotid and femoral arteries, necessitating specialized staff, and becoming unsuitable for routine patient screenings in daily healthcare centers. Moreover, it is time-consuming and relatively invasive, as it includes measurements at the groin and requires the calculation of distances between the carotid and femoral sites. Consequently, measurements with the SphygmoCor® system (CardieX Limited, Sydney, Australia) are prone to errors and inaccuracies, especially in determining the path length between the carotid and femoral sites [6].
An accepted alternative to applanation tonometry for indirectly analyzing the cfPWV is the use of oscillometric methods, which are measured directly on the arm. These methods estimate aortic PWV (aPWV), which correlates well with cfPWV, providing valuable insights into central arterial stiffness [7]. An oscillometric measurement involves a non-invasive technique that is potentially easier and faster to use in daily clinical practice. As a semi-automatic method, it does not require specialized staff for its operation or the precise localization of arteries for measurement. Essentially, the oscillometric method applies pressure on the arm to nearly completely obstruct blood flow, allowing for minimal blood passage. At this point, the oscillations caused by arterial pulsations are detected by an integrated pressure sensor. These oscillations are then processed using proprietary algorithms to estimate aPWV and other hemodynamic parameters. The Mobil-O-Graph® (MOG; IEM GmbH, Aachen, Germany) is one of the most widely used oscillometric devices for estimating aPWV in both clinical and research settings. While it is not considered the gold standard, previous comparative studies have reported a moderate correlation with cfPWV, supporting its use as a pragmatic surrogate method [8]. Moreover, MOG has been compared with other methodologies, which evaluate the AS, including cardiac resonance [9] or intra-aortic catheter measurements [10], among others.
The MOG device could be extremely valuable in daily screening environments, potentially enabling the early identification of patients at cardiovascular risk. However, the high cost of these specific devices can pose a challenge for their implementation in primary care, especially in settings where access to specialized equipment is limited, such as depopulated areas or developing regions. Furthermore, these devices require regular calibration and maintenance to ensure measurement accuracy, which adds to the overall operational cost and complexity. In this context, predictive models for PWV, based on easily obtainable clinical variables, could offer a more cost-effective and accessible alternative, providing valuable insights without the need for specialized equipment. Indeed, owing to advances in artificial intelligence (AI) algorithm modeling, it is now possible to identify complex patterns in the data that could result in an approximated estimation of PWV values.
However, very few studies have estimated or inferred PWV through other peripheral variables. For instance, Tavallali et al. [6] proposed a regression model based on neural networks to estimate cfPWV by analyzing the carotid waveform and using parameters extracted from the intrinsic frequency, as well as other parameters such as blood pressure, mean carotid shape factor, age, and others. However, this method requires central pressure wave data, the carotid pressure wave, as well as other clinical parameters. Similarly, Liu et al. [11] estimated aPWV by decomposing the central aortic pressure waveform, which was derived from radial pressure waveforms. This method, while innovative, also relies on the accurate detection of waveform inflection points and requires sophisticated signal processing techniques. Huttunen et al. (2019) [12] also estimated aPWV using the pulse transit time derived from photoplethysmography signals and a cardiovascular simulator to generate virtual subjects for training a Gaussian process regressor. While this approach demonstrated high accuracy, it depended on simulated data and a complex signal analysis. Other studies, such as the one published by Jin et al. [5], estimated cfPWV using pulse pressure signals from the radial artery with recurrent neural networks and Gaussian regression. Additionally, Vargas et al. [13] proposed a methodology for estimating cfPWV by analyzing peripheral pulse signals through spectrograms. Despite their potential to estimate cfPWV from peripheral sites, these methodologies rely on the measurement and analysis of pulse signals, which are prone to measurement errors and are susceptible to noise.
To the best of our knowledge, no studies have aimed to estimate aPWV exclusively from routine clinical variables, such as blood pressure, anthropometric measurements, and metabolic markers, without relying on the analysis of biosignals or waveform-derived features that typically require complex signal processing or specialized equipment. Our hypothesis is that aPWV could be reliably estimated using only data commonly collected during routine medical check-ups, which would make the approach particularly suitable for primary care settings and low-resource environments. Therefore, this study aimed to explore the feasibility of developing a machine learning-based predictive model for aPWV estimation using these clinical variables. Such a model could be easily implemented in any general medical center and, if integrated into a software tool, could offer a practical and accessible solution for early vascular risk stratification, especially in underserved regions lacking specialized infrastructure or personnel.
Therefore, this study specifically addresses the following research questions:
- Can aPWV be accurately predicted using only routine clinical variables without the need for biosignal analysis?
- Which machine learning models offer the best predictive performance for this task under both internal and external validations?
- What are the most relevant clinical features for estimating aPWV, and how consistent are their contributions across models?
And the expected contributions are as follows:
- Development of a non-invasive, data-driven system for aPWV prediction using only clinical variables routinely collected in primary care, trained and evaluated entirely on prospectively collected real-world data.
- Comprehensive evaluation and comparison of different machine learning models using internal cross-validation and two external validation cohorts.
- Proposal of a clinically viable and cost-effective tool for early cardiovascular risk stratification in low-resource settings.
2. Materials and Methods
2.1. The Proposed Method
A structured methodology was adopted in this study, consisting of several key stages, which are summarized in Figure 1. First, data from three independent datasets—EVasCu, VascuNET, and ExIC-FEp—were collected. In the preprocessing stage, missing values were imputed using the median strategy, and all variables were normalized using Z-score standardization. To identify the most relevant predictors of aPWV, feature importance was assessed through both a permutation-based method using Random Forest models and a SHapley Additive exPlanation (SHAP) analysis [14]. The final set of selected features was then used to train and evaluate a set of five machine learning models: Linear Regression (LR), Polynomial Regression (PR), Gradient Boosting Regression (BR), Support Vector Regression (SVR), and Neural Networks (NNs).
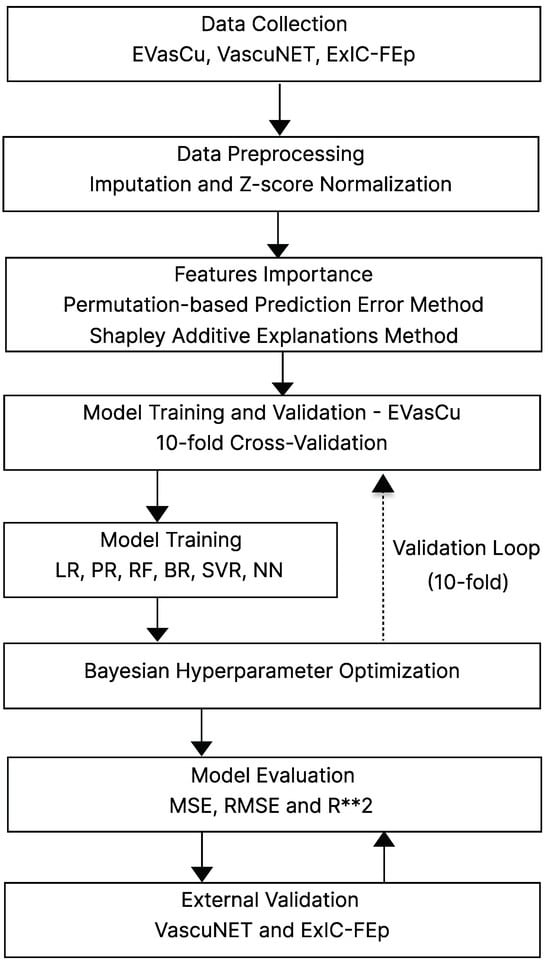
Figure 1.
General outline of the stages within the methodology. Abbreviations: LR = Linear Regression, PR = Polynomial Regression, BR = Boosted Regression (Gradient Boosting), SVR = Support Vector Regression, NN = Neural Network, MSE = Mean Squared Error, RMSE = Root Mean Squared Error, R**2 = = Coefficient of Determination.
Model development followed a 10-fold cross-validation strategy on the EVasCu dataset, using Bayesian optimization to fine-tune the hyperparameters. Model performance was evaluated using standard metrics such as Mean Squared Error (MSE), Root Mean Squared Error (RMSE), and the Coefficient of Determination (). Finally, to ensure the generalizability of the models, external validation was performed using the VascuNET and ExIC-FEp datasets, thereby assessing predictive performance on unseen populations with varying cardiovascular risk profiles.
2.2. Study Population
Three different datasets were utilized in this study. The first two datasets correspond to the EVasCu [15] and VascuNET [16] studies, which are cross-sectional studies that were conducted in Cuenca, Spain, to evaluate vascular health in apparently healthy populations. While both studies shared a common goal, they were carried out in different periods and with distinct participant cohorts. Thus, the EVasCu study was conducted between October and December 2022, while VascuNET was carried out between March and November 2024. Additionally, the recruitment strategies and geographic distribution of participants varied between studies, further contributing to sample diversity. Both studies followed the Strengthening the Reporting of Observational Studies in Epidemiology (STROBE) Statement guidelines for reporting observational studies [17].
The third dataset corresponds to the ExIC-FEp Study [18], which includes both healthy control subjects and patients diagnosed with heart failure with preserved ejection fraction. The recruitment of these patients was carried out in the Cuenca I, II, and III primary health centers, as well as in the cardiology and internal medicine departments of the Hospital Virgen de la Luz, part of the Castilla-La Mancha Health Service (SESCAM), between 2023 and 2024.
It is worth noting that all datasets were collected directly by the research team through clinical fieldwork conducted in real healthcare settings, and the research protocol of this study was approved by the Clinical Research Ethics Committee of the Cuenca Health Area (EVasCu (REG: 2022/PI2022), VascuNET (REG: 2023/PI1823), and ExIC-FEp (REG: 2022/PI2122)). Written informed consent to participate was obtained from all subjects included in the study. All procedures performed in this study were in accordance with the Declaration of Helsinki and its later amendments or comparable ethical standards for experiments involving humans [19].
Table 1 provides a summary of the key demographic characteristics of the datasets used in this study, including the total number of participants, sex distribution, and age statistics (mean and standard deviation). Additionally, t-tests were conducted to evaluate differences in gender distributions across datasets.

Table 1.
Summary statistics of the datasets used in this study.
2.3. Data Collection
A comprehensive set of baseline measurements was performed on all participants, regardless of the study of origin. Thus, a total of 13 variables potentially related to arterial stiffness were measured. Age, gender, and smoking status were obtained directly from participants by healthcare professionals during structured clinical interviews. Smoking status was subsequently categorized into five distinct groups: current smoker, former smoker (quit within the last year), former smoker (quit within 1–5 years), former smoker (quit more than 5 years ago), and non-smoker. Furthermore, measurements of weight, height, and waist circumference (WC) were taken twice using the appropriate equipment, with averages used for analysis. Finally, the body mass index was calculated by dividing the weight in kilograms by the square of the height in meters (kg/m2).
Blood pressure measurements were performed in a tranquil environment after a rest period of five minutes using the Omron® M5-I monitor (Omron Healthcare UK Ltd., Milton Keynes, UK), with the appropriate cuff size chosen based on the participant’s arm circumference. Systolic and diastolic blood pressures (SBP and DBP) were determined by averaging two separate readings taken five minutes apart. Additionally, pulse pressure (PP) was calculated as the difference between the SBP and DBP averaged pressures. Resting heart rate (RHR) was also recorded during this assessment. Furthermore, glycated hemoglobin (HbA1c) was measured as a marker of arterial inflammatory alterations using the Roche Diagnostics® Cobas 8000 system (Roche Diagnostics GmbH, Mannheim, Germany). To assess arterial oxidative stress, advanced glycation end products (AGEs) were quantified through skin autofluorescence using the AGE Reader® device (Diagnoptics Technologies B.V., Groningen, The Netherlands).
The primary outcome variable aPWV was measured using the Mobil-O-Graph® (IEM GmbH, Aachen, Germany) oscillometric device. In this study, two aPWV measurements were taken five minutes apart, and their average was used as the final value. To ensure accuracy, these measurements were performed in a quiet setting after a five-minute rest period. The appropriate cuff size was used, selected based on the circumference of the participant’s arm or lower limb.
It is important to note that although the Mobil-O-Graph® is capable of simultaneously measuring blood pressure parameters, in this study, it was used exclusively for aPWV estimation. All blood pressure values (SBP, DBP, and PP) included in the models were obtained using the Omron® M5-I monitor. This decision reflects the aim of developing a predictive tool tailored for real-world primary care scenarios, where conventional blood pressure monitors are routinely available, but advanced equipment such as the Mobil-O-Graph® is often inaccessible, particularly in low-resource or underserved healthcare settings.
2.4. Data Preprocessing and Variable Selection
The EVasCu dataset comprising 389 samples was utilized to train the machine learning regression models. In the rare instances of missing data (less than 0.5%), values were imputed using the median of the corresponding variable to maintain dataset integrity. Additionally, to address the disparity in units and magnitudes among the different variables, a z-score normalization was applied, thus ensuring that each feature contributed equally to the analysis. This normalization mitigates the influence of outliers and enhances the algorithm’s convergence speed during training.
Next, the assessment of variable importance was conducted using a Random Forest model, which is recognized for its ability to handle large datasets and capture nonlinear interactions among variables [20]. To determine the importance of each feature, a permutation-based method was employed. This method involves randomly permuting the values of each variable and observing the impact on model performance. Specifically, after a variable is permuted, the model is re-evaluated, and the increase in Mean Squared Error (MSE), compared to the original model without permutation, is measured. To this respect, the MSE can be mathematically defined as follows:
where n is the number of observations, is the actual value of the observation, and is the predicted value from the model.
The importance of a feature is then quantified as the average increase in prediction error () that results when that feature is altered. This increase in error indicates the model’s reliance on the variable for making accurate predictions and can be mathematically defined as follows:
where is the MSE of the model predictions using the original, unpermuted data and is the MSE obtained after permuting the values of a particular feature, thus simulating the loss of information provided by that feature. Finally, the difference represents how much the prediction error increases when the model is deprived of the information provided by the specific feature. A larger increase signifies a greater importance of the feature for the model’s accuracy.
Finally, to complement the feature selection process and improve model interpretability, a SHAP-based analysis was performed using the trained Random Forest model. SHAP is a game-theoretic approach that assigns each feature a contribution value for individual predictions based on Shapley values from cooperative game theory [14]. Unlike traditional global importance metrics, SHAP provides both global and local interpretability, allowing a detailed understanding of how each variable influences the model’s output on a per-subject basis [14]. In this study, the global importance of each feature was computed as the mean absolute SHAP value across all observations, effectively reflecting its average contribution to the prediction of aPWV.
2.5. Training and Validation of the ML-Based Algorithms
In our study, several machine learning models were trained to evaluate and compare their ability to accurately predict the target variable. The models implemented included Linear Regression (LR), Polynomial Regression (PR, second-degree), Boosting-based ensemble regressors (BR), Support Vector Regression (SVR), and Neural Network-based regression models (NNs). Given the significant impact of hyperparameter tuning on the performance of models such as SVR and NN, as well as the associated costs, Bayesian optimization algorithm was employed. This approach constructs a probabilistic model of the objective function, allowing for the selection of the most promising parameters. Each iteration selects a hyperparameter that optimizes a selection criterion based on the trade-off between exploration (testing new areas of the hyperparameter space) and exploitation (refining hyperparameters that already show promise). The ultimate goal is to minimize the objective function or cost function, enhancing model accuracy and efficiency.
The optimization and training of our machine learning models were conducted under a 10-fold cross-validation scheme to ensure robustness and generalizability. In this approach, the dataset was divided into ten equal folds, where in each iteration, nine folds were used for training, and the remaining fold served as the test set for internal validation. This process was repeated ten times, ensuring that each fold was used exactly once as the validation set, allowing the models to be trained and evaluated across all available data.
To assess overall model performance, the Mean Squared Error (MSE) and Root Mean Squared Error (RMSE) were computed for each fold, and their average across all iterations was used as the final performance metric. Additionally, the model fit was evaluated using the Coefficient of Determination (), which quantifies the proportion of variance in the dependent variable explained by the independent variables. The final value was obtained as the average across all folds, ensuring a reliable estimate of the model’s explanatory power. An closer to 1 indicates a stronger predictive capacity and a better model fit.
Finally, in adherence to the guidelines set by the Transparent Reporting of a Multivariate Prediction Model for Individual Prognosis or Diagnosis (TRIPOD) initiative [21], the VascuNET and ExIC-FEp datasets were utilized for the external validation of the developed models. These datasets are completely separate from the data used in model training, ensuring that the validation process tests the models on entirely unseen data. To prevent data leakage and maintain the integrity of the evaluation, all variables in the validation datasets were normalized using the Z-score transformation parameters (mean and standard deviation) computed from the training dataset, thus ensuring that the external validation remains unbiased and reflects the true generalization ability of the models.
3. Results
3.1. Feature Selection and Importance
The analysis of feature importance is depicted in Table 2. As can be observed, age is the most significant predictor of aPWV and a critical factor in arterial stiffness, showing the highest mean increase in MSE. Other important variables include SBP and DBP variables, which also show notable influences on the model’s predictive accuracy. Furthermore, anthropometric parameters such as height and WC, although featuring lower in the ranking, still contribute to the model, suggesting their relevance in predicting arterial characteristics. However, it can be appreciated that while the positive increments in MSE for these features affirm their utility, the relatively high standard deviations across the results indicate considerable variability in their impact across different iterations of cross-validation.
Table 2.
Feature importance based on permutation-based method using a Random Forest model.
To complement the MSE-based ranking of feature importance, a SHAP (SHapley Additive exPlanations) analysis was also performed on the trained Random Forest model. Figure 2 shows the global SHAP summary plot, where features are ranked according to their average contribution to the model predictions across all samples. As illustrated, age and Systolic Blood Pressure (SBP) are the most influential features, displaying the widest spread in SHAP values and consistently contributing to increased predicted aPWV. These are followed by DBP, BMI, and Waist Circumference, which also show moderate impact. In contrast, variables such as HbA1c, AGEs, Resting Heart Rate (RHR), Sex, and Tobacco Quantity show minimal influence, with SHAP values clustered around zero across individuals.
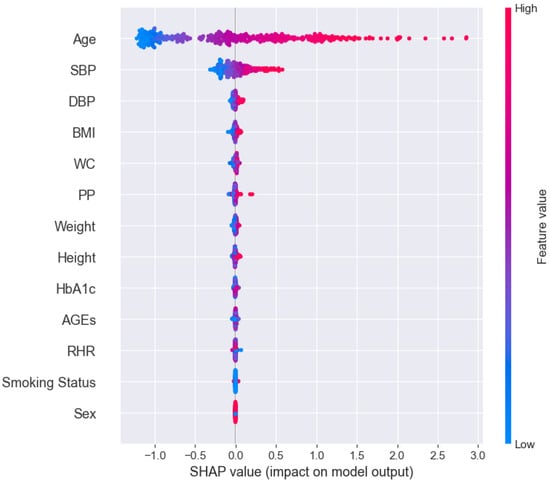
Figure 2.
Global SHAP summary plot displaying feature importance based on the average absolute contribution of each variable to model predictions. Variables are ranked from top to bottom in order of decreasing importance.
In the development of the following predictive models, the initial set of 13 variables was reduced to the eight most relevant features based on their importance in both permutation-based MSE analysis and the SHAP interpretability framework. The retained variables were as follows: age, SBP, DBP, PP, Height, WC, BMI, and Weight, which consistently showed the highest contribution to model performance across both methodologies. It is important to highlight that PP and BMI are derived variables, rather than direct measurements. Therefore, the core of the model is based on six directly measurable physiological parameters, which are routinely collected in standard clinical practice.
Additionally, Sex and Smoking Status were excluded from the final selection due to their negligible impact on the model’s predictive performance, as shown in both the MSE and SHAP analyses. Including variables with low statistical relevance could introduce unnecessary noise rather than improving accuracy. Furthermore, their categorical nature differs from the rest of the selected variables, which are all continuous, possibly complicating model optimization and compatibility with certain machine learning algorithms.
Similarly, HbA1c, AGEs, and RHR were also excluded. Despite being continuous, these variables exhibited very limited predictive contribution and would require additional biochemical or specialized assessments. Including them would increase the model’s operational complexity and reduce its feasibility for widespread use in routine clinical settings. Their exclusion helps preserve the model’s simplicity and accessibility without compromising predictive accuracy.
3.2. Internal Validation and Model Performance
Table 3 presents the performance of machine learning models during internal cross-validation, illustrating their efficacy in predicting aPWV. On the one hand, LR exhibited an of 0.92 with an MSE of 0.1407, demonstrating its ability to capture linear relationships within the dataset. However, PR, incorporating second-degree terms, achieved the best overall performance, significantly improving the fit with an of 0.95 and the lowest MSE (0.0806). This highlights the advantage of capturing nonlinear relationships in the data, suggesting that arterial stiffness estimation benefits from a more flexible regression approach.
Table 3.
Performance metrics (MSE, RMSE, ) and hyperparameters used for each model using exclusively the most relevant features.
Furthermore, the NN model configured with three hidden layers (13, 96, 23) and a regulation parameter of 0.2369 demonstrated a strong balance between model flexibility and accuracy, achieving an of 0.95 and an MSE of 0.0950. These results highlight the trade-offs between model complexity and predictive power, with PR and NN emerging as the most effective approaches based on the validation metrics. Finally, both SVR and BR achieved similar performance levels, with values of 0.91 and 0.92, respectively. Their predictive accuracy remained slightly below that of NN and PR, which demonstrated superior fits to the data.
Figure 3 shows the fit of the models on the training data using a 10-fold cross-validation scheme. The scatter plots illustrate the relationship between the predicted aPWV values (y-axis) and the true aPWV values (x-axis). The high concordance between the observation points and the perfect prediction line indicates strong model performance, as reflected by an above 0.90, meaning that over 90% of the variability in aPWV is explained by the models. However, it is noticeable that, since the training dataset consists of apparently healthy patients, there is a higher concentration of points at lower aPWV values, while predictions for higher aPWV values tend to be less precise. This effect is particularly evident in models like LR, where discrepancies appear more pronounced at the upper end of the distribution.
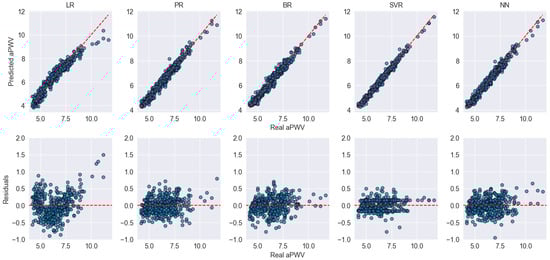
Figure 3.
Scatter and residual plots for model performance during internal cross-validation. The top row shows the predicted vs. actual aPWV values, while the bottom row displays the residuals for each model. Blue dots represent individual data points. The red dashed lines indicate the identity line (top row) and zero-error line (bottom row), serving as references for ideal prediction and perfect residuals, respectively.
3.3. External Validation and Generalization Performance
Table 4 presents the external validation performance on the VascuNET and ExIC-FEp datasets. The results on VascuNET, while generally aligned with the internal cross-validation, show a moderate decline in predictive performance across most models. However, both PR and NN maintained strong predictive capabilities, achieving values of 0.95 and 0.94, respectively, with relatively low MSE values. In contrast, LR, BR, and SVR experienced a more pronounced drop in performance, suggesting that these models may be more sensitive to data shifts even within a healthy population. For instance, although both EVasCu and VascuNET include apparently healthy individuals, slight differences in the average age or clinical profiles may introduce variations in the data distribution. Such shifts can challenge certain models’ ability to generalize effectively, which may explain the decreased performance observed in these cases.
Table 4.
Performance metrics of the models during external validation on the VascuNET and ExIC-FEp datasets.
Interestingly, when evaluated on the ExIC-FEp dataset, which includes older patients with cardiovascular disease and higher aPWV values, a further decline in performance was observed across all models. Despite this, PR remained the best-performing model, achieving an of 0.90 and an MSE of 0.3332, followed closely by NN (, MSE = 0.3388). On the other hand, SVR exhibited a drastic drop in predictive performance, with an R2 of −0.21 and an MSE of 4.08, indicating that it struggled significantly with this pathological dataset.
Figure 4 displays the fit and residual analysis of the different models evaluated on the VascuNET dataset. Overall, PR and NN exhibit the best performance, with predicted values closely aligned along the identity line and minimal residual dispersion. In contrast, LR, BR, and SVR show clear deviations, particularly in the upper range of aPWV values, where systematic underestimation becomes evident for aPWV values above 10 m/s. This suggests that these models struggle to accurately capture arterial stiffness in individuals with higher vascular aging. Furthermore, the residual plots confirm these trends, as LR, BR, and SVR present increasing residual magnitudes for higher aPWV values, suggesting that these models struggle to generalize well in this range. On the other hand, PR and NN maintain more homogeneously distributed residuals around zero, indicating a more stable fit across the entire range of values.
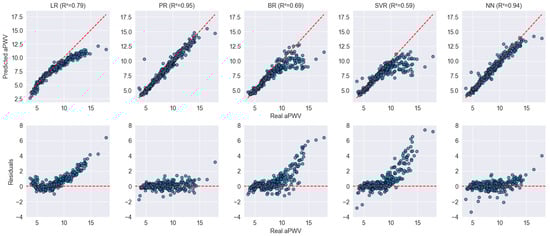
Figure 4.
Scatter and residual plots for model performance on the VascuNET dataset. The top row displays the predicted vs. real aPWV values for each model, while the bottom row shows the residuals, with an expected distribution centered around zero. Blue dots represent individual data points. The red dashed lines indicate the identity line (top row) and zero-error line (bottom row), serving as references for ideal prediction and perfect residuals, respectively.
Finally, Figure 5 further confirms these findings, highlighting the impact of arterial stiffness on model performance. Since the ExIC-FEp dataset includes patients with cardiovascular disease and markedly elevated AS, most models exhibit a considerable decrease in predictive accuracy. Notably, LR, BR, and SVR show clear limitations, struggling to adapt to the high PWV values present in this population. Their predictions deviate significantly from the expected trend, leading to high residual dispersion, particularly for PWV values above 10 m/s. In contrast, PR and NN maintain robust predictive performance, with values remaining above 0.90 and residuals distributed more homogeneously around zero.
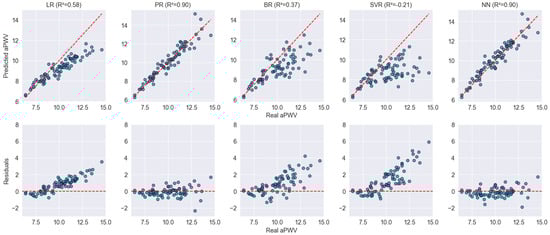
Figure 5.
Scatter and residual plots for model performance on the ExIC-FEp dataset. The top row displays the predicted vs. actual aPWV values for each model, while the bottom row shows the residuals, highlighting differences in prediction errors. Blue dots represent individual data points. The red dashed lines indicate the identity line (top row) and zero-error line (bottom row), serving as references for ideal prediction and perfect residuals, respectively.
4. Discussion
The cross-validation results demonstrated a strong model fit for all the proposed models, with PR and NN emerging as the top performers. PR’s superior performance can be attributed to its ability to explicitly model nonlinearities through polynomial terms, allowing it to capture subtle variations in AS more effectively. Similarly, NN may benefit from its hierarchical structure, which enables it to learn complex vascular aging patterns across multiple layers. These findings align with previous research emphasizing the advantages of nonlinear models in biomedical applications, particularly in the context of cardiovascular risk assessment [22,23].
Interestingly, although SVR is typically effective in handling high-dimensional data, it did not achieve the same level of accuracy as PR and NN. One possible explanation is that SVR, particularly with the RBF kernel, optimizes a margin around the data, which may be less effective when the underlying relationships are nonlinear but smooth. This limitation became especially evident in the ExIC-FEp dataset, where SVR experienced a drastic drop in predictive performance (), failing to adapt to extreme AS values. In contrast, PR and NN maintained strong predictive capabilities (), suggesting that models incorporating nonlinear transformations are better suited for predicting aPWV in both healthy and pathological populations. The relatively higher errors observed in SVR and boosting-based models indicate that, while these approaches may still generalize well, they likely require further kernel optimization or alternative feature engineering to enhance their adaptability to diverse patient profiles.
Table 5 shows a comparison between the current work and existing studies on PWV estimation. It is important to note that while each study employs its specific methodology, and, therefore, the results should be interpreted with caution, the performance in terms of adjustment is quite similar among them. Only the study by Jin, Weiwei et al. [5] seems to report a significantly lower adjustment. To this respect, the methodology proposed in this work achieves the lower RMSE, with a score of 0.58 m/s. This result is particularly noteworthy because, unlike the other studies that use internal validation methods such as K-fold cross-validation or hold-out validation, this work employed two different datasets for external validation, which were not used in the training phase. Consequently, this approach provides a clearer indication of the predictive model’s ability to generalize results, thus demonstrating its robustness and applicability to diverse patient populations.
Table 5.
Comparison of current work with existing studies on pulse wave velocity estimation.
It is also worth noting that very few studies have attempted to predict PWV, whether in its cfPWV or aPWV form. In this regard, the most direct comparison to this work would be with the method proposed by Huttunen, Janne M. J. et al. [12]. However, this study only reported the and not the RMSE or validation scheme. Additionally, it used synthetic training data, which could pose a problem in real-world scenarios where the variability and complexity of actual patient data might not be fully captured by synthetic datasets. Similarly, Liu et al. (2021) [11] estimated aPWV using waveform decomposition of central aortic pressure waveforms derived from radial pressure waveforms. This method achieved a relatively high of 0.88 and an RMSE of 0.63 m/s using a 5-fold cross-validation. However, it relies on advanced signal processing techniques, which can introduce complexity and potential sources of error, especially under conditions with noisy or imperfect signals.
Furthermore, the complexity of the analyses conducted in other studies is notable, as they all employed signal processing techniques. For example, Tavallali et al. used tonometric signals, while other studies utilized PPG (photoplethysmography) signals. Although these physiological signals have been proven effective for PWV prediction, they can contain noise, and their analysis or validation may require expert intervention. This complexity can introduce additional variability and potential sources of error in the prediction models. In contrast, the approach used in this study relies on clinical variables, which are typically more stable and easier to interpret. This difference underscores the potential advantage of this approach as it reduces the dependency on high-quality signal acquisition and expert analysis, making the model more accessible and potentially more reliable in diverse clinical settings.
In this context, the analysis identified age, SBP, DBP, WC, weight, and height as the six most influential variables. Age and blood pressure are well-documented predictors of vascular health, reflecting their pivotal role in cardiovascular dynamics [24]. Indeed, it has been reported that AS and blood pressure increase with age and are independent predictors of cardiovascular events [25]. On the other hand, WC and weight provide crucial insights into body composition, an important factor in vascular stiffness and overall cardiovascular risk [26]. WC provides crucial insights into body fat distribution, which is a known factor influencing vascular stiffness and overall cardiovascular risk [27].
Height, while less directly related to arterial stiffness, plays an important role when considered alongside weight in the calculation of BMI. To this respect, BMI has been shown to be a predictor of AS syndrome, as studies indicate that increasing BMI is positively associated with vascular aging and arterial rigidity [28]. Therefore, height acts as a normalizing factor in cardiovascular assessments, ensuring that body proportions are accurately accounted for when evaluating cardiovascular risk. This normalization is essential for the accurate interpretation of anthropometric data in relation to arterial health, reinforcing the inclusion of height as an important variable in our predictive model.
However, our results suggest that BMI may not provide consistent added value beyond its base components. While SHAP analysis indicated that BMI had a higher individualized predictive impact than weight or height alone, additional experiments in which BMI was removed from the model revealed only marginal differences in performance across most algorithms. Some models slightly improved (e.g., SVR and BR), others remained stable (e.g., PR), and a few experienced minimal declines (e.g., NN and LR). These findings indicate that the predictive information carried by BMI may already be accounted for by the inclusion of weight and height. Nonetheless, BMI was retained in the final model configuration because it may still hold specific relevance in particular subsets of the population, as denoted by the SHAP analysis, especially in future datasets with different demographic or clinical characteristics, despite demonstrating a limited overall impact across the full cohort analyzed in this study.
An important consideration when interpreting the results of this study lies in the composition of the training dataset. The model was primarily trained using data from the EVasCu cohort, which includes a large and balanced sample of apparently healthy individuals across a broad age range. While this provided a strong base for capturing patterns in the lower-to-mid aPWV spectrum, it may limit the model’s generalizability to patients with advanced AS or overt cardiovascular disease. To address this concern, external validation was conducted using the ExIC-FEp cohort, which includes patients diagnosed with heart failure with a preserved ejection fraction. The fact that the models, particularly PR and NN, maintained high predictive accuracy in this high-risk group supports the robustness and potential clinical utility of the approach and may also explain why other models exhibited a more pronounced drop in performance, likely due to their lower capacity to generalize to populations with clinical characteristics different from those seen during training.
To further explore the influence of the training population, alternative validation schemes were considered during the study. Specifically, an inverse validation setup was tested in which the models were trained on the combined VascuNET and ExIC-FEp datasets and validated on the EVasCu cohort. The results obtained in this configuration were comparable, with PR and NN again achieving the best performance (R2 = 0.95 and 0.91, respectively). Notably, other models such as LR, BR, and SVR also performed considerably better under this scheme than in the original external validation, suggesting that their previous drop in accuracy may have been due to limited generalization when applied to clinically distinct populations not represented in the training data, rather than due to poor model performance per se. However, under this scheme, the potential to externally validate the model on a clinically distinct population with cardiovascular impairments is lost, which limits the value of such a configuration for assessing generalization in high-risk clinical settings. For this reason, the original scheme, training on EVasCu and validating on VascuNET and ExIC-FEp, was retained in this work as the most informative and clinically meaningful approach, and it highlights the importance of future efforts to test the model on datasets including subjects with higher aPWV values and more severe vascular impairment.
Limitations
Despite the promising results, this study has some important limitations that should be acknowledged. First, although the aPWV values used as reference standard measurements were obtained using the Mobil-O-Graph®, it does not represent the gold standard for AS assessment, which is the cfPWV measured via applanation tonometry. This difference may introduce some degree of measurement bias and should be considered when interpreting the results. In this regard, different studies [29,30] emphasize that the methodologies used to assess PWV require validation in larger and more diverse populations, supporting the notion that further studies are needed to evaluate the clinical applicability of each device across different cardiovascular risk profiles. However, the use of the Mobil-O-Graph® was a deliberate methodological choice aligned with the study’s translational aims. Unlike cfPWV measurements obtained via applanation tonometry, which require trained operators and longer acquisition times, the Mobil-O-Graph® provides a non-invasive, automated, and operator-independent alternative that enables broader applicability in real-world clinical settings.
Second, the training data predominantly included individuals with aPWV values below 10 m/s, which is characteristic of apparently healthy populations. While the models were externally validated on the ExIC-FEp cohort, which includes patients with elevated AS due to cardiovascular conditions, additional validation on larger and more clinically representative cohorts, composed exclusively of patients with suspected or confirmed cardiovascular disease, will be necessary to confirm the model’s generalizability across the full spectrum of vascular risk.
5. Conclusions
This study demonstrates the feasibility of using machine learning models to estimate aPWV based on easily obtainable clinical variables. Among the models tested, Polynomial Regression achieved the highest prediction accuracy, with an of 0.95 and an RMSE of 0.58 m/s in external validation. This level of accuracy is comparable to existing methods that rely on complex physiological signal analysis, but with significant advantages in terms of simplicity and applicability in routine clinical practice. Moreover, the use of external validation with two distinct datasets enhances the generalizability of the model and its robustness and potential applicability across diverse patient populations, including those with high cardiovascular risk due to conditions such as heart failure.
The analysis identified age, SBP, DBP, WC, weight, and height as the most influential variables for predicting aPWV. These variables are routinely measured in clinical settings, making the proposed model both practical and cost-effective. By measuring these common clinical metrics, the model can facilitate an early detection of AS, aiding in the identification of individuals at high cardiovascular risk and enabling timely intervention. Unlike methods that require costly or specialized equipment, our proposed model offers a cost-effective and practical alternative for estimating aPWV using only routinely collected clinical variables. This makes it particularly suitable for routine check-ups and for implementation in underserved or remote areas where access to such devices may be limited.
Author Contributions
Conceptualization, I.C.-R. and A.S.-L.; methodology, A.M.-R. and J.P.; software, A.M.-R. and D.C.; validation, A.M.-R., D.C. and I.C.-R.; formal analysis, A.M.-R. and J.P.; resources, I.C.-R. and A.S.-L.; data curation, I.C.-R. and A.S.-L.; writing—original draft preparation, A.M.-R. and J.P.; writing—review and editing, A.M.-R.; visualization, A.M.-R., J.P. and D.C.; supervision, J.P. and D.C. All authors have read and agreed to the published version of the manuscript.
Funding
This research received financial support from several sources: the 42nd edition of the nursing award of the University Pontificia Comillas and Escuela de Enfermeria y Fisioterapia San Juan de Dios; Carvascare Research Group from the Universidad de Castilla-La Mancha (2023-GRIN-34459); PID2021-128525OB-I00 and TED2021-130935B-I00, funded by the Spanish Government in conjunction with the European Regional Development Fund (EU) jointly with SBPLY/21/180501/000186, SBPLY/21/180225/000080, and SBPLY/21/180501/000112 provided by the Junta de Comunidades de Castilla-La Mancha, Spain, and the European Regional Development Fund (EU); 2024-TRAN-36529 Vascular Applications and Software CompUting NETwork funded by the University of Castilla-La Mancha. Finally, João Pedrosa is supported by the Portuguese funding agency, FCT—Fundação para a Ciência e a Tecnologia, through application reference 2022.06138.CEECIND.
Institutional Review Board Statement
The study was conducted according to the guidelines of the Declaration of Helsinki, and approved by the Clinical Research Ethics Committee of the Cuenca Health Area EVasCu (REG: 2022/PI2022, approval date: 18 May 2022) VascuNET (REG: 2023/PI1823, approval date: 28 August 2023) and ExIC-FEp (REG: 2022/PI2122, approval date: 13 June 2022).
Informed Consent Statement
Written informed consent to participate was obtained from all subjects included in the study.
Data Availability Statement
The original contributions presented in this study are included in the article. Further inquiries can be directed to the corresponding author.
Conflicts of Interest
The authors declare no conflicts of interest.
References
- Boutouyrie, P.; Chowienczyk, P.; Humphrey, J.D.; Mitchell, G.F. Arterial Stiffness and Cardiovascular Risk in Hypertension. Circ. Res. 2021, 128, 864–886. [Google Scholar] [CrossRef] [PubMed]
- Shirwany, N.A.; Zou, M.H. Arterial stiffness: A brief review. Acta Pharmacol. Sin. 2010, 31, 1267–1276. [Google Scholar] [CrossRef]
- Sun, Z. Aging, arterial stiffness, and hypertension. Hypertension 2015, 65, 252–256. [Google Scholar] [CrossRef] [PubMed]
- Van Bortel, L.M.; Laurent, S.; Boutouyrie, P.; Chowienczyk, P.; Cruickshank, J.K.; De Backer, T.; Filipovsky, J.; Huybrechts, S.; Mattace-Raso, F.U.; Protogerou, A.D.; et al. Expert consensus document on the measurement of aortic stiffness in daily practice using carotid-femoral pulse wave velocity. J. Hypertens. 2012, 30, 445–448. [Google Scholar] [CrossRef]
- Jin, W.; Chowienczyk, P.; Alastruey, J. Estimating pulse wave velocity from the radial pressure wave using machine learning algorithms. PLoS ONE 2021, 16, e0245026. [Google Scholar] [CrossRef] [PubMed]
- Tavallali, P.; Razavi, M.; Pahlevan, N.M. Artificial Intelligence Estimation of Carotid-Femoral Pulse Wave Velocity using Carotid Waveform. Sci. Rep. 2018, 8, 1014. [Google Scholar] [CrossRef]
- Podolec, P.; Kopeć, G.; Podolec, J.; Wilkołek, P.; Krochin, M.; Rubiś, P.; Cwynar, M.; Grodzicki, T.; Żmudka, K.; Tracz, W. Aortic Pulse Wave Velocity and Carotid-Femoral Pulse Wave Velocity: Similarities and Discrepancies. Hypertens. Res. 2007, 30, 1151–1158. [Google Scholar] [CrossRef]
- Grillo, A.; Moretti, F.; Rovina, M.; Baldi, C.; Salvi, L.; Gao, L.; Scalise, F.; Sorropago, G.; Faini, A.; Millasseau, S.; et al. Non-Invasive Measurement of Aortic Pulse Wave Velocity: A Comparative Evaluation of Eight Devices. J. Hypertens. 2018, 36, e199. [Google Scholar] [CrossRef]
- Feistritzer, H.J.; Reinstadler, S.J.; Klug, G.; Kremser, C.; Seidner, B.; Esterhammer, R.; Schocke, M.F.; Franz, W.M.; Metzler, B. Comparison of an oscillometric method with cardiac magnetic resonance for the analysis of aortic pulse wave velocity. PLoS ONE 2015, 10, e0116862. [Google Scholar] [CrossRef]
- Hametner, B.; Wassertheurer, S.; Kropf, J.; Mayer, C.; Eber, B.; Weber, T. Oscillometric estimation of aortic pulse wave velocity: Comparison with intra-aortic catheter measurements. Blood Press. Monit. 2013, 18, 173–176. [Google Scholar] [CrossRef]
- Liu, W.; Yao, Y.; Yang, J.; Song, D.; Zhang, Y.; Sun, G.; Xu, L.; Avolio, A. Estimation of aortic pulse wave velocity based on waveform decomposition of central aortic pressure waveform. Physiol. Meas. 2021, 42, 105001. [Google Scholar] [CrossRef] [PubMed]
- Huttunen, J.M.J.; Kärkkäinen, L.; Lindholm, H. Pulse transit time estimation of aortic pulse wave velocity and blood pressure using machine learning and simulated training data. PLoS Comput. Biol. 2019, 15, e1007259. [Google Scholar] [CrossRef]
- Vargas, J.M.; Bahloul, M.A.; Laleg-Kirati, T.M. A learning-based image processing approach for pulse wave velocity estimation using spectrogram from peripheral pulse wave signals: An in silico study. Front. Physiol. 2023, 14, 1100570. [Google Scholar] [CrossRef]
- Lundberg, S.M.; Lee, S.I. A Unified Approach to Interpreting Model Predictions. Adv. Neural Inf. Process. Syst. 2017, 30, 4765–4774. [Google Scholar]
- Saz-Lara, A.; Cavero-Redondo, I.; Pascual-Morena, C.; Martínez-García, I.; Rodríguez-Gutiérrez, E.; Lucerón-Lucas-Torres, M.; Bizzozero-Peroni, B.; Moreno-Herráiz, N.; Martínez-Rodrigo, A. Early vascular aging as an index of cardiovascular risk in healthy adults: Confirmatory factor analysis from the EVasCu study. Cardiovasc. Diabetol. 2023, 22, 209. [Google Scholar] [CrossRef] [PubMed]
- VascuNET Study. Ongoing Cross-Sectional Study on Vascular Health in Healthy Adults. Coordinated by Universidad de Castilla-La Mancha (UCLM), Cuenca, Spain. 2024. [Google Scholar]
- Von Elm, E.; Altman, D.G.; Egger, M.; Pocock, S.J.; Gøtzsche, P.C.; Venbroucke, J.P. Strengthening the Reporting of Observational Studies in Epidemiology (STROBE) statement: Guidelines for reporting observational studies. BMJ 2007, 335, 806–808. [Google Scholar] [CrossRef]
- Cavero-Redondo, I.; Saz-Lara, A.; Martínez-García, I.; Bizzozero-Peroni, B.; Díaz-Goñi, V.; Díez-Fernández, A.; Moreno-Herráiz, N.; Pascual-Morena, C. Comparative Effect of Two Types of Physical Exercise for the Improvement of Exercise Capacity, Diastolic Function, Endothelial Function and Arterial Stiffness in Participants with Heart Failure with Preserved Ejection Fraction (ExIC-FEp Study): Protocol for a Randomized Controlled Trial. J. Clin. Med. 2023, 12, 3535. [Google Scholar] [CrossRef] [PubMed]
- World Medical Association. World Medical Association Declaration of Helsinki: Ethical principles for medical research involving human subjects. JAMA 2013, 310, 2191–2194. [Google Scholar] [CrossRef]
- Genuer, R.; Poggi, J.M.; Tuleau-Malot, C.; Villa-Vialaneix, N. Random Forests for Big Data. Big Data Res. 2015, 9, 28–46. [Google Scholar] [CrossRef]
- Collins, G.S.; Reitsma, J.B.; Altman, D.G.; Moons, K.G. Transparent reporting of a multivariable prediction model for individual prognosis or diagnosis (TRIPOD): The TRIPOD Statement. BMC Med. 2015, 131, 211–219. [Google Scholar] [CrossRef]
- Simonetto, C.; Heier, M.; Rospleszcz, S.; Meisinger, C.; Then, C.; Seißler, J.; Peters, A.; Kaiser, J.C. Risk for cardiovascular events responds nonlinearly to carotid intima-media thickness in the KORA F4 study. Atherosclerosis 2020, 296, 32–39. [Google Scholar] [CrossRef] [PubMed]
- Wessel, N.; Malberg, H.; Bauernschmitt, R.; Kurths, J. Nonlinear Methods of Cardiovascular Physics and their Clinical Applicability. Int. J. Bifurc. Chaos 2007, 17, 3325–3371. [Google Scholar] [CrossRef]
- Prospective Studies Collaboration. Age-specific relevance of usual blood pressure to vascular mortality: A meta-analysis of individual data for one million adults in 61 prospective studies. Lancet 2002, 360, 1903–1913. [Google Scholar] [CrossRef] [PubMed]
- Nowak, K.L.; Rossman, M.J.; Chonchol, M.; Seals, D.R. Strategies for Achieving Healthy Vascular Aging. Hypertension 2018, 71, 389–402. [Google Scholar] [CrossRef]
- Huxley, R.; Mendis, S.; Zheleznyakov, E.; Reddy, S.; Chan, J. Body mass index, waist circumference and waist:hip ratio as predictors of cardiovascular risk—A review of the literature. Eur. J. Clin. Nutr. 2010, 64, 16–22. [Google Scholar] [CrossRef]
- Zhu, S.; Wang, Z.; Heshka, S.; Heo, M.; Faith, M.S.; Heymsfield, S.B. Waist circumference and obesity-associated risk factors among whites in the third National Health and Nutrition Examination Survey: Clinical action thresholds. Am. J. Clin. Nutr. 2002, 76, 743–749. [Google Scholar] [CrossRef]
- Wang, Y.; Wang, J.; Zheng, X.W.; Du, M.F.; Zhang, X.; Chu, C.; Wang, D.; Liao, Y.Y.; Ma, Q.; Jia, H.; et al. Early-Life Cardiovascular Risk Factor Trajectories and Vascular Aging in Midlife: A 30-Year Prospective Cohort Study. Hypertension 2023, 80, 1057–1066. [Google Scholar] [CrossRef] [PubMed]
- Marta Maria, N.; Chlabicz, S. Evaluation of Arterial Stiffness Parameters Measurement with Noninvasive Methods—A Systematic Review. Cardiol. Res. Pract. 2024, 2024, 4944517. [Google Scholar] [CrossRef]
- Milan, A.; Zocaro, G.; Leone, D.; Tosello, F.; Buraioli, I.; Schiavone, D.; Veglio, F. Current assessment of pulse wave velocity: Comprehensive review of validation studies. J. Hypertens. 2019, 37, 1547–1557. [Google Scholar] [CrossRef]
Disclaimer/Publisher’s Note: The statements, opinions and data contained in all publications are solely those of the individual author(s) and contributor(s) and not of MDPI and/or the editor(s). MDPI and/or the editor(s) disclaim responsibility for any injury to people or property resulting from any ideas, methods, instructions or products referred to in the content. |
© 2025 by the authors. Licensee MDPI, Basel, Switzerland. This article is an open access article distributed under the terms and conditions of the Creative Commons Attribution (CC BY) license (https://creativecommons.org/licenses/by/4.0/).