Methods for Cognitive Diagnosis of Students’ Abilities Based on Keystroke Features

Abstract
1. Introduction
2. Related Works
2.1. Research Status
2.2. Research Method
2.2.1. Keystroke Features
- 1.
- Average Keystroke Speed
- 2.
- Modification Frequency
- Delete;
- Backspace;
- Copy shortcut key;
- Paste shortcut key;
- Undo shortcut key;
- 3.
- Average typing time of keywords.
- Python 3.12: def, class, if/else/elif, for/while, try/except/finally, import, return;
- Java 8: class, public/private/protected, static, void, if/else, switch, for/while/do, try/catch/finally;
- C(C17)/C++(C++17): int/float/char/double/void/short/long/signed/unsigned, if/else, switch/case, for/while/do/break/continue, break/continue, return, struct, typedef.
- 4.
- Time Spent on Each Question
- 5.
- Average Number of Submissions per Question
- 6.
- Final Examination Score
2.2.2. Clustering Algorithm
2.2.3. Evaluation Method
- 1.
- Silhouette Score
- 2.
- Calinski–Harabasz Index (CH index)
- 3.
- Davies–Bouldin Index (DB index)
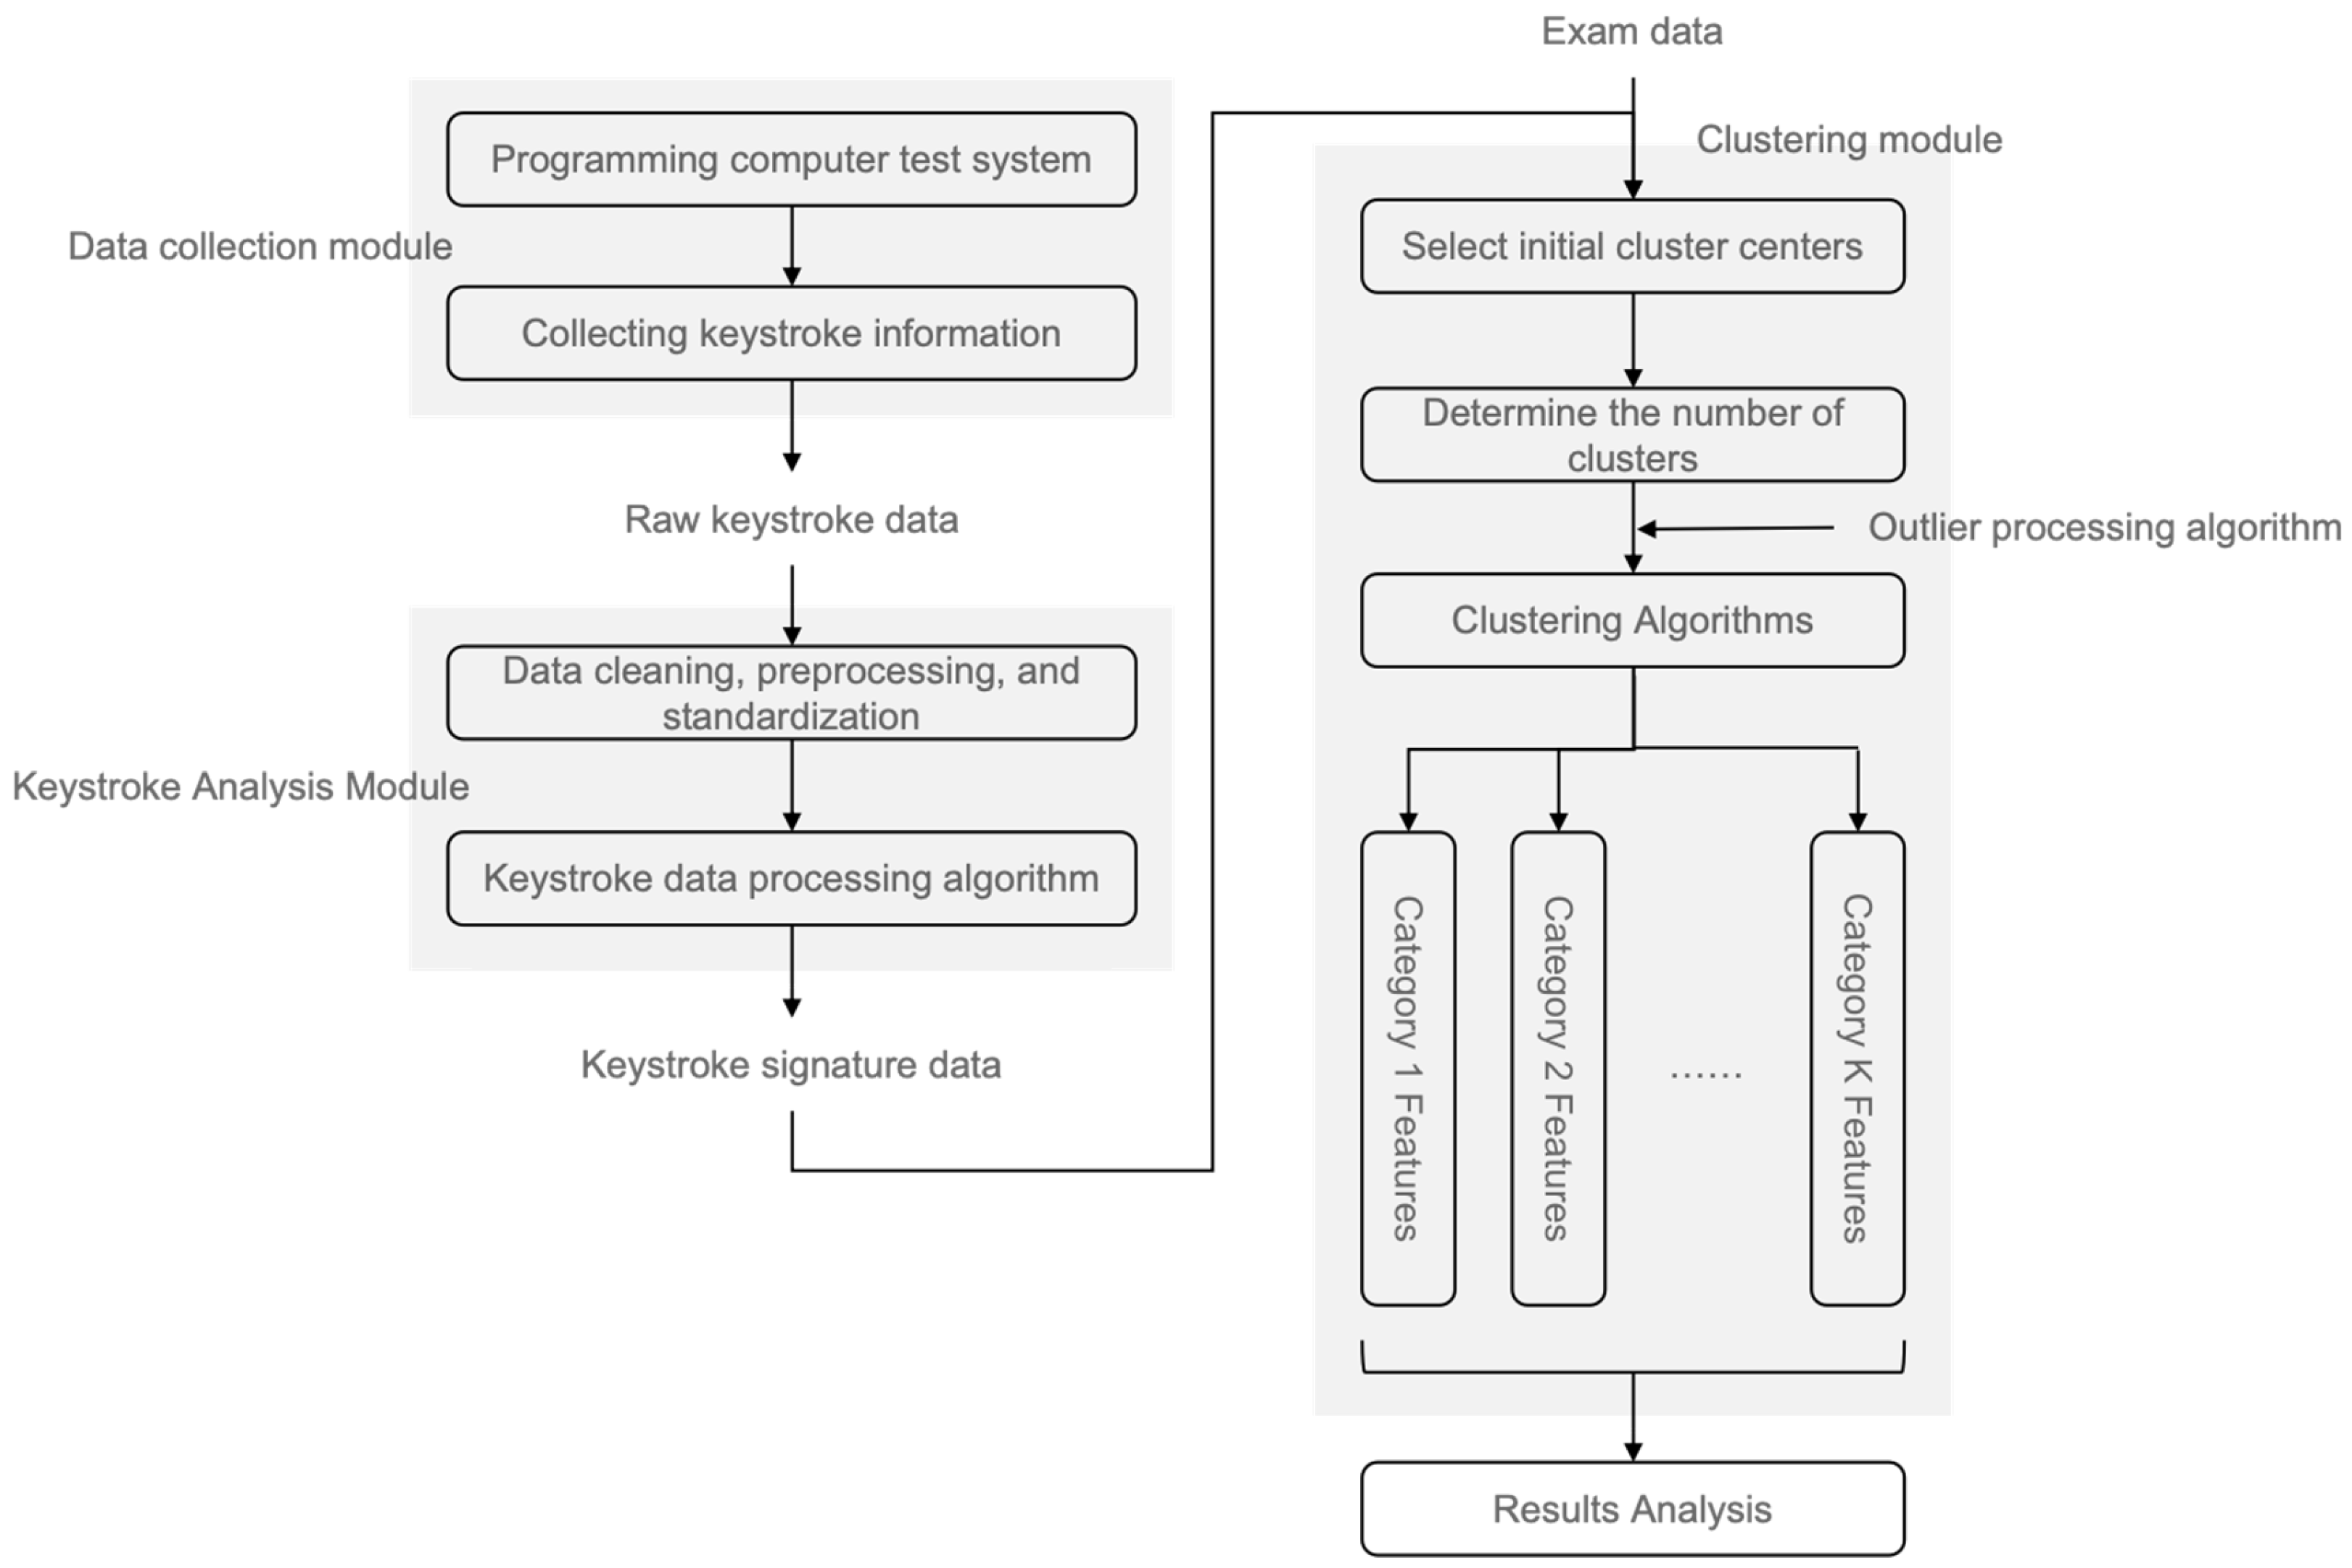
3. Materials and Methods
3.1. Experimental Method
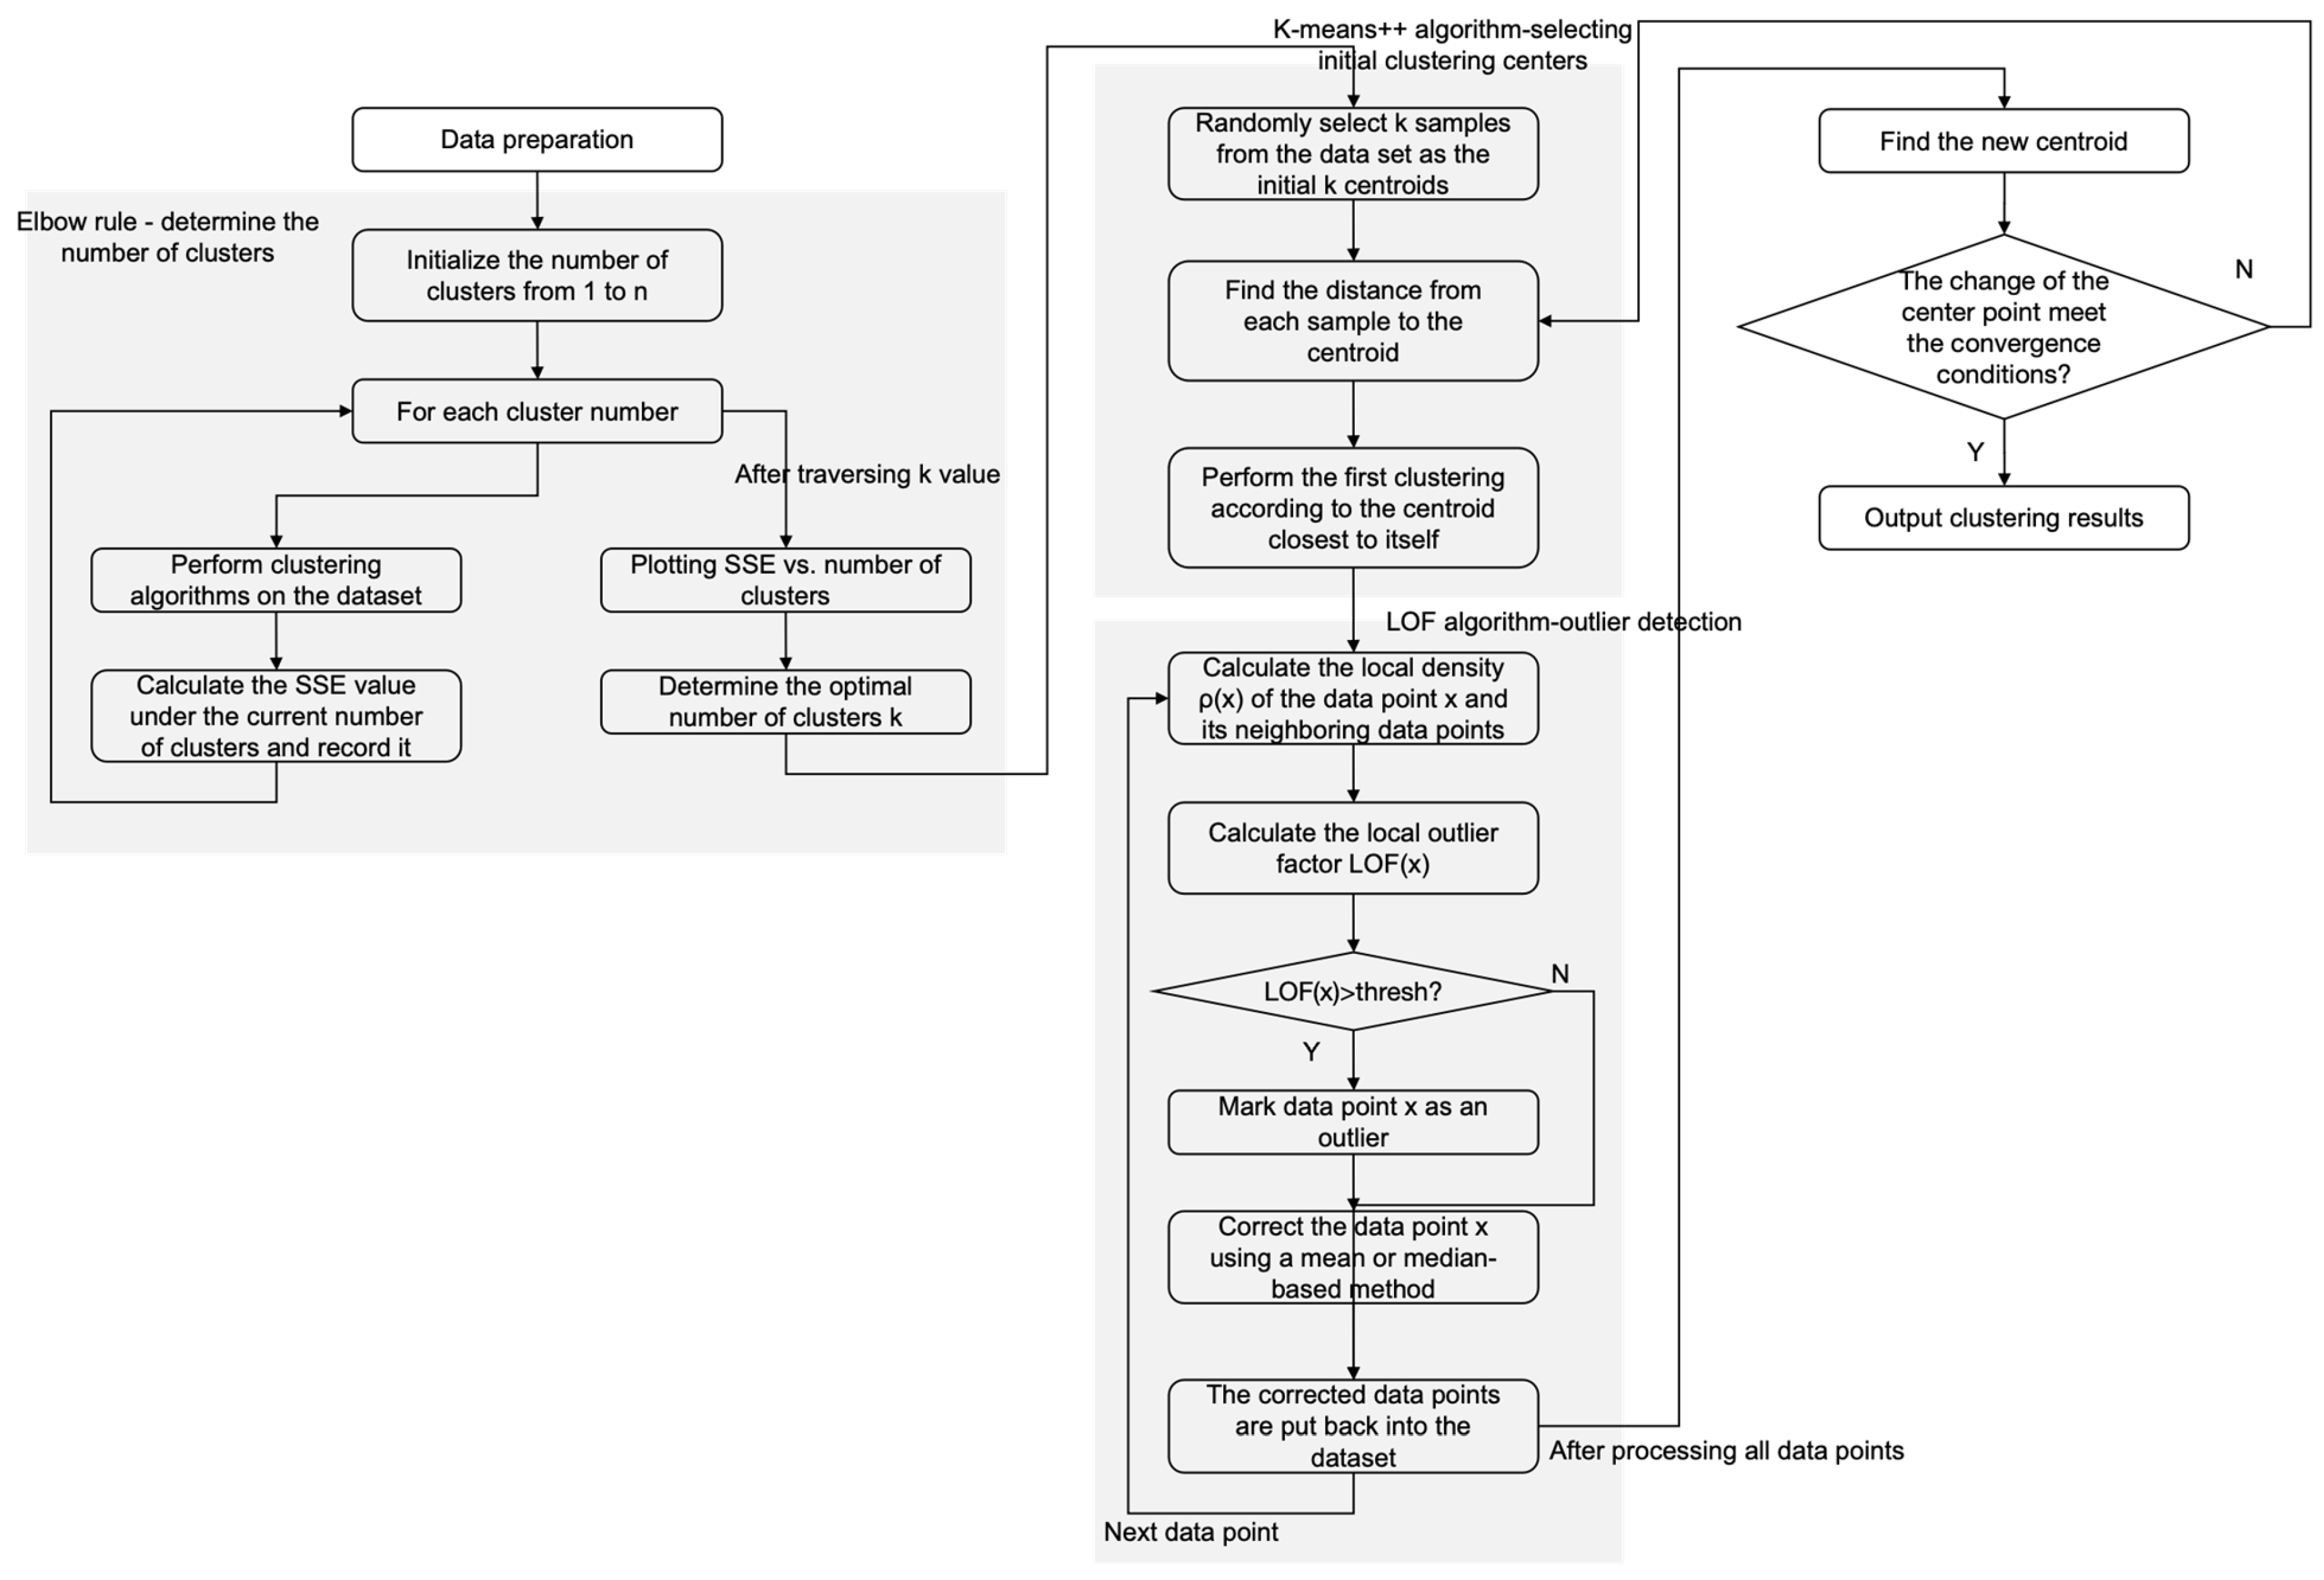
3.2. Improvement of the K-Means Algorithm
3.2.1. Selection of Initial Clustering Centers
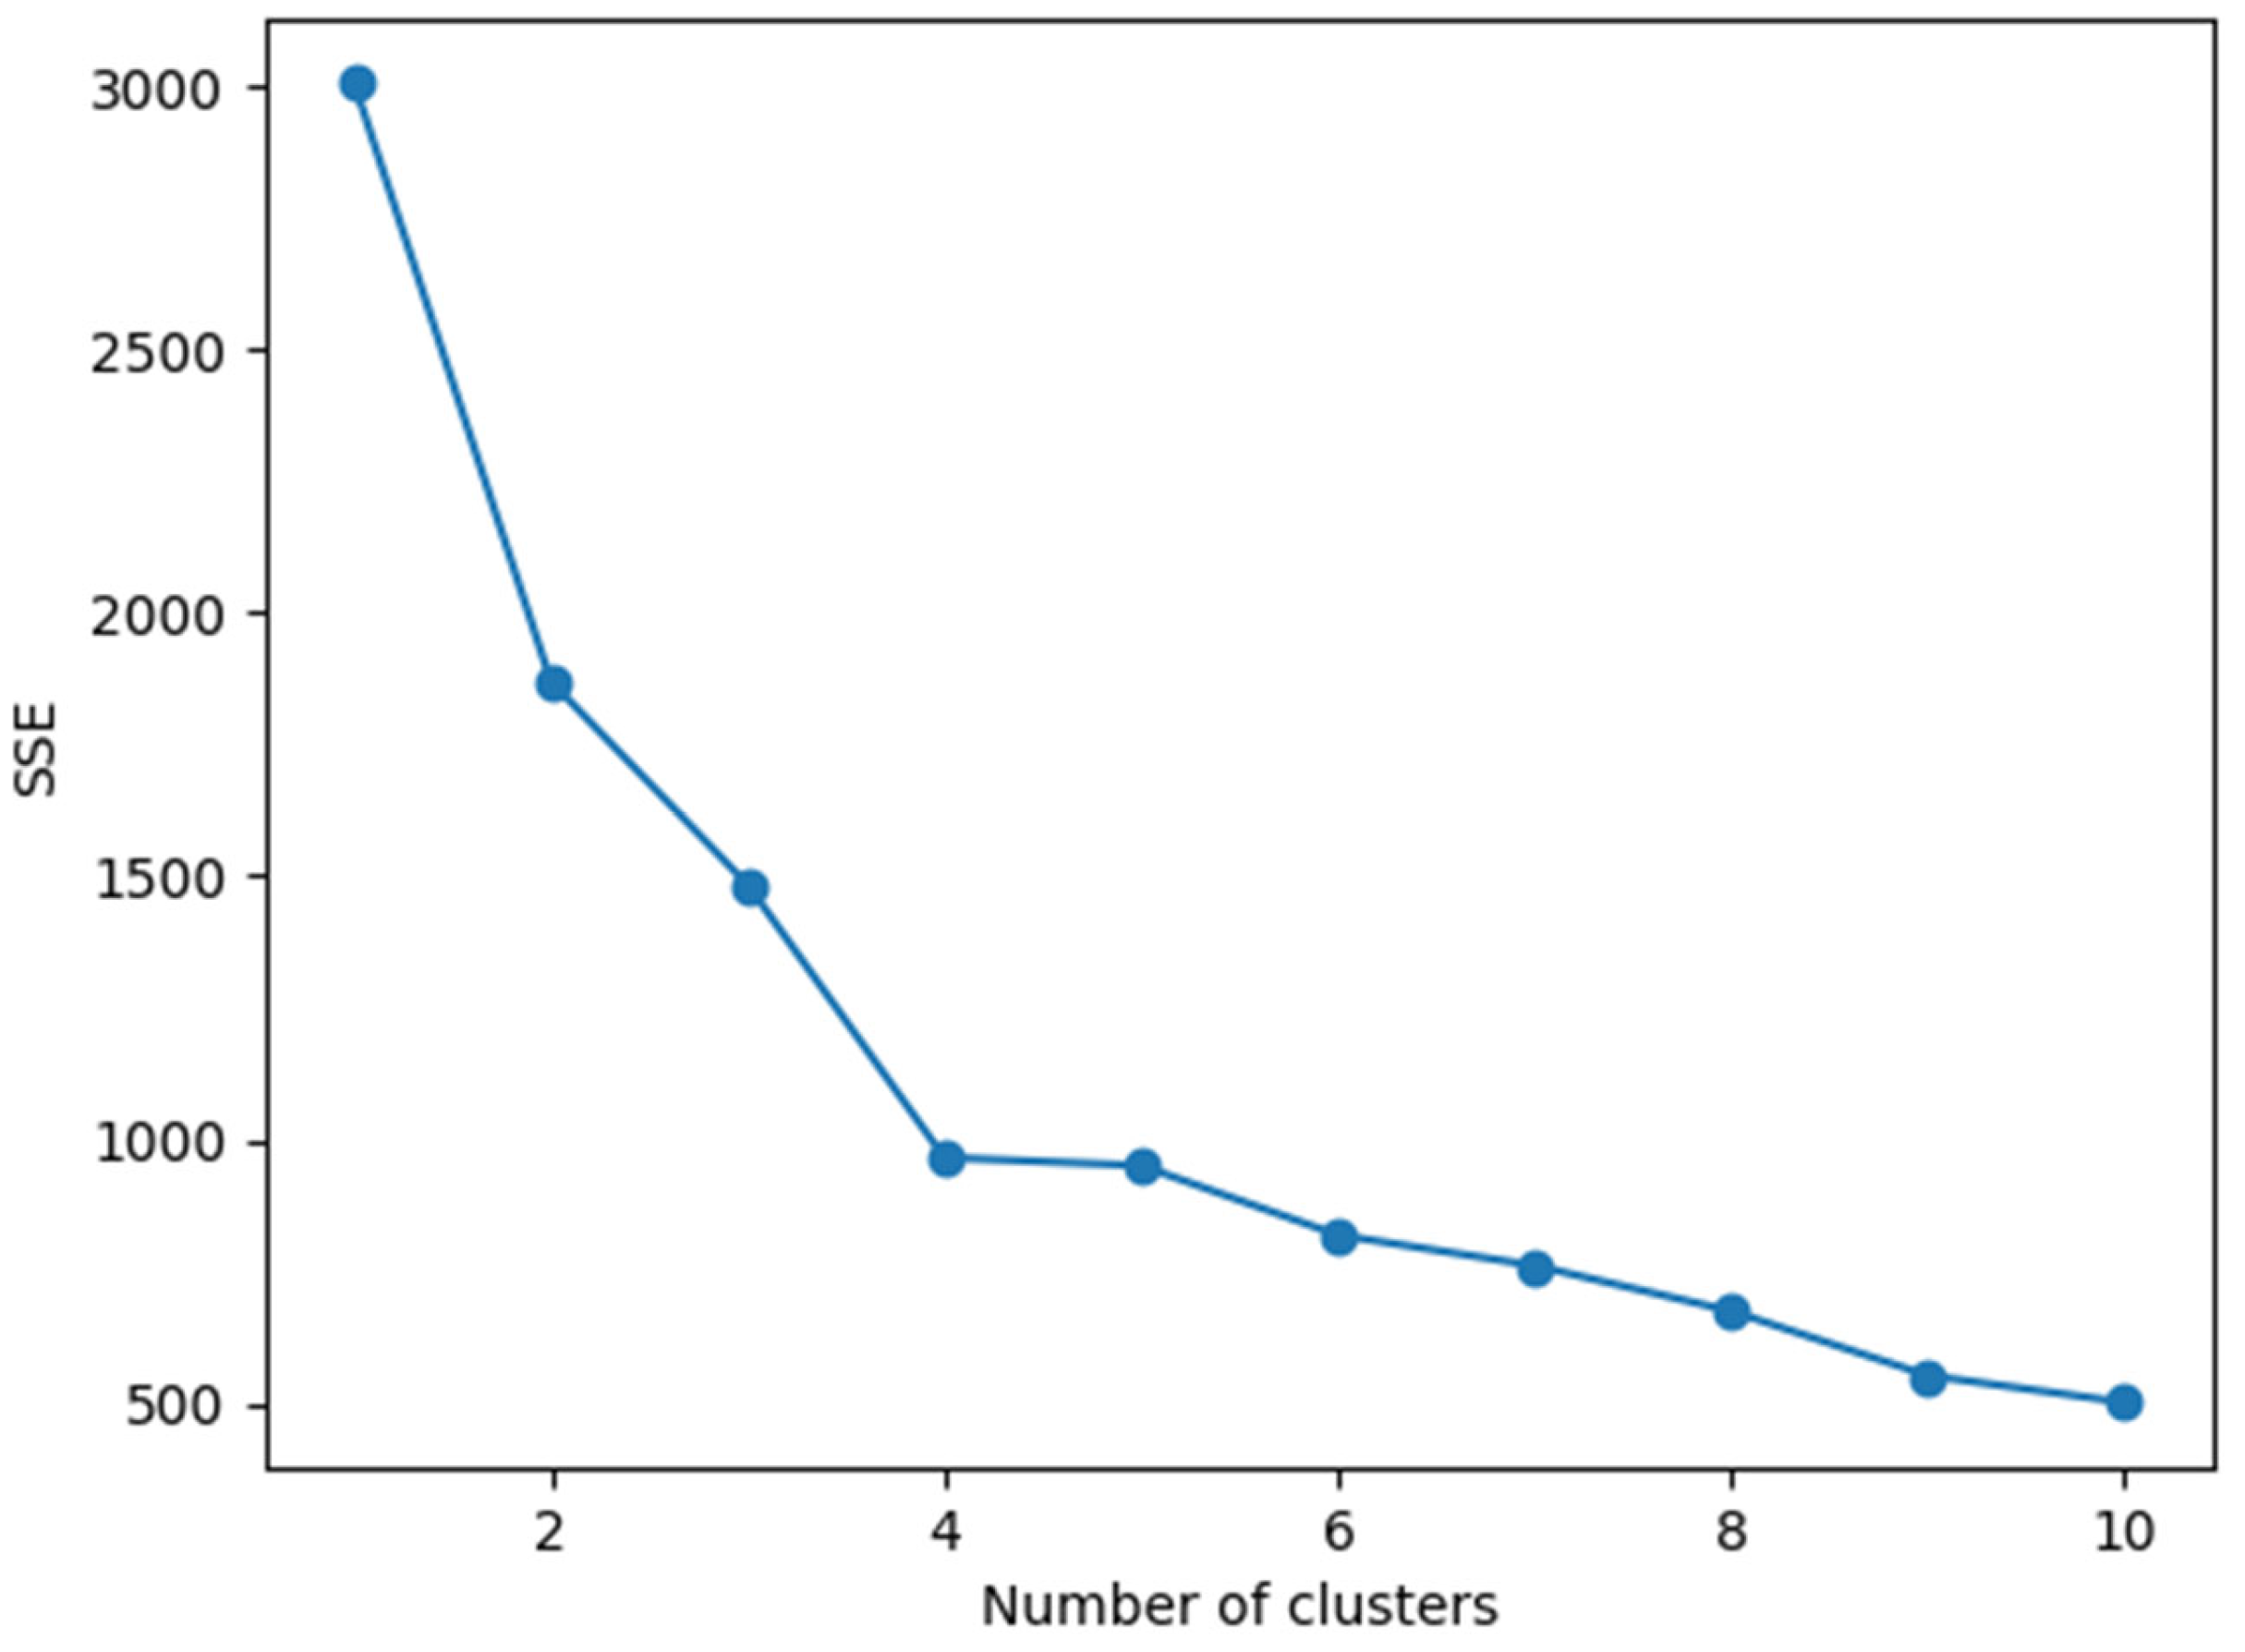
3.2.2. Selection of the Clustering Number k
3.2.3. Treatment of Outliers
4. Results
4.1. Experimental Data
4.2. Experimental Results
5. Discussion
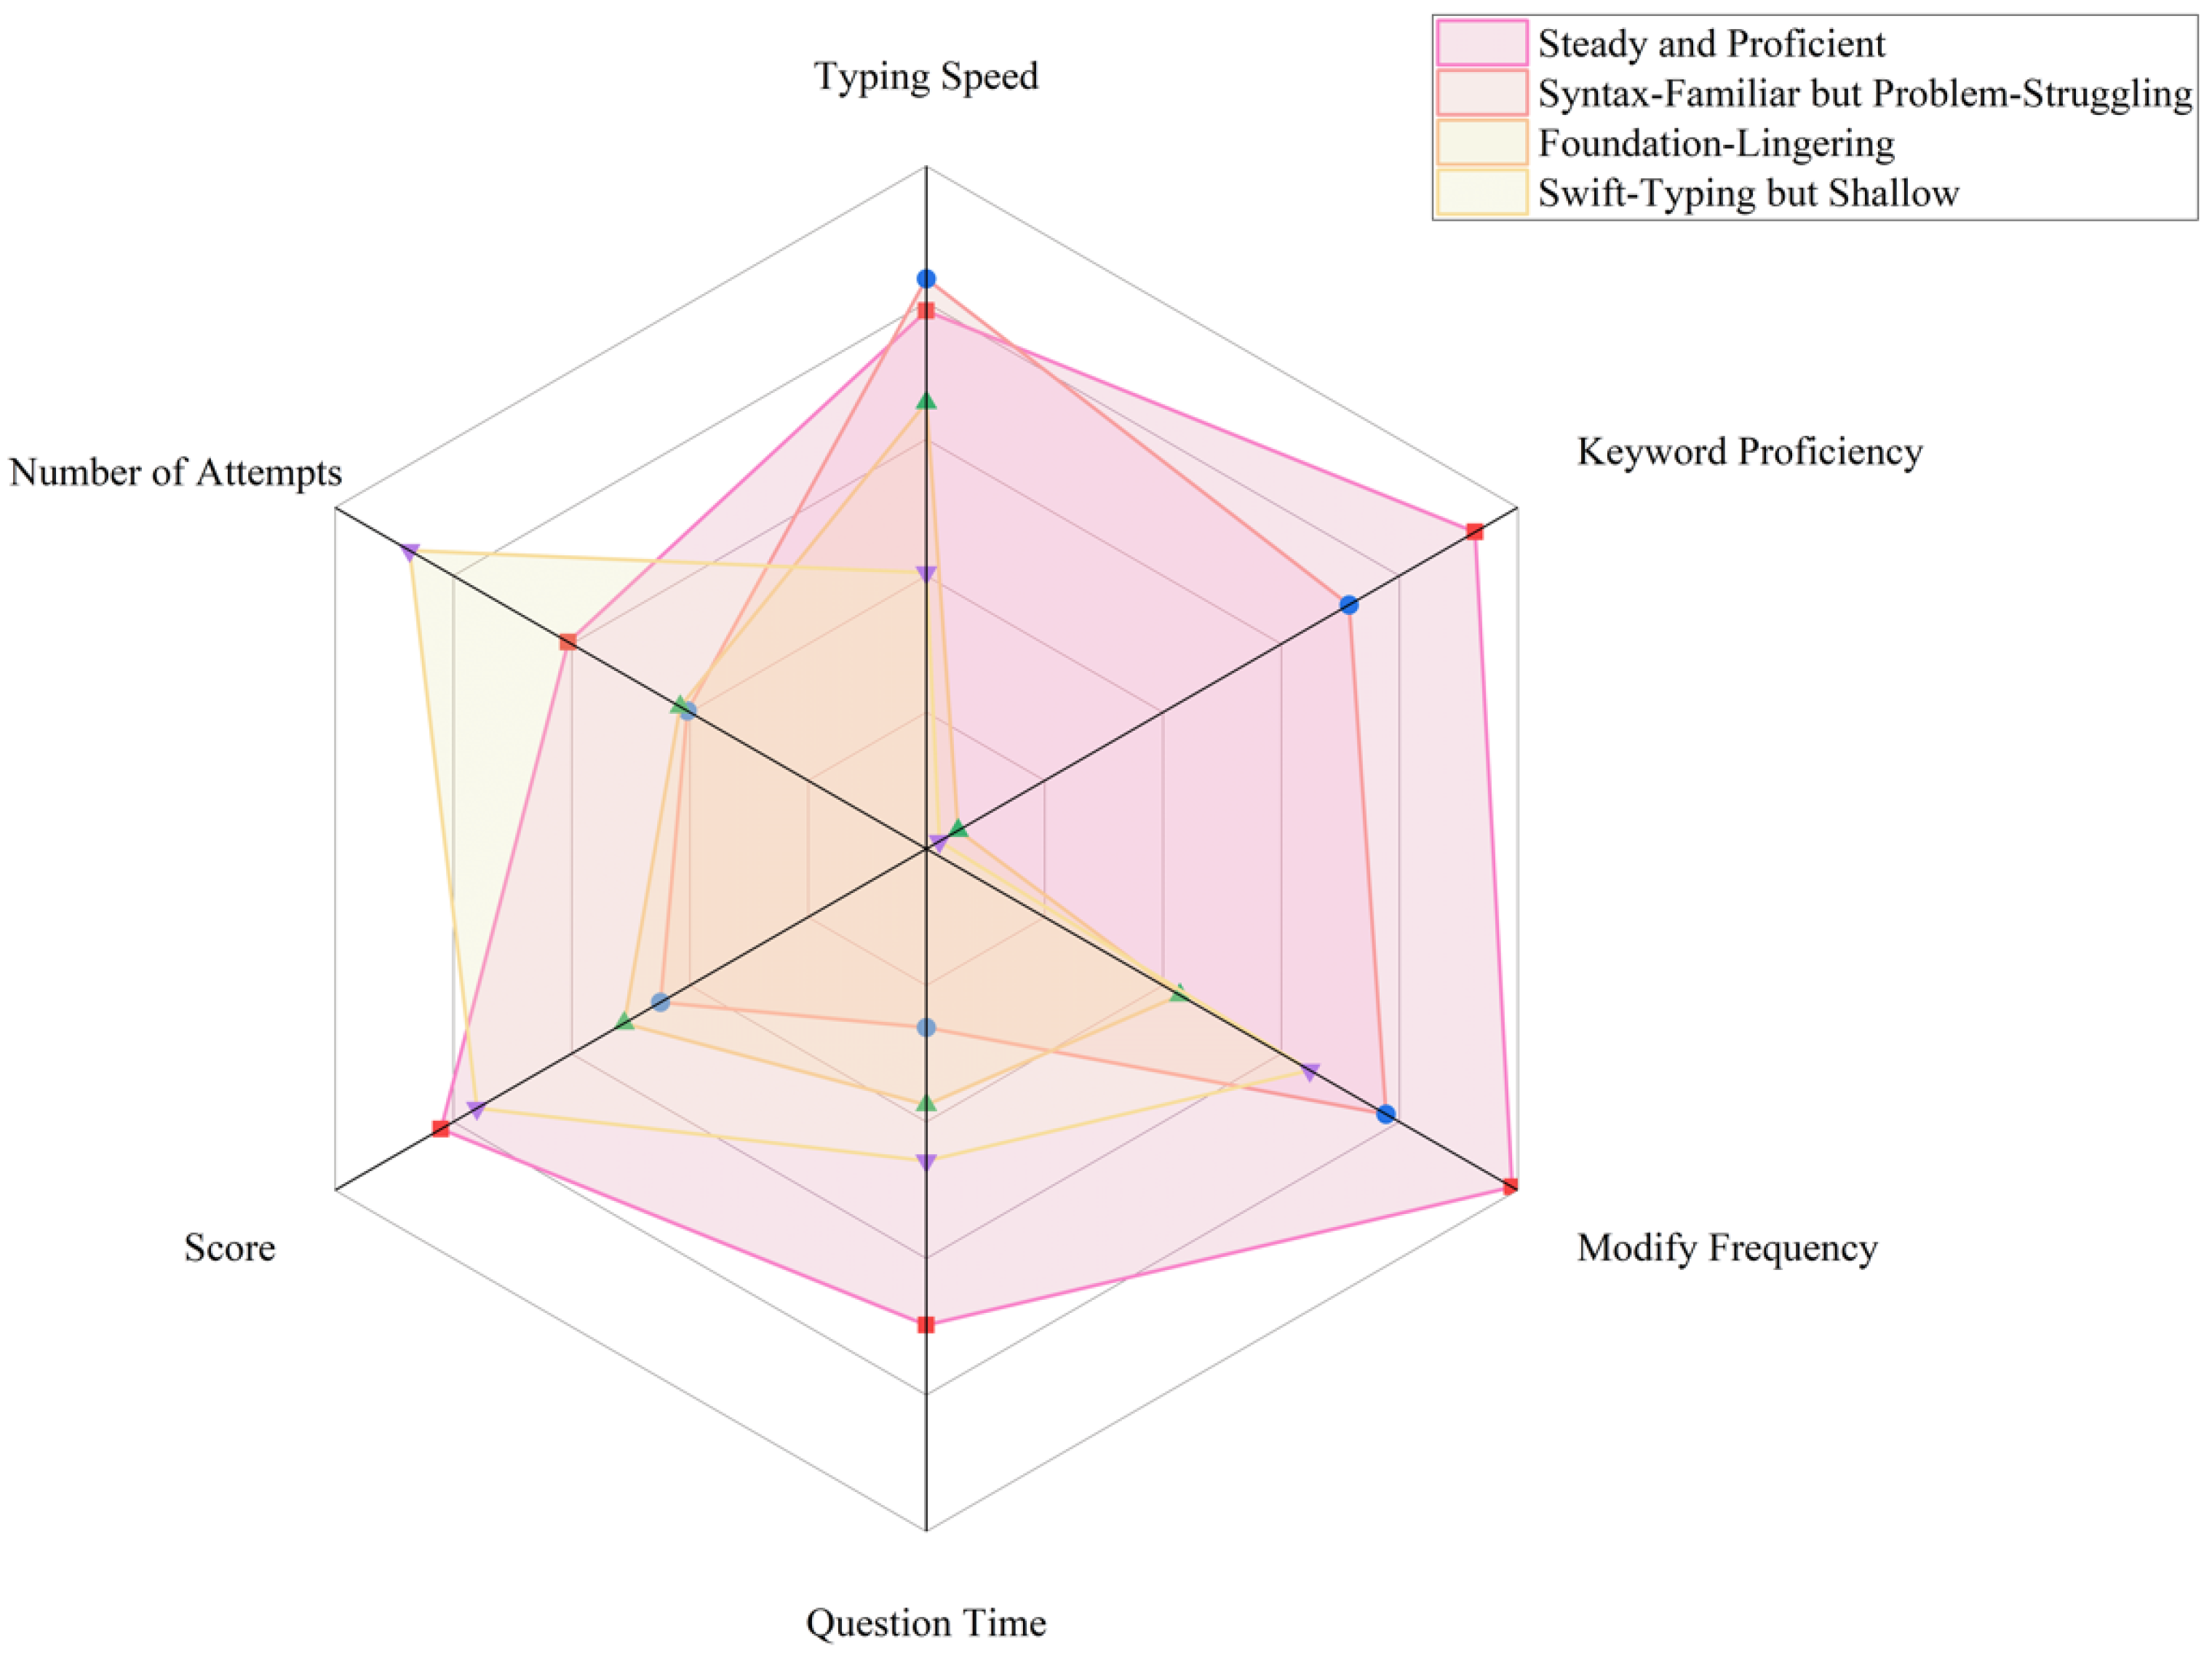
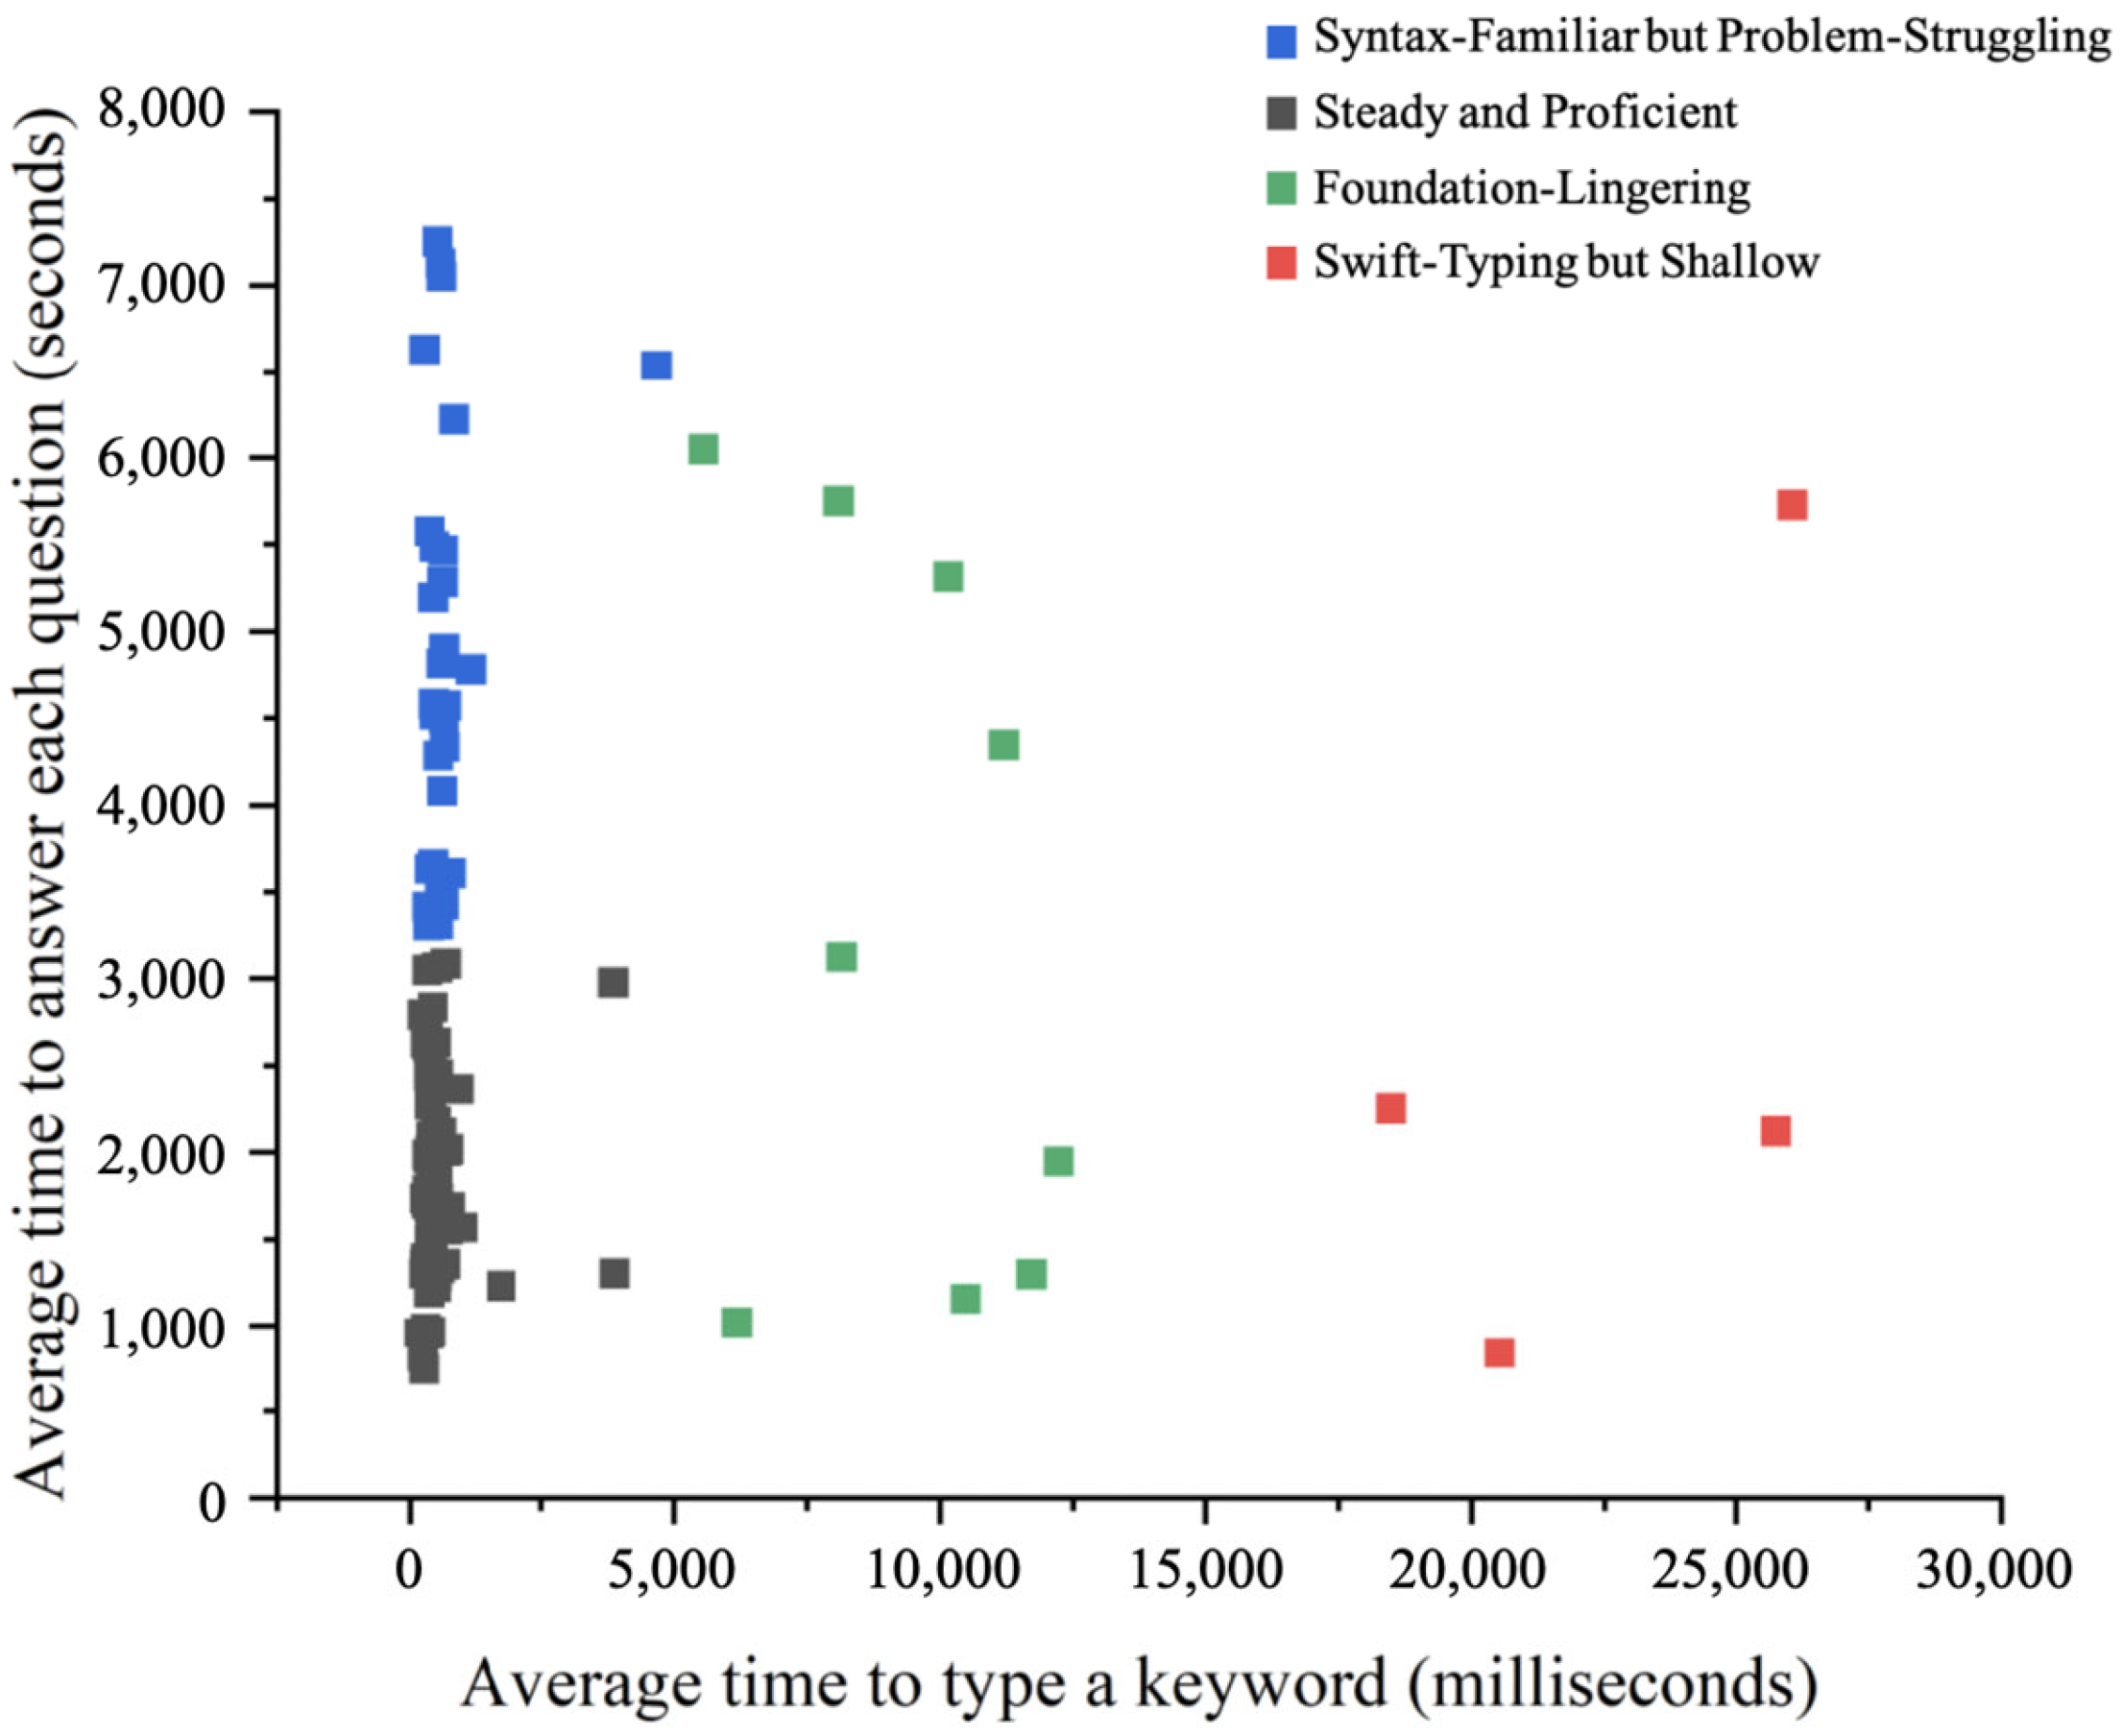
5.1. Clustering Result Analysis
- 1.
- Keystroke Speed
- 2.
- Modification Operation
- 3.
- Keyword Relevance
- 4.
- Question Relevance
- Score: This incorporated the “Average score for each question” in Table 1 into the relative high–low scores of the four types of candidates.
- Number of Attempts: This converted the number of submissions for each question into the “Number of Attempts.” The more submissions there were, the more attempts had been made on a question. Then, we transformed the table content into the relative high–low numbers of attempts of the four types of candidates.
5.2. Impact of Different Improvements on the Experimental Results
6. Conclusions
6.1. Cognitive Diagnosis Based on Clustering Results
6.2. Exploration of the Laws of Programming Education Based on Clustering Results
6.2.1. Basic Abilities Determine the Upper Limit
6.2.2. The Law of Learning Strategy Effectiveness
6.2.3. Nonlinear Growth Characteristics
6.2.4. The Theory of Process Quality Dominance
Author Contributions
Funding
Institutional Review Board Statement
Informed Consent Statement
Data Availability Statement
Conflicts of Interest
References
- Xu, L.M.; Zhou, Q. Analysis of Teaching Problems and Countermeasures in Computer Programming Courses. Comput. Campus. 2020, 12, 9–12. [Google Scholar]
- Xu, Y.; Wu, Z. Research on cognitive diagnosis in English testing. Foreign Lang. Teach. Theory Pract. 2021, 2, 44–55+75. [Google Scholar]
- Limpo, T.; Alves, R.A.; Connelly, V. Examining the transcription-writing link: Effects of handwriting fluency and spelling accuracy on writing performance via planning and translating in middle grades. Learn. Individ. Differ. 2017, 53, 26–36. [Google Scholar] [CrossRef]
- Leinonen, J. Keystroke Data in Programming Courses; University of Helsinki: Helsinki, Finland, 2019. [Google Scholar]
- Mahatanankoon, P. Cognitive Learning Strategies in an Introductory Computer Programming Course. Inf. Syst. Educ. J. 2021, 19, 11–20. [Google Scholar]
- Wang, K.; Song, L.P.; Zheng, J.J. Continuous Identity Authentication by Integrating Keystroke Content and Keystroke Behavior. Comput. Eng. Des. 2020, 41, 1562–1567. [Google Scholar]
- Zhang, C.; Han, J.H.; Li, F.L.; Wei, C.P. A Review of Keystroke Dynamics Research. J. Inf. Eng. Univ. 2020, 21, 310–315+324. [Google Scholar]
- Epp, C.; Lippold, M.; Mandryk, R.L. Identifying emotional states using keystroke dynamics. In Proceedings of the Sigchi Conference on Human Factors in Computing Systems, Vancouver, BC, Canada, 7–12 May 2011. [Google Scholar]
- Khan, M.F.A.; Edwards, J.; Bodily, P.; Karimi, H. Deciphering Student Coding Behavior: Interpretable Keystroke Features and Ensemble Strategies for Grade Prediction. In Proceedings of the 2023 IEEE International Conference on Big Data (BigData), Sorrento, Italy, 15–18 December 2023. [Google Scholar]
- Shrestha, R.; Leinonen, J.; Zavgorodniaia, A.; Hellas, A.; Edwards, J. Pausing While Programming: Insights From Keystroke Analysis. In Proceedings of the 2022 IEEE/ACM 44th International Conference on Software Engineering: Software Engineering Education and Training (ICSE-SEET), Pittsburgh, PA, USA, 25–27 May 2022. [Google Scholar]
- Zhang, Y.L.; Zhou, Y.J. A Review of Clustering Algorithms. J. Comput. Appl. 2019, 39, 1869–1882. [Google Scholar]
- Ma, W.; Guo, W. Cognitive diagnosis models for multiple strategies. Br. J. Math. Stat. Psychol. 2019, 72, 370–392. [Google Scholar] [PubMed]
- James, F.E.; Feldhausen, R.; Bean, N.H.; Weese, J.; Allen, D.S.; Friend, M. From Typing to Insights: An Interactive Code Visualization for Enhanced Student Support Using Keystroke Data. In Proceedings of the 56th ACM Technical Symposium on Computer Science Education V 2, Pittsburgh, PA, USA, 26 February–1 March 2025; Association for Computing Machinery: New York, NY, USA, 2025; pp. 1493–1494. [Google Scholar]
- Nakada, T.; Miura, M. Extracting typing game keystroke patterns as potential indicators of programming aptitude. Front. Comput. Sci. 2024, 6, 1412458. [Google Scholar] [CrossRef]
- Kamal Bunkar, S.T. Educational Data Mining for Student Learning Pattern Analysis using Clustering Algorithms. Int. J. Eng. Adv. Technol. 2020, 9, 481–488. [Google Scholar]
- Aggarwal, C.C.; Reddy, C.K. Data Clustering: Algorithms and Applications. 2013; CRC Press: Boca Raton, FL, USA, 2014. [Google Scholar]
- Patel, G.K.; Dabhi, V.K.; Prajapati, H.B. Study and Analysis of Particle Swarm Optimization for Improving Partition Clustering; IEEE: Piscataway, NJ, USA, 2015. [Google Scholar]
- Guo, Y.K.; Zhang, X.Y.; Liu, L.P.; Ding, L.; Niu, X.L. K-means Clustering Algorithm with Optimized Initial Clustering Centers. Comput. Eng. Appl. 2020, 56, 172–178. [Google Scholar]
- Chen, Q. Contemporary Educational Psychology; Beijing Normal University Press: Beijing, China, 2007. [Google Scholar]
- An, S.A. The Complexity of Education and Nonlinear Laws. Mod. Educ. Manag. 2015, 7, 41–46+81. [Google Scholar]

| Id | Key | Time | Type | Row | Column |
|---|---|---|---|---|---|
| 1 | Shift | 14:06:16:638 4/1/2025 | down | 0 | 0 |
| 2 | # | 14:06:16:652 4/1/2025 | down | 0 | 0 |
| 3 | Shift | 14:06:16:741 4/1/2025 | up | 0 | 1 |
| 4 | 3 | 14:06:16:748 4/1/2025 | up | 0 | 1 |
| 5 | i | 14:06:16:981 4/1/2025 | down | 0 | 1 |
| 6 | i | 14:06:17:44 4/1/2025 | up | 0 | 2 |
| 7 | n | 14:06:17:133 4/1/2025 | down | 0 | 2 |
| 8 | n | 14:06:17:206 4/1/2025 | up | 0 | 3 |
| 9 | c | 14:06:17:276 4/1/2025 | down | 0 | 3 |
| 10 | c | 14:06:17:356 4/1/2025 | up | 0 | 4 |
| 11 | l | 14:06:17:412 4/1/2025 | down | 0 | 4 |
| 12 | l | 14:06:17:558 4/1/2025 | up | 0 | 5 |
| 13 | u | 14:06:17:596 4/1/2025 | down | 0 | 5 |
| 14 | d | 14:06:17:653 4/1/2025 | down | 0 | 6 |
| 15 | u | 14:06:17:658 4/1/2025 | up | 0 | 7 |
| 16 | d | 14:06:17:740 4/1/2025 | up | 0 | 7 |
| 17 | e | 14:06:17:874 4/1/2025 | down | 0 | 7 |
| 18 | e | 14:06:17:932 4/1/2025 | up | 0 | 8 |
| 19 | Space | 14:06:18:412 4/1/2025 | down | 0 | 8 |
| 20 | Space | 14:06:18:469 4/1/2025 | up | 0 | 9 |
| Category | Proportion | Average Typing Speed (Keys/Minute) | Average Percentage of Modified Actions (%) | Average Time to Type a Keyword (Milliseconds) | Average Time to Answer Each Question (Seconds) | Average Score for Each Question | Average Number of Submissions per Question |
|---|---|---|---|---|---|---|---|
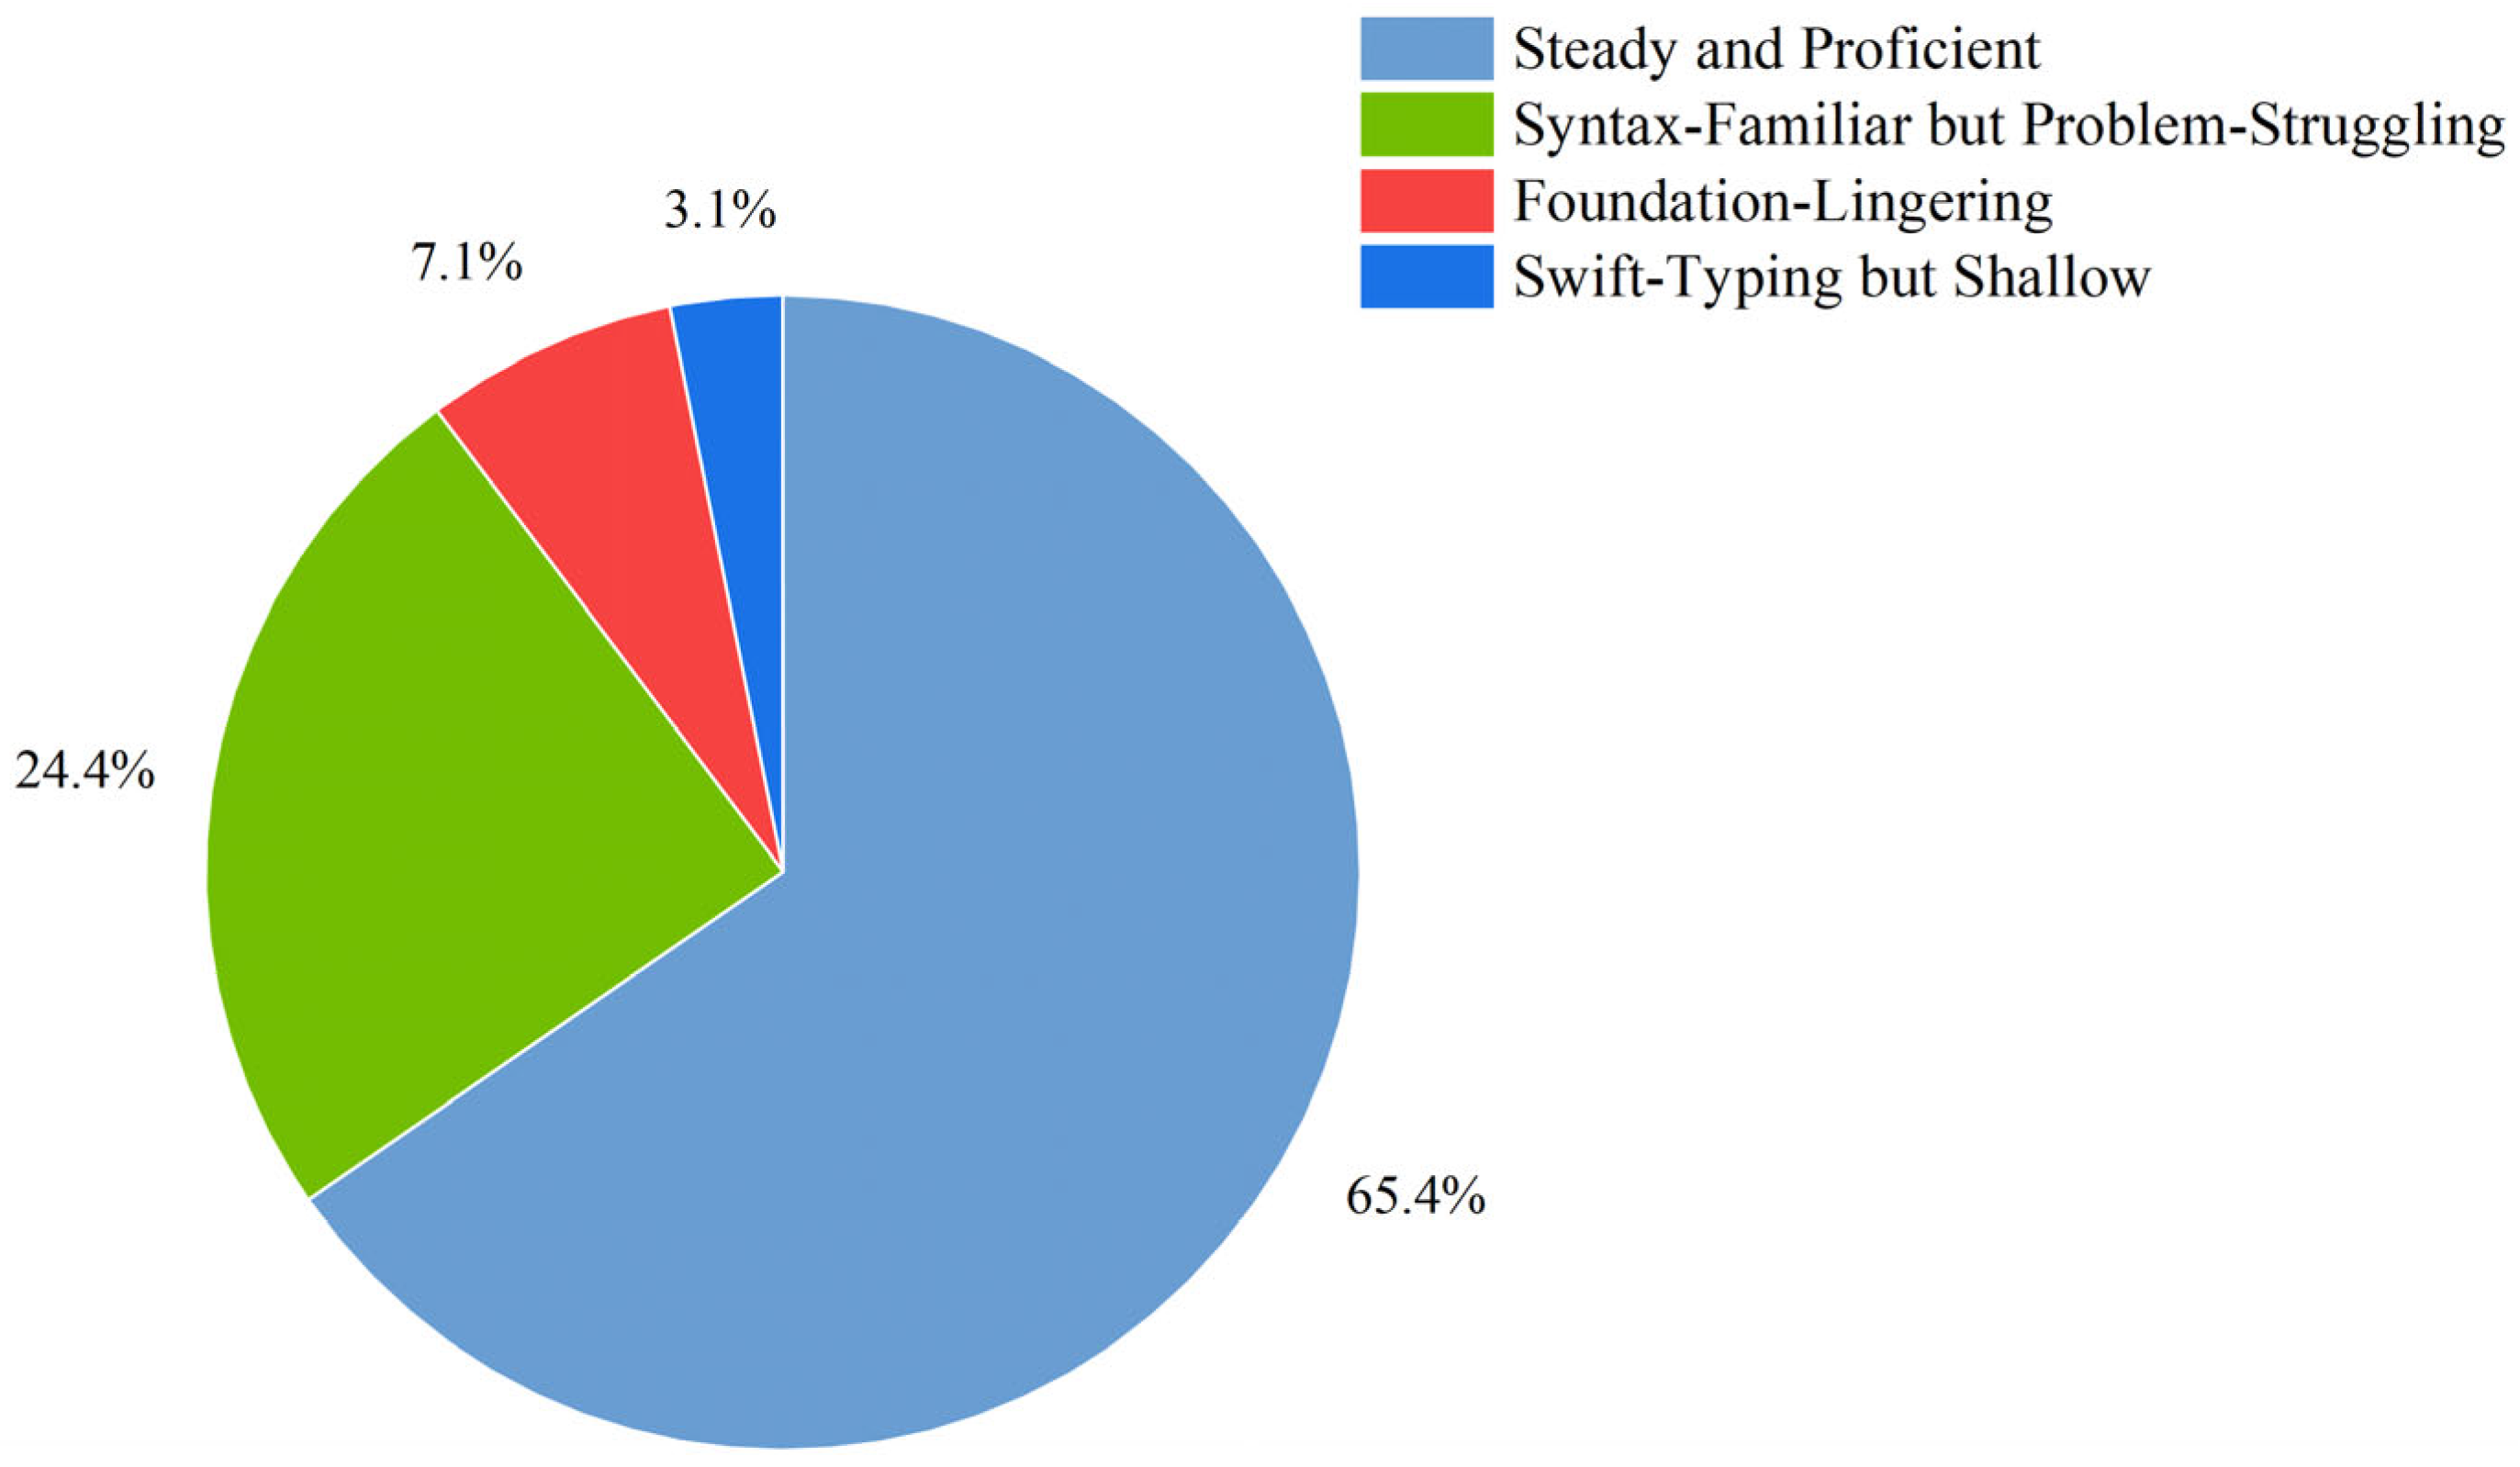
| Category 1 | 65.35% | 152.315 | 10.10 | 538.827 | 1791.993 | 82.096 | 3.303 |
| Category 2 | 24.41% | 143.702 | 12.87 | 699.316 | 4773.891 | 44.968 | 4.947 |
| Category 3 | 7.09% | 183.538 | 23.32 | 9312.115 | 3333.714 | 51.111 | 4.803 |
| Category 4 | 3.15% | 296.528 | 15.42 | 22,709.063 | 2734.728 | 76 | 2.288 |
| Category | Proportion | Typing Speed | Modify Frequency | Keyword Proficiency | Question Time | Number of Attempts | Score |
|---|---|---|---|---|---|---|---|
| Steady and Proficient | Largest | Slower | Minimum | Best | Shortest | Less | Highest |
| Syntax-Familiar but Problem-Struggling | Larger | Slowest | Moderate | Better | Extremely long | Most | Lowest |
| Foundation-Lingering | Smaller | Medium | Maximum | Worse | Longer | More | Lower |
| Swift-Typing but Shallow | Least | Fastest | Moderate | Worst | Shorter | Least | Higher |
| Clustering Algorithms | Silhouette Score | CH Index | DB Index |
|---|---|---|---|
| Improved K-Means | 0.682 | 603.720 | 0.462 |
| Traditional K-Means | 0.658 | 612.553 | 0.528 |
| Hierarchical Clustering | 0.608 | 543.281 | 0.615 |
| Gaussian Mixture Model | 0.512 | 467.141 | 0.739 |
| Initial Cluster Center Selection Method | Silhouette Score | CH Index | DB Index |
|---|---|---|---|
| K-Means++ | 0.682 | 603.720 | 0.462 |
| Random | 0.658 | 612.553 | 0.528 |
| Number of Clusters | Silhouette Score | CH Index | DB Index |
|---|---|---|---|
| K = 4 | 0.682 | 603.720 | 0.462 |
| K = 3 | 0.642 | 249.473 | 0.743 |
| K = 5 | 0.543 | 542.950 | 0.578 |
| Treatment of Outliers | Silhouette Score | CH Index | DB Index |
|---|---|---|---|
| LOF | 0.682 | 603.720 | 0.462 |
| No treatment | 0.638 | 612.658 | 0.537 |
Disclaimer/Publisher’s Note: The statements, opinions and data contained in all publications are solely those of the individual author(s) and contributor(s) and not of MDPI and/or the editor(s). MDPI and/or the editor(s) disclaim responsibility for any injury to people or property resulting from any ideas, methods, instructions or products referred to in the content. |
© 2025 by the authors. Licensee MDPI, Basel, Switzerland. This article is an open access article distributed under the terms and conditions of the Creative Commons Attribution (CC BY) license (https://creativecommons.org/licenses/by/4.0/).
Share and Cite
Chi, X.; Guo, X.; Sheng, Y. Methods for Cognitive Diagnosis of Students’ Abilities Based on Keystroke Features. Appl. Sci. 2025, 15, 4783. https://doi.org/10.3390/app15094783
Chi X, Guo X, Sheng Y. Methods for Cognitive Diagnosis of Students’ Abilities Based on Keystroke Features. Applied Sciences. 2025; 15(9):4783. https://doi.org/10.3390/app15094783
Chicago/Turabian StyleChi, Xu, Xinyu Guo, and Yu Sheng. 2025. "Methods for Cognitive Diagnosis of Students’ Abilities Based on Keystroke Features" Applied Sciences 15, no. 9: 4783. https://doi.org/10.3390/app15094783
APA StyleChi, X., Guo, X., & Sheng, Y. (2025). Methods for Cognitive Diagnosis of Students’ Abilities Based on Keystroke Features. Applied Sciences, 15(9), 4783. https://doi.org/10.3390/app15094783