Article

Windows Malware Detection via Enhanced Graph Representations with Node2Vec and Graph Attention Network

Department of Computer Engineering, Mersin University, 33343 Mersin, Türkiye
*
Author to whom correspondence should be addressed.
Appl. Sci. 2025, 15(9), 4775; https://doi.org/10.3390/app15094775
Submission received: 6 March 2025 / Revised: 15 April 2025 / Accepted: 23 April 2025 / Published: 25 April 2025

Abstract

:
As malware has become increasingly complex, advanced techniques have emerged to improve traditional detection systems. The increasing complexity of malware poses significant challenges in cybersecurity due to the inability of existing methods to understand detailed and contextual relationships in modern software behavior. Therefore, developing innovative detection frameworks that can effectively analyze and interpret these complex patterns has become critical. This work presents a novel framework integrating API call sequences and DLL information into a unified, graph-based representation to analyze malware behavior comprehensively. The proposed model generates initial embeddings using Node2Vec, which uses a random walk approach to understand structural relationships between nodes. Graph Attention Network (GAT) then enhances these initial embeddings, which utilizes attention mechanisms to incorporate contextual dependencies and enhance semantic representations. Finally, the enhanced embeddings are classified using Convolutional Neural Network (CNN) and Gated Recurrent Units (GRU)s, a custom hybrid CNN-GRU-3 deep learning-based model capable of effectively modeling sequential patterns. The dual role of GAT as a classifier and feature extractor is also analyzed to evaluate its impact on embedding quality and classification accuracy. Experimental results show that the proposed model achieves superior results with an accuracy rate of 0.9961 compared to state-of-the-art approaches such as ensemble learning and standalone GAT. This achievement highlights the framework’s ability to utilize contextual information for malware detection. The real-world dataset used provides a benchmark for future work, and this research lays a comprehensive foundation for advancing graph-based malware analysis.

1. Introduction

Malware is defined as malicious code that infiltrates computers or devices connected to the internet and steals sensitive information belonging to government, commercial, or private organizations [1]. Malware has become more sophisticated and advanced with time, using advanced techniques, making malware detection more difficult [2,3]. This dynamic structure makes malware detection difficult and also requires the development of detection methods. Malware detection is divided into two main categories: static and dynamic analysis methods. Static analysis allows examination of the code without executing it [4], and low-level features such as text patterns, opcodes, and byte sequences are obtained. Although these methods are fast and effective, they are vulnerable to methods such as encryption and code obfuscation. In this study, static analysis was performed using software behavioral features, such as API call sequences and DLL dependencies, to understand contextual relationships. On the other hand, dynamic analysis involves running the program in a secure environment and observing its behavior [5]. However, these methods require more computational resources. A key feature for malware detection is the Application Programming Interface (API) call sequences that define the program behaviors [6]. API calls cover important behaviors such as file operations, network access, and registry changes and often contain contextual patterns that are distinctive for malware. Recent studies have applied Machine Learning (ML) [7,8,9,10] and Deep Learning (DL) [11,12,13,14] approaches to analyze API call sequences for malware detection. While ML often overlooks semantic context, DL models offer improved accuracy by capturing complex patterns and structural dependencies, making them effective against advanced and increasingly sophisticated evasion techniques. DL also stands out for its success in modeling complex malware features such as API call sequences or structural dependencies. Examining the relationships between API call sequences and Dynamic Link Library (DLL) helps develop more comprehensive and effective detection techniques for malware behavior. For example, an API sequence like “CreateWindow->ShowWindow->CreateFile” may indicate a malicious behavior when analyzed in context, such as hiding a malware window and creating a malicious file on the system [3]. DLL and API call sequences provide semantic and contextual information crucial to accurate malware detection. Unlike frequency-based approaches, NLP-based (Natural Language Processing) methods can effectively understand these relationships by treating API calls and DLLs as sequential text-like data [15]. However, many existing models still overlook deeper semantic connections between API functions.
Graph representation has been widely used in language processing research for many years. In recent years, it has also come to the fore in malware analysis [16]. Integrating API call sequences and DLL usage into a unified graph analysis framework provides a more holistic view of software behavior, enabling more sensitive and robust malware detection. Inspired by the above arguments, we propose a new framework to detect increasingly sophisticated Windows malware in this paper utilizing the semantic analysis of API call sequences and DLLs. Unlike previous works in the literature that focus on analyzing API calls or DLLs separately, our approach addresses the joint analysis of these two critical components. In this paper, we propose a new framework for malware detection that uses graph-based methodologies using API call sequences and DLLs to construct meaningful graph representations. In the proposed framework, the Node2Vec algorithm generates initial embeddings (vector representations of nodes) in the graph. Node2Vec’s random walk approach provides a strong starting point for understanding the structural relationships of nodes. These initial embeddings are improved by GAT with attention coefficients and made more contextual by giving weight to the importance of information from neighboring nodes. To the best of our knowledge, this is the first application to integrate Node2Vec embeddings with GAT for contextual enhancement in malware detection. Finally, these improved embeddings are fed into our custom CNN-GRU-3, a DL-based hybrid classifier that can effectively model sequential and complex relationships. Multiple experimental setups are designed to evaluate the performance of the proposed framework and assess the effectiveness of graph embedding methods and classifiers. First, graph embedding techniques Node2Vec and GraphSAGE are compared regarding their ability to extract semantic and structural features from the generated graphs. These embeddings are then evaluated using two classification approaches: (1) a custom CNN-GRU-3 hybrid model designed to understand patterns and (2) an ensemble learning method that combines the strengths of multiple classifiers to improve performance. Next, we examine GAT in different roles. As a classifier, GAT is directly used to detect malware by processing graph embeddings and utilizing its ability to understand contextual dependencies within API and DLL graphs. Additionally, GAT is evaluated as an embedding enhancer, where it improves the semantic representations of Node2Vec and GraphSAGE embeddings by incorporating the contextual structure of the graph before feeding the improved embeddings to classifiers such as CNN-GRU-3 and ensemble learning models. Finally, GAT was used as a feature extractor, where it generated enriched embeddings from the graphs, which were then classified using CNN-GRU-3 and ensemble learning.
This new comprehensive evaluation and framework not only compares the performance of different embedding techniques and classifiers but also highlights the dual role of GAT as both a classifier and a feature extractor. The results of these experiments allowed us to propose the most effective framework for malware detection by balancing semantic richness and classification accuracy.
The key contributions of this research are as follows.
  • A novel framework is proposed that enhances initial embedding methods, such as Node2Vec and GraphSAGE, with GAT by integrating API call sequences and DLL information through graph representations. This approach establishes a robust foundation for malware detection by enriching contextual semantic features.
  • A comprehensive comparative analysis is performed to evaluate the effectiveness of various graph embedding techniques, including Node2Vec, GraphSAGE, and GAT, in the context of malware detection.
  • The dual functionality of GAT as both a classifier and feature extractor is thoroughly examined, with a detailed assessment of its impact on semantic information extraction and classification performance.
  • A real-world dataset is developed from practical scenarios, contributing to the literature while providing a reliable benchmark for future malware detection research.
The rest of the paper is organized as follows: Section 2 discusses some state-of-the-art research in the literature. Section 3 and Section 4 highlight theoretical backgrounds and the experimental results. Section 5 includes limitations and discussion. This study is concluded in Section 6 by addressing the research aspects.

2. Related Studies

Recent research explores innovative methodologies to overcome the above-mentioned challenges. Sequence-based methods for malware detection use DL models to extract sequential features from API call sequences. API-MalDetect is a framework that utilizes API call sequences for malware detection on Windows systems [13]. The framework combines a CNN and BiGRU-based hybrid feature extractor with NLP-inspired encoding to understand semantic relationships in API calls. API-MalDetect achieves high accuracy and robustness against evolving malware variants, outperforming state-of-the-art methods in various evaluation metrics. Another paper [17] presents a DL framework that detects malware through intrinsic features derived from API sequences, such as software behavior, semantic information, and relationships between API calls. By employing Bi-LSTM and convolutional layers, the proposed model achieves improved accuracy and F1-scores over existing baselines. The study highlights the limitations of traditional methods, which often overlook the contextual semantics of API calls, and proposes a more comprehensive approach for dynamic malware detection. Kumar et al. [18] introduced a transfer and ensemble learning method using CNNs to classify malware in enterprise networks. Their approach effectively handles polymorphic malware with an impressive detection accuracy of 0.9936 on benchmark datasets by visualizing malware as grayscale images. Similarly, Bensaoud and Kalita [1] used a CNN-LSTM hybrid model to classify malware based on opcode sequences and API calls, demonstrating the effectiveness of combining sequential and convolutional approaches for high accuracy. Darem et al. [19] introduced a novel DL-based framework utilizing feature engineering techniques to reduce feature space significantly and achieved a 0.9601 detection accuracy using the Microsoft malware dataset. Brown et al. [20] explored the potential of Automated Machine Learning (AutoML) for optimizing DL architectures, demonstrating superior performance in static and online malware detection compared to manually crafted models. Recent work in malware detection highlights the importance of integrating advanced analysis techniques and Graph Neural Networks (GNNs) against evolving threats. Bao et al. [21] proposed a multimodal Windows malware detection method combining static features from PE headers and dynamic Control Flow Graphs (CFG) using a hybrid analysis and DL framework, achieving 0.9925 accuracy. Zhang et al. [22] introduced a semantics-preserving reinforcement learning attack targeting GNN-based malware detection system, highlighting vulnerabilities in existing defenses while preserving malware functionality through semantic manipulation of CFGs. Lin et al. [23] explored the use of Graph Convolutional Networks (GCNs) and GATs for ransomware detection, utilizing API call graphs extracted from Cuckoo Sandbox reports, demonstrating the effectiveness of GCNs over GATs in analyzing structural and relational data in malware detection. These studies underline the critical role of GNNs and multimodal approaches in enhancing the accuracy and resilience of modern malware detection systems. Chen et al. proposed a multimodal approach combining structural and semantic features using Class Set Call Graph (CSCG) and GAT. They achieved state-of-the-art accuracy in Android malware detection by combining graph-based and permission features [24]. In another study, Feng et al. [2] presented a graph neural network-based framework called DawnGNN for Windows malware detection that utilize semantic embeddings derived from API documents to improve detection performance. Extending API behavior analysis, Wu et al. proposed the MINES framework, which combines graph contrastive learning and CNNs to extract and fuse API presence and transition features, significantly improving malware classification [25].

3. Theoretical Background

This section presents the theoretical and architectural foundations of the proposed malware detection framework. Before introducing the experimental setup, we first detail the construction of API and DLL-based graphs, the embedding techniques used to represent graph nodes, and the DL architectures employed for classification. Specifically, we describe the system components, including the graph construction process, the Node2Vec and GraphSAGE embeddings, the custom CNN-GRU-3 model, the ensemble learning strategy, and the use of GAT as both a classifier and a feature enhancer. Finally, we introduce the dataset utilized in the experiments and describe its structure and pre-processing.

3.1. Graph Construction

Graphs consist of nodes (or states) and edges (or relationships) that connect the nodes. The created nodes and edges can have specific attributes or properties associated with them [26]. In our graph representation, nodes correspond to both API calls and DLLs extracted from executable files. Each API or DLL encountered during static analysis is treated as a unique node in the graph structure. Relationships between API calls are represented as edges in the graph structure. Edges represent relationships between these nodes. For API nodes, a directed edge is drawn from one API to the next based on their sequential appearance in the call trace. Similarly, edges between DLLs or API and DLL nodes represent functional associations or co-usage patterns. In addition to temporal edges between API calls, we construct edges from API nodes to the corresponding DLLs that implement or invoke those functions. This dual relationship modeling enhances the semantic richness of the graph and enables more accurate behavior profiling. For example, if software calls the API “CreateFile” and then calls the API “WriteFile”, a directed edge is created between these two nodes. Edges are designed to reflect the temporal order of API calls. Alternatively, relationships can be established between APIs called within the same transaction. However, since static analysis data are used in this study, a control flow relationship based on temporal order is preferred. This approach is practical in understanding behavioral patterns that are frequently seen in malware. We can model DLL and API Calls using graph theory to represent software behavior. The rationale behind using a graph representation lies in its ability to reflect the behavioral flow of a program. By modeling API call sequences and DLL usages as connected nodes, the framework understands meaningful execution patterns. Each API Call and DLL is considered as a node, while the relationships between these nodes are represented by edges (Equation (1)). The following explains how to define this graph structure:
G = ( V , E )
Node Set (V ): each API call is defined as a node (Equation (2)). The consecutive calls or operations performed in a specific order between the API calls constitute the node set. Similarly, DLL files are defined as nodes (Equation (3)). DLLs are dynamic libraries associated with specific API calls.
V API = { v 1 , v 2 , , v i }
V DLL = { d 1 , d 2 , , d i }
Here, v i represents the i t h API call, and di represents the i t h DLL. Edge Set (E): whenever an API call follows another API call, a directed edge is drawn between these two nodes (Equation (4)). For example, if the API call “CreateFile” is followed by “WriteFile”, an edge is created between these two nodes:
E API = { ( v i , v j ) v i v j }
For instance, if a software makes three consecutive API calls “CreateFile” → “WriteFile” → “CloseHandle”, we represent these calls with three nodes ( v 1 , v 2 , v 3 ) and two edges (( v 1 , v 2 ), ( v 1 , v 3 )). If a DLL implements multiple API calls or is used in conjunction with another DLL, directional edges can be created between these DLLs (Equation (5)).
E DLL = { ( d i , d j ) d i d j }
For example, in cases where the files “kernel32.dll” and “user32.dll” work together, an edge is drawn between these two DLLs. Figure 1 presents an example API call sequence graph constructed from a PE file. Each node corresponds to an individual API function, and directed edges indicate the chronological order in which these functions are invoked. For instance, GetFileSize is followed by PostMessage, which is then succeeded by FreeLibrary and subsequently by GetCurrentProcess. This sequence continues through various file and process-related API calls, capturing the behavioral flow of the executable. Such graph representations allow the model to understand not only the occurrence of specific API calls but also their contextual relationships within the execution chain, an essential factor in accurate malware detection.

3.2. Graph Node Embedding

After graphs are created, node features need to be converted to vectors. For this purpose, we used Node2Vec and GraphSAGE embedding techniques in our study. These techniques are explained in detail below.

3.2.1. Node2Vec

Node2Vec is an algorithm that converts graph nodes into vectors (embedding) [27]. These vectors represent the structural features of the graph (topology) and the relationships between nodes. Node2Vec performs random walks on the graph starting from a certain node. During these walks, the context of the nodes is determined. Node sequences created by random walks are treated as word sequences, and embeddings are created using Word2Vec. In practice, a walk length of 30 and 200 walks per node, and 128-dimensional embeddings based on experimental validation were used. Algorithm 1 shows the pseudocode of the Node2Vec algorithm.
Algorithm 1 Node2Vec Random Walk and Embedding Learning
Input: Graph G = ( V , E ) , embedding dimension d, walk length l, walks per node r, context window size k, return parameter p, in-out parameter q
Output: Feature representations f
  1:
Compute transition probabilities π using parameters p and q
  2:
Create weighted graph G = ( V , E , π )
  3:
Initialize list all_walks as empty
  4:
for each node u V  do
  5:
    for  i = 1 to r do
  6:
         w a l k RandomWalk( G , u , l )
  7:
        Append w a l k to all_walks
  8:
    end for
  9:
end for
10:
Train Skip-Gram model on all_walks using context window size k to obtain embeddings f
11:
return f
12:
function RandomWalk( G , s t a r t _ n o d e u , l e n g t h l )
13:
    Initialize walk  [ s t a r t _ n o d e ]
14:
    while length of walk  < l  do
15:
         c u r r _ n o d e ← last node in walk
16:
         n e i g h b o r s GetNeighbors( c u r r _ n o d e , G ) ▹ GetNeighbors, returns the set of neighboring nodes directly connected to the given node in the graph G.
17:
         n e x t _ n o d e AliasSample( n e i g h b o r s , π ) ▹ The AliasSample, samples the next node among neighbors according to their pre-calculated transition probabilities.
18:
        Append n e x t _ n o d e to walk
19:
    end while
20:
    return walk
21:
end function

3.2.2. GraphSAGE

GraphSAGE creates embeddings for nodes using node features and the local structure of the graph [28]. Only a certain number of neighboring nodes are selected for a node. The features of the selected neighboring nodes are combined with a specific function (e.g., mean, maximum, LSTM). Embedding is created by combining the information from neighboring nodes with the target node’s features. GraphSAGE uses aggregation functions to aggregate the information accumulated in the node’s local neighborhood. The graphic illustration of the GraphSAGE sample and the aggregate approach is shown in Figure 2.
Specifically, at each iteration or layer depth k, each node v collects feature information from its N ( v ) neighbors. This collection process can be performed by different methods such as mean pooling, LSTM-based aggregation, or max pooling. The representation of each node v at depth k is expressed as h v k (Equation (6)) [28].
h v k = σ W k · CONCAT h v k 1 , AGGREGATE k { h v k 1 , u N ( v ) }
where W k is the trainable weight matrix in layer k, σ is the non-linear activation function, h v k 1 is the representation of the node features from the previous layer, and AGGREGATE is the aggregator function that collects information from neighbors of v.

3.3. Custom CNN-GRU-3 Model

In this study, a hybrid CNN-GRU-3 architecture was selected to utilize the strengths of both convolutional and recurrent layers. The CNN layers effectively understand local patterns and spatial features from the API-DLL embeddings, while the stacked GRU layers are well-suited for modeling sequential dependencies across time steps. This combination enables the model to learn low-level patterns and long-term behavioral dependencies, which is essential to identifying complex malware behaviors accurately. The model has three convolutional layers, three grouping layers, three GRU layers, and one fully connected layer. The size of the convolutional layer used for feature extraction is 3 × 3. We use the Exponential Linear Unit (ELU) activation function [29]. Max-pooling layers with 2 × 2 kernels reduce the feature map dimensions, followed by a smoothing layer that transforms the output into a one-dimensional vector. The model architecture includes one GRU layer with 512, 256, and 128 neurons, a depth of 3, and a dropout rate of 0.3. Finally, a fully connected dense layer with 64 neurons and a Rectified Linear Unit (ReLU) activation function is added, followed by a dense layer with a single neuron and a Sigmoid activation function. This GRU component increases the ability of the model to distinguish complex patterns in sequential data. The proposed architecture that mixes two DL models is shown in Figure 2. The optimization process for the model included 150 epochs during training and a batch size of 64. The Adam optimizer with a learning rate of 0.001 was preferred for adaptive learning rate computations, making it a suitable choice for efficient optimization. The dataset is split into 80% training and 20% test sets and trained with 5-fold cross-validation. The pseudocode for the custom CNN-GRU-3 model is given in Algorithm 2.
Algorithm 2. Pseudocode for Custom CNN-GRU-3 Model
Input:  X train_input , X train_output
Output: Trained CNN-GRU-3 model and classification performance metrics
  1:
function ModelTraining(X_train_input, X_train_output)
  2:
    Apply convolutional layers with ELU activation:
  3:
        Conv1D(filters=64, kernel_size=3), activation=ELU
  4:
        MaxPooling1D (pool_size=2)
  5:
        Conv1D(filters=64, kernel_size=3), activation=ELU
  6:
        MaxPooling1D (pool_size=2)
  7:
        Conv1D(filters=64, kernel_size=3), activation=ELU
  8:
        MaxPooling1D (pool_size=2)
  9:
    Apply a Flatten layer
10:
    GRU Layers:
11:
        GRU Layer 1: 512 units, dropout=0.3
12:
        GRU Layer 2: 256 units, dropout=0.3
13:
        GRU Layer 3: 128 units, dropout=0.3
14:
    Fully Connected Output Layers:
15:
        Dense: 64 units, dropout=0.3, activation=ReLU
16:
        Dense: 1 unit, activation=Sigmoid
17:
       Output layer with sigmoid activation for 2 classes
18:
    Training and Evaluation:
19:
       Train model using Adam optimizer and binary_crossentropy loss
20:
       Evaluate model performance
21:
end function
The embeddings developed by GAT are arranged in a time series-like sequence to provide data input to the CNN-GRU model. The embedding of each node is placed in the sequence according to the original order of the API calls. This arrangement allows CNN to understand spatial relationships between adjacent nodes and GRU to understand sequential patterns. For example, if the API call order in a software is [“CreateFile”, “WriteFile”, “CloseHandle”], the embeddings of these calls are fed into the model in the same order. This approach allows graph data to be aligned with time-series models.

3.4. Ensemble Learning Approach

Ensemble learning can be particularly effective in malware classification because it combines multiple models to catch complex patterns and situations that a single model might miss [30]. Malware data present unique challenges, such as high dimensionality, diverse patterns across different malware families, and imbalanced class distributions (malicious vs. benign). Each model provides insight into different aspects. For example, neural networks like CNNs and LSTMs are good at identifying sequential patterns in API call sequences. At the same time, tree-based methods like Random Forest (RF) or XGBoost (XGB) can better handle data with complex interactions [31,32]. Combining these models allows an ensemble to benefit from the fact that each model better analyzes different features of malware data. In this study, an ensemble learning approach is applied with a soft voting classifier of the predictions of the best-performing models. The probabilities generated by each model are averaged to determine the final prediction [33,34]. The best results from the XGB, RF, Decision Tree (DT), LightGBM, and Adaboost models are combined with the voting mechanism to form a final classification model [35,36,37]. The dataset is split into 80% training and 20% test sets and trained with 5-fold cross-validation.

3.5. Graph Attention Network Classifier

Graph Neural Networks (GNNs) are DL models that perform learning on data in a graph structure at the node, edge, or graph level [38]. Unlike traditional neural networks, GNNs extract features for each node by considering the topological relationships and contextual information between nodes and represent these nodes as vectors [39]. GNNs generally use the message-passing method [2]. In this method, each node receives information from its neighbors and combines it with its features to create an updated node representation. In recent years, GNNs have achieved significant performance gains in many tasks such as Graph Convolutional Networks (GCNs) [40], GraphSAGE [28], and GAT [41]. Therefore, many studies have started to rely on GNNs for malware analysis. GAT is an improved version of GNNs and dynamically determines the importance of neighbors by giving different weights to the information from the neighbors of each node [42]. Using the attention mechanism, GAT learns the importance of each node relationship and thus obtains better node representations [43]. GAT calculates an attention coefficient ( e v u ) for each node v and its neighbor u. This coefficient is calculated using the feature vectors ( h v and h u ) of node v and its neighbor u as follows:
e v u = LeakyReLU a T · W h v W h u
where a is the learnable weight vector, W is the learnable weight matrix, W h v W h u is the concatenation of the feature vectors of nodes v and u. LeakyReLU is an activation function that provides a small slope for negative values. The attention coefficients are normalized by the softmax function, so that the sum of the attention coefficients among the neighbors of node v is 1:
α v u = exp ( e v u ) k N ( v ) exp ( e v k )
where α v u determines the influence of node u on node v. This normalization process expresses the relative importance of neighbors. Each node v creates a new node representation h v by weighting the features from its neighbors with their normalized attention coefficients:
h v = σ u N ( v ) α v u W h u
This formula allows the node to be updated by considering its neighbors’ information. Thus, each node has richer information, not only about itself but also about its neighbors. GAT generally uses the multi-head attention mechanism. This mechanism learns the representation of a node using multiple independent attention heads and combines the results of these heads. The multi-head attention mechanism is formulated as:
h v = k 1 K σ u N ( v ) α v u k W k h u
where K denotes the number of attention heads and k 1 K denotes the concatenation of heads. This method allows capturing different relationships between nodes and creating a more robust node representation. All notations and explanations in the study are given in Table 1.
The role of GAT has been evaluated both as a standalone classifier and feature extractor in different scenarios. In Experiment 2, GAT was used as a standalone classifier, and its performance was compared with the combinations of Node2Vec + GAT and GraphSAGE + GAT. This experiment aims to examine the effectiveness of GAT in malware detection by directly exploiting the contextual relationships between nodes and neighbors. In Experiment 3, the node embeddings obtained using Node2Vec and GraphSAGE were further improved with GAT, and these improved embeddings were evaluated with custom CNN-GRU-3 and ensemble learning models. This experiment aims to demonstrate the potential of GAT to improve classification performance by making node embeddings more contextual. Finally, in Experiment 4, GAT was used only as a feature extractor, and the embeddings obtained from graph data were fed to CNN-GRU-3 and ensemble learning models. In this experiment, we examined how GAT provides a performance increase over other classifiers by improving the features obtained from the nodes. The details of these experiments are given in Section 4.

3.6. Dataset

The dataset, which was created using API Call and DLL sequences extracted from Windows PE files, initially consisted of 1000 benign and 1000 malicious software samples. In order to increase the performance of the dataset and provide a more robust evaluation, the amount of data for each category was increased to 4000 using the data augmentation method, as shown in Table 2. As a result of this process, a total of 8000 data samples (4000 benign and 4000 malicious) were obtained. This balanced dataset reduces bias during model training and increases model performance. The features and descriptions of the dataset are shown in Table 3.
In our graph construction process, we integrate two distinct features extracted from each PE file: the sequence of API calls and the list of imported DLLs. Both API calls and DLLs are represented as nodes in a unified directed graph. Sequential API calls are connected with directed edges to understand the temporal execution flow. In addition, for every API call in the sequence, we establish directed edges pointing to all DLL nodes associated with the file. This way reflects potential dependencies or origins of the API calls, even in the absence of exact DLL-API pairings. Combining dynamic behavior (via API sequences) and static structural context (via DLL imports) into a single graph provides the model with a rich and comprehensive representation of each sample. This enables downstream models like GAT to learn behaviorally and contextually better relevant patterns for distinguishing between benign and malicious files. Different embedding techniques, such as Node2Vec, GraphSAGE, and GAT, were used to represent the graph nodes. Feature selection was performed to identify the highly significant features that could improve the model’s performance. For this purpose, features were ranked using SelectKBest and ANOVA (Analysis of Variance) F-value, and their significance was visualized. In Figure 3, feature names are shown on the x-axis, and significance scores are shown on the y-axis. For this purpose, features were ranked using the SelectKBest method and ANOVA F-value, and their significance was visualized. ANOVA F-value is a statistical method used to measure the discrimination power of each feature in a dataset on the target variable by calculating the ratio between the between-class variance and within-class variance. In this study, the SelectKBest method from Scikit Learn [44] was utilized to calculate each feature’s ANOVA F-value [45]. Features were then sorted in descending order based on their F-values, and the top k features with the highest impact on the target variable were selected. This process enabled the model to perform better using fewer features, prioritizing those with the most contextual and meaningful information. Using ANOVA F-value in selecting features played a critical role in improving classification performance by focusing on the most significant attributes in the dataset.

4. Proposed Approach and Experiments

This section presents the proposed malware detection framework in a formalized structure, followed by four distinct experimental configurations designed to evaluate the contribution and interaction of its core components. Before a detailed analysis of the experiments, we outline the structural relationship between the experimental setups and the proposed framework. The experiments were designed as follows: (i) graph-based node embedding, achieved through Node2Vec or GraphSAGE to understand topological and semantic features from API and DLL graphs; (ii) contextual refinement of embeddings through the GAT, which assigns importance weights to neighboring nodes using attention coefficients; and (iii) final classification using either a custom hybrid CNN-GRU-3 model, optimized for sequential pattern recognition, or an ensemble of traditional ML classifiers. The experiments were designed as follows:
  • Experiment 1: to assess their baseline performance, Node2Vec and GraphSAGE embeddings were paired with CNN-GRU-3 and ensemble learning models.
  • Experiment 2: GAT was used as a standalone classifier, and its effectiveness was compared with the combinations Node2Vec + GAT and GraphSAGE + GAT.
  • Experiment 3: Node2Vec and GraphSAGE embeddings were refined by GAT, and enhanced embeddings were evaluated using CNN-GRU-3 and ensemble learning.
  • Experiment 4: GAT was used solely as a feature extractor, and the resulting embeddings were classified using CNN-GRU-3 and ensemble learning.
Each of the four experiments explores different configurations of these components to assess their individual and combined contributions. Specifically, Experiment 1 evaluates the baseline performance of Node2Vec and GraphSAGE embeddings using CNN-GRU-3 and ensemble classifiers without GAT. Experiment 2 measures the standalone classification capability of GAT and its integration with initial embeddings. Experiment 3 corresponds to the proposed framework, where GAT refines the embeddings, and CNN-GRU-3 performs classification. Experiment 4 analyzes GAT solely as a feature extractor prior to classification. This experimental design allows for a modular and comparative evaluation of each architectural component and demonstrates how their integration leads to the performance gains achieved by the whole framework.

4.1. Experiment 1: Graph Embedding with Node2Vec and GraphSage Embedding—Comparison of Graph Node Embeddings

In Experiment 1, node embeddings obtained using Node2Vec and GraphSAGE are paired with CNN-GRU-3 and ensemble learning models to evaluate their baseline performance. This experiment aims to perform a baseline performance evaluation by comparing the contribution of both embedding methods to the classification process. For each node v, an embedding is created using Node2Vec or GraphSAGE:
h v = Node 2 Vec ( v ) or h v = GraphSAGE ( v )
These embeddings are used as a vector representation of each node in low-dimensional space. Embeddings are given as input to CNN-GRU-3 and ensemble learning models. These classifiers perform malware detection using node representatives.
y = f ( h v ) , f { CNN - GRU - 3 , Ensemble L . }

4.2. Experiment 2: GAT as Classifier with Node2Vec and GraphSage

In Experiment 2, GAT is used as a standalone classifier, and the results are compared with the combinations of Node2Vec + GAT and GraphSAGE + GAT. This experiment analyzes the performance of GAT as a standalone classifier and its contribution when used with other embedding methods. In the same manner as Experiment 1, embedding is generated for each node using Node2Vec or GraphSAGE. Using these embeddings, GAT analyzes the relationships between nodes and creates a new representation h v for each node:
h v = σ u N ( v ) α v u W h u
In the last layer of GAT, a Sigmoid activation function is used to classify the resulting node representations. The sigmoid activation function used in the last layer of GAT makes it possible to estimate the probability (between 0 and 1) that a node belongs to a certain class in two-class malware detection. This function provides a non-linear activation, allowing the model to distinguish between classes more precisely.
y ^ v = σ ( W h v )
Here, W represents the learnable weights, and the Sigmoid activation function reduces the output of the model to the range [0, 1], which is especially suitable for binary classification. The model is trained using a loss function between the model outputs y ^ v and the true labels  y v :
L = v y v log ( y ^ v ) + ( 1 y v ) log ( 1 y ^ v )
This last layer and activation process is one of the necessary steps for using GAT as a classifier. This allows it to transform the node representations of the GAT model into a classification output that will decide on the presence or absence of malware. This allows GAT to be effectively used as a standalone classifier.

4.3. Experiment 3: Enhancing Node Embedding Using GAT with Node2Vec and GraphSAGE

In Experiment 3, GAT enhances the initial embeddings generated by Node2Vec and GraphSAGE with attention mechanisms. The initial embeddings understand the structural relationships of the nodes but may lack context information. GAT contextually enriches the embeddings by computing the contributions of neighboring nodes with attention weights. For example, in cases where an API call indicates malware behavior, GAT can assign a higher weight to this node. This process is achieved by directly feeding the embeddings from node2vec/GraphSAGE into the GAT layers. As a result, the resulting attention-enhanced embeddings become more meaningful and suitable for classification. This experiment evaluates the embedding improvement ability of GAT and the performance of these embeddings when used with more complex classifiers. The embedding h v for each node is generated with Node2Vec or GraphSAGE. GAT enhances these embeddings with information from neighboring nodes:
Z v = σ u N ( v ) α v u W ( h u )
For each neighbor u of node v, the neighbor’s feature vector h u is first multiplied by the weight matrix (W). This transforms the node’s features to account for their influence on node v. This transformed feature vector W ( h u ) is then multiplied by the attention coefficient α v u . This expresses how much the neighbor node contributes to node v relative to its importance. The contributions of all neighbors of node v are summed N(v). This process allows node v to contextually obtain information from its neighbors and incorporate it into its representation. After the addition process, the resulting total value is inserted into an activation function σ .

4.4. Experiment 4: Extracting Features Using Single GAT

In Experiment 4, GAT is used solely as a feature extractor, and the resulting embeddings are given as input to CNN-GRU-3 and ensemble learning models. This experiment aims to analyze the effectiveness of GAT as a feature extractor and its classification success when combined with other classifiers.

4.5. Proposed Framework

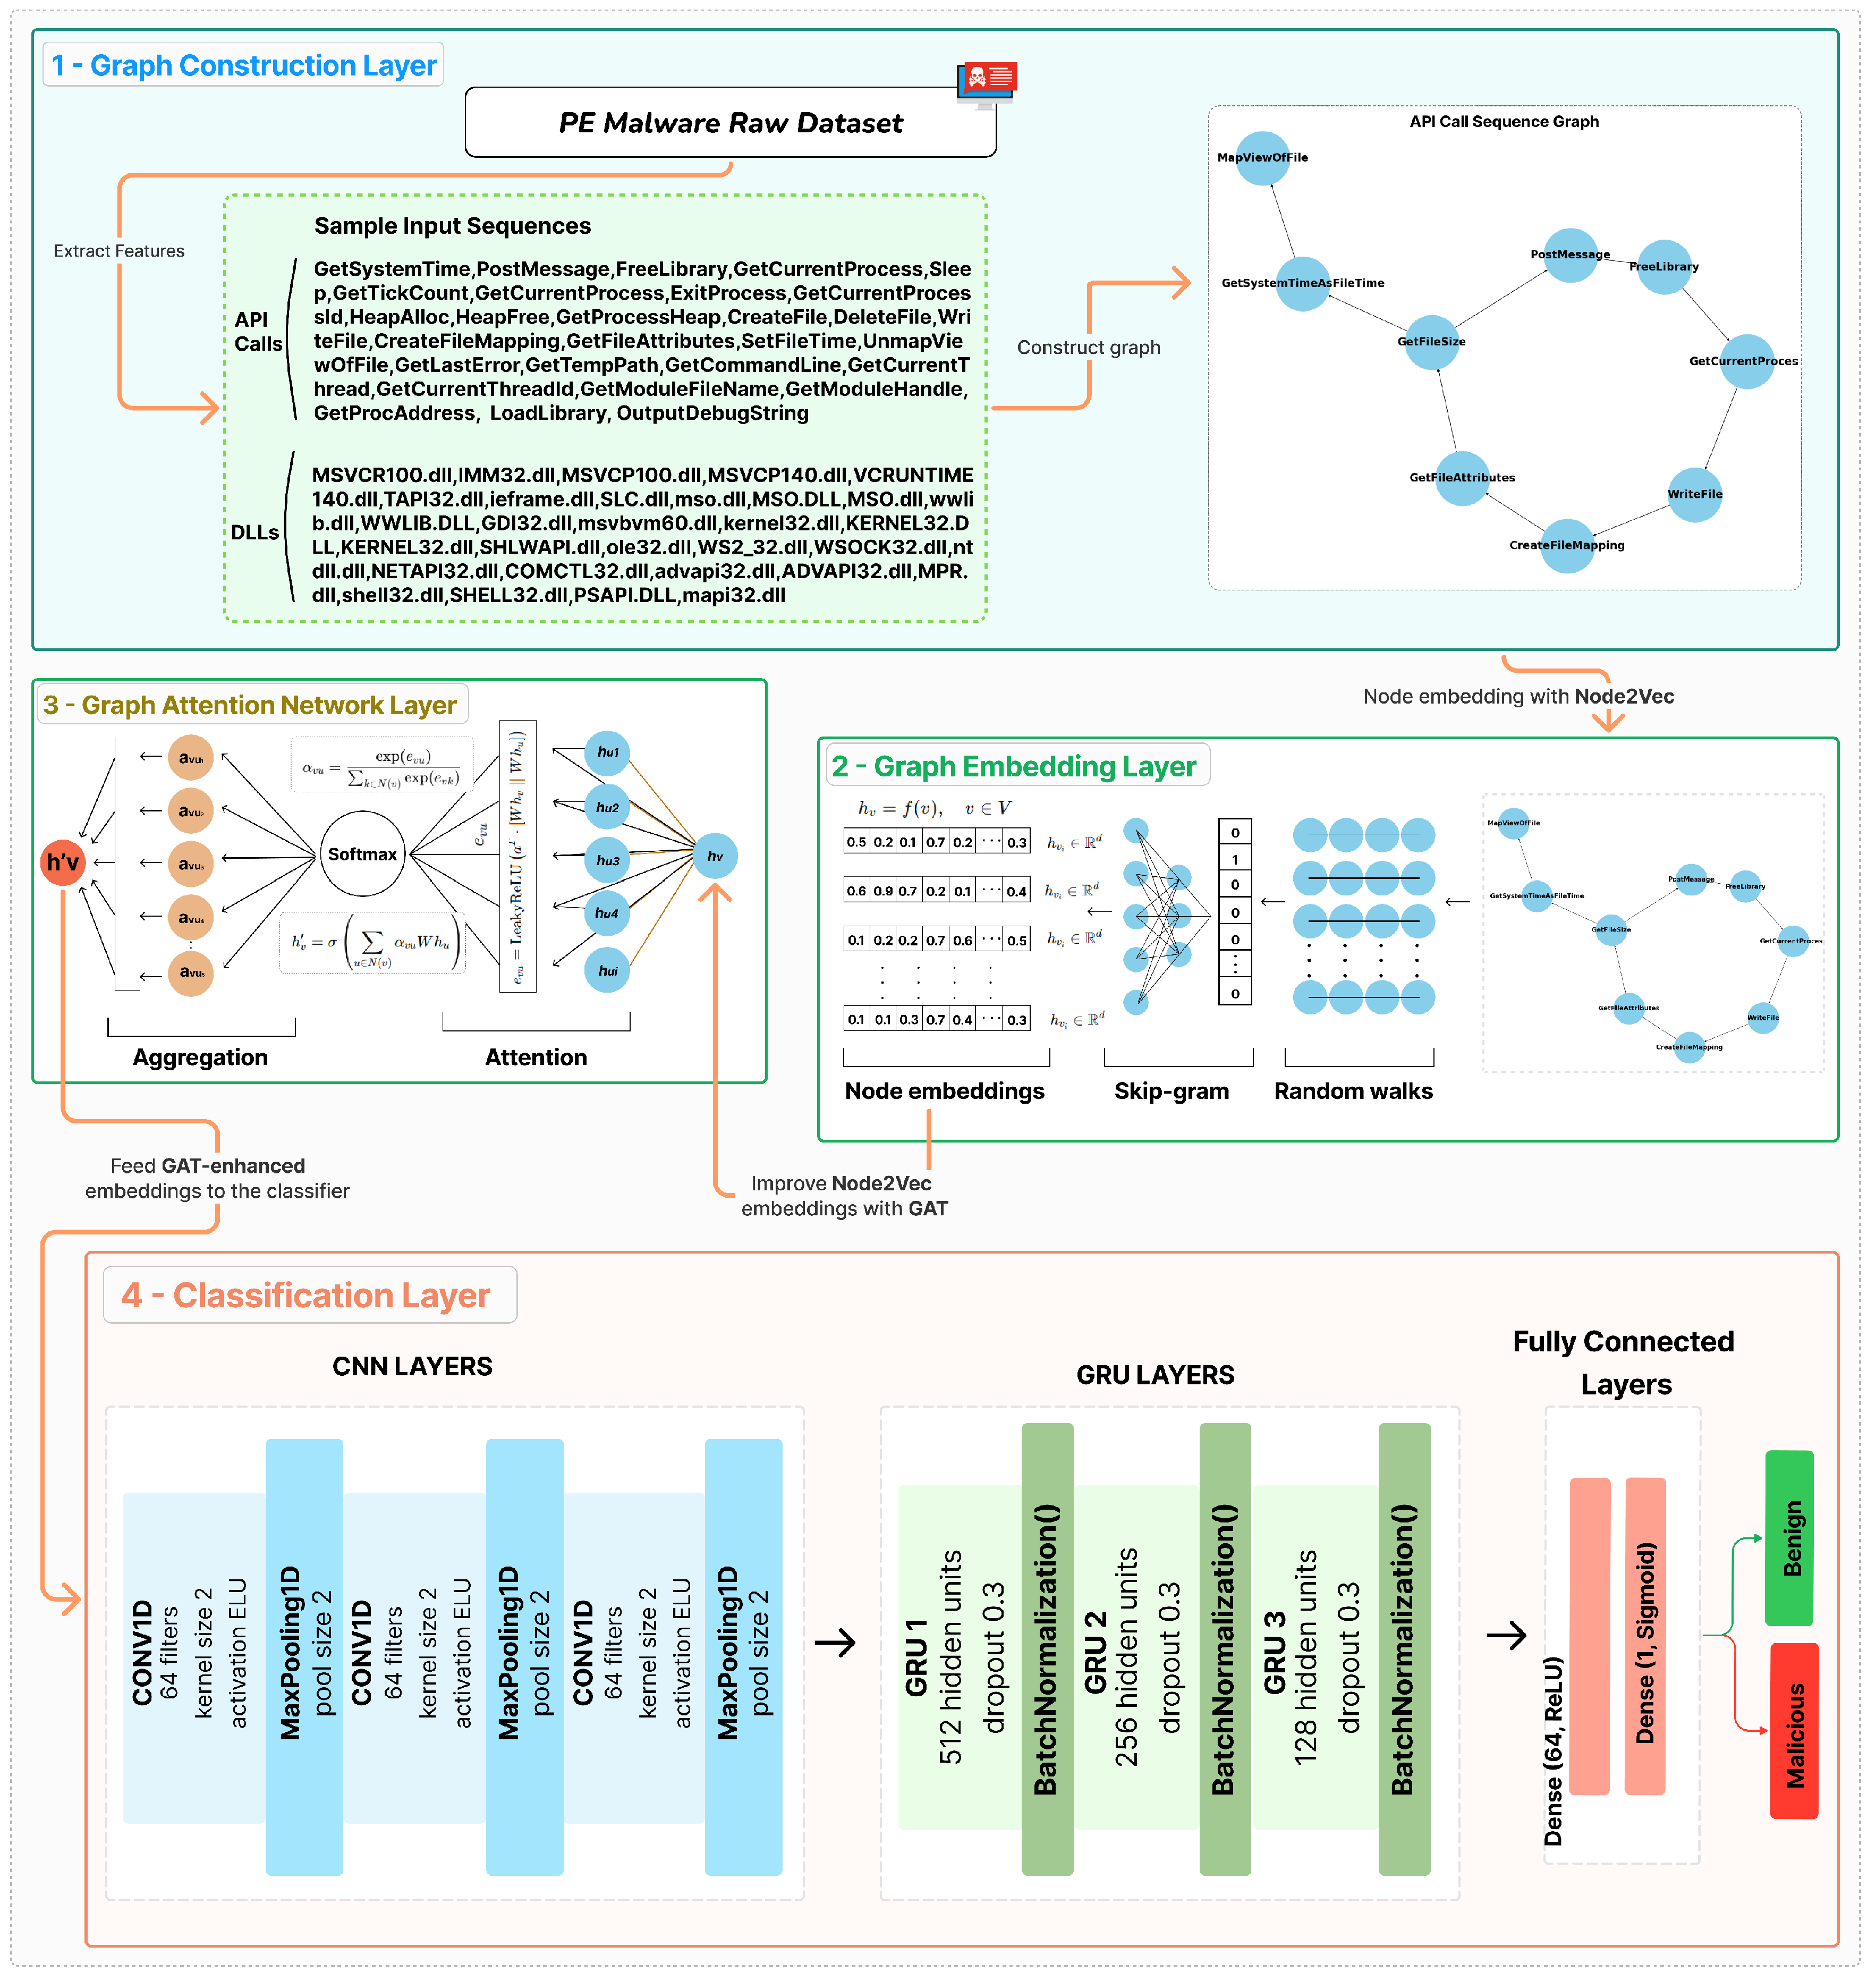
This work presents a novel malware detection framework that integrates graph-based methodologies with DL approaches. The proposed model uses Node2Vec, GAT, and CNN-GRU-3 in a novel structure to exploit structural and contextual relationships in malware data. The overall proposed framework is shown in 
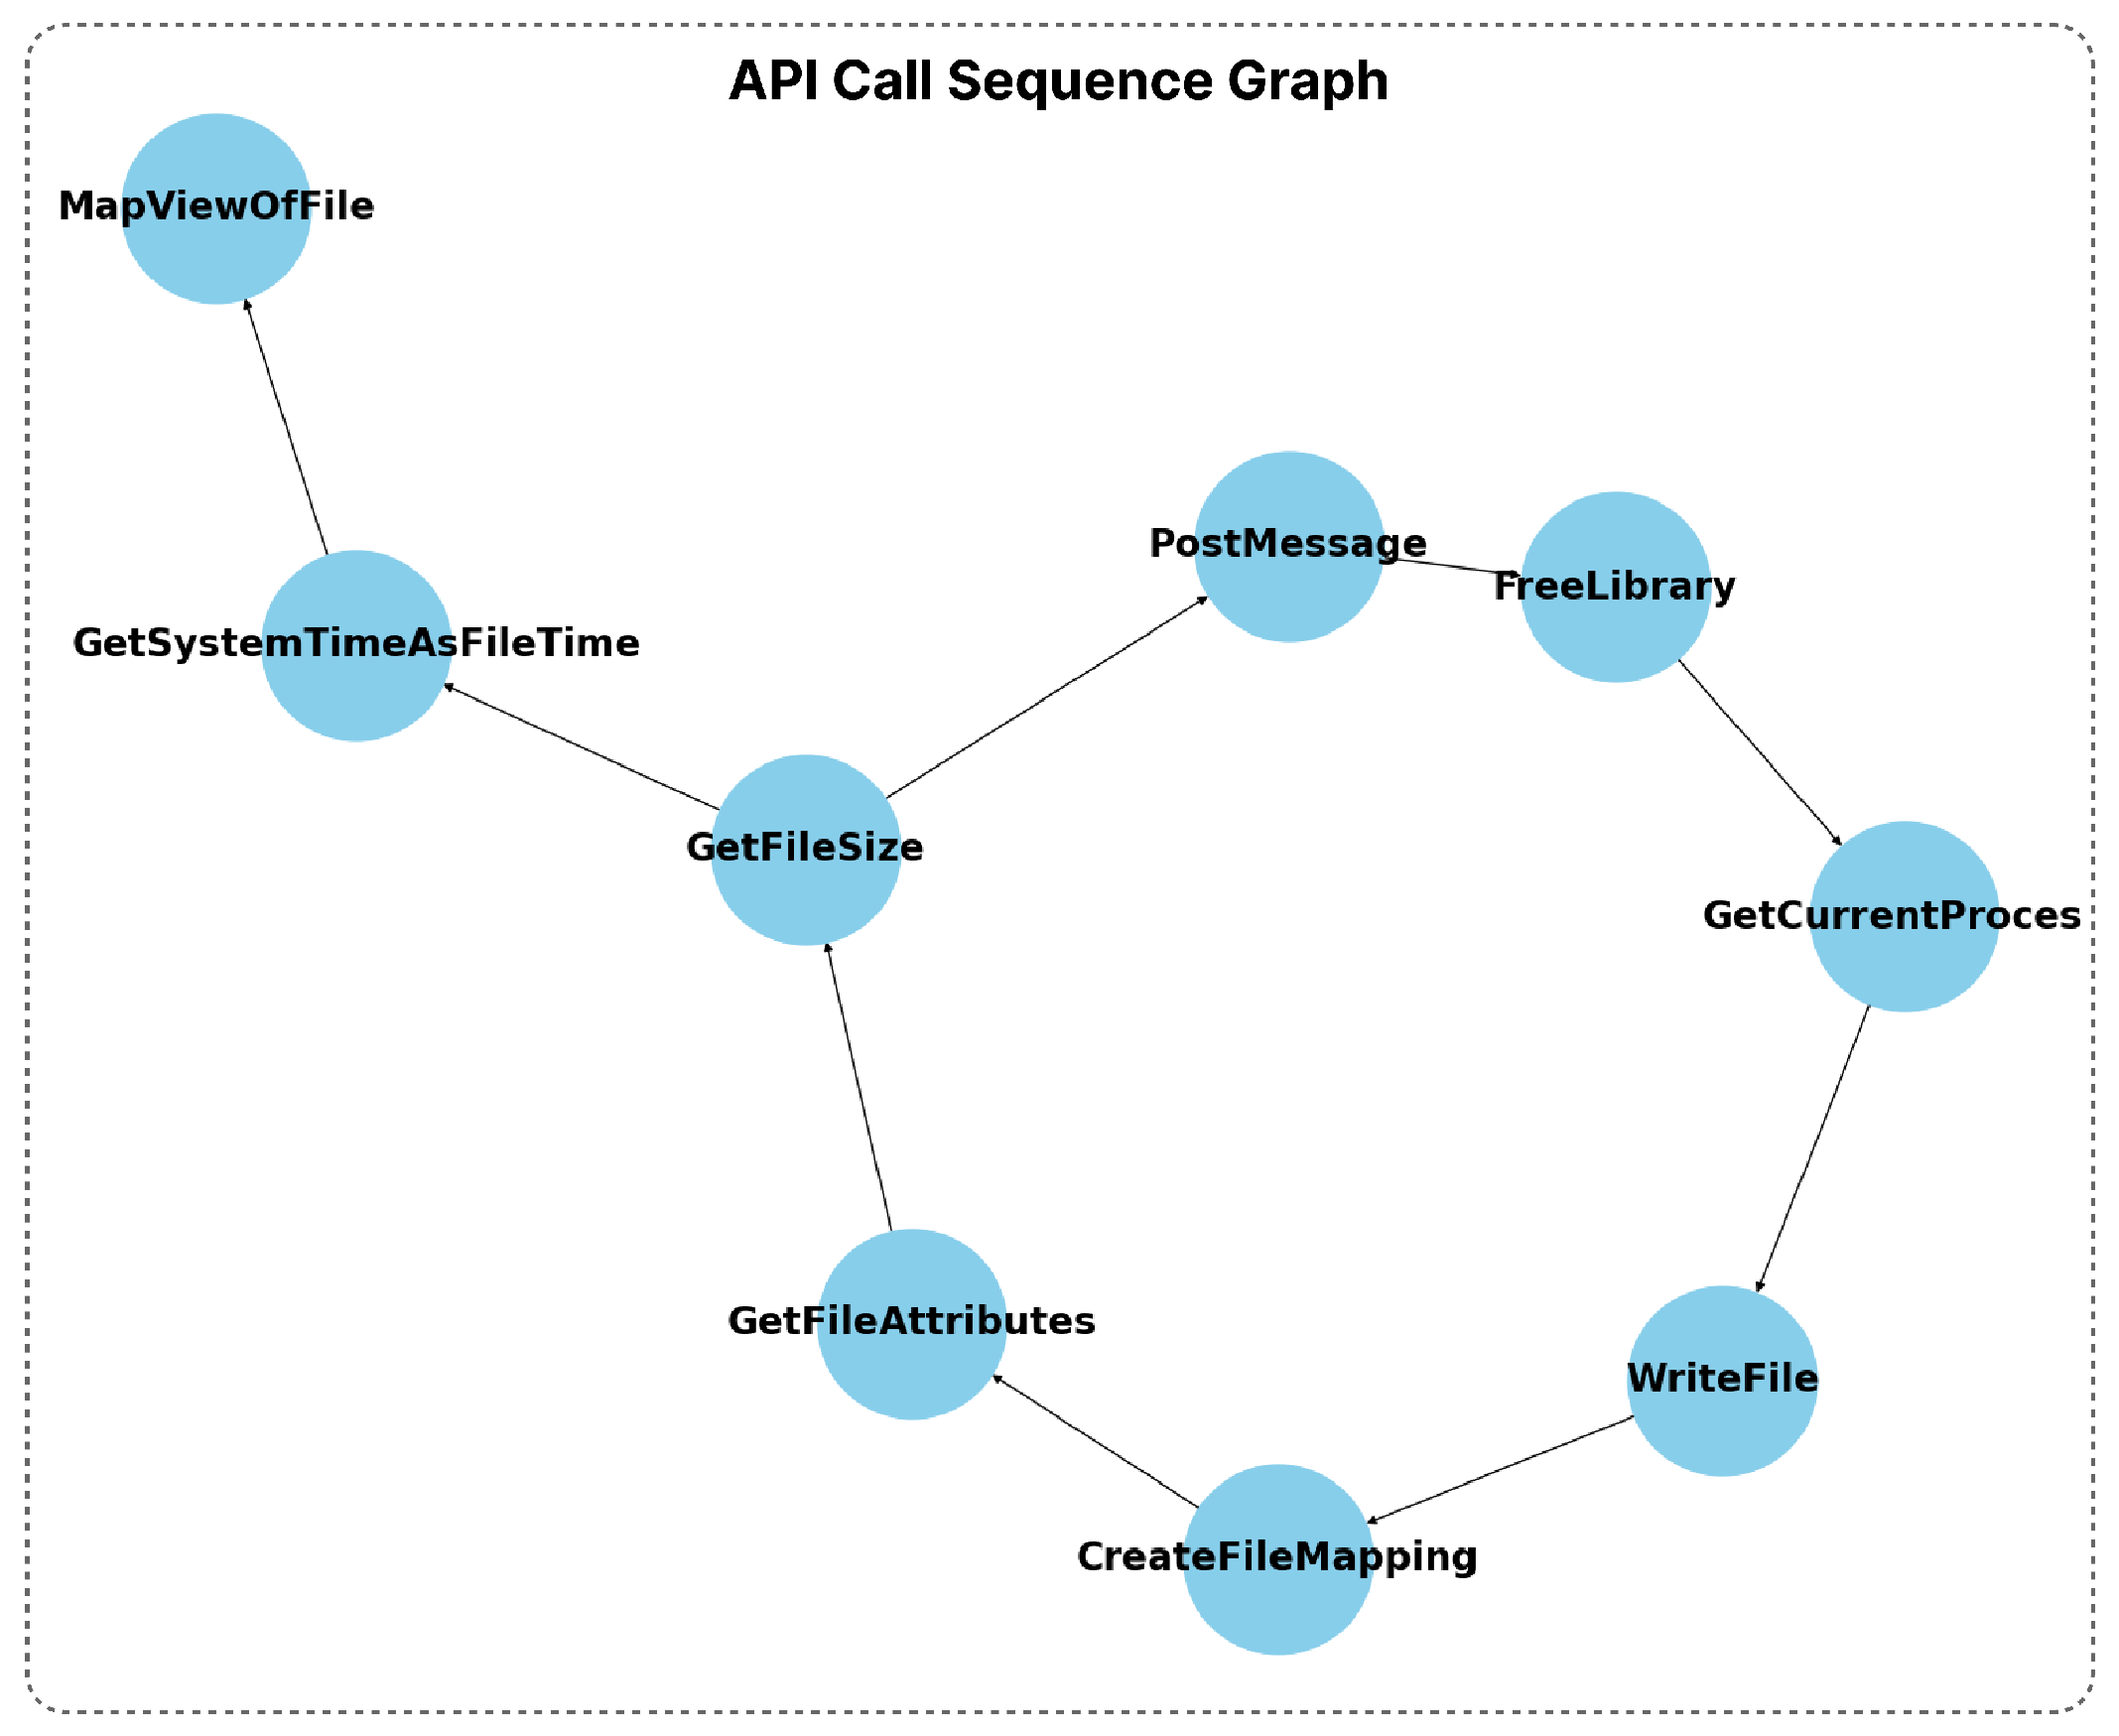
Figure 4, and the pseudocode is given in Algorithm 3. The model aims to extract and enhance semantic features from API call sequences and DLL information. First, the graph is constructed using API call sequences and DLL information, where nodes represent API calls or DLLs and edges represent interactions between them. Then, initial node embeddings are generated using Node2Vec via random walks that understand structural relationships in the graph. The embeddings are enhanced using GAT by applying attention mechanisms to improve contextual relationships. Finally, the GAT-enhanced embeddings are fed into the CNN-GRU-3 model, which performs the final classification to detect malware.
Algorithm 3. Pseudocode for Node2Vec + GAT + CNN-GRU-3 Training Pipeline
  1:
Input: Graph G = ( V , E , W ) , Dimensions d, Walks per node r, Walk length l, Context size k, Return parameter p, In-out parameter q, Number of epochs n
  2:
Output: Predicted class labels y ^
  3:
function Node2VecEmbedding( G , d , r , l , k , p , q )
  4:
     π = PreprocessModifiedWeights( G , p , q )
  5:
     G = ( V , E , π )
  6:
    Initialize w a l k s as Empty
  7:
    for  i t e r = 1 to r do
  8:
        for each node u V  do
  9:
            w a l k = Node2VecWalk( G , u, l)
10:
           Append w a l k to w a l k s
11:
        end for
12:
    end for
13:
    f = StochasticGradientDescent(k, d, w a l k s )
14:
    return f
15:
end function   
  
16:
function GAT(f, Adjacency Matrix A, Attention Parameters W, a)
17:
    Initialize attention coefficients: e v u
18:
    Normalize attention coefficients: α v u
19:
    Update node embeddings: Z v
20:
    return Z
21:
end function   
  
22:
function TrainCNNGRU3(Z, Y, n)
23:
    Input Z
24:
    Pass Z through convolutional layers:
25:
        Conv1D: 64 filters, kernel size 3, activation ELU, then MaxPooling1D
26:
        Conv1D: 64 filters, kernel size 3, activation ELU, then MaxPooling1D
27:
        Conv1D: 64 filters, kernel size 3, activation ELU, then MaxPooling1D
28:
    Flatten the output of convolutional layers
29:
    Pass through GRU layers:
30:
        GRU1: 512 hidden units, dropout 0.3
31:
        GRU2: 256 hidden units, dropout 0.3
32:
        GRU3: 128 hidden units, dropout 0.3
33:
    Fully connected layers:
34:
        Dense1: 64 units, dropout 0.3, activation ReLU
35:
        Dense2: 1 unit, activation Sigmoid
36:
    Compile model with Adam optimizer, binary crossentropy loss
37:
    Train model for n epochs using Z and labels Y
38:
    return trained model and predictions y ^
39:
end function
GAT’s attention mechanism improves Node2Vec embeddings by weighting the information from each node’s neighbors with attention coefficients ( α v u ) to make them more contextual. While Node2Vec understands node relationships with random walks, these embeddings only carry structural information. GAT, on the other hand, provides semantic enrichment of embeddings by calculating the importance of nodes to their neighbors ( e v u ). This process enables each node to create a more meaningful representation in its context. This contextual enrichment is evaluated with higher accuracy rates by DL classifiers. The effectiveness of the proposed model is evaluated through multiple experimental setups, where it is also compared with other graph embedding and classification techniques. The results show that the proposed Node2Vec + GAT + CNN-GRU-3 model achieves the highest accuracy of 0.9961 and outperforms other tested configurations. This achievement is due to the combination of Node2Vec’s effective structural embedding, GAT’s contextual enhancement of embeddings with an attention mechanism, and CNN-GRU-3’s sequential modeling capabilities.

4.6. Performance Metrics

This study uses various metrics to evaluate the performance of malware detection models. Accuracy (Equation (17)) determines the overall success of the model. At the same time, Recall (Equation (18)) and (Equation (19)) Precision metrics are used to measure how much malware was correctly detected and how much of the detected malware was malicious, respectively. F-measure (Equation (20)) is a measure obtained by combining recall and precision in a balanced manner, indicating the balanced success of the model. Cohen’s Kappa (Equation (21)) evaluates the reliability of the model against random guesses. At the same time, Mean Absolute Error (MAE) (Equation (22)) is used to measure how much the model’s predictions deviate from the true values. Using these metrics together provides a more comprehensive assessment of the model’s performance in malware detection.
Accuracy = T P + T N T P + T N + F P + F N
True Positive ( T P ) are true positive predictions and are cases where the model correctly detects malware; False Negative ( F N ) are cases where the model misses the malware, i.e., does not detect it despite being malicious; True Negative ( T N ) are cases where the model correctly classifies a benign software as benign; and False Positive ( F P ) are cases where a benign software is incorrectly classified as malicious.
Recall = T P T P + F N
Precision = T P T P + F P
F - Measure = 2 · Precision · Recall Precision + Recall
Cohen s Kappa ( κ ) = P 0 P e 1 P e
P 0 represents the observed agreement between raters or classifiers. P e represents the expected agreement between raters or classifiers based on chance. κ = 1 indicates perfect agreement between raters or classifiers. κ = 0 indicates agreement equivalent to what would be expected by chance. κ < 0 indicates agreement worse than what would be expected by chance.
MAE = 1 N i = 1 N | y i y ^ i |
where N is the total number of samples, y j is the actual value and y ^ j is the value predicted by the model.

4.7. Results and Evaluation

In this study, the Node2Vec + GAT + CNN-GRU-3 model proposed for malware detection was developed and compared with other methods to analyze its performance. The hyperparameters for DL models (CNN and GRU) were determined empirically based on iterative experimentation and validation performance. The CNN block uses three convolutional layers with 64 filters and ELU activation, effectively capturing local spatial features. The GRU block consists of 3 layers with decreasing hidden units (512, 256, 128) and a dropout rate of 0.3 to prevent overfitting, optimized using the Adam optimizer with a learning rate of 0.0001. For the ensemble learning models (Random Forest and XGBoost), hyperparameter tuning was performed using grid search, exploring combinations of key parameters such as the number of estimators, maximum depth, and learning rate. The best-performing configurations, as shown in Table 4, were selected based on cross-validation accuracy.
As a result of the experiments conducted with different embedding techniques (Node2Vec and GraphSAGE), contextual enhancement methods (GAT), and classifiers (CNN-GRU-3, Ensemble Learning), it is seen that our proposed model provides the highest accuracy compared to all other combinations. While implementing this study, the NetworkX [46] library was used to convert API calls and DLL information into a graph structure. While the graph nodes represent API calls and DLLs, the edges represent the relationships between these elements (e.g., call order or dependencies). We applied the Node2Vec and GraphSAGE methods to create embeddings of the nodes. For this purpose, we used node2vec and stellargraph [47] (Python 3.6 version was preferred for StellarGraph library support in the study) libraries. To further improve the obtained embeddings, we used the GAT model for contextual enrichment with attention mechanisms; the PyTorch Geometric [48] library was preferred for GAT. Finally, we designed a custom CNN-GRU hybrid model to classify the improved embeddings; we used TensorFlow/Keras libraries at this stage. During the whole process, we also used Pandas, NumPy, and Scikit-learn libraries extensively for data processing and analysis. Training and testing operations were performed in the Google Colab environment using L4 GPU, 53.0 GB system RAM, 22.5 GB GPU RAM, and 235.7 GB disk capacity. This integrated approach combined both graph-based features and the power of DL models to detect malware with high accuracy rates.
Node2Vec + GAT + CNN-GRU-3 model outperforms other Node2Vec and GraphSAGE-based models and models that use GAT as an independent classifier or use GAT for contextual enhancement, with an accuracy value of 0.9961. This result shows that the proposed model benefits from the random walk method of Node2Vec to provide a strong initial embedding, the attention mechanism of GAT to enhance contextual relationships, and the capabilities CNN-GRU-3 to model sequential data. Table 5 presents the performance results of Node2Vec and GraphSAGE embeddings with CNN-GRU-3 and ensemble learning.
When Node2Vec and GraphSAGE node embedding methods were classified with custom CNN-GRU-3 and Ensemble Learning classifiers, respectively, the best result was obtained from the Node2Vec + CNN-GRU-3 hybrid model. The Node2Vec + CNN-GRU-3 model performed better with 0.9675 accuracy, indicating that the random walk approach of Node2Vec is more effective when combined with the powerful sequential and local information extraction capabilities of CNN-GRU-3. Table 6 shows the performance results obtained using the GAT classifier and Node2Vec/GraphSAGE embeddings. The GAT model was evaluated both as a standalone classifier and combined with Node2Vec and GraphSAGE embeddings. According to the results, the Node2Vec + GAT model gave the best result with 0.9711 accuracy. When the results were examined, it was seen that the attention mechanism of GAT could process the contextual information more effectively when combined with Node2Vec embeddings. After improving the node embeddings of Node2Vec and GraphSAGE with GAT, they were classified with CNN-GRU-3 and ensemble learning classifiers. The results are shown in Table 7. GAT was used as a contextual enhancer, and the resulting embeddings were given to CNN-GRU-3 and ensemble learning classifiers. Node2Vec + GAT + CNN-GRU-3 (proposed model) gave the best result among all groups with 0.9961 accuracy. In Table 8, GAT embeddings are classified with CNN-GRU-3 and ensemble learning. The GAT + CNN-GRU-3 model showed better performance than ensemble learning with 0.9713 accuracy. This situation revealed that CNN-GRU-3 is more effective compared to ensemble learning.
The Node2Vec + CNN-GRU-3 model proved to be an effective initial embedding technique with an accuracy value of 0.9675 for Node2Vec, one of the components of the proposed model. However, when not combined with GAT and CNN-GRU-3, this model could not adequately handle contextual and sequential relationships. The Node2Vec + GAT model showed that GAT’s attention mechanism enriched the embeddings contextually with an accuracy of 0.9711. However, it performed less than the proposed model because it did not understand the sequential information with CNN-GRU-3. The GraphSAGE + GAT + CNN-GRU-3 model provided high performance with an accuracy of 0.9898 even when GraphSAGE was used instead of Node2Vec. This configuration was not as successful as the Node2Vec + GAT + CNN-GRU-3 configuration because Node2Vec can better understand contextual information with the random walk method. As seen in 
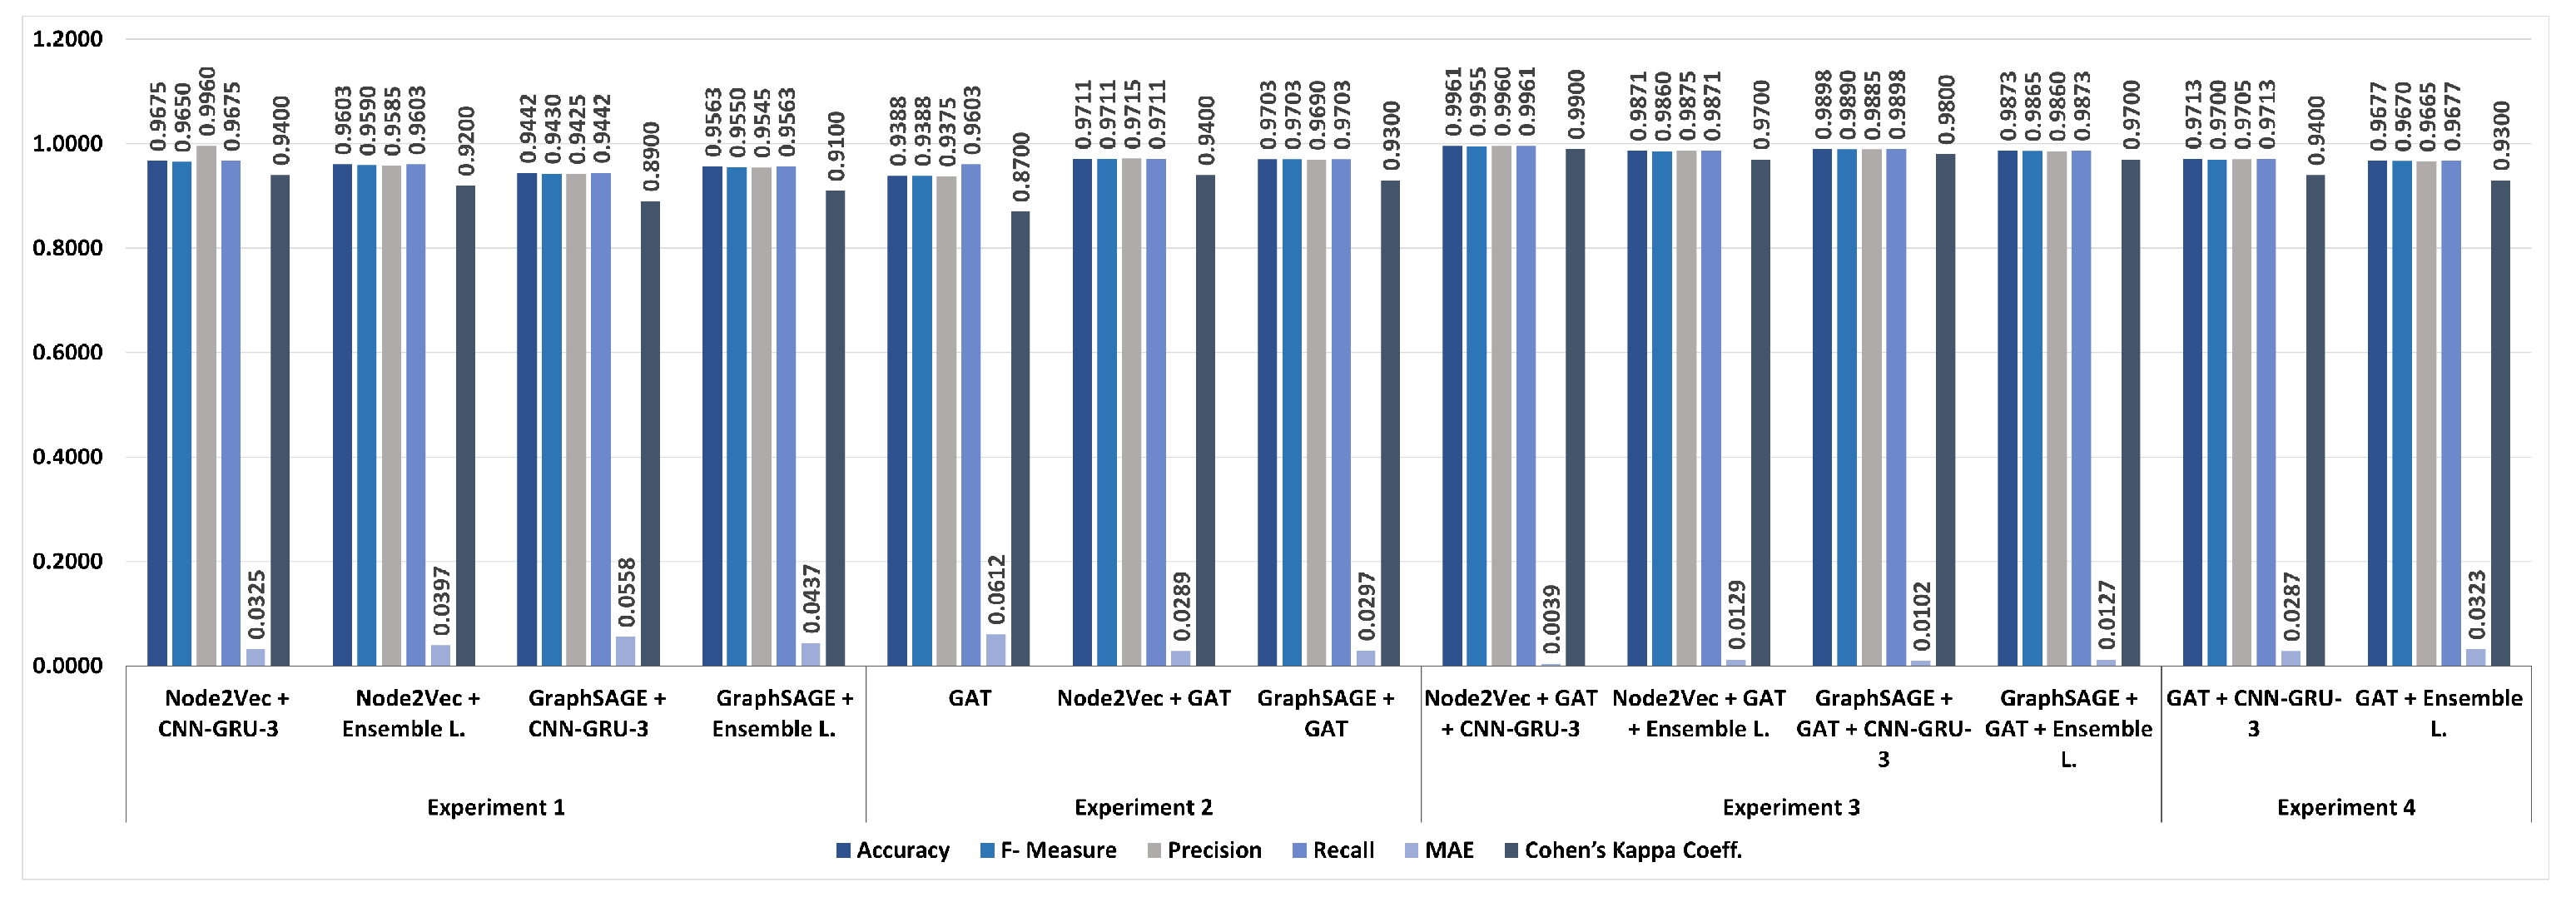
Figure 5, the models’ performance comparison reveals the proposed framework’s superiority. The performance comparison of the models, as shown in Figure 5, highlights the superiority of the proposed framework. The confusion matrix of the three models that achieved the highest accuracy is given in
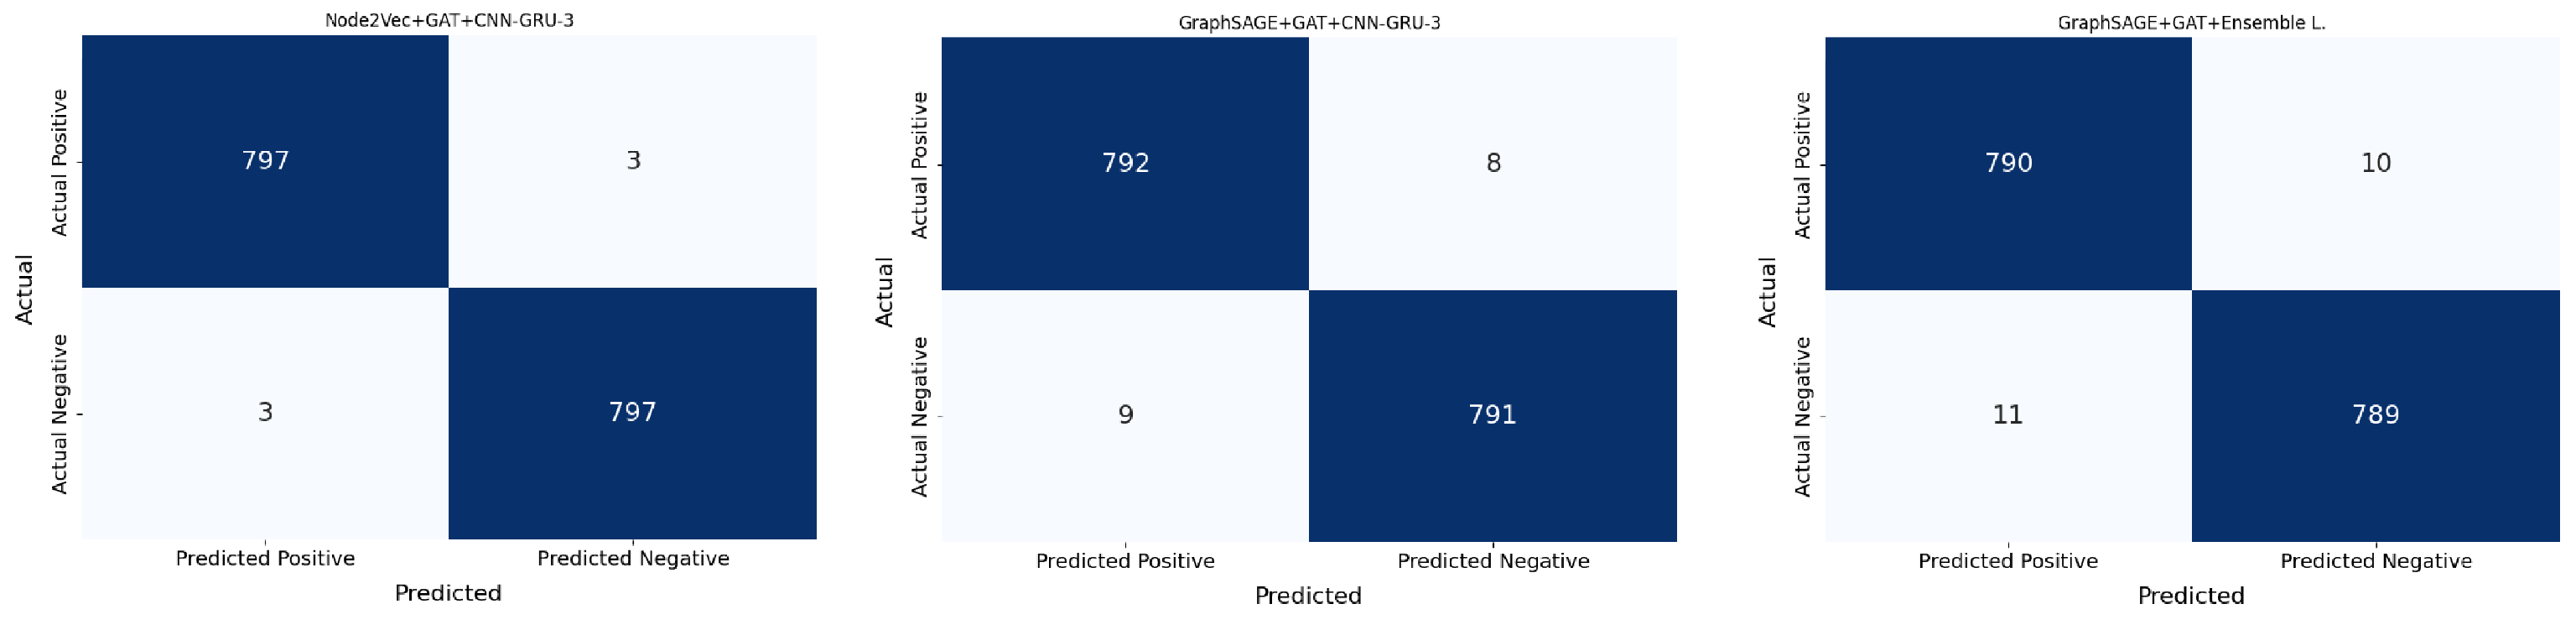
 Figure 6.
The proposed Node2Vec + GAT + CNN-GRU-3 model achieved a highly balanced classification, with only 3 false positives and 3 false negatives out of 1600 test samples. In contrast, the GraphSAGE + GAT + CNN-GRU-3 configuration resulted in slightly more errors (8 false negatives and 9 false positives), while the GraphSAGE + GAT + Ensemble Learning model showed the highest number of misclassifications (10 false negatives and 11 false positives). The proposed Node2Vec + GAT + CNN-GRU-3 model achieved the highest accuracy (0.9961) in all experiments. This proves the effectiveness of the model’s integration of graph-based contextual information and DL. Recall and F-measure values were higher in the experiments where GAT was used as an embedding improvement method. This is because GAT optimizes contextual relationships and reveals meaningful relationships between nodes. The MAE value of the proposed model (0.02%) is lower than other models. This shows that the model’s error rate in malware detection is relatively low. The Node2Vec + GAT + CNN-GRU-3 model obtained a high value of 0.98 with Cohen’s Kappa. This supports the classification stability and overall accuracy of the model. Considering Experiment 1, it was observed that the accuracy and recall rates were lower in these experiments where Node2Vec and GraphSAGE embeddings were used without improvement with GAT. In particular, the generalization success of the GraphSAGE + Ensemble model was limited. When Experiment 2 was evaluated, contextual information extraction increased in these experiments, where GAT was used as a classifier. However, since the initial embeddings were not directly improved, the accuracy rates were lower compared to the embedding improvement method. When Experiments 3 and 4 were evaluated, the model’s accuracy and generalization success increased significantly in the experiments where GAT was used as the embedding improvement method. This result shows the effect of the contextual enrichment provided by the attention mechanism of GAT on Node2Vec and GraphSAGE embeddings. The graphs in 
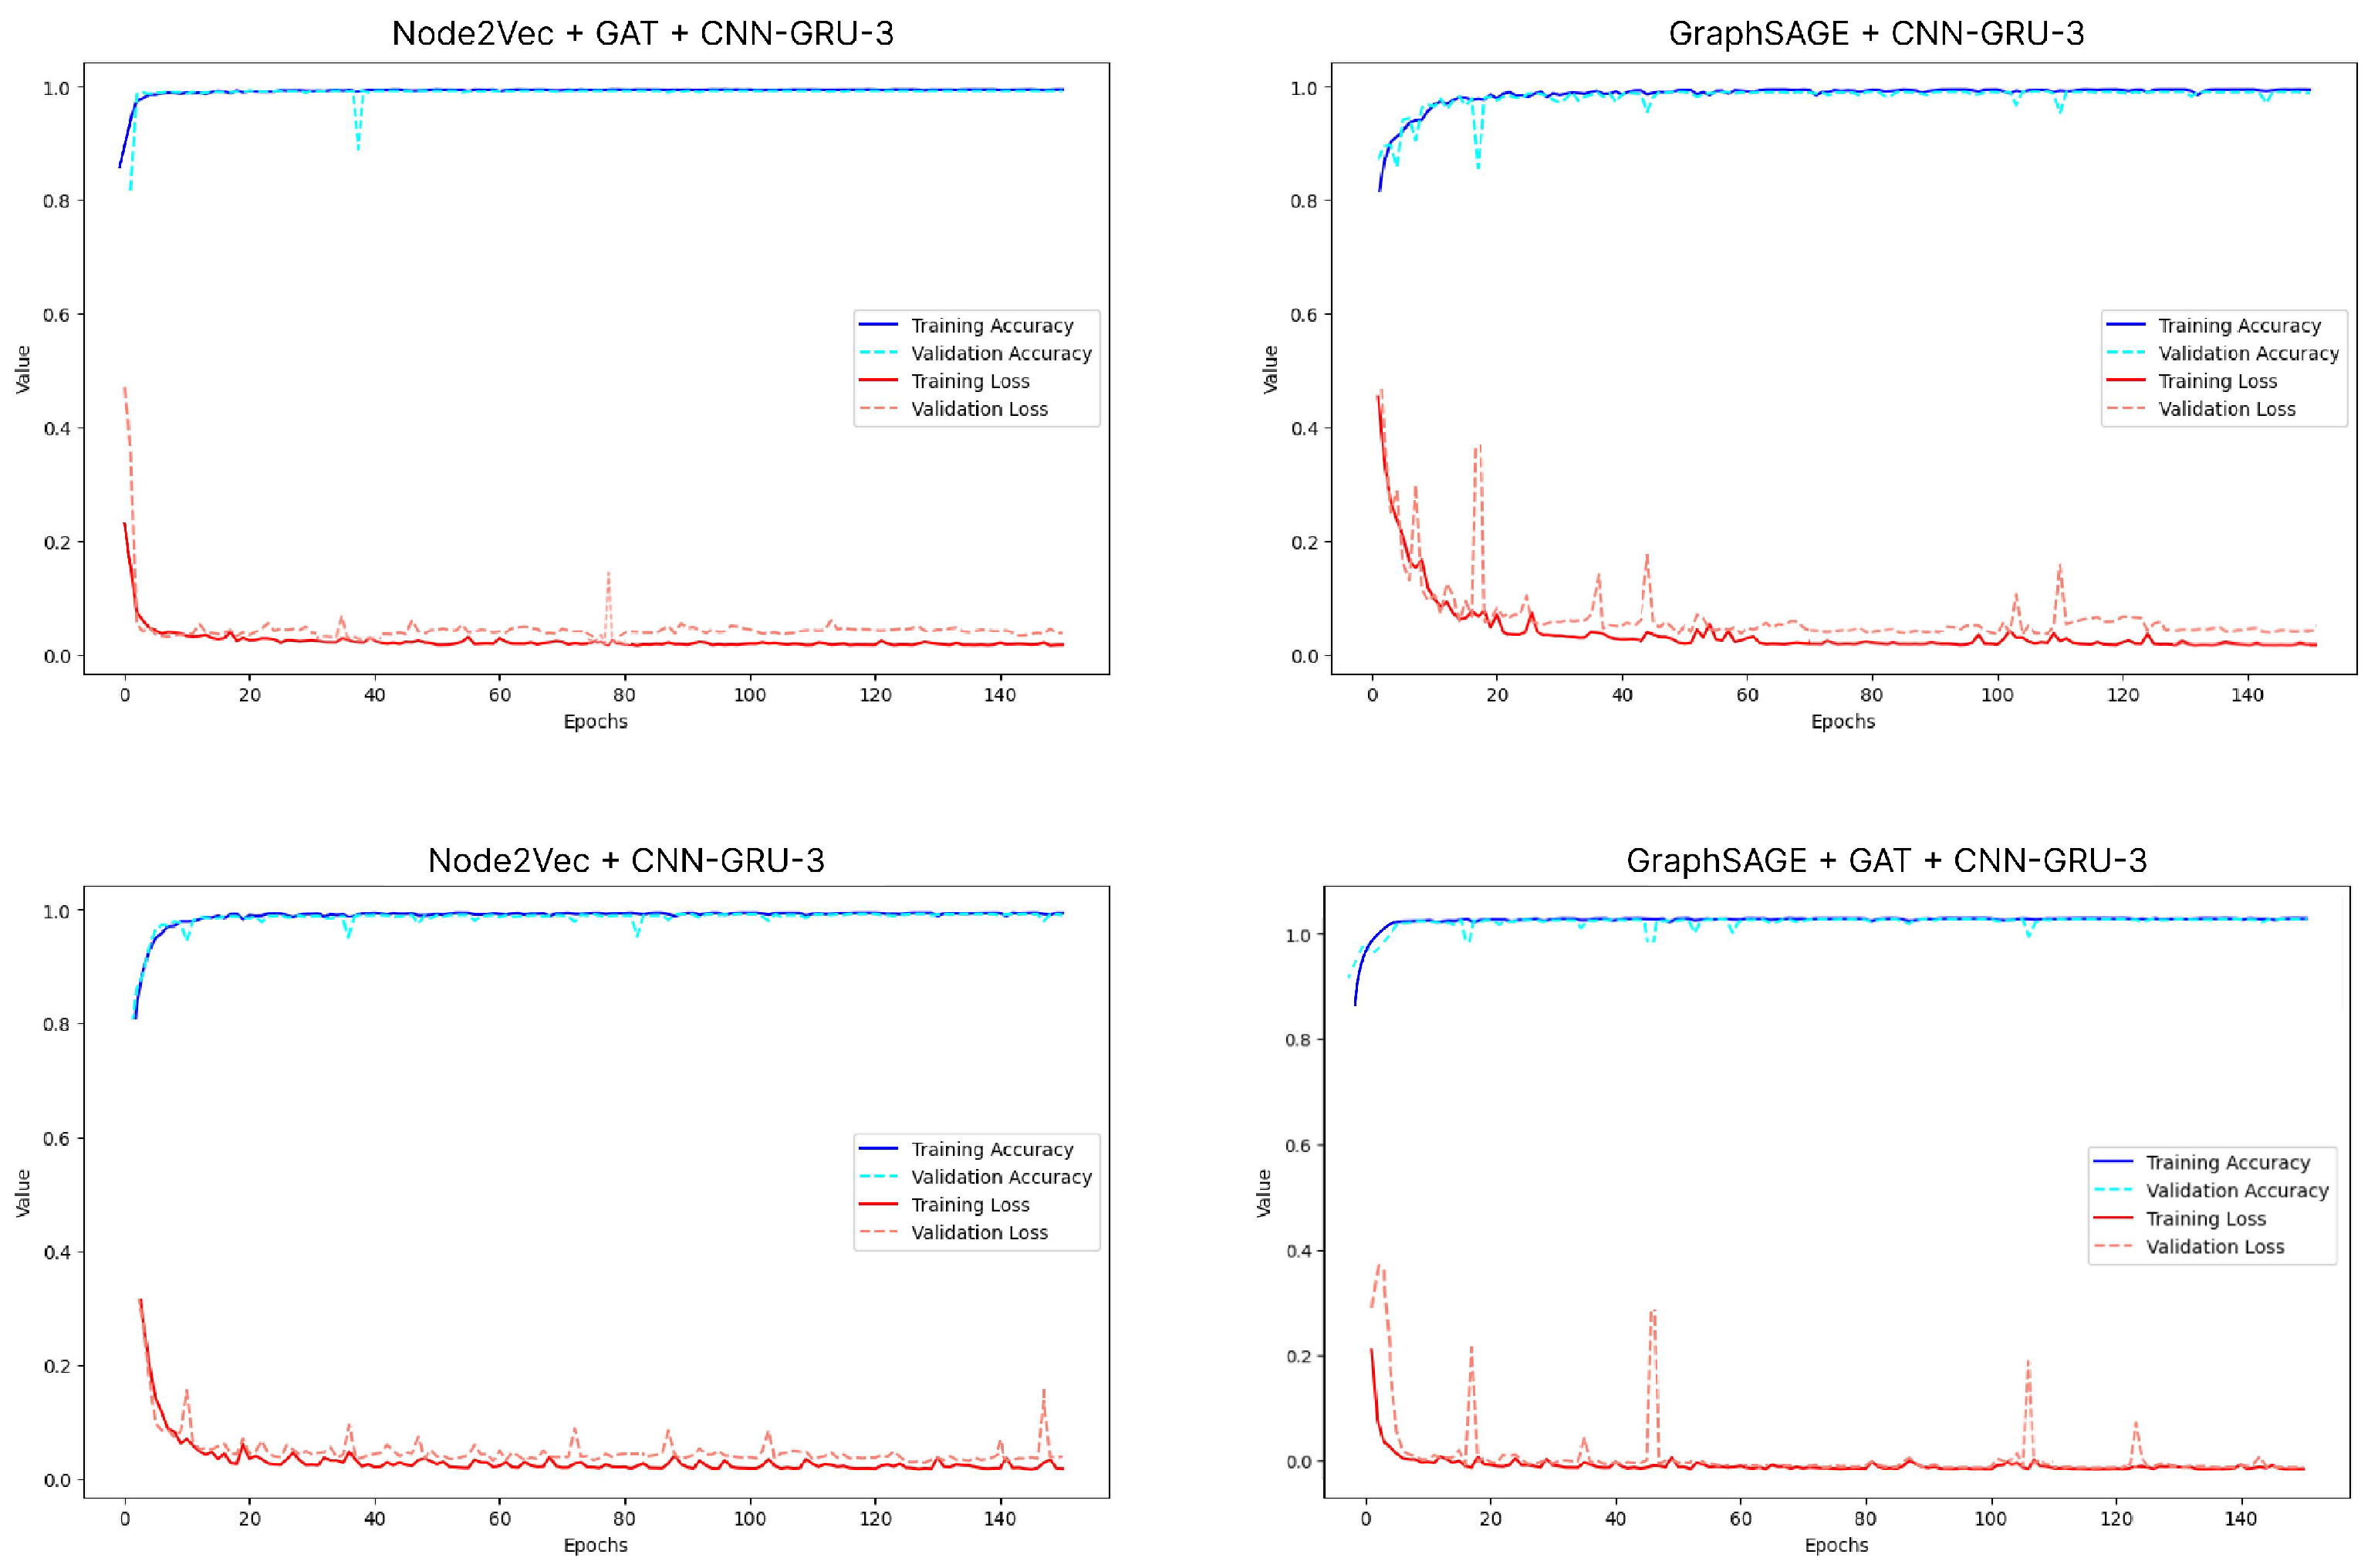
Figure 7 show the performances of Node2Vec + GAT + CNN-GRU-3, GraphSAGE + CNN-GRU-3, Node2Vec + CNN-GRU-3, and GraphSAGE + GAT + CNN-GRU-3 models during the training and validation processes.
The performance evaluation of the models shows that the proposed Node2Vec + GAT + CNN-GRU-3 model outperforms other approaches in terms of accuracy and stability. Achieving an accuracy of 0.9961, this model benefits from the effective use of Node2Vec embeddings, which better understand structural relationships, and GAT’s attention mechanism, which improves the contextual relevance of these embeddings. When combined with the sequential modeling capabilities of the CNN-GRU-3 classifier, the proposed framework achieves a better generalization ability compared to alternatives such as GraphSAGE + GAT + CNN-GRU-3 and Node2Vec + CNN-GRU-3, which show slightly lower accuracy and more fluctuating validation loss. When we examine different GAT scenarios, the scenarios where GAT is used as an embedding enhancement method have shown superior results, especially in performance metrics such as accuracy, precision, recall, and MAE, compared to those used as a classifier. The main reason for this difference is that the initial embeddings created with Node2Vec and GraphSAGE are contextually enriched with attention coefficients by GAT. This improvement of the embeddings has increased the generalization ability of the classification models (CNN-GRU-3, ensemble learning) by making the complex relationships in API calls and DLL information more meaningful. In cases where GAT is used directly as a classifier, the contextual information is only processed during the classification. The initial embeddings are not improved, so MAE is higher, and recall is relatively low. The results show that GAT offers a more effective approach to malware detection when used as an embedding enhancement method.

5. Limitations and Discussion

This section outlines the key limitations of the proposed framework and discusses its practical implications, scalability, and areas for future improvement. To assess generalizability, the performance of the proposed framework is evaluated on three separate datasets: MalBehavD-V1, APIMDS, and the custom-built PEMalware dataset. These datasets differ significantly in sample distribution, API behavior patterns, and dataset scale. As shown in Table 9, our framework achieved strong results on MalBehavD-V1 (97.05%) and PEMalware (99.61%) despite the high-class imbalance (23,080 malicious vs. 300 benign samples) and large-scale and showed competitive performance on and APIMDS (95.41%). The performance on APIMDS was slightly lower compared to other datasets. This can be attributed to several factors: (i) severe class imbalance in APIMDS (23,080 malicious vs. only 300 benign examples), complicating decision boundaries; (ii) the scale of the dataset, which may require deeper or more scalable architectures; and (iii) behavioral inhomogeneity of benign examples, which may lead to overfitting or limited generalization. All models were trained independently on each dataset using the same protocol: standard 80/20 train-test split and 5-fold cross-validation to ensure consistency and robustness. This approach allows for fair comparisons across datasets. Training was performed on a single NVIDIA L4 GPU for all experiments. Training durations were similar except for the APIMDS dataset, which took approximately 60 min longer due to the more significant number of examples. This increase is expected and acceptable in the context of real-world scalability. While Table 9 confirms that the proposed framework achieves high accuracy, evaluating these results beyond accuracy alone is important. Compared to state-of-the-art methods such as DawnGNN and MINES, our framework demonstrates comparable or slightly superior performance but has significant architectural differences. For example, DawnGNN uses pre-trained GNN layers and hand-crafted semantic features, which may reduce adaptability to unseen environments. In contrast, our method performs end-to-end feature learning via graph-based embeddings and a hybrid CNN-GRU design and offers greater flexibility across various API-DLL patterns. Despite including computationally intensive modules such as GAT and GRU, the framework remains efficient due to mini-batch training, gradient checkpointing, and early stopping optimizations. While our framework achieves high accuracy on all datasets, we acknowledge that real-world malware detection scenarios are inherently dynamic and more complex. To mitigate dataset-specific limitations, we designed the graph generation and feature extraction pipeline to be dataset-independent by relying on structural and contextual relationships between API calls and libraries rather than static properties or hard-coded signatures.
The proposed framework integrates graph-based embedding (Node2Vec), attention mechanisms (GAT), and sequential DL (CNN-GRU-3), which inevitably leads to a higher computational cost compared to traditional ML models. This increase is particularly notable in components such as GAT, due to multi-head attention over large node graphs, and GRU, due to sequential processing. Regarding computational overhead, traditional detection methods are highly efficient because they are rule-based, requiring minimal memory and processing power. ML models introduce moderate overhead, especially during training, while DL approaches incur the highest computational cost due to their layered architecture, high parameter counts, and GPU dependency. However, the overhead is often justified by the superior performance and generalization capabilities of DL-based frameworks. As demonstrated in Section 4.7, the model achieves 99.61% accuracy and extremely low error rates, significantly outperforming conventional baselines.
Like most DL-based malware detection systems, the proposed framework may face challenges when encountering novel or evolving malware that exhibits behavior patterns not present in the training data. Although the integration of graph-based and sequential learning components (Node2Vec, GAT, and CNN-GRU) enhances the model’s ability to generalize, it remains inherently limited by the scope and diversity of the training set. To address this, periodic retraining with newly collected and labeled malware samples can improve the framework’s adaptability. Additionally, more advanced solutions such as automated model updating via AutoML techniques may enhance responsiveness to evolving threats [20]. However, such techniques could not be used in this study due to their high computational costs and intensive resource requirements, which are beyond the scope of the current study. It is planned to focus on this issue in the future work.

6. Conclusions

This study proposes a new framework for malware detection by combining API calls and DLL information. The proposed Node2Vec + GAT + CNN-GRU-3 model effectively uses structural and contextual information by combining graph-based embedding techniques and DL methods. This model has outperformed many approaches in the literature by demonstrating a high performance of 0.9961 in understanding malware behaviors and classification accuracy. The experiments have shown that improving embedding techniques such as Node2Vec and GraphSAGE with GAT makes graph-based features richer and contextually meaningful. The effective use of GAT as both a classifier and feature extractor has contributed significantly to the success of the study. In addition, comparing multiple models (CNN-GRU-3, ensemble learning) during the study process allowed for an in-depth analysis of the effects of various approaches. In conclusion, this study has provided a new solution for malware detection with API calls and DLL-based heterogeneous graph representations and has become an important reference for future studies. In the future, it is suggested that the model be further developed by integrating multiple data sources for various malware types.

Author Contributions

N.V.S.: conceptualization, methodology, investigation, software, writing—original draft preparation, data curation, writing—review and editing. M.A.: conceptualization, validation, data curation, writing—review and editing, supervision. Ç.İ.A.: validation, writing—review and editing, supervision All authors have read and agreed to the published version of the manuscript.

Funding

This research received no external funding.

Institutional Review Board Statement

Not applicable.

Informed Consent Statement

Not applicable.

Data Availability Statement

The dataset used in this study has been made publicly available and can be accessed at the following URLs. Benign samples: https://c-prot.com/presentations/1000_whitelist_sample_benign.csv (accessed on 18 March 2025), malware samples: https://c-prot.com/presentations/1000_malware_sample_malicious.csv (accessed on 18 March 2025).

Acknowledgments

We would like to thank to C-Prot Turkiye (https://www.c-prot.com/en) (accessed on 25 November 2024) for making their data available to us.

Conflicts of Interest

The authors declare no conflicts of interest.

Abbreviations

The following abbreviations are used in this manuscript:
ANOVAAnalysis of Variance
CFGControl Flow Graphs
CNNConvolutional Neural Network
DLDeep Learning
DLLDynamic Link Libraries
DTDecision Tree
ELUExponential Linear Unit
FNFalse Negative
FPFalse Positive
GATGraph Attention Network
GCNGraph Convolutional Network
GNNGraph Neural Network
GRUGated Recurrent Units
MAEMean Absolute Error
MLMachine Learning
NLPNatural Language Processing
ReLuRectified Linear Unit
RFRandom Forest
TNTrue Negative
TPTrue Positive
XGBExtreme Gradient Boosting

References

  1. Bensaoud, A.; Kalita, J. CNN-LSTM and transfer learning models for malware classification based on opcodes and API calls. Knowl.-Based Syst. 2024, 290, 111543. [Google Scholar] [CrossRef]
  2. Feng, P.; Gai, L.; Yang, L.; Wang, Q.; Li, T.; Xi, N.; Ma, J. DawnGNN: Documentation augmented windows malware detection using graph neural network. Comput. Secur. 2024, 140, 103788. [Google Scholar] [CrossRef]
  3. Amin, R.; Gantassi, R.; Ahmed, N.; Alshehri, A.H.; Alsubaei, F.S.; Frnda, J. A hybrid approach for adversarial attack detection based on sentiment analysis model using Machine learning. Eng. Sci. Technol. Int. J. 2024, 58, 101829. [Google Scholar] [CrossRef]
  4. Rizvi, S.K.J.; Aslam, W.; Shahzad, M.; Saleem, S.; Fraz, M.M. PROUD-MAL: Static analysis-based progressive framework for deep unsupervised malware classification of windows portable executable. Complex Intell. Syst. 2022, 8, 673–685. [Google Scholar] [CrossRef]
  5. Amer, E.; Zelinka, I. A dynamic Windows malware detection and prediction method based on contextual understanding of API call sequence. Comput. Secur. 2020, 92, 101760. [Google Scholar] [CrossRef]
  6. Kale, G.; Bostancı, G.E.; Çelebi, F.V. Evolutionary feature selection for machine learning based malware classification. Eng. Sci. Technol. Int. J. 2024, 56, 101762. [Google Scholar] [CrossRef]
  7. Cakir, B.; Dogdu, E. Malware classification using deep learning methods. In Proceedings of the ACMSE’18 2018 ACM Southeast Conference 2018 Conference, Richmond, KY, USA, 29–31 March 2018; pp. 1–5. [Google Scholar]
  8. Han, W.; Xue, J.; Wang, Y.; Liu, Z.; Kong, Z. Malinsight: A systematic profiling based malware detection framework. J. Netw. Comput. Appl. 2019, 125, 236–250. [Google Scholar] [CrossRef]
  9. Azeez, N.A.; Odufuwa, O.E.; Misra, S.; Oluranti, J.; Damaševičius, R. Windows PE Malware Detection Using Ensemble Learning. Informatics 2021, 8, 10. [Google Scholar] [CrossRef]
  10. Chen, Z.; Ren, X. An efficient boosting-based windows malware family classification system using multi-features fusion. Appl. Sci. 2023, 13, 4060. [Google Scholar] [CrossRef]
  11. Cho, Y. Dynamic RNN-CNN based malware classifier for DL algorithm. In Proceedings of the 2019 29th International Telecommunication Networks and Applications Conference (ITNAC), Auckland, New Zealand, 27–29 November 2019; IEEE: Piscataway, NJ, USA; pp. 1–6. [Google Scholar]
  12. Haq, U.; Khan, T.A.; Akhunzada, A. A dynamic robust DL-based model for android malware detection. IEEE Access 2021, 9, 74510–74521. [Google Scholar] [CrossRef]
  13. Maniriho, P.; Mahmood, A.N.; Chowdhury, M.J.M. API-MalDetect: Automated malware detection framework for windows based on API calls and deep learning techniques. J. Netw. Comput. Appl. 2023, 218, 103704. [Google Scholar] [CrossRef]
  14. Kabakus, T. Droidmalwaredetector: A novel Android malware detection framework based on convolutional neural network. EXpert Syst. Appl. 2022, 206, 117833. [Google Scholar] [CrossRef]
  15. Liu, J.; Zhao, Y.; Feng, Y.; Hu, Y.; Ma, X. Semalbert: Semantic-based malware detection with bidirectional encoder representations from transformers. J. Inf. Secur. Appl. 2024, 80, 103690. [Google Scholar] [CrossRef]
  16. Demir, S.; Topcu, B. Graph-based Turkish text normalization and its impact on noisy text processing. Eng. Sci. Technol. Int. J. 2022, 35, 101192. [Google Scholar] [CrossRef]
  17. Li, C.; Lv, Q.; Li, N.; Wang, Y.; Sun, D.; Qiao, Y. A novel deep framework for dynamic malware detection based on API sequence intrinsic features. Comput. Secur. 2022, 116, 102686. [Google Scholar] [CrossRef]
  18. Kumar, S.; Janet, B.; Neelakantan, S. IMCNN: Intelligent Malware Classification using Deep Convolution Neural Networks as Transfer learning and ensemble learning in honeypot enabled organizational network. Comput. Commun. 2024, 216, 16–33. [Google Scholar] [CrossRef]
  19. Darem, A.A. A Novel Framework for Windows Malware Detection Using a Deep Learning Approach. Comput. Mater. Contin. 2022, 72, 461–479. [Google Scholar] [CrossRef]
  20. Brown, A.; Gupta, M.; Abdelsalam, M. Automated machine learning for deep learning based malware detection. Comput. Secur. 2024, 137, 103582. [Google Scholar] [CrossRef]
  21. Bao, P.T.; Cam, N.T.; Pham, V.H. A multimodal Windows malware detection method based on hybrid analysis and graph representations. In Proceedings of the 2024 International Conference on Multimedia Analysis and Pattern Recognition (MAPR), Da Nang, Vietnam, 15–16 August 2024; IEEE: Piscataway, NJ, USA, 2024; pp. 1–6. [Google Scholar]
  22. Zhang, L.; Liu, P.; Choi, Y.H.; Chen, P. Semantics-preserving reinforcement learning attack against graph neural networks for malware detection. IEEE Trans. Dependable Secur. Comput. 2022, 20, 1390–1402. [Google Scholar] [CrossRef]
  23. Lin, H.C.; Wang, P.; Lin, W.H.; Lin, Y.H.; Yu, Y.S.; Dai, J.H. Using Graph Neural Network to Ransomware Detection for Cyber Threats. In Proceedings of the 2024 10th International Conference on Applied System Innovation (ICASI), Kyoto, Japan, 17–21 April 2024; IEEE: Piscataway, NJ, USA, 2024; pp. 314–316. [Google Scholar]
  24. Chen, S.; Lang, B.; Liu, H.; Chen, Y.; Song, Y. Android malware detection method based on graph attention networks and deep fusion of multimodal features. Expert Syst. Appl. 2024, 237, 121617. [Google Scholar] [CrossRef]
  25. Wu, P.; Gao, M.; Sun, F.; Wang, X.; Pan, L. Multi-perspective API call sequence behavior analysis and fusion for malware classification. Comput. Secur. 2024, 148, 104177. [Google Scholar] [CrossRef]
  26. Saravanan, K.S.; Bhagavathiappan, V. Innovative agricultural ontology construction using NLP methodologies and graph neural network. Eng. Sci. Technol. Int. J. 2024, 52, 101675. [Google Scholar] [CrossRef]
  27. Grover, A.; Leskovec, J. node2vec: Scalable feature learning for networks. In Proceedings of the 22nd ACM SIGKDD International Conference on Knowledge Discovery and Data Mining, San Francisco, CA, USA, 13–17 August 2016; pp. 855–864. [Google Scholar]
  28. Hamilton, W.; Ying, Z.; Leskovec, J. Inductive representation learning on large graphs. Adv. Neural Inf. Process. Syst. 2017, 30. Available online: https://proceedings.neurips.cc/paper_files/paper/2017/hash/5dd9db5e033da9c6fb5ba83c7a7ebea9-Abstract.html (accessed on 22 April 2025).
  29. Clevert, D.-A.; Unterthiner, T.; Hochreiter, S. Fast and accurate deep network learning by exponential linear units (ELUs). arXiv 2015, arXiv:1511.07289. [Google Scholar]
  30. Euh, S.; Lee, H.; Kim, D.; Hwang, D. Comparative analysis of low-dimensional features and tree-based ensembles for malware detection systems. IEEE Access 2020, 8, 76796–76808. [Google Scholar] [CrossRef]
  31. Liu, Y.; Wang, Y.; Zhang, J. New machine learning algorithm: Random Forest. In Information Computing and Applications: Third International Conference, ICICA 2012, Chengde, China, 14–16 September 2012; Proceedings 3; Springer: Berlin/Heidelberg, Germany, 2012; pp. 246–252. [Google Scholar]
  32. Chen, T.; Guestrin, C. XGBoost: A scalable tree boosting system. In Proceedings of the 22nd ACM SIGKDD International Conference on Knowledge Discovery and Data Mining, San Francisco, CA, USA, 13–17 August 2016; pp. 785–794. [Google Scholar]
  33. Mim, M.A.; Majadi, N.; Mazumder, P. A soft voting ensemble learning approach for credit card fraud detection. Heliyon 2024, 10, e25466. [Google Scholar] [CrossRef] [PubMed]
  34. Aydın, F.; Aslan, Z. Recognizing Parkinson’s disease gait patterns by VIBES algorithm and Hilbert-Huang transform. Eng. Sci. Technol. Int. J. 2021, 24, 112–125. [Google Scholar] [CrossRef]
  35. Suthaharan, S. Decision tree learning. In Machine Learning Models and Algorithms for Big Data Classification: Thinking with Examples for Effective Learning; Springer: Berlin/Heidelberg, Germany, 2016; pp. 237–269. [Google Scholar]
  36. Ke, G.; Meng, Q.; Finley, T.; Wang, T.; Chen, W.; Ma, W.; Ye, Q.; Liu, T.Y. LightGBM: A highly efficient gradient boosting decision tree. Adv. Neural Inf. Process. Syst. 2017, 30. Available online: https://proceedings.neurips.cc/paper/2017/hash/6449f44a102fde848669bdd9eb6b76fa-Abstract.html (accessed on 22 April 2025).
  37. Schapire, R.E. Explaining AdaBoost. In Empirical Inference: Festschrift in Honor of Vladimir N. Vapnik; Springer: Berlin/Heidelberg, Germany, 2013; pp. 37–52. [Google Scholar]
  38. Zhou, J.; Cui, G.; Hu, S.; Zhang, Z.; Yang, C.; Liu, Z.; Wang, L.; Li, C.; Sun, M. Graph neural networks: A review of methods and applications. AI Open 2020, 1, 57–81. [Google Scholar] [CrossRef]
  39. Liang, F.; Qian, C.; Yu, W.; Griffith, D.; Golmie, N. Survey of graph neural networks and applications. Wirel. Commun. Mob. Comput. 2022, 2022, 9261537. [Google Scholar] [CrossRef]
  40. Kipf, T.N.; Welling, M. Semi-supervised classification with graph convolutional networks. arXiv 2016, arXiv:1609.02907. [Google Scholar]
  41. Veličković, P.; Cucurull, G.; Casanova, A.; Romero, A.; Lio, P.; Bengio, Y. Graph attention networks. arXiv 2017, arXiv:1710.10903. [Google Scholar]
  42. Vrahatis, A.G.; Lazaros, K.; Kotsiantis, S. Graph Attention Networks: A Comprehensive Review of Methods and Applications. Future Internet 2024, 16, 318. [Google Scholar] [CrossRef]
  43. Bilot, T.; El Madhoun, N.; Al Agha, K.; Zouaoui, A. A survey on malware detection with graph representation learning. ACM Comput. Surv. 2024, 56, 1–36. [Google Scholar] [CrossRef]
  44. SelectKBest. (n.d.). Scikit-Learn. Available online: https://scikit-learn.org/1.5/modules/generated/sklearn.feature_selection.SelectKBest.html (accessed on 30 November 2024).
  45. St, L.; Wold, S. Analysis of variance (ANOVA). Chemom. Intell. Lab. Syst. 1989, 6, 259–272. [Google Scholar]
  46. NetworkX. Available online: https://networkx.org/ (accessed on 30 November 2024).
  47. StellarGraph. Available online: https://stellargraph.readthedocs.io/en/stable/ (accessed on 2 December 2024).
  48. PyTorch Geometric. Available online: https://pytorch-geometric.readthedocs.io/en/latest/ (accessed on 2 December 2024).
  49. Ki, Y.; Kim, E.; Kim, H.K. A novel approach to detect malware based on API call sequence analysis. Int. J. Distrib. Sens. Netw. 2015, 11, 659101. [Google Scholar] [CrossRef]
Figure 1. Directed graph representation of API call sequences extracted from a malware sample. Nodes correspond to API functions, and edges indicate their execution order.
Applsci 15 04775 g001
Figure 2. Overview of the GraphSAGE node embedding process. (a) A node’s local neighborhood is sampled up to depth k, (b) feature information from neighbors is aggregated using learnable functions, and (c) the resulting embedding is used for prediction [28].
Applsci 15 04775 g002
Figure 3. Feature importance based on ANOVA F-value.
Applsci 15 04775 g003
Figure 4. Overall design of the proposed framework.
Applsci 15 04775 g004
Figure 5. Performance comparison of malware detection models.
Applsci 15 04775 g005
Figure 6. Confusion matrices of the three best-performing models.
Applsci 15 04775 g006
Figure 7. Training and validation performance comparison of graph-based DL malware detection models.
Applsci 15 04775 g007
Table 1. Notations and explanations of the formulas.
NotationsExplanations
GGraph
VNode set
EEdge set
uNode
vNeighbor of the node
yClassifiers
WLearnable weight matrix.
W h v W h u Weighted concatenation of feature vectors of nodes v and u.
LLoss function
h u The feature vector of neighbor node u obtained using Node2Vec or GraphSAGE.
h v The feature vector of node v obtained using Node2Vec or GraphSAGE.
Z v New node representation by GAT.
α Learnable weight vector.
α v u It shows the normalized influence of node u on node v.
N ( v ) The neighbor set of node v. This includes the nodes to which v is directly connected.
e v u The attention coefficient between node v and its neighbor u.
pControls the probability of the walk to return to the previous node.
qDetermines the tendency of the walk to explore local neighborhoods or the wider area.
Table 2. The amount of data in the PEmalware dataset.
LabelNumber of Software
Malicious Software1000
Before Data AugmentationBenign Software1000
Total Software2000
Malicious Software4000
After Data AugmentationBenign Software4000
Total Software8000
Table 3. Dataset features.
FeaturesDescriptionValues
File SizeSize of file in byteInteger
Digital SignatureWhether there is a digital signatureBoolean
API CallsThe name of functionsString
DLLsThe name of DLLsString
LabelWhether the file is maliciousBoolean
Table 4. Hyperparameter configurations.
ModelHyperparameterValue
CNNConvolution Layers3
Convolution filters64
Kernel Size3
Pool Size2
ActivationELU
GRUGRU Layers3
Hidden Units512, 256, 128
Dropout0.3
OptimizerAdam
Learning Rate0.0001
LossBinary Crossentropy
RFn estimators[50, 100, 200]—Best value: 100
max depth[3, 5, 7]—Best value: 3
min samples split[2, 5]—Best value: 2
min samples leaf[1, 2]—Best value: 2
XGBn estimators[50, 100, 150]—Best value: 100
max depth[3, 5, 7]—Best value: 7
learning rate[0.01, 0.1, 0.2]—Best value: 0.1
Node2VecWalk Length30
Walks per Node200
Embedding Dimension128
Table 5. Comparison of classification performance of Node2Vec and GraphSAGE embeddings with CNN-GRU-3 and ensemble learning.
ModelAccuracyF-MeasurePrecisionRecallMAECohen’s Kappa
Node2Vec + CNN-GRU-30.96750.96500.96600.96750.03250.94
Node2Vec + Ensemble L.0.96030.95900.95850.96030.03970.92
GraphSAGE + CNN-GRU-30.94420.94300.94250.94420.05580.89
GraphSAGE + Ensemble L.0.95630.95500.95450.95630.04370.91
Table 6. Performance comparison of using GAT as a standalone classifier and combining it with Node2Vec/GraphSAGE.
ModelAccuracyF-MeasurePrecisionRecallMAECohen’s Kappa
GAT0.93880.93600.93750.96030.06120.87
Node2Vec + GAT0.97110.97000.97150.97110.02890.94
GraphSAGE + GAT0.97030.96850.96900.97030.02970.93
Table 7. Classification performances of Node2Vec and GraphSAGE embeddings with CNN-GRU-3 and ensemble learning by improving with GAT.
ModelAccuracyF-MeasurePrecisionRecallMAECohen’s Kappa
Node2Vec + GAT + CNN-GRU-30.99610.99550.99600.99610.00390.99
Node2Vec + GAT + Ensemble L.0.98710.98600.98750.98710.01290.97
GraphSAGE + GAT + CNN-GRU-30.98980.98900.98850.98980.01020.98
GraphSAGE + GAT + Ensemble L.0.98730.98650.98600.98730.01270.97
Table 8. Using GAT as a feature extractor and comparing its classification performance with CNN-GRU-3/ensemble learning models.
ModelAccuracyF-MeasurePrecisionRecallMAECohen’s Kappa
GAT + CNN-GRU-30.97130.97000.97050.97130.02870.94
GAT + Ensemble L.0.96770.96700.96650.96770.03230.93
Table 9. Comparison of detection results across different datasets and models.
DatasetMaliciousBenignModelDetection Results (%)
MalBehavD-V1 [13]12851285API-MalDetect [13]Accuracy: 98.0
DawnGNN [2]Accuracy: 96.38
Proposed FrameworkAccuracy: 97.05
APIMDS [49]23,080300MINES [2]Micro-F1: 97.03, Macro-F1: 93.70
DawnGNN [2]Accuracy: 99.75
Proposed FrameworkAccuracy: 95.41
PEMalware (Ours)10001000Proposed FrameworkAccuracy: 99.61
Disclaimer/Publisher’s Note: The statements, opinions and data contained in all publications are solely those of the individual author(s) and contributor(s) and not of MDPI and/or the editor(s). MDPI and/or the editor(s) disclaim responsibility for any injury to people or property resulting from any ideas, methods, instructions or products referred to in the content.

