
Study on the Asymmetric Failure Characteristics and Failure Mechanisms of Surrounding Rock During Excavation of a Deep Buried Small-Clearance Tunnel


 ,
,
Abstract
1. Introduction
2. Engineering Background and in Situ Monitoring Methods
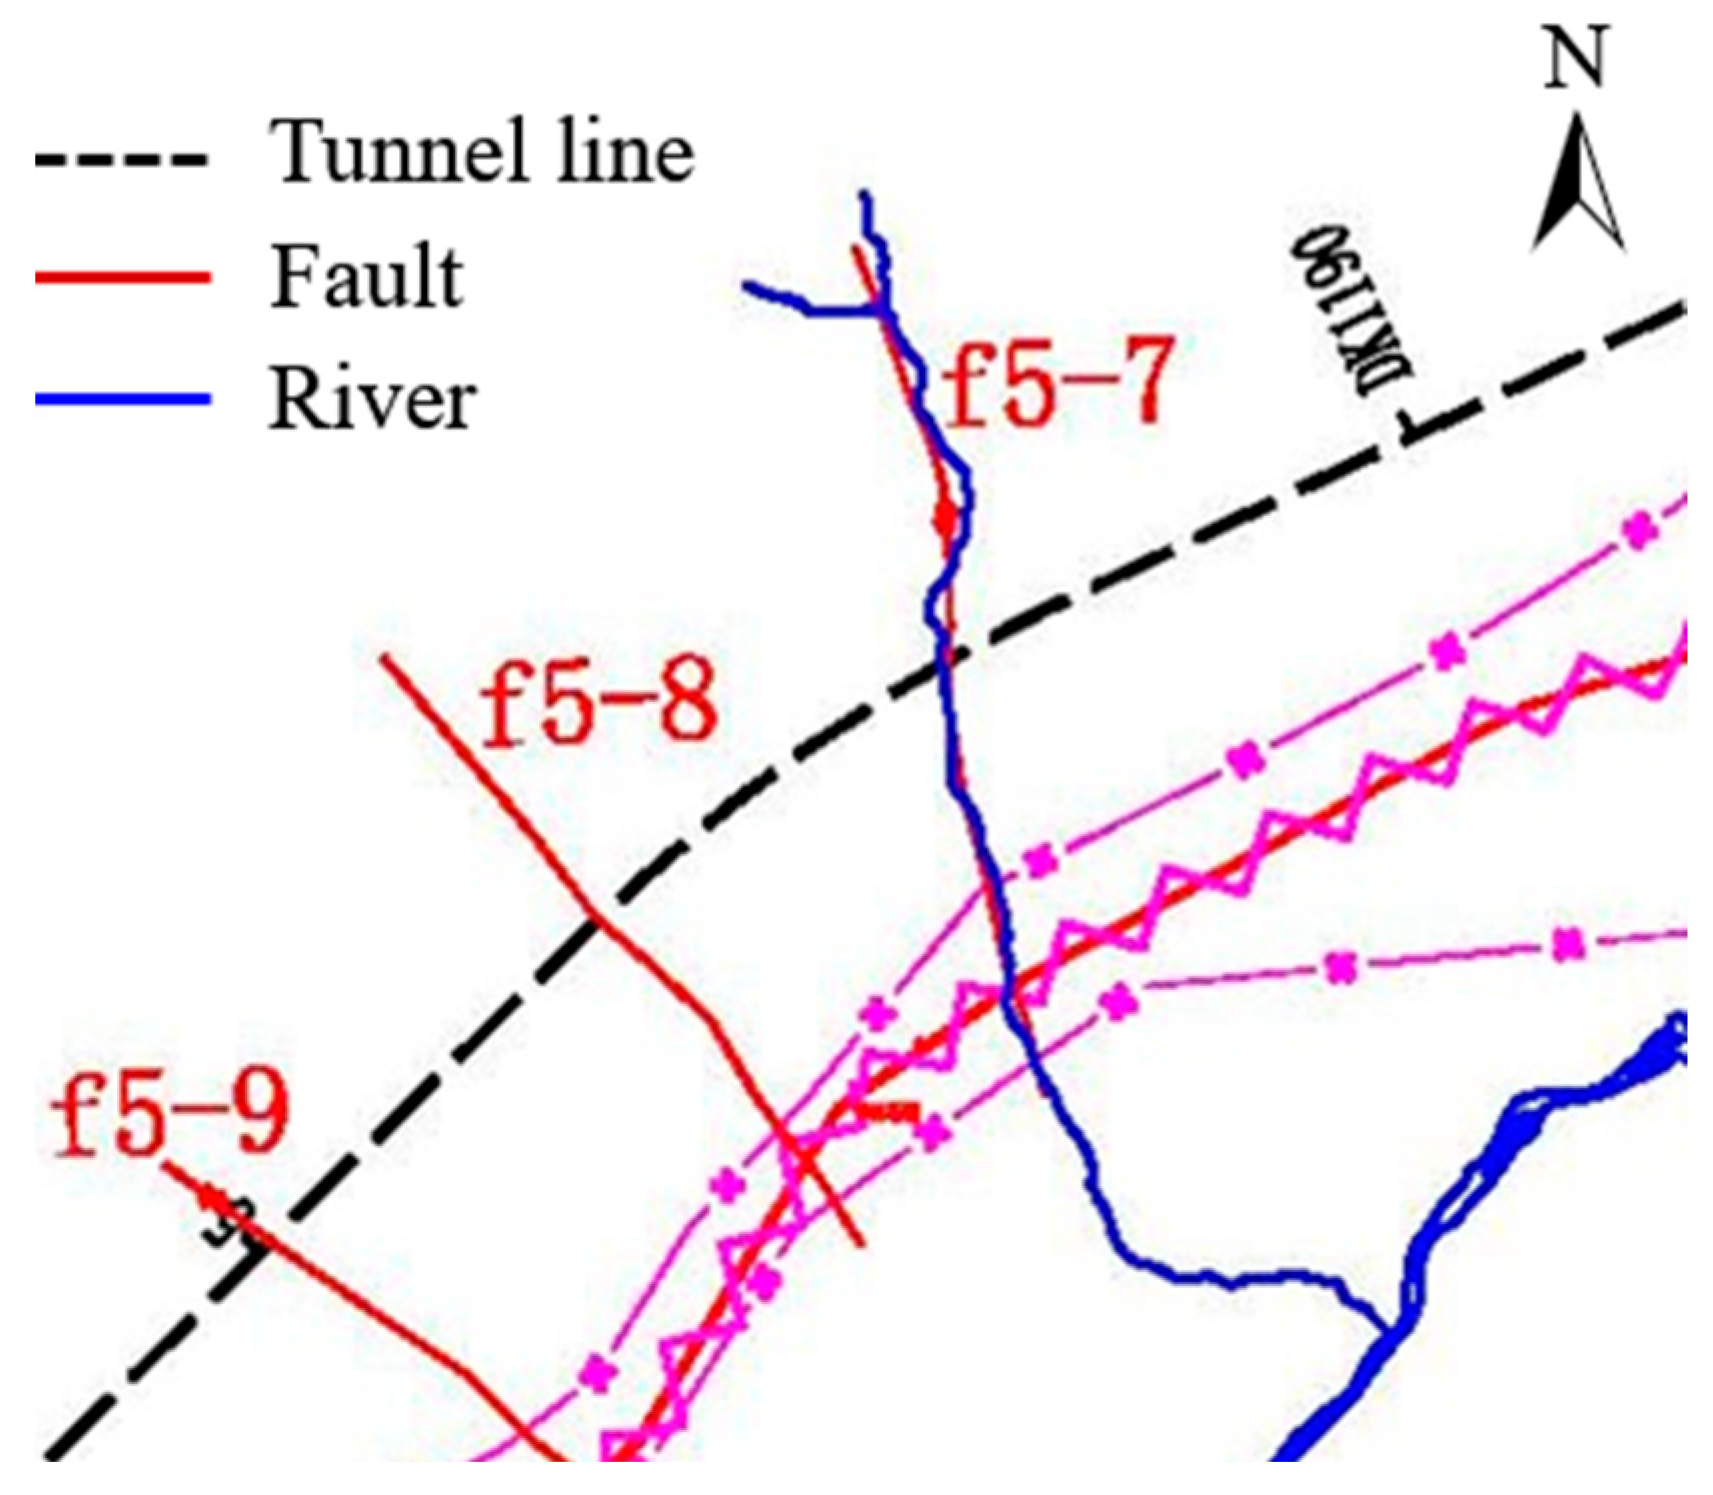
2.1. Engineering Background
2.2. In Situ Monitoring Method of Surrounding Rock Pressure
2.2.1. In Situ Monitoring Scheme
- (1).
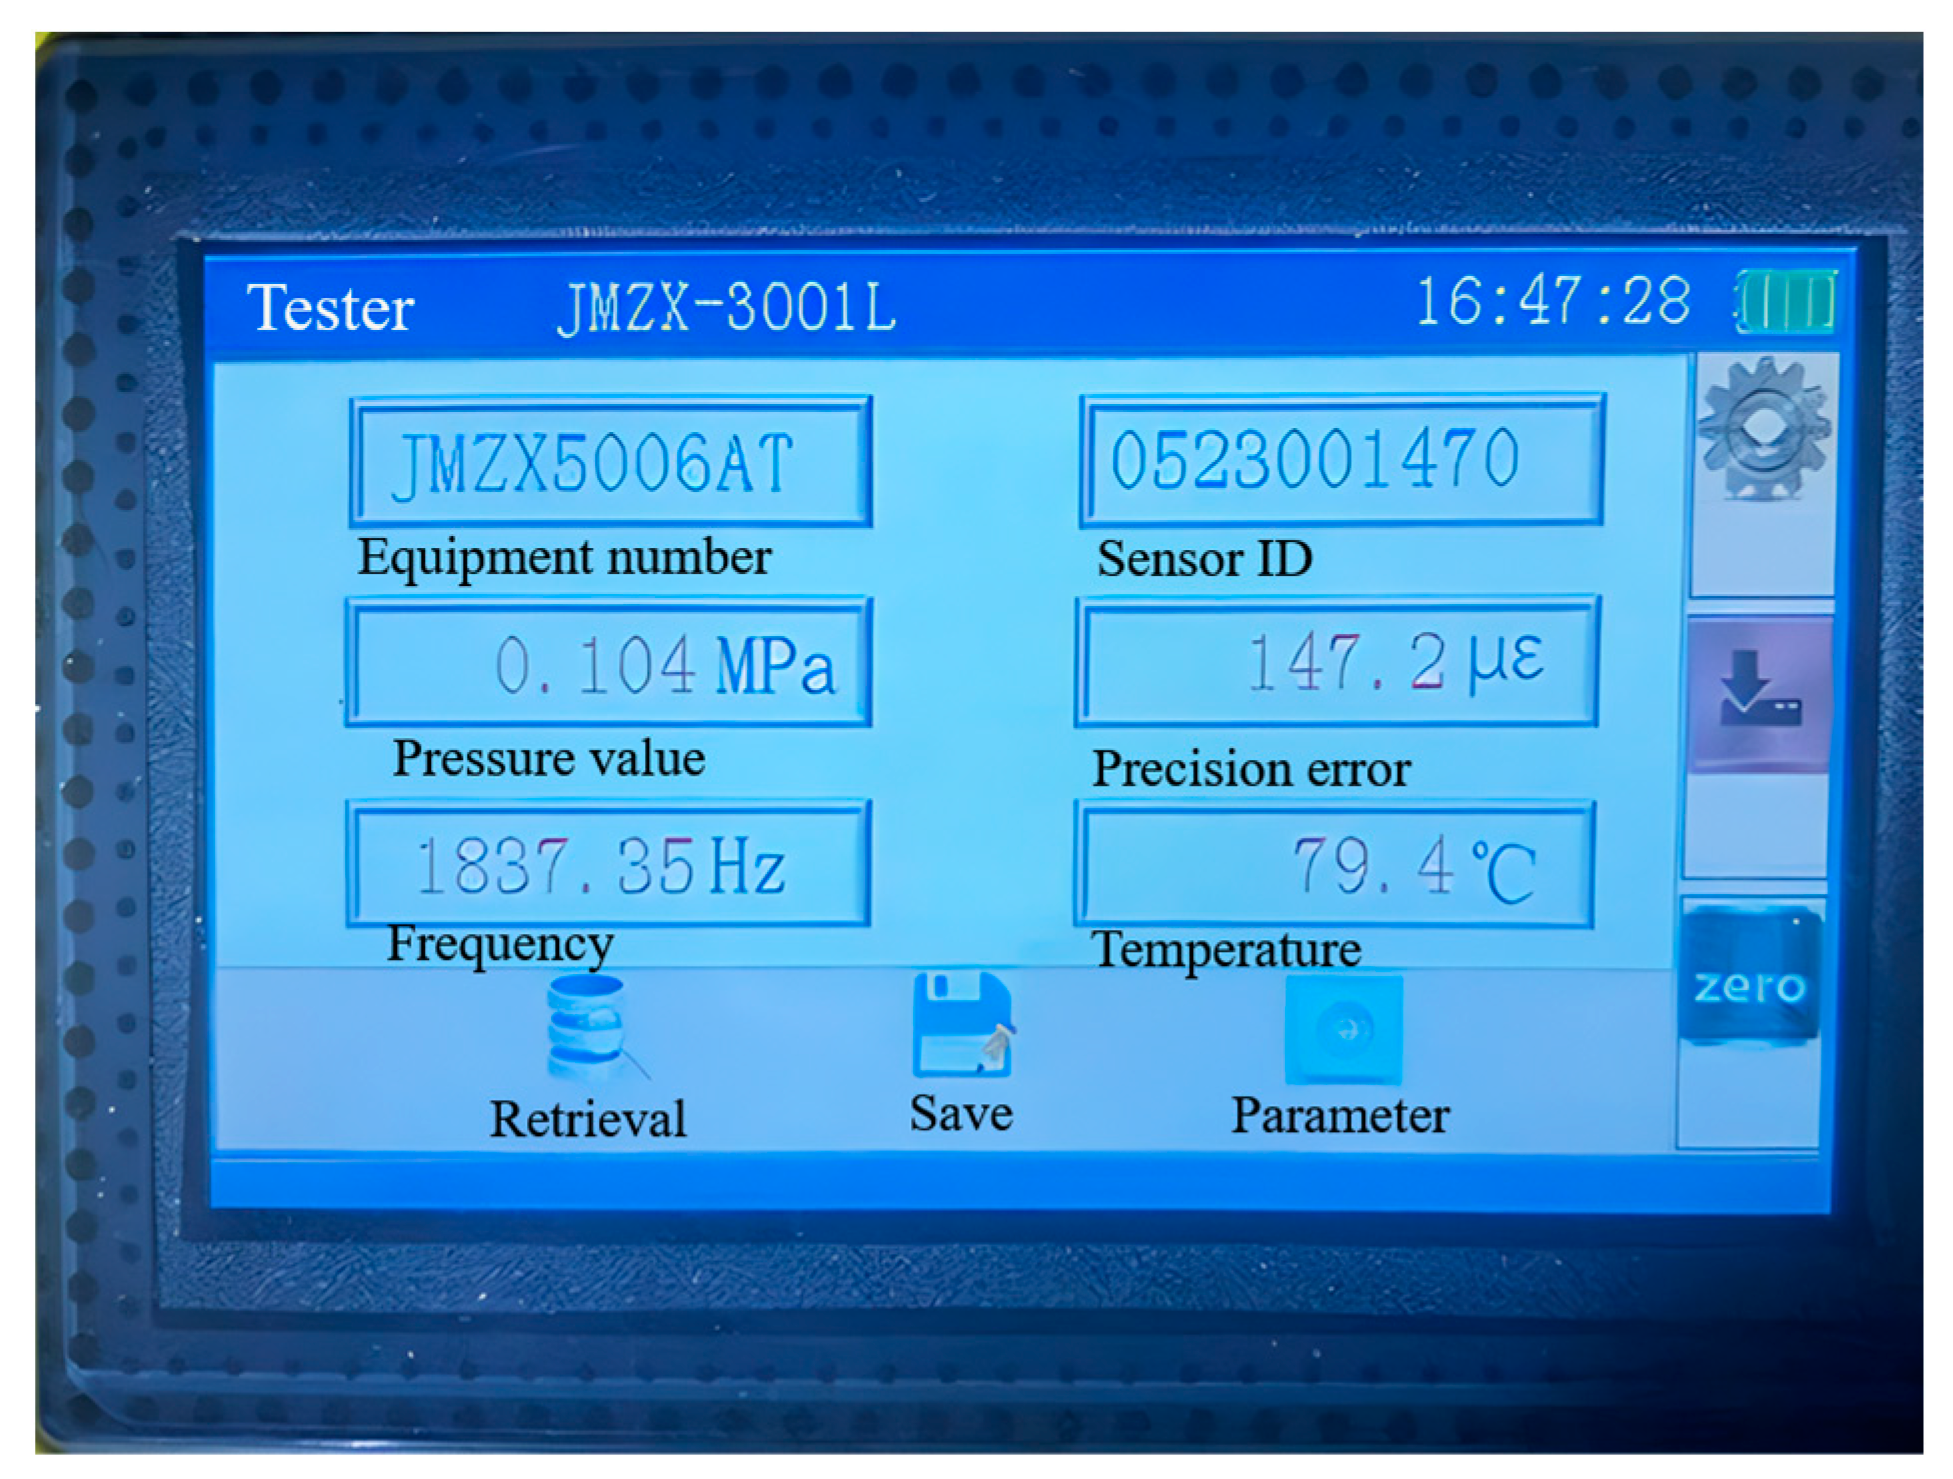
- Equipment selection.To ensure the effectiveness of the monitoring system, a comprehensive comparison of existing monitoring equipment and methods was conducted, taking into account their applicability, technical feasibility, and compatibility with the specific conditions of the tunnel environment. The selection criteria included factors such as accuracy, durability, and the ability to perform under challenging conditions. A summary of the comparative analysis is presented in Table 1.Considering the geological and environmental conditions of the surrounding rock, including high temperature and water-rich environments, the selected sensors must exhibit high temperature resistance and corrosion resistance, while meeting the demands of long-term monitoring and high accuracy. Therefore, a vibrating string pressure sensor was chosen for this purpose, as it satisfies these critical requirements. The sensor used in this paper is the JMZX-3001 type intelligent vibrating string pressure box of Changsha Jinma Measurement and Control Technology Co., Ltd. in Changsha City, China. The pressure accuracy is ±0.1% FS and the temperature accuracy is ±0.5 °C.
- (2).
- Sensor layout.The sensor layout design was guided by the following principles:
- (1)
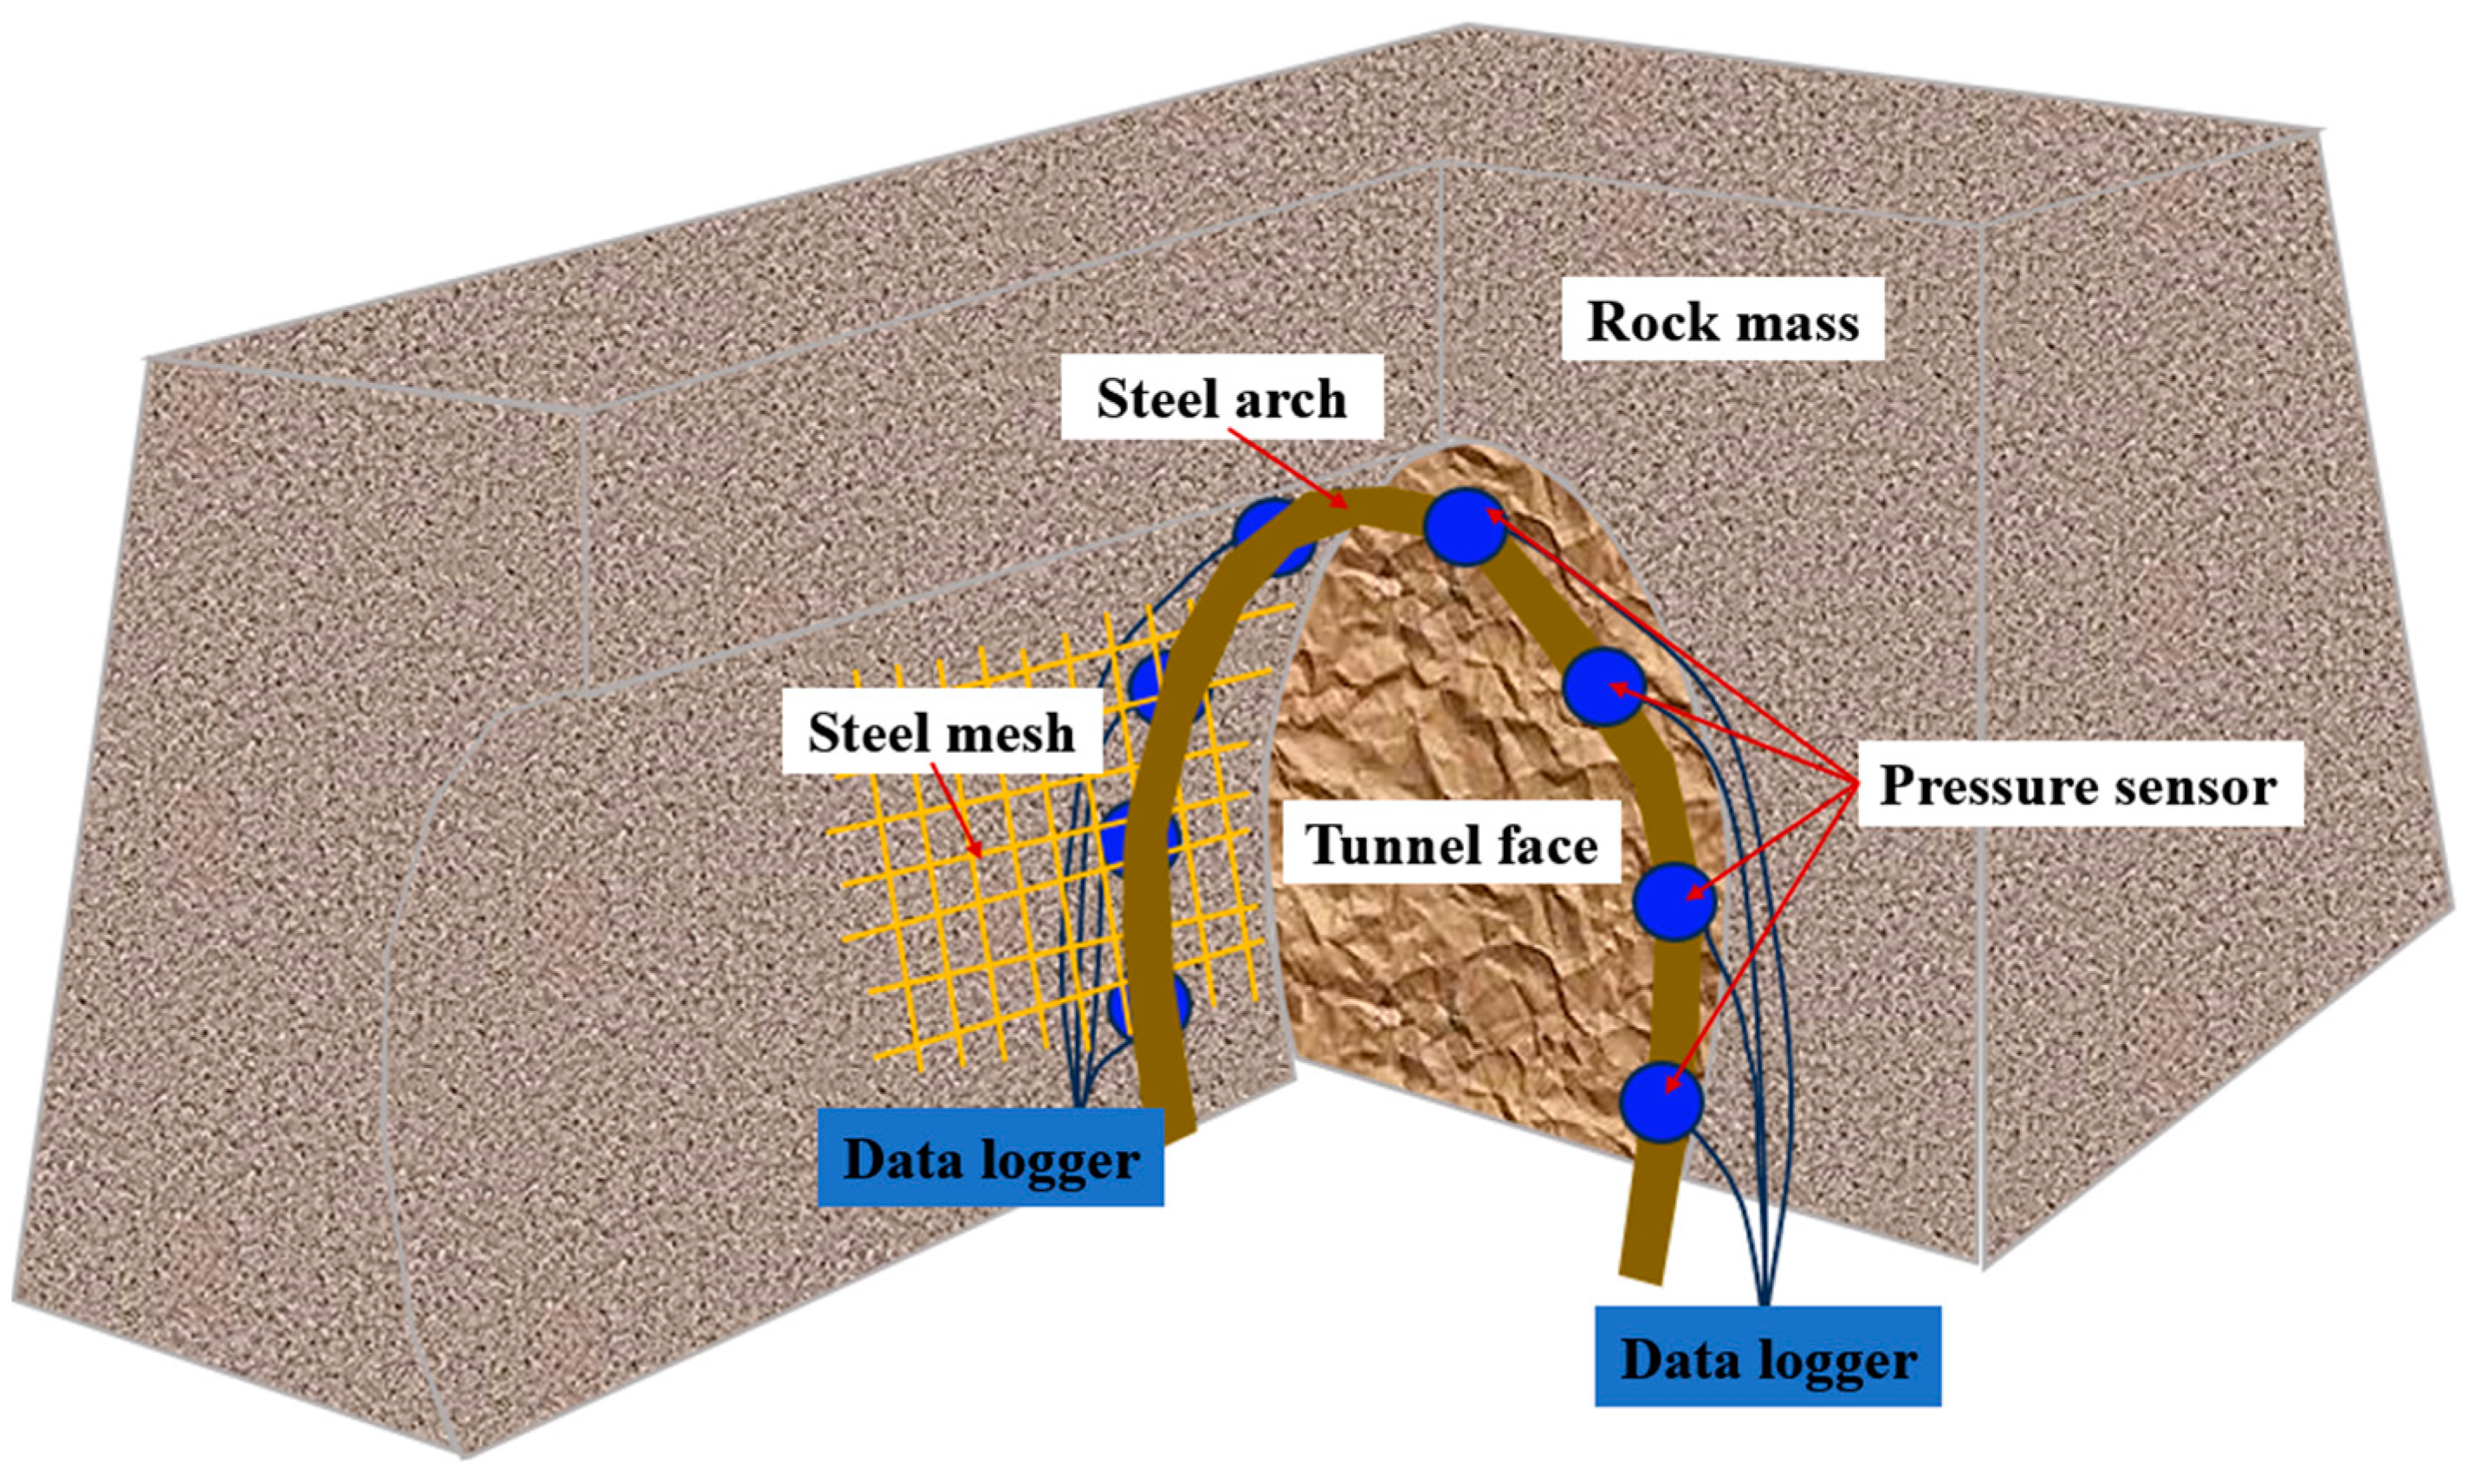
- Given the potential blasting disturbances and unloading effects due to the excavation of adjacent tunnels, the entire section of the tunnel may be subjected to negative impacts. It has been shown that the pressure sensor should be evenly distributed in the tunnel section to ensure the accuracy of monitoring the key parts of each section [36]. When Yang [37] carried out the study of large tunnel deformation, the layout scheme of the surrounding rock pressure monitoring points involved arranging eight sensors uniformly in the tunnel section. As a result, eight pressure sensors are evenly distributed along the tunnel section, with each monitoring section arranged in a single row (Figure 3).
- (2)
- The positioning of the sensors was determined based on the geological conditions of the surrounding rock encountered during excavation. Pressure sensors are strategically placed at locations corresponding to the most unfavorable structural planes.
- (3)
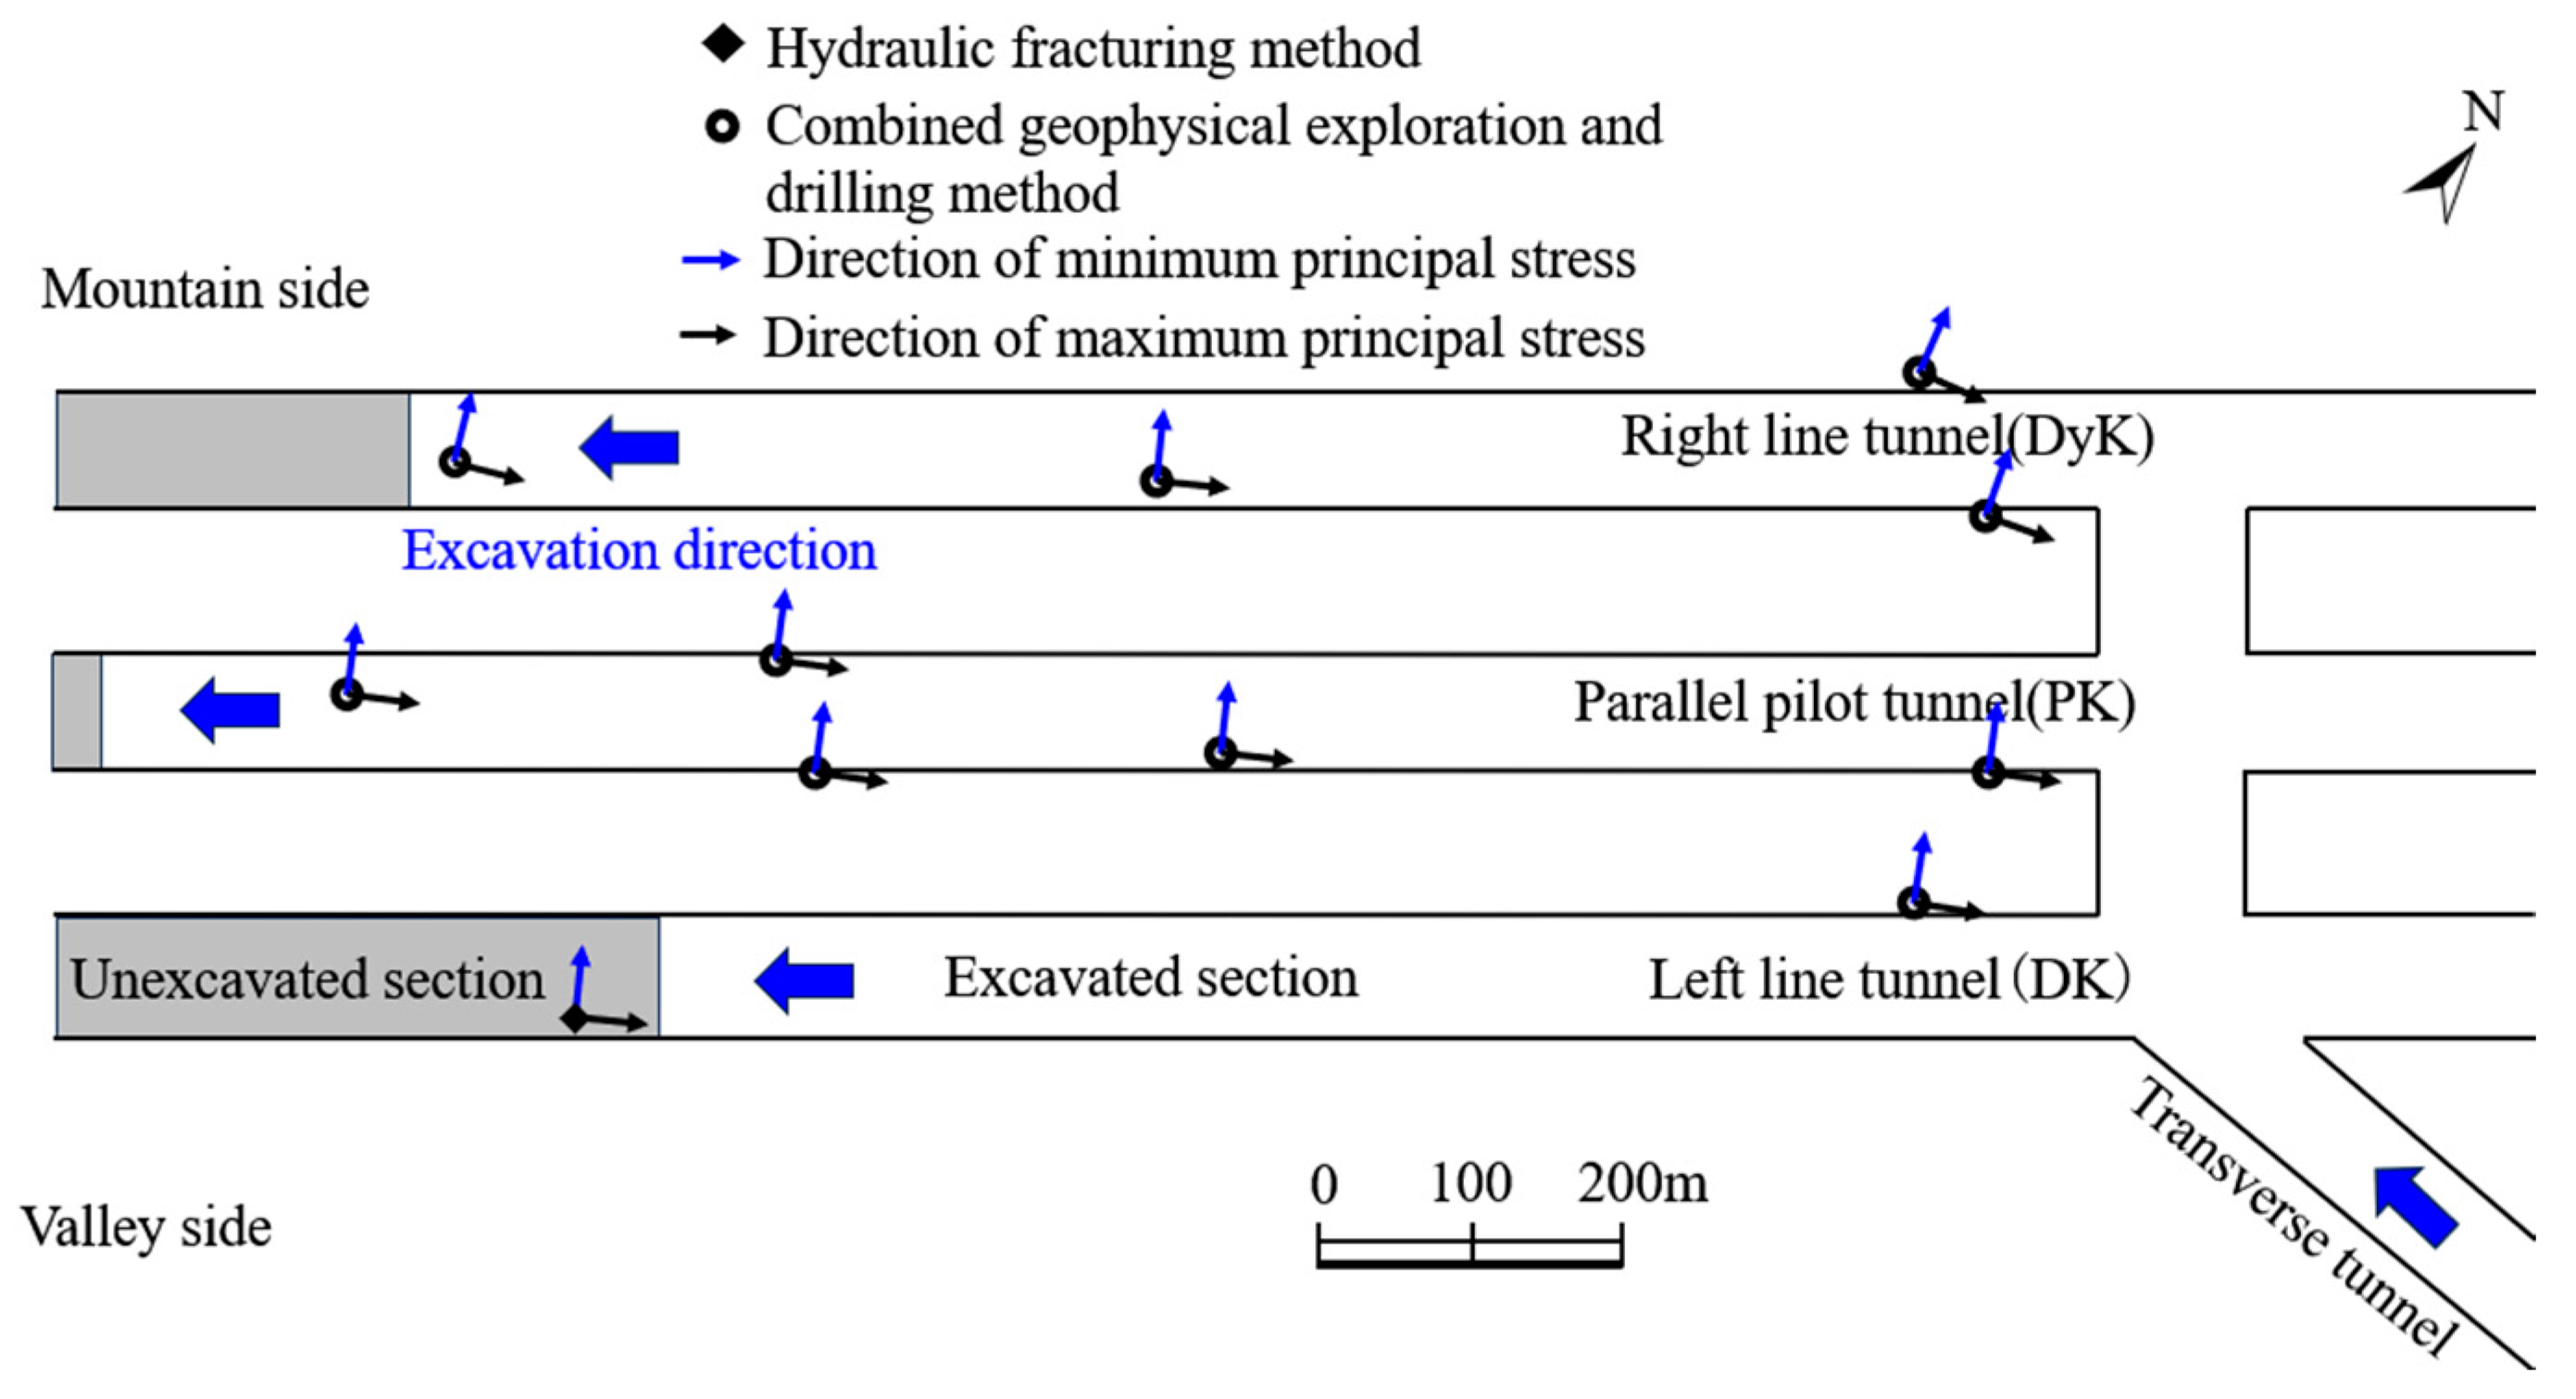
- The first set of eight pressure sensors in a single row is arranged within the first borehole, while the second and third sets of pressure sensors are installed sequentially in subsequent boreholes within the same section.The excavation sequence of the three tunnels is that the parallel pilot tunnel is used as the first tunnel excavation, the right line starts to follow after the excavation of more than 200 m, and the left line starts to advance after the excavation of more than 150 m. Due to the small clearance between the tunnels, the surrounding rock of each tunnel has different degrees of damage after the excavation of the left line, and the parallel pilot tunnel is the most serious. In order to facilitate the monitoring of the changes in the surrounding rock pressure when the face of the adjacent tunnel is close to and away from the section, the preliminary design is to install the first group of pressure sensors in the parallel pilot tunnel to determine the mileage of the monitoring section. When the two backward tunnels of the left and right lines follow up, the second group and the third group of pressure sensors are installed in turn at the monitoring section. The relative diagram of the installation process and position of the pressure sensor is shown in Figure 4.
2.2.2. Basic Theory of in Situ Monitoring of Surrounding Rock Pressure
2.2.3. Principles for in Situ Monitoring
- (1).
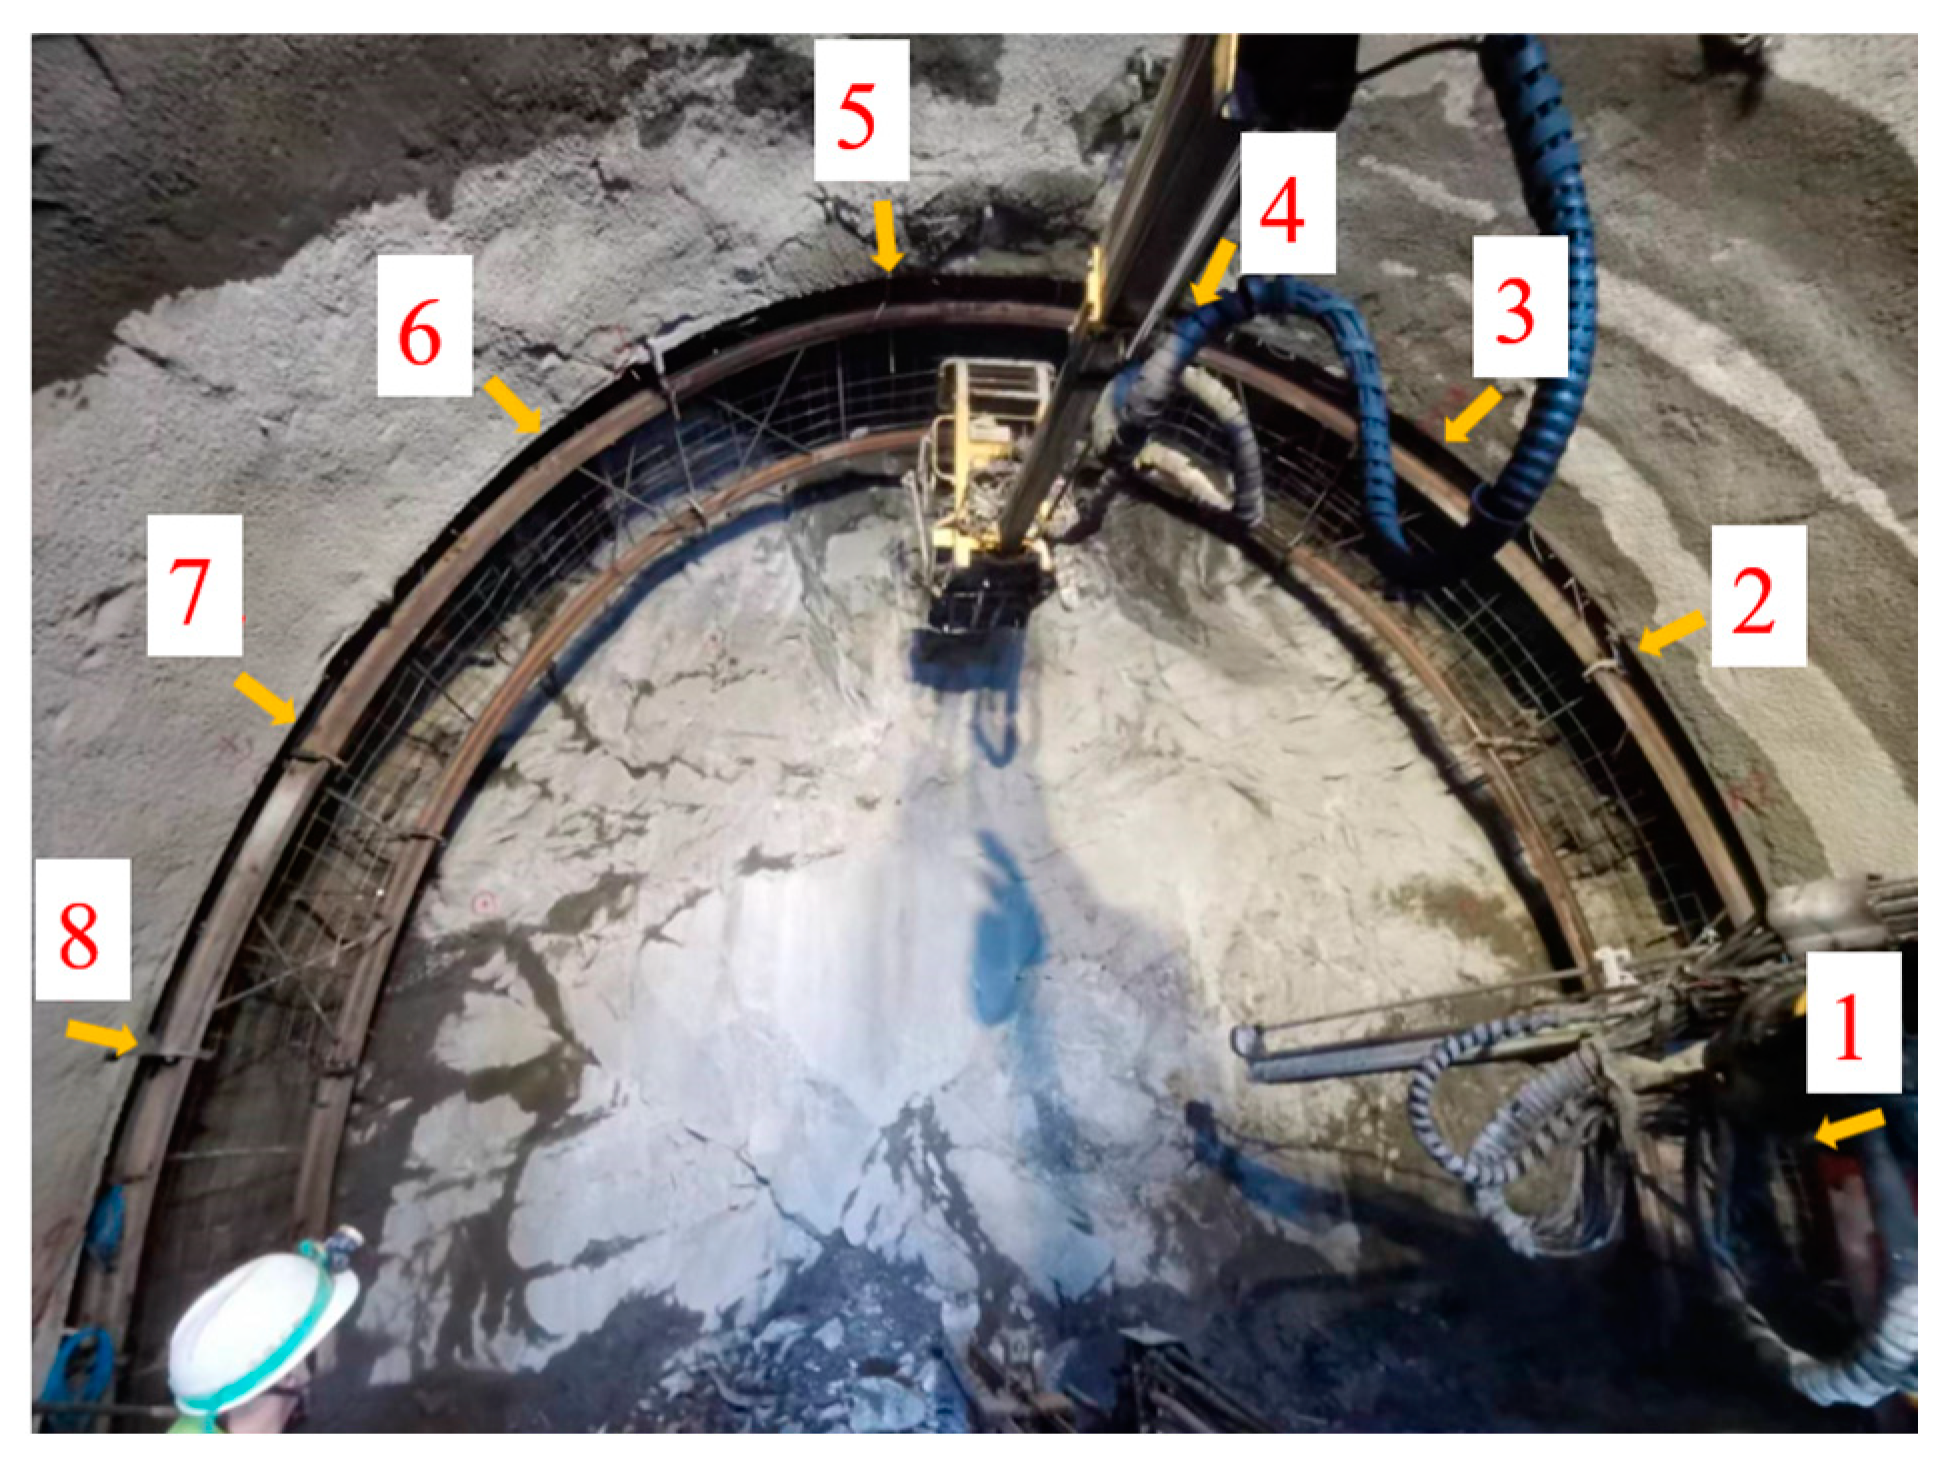
- Sensor installation.The pressure membrane of the pressure sensor must be in close contact with the rock surface. If the rock surface is uneven, leveling pretreatment should be carried out prior to installation. The steel frame should establish good contact with the pressure box to ensure proper stress transfer. The installation effect is shown in Figure 5.
- (2).
- Calibration and protection.After the installation of the pressure sensor, its identification numbers should be calibrated. Additionally, protective measures must be implemented for the data transmission lines to ensure uninterrupted data transmission, as illustrated in Figure 6.
- (3).
- Pre-installation debugging.Prior to installation, the pressure sensor should be thoroughly calibrated and debugged. Following installation, the first set of pressure data should be recorded to confirm the system’s functionality.
- (4).
- Data collection protocol.During data collection, special attention should be given to ensuring that the transmission wire is properly inserted into the acquisition instrument interface. Data should only be read once the values have stabilized, ensuring accuracy and reliability.
- (5).
- Data integrity.Data collection should occur once daily to maintain continuity and ensure the integrity of the dataset.
2.2.4. In Situ Monitoring Results
3. Investigation Results
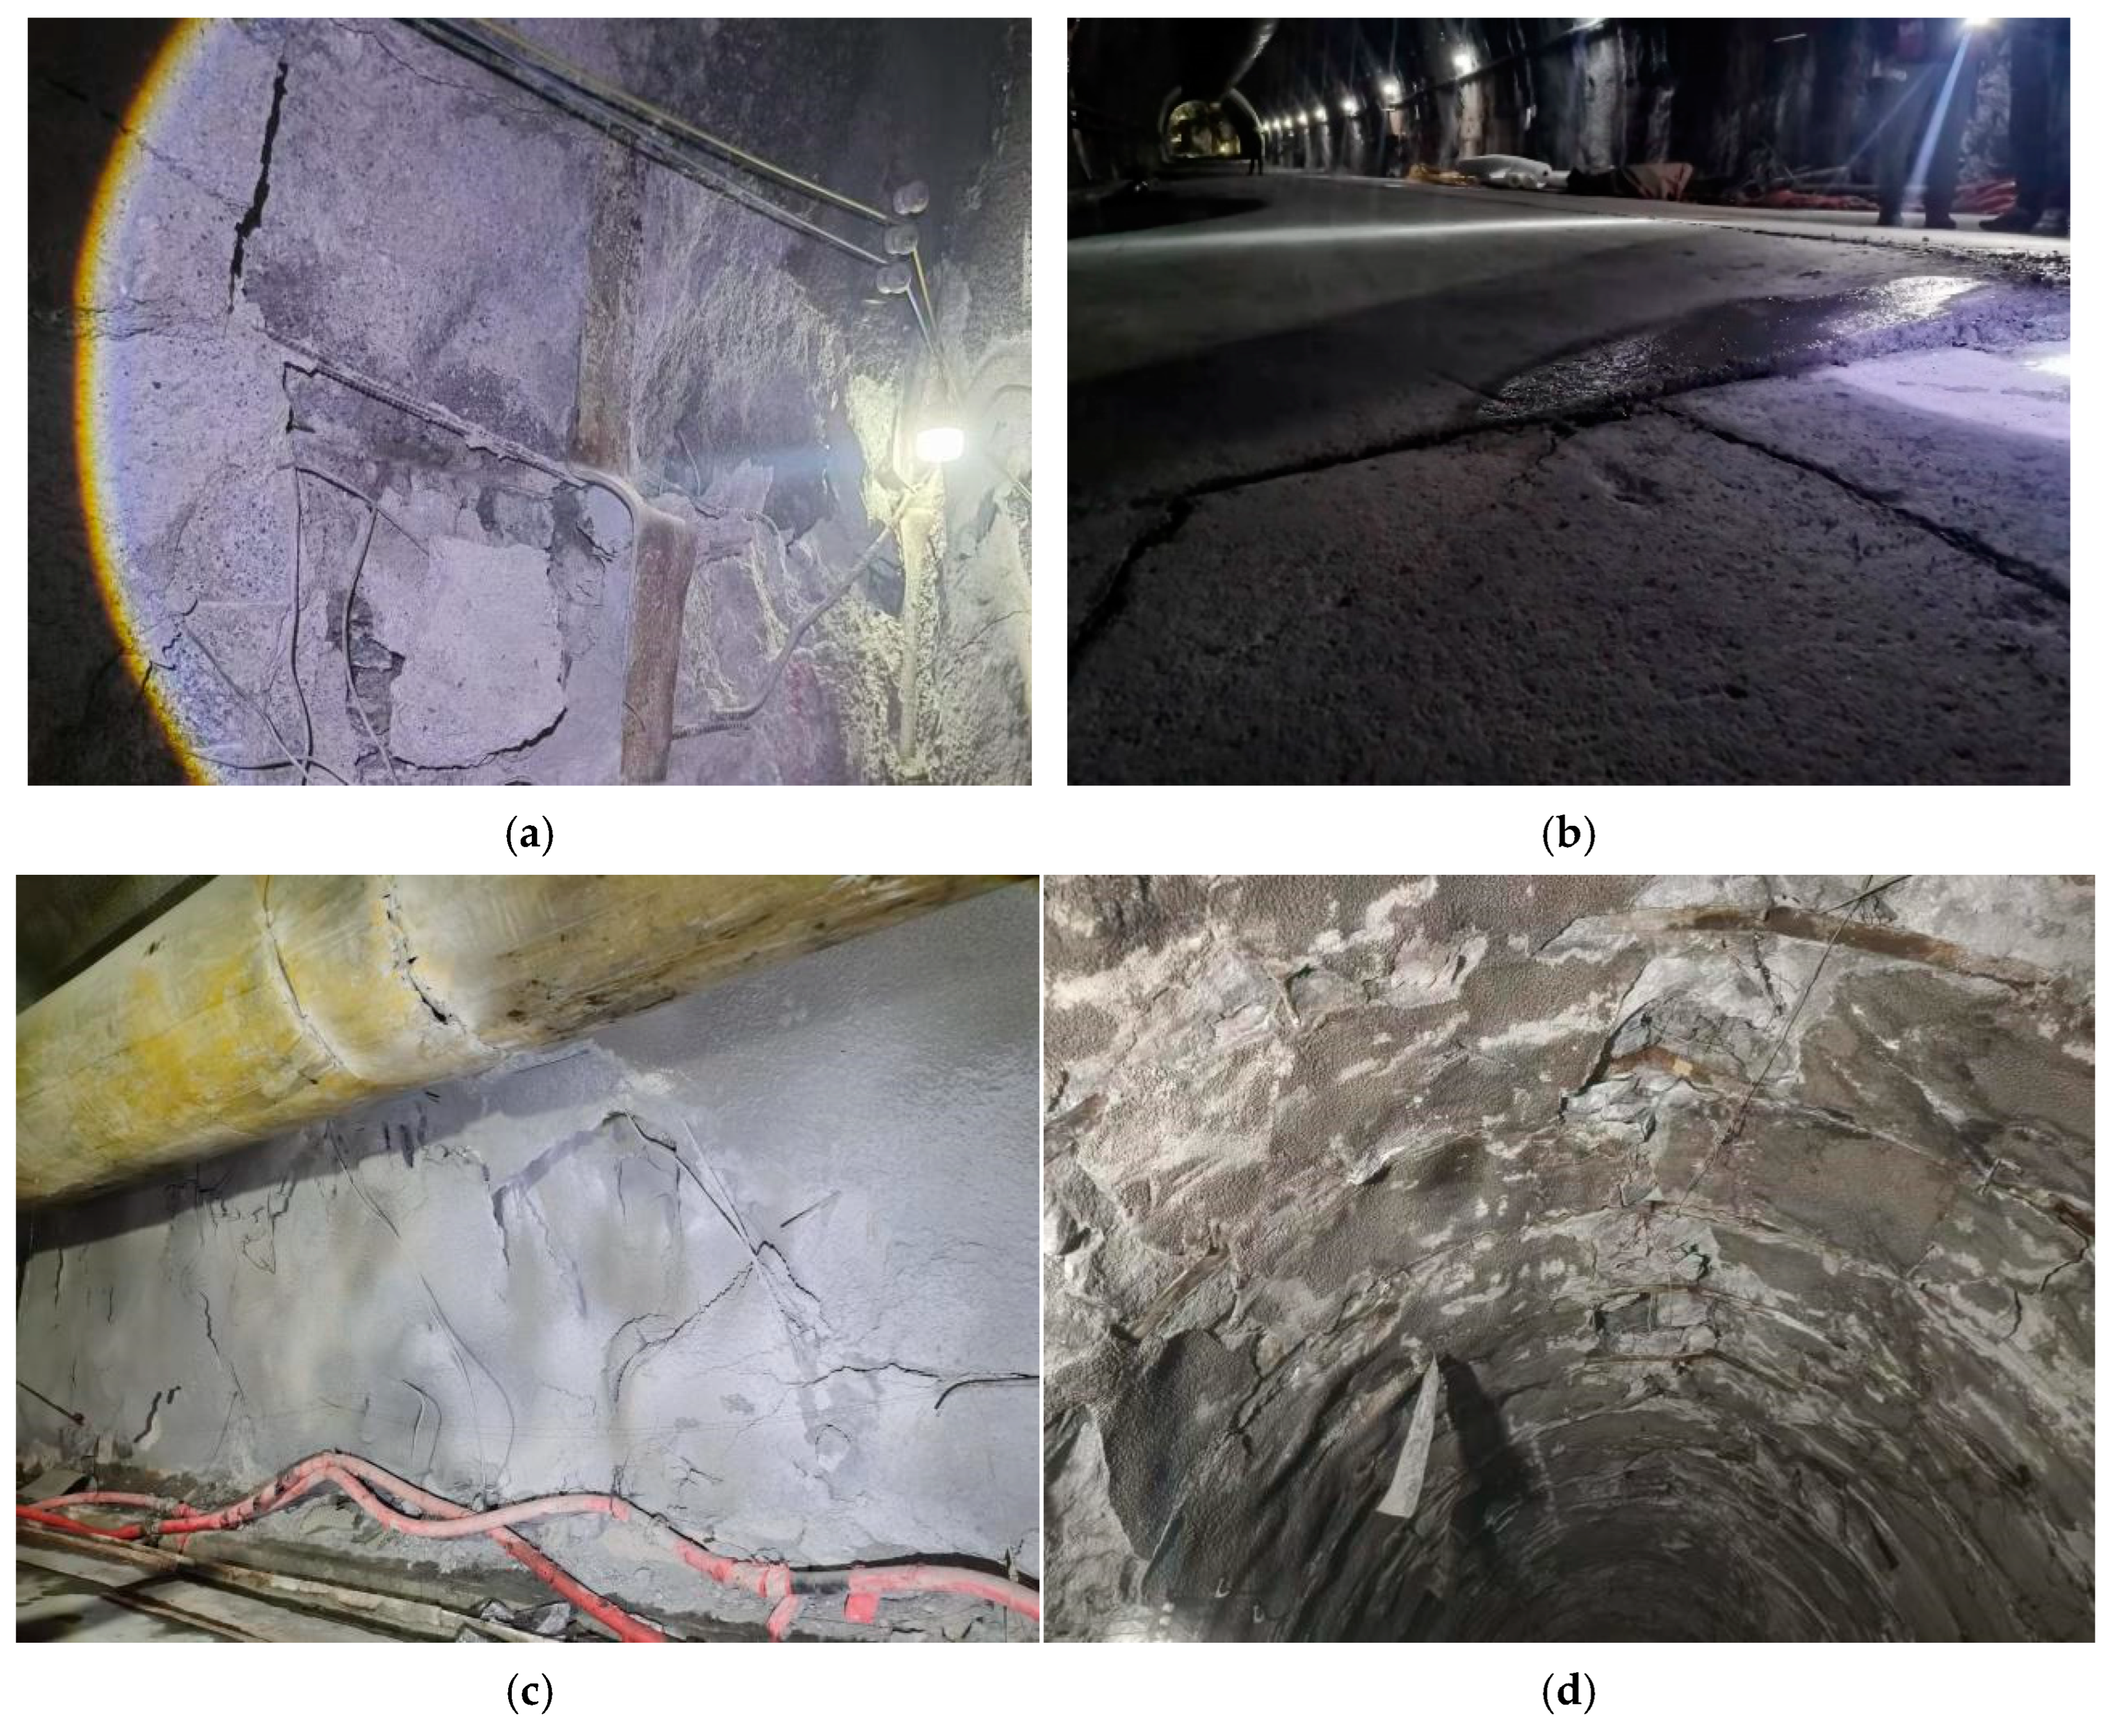
3.1. Failure Characteristics of the Parallel Pilot Tunnel
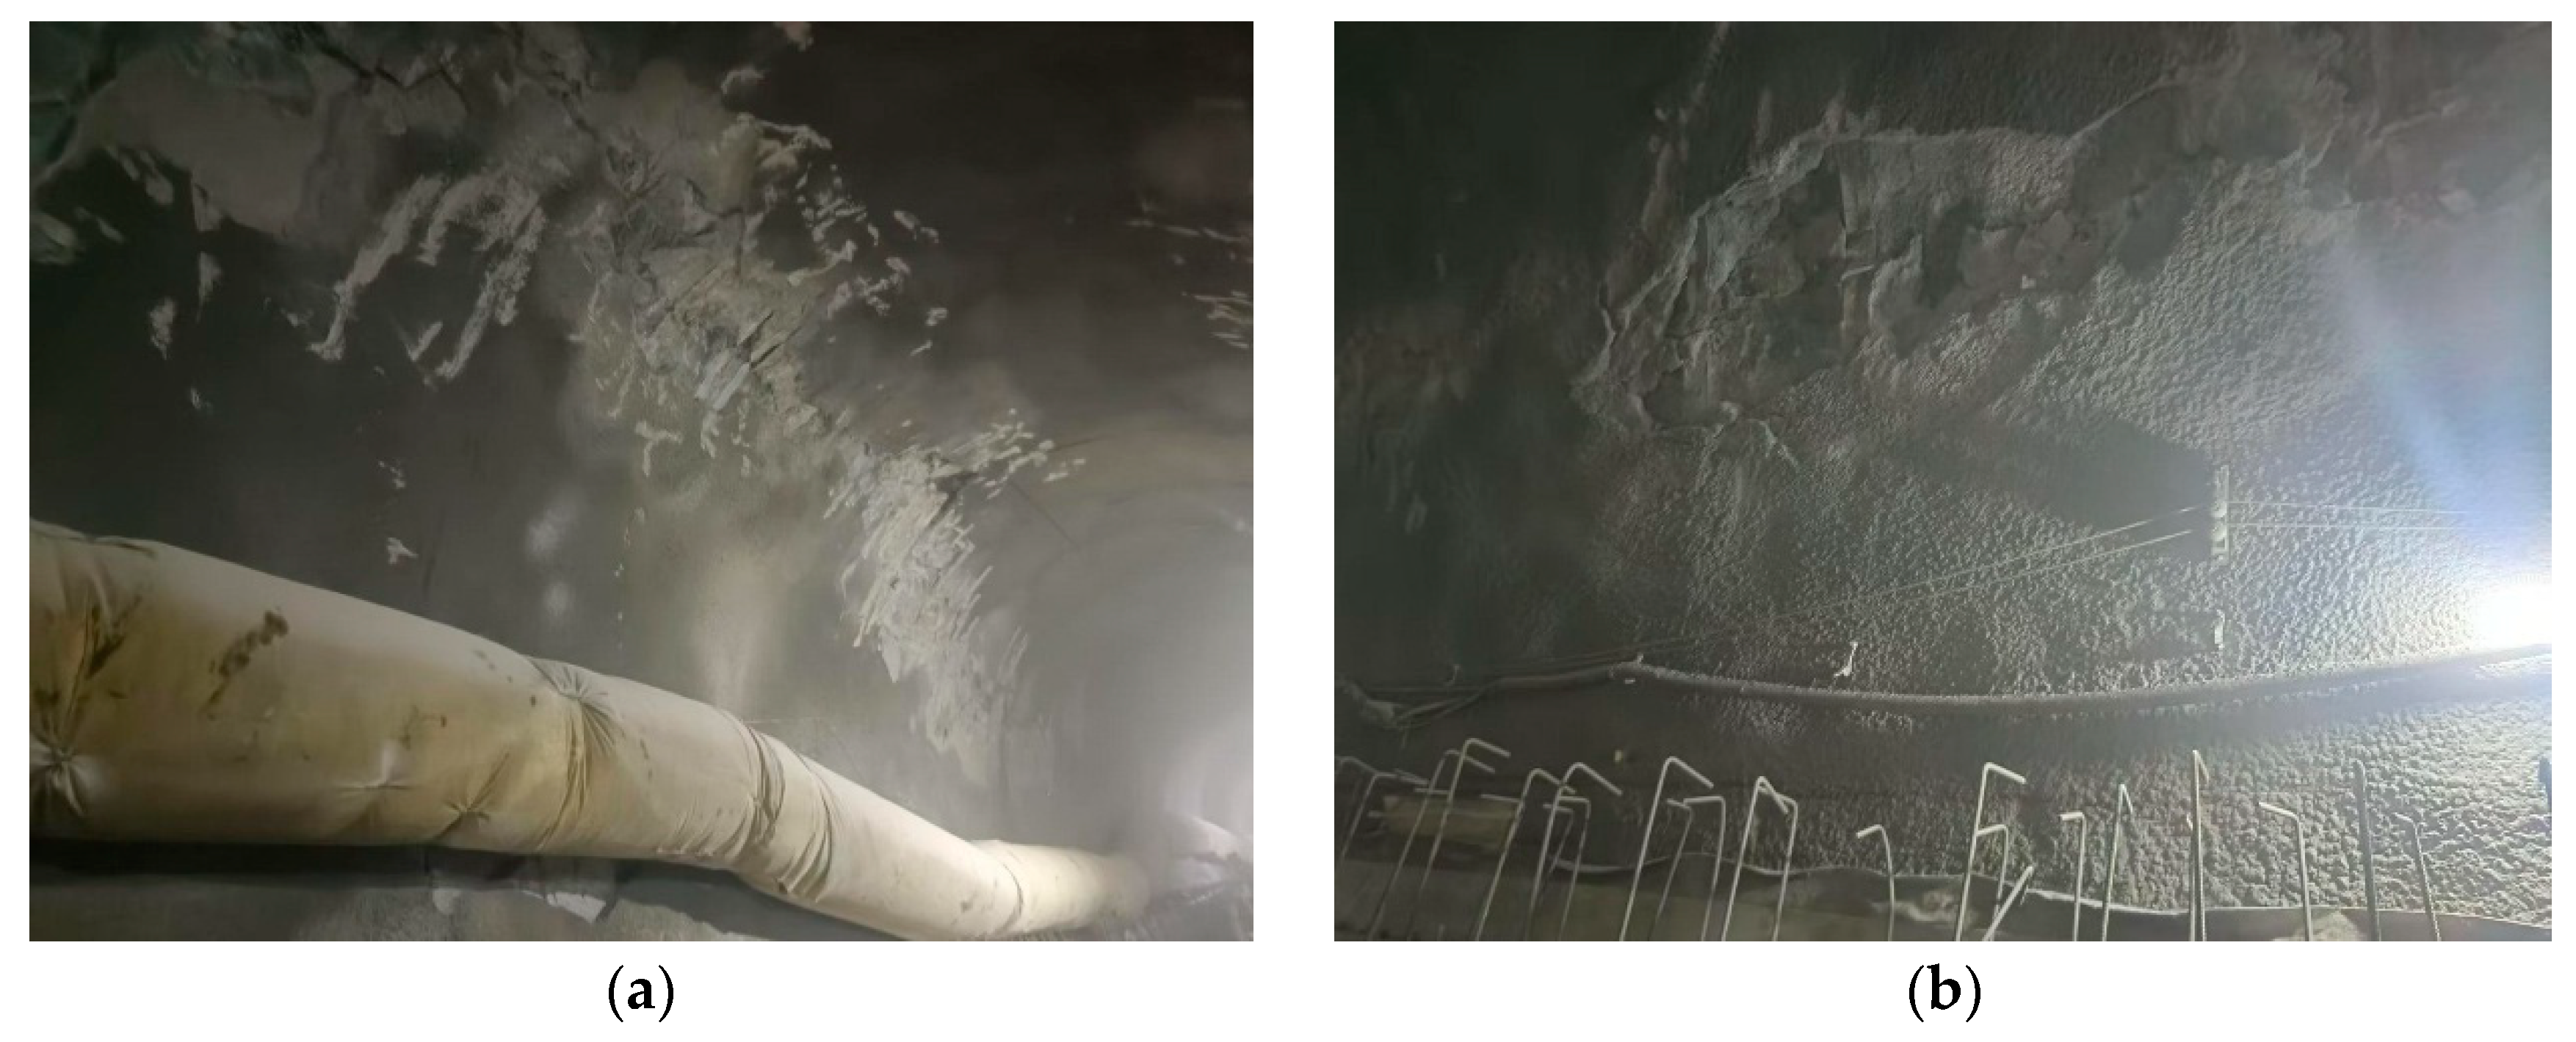
3.2. Failure Characteristics of the Right Line Tunnel
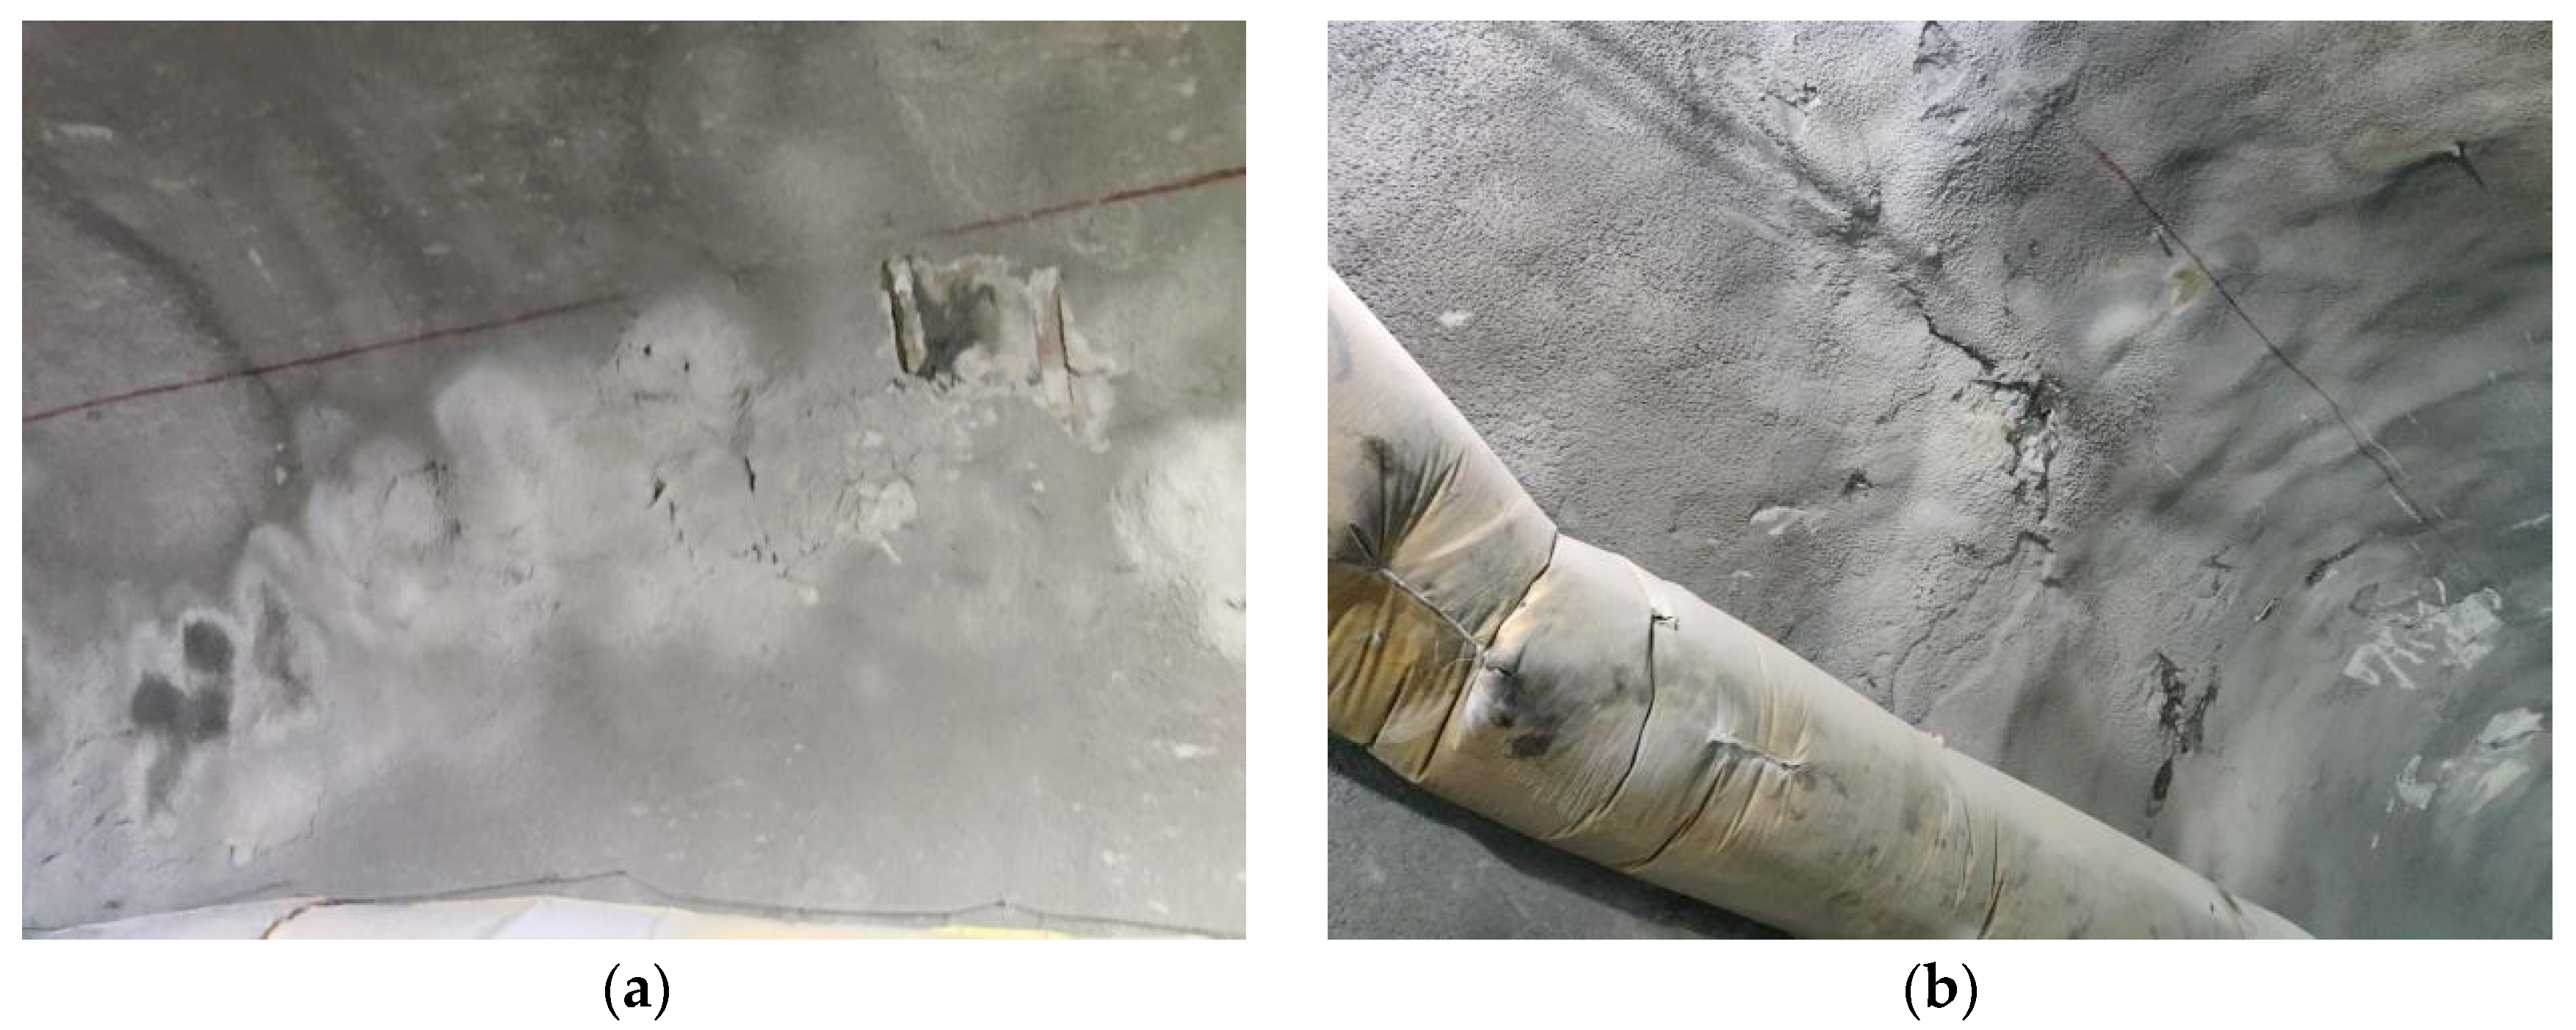
3.3. Failure Characteristics of the Left Line Tunnel
3.4. Comparative Analysis of Spatial Failure Characteristics and Geological Conditions Across Different Tunnels
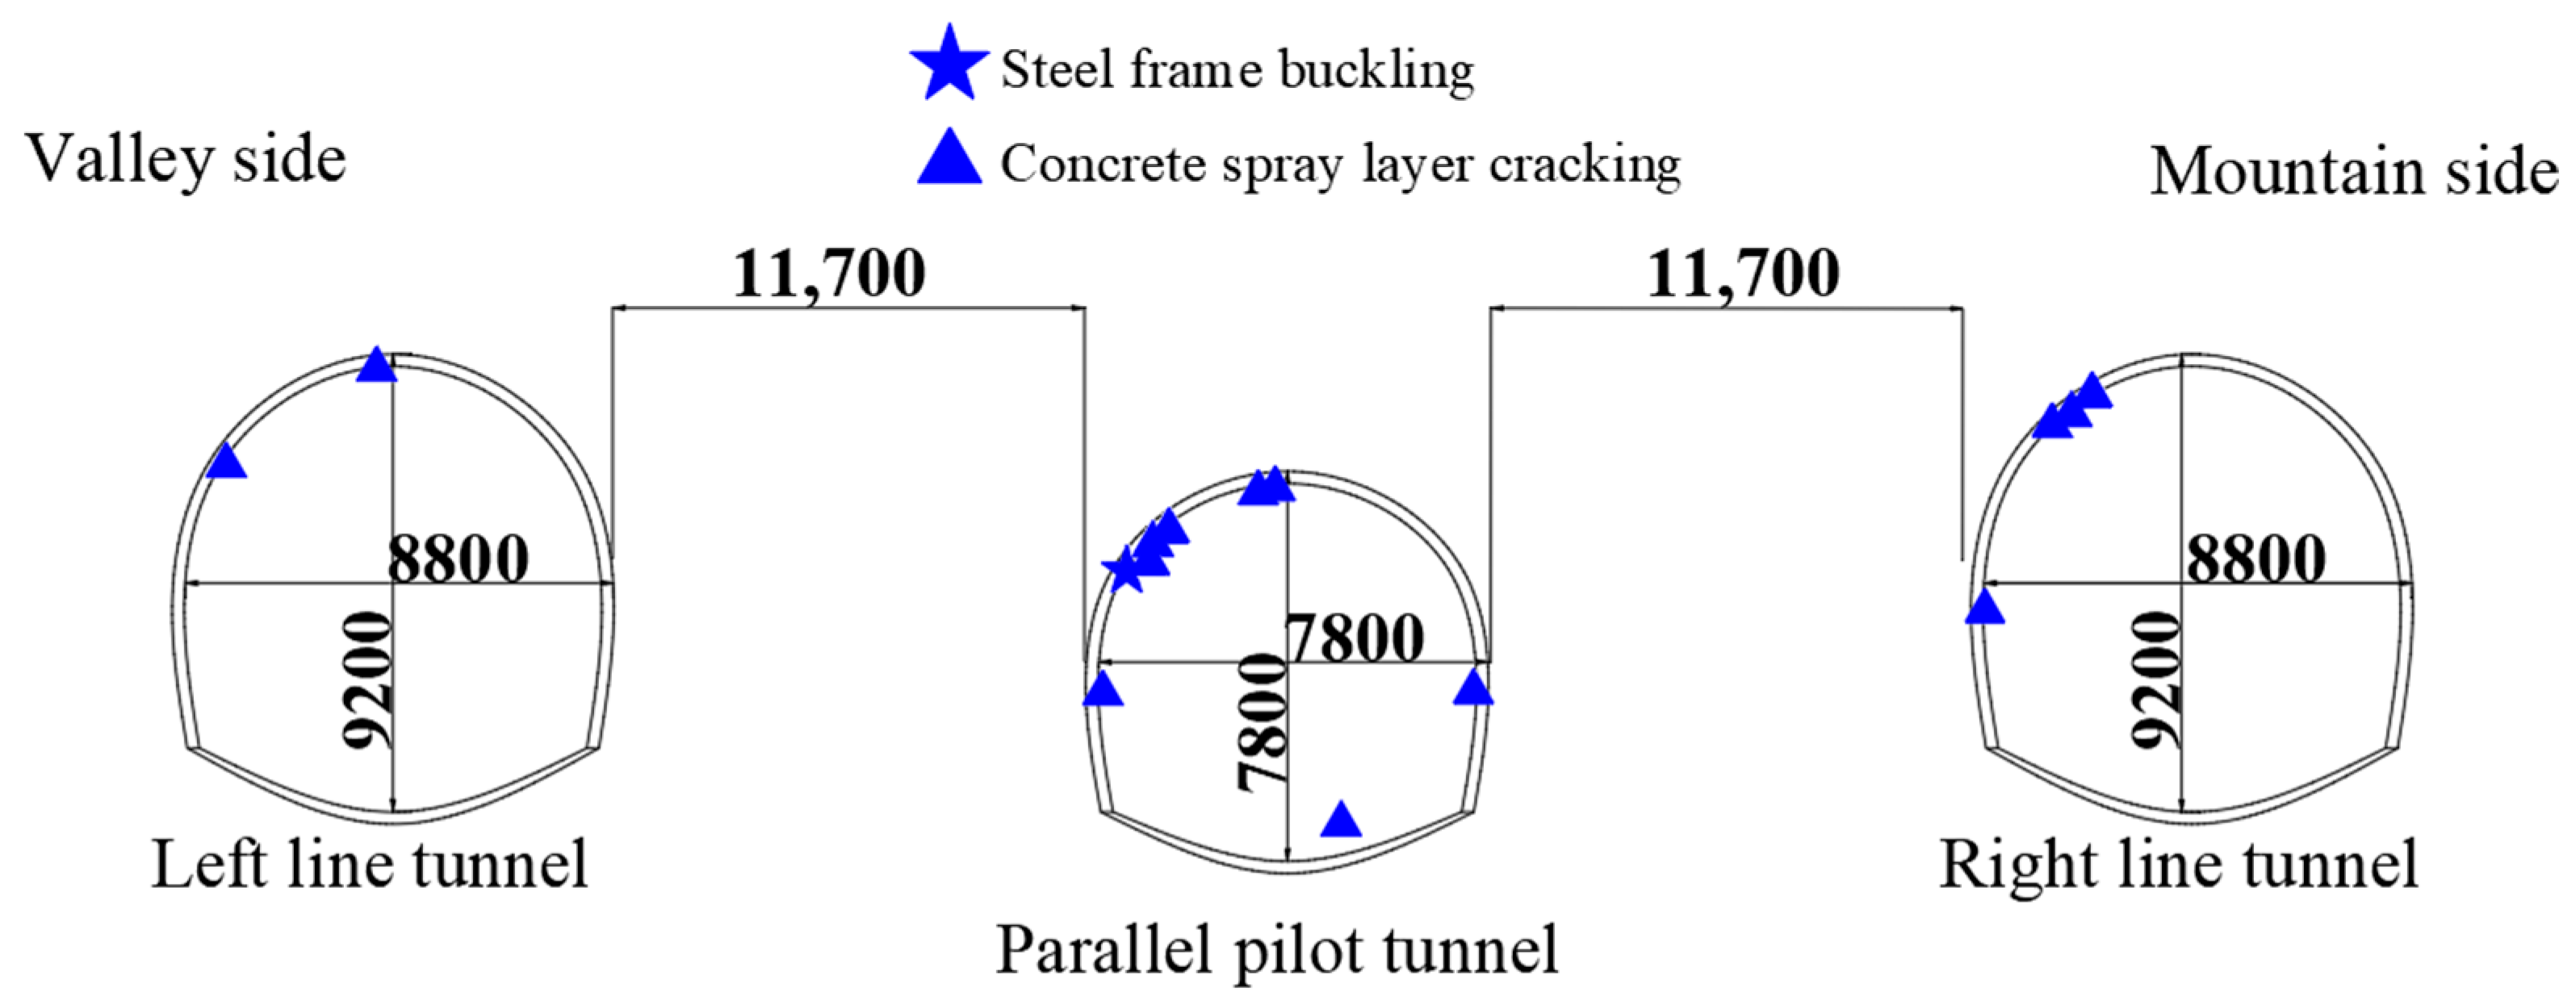
3.4.1. Comparison of Spatial Failure Characteristics
3.4.2. Comparison of Geological Conditions
4. Discussion
4.1. Evolution Characteristics of Surrounding Rock Pressure
4.2. Analysis of the Asymmetric Failure Mechanism
5. Conclusions
Author Contributions
Funding
Institutional Review Board Statement
Informed Consent Statement
Data Availability Statement
Conflicts of Interest
References
- Cui, P.; Ge, Y.; Li, S.; Li, Z.; Xu, X.; Zhou, G.G.D.; Chen, H.; Wang, H.; Lei, Y.; Zhou, L.; et al. Scientific Challenges in Disaster Risk Reduction for the Sichuan-Tibet Railway. Eng. Geol. 2022, 309, 106837. [Google Scholar] [CrossRef]
- Borghetti, F.; Frassoldati, A.; Derudi, M.; Lai, I.; Trinchini, C. Road Tunnels Operation: Effectiveness of Emergency Teams as a Risk Mitigation Measure. Sustainability 2022, 14, 15491. [Google Scholar] [CrossRef]
- Song, G.; Huang, Y.; Wang, Z.; Feng, Q.; Jia, F.; Wang, S. Review of Railway Operation Tunnel Inspection System and Condition Assessment Method. Acta Polytech. Hung 2024, 21, 259–279. [Google Scholar] [CrossRef]
- Xu, D.; Jiang, Q.; Li, S.; Liu, X.; Huang, S.; Qiu, S.; Feng, G.; Zheng, H. Quantitative Approach, Cloud System and Engineering Practice for Global Stability Assessment of Surrounding Rock in Underground Caverns. Chin. J. Rock Mech. Eng. 2022, 41, 2186–2198. [Google Scholar] [CrossRef]
- Liu, G.; Liu, Z.; Feng, G.; Chen, X.; Duan, S.; Liu, C.; Zhao, J. Disaster Characteristics and Mechanisms of the Time-Delayed Rockburst Development Process in Tunnels at 2500 m Depth. Tunn. Undergr. Space Technol. 2025, 159, 106474. [Google Scholar] [CrossRef]
- Jiang, Q.; Feng, X.; Li, S.; Su, G.; Xiao, Y. Cracking-restraint Design Method for Large Underground Caverns with Hard Rock Under High Geostress Condition and Its Practical Application. Chin. J. Rock Mech. Eng. 2019, 38, 1081–1101. [Google Scholar] [CrossRef]
- Peng, J.; Cui, P.; Zhuang, J. Challenges to Engineering Geology of Sichuan-Tibet Railway. Chin. J. Rock Mech. Eng. 2020, 39, 2377–2389. [Google Scholar] [CrossRef]
- Li, S.; Feng, X.; Li, Z.; Chen, B.; Zhang, C.; Zhou, H. In Situ Monitoring of Rockburst Nucleation and Evolution in the Deeply Buried Tunnels of Jinping II Hydropower Station. Eng. Geol. 2012, 137–138, 85–96. [Google Scholar] [CrossRef]
- Feng, G.; Feng, X.; Chen, B.; Xiao, Y.; Yu, Y. A Microseismic Method for Dynamic Warning of Rockburst Development Processes in Tunnels. Rock Mech. Rock Eng. 2015, 48, 2061–2076. [Google Scholar] [CrossRef]
- Xia, Y.; Xu, D.; Qiu, S.; Liu, X.; Huang, X.; Li, Z. Experimental Study on Mechanical Properties of Deeply Buried Granite During Layered Excavation of Large Underground Caverns. Rock Mech. Rock Eng. 2023, 56, 4757–4778. [Google Scholar] [CrossRef]
- Xu, H.; Zhang, Z.; Zhang, Y.; Jiang, Q.; Qiu, S.; Zhou, Y.; Feng, G. Effects of Natural Stiff Discontinuities on the Deformation and Failure Mechanisms of Deep Hard Rock Under True Triaxial Conditions. Eng. Fail. Anal. 2024, 158, 108034. [Google Scholar] [CrossRef]
- Feng, G.; Ma, Q.; He, Z.; Su, G.; Chen, B.; Xu, D.; He, J. Time-Delayed Failure Process of Granite and Its Energy Evolution and Acoustic Emission Characteristics. Eng. Fail. Anal. 2024, 157, 107854. [Google Scholar] [CrossRef]
- Zhang, S.; Xu, D.; Qiu, S.; Feng, G.; Jiang, Q. Experimental and Theoretical Study on Cyclic Fatigue Damage Evolution of Sandstone Based on Acoustic Emission Monitoring and Resistivity Measuring. Measurement 2025, 245, 116633. [Google Scholar] [CrossRef]
- Liu, D.; Ling, K.; Guo, C.; He, P.F.; He, M.; Sun, J.; Yan, X. Experimental Simulation Study of Rockburst Characteristics of Sichuan-Tibet granite: A Case Study of the Zheduoshan Tunnel. Eng. Geol. 2022, 305, 106701. [Google Scholar] [CrossRef]
- Feng, X.; Xiao, Y.; Feng, G.; Yao, Z.; Chen, B.; Yang, C.; Su, G. Study on the Development Process of Rockbursts. Chin. J. Rock Mech. Eng. 2019, 38, 649–673. [Google Scholar] [CrossRef]
- Tyagi, A.; Lee, F.-H. Influence of Tunnel Failure on the Existing Large-Diameter Tunnel in Improved Soil Surround. Tunn. Undergr. Space Technol. 2022, 120, 104276. [Google Scholar] [CrossRef]
- Huang, H.; Li, P.; Wang, C.; Yuan, B.; Chen, M.; Feng, W. Research and Analysis on the Influence of Small Clear Distance Drilling and Blasting Method on the Existing Tunnel Structure. Adv. Civ. Eng. 2021, 2021, 4730936. [Google Scholar] [CrossRef]
- Lei, M.; Lin, D.; Yang, W.; Shi, C.; Pei, L.; Huang, J. Model Test to Investigate Failure Mechanism and Loading Characteristics of Shallow-Bias Tunnels with Small Clear Distance. J. Cent. South Univ. 2016, 23, 3312–3321. [Google Scholar] [CrossRef]
- Zhang, X.; Fu, D.; Zhou, X.; Han, Y. Characterization of Mechanical Behavior of Ultra-Small Clearance Tunnel Construction in Upper Soil and Lower Rock Composite Strata. Buildings 2023, 13, 559. [Google Scholar] [CrossRef]
- Wu, S.; Wu, J.; Liu, D. Research on Construction Sequences and Construction Methods of the Small Clear-Distance, Double-Arch Tunnel under an Asymmetrical Load. Appl. Sci. 2023, 13, 8242. [Google Scholar] [CrossRef]
- Chen, H.; Lai, H.; Huang, M.; Wang, G.; Tang, Q. Failure Mechanism and Treatment Measures of Supporting Structures at the Portal for a Shallow Buried and Asymmetrically Loaded Tunnel with Small Clear-Distance. Nat. Hazards 2022, 114, 2283–2310. [Google Scholar] [CrossRef]
- Zhang, H.; Hao, Z.; Ge, Z.; Zhang, G.; Chen, S.; Wang, L. The Construction Mechanical Behavior and Deformation Characteristics of Lining Structure: A Case Study of Large-Span and Small-Clearance Tunnels. Structures 2022, 45, 2007–2021. [Google Scholar] [CrossRef]
- Zhang, H.; Liu, G.; Liu, W.; Chen, Z.; Miao, Z.; Liu, Q. Stability Evaluation of Rock Pillar Between Twin Tunnels Using the YAI. Sci. Rep. 2023, 13, 13187. [Google Scholar] [CrossRef] [PubMed]
- Chen, H.; Zhou, X.; Liu, X.; Lojain, S.; Xu, Q.; Ren, L. Study on Construction Mechanical Characteristics and Pinch Rocks Reinforcement Schemes of Honeycomb Tunnel Clusters in Mountainous City. Tunn. Undergr. Space Technol. 2025, 158, 106397. [Google Scholar] [CrossRef]
- Zhang, H.; Zhang, G.; Pan, Y.; Hao, Z.; Chen, S.; Cheng, F. Experimental Study on the Mechanical Behavior and Deformation Characteristics of Lining Structure of Super-Large Section Tunnels with a Small Clearance. Eng. Fail. Anal. 2022, 136, 106186. [Google Scholar] [CrossRef]
- Wu, X.; Gong, M.; Wu, H.; Hu, G.; Wang, S. Vibration Reduction Technology and the Mechanisms of Surrounding Rock Damage from Blasting in Neighborhood Tunnels with Small Clearance. Int. J. Min. Sci. Technol. 2023, 33, 625–637. [Google Scholar] [CrossRef]
- He, F.; Zhai, W.; Xu, X.; Song, J.; Li, L.; Lv, K. Study on Mechanism and Control Technology of Asymmetric Floor Heave in a Deep Soft Rock Main Roadway. Geofluids 2022, 2022, 12. [Google Scholar] [CrossRef]
- Wang, X.; Zhang, Y.; Zhang, Q.; Wei, Y.; Liu, W.; Jiang, T. Space-Time Evolution Characteristics of Deformation and Failure of Surrounding Rock in Deep Soft Rock Roadway. Sustainability 2022, 14, 12587. [Google Scholar] [CrossRef]
- Jiang, Q.; Yang, B.; Yan, F.; Xu, D.; Feng, G.; Li, S. Morphological features and fractography analysis for in situ spalling in the China Jinping underground laboratory with a 2400 m burial depth. Tunn. Undergr. Space Technol. 2021, 118, 104194. [Google Scholar] [CrossRef]
- Liu, X.; Pan, P.; Zhou, Y.; Wang, Z.; Xu, D. Role of Foliation Occurrence and Stress Orientation on Asymmetric Failure in Foliated Rock Tunnel: Insight from Numerical Simulation. Eng. Fail. Anal. 2024, 160, 108174. [Google Scholar] [CrossRef]
- Sun, X.; Zhao, W.; Shen, F.; Wang, J.; Cui, L.; Jiang, M. Physical Modelling of Deformation and Failure Mechanisms and Supporting Effects for a Deep-buried Tunnel in Inclined Layered Strata. Bull. Eng. Geol. Environ. 2023, 82, 74. [Google Scholar] [CrossRef]
- Liu, D.; Zhang, D.; Fang, Q.; Sun, Z.; Luo, J.; Li, A. Field Monitoring of the Deformation and Internal Forces of the Surrounding Rock and Support Structures in the Construction of a Super-Span High-Speed Railway Tunnel—A Case Study. Appl. Sci. 2020, 10, 5182. [Google Scholar] [CrossRef]
- Fan, L.; Cui, L.; Zhu, Z.; Sheng, Q.; Zheng, J.; Dong, Y. Elaborate Numerical Analysis and New Fiber Bragg Grating Monitoring Methods for the Ground Pressure in Shallow Large-Diameter Shield Tunnels: A Case Study of the Yellow Crane Tower Tunnel Project. Bull. Eng. Geol. Environ. 2025, 84, 63. [Google Scholar] [CrossRef]
- Zhang, Q.; Li, R.; Yuan, H.; Zhong, H. Vertical Displacement Measurement of Tunnel Structures Based on Long-Gauge Fiber Bragg Grating Strain Sensing. Appl. Sci. 2023, 13, 11496. [Google Scholar] [CrossRef]
- Li, J.; Liu, Y.; Zhang, J. Simultaneous Measurement of Strain and Displacement for Railway Tunnel Lining Safety Monitoring. Sensors 2024, 24, 6201. [Google Scholar] [CrossRef]
- Qin, Z.; Liu, W.; Wu, F.; Li, W. Progressive Arching Effect and Damage Evolution Process of Shallow Tunnels with Jointed Hard Rock under Overlying Loads. Tunn. Undergr. Space Technol. 2025, 158, 106385. [Google Scholar] [CrossRef]
- Yang, K.; Yan, Q.; Zhang, C.; Wu, W.; Xu, Y.; Cheng, Y. Monitoring and Field Tests for Controlling Large Tunnel Deformation in Squeezing Ground: A Case Study. Bull. Eng. Geol. Environ. 2024, 83, 132. [Google Scholar] [CrossRef]
- Chen, Z.; You, Q.; Lin, M.; Li, X. Application of Vibrating Wire Pressure Cell for Stress Monitoring on Rigid Interface. Strateg. Study CAE 2002, 4, 80–85. [Google Scholar]


| Monitoring Methods | Principle | Precision | Application Scenario | Limitations |
|---|---|---|---|---|
| Vibrating string pressure box | String vibration frequency–pressure conversion relationship | ±0.1% FS | High humidity environment and long-term stable monitoring. | Slow dynamic response |
| Fiber grating sensor | Grating wavelength offset-strain relationship | ±0.01% FS | Distributed monitoring and anti-electromagnetic interference. | High cost and complex installation. |
| Strain type bolt sensor | Elastic mechanics strain–stress relationship | ±0.5% FS | Deep surrounding rock, local stress concentration area. | Affected by anchoring agent. |
| Displacement inverse analysis | Displacement-pressure numerical inversion | Depends on the accuracy of inversion model | The sensor cannot be deployed directly under complex geological conditions. | High calculation complexity and uncertainty. |
| Vibrating string pressure box | String vibration frequency-pressure conversion relationship | ±0.1% FS | High humidity environment and long-term stable monitoring. | Slow dynamic response |
| Number | Tunnel | Severely Deformed and Damaged Sections | Length (m) | Maximum Amount of Deformation |
|---|---|---|---|---|
| 1 | The left line | DK1193+114~DK1193+126 | 12 | Settlement of the arch: 77 mm. Convergence value of the side wall: 255 mm. |
| 2 | DK1193+265~DK1193+430 | 165 | ||
| 3 | DK1193+550~DK1193+630 | 80 | ||
| 4 | DK1193+690~DK1193+873 | 183 | ||
| 5 | The right line | DyK1193+130~DyK1193+165 | 35 | Settlement of the arch: 52 mm. Convergence value of the side wall: 155 mm. |
| 6 | DyK1193+600~DyK1193+675 | 75 | ||
| 7 | DyK1193+706~DyK1193+870 | 164 | ||
| 8 | Parallel pilot tunnel | PK1193+130~PK1193+270 | 140 | Settlement of the arch: 122 mm. Convergence value of the side wall: 199 mm. |
| 9 | PK1193+600~PK1193+750 | 150 | ||
| 10 | PK1193+760~PK1193+900 | 140 | ||
| 11 | PK1194+130~PK1194+180 | 50 |
| Geological Conditions | The Left Line Tunnel | The Parallel Pilot Tunnel | The Right Line Tunnel |
|---|---|---|---|
| Stratigraphic lithology | Gneiss, grayish white, gneiss-like structure, mainly composed of quartz, feldspar, mica and so on. | Gneiss, gray-black, gneiss-like structure, mainly composed of quartz, feldspar, mica and so on. | Gneiss, cyan-gray mixed with grayish white, gneiss-like structure, mainly composed of quartz, feldspar, mica and so on. |
| Rock mass integrity | Weak weathering, relatively developed joints, two groups of main joints developed; the rock mass is relatively intact. | Weak weathering, more developed joint fissure, development of Group 2 main joints; there is a slight kneading and extrusion phenomenon on the palm surface, the rock mass is wedged and blocky, the rock mass is more complete, but there is local fragmentation. | Weak weathering, the joints are more developed, and the palm surface is slightly crumpled. A group of joints runs through the whole palm surface, the rock mass is more complete, and the whole rock mass is blocky. |
| Compressive strength σc (MPa) | 61.4 | 91.4 | 57.8 |
| Groundwater seepage rate [L/(min·10m)] | 2 | 4 | 2 |
| Occurrence of gneiss | N39° E/80° S | N51° E/84° S | N46° E/82° N |
| Joint fissure | J1: N32° E/48° S, micro-tensile joint, rough joint surface, no filling, joint spacing of 0.6–0.7 m, joint extension of 3.0–4.0 m. J2: N47° E/34° N, micro-tensile joint, rough joint surface, no filling, joint spacing 0.7–0.8 m, joint extension 5.0–7.0 m. | J1: N38° E/65° S, micro-tensile joint, rough joint surface, no filling, joint spacing of 0.7–1.1 m, joint extension of 3.0–5.0 m. J2: N50° W/48° N, micro-tensile joint, rough joint surface, no filling, joint spacing 0.6–0.9 m, joint extension 2.0–4.0 m. | J1: N50° E/46° S, micro-tensile joint, rough joint surface, no filling, joint spacing of 0.6–0.8 m, joint extension of 4.0–9.0 m. J2: N47° W/39° N, micro-tensile joint, rough joint surface, no filling, joint spacing of 0.8–1.1 m, joint extension of 5.0–8.0 m. |
| Buried depth (m) | 837 | 938 | 957 |
Disclaimer/Publisher’s Note: The statements, opinions and data contained in all publications are solely those of the individual author(s) and contributor(s) and not of MDPI and/or the editor(s). MDPI and/or the editor(s) disclaim responsibility for any injury to people or property resulting from any ideas, methods, instructions or products referred to in the content. |
© 2025 by the authors. Licensee MDPI, Basel, Switzerland. This article is an open access article distributed under the terms and conditions of the Creative Commons Attribution (CC BY) license (https://creativecommons.org/licenses/by/4.0/).
Share and Cite
Sun, Q.; Zhang, W.; Feng, G.-L.; Niu, W.; Wei, X.; Chen, J. Study on the Asymmetric Failure Characteristics and Failure Mechanisms of Surrounding Rock During Excavation of a Deep Buried Small-Clearance Tunnel. Appl. Sci. 2025, 15, 4763. https://doi.org/10.3390/app15094763
Sun Q, Zhang W, Feng G-L, Niu W, Wei X, Chen J. Study on the Asymmetric Failure Characteristics and Failure Mechanisms of Surrounding Rock During Excavation of a Deep Buried Small-Clearance Tunnel. Applied Sciences. 2025; 15(9):4763. https://doi.org/10.3390/app15094763
Chicago/Turabian StyleSun, Qiancheng, Wencong Zhang, Guang-Liang Feng, Wenjing Niu, Xinyuan Wei, and Jingwen Chen. 2025. "Study on the Asymmetric Failure Characteristics and Failure Mechanisms of Surrounding Rock During Excavation of a Deep Buried Small-Clearance Tunnel" Applied Sciences 15, no. 9: 4763. https://doi.org/10.3390/app15094763
APA StyleSun, Q., Zhang, W., Feng, G.-L., Niu, W., Wei, X., & Chen, J. (2025). Study on the Asymmetric Failure Characteristics and Failure Mechanisms of Surrounding Rock During Excavation of a Deep Buried Small-Clearance Tunnel. Applied Sciences, 15(9), 4763. https://doi.org/10.3390/app15094763