Abstract
Microplastic pollution has gained attention in recent years due to its adverse impact on the environment. As a major threat to marine ecosystems and biota, the accumulation of microplastics along coastlines has become a growing concern. This study focused on quantifying and characterizing the presence, distribution, and composition of microplastics along the beaches of Romania and Bulgaria. Microplastics were extracted from beach sand samples using a saturated NaCl solution. The particles were then analyzed through FT-IR and DSC spectral analyses to identify their chemical composition. Sampling was conducted across several resorts along the Romanian and Bulgarian coastlines. The findings revealed varying concentrations of microplastics across different beaches, with Romanian beaches showing concentrations of between 40 and 213 particles per sample (470–2500 microplastics/kg), which were notably higher in areas like Mamaia and Costinești. On Bulgarian beaches, the average concentrations reached up to 137 particles per sample (1612 microplastics/kg), particularly in areas like Sunny Beach and Nessebar. Polyethylene (PE) was identified as the most prevalent polymer (55%), followed by polyamide (PA), polypropylene (PP), polyethylene terephthalate (PET), and polyurethane (PU). These polymers were linked to common sources such as packaging, textiles, and industrial products. Microscopic examination, combined with FT-IR and DSC spectral analysis, confirmed the plastic nature of the particles, revealing distinct chemical structures characteristic of each material type. This study underscores the widespread contamination of Romanian and Bulgarian beaches with microplastics, emphasizing the environmental risks to coastal ecosystems. The presence of synthetic polymers highlights the urgent need for policies targeting plastic waste management to mitigate the growing pollution in marine environments.
1. Introduction
Microplastics in beach sand have become a growing environmental concern due to their persistence, potential to absorb toxic substances, and adverse impacts on marine ecosystems and coastal biodiversity, underscoring the need for comprehensive studies on their distribution, sources, and degradation processes [1]. Plastic materials are synthetic polymer-based products that have experienced a significant increase in use across various industries in recent decades, becoming an indispensable element of modern society [2]. Microplastics are small plastic particles present in the environment that have become a major problem, especially for the marine environment [3]. Plastic materials are of different types and shapes, comprising natural or modified polymers, thermosetting plastics, thermoplastics, and more recently, ecological plastics [4]. These can be biodegradable and biologically synthesized, with natural origins (plants, animals, microorganisms), from polyhydroxyalkanoates (PHAs), polylactic acid (PLA), starch, cellulose, and lignin [5]. Alternatively, plastics can be biodegradable and based on petroleum, such as polyglycolic acid (PGA), polybutylene succinate (PBS), polycaprolactone (PCL), polyvinyl alcohol (PVA, PVOH), and polybutylene adipate terephthalate (PBAT) [6]. The cheapest and most commercially used plastics are low-density polyethylene (LDPE), high-density polyethylene (HDPE), polypropylene (PP), polyvinyl chloride (PVC), polystyrene (PS), and polyethylene terephthalate (PET) [7].
The occurrence of environmental pollution, including in the Black Sea area, is not only well known but is also deeply studied in all the components of an ecosystem [8]. Surface water pollution due to industrial, touristic, and domestic activities and population growth is a current concern for the whole world, with repercussions on human health [9,10]. According to studies [11] conducted as early as 2014, approximately 4.2 tons of plastic are discharged into the Black Sea from the Danube River each day in Romania. Plastic microparticles have been identified by researchers in both Romanian rivers and the Black Sea [12]. The identified particles have primarily been fibers originating from clothing items and the construction industry and polypropylene from plastic waste, fishing nets, etc. Plastic fibers also enter wastewater through the cleaning of textiles, eventually reaching rivers or seas. Microplastics are additionally formed through the degradation of plastic waste caused by UV radiation or physical forces [13]. Textile or plastic waste thrown into water is ingested by fish and mollusks, such as mussels [14]. Recent research has shown that in Romania, the amount of plastic found in running water increases by at least 10% annually. This plastic then flows towards the Black Sea, where it significantly contributes to marine pollution and impacts the biodiversity of the aquatic ecosystem [11,15]. The Danube River flows through ten countries before emptying into the Black Sea, constituting the primary source of microplastics in this marine basin [16]. The results of one study [17] revealed the widespread presence of microplastics in the coastal waters of Bulgaria, with an average concentration measured at 7.3 ± 4.9 particles per liter, highlighting the extent of plastic pollution in the region. Based on their sizes, microplastics on sand beaches can be divided into macroplastics (≥5 mm), microplastics (<5 mm), and nanoplastics (<1000 nm) [18]. The microplastics in the water eventually end up in marine organisms, which constitute food for the population. These micro-fragments can change their structure during cooking and when consumed can become carcinogenic [19].
This study makes an important contribution by providing a comparative investigation of microplastic pollution on the beaches of Romania and Bulgaria—an underrepresented region in the scientific literature—using complementary analytical methods such as FT-IR, DSC, and microscopic examination. However, the research is limited by its cross-sectional nature, lacking seasonal or temporal perspectives, and it did not explore the direct impact on local marine fauna. In the future, the study could be expanded through periodic monitoring, ecotoxicological analyses, and the identification of major pollution sources, thus supporting policies for coastal environmental protection.
This research was focused on implementing a procedure for the sampling, extraction, and characterization of microplastics from sand sediments from seaside resorts in Romania and Bulgaria. The aim of the study was to determine the distribution of microplastics on Black Sea beaches. Through the statistical analysis of data representing the sand load of beaches located in Romania and Bulgaria, the specific beach and the area most exposed to microfiber pollution were identified.
2. Materials and Methods
2.1. Sand Sampling
The Romanian seaside is along the Black Sea coast from the Danube Delta in the north to the Bulgarian Black Sea coast in the south, spanning 275 km of shoreline. However, only about 70 km of this is suitable for mass seaside tourism, featuring sandy beaches [20]. The Bulgarian coastline is south of the Romanian coastline, starting at the border between Romania and Bulgaria in the Vama Veche–Durankulak area and continuing along the Black Sea coast to the southernmost point of the country, near the border with Turkey in the Rezovo area. Bulgaria has a coastline with a total length of 354 km, including no less than 130 km of sandy beaches [21].
Figure 1 and Figure 2 show maps of Romania and Bulgaria, highlighting the sampling areas along the Black Sea coast, created using Quantum GIS (QGIS 1.6.0) software. Sand samples were collected from the beaches of tourist resorts belonging to both countries.
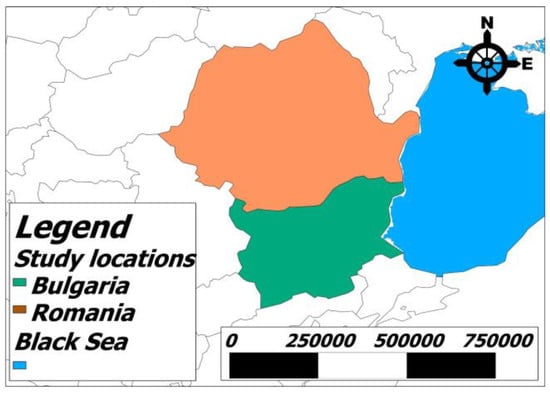
Figure 1.
A map of Romania and Bulgaria with their locations on a map of Europe, showing the Black Sea coastline.
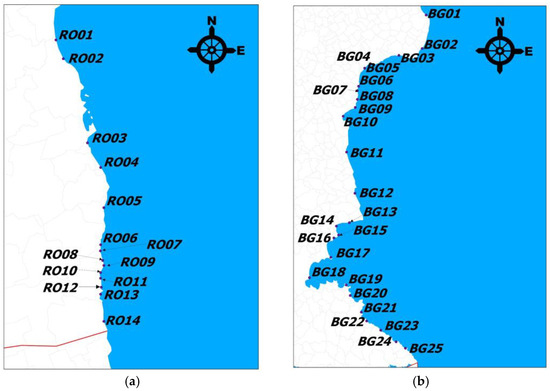
Figure 2.
A map of (a) Romania and (b) Bulgaria’s coastline, highlighting the sampling areas of beaches in tourist resorts.
Beach sand samples were collected from the beaches of the following tourist resorts in Romania, coded as follows: Mamaia North—RO01; Mamaia—RO02; Eforie North—RO03; Eforie South—RO04; Costinesti—RO05; Olimp—RO06; Neptun—RO07; Jupiter—RO08; Cap Aurora—RO09; Venus—RO10; Saturn—RO11; Mangalia—RO12; 2 Mai—RO13; and Vama Veche—RO14. From each resort, 3 samples were collected from the south (S) end, center (C), and north (N) end of the beach.
In Bulgaria, the sand sampling area for the Black Sea beaches included the following resorts: Shabla—BG01; Rusalka—BG02; Kavarna—BG03; Balchik—BG04 (artificial beach); Albena—BG05; Golden Sands—BG06; Riviera—BG07; Sunny Day—BG08; St. Constantine and Elena—BG09; Varna—BG10; Kamchia—BG11; Obzor—BG12; Elenite—BG13; Sunny Beach—BG14; Nessebar—BG15; Ravda—BG16; Pomorie—BG17; Bourgas—BG18; Sozopol—BG19; Duni—BG20; Primorsko—BG21; Kiten—BG22; Tsarevo—BG23; Ahtopol—BG24; and Sinemorets—BG25. At each tourist resort, samples were collected from the center (C), south (S) end, and north (N) end of the beach.
The sand samples were collected from the beaches at a distance of approximately 1–2 m from the high-water line where seawater reached the shore. The sampling depth was 2–5 cm. Sand samples were collected using a 0.25 m2 sampling quadrat of 50 × 50 cm. The sampling was performed for the four corners of the sampling quadrat, as well as the center. The total amount of sand sampled from each area was approximately 2 kg.
The sampling took place in May 2024, during a period of calm sea conditions. The samples were obtained using a stainless steel spatula, put in glass containers sealed with aluminum foil, and transported to the laboratory for analysis.
2.2. Methodology for Sand Analysis
To ensure the removal of vegetal particles, all sand samples were oven-dried and subsequently sieved using a stainless steel 5 Mesh screen. In a Berzelius beaker, sand was added until it reached the 50 mL mark of the container (approximately 85 g of dry sand). This was then transferred into a sterile 500 mL flask with a stopper, to which 100 mL of a saturated NaCl solution was added (prepared by dissolving 220 g of NaCl in 700 mL of distilled water). The mixture was stirred for 3 min and then allowed to settle for 30 min. The supernatant was decanted using a Büchner funnel and filtered using Whatman GF/A filter paper with the aid of a vacuum pump. Once filtration was complete, the filter paper was transferred to a Petri dish. To the remaining sediment, 100 mL of a saturated NaCl solution was added. The mixture was subjected to ultrasonic treatment using an ultrasonic power cleaner (DU-32 Digital; Argo Lab, Carpi, MO, Italy) at room temperature for 3 min. This procedure was repeated one more time, resulting in three successive filtrations for each sample. As a control sample, the saturated NaCl solution was filtered through a new filter paper.
2.3. Microscopic Methods for Fiber Counting and Density-Based Separation of Microplastics
Whatman filter papers were examined under a stereomicroscope to determine the number of microscopic plastic particles. Microscopic fibers were marked in each Petri dish. A separate clean filter paper was used to store the fibers, which were labeled for identification. This technique facilitated the counting of microscopic fibers and the estimation of contamination levels for each sub-site (beach). The total amount of microplastics on all three filter papers (collected from each location) represented the concentration of microparticles in the equivalent of 50 mL of sand (approximately 85 g of dry sand). A stereomicroscope, the Stemi 508 LAB doc/trinocular (Carl Zeiss AG, Jena, Germany), was used to investigate and count microplastics. Subsequently, 20 microplastic particles were also subjected to analysis under the Axio LAB.A1 light microscope (Carl Zeiss Microscopy GmbH, Jena, Germany). For measuring the dimensions (where possible), the microplastics were transferred using a needle with a diameter of 0.23 mm from the filter paper onto a slide and examined under a microscope. Further, polymers were separated based on the differences in their density using distillated water and different densities of NaCl, ZnCl2, and isopropanol solutions. First, samples were mixed with distillated water, in which PE and PP floated and the rest of the polymers sank. PE and PP were separated using an isopropanol solution of a 0.91 g/cm3 density, in which PP floated and PE sank. The rest of the polymers were separated using NaCl solutions with a 1.1 g/cm3 density, in which PS floated, and a 1.19 g/cm3 density, in which PA6 floated. PET was separated from PVC using a ZnCl2 solution with a 1.3 g/cm3 density, in which PET floated and PVC sank. After each separation step, the samples were allowed to settle for approximately 45 min to ensure a clear separation between the floating and sedimented fractions. To minimize contamination, all equipment was thoroughly cleaned with distilled water before use, and samples were handled using nitrile gloves and processed in a laminar flow hood when possible.
2.4. Polymer Characterization Using FT-IR Spectroscopy
Polymer identification was performed using Fourier Transform Infrared Spectroscopy (FT-IR). A Bruker Vertex 70 spectrometer (Bruker Optik GmbH, Rosenheim, Germany) equipped with a Platinum ATR accessory and a Bruker Diamond Tip A225/Q.1 was utilized under room temperature conditions. The spectral range spanned 4000–400 cm−1 with a nominal resolution of 4 cm−1, and measurements were carried out over 128 scans. Each sample was analyzed in duplicate, and the resulting IR absorption spectra were compared to the reference spectra of known materials stored in an electronic library (where this was possible).
2.5. Polymer Characterization Using Differential Scanning Calorimetry (DSC)
The thermal behavior of microplastics was investigated using differential scanning calorimetry (DSC). DSC analyses were conducted with a DSC 204 F1 Phoenix calorimeter (Netzsch-Gerätebau GmbH, Selb, Germany) under a nitrogen atmosphere. The temperature range was set at between 20 °C and 200 °C, with a heating rate of 10 °C/min. Samples were weighed in sealed crucibles with perforated lids to prevent a pressure build-up during potential sample evaporation.
2.6. Molecular Descriptors of Synthetic Polymers
Models of the 2D structures of propolis flavonoids were developed based on their core structures and imported into HyperChem version 8.0 molecular modeling software. The most stable geometric configurations, defined by the lowest energy states, were obtained using semi-empirical PM3 and RHF molecular orbital calculations in a vacuum. These calculations were executed using the Polak–Ribière minimization algorithm with a root mean square (RMS) energy gradient of 0.01 kcal/Å·mol [22]. The structural properties of quercetin and rutin derived from molecular modeling included the van der Waals surface, total and grid areas (A), molar volume (V), partition coefficient (LogP), refractivity (R), polarizability (α), dipole moment (μt), standard enthalpy of formation (Hformation), hydration energy (Ehydr), molecular mass, and the number of phenolic hydroxyl groups.
2.7. Statistical Analysis
Statistical analysis was performed using Origin Pro 2025 software (Stat-Ease Inc., Minneapolis, MN, USA), employing a one-way analysis of variance (ANOVA) followed by Tukey’s test for post hoc multiple comparisons. A significance level of p < 0.05 was set to determine statistical significance.
3. Results
3.1. Microplastics on the Beaches of Romania and Bulgaria
Microplastic particles with sizes ranging from 0.4 μm to 5 mm were identified, originating either from primary plastic objects or from degraded secondary plastic items.
The results of the filtration and the average distribution of microplastic contamination on beaches in Romania and Bulgaria per sample and per kilogram of sand are presented in the Supplementary Materials in Tables S1 and S2.
The minimum, maximum, and average values obtained for the microplastics on the beaches of Romania are presented in Figure 3.
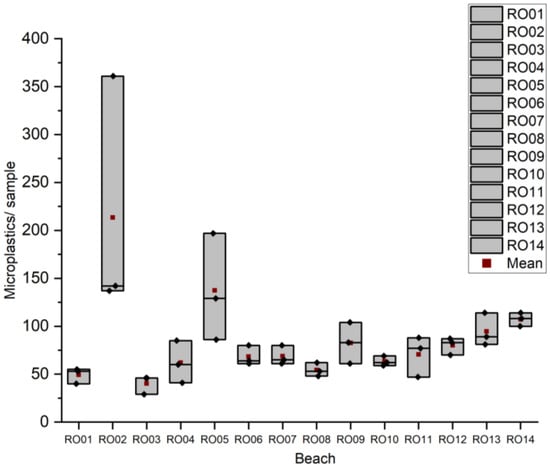
Figure 3.
Results obtained for microplastic particles/sample in sand from Romanian beaches.
The results for the microplastic counts in sand samples from Romanian beaches showed significant variability across locations, with higher concentrations generally observed at site RO02 (Mamaia) and lower values recorded at beaches like RO03 (Eforie Nord), indicating spatial differences in the microplastic pollution levels.
For Bulgaria, the minimum, maximum, and average values obtained for the amount of microplastics in the sand from the beaches of the resorts are presented in Figure 4.
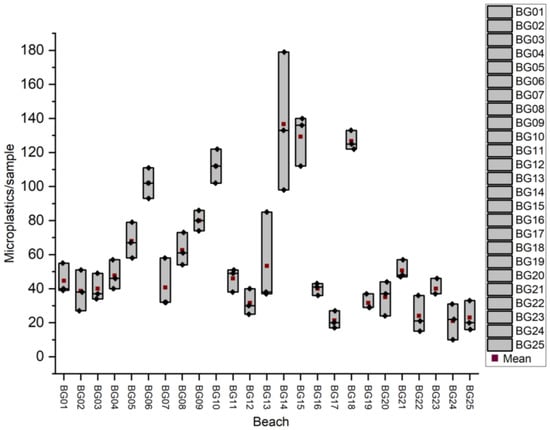
Figure 4.
Results obtained for microplastic particles/sample in sand from Bulgarian beaches.
The results for the microplastic counts in sand samples from Bulgarian beaches showed considerable variability across locations, with higher concentrations generally observed at site BG14 (Sunny Beach), while lower values were recorded at Ahtopol Beach (BG24), indicating spatial differences in the microplastic pollution levels.
In Romania, the highest average number of microplastic particles was recorded at beach RO02 (Mamaia), with an average of 213 particles/sample (2500 microplastic particles/kg), while the lowest was at RO03 (Eforie Nord), with 40 particles/sample (470 microplastic particles/kg). In Bulgaria, the highest value was observed at BG14 (Sunny Beach), with 137 particles/sample (1612 microplastic particles/kg), and the lowest at BG24 (Ahtopol), with 21 microplastic particles/sample (247 microplastic particles/kg). These data provide a clear image of the current level of microplastic contamination along the Romanian–Bulgarian coastline.
3.2. Microscopic Identification of Microplastics
Figure 5 and Figure 6 illustrate the microscopic analysis of microplastics using a stereomicroscope and a standard microscope, respectively.
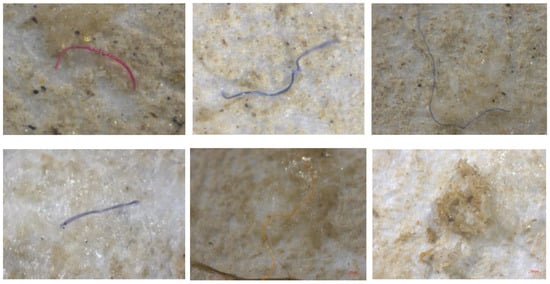
Figure 5.
Microscopic (stereomicroscope) analysis of microplastics.
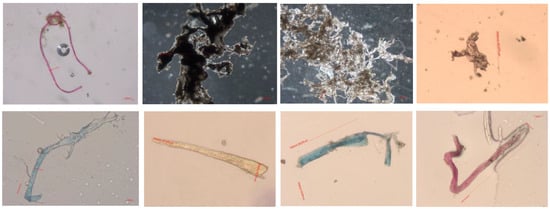
Figure 6.
Microscopic analysis of microplastics.
Microplastics were identified in Figure 5 and Figure 6 through detailed microscopic analysis, with Figure 5 showing observations made using a stereomicroscope, allowing for a broader view of the particles, while Figure 6 presents a closer inspection under a standard microscope, providing higher magnification for the more precise identification of the microplastic particles.
3.3. FT-IR Spectroscopic Identification of Microplastics
Polymer quantification was conducted by applying FT-IR spectroscopy to 20 randomly selected particles identified as plastic through microscopic observation and density separation. The FT-IR spectra were matched against reference databases to identify the polymer types. The resulting percentages—twelve were polyethylene (55%), three were identified as polyamide (15%), three were identified as polypropylene (15%), and two were identified as polyethylene terephthalate (10%), while one was identified as polyurethane (5%)—reflect the relative frequency of each polymer within the analyzed subset. To support and confirm these identifications, DSC was employed to determine their melting points, and density-based flotation methods were used to pre-classify particles according to their buoyancy properties prior to FT-IR analysis.
In Figure 7, Figure 8, Figure 9, Figure 10 and Figure 11, the obtained FT-IR spectra for the identified microplastics are presented.
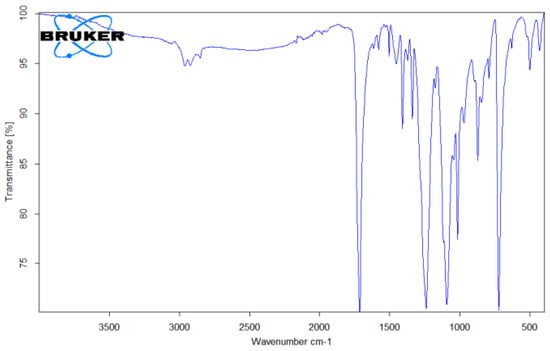
Figure 7.
FTIR spectrum of PET microplastic.
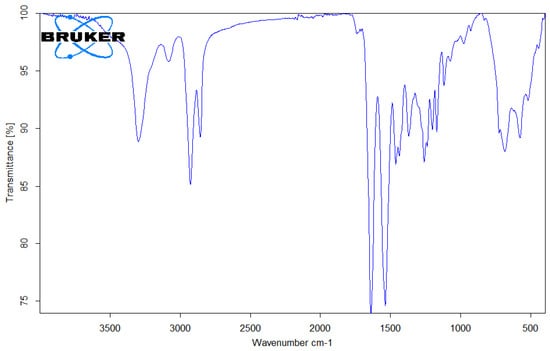
Figure 8.
FTIR spectrum of PA6 (Nylon 6) microplastic.
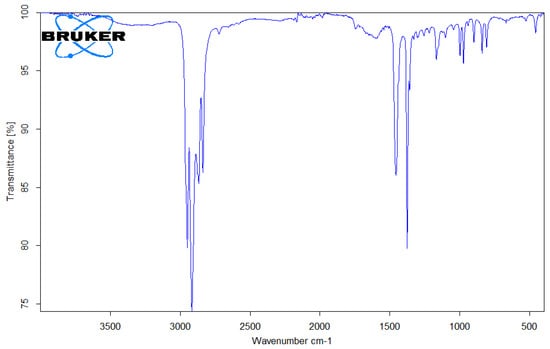
Figure 9.
FTIR spectrum of PP microplastic.
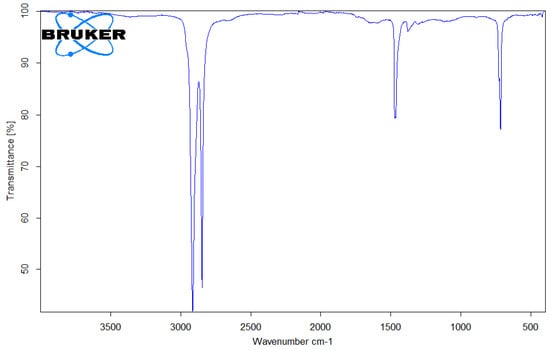
Figure 10.
FTIR spectrum of PE microplastic.
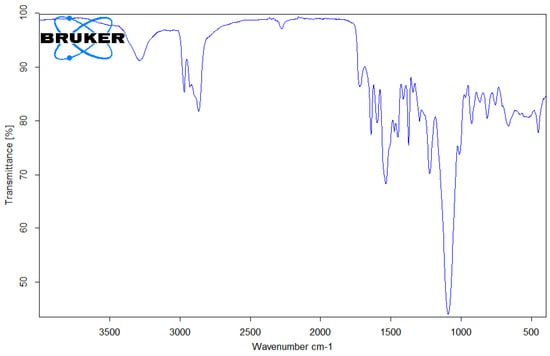
Figure 11.
FTIR spectrum of PU microplastic.
In the case of PET (Figure 7), the results showed bands in the regions of 1713 cm−1 (C=O stretching), 1241 cm−1 (C-O stretching), and 1094 cm−1 (C-O stretching). The band at 720 cm−1 occurred due to the presence of aromatic CH out-of-plane bending [23].
In Figure 8, the band that appears between 3298 cm−1 and 3300 cm−1 represents N-H stretching vibration. The bands in the range between 2932 cm−1 and 2858 cm−1 confirm the occurrence of CH stretching, while the stretching of C=O occurred at 1634 cm−1. The bands situated in the regions of 1237 cm−1, 1160 cm−1, and 1097 cm−1 represent the stretching vibration of the C=O ester group. The bands at 1538 cm−1 and 1274 cm−1 occur because of the presence of NH bending and CN stretching vibration. The bands that appear at 1464 cm−1, 1372 cm−1, and 1199 cm−1 represent CH2 bending. The absorption bands for NH and C=O bending appear at 664–687 cm−1 [24].
PP (Figure 9) was indicated by the prominent presence of C-H stretching at 2950 cm−1, 2915 cm−1, and 2838 cm−1. The spectral assignment considering the bands at 1455 cm−1 and 1377 cm−1 indicated types of asymmetrical vibration (ⱱa-CH2) and asymmetrical deformation vibrations (δa-CH3). PP was identified based on the presence of absorption bands at 1167 cm−1 (CH bending, CH3 rocking), 997 cm−1 (C-C stretching), 973 cm−1 (CH3 rocking, CH3 bending), 841 cm−1 (CH bending), and 808 cm−1 (CH3 rocking, C-C stretching, CH2 rocking, C-CH3 stretching, CH2 rocking, C-C stretching, C-CH stretching) [25].
PE (Figure 10) was characterized by vibration bands at 2911–2915 cm−1 and 2845–2848 cm−1 (C-H stretching). The spectral assignment for PE considered bands at 1467 cm−1 (δ-CH2) and 717 cm−1 (γr-CH2) [25].
In Figure 11, the absorption bands between 3223 and 3330 cm⁻¹ correspond to the stretching vibration of the –NH group [26], while the asymmetric stretching vibration of –CH2– groups generated absorption bands at 1294 cm−1, 1364 cm−1, 1415–1418 cm−1, 1464 cm−1, 2859–2862 cm−1, and 2938 cm−1 [27]. The sharp peaks observed at 1726–1734 cm−1 and 1701 cm−1 can be attributed to the stretching vibration of the carbonyl group (C=O) in the amide. Additionally, the absorption band at 1541–1597 cm−1 corresponds to the bending vibration (scissoring) of the N-H group [28]. The absorption bands observed at approximately 1067 cm−1 and 1217 cm−1 were attributed to the stretching vibrations of the C–O bond [26].
3.4. DSC Analysis
In cases where the required amount of 1–3 mg of a sample was available, a DSC analysis was also performed. The thermal behavior (DSC thermograms) of the microplastics is presented in Figure 12, Figure 13 and Figure 14.
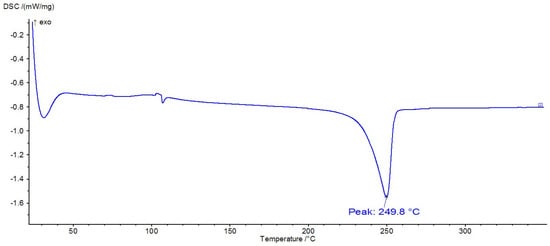
Figure 12.
DSC thermogram of PET.
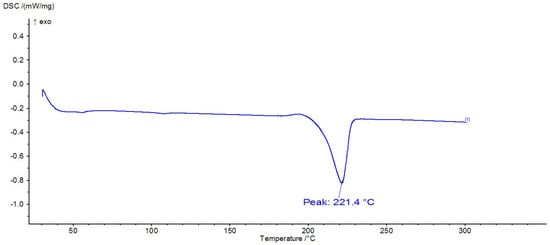
Figure 13.
DSC thermogram of PA6.
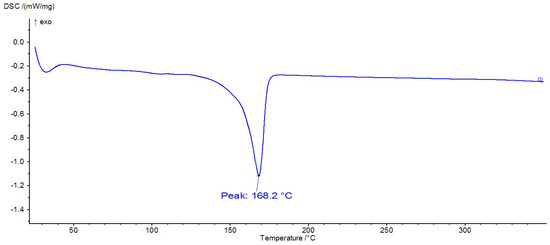
Figure 14.
DSC thermogram of PP.
DSC analysis is often used to identify polymers because they exhibit thermal transitions at specific temperatures. Thus, Figure 12, Figure 13 and Figure 14 show the DSC thermograms for PET, PA6, and PP, in which the melting processes of the crystalline zones can be observed. In Figure 10, a glass transition can be observed at approximately 106 °C, along with a melting process with a peak at 250 °C, thermal behavior specific to PET polymers. In Figure 11, there is a melting process with a peak at 221 °C, specific to PA6, and in Figure 12, there is a melting process with a peak at 168 °C, specific to PP.
4. Discussion
Microplastics have become a significant environmental concern, with numerous studies highlighting their widespread presence in aquatic ecosystems, particularly in marine and freshwater environments. According to Andrady [29], microplastics, defined as plastic particles smaller than 5 mm, originate from both primary sources (e.g., microbeads in personal care products) and secondary sources (e.g., the breakdown of larger plastic debris). The persistence of microplastics in the environment is largely due to the durability of plastic materials, which are resistant to natural degradation processes [30]. Recent studies have shown that microplastics are ubiquitously distributed in coastal regions, rivers, and even remote areas, demonstrating their ability to travel long distances via water currents [31]. For instance, in a study conducted by Asensio-Montesinos et al. [32], microplastics were found in significant quantities on beaches along the Mediterranean coast, similarly to findings from the Black Sea region [33]. In comparison, research by Kittner et al. [34] reported that microplastic concentrations in river systems, such as the Danube, were notably high, suggesting that rivers serve as a major transport route for microplastics from inland regions to marine environments. The accumulation of microplastics on beaches is not only due to natural transportation but is also influenced by human activities such as tourism, which contribute to the deposition of plastic waste [35]. Overall, despite variations in concentrations and compositions, the presence of microplastics across different geographical regions emphasizes the global nature of this pollution and the urgent need for effective management strategies.
The abundance of microplastics in beach samples worldwide varies considerably, reflecting both regional differences and the methods of collection and analysis. In the coastal marine environment of Singapore, the maximum concentration of microplastics in beach sediments was 470.8 microplastic particles/kg dry weight of sand [36]. In contrast, beaches in Slovenia showed average values of 155.6 microplastic particles/kg [37].
In sand from Baja California, Mexico, the average abundance of particles larger than 1 mm was 135 ± 92 microplastic particles/kg, indicating significant pollution with large variations from one area to another [38]. In China, in the Bohai Sea area, values of between 102.9 and 163.3 microplastic particles/kg have been recorded for the abundance of 1 µm particles [39], while in Wanning, on the Chinese coast, the concentrations are alarmingly high, with an abundance ranging from 5000 to 8714 microplastic particles/kg for particles smaller than 5 mm [40].
In Germany, on the beaches of Rügen Island, located in the Baltic Sea, the concentrations ranged between 77.9 and 107.3 microplastic particles/kg for the 63 µm–5 mm fraction of microplastics [41]. A similar situation was observed in the northwestern Mediterranean Sea, where two distinct locations recorded abundance values ranging from 56 to 150 and 60 to 182 microplastic particles/kg for the same size range [42]. In the Mediterranean region (France, Italy, Spain), typical values range from 100 to 500 microplastic particles/kg in the surface layer of the sand. On the western European coast (Mediterranean Sea, Atlantic Ocean), beaches commonly show values of between 50 and 300 microplastic particles/kg, with peaks of up to 1000 particles/kg in heavily industrialized or estuarine areas, such as the Thames Estuary (United Kingdom) [43].
In a regional and international context, studies conducted in other areas of the Black Sea coast, such as Turkey and Georgia, have reported microplastic concentrations in sand ranging from 20 to over 300 particles/kg, with higher values associated with urban or industrial zones. For example, in the vicinity of cities like Istanbul and Samsun, concentrations of up to 350–500 microplastic particles/kg have been recorded, especially after the tourist season. In sand from the Anatolian area of Istanbul, a maximum abundance of 135 microplastic particles/kg was recorded during the summer season for particles ranging between 1 and 5 mm, indicating lower pollution compared to other urban regions [44].
Microplastics were identified in beach sand samples from Romania and Bulgaria. The presence of microplastics in beach sand can be attributed to the geographical characteristics of a region. Consequently, plastic waste and microplastics may be transported by rivers, such as the Danube, from inland areas and accumulate on nearby beaches in Romania. These findings are similar to those of Syakti et al. [45] and Tagg et al. [46].
In Table 1, the chemical structures and sources of the most common plastic polymer types found in the sand samples are presented.

Table 1.
Chemical structures and sources of the most common plastic polymer types found in sand.
Microplastics have emerged as a significant environmental and health concern due to their widespread presence in ecosystems and potential toxic effects on living organisms [48]. Concerning their general toxicity, exposure to microplastics has been linked to various adverse health effects, including neurological disorders such as cognitive dysfunction and neuroinflammation, respiratory complications, and allergic reactions [49]. These particles may cause impaired reproduction [50], malnutrition [50], and physical irritation to the gastrointestinal tract [51], leading to changes in the intestinal microbiome [51]. Furthermore, microplastics can deposit in the lungs, where they may interfere with respiratory function and affect cell viability [51]. As vectors for various contaminants, especially heavy metals, microplastics contribute to the exacerbation of reproduction issues, impaired growth, and weakened immune systems [51]. Their chronic presence has been linked to vascular disease, chronic inflammation, and immune system-related disorders [49], further highlighting their damaging impact on human and animal health. Moreover, evidence suggests that microplastics can inflict harmful effects on the brain and nervous system [49], underscoring their broad and dangerous influence over various biological systems.
Table 2 presents data regarding the ecological and environmental impacts of synthetic polymers on beaches, shallow coastal waters, and sand.
Table 2.
Ecological and environmental impacts of synthetic polymers on beaches, shallow coastal waters, and sand.
The biodegradability of microplastics is influenced by various factors, with degradation rates in marine environments varying significantly depending on the type of polymer. For instance, common plastic polymers such as LDPE, HDPE, PP, and PET have been estimated to degrade at rates ranging from 0 to 37 µm per year [55]. Notably, Maddison et al. [54] have reported substantially higher surface degradation rates for polycaprolactone (PCL) and polyvinyl chloride (PVC), reaching up to 469.73 µm per year, highlighting the variability in plastic breakdown processes under different environmental conditions.
The synthetic polymers were analyzed to determine their structural characteristics using computational chemistry. Molecular structure modeling was performed in a vacuum using semi-empirical methods (AM1, RHF). The structures were optimized using the Polak–Ribière algorithm, achieving an RMS maximum energy gradient of 0.01 kcal/Å·mol. The system’s energy and other molecular properties were calculated using the Schrödinger equation.
Table 3 presents data on the calculated properties of the synthetic polymer structures.
Table 3.
Calculated molecular descriptors for polymer structures.
The structural characteristics of polymers significantly influence their biodegradability, toxicity, and recyclability. Microplastics are a challenge for protecting the environment due to their resistance to biodegradation, their complex toxicity, and difficulties in recycling them [56,57]. The biodegradability of polymers is influenced by the presence of functional groups such as esters or amides, the degree of crystallinity of the material, and the structure of the polymer chains, with simpler and more hydrophilic chains being more easily degraded by microorganisms [52]. In the case of microplastics, the biodegradability is lower due to the chemical composition of resistant polymers and the limited presence of microorganisms in environments such as water or sand [58]. Microplastics are toxic not only due to the chemicals they release but also because of the pollutants they absorb, having a negative impact on the organisms that ingest them and on the food chain [59].
The recyclability is determined by the nature of the polymer, with thermoplastics being easier to process and reuse, while thermosetting polymers or complex blends have reduced recycling efficiency and require the use of more advanced technologies. Recycling microplastics, however, is more challenging due to their small size, contamination with pollutants, and chemical structure degradation, which complicate both their collection and reuse in industrial processes [60].
The statistical analysis of data regarding the microplastic pollution of beaches located in Romania and Bulgaria aimed to determine whether the zoning of these beaches generated statistically significant variability. Furthermore, the analysis sought to identify the geographical regions in which beaches were more exposed to microfiber pollution, as well as to determine which specific beach was the most affected by this type of contamination.
The one-way ANOVA included the number of microplastics as a variable and the distributions for the zones of each beach as observables. Statistical analysis using a one-way ANOVA revealed significant differences between the groups, indicating that at least one group’s mean differed significantly from the others, which necessitated further post hoc analysis to pinpoint specific group differences [61]. The characteristics of the mathematical model used in the ANOVA are presented in Table 4, and it showed relatively good values for the regression coefficients.
Table 4.
Summary of the ANOVA for the concentration of microplastics in the sand on the beaches.
The Fisher statistic for the ANOVA test indicated that the proposed zoning of the beaches generated very high variability in the contamination of the sand of the beaches with microplastics. The F value of 17.51 suggests that the variability between groups was much greater than the variability within groups. The extremely low p-value (p < 0.0001) confirms that these differences were statistically significant. The null hypothesis stated that all group means would be equal, while the alternative hypothesis asserted that at least one group mean would be different. Since the p-value was considerably lower than the 0.05 threshold, the null hypothesis was rejected, meaning that at least one group was significantly different from the others.
The R-squared value of 0.89 indicates that approximately 89.67% of the variability in microplastic levels was explained by the differences between groups. This high R2 value suggests that the location played a strong role in determining the microparticle concentration.
The algorithm used for classifying/grouping beach areas based on the contamination of the sand with microfibers was the Tukey test, the results of which are presented in Table 5.
Table 5.
Statistical classification of beaches according to mean scores and group affiliation.
The interpretation of the table classifying beach zones in Romania and Bulgaria based on their sand microplastic contamination using the post hoc Tukey test revealed significant differences in the microplastic pollution levels.
The Mamaia S beach (RO02S) stood out with an extremely high microplastic load (120.33), placing it clearly in a distinct category. In comparison, beaches such as Costinești S (RO05S) (65.67) and Sunny Beach C (BG14C) (59.67) showed more moderate values, although there were still significantly higher than those of most other locations.
Beaches with moderate contamination included locations such as Mamaia N (RO02N), Nessebar N (BG15N), Mamaia C (RO02C), and Bourgas C (BG18), where values ranged between 40 and 50 microplastic particles. These areas demonstrated a high level of pollution, though it was lower than that of some other beaches.
On the other hand, beaches with low microplastic contamination included destinations such as 2 Mai (RO13), Saturn (RO11), Mangalia (RO12), and Albena (BG05), with values of below 30 particles. Regarding the cleanest sandy beaches, areas such as Ahtopol (BG24), Kiten (BG22), Sinemorets (BG25), and Pomorie (BG17) stood out, with very low microplastic levels.
The overall analysis highlighted a clear trend: beaches on the northern Romanian coastline, such as Mamaia and Costinești, were the most affected, while the southern coastline, both in Romania and Bulgaria, showed lower microplastic values. This distribution may have been influenced by factors such as the tourism intensity, expansion works, marine currents, and local pollution sources.
The results of Levene’s test for the one-way ANOVA are presented in Table 6.
Table 6.
Levene’s test table (absolute deviations).
Levene’s test examines whether the variance among groups is equal. Since the p-value was very low (<0.05), we rejected the assumption of equal variances. This suggests that the variability between groups was not homogeneous, which could impact the reliability of the ANOVA.
Levene’s test indicated a p-value of <0.0001, which means that the variances were significantly different between the groups. This result justified the use of the Tukey test for pairwise group comparisons.
The PCA (Principal Component Analysis) method was used to highlight the potential grouping of the microfiber load values of beaches based on zones (north, center, south), which represented the three variables considered. The determination of the principal components was carried out using a correlation matrix. The obtained eigenvalues were 2.69, 0.89, 0.27, and 0.15 for PC1 through PC4, respectively. The first two principal components explained 89.31% of the total data variance, with PC1 accounting for 66.98% and PC2 for 22.33%.
Figure 15 presents the PCA Biplot for all the analyzed beaches in Romania and Bulgaria. We can begin to interpret this Biplot by noting that the x-axis represents the first principal component, which consisted of a linear combination of the three variables and captured the highest proportion of the variability of the input data.
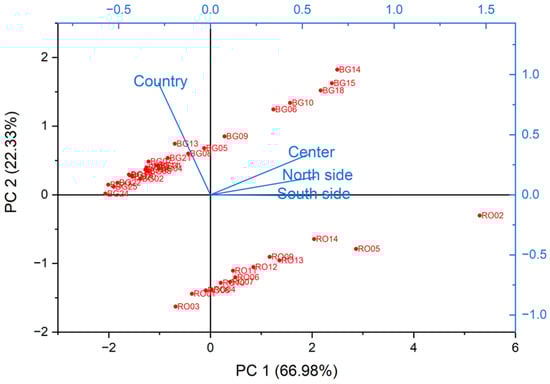
Figure 15.
Biplot graph of the results generated by the PCA analysis regarding the microplastic pollution of the beaches analyzed in Romania and Bulgaria.
Figure 15 presents the observations and principal components obtained from the analyzed data. In the 2D PCA Biplot (scores and loadings of PC1 vs. PC2), the formation of two distinct groups in the sample can be observed. Among the three zone variables, the southern zone showed the greatest variability, being positioned closest to the x-axis, followed by the northern zone and then the central zone. All variables had positive directions of variation, aligning with the positive direction of the x-axis, i.e., of PC1. As a result, all beaches located on the positive side of the x-axis exhibited higher levels of microplastic contamination than those on the negative side. The Biplot shows microfiber load levels relatively close to the mean value, around which the PCA centered the input data, thus statistically validating the appropriateness of the determined microplastic contamination levels for the beaches. A separation between Romanian (RO) and Bulgarian (BG) sites is visible, with Bulgarian sites like BG14–BG18 showing moderate to high contamination but clustering differently to their Romanian counterparts, possibly reflecting different environmental management or beach usage patterns.
5. Conclusions
On the beaches of Romania, the average concentration of microplastics ranged between 40 and 213 particles per sample (470 and 2500 microplastic particles/kg). On the beaches of Bulgaria, the concentrations were higher in certain areas, such as BG14 and BG15, reaching values of up to 137 particles per sample (1612 microplastic particles/kg). In both countries, microplastic concentrations tended to be higher in more touristy and heavily frequented areas, indicating a link between human activities and the accumulation of microplastics.
FT-IR and DSC analysis revealed the predominant presence of polyethylene (PE) (55%), followed by polyamide (PA), polypropylene (PP), polyethylene terephthalate (PET), and polyurethane (PU). This reflects the widespread use of these plastic materials in packaging, textiles, and industrial products. Correlating microscopic images with FT-IR and DSC spectra confirmed the plastic nature of the analyzed particles, highlighting the structures and chemical groups specific to each type of material.
The significant presence found of microplastics in beach sand highlights the risks to marine and coastal ecosystems, having potential negative effects on fauna and flora. Beyond these findings, this study emphasizes the urgent need for coordinated environmental policies aimed at reducing the plastic waste input into coastal areas. Authorities should consider implementing stricter waste management protocols in touristic regions, increasing public awareness campaigns, and promoting alternatives to single-use plastics. Regular monitoring and cleanup efforts, especially in high-risk zones, could significantly mitigate the environmental impacts. Additionally, future research should explore the long-term ecological consequences of microplastic exposure for marine organisms in the Black Sea region, as well as potential human health implications related to seafood consumption.
Supplementary Materials
The following supporting information can be downloaded at https://www.mdpi.com/article/10.3390/app15094751/s1: Table S1: Filtering results and average distribution of microplastic contamination on beaches in Romania per sample and per kilogram of sand; Table S2: Filtering results and average distribution of microplastic contamination on beaches in Bulgaria per sample and per kilogram of sand.
Author Contributions
Conceptualization, M.G. and D.T.; methodology, M.P.; software, G.-A.D.; validation, S.V., M.-T.C. and G.I.R.; formal analysis, M.-T.C.; investigation, G.I.R.; resources, S.V.; data curation, A.-M.P.; writing—original draft preparation, M.G.; writing—review and editing, G.-A.D.; visualization, A.-M.P.; supervision, D.T.; project administration, M.G.; funding acquisition, M.P. All authors have read and agreed to the published version of the manuscript.
Funding
This research received no external funding.
Institutional Review Board Statement
Not applicable.
Informed Consent Statement
Not applicable.
Data Availability Statement
The original contributions presented in this study are included in the article. Further inquiries can be directed to the corresponding author.
Acknowledgments
We appreciate the excellent collaboration among all the universities involved in this research, which has been key to the success of our project. We sincerely value the effort and dedication demonstrated by all parties. We are grateful for the materials provided for the experiments and to the students for their assistance with the sampling and preliminary analysis.
Conflicts of Interest
The authors declare no conflicts of interest.
References
- Ghosh, S.; Sinha, J.K.; Ghosh, S.; Vashisth, K.; Han, S.; Bhaskar, R. Microplastics as an Emerging Threat to the Global Environment and Human Health. Sustainability 2023, 15, 10821. [Google Scholar] [CrossRef]
- Andrady, A.L.; Neal, M.A. Applications and societal benefits of plastics. Philos. Trans. R. Soc. Lond. B Biol. Sci. 2009, 364, 1977–1984. [Google Scholar] [CrossRef] [PubMed]
- Thompson, R.C. Microplastics in the Marine Environment: Sources, Consequences and Solutions. In Marine Anthropogenic Litter; Bergmann, M., Gutow, L., Klages, M., Eds.; Springer: Cham, Switzerland, 2015; pp. 185–200. [Google Scholar]
- Oladele, I.O.; Okoro, C.J.; Taiwo, A.S.; Onuh, L.N.; Agbeboh, N.I.; Balogun, O.P.; Olubambi, P.A.; Lephuthing, S.S. Modern Trends in Recycling Waste Thermoplastics and Their Prospective Applications: A Review. J. Compos. Sci. 2023, 7, 198. [Google Scholar] [CrossRef]
- Kumar, V.; Sehgal, R.; Gupta, R. Blends and composites of polyhydroxyalkanoates (PHAs) and their applications. Eur. Polym. J. 2021, 161, 110824. [Google Scholar] [CrossRef]
- Kunam, P.K.; Ramakanth, D.; Akhila, K.; Gaikwad, K.K. Bio-based materials for barrier coatings on paper packaging. Biomass Convers. Biorefin. 2024, 14, 12637–12652. [Google Scholar] [CrossRef]
- Muhib, M.I.; Uddin, M.K.; Rahman, M.M.; Malafaia, G. Occurrence of microplastics in tap and bottled water, and food packaging: A narrative review on current knowledge. Sci. Total Environ. 2023, 865, 161274. [Google Scholar] [CrossRef]
- Popa, M.; Corches, M.; Popa, D.; Glevitzky, M. Educating Future Engineers for the Prevention of Heavy Metals Contamination of Surface Waters in Mining Areas. The Case of Zlatna, Alba County. Procedia Soc. Behav. Sci. 2013, 83, 408–412. [Google Scholar] [CrossRef]
- Popa, M.; Dumitrel, G.A.; Glevitzky, M.; Popa, D. Anthropogenic Contamination of Water from Galda River-Alba County, Romania. Agric. Agric. Sci. Procedia 2015, 6, 446–452. [Google Scholar] [CrossRef][Green Version]
- Glevitzky, I.; Dumitrel, G.-A.; Glevitzky, M.; Bungau, S.; Popa, M. Aspects Concerning the Management of Groundwater in the Farau Area–Alba County, Romania. J. Environ. Prot. Ecol. 2020, 21, 443–453. [Google Scholar]
- Lechner, A.; Keckeis, H.; Lumesberger-Loisl, F.; Zens, B.; Krusch, R.; Tritthart, M.; Glas, M.; Schludermann, E. The Danube so colourful: A potpourri of plastic litter outnumbers fish larvae in Europe’s second largest river. Environ. Pollut. 2014, 188, 177–181. [Google Scholar] [CrossRef]
- Pojar, I.; Stănică, A.; Stock, F.; Kochleus, C.; Schultz, M.; Bradley, C. Sedimentary microplastic concentrations from the Romanian Danube River to the Black Sea. Sci. Rep. 2021, 11, 2000. [Google Scholar] [CrossRef] [PubMed]
- Cincinelli, A.; Scopetani, C.; Chelazzi, D.; Martellini, T.; Pogojeva, M.; Slobodnik, J. Microplastics in the Black Sea sediments. Sci. Total Environ. 2021, 760, 143898. [Google Scholar] [CrossRef] [PubMed]
- Kruse, K.; Knickmeier, K.; Brennecke, D.; Unger, B.; Siebert, U. Plastic Debris and Its Impacts on Marine Mammals. In Marine Mammals; Brennecke, D., Knickmeier, K., Pawliczka, I., Siebert, U., Wahlberg, M., Eds.; Springer: Cham, Switzerland, 2023; pp. 49–62. [Google Scholar]
- Babos, T.; Lazar, C.; Dobre, O.; Pop, C.; Pojar, I. Microplastic characterization in Romanian coastal waters, Western Black Sea. Geo-Eco-Marina 2023, 29, 51–58. [Google Scholar]
- Miladinova, S.; Moy, D.M.; Stips, A.; Garcia-Gorriz, E. Microplastics accumulation on the Black Sea coast: Scenario analysis. In Marine Litter in the Black Sea; Aytan, Ü., Pogojeva, M., Simeonova, A., Eds.; Turkish Marine Research Foundation (TUDAV): Istanbul, Turkey, 2020; Volume 56, pp. 218–235. [Google Scholar]
- Georgieva, S.K.; Peteva, Z.V.; Stancheva, M.D. Evaluation of abundance of microplastics in the Bulgarian coastal waters. BioRisk 2023, 20, 59–69. [Google Scholar] [CrossRef]
- Hunter, J.R.; Qiao, Q.; Zhang, Y.; Shao, Q.; Crofcheck, C.; Shi, J. Green solvent mediated extraction of micro- and nano-plastic particles from water. Sci. Rep. 2023, 13, 10585. [Google Scholar] [CrossRef]
- Campanale, C.; Massarelli, C.; Savino, I.; Locaputo, V.; Uricchio, V.F. A Detailed Review Study on Potential Effects of Microplastics and Additives of Concern on Human Health. Int. J. Environ. Res. Public. Health 2020, 17, 1212. [Google Scholar] [CrossRef]
- Romania-Travel and Tourism Information. Romania Black Sea Coast. Available online: http://www.romaniatourism.com (accessed on 20 March 2025).
- Mooser, A.; Anfuso, G.; Stanchev, H.; Stancheva, M.; Williams, A.T.; Aucelli, P.P.C. Most Attractive Scenic Sites of the Bulgarian Black Sea Coast: Characterization and Sensitivity to Natural and Human Factors. Land 2022, 11, 70. [Google Scholar] [CrossRef]
- HyperChem™. Molecular Modeling System; Demo Version, Release 8.0; Hypercub Inc.: Gainesville, FL, USA; Available online: https://hiper.com (accessed on 5 February 2025).
- Djebara, M.; Stoquert, J.P.; Abdesselam, M.; Muller, D.; Chami, A.C. FTIR analysis of polyethylene terephthalate irradiated by MeV He+. Nucl. Instrum. Methods Phys. Res. B 2012, 274, 70–77. [Google Scholar] [CrossRef]
- Navarro-Pardo, F.; Martínez-Barrera, G.; Martínez-Hernández, A.L.; Castaño, V.M.; Rivera-Armenta, J.L.; Medellín-Rodríguez, F.; Velasco-Santos, C. Effects on the Thermo-Mechanical and Crystallinity Properties of Nylon 6,6 Electrospun Fibres Reinforced with One Dimensional (1D) and Two Dimensional (2D) Carbon. Materials 2013, 6, 3494–3513. [Google Scholar] [CrossRef]
- Nandiyanto, A.B.D.; Ragadhita, R.; Fiandini, M. Interpretation of Fourier Transform Infrared Spectra (FTIR): A Practical Approach in the Polymer/Plastic Thermal Decomposition. Indones. J. Sci. Technol. 2023, 8, 113–126. [Google Scholar] [CrossRef]
- Asefnejad, A.; Khorasani, M.T.M.; Behnamghader, A.; Farsadzadeh, B.; Bonakdar, S. Manufacturing of biodegradable polyurethane scaffolds based on polycaprolactone using a phase separation method: Physical properties and in vitro assay. Int. J. Nanomed. 2011, 6, 2375–2384. [Google Scholar] [CrossRef] [PubMed]
- Li, J.-W.; Lee, H.-T.; Tsai, H.-A.; Suen, M.-C.; Chiu, C.-W. Synthesis and Properties of Novel Polyurethanes Containing Long-Segment Fluorinated Chain Extenders. Polymers 2018, 10, 1292. [Google Scholar] [CrossRef] [PubMed]
- Fallahiarezoudar, E.; Ahmadipourroudposht, M.; Idris, A.; Yusof, N.M. Optimization and development of Maghemite (γ-Fe2O3) filled poly-L-lactic acid (PLLA)/thermoplastic polyurethane (TPU) electrospun nanofibers using Taguchi orthogonal array for tissue engineering heart valve. Mater. Sci. Eng. C 2017, 76, 616–627. [Google Scholar] [CrossRef] [PubMed]
- Andrady, A.L. The plastic in microplastics: A review. Mar. Pollut. Bull. 2017, 119, 12–22. [Google Scholar] [CrossRef]
- Gewert, B.; Plassmann, M.M.; MacLeod, M. Pathways for degradation of plastic materials in the environment. Environ. Sci. Process. Impacts 2015, 17, 1513–1521. [Google Scholar] [CrossRef]
- Hidalgo-Ruz, V.; Gutow, L.; Thompson, R.C.; Thiel, M. Microplastics in the marine environment: A review of the methods used for identification and quantification. Environ. Sci. Technol. 2012, 46, 3060–3075. [Google Scholar] [CrossRef]
- Asensio-Montesinos, F.; Blaya-Valencia, G.; Corbí, H.; Beltrán-Sanahuja, A.; Sanz-Lázaro, C. Microplastic accumulation dynamics in two Mediterranean beaches with contrasting inputs. J. Sea Res. 2022, 188, 102269. [Google Scholar] [CrossRef]
- Bat, L.; Öztekin, A. Microplastic Pollution in the Black Sea: An Overview of the Current Situation. In Microplastic Pollution. Emerging Contaminants and Associated Treatment Technologies; Hashmi, M.Z., Ed.; Springer International Publishing: Cham, Switzerland, 2022. [Google Scholar]
- Kittner, M.; Kerndorff, A.; Ricking, M.; Bednarz, M.; Obermaier, N.; Lukas, M.; Asenova, M.; Bordós, G.; Eisentraut, P.; Hohenblum, P.; et al. Microplastics in the Danube River Basin: A First Comprehensive Screening with a Harmonized Analytical Approach. ACS EST Water 2022, 2, 1174–1181. [Google Scholar] [CrossRef]
- Remzi Gül, M. Short-term tourism alters abundance, size, and composition of microplastics on sandy beaches. Environ. Pollut. 2023, 316, 120561. [Google Scholar]
- Curren, E.; Lee, A.E.; Yu, D.C.Y.; Leong, S.C.Y. Progress in Research on Microplastic Prevalence in Tropical Coastal Environments: A Case Study of the Johor and Singapore Straits. Microplastics 2024, 3, 373–389. [Google Scholar] [CrossRef]
- Korez, Š.; Gutow, L.; Saborowski, R. Microplastics at the strandlines of Slovenian beaches. Mar. Pollut. Bull. 2019, 14, 334–342. [Google Scholar] [CrossRef] [PubMed]
- Piñon-Colin, T.J.; Rodriguez-Jimenez, R.; Pastrana-Corral, M.A.; Rogel-Hernandez, E.; Wakida, F.T. Microplastics on sandy beaches of the Baja California Peninsula, Mexico. Mar. Pollut. Bull. 2018, 131 Pt A, 63–71. [Google Scholar] [CrossRef]
- Yu, X.; Peng, J.; Wang, J.; Wang, K.; Bao, S. Occurrence of microplastics in the beach sand of the Chinese inner sea: The Bohai Sea. Environ. Pollut. 2016, 214, 722–730. [Google Scholar] [CrossRef] [PubMed]
- Qiu, Q.; Peng, J.; Yu, X.; Chen, F.; Wang, J.; Dong, F. Occurrence of microplastics in the coastal marine environment: First observation on sediment of China. Mar. Pollut. Bull. 2015, 98, 274–280. [Google Scholar] [CrossRef] [PubMed]
- Hengstmann, E.; Tamminga, M.; Vom Bruch, C.; Fischer, E.K. Microplastic in beach sediments of the Isle of Rügen (Baltic Sea)-Implementing a novel glass elutriation column. Mar. Pollut. Bull. 2018, 126, 263–274. [Google Scholar] [CrossRef]
- Constant, M.; Kerhervé, P.; Mino-Vercellio-Verollet, M.; Dumontier, M.; Sànchez Vidal, A.; Canals, M.; Heussner, S. Beached microplastics in the Northwestern Mediterranean Sea. Mar. Pollut. Bull. 2019, 142, 263–273. [Google Scholar] [CrossRef]
- Trusler, M.M.; Moss-Hayes, V.L.; Cook, S.; Lomax, B.H.; Vane, C.H. Microplastics pollution in sediments of the Thames and Medway estuaries, UK: Organic matter associations and predominance of polyethylene. Mar. Pollut. Bull. 2024, 208, 116971. [Google Scholar] [CrossRef]
- Şener, M.; Doğruyol, P.; Balkaya, N. Microplastic pollution in the Black Sea Coast of the Anatolian side of Istanbul, Turkey. Desalin. Water Treat. 2019, 172, 351–358. [Google Scholar] [CrossRef]
- Syakti, A.D.; Hidayati, N.V.; Jaya, Y.V.; Siregar, S.H.; Yude, R.; Suhendy, A.L.; Wong-Wah-Chung, P.; Doumenq, P. Simultaneous grading of microplastic size sampling in the Small Islands of Bintan water, Indonesia. Mar. Pollut. Bull. 2018, 137, 593–600. [Google Scholar] [CrossRef]
- Tagg, A.S.; Harrison, J.P.; Ju-Nam, Y.; Sapp, M.; Bradley, E.L.; Sinclair, C.J.; Ojeda, J.J. Fenton’s reagent for the rapid and efficient isolation of microplastics from wastewater. Chem. Commun. 2017, 53, 372–375. [Google Scholar] [CrossRef]
- Osman, A.I.; Hosny, M.; Eltaweil, A.S.; Omar, S.; Elgarahy, A.M.; Farghali, M.; Yap, P.S.; Wu, Y.S.; Nagandran, S.; Batumalaie, K.; et al. Microplastic sources, formation, toxicity and remediation: A review. Environ. Chem. Lett. 2023, 4, 1–41. [Google Scholar] [CrossRef] [PubMed]
- Dees, J.P.; Ateia, M.; Sanchez, D.L. Microplastics and Their Degradation Products in Surface Waters: A Missing Piece of the Global Carbon Cycle Puzzle. ACS EST Water 2021, 1, 214–216. [Google Scholar] [CrossRef]
- Lin, Y.D.; Huang, P.H.; Chen, Y.W.; Hsieh, C.W.; Tain, Y.L.; Lee, B.H.; Hou, C.Y.; Shih, M.K. Sources, Degradation, Ingestion and Effects of Microplastics on Humans: A Review. Toxics 2023, 11, 747. [Google Scholar] [CrossRef]
- Chen, J.; Wu, J.; Sherrell, P.C.; Chen, J.; Wang, H.; Zhang, W.X.; Yang, J. How to Build a Microplastics-Free Environment: Strategies for Microplastics Degradation and Plastics Recycling. Adv. Sci. 2022, 9, e2103764. [Google Scholar] [CrossRef]
- Mittal, N.; Tiwari, N.; Singh, D.; Tripathi, P.; Sharma, S. Toxicological impacts of microplastics on human health: A bibliometric analysis. Environ. Sci. Pollut. Res. Int. 2024, 31, 57417–57429. [Google Scholar] [CrossRef]
- Zhang, X.; Yin, Z.; Xiang, S.; Yan, H.; Tian, H. Degradation of Polymer Materials in the Environment and Its Impact on the Health of Experimental Animals: A Review. Polymers 2024, 16, 2807. [Google Scholar] [CrossRef]
- Oluwoye, I.; Machuca, L.L.; Higgins, S.; Suh, S.; Galloway, T.S.; Halley, P.; Tanaka, S.; Iannuzzi, M. Degradation and lifetime prediction of plastics in subsea and offshore infrastructures. Sci. Total Environ. 2023, 904, 166719. [Google Scholar] [CrossRef]
- Maddison, C.; Sathish, C.I.; Lakshmi, D.; Wayne, O.; Palanisami, T. An advanced analytical approach to assess the long-term degradation of microplastics in the marine environment. NPJ Mater. Degrad. 2023, 7, 59. [Google Scholar] [CrossRef]
- Chamas, A.; Moon, H.; Zheng, J.; Qiu, Y.; Tabassum, T.; Jang, J.H.; Abu-Omar, M.M.; Scott, S.L.; Suh, S. Degradation Rates of Plastics in the Environment. ACS Sustain. Chem. Eng. 2020, 8, 3494–3511. [Google Scholar] [CrossRef]
- Sutkar, P.R.; Gadewar, R.D.; Dhulap, V.P. Recent trends in degradation of microplastics in the environment: A state-of-the-art review. J. Hazard. Mater. Adv. 2023, 11, 100343. [Google Scholar] [CrossRef]
- Lamichhane, G.; Acharya, A.; Marahatha, R.; Modi, B.; Paudel, R.; Adhikari, A.; Raut, B.K.; Aryal, S.; Parajuli, N. Microplastics in environment: Global concern, challenges, and controlling measures. Int. J. Environ. Sci. Technol. 2023, 20, 4673–4694. [Google Scholar] [CrossRef] [PubMed]
- Kye, H.; Kim, J.; Ju, S.; Lee, J.; Lim, C.; Yoon, Y. Microplastics in water systems: A review of their impacts on the environment and their potential hazards. Heliyon 2023, 9, e14359. [Google Scholar] [CrossRef] [PubMed]
- Guzzetti, E.; Sureda, A.; Tejada, S.; Faggio, C. Microplastic in marine organism: Environmental and toxicological effects. Environ. Toxicol. Pharmacol. 2018, 64, 164–171. [Google Scholar] [CrossRef]
- Jung, H.; Shin, G.; Kwak, H.; Hao, L.T.; Jegal, J.; Kim, H.J.; Jeon, H.; Park, J.; Oh, D.X. Review of polymer technologies for improving the recycling and upcycling efficiency of plastic waste. Chemosphere 2023, 320, 138089. [Google Scholar] [CrossRef]
- Gluck, A. Mathematical Methods in the Chemical Industry; Tehnică Publishing House: Bucureşti, Romania, 1971; pp. 58–61. (In Romanian) [Google Scholar]


Disclaimer/Publisher’s Note: The statements, opinions and data contained in all publications are solely those of the individual author(s) and contributor(s) and not of MDPI and/or the editor(s). MDPI and/or the editor(s) disclaim responsibility for any injury to people or property resulting from any ideas, methods, instructions or products referred to in the content. |
© 2025 by the authors. Licensee MDPI, Basel, Switzerland. This article is an open access article distributed under the terms and conditions of the Creative Commons Attribution (CC BY) license (https://creativecommons.org/licenses/by/4.0/).