1. Introduction
High temperatures and humidity directly impact cooling energy consumption, a significant issue in hot and humid regions [
1]. With rapid economic development and urbanization in Vietnam, traditional buildings (e.g., folk houses, tubular houses) are increasingly being replaced by high-rise apartment buildings, while resident lifestyles and cooling needs are evolving [
2]. Over the past decade, the proportion of households with air-conditioning (AC) units has quintupled to approximately one-third [
3], leading to a sharp increase in AC-related energy consumption, particularly in urban areas affected by the heat island effect [
4]. This rising cooling demand significantly burdens local electricity systems, emphasizing the urgent need to improve building energy efficiency.
While energy-saving strategies in design, construction, operation, and maintenance have been extensively explored, occupant behavior (OB) remains crucial, but it is challenging to predict factors influencing building energy use and indoor environmental conditions [
5,
6,
7]. OB is diverse, dynamic, and stochastic, making it challenging to incorporate accurately into the building design process. An effective way to gain insight into the characteristics of OBs and their impact on building performance is through Post-Occupancy Evaluation (POE) [
8]. POE is essential in assessing building performance, studying the relationship between occupant behavior and energy use, optimizing indoor environments, and supporting decision-making for future building designs [
9].
1.1. Existing POE Research and Limitations
Despite increasing POE studies in recent years, they have mainly focused on non-residential buildings, such as office buildings [
10], academic buildings, and sports buildings [
11,
12]. In contrast, POE studies in residential buildings remain limited, often characterized by small sample sizes, short monitoring durations, and restricted measurement parameters due to privacy concerns and logistical challenges.
Several studies have attempted to analyze occupant behavior and energy consumption in residential environments. Amasyali and El-Gohary [
13] explored energy-related values and occupant satisfaction in U.S. residential and office buildings using 618 online questionnaires; however, the study lacked direct indoor environmental measurements. Psomas et al. [
14] investigated the relationship between relative humidity levels and multiple factors related to building characteristics and occupants using measurements provided by the BETSI database. Their analysis revealed the low indoor humidity issue in Swedish dwellings during the heating season. Dartevelle et al. [
15] evaluated compliance with commonly used overheating criteria defined by existing standards based on data from post-occupancy measurements and survey campaigns in 23 nearly zero-energy houses in Wallonia, Belgium. Despite the temperate local climate, summer thermal discomfort was frequently identified in their study. Pastore and Andersen [
16] analyzed the indoor environment in four energy-certified buildings located in Switzerland. Design factors related to personal control of the indoor environment and personal factors were found to affect comfort ratings. Pereira et al. [
17] investigated building and occupancy factors affecting the indoor environment quality based on three-week measurements of 42 rooms in 12 apartments in Porto, Portugal. The presence of smokers, room ventilation rates, floor area, and the number of occupants were identified as the main impact factors.
POE studies have primarily focused on the relationship between AC use and building performance in hot and humid regions. Aqilah et al. [
18] analyzed the electricity consumption and thermal conditions in 19 Malaysian dwellings, observing that AC usage peaked at night. Understanding detailed AC usage characteristics can contribute to predicting electricity demand. However, the study lacked direct occupancy measurements, making quantifying the behavioral impact on cooling demand difficult. Duan et al. [
19] incorporated the occupancy rates from household surveys in their analysis of AC use in high-rise apartments in Changsha, China, but their findings were based on only six households, limiting the generalizability of their results. Other studies [
20,
21,
22] have identified occupant behavior as a key factor influencing AC usage, but they often suffer from narrow scopes, small sample sizes, and inadequate measurement coverage, which hinder the ability to derive broadly applicable insights.
Even in similar climates, variations in building typology, socio-economic conditions, and cultural preferences result in distinct OB patterns [
19]. Large-scale POE studies from Southeast Asia are still scarce, particularly those incorporating the long-term monitoring of both occupancy and cooling behaviors. This gap underscores the region’s need for broader POE research.
1.2. Addressing Key POE Methodological Gaps
In Vietnam, existing POE studies primarily relied on questionnaire surveys or short-term measurements, limiting the depth of analysis regarding energy consumption, indoor comfort, and OB [
23,
24], but they were based on household surveys and did not further analyze the indoor environment. Research on building thermal performance is predominantly simulation-based [
25,
26], lacking empirical validation through actual measurements. Furthermore, critical OB parameters, such as AC usage patterns, window operation, and occupancy behavior, are rarely integrated into building performance assessments.
To address these gaps, this study aims to achieve the following:
Comprehensively analyze the building performance and occupant behavior (OB) patterns in high-rise residential buildings through detailed occupant surveys and long-term measurements.
Investigate different cooling and ventilation behaviors and their impact on the indoor environment to identify potential issues.
Provide empirical evidence to support the development of energy-efficient buildings in Vietnam, improve indoor environmental quality and occupant well-being, and serve as a foundation for optimizing building design, operation, maintenance, and retrofitting.
By expanding POE research in hot and humid high-rise residential buildings, this study builds upon and extends existing work by incorporating the comprehensive, long-term monitoring of occupant AC usage behavior and the indoor environment. The findings contribute to developing more accurate predictive models, informing energy policy, and supporting the sustainable urban development of rapidly growing cities in Vietnam and other similar climates.
2. Materials and Methods
2.1. Investigated Objects
As a part of the joint German–Vietnamese research project CAMaRSEC (Climate-adapted Material Research for the Socio-economic Context in Vietnam) [
27], long-term indoor environmental measurements and occupant surveys were conducted in 49 apartments in high-rise residential buildings in Hanoi. The selection criteria for the investigated apartments were as follows: (1) they must have been located in high-rise residential buildings constructed in recent years, (2) they must have been equipped with split AC units, and (3) the households must have agreed to participate in long-term measurements and surveys and consented to the publication of the results. These selection criteria resulted in a sample representing a population group that had recently moved to an apartment in a high-rise residential building in Hanoi. This group was addressed in other parts of the CAMaRSEC project as the new urban middle class.
The selected apartments were in 15 high-rise residential buildings constructed between 2010 and 2018. Their location distribution is shown in
Figure 1. A hot and humid climate characterized this region. Daytime temperatures often exceeded 30 °C between May and September, while the coldest month was January, with average daily outdoor temperatures ranging from 14 °C to 19 °C. The relative humidity remained between 75% and 80% throughout the year.
2.2. Data Collection
The data collection consisted of three parts: (1) basic information on buildings and occupants, (2) long-term indoor and outdoor environmental data, and (3) point-in-time thermal comfort surveys.
2.2.1. Basic Information on Buildings and Occupants
Basic information about the buildings and apartments, including floor plans, construction year, and building materials, was obtained through local partners during the selection of the investigated apartments. Additionally, field investigations were conducted to collect data on typical household occupancy schedules, available cooling measures (split ACs, electric fans, and window ventilation), as well as occupants’ preferences for these measures and their usage habits.
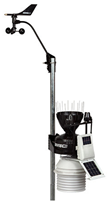
2.2.2. Long-Term Indoor and Outdoor Environmental Data
Indoor temperature, humidity, atmospheric pressure, and CO
2 concentration were collected in 98 rooms of the 49 investigated apartments between June 2020 and June 2021 using Testo 160 IAQ WiFi data loggers, as shown in
Table 1. These data loggers were installed at mid-height (approximately 1.5 m) on interior walls that were not directly exposed to sunlight, ensuring representative environmental measurements. Each apartment was equipped with two data loggers, one in the main bedroom and one in the living room, to capture the differences in environmental conditions between these frequently occupied spaces. The measurement interval was set to 15 min, and data were transmitted in real-time to a cloud-based server for remote access and analysis.
AC operating states (on/off) and room occupancy states (occupied/unoccupied) were not measured directly but were derived from indoor environmental data using developed recognition algorithms [
28]. The AC operation recognition based on room temperature and absolute humidity demonstrated high accuracy. However, occupancy recognition using CO
2 concentration was less reliable in large, well-ventilated spaces with low occupant CO
2 release rates, such as living rooms during the day. The dataset is publicly available in [
29].
The weather data were collected through a Davis Vantage Pro2 weather station installed on the campus of Hanoi University of Civil Engineering.
Table 1.
List of instruments.
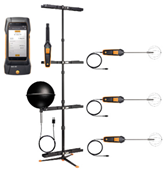
2.2.3. Point-in-Time Thermal Comfort Surveys
The environmental factors required for the point-in-time thermal comfort survey were measured with a Testo 400 kit, as shown in
Table 1. The questions in the point-in-time thermal comfort surveys are listed in
Table 2. The two personal parameters, i.e., activity level and clothing, are used to estimate the metabolic rate and clothing insulation. Besides the well-known seven-point thermal sensation and thermal comfort vote, a question on humidity sensation is added due to the local humid climate.
2.3. Method for Evaluating Long-Term Thermal Comfort
The Predicted Mean Vote (PMV) and adaptive comfort models are the most recognized methods for evaluating indoor thermal environments. The PMV model, developed by Fanger [
33], is based on heat balance principles and experimental data collected under steady-state conditions in a controlled climate chamber. This model considers two personal factors (metabolic rate and clothing level) and four environmental factors (air temperature, humidity, air velocity, and mean radiant temperature) to predict the occupants’ thermal sensations on a seven-point scale from cold (−3) to hot (+3) [
34]. The PMV model is suited for mechanically conditioned buildings, while the adaptive model applies to naturally operated buildings.
The adaptive model, developed based on extensive field studies, accounts for occupants’ dynamic interactions with their environment, such as adjusting clothing, opening windows, and using electric fans [
35]. However, there is no consensus on which comfort model is most suitable for mixed-mode buildings, where indoor climate control alternates between natural ventilation and mechanical cooling. This uncertainty is particularly relevant, spatially and temporally, for partially air-conditioned buildings, as is the case for the apartment buildings examined in this study. In the latest ASHRAE Standard 55-2020 [
34], the applicability of the adaptive model has been expanded to buildings with a mechanical cooling system installed, as long as the system is not in operation.
Therefore, this paper applies the adaptive comfort model given in the draft Vietnamese Standard TCVN 14214:2024 [
36] (see
Figure 2) to evaluate the indoor thermal environment of the investigated apartments when AC systems are not in use. The comfort temperature equation used in this model was developed by Nguyen et al. [
37]. According to this approach, an indoor environment is classified as overheating or overcooling if the indoor operative temperature of an occupied space exceeds or falls below the upper or lower 80% acceptability limit. This method is validated through point-in-time thermal comfort surveys, in which only 8% of the 87 respondents reported dissatisfaction when the indoor operative temperature remained within the 80% acceptable range.
In principle, the PMV model can be used to evaluate the thermal comfort in occupied spaces during AC operation. However, its application for long-term evaluation presents challenges in practice. A key limitation is that some required input parameters, such as metabolic rate, clothing level, and air velocity, are difficult to monitor over an extended period continuously. Using standardized values—for instance, 0.5 clo of clothing level and 0.2 m/s of air velocity under summer conditions—may lead to the overestimation of PMV values, as adaptive behaviors such as clothing adjustments and the increased air velocity from electric fans are not accounted for.
Among the 24 surveys on thermal comfort during AC operation, only 8% of respondents reported discomfort. This issue was primarily observed during the transition period, when the air conditioner was first turned on and the room had not yet reached the desired temperature. Once stabilized, most occupants found the indoor environment satisfactory. Given this, this study assumes that the thermal conditions during AC operation are generally comfortable, allowing for a simplified evaluation while avoiding PMV overestimation due to missing data on occupant-specific adaptations.
Since occupied hours vary across rooms, comparing overcooling and overheating hours is inappropriate. Instead, this study introduces overcooling and overheating probabilities as a comparative metric for thermal comfort in different rooms. These probabilities are calculated using Equation (1) and Equation (2), respectively:
and indicate the probability of overheating and the probability of overcooling, respectively. They are defined as the ratio of overheating hours () and overcooling hours () for a given period to the occupied hours ().
2.4. Method for Evaluating Room Ventilation
Elevated CO
2 concentrations are often caused by inadequate ventilation, which can increase health risks due to prolonged exposure to indoor pollutants. As a result, CO
2 concentration is widely used in standards and research to indicate indoor air quality and ventilation efficiency. For instance, the latest Vietnamese Standard TCVN 13521:2022 [
38] specifies that the indoor CO
2 concentration should not exceed 1000 ppm. However, it is worth noting that CO
2 concentration thresholds should be determined by considering building type and occupancy patterns [
39]. In this study, CO
2 concentration is used as a comparative metric to assess ventilation performance across different rooms rather than as an absolute criterion for evaluating indoor air quality.
3. Results and Discussion
3.1. Statistics on Investigated Apartments and Occupants
The residential high-rise buildings under investigation were constructed between 2010 and 2018. The exterior walls are mainly constructed with burnt clay bricks without thermal insulation. Single-glazed, top-hung windows dominate with transparent components without moveable or fixed external shading systems. Around 80% of the apartments investigated have a floor area between 50 m2 and 100 m2. More than half of the households have four family members (parents and two children).
Every household has at least one AC unit, with 81% owning two or more units. These are split-type AC systems that do not take in outdoor air. Additionally, most households have more than two electric fans, which are frequently used in conjunction with window ventilation and AC cooling. On weekdays, 80% of respondents leave home between 6:30 and 7:30 and return between 17:00 and 18:00.
In a mixed-mode building, occupants can maintain thermal comfort through mechanical cooling with AC, opening windows, or using electric fans.
Figure 3 shows the respondents’ cooling preference rankings, where “Level I” indicates a strong preference, while “Level IV” represents a less favored option.
The results indicate that electric fans are the most preferred cooling measure, followed closely by split-type ACs. Conversely, opening windows is the least favored option, as outdoor temperatures in hot and humid climates are typically higher than indoor temperatures. Regarding the factors influencing cooling choices, 60% of respondents prioritize energy cost, whereas 40% consider thermal comfort the primary factor. These varying cooling preferences contribute to differences in indoor climate conditions and AC-related energy consumption across apartments.
3.2. Occupancy and AC Usage Patterns Derived from Long-Term Measurements
In mixed-mode residential buildings, occupants typically operate AC only when the rooms are occupied. Therefore, understanding room occupancy patterns is essential for analyzing AC usage and indoor climate conditions.
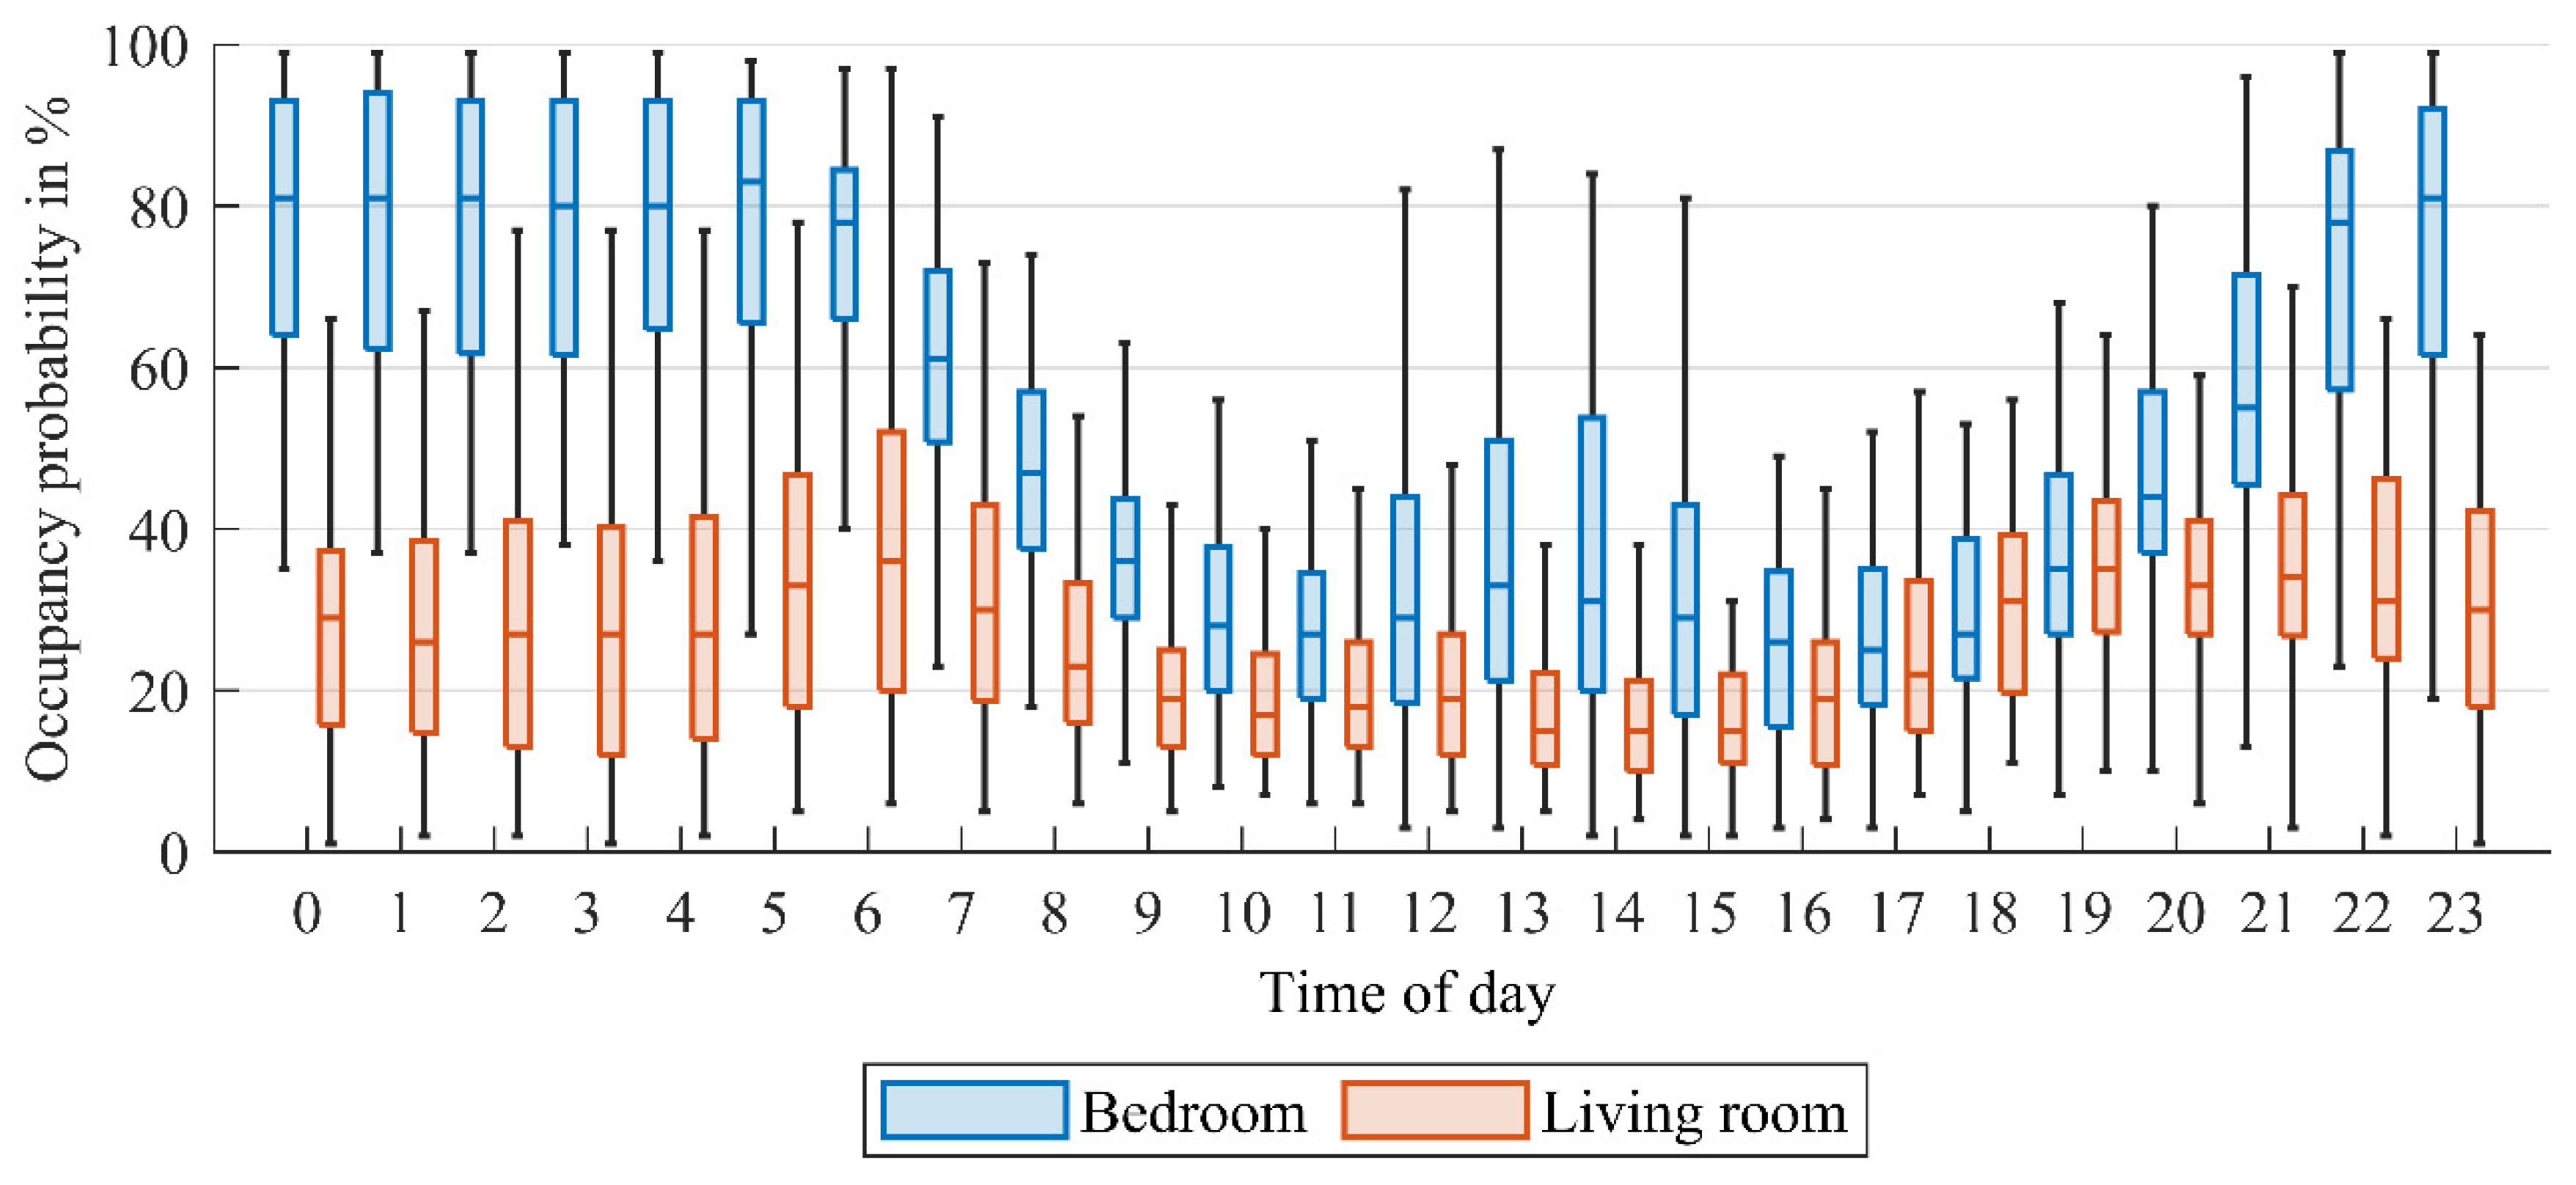
Figure 4 presents the statistics of weekday room occupancy probabilities over time. Occupancy probability is defined as the ratio of the total number of hours that the room is occupied to the total number of observation hours. The occupancy data are derived from one-year measurements in the 49 investigated apartments. The time of day is divided into 24 bins with one-hour intervals. Each bin contains box plots of the occupancy probability of living rooms and bedrooms for the corresponding period.
The results indicate that, on average, bedrooms have a higher occupancy probability than living rooms. This difference is primarily due to the occupant activities and may also be influenced by uncertainties inherent in the CO2-based occupancy recognition algorithm. On weekdays, the typical occupancy period of the investigated apartments spans from 18:00 to 7:00 the following day, although some apartments are occasionally occupied during daytime hours. The median bedroom occupancy probability remains relatively constant during sleeping hours, at about 80%. Additionally, a significant dispersion in occupancy probabilities is observed, highlighting the diversity of occupancy patterns in residential buildings.
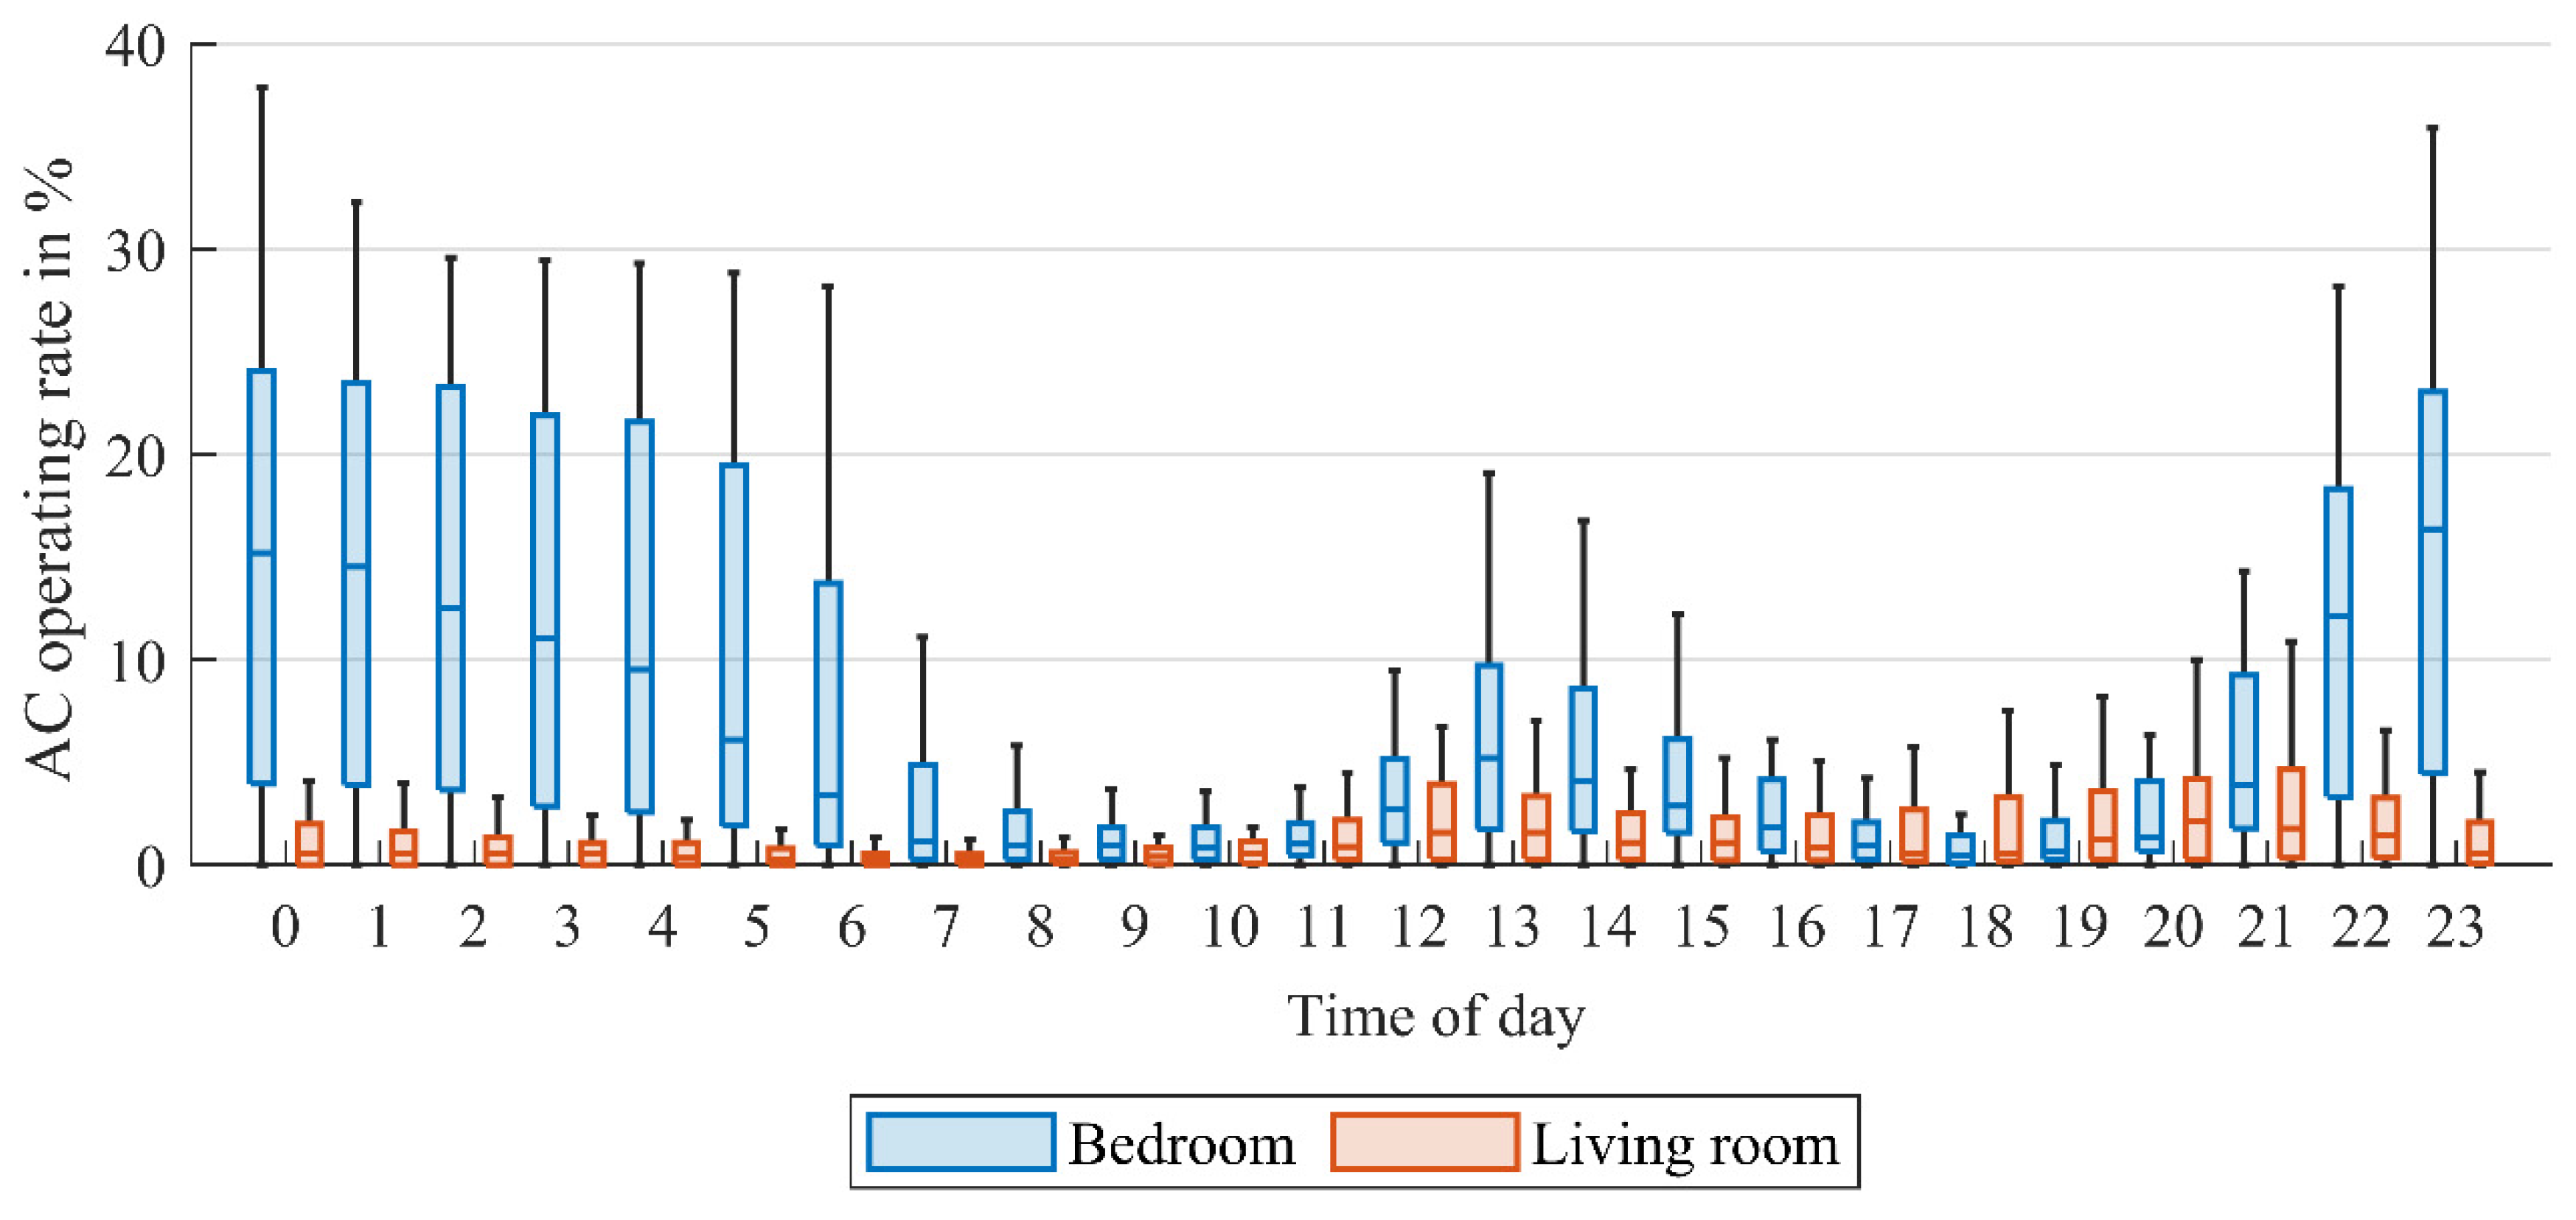
Figure 5 presents box plots depicting the operating rates over time in the living rooms and bedrooms of the 49 apartments investigated. The AC operating rate is the ratio of the total AC running time to the total observation time. In bedrooms, two primary periods of AC usage are observed: nighttime from 21:00 to 7:00 the following day and daytime from 12:00 to 15:00, with significantly higher operating rates at night. In living rooms, AC units are predominantly used between 12:00 and 14:00 and 17:00 to 21:00. Compared to bedrooms, living rooms exhibit notably lower AC operating rates.
A correlation between room occupancy and AC usage is evident. Rooms with high occupancy probabilities tend to have higher AC operating rates. Occupancy may influence AC usage and vice versa. For instance, cooling large spaces like living rooms during the day when fewer occupants are present may be deemed uneconomical, leading occupants to prefer using AC in bedrooms. The movement of the occupants caused by the use of AC increases the disparity in the occupancy probability between bedrooms and living rooms. Notably, even in bedrooms where AC usage is relatively frequent, the typical AC operating rate is less than 15% at night and less than 5% during the day. This finding indicates that AC usage in mixed-mode residential buildings is characterized by “part-time and part-space” operation, with significant variations between apartments. Therefore, assuming a “full-time and full-space” AC usage, as suggested in some design standards, may significantly overestimate the cooling demand in buildings similar to the investigated high-rise residential apartments.
AC-related energy use differences are influenced by AC running time and setpoint temperature.
Figure 6 presents box plots illustrating the typical cooling setpoint temperatures obtained from measurements and surveys. According to the survey results, the typical setpoint temperatures for bedrooms and living rooms range between 26 °C and 28 °C, aligning with the recommended room temperature range specified in the local design standard TCVN 14214:2024 [
36].
Notably, there is a discrepancy between the measured and reported setpoint temperatures. The median cooling temperature for bedrooms derived from measurements is 1.4 °C higher than that reported in surveys, while for living rooms, the difference extends to 2.1 °C. These deviations can be attributed to differences in data collection methods. The setpoint temperature reported by the occupants refers to the indoor air temperature, whereas the temperature recorded by the wall-mounted data logger is closer to the operative temperature due to the influence of the wall and casing [
40]. After the AC is turned on, the wall surface temperature drops much more slowly than the indoor air temperature due to thermal inertia. Consequently, during the initial cooling period, the temperature recorded by the data logger tends to be higher than the actual air temperature.
Detailed field measurements indicate that, at the beginning of the cooling process, the temperature recorded by the data logger is about 2 °C higher than the indoor air temperature, with this difference decreasing as cooling time increases. This effect is more pronounced in living rooms, where ACs are typically used for shorter periods, resulting in a more significant discrepancy. Furthermore, some occupants tend to set a low target temperature (below 24 °C). However, this does not necessarily mean that the room will be cooled to that temperature, as the actual cooling performance depends on factors such as the AC’s cooling capacity, control accuracy, and the room’s cooling load and thermal properties.
3.3. Electricity Energy Consumption and Weather
Figure 7 presents the monthly electricity consumption of the investigated apartments alongside the corresponding monthly average outdoor temperature. Since electricity consumption data are derived from monthly energy bills, it is impossible to distinguish between different end uses precisely. However, by analyzing the weather data, it can be inferred that the peak in electricity consumption between May and September is primarily driven by AC usage for space cooling. The increased variation in electricity consumption during this period reflects differences in AC usage across apartments. Additionally, a slight rise in electricity consumption in December may be attributed to domestic hot water systems or electric heating in some apartments.
3.4. Impact of OB on the Indoor Thermal Environment
This study analyzes the indoor environments of the 49 investigated apartments under different room states during different seasons, using data collected from June 2020 to June 2021 (one year). The period from May to September is classified as the cooling season due to the high outdoor air temperatures and the increased electricity consumption associated with AC usage, while the remaining months are categorized as the non-cooling season. Based on occupancy status, the rooms are classified into two basic states: occupied and unoccupied. During the cooling season, occupied rooms are divided into two operating states: AC-on and AC-off.
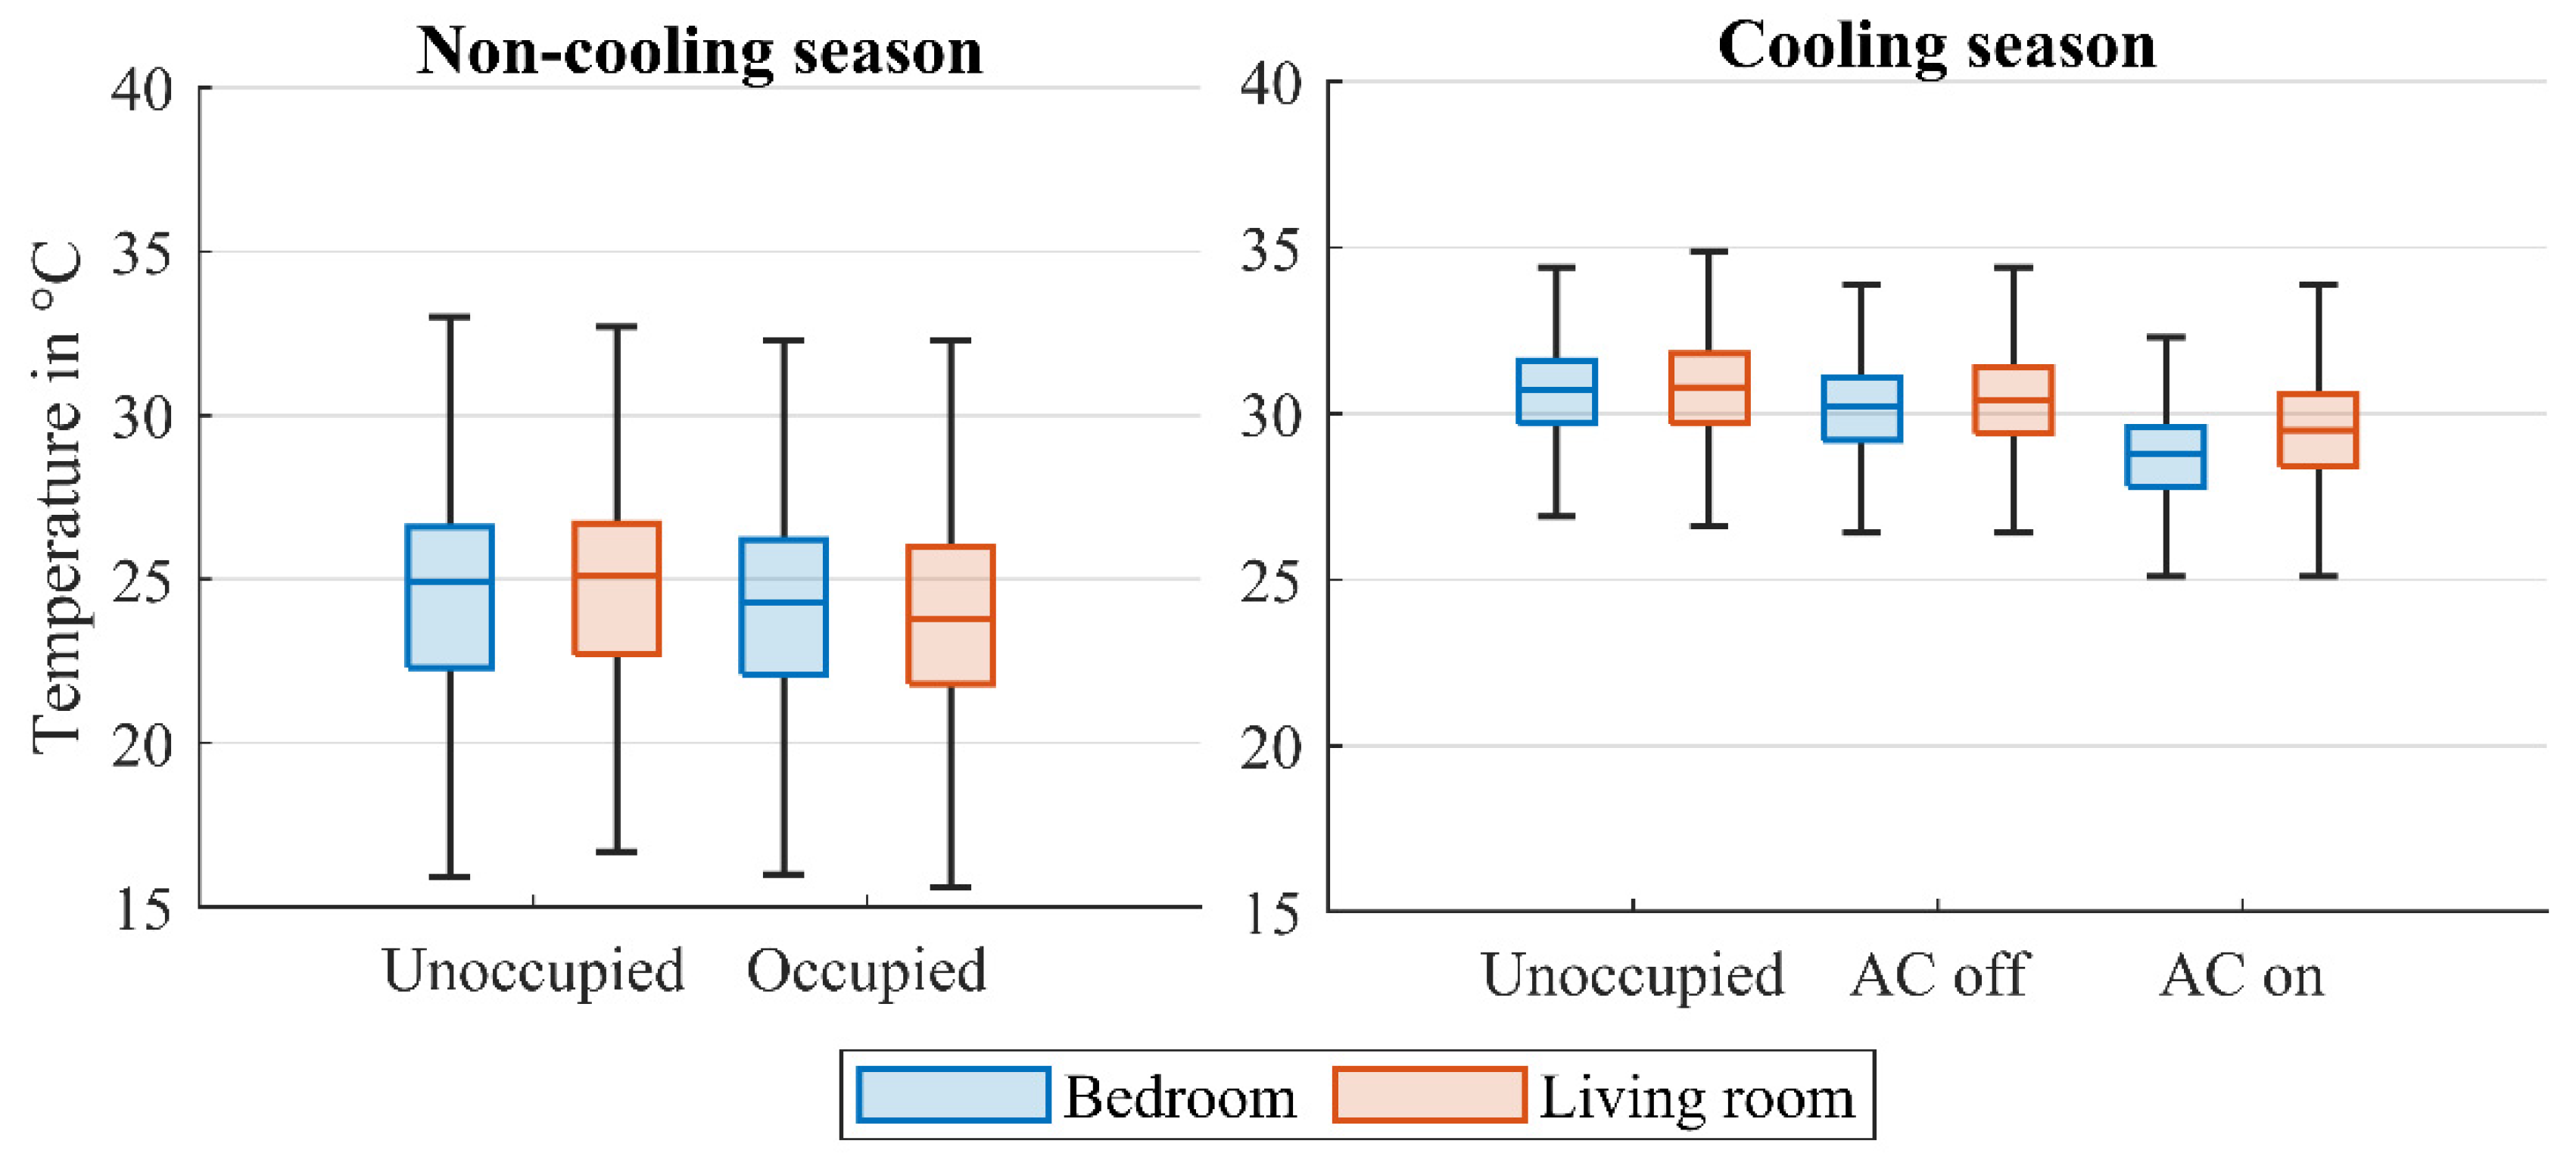
Using box plots,
Figure 8 compares the bedroom and living room temperatures across different room states and seasons. The wall-mounted data loggers measure the room temperature close to the operative temperature. During the non-cooling season, occupancy state and room type have little impact on room temperature. The median room temperature is around 25 °C during non-occupied periods and slightly lower at around 24 °C during occupied periods. This difference can be attributed to nighttime occupancy, as outdoor air temperatures tend to be lower at night than during the day.
In the cooling season, similar trends are observed in unoccupied and AC-off room states, but room temperatures are significantly higher due to elevated outdoor air temperatures. Without AC operation, the median room temperature in bedrooms and living rooms exceeds 30 °C. When AC is used in bedrooms, the median room temperature decreases by approximately 4 K. However, in the living rooms, the median room temperature remains slightly higher due to the shorter AC operation durations, as discussed in
Section 3.2.
Figure 9 compares the relative humidity levels in bedrooms and living rooms across different room states and seasons using box plots. During the non-cooling season, the relative humidity remains similar in both room types regardless of occupancy state, with a median value of around 75%, which exceeds the recommended range specified in the local design standard. Due to the absence of humidity control equipment, indoor relative humidity varies widely, ranging from a minimum of about 40% to a maximum exceeding 95%.
When the AC is not in use during the cooling season, the median relative humidity in bedrooms and living rooms remains around 75%, largely unaffected by the occupancy state. While the maximum measured relative humidity decreases slightly due to the higher indoor temperatures, it still exceeds 90%. Meanwhile, the humid and rainy climate causes the minimum relative humidity to rise above 55%.
Since AC cooling is accompanied by dehumidification, significant reductions in relative humidity are observed in the AC-on state, with the median value dropping to about 60%. However, relative humidity varies considerably due to differences in AC operating durations and cooling control strategies. Notably, excessive dehumidification in some rooms can negatively impact occupant comfort and health, leading to unnecessary energy consumption.
3.5. Evaluation of Long-Term Thermal Comfort
The long-term indoor thermal environment of the 49 investigated apartments is evaluated using the methodology described in
Section 2.3.
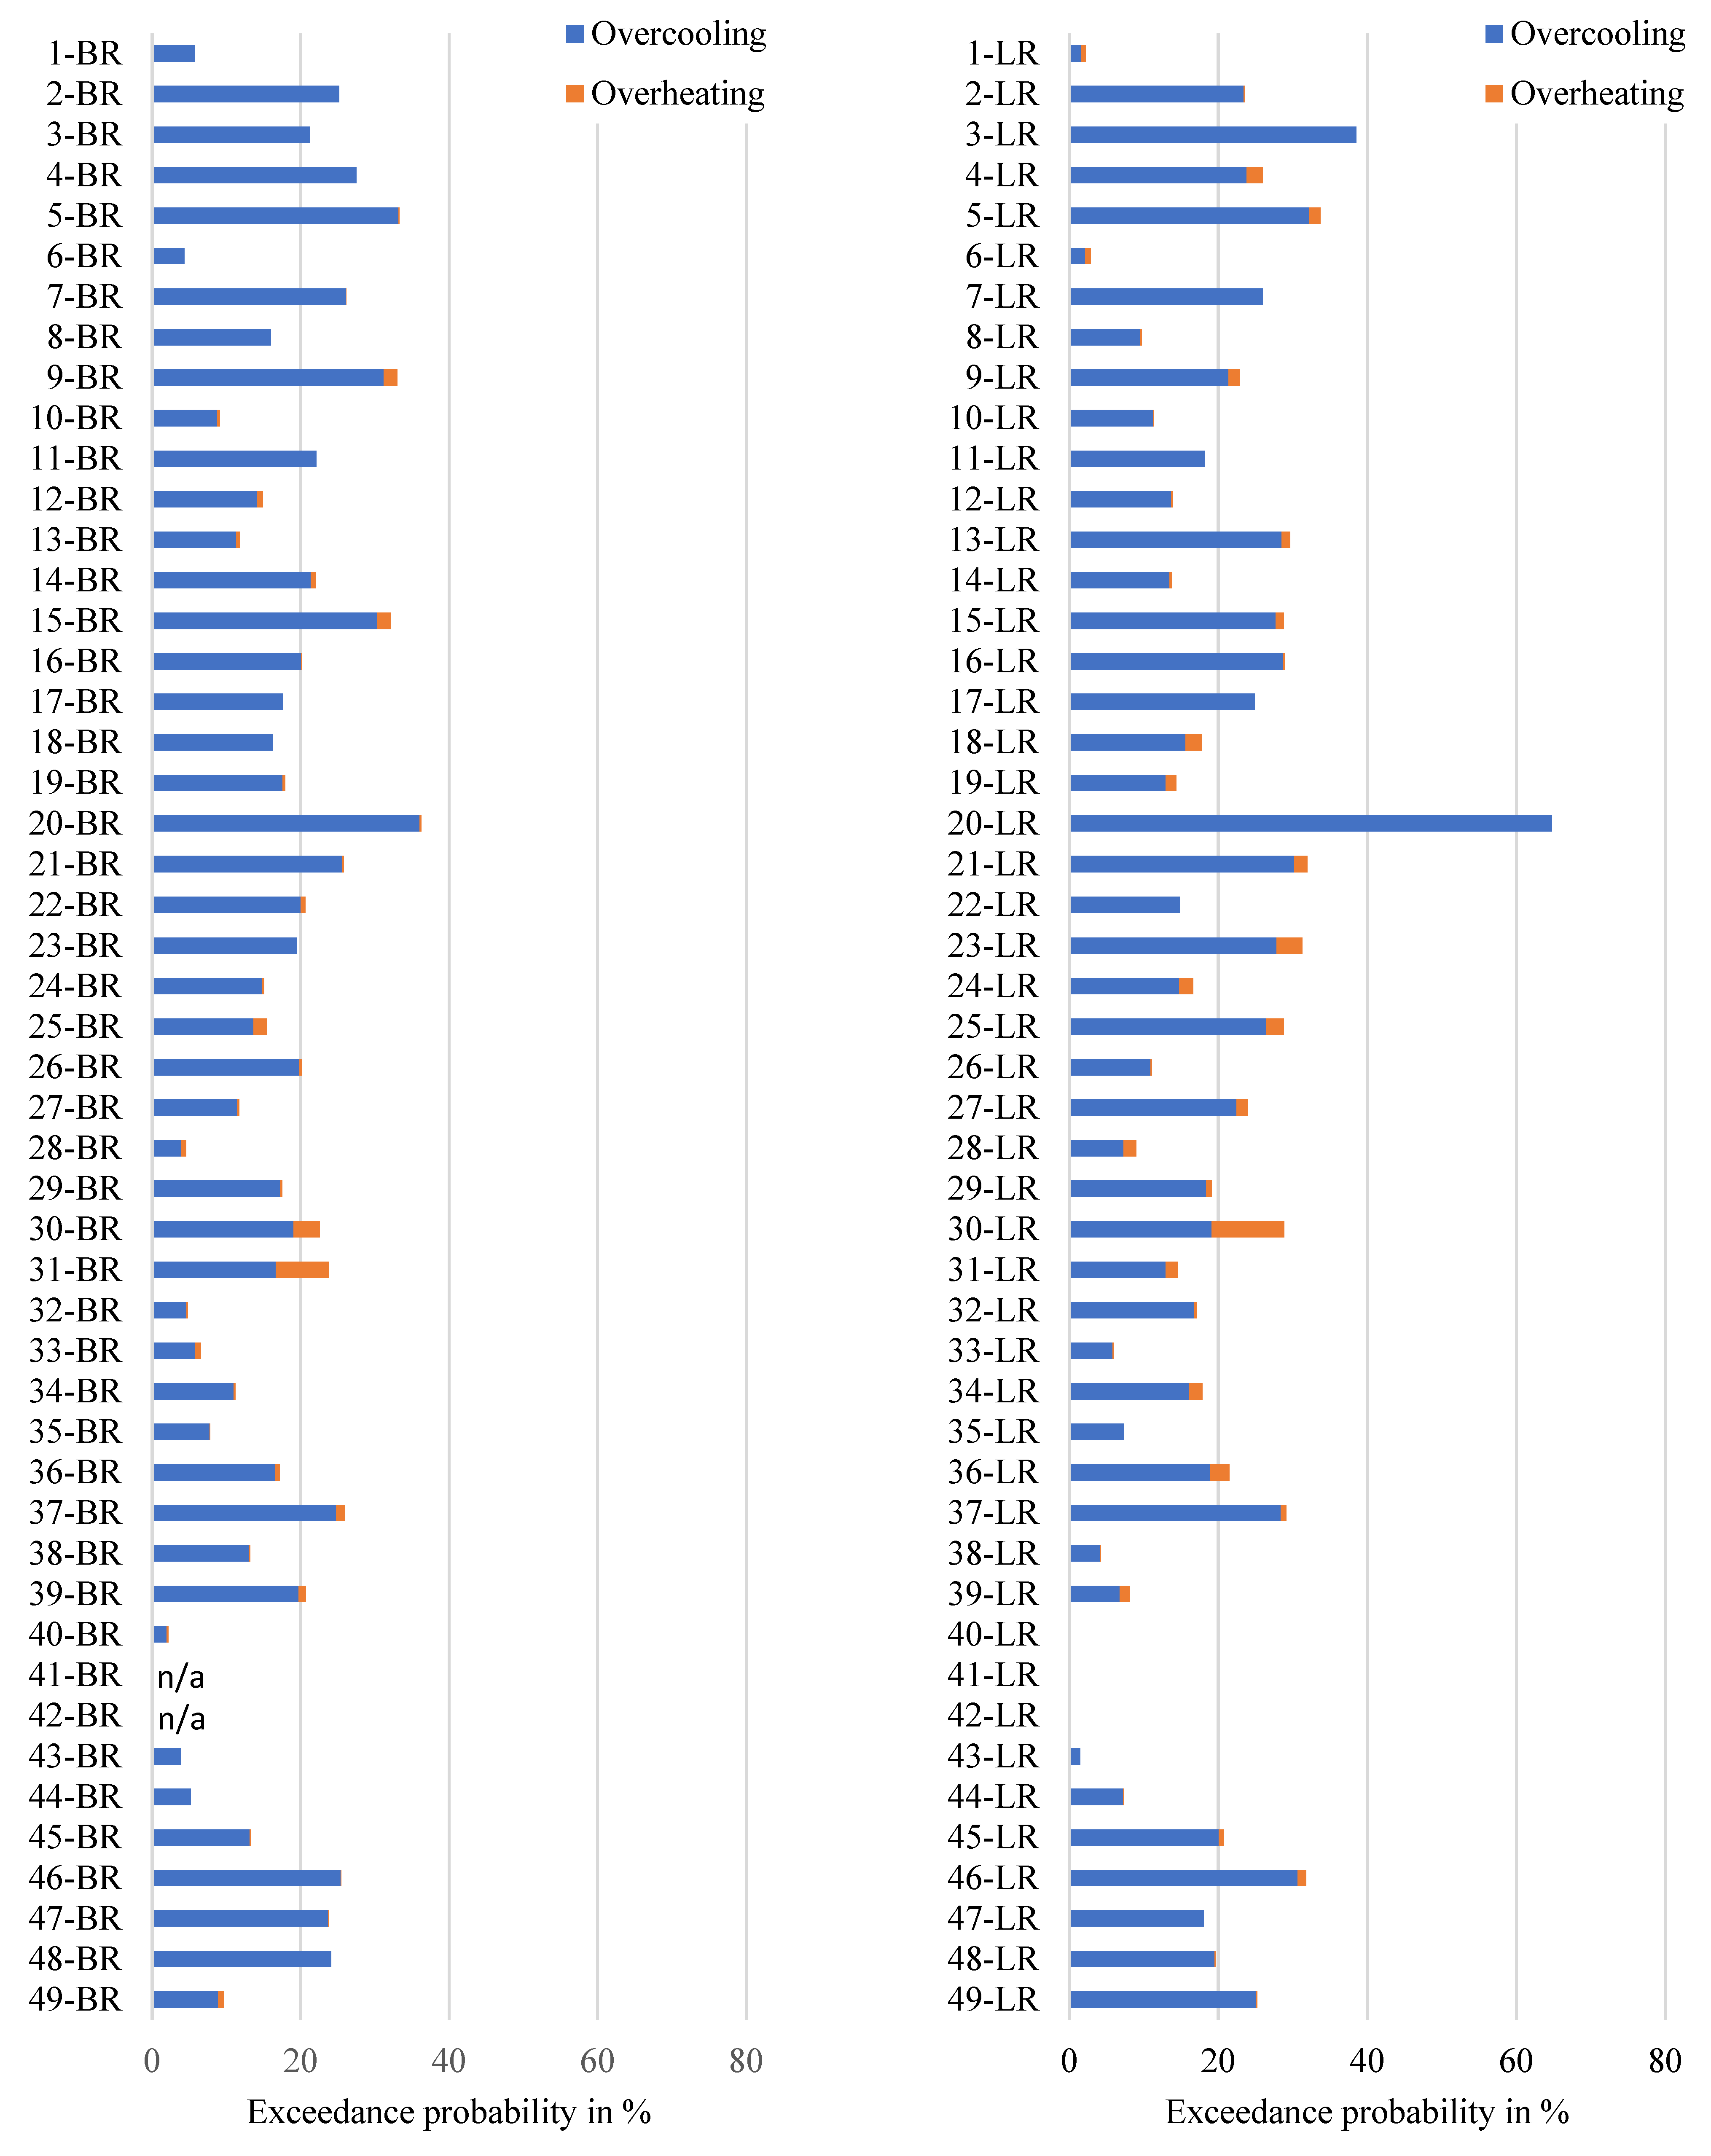
Figure 10 compares the annual overcooling and overheating probabilities for the measured bedrooms and living rooms. Overall, the probability of overheating (defined as the room temperature exceeding the 80% upper limit of the adaptive model) during the occupied hours is low. Notable exceptions include the living room of Apartment 30 and the bedroom of Apartment 31, where overheating probabilities reach 10% and 7%, respectively. Both rooms share common characteristics: west-facing windows and infrequent AC usage due to energy cost concerns. As a result, these spaces experience high summer temperatures due to increased solar radiation exposure. However, the impact of elevated air speed on thermal comfort is not accounted for due to measurement limitations. Since the occupants of these rooms prefer using electric fans in summer, the actual thermal environment may be more tolerable than the evaluation suggests.
Conversely, overcooling is more prevalent, as residents typically do not use heating equipment. About 70% of the measured rooms have an overcooling probability of more than 10%, with most exceeding 20%. Bedrooms and living rooms within the same apartment generally experience similar overcooling conditions. Notably, the living room of Apartment 20 stands out, with an overcooling probability nearing 65%, significantly higher than in other apartments. This can be attributed to its high winter and low summer occupancy rates. Additionally, solar heat gain is limited as the room faces north, resulting in low room temperatures.
It is worth noting that the adaptive model used in the evaluation is based on the study by Nguyen et al. [
37], which primarily developed the comfort temperature equation using the data collected during the cooling season in Southeast Asia. Limited winter comfort surveys suggest that this model may underestimate occupants’ tolerance to cold conditions, implying that the risk of overcooling might be lower than indicated in
Figure 9. Further validation of the long-term indoor thermal environment evaluation methodology is needed, particularly through additional occupant surveys conducted during colder months.
Although the adaptive model does not specify humidity limits, high relative humidity can restrict the effectiveness of adaptive strategies and narrow the comfort range [
37]. Moreover, excessive humidity often leads to mold growth, which causes structural damage and increases health risks [
41]. The Vietnamese Standard TCVN 14214:2024 [
36] recommends an indoor humidity range of 60% to 70%, which is higher than the 40 to 60% range preferred by many international standards [
42,
43]. This reflects the local adaptation to hot and humid environmental conditions.
3.6. Impact of OB on the Room Ventilation
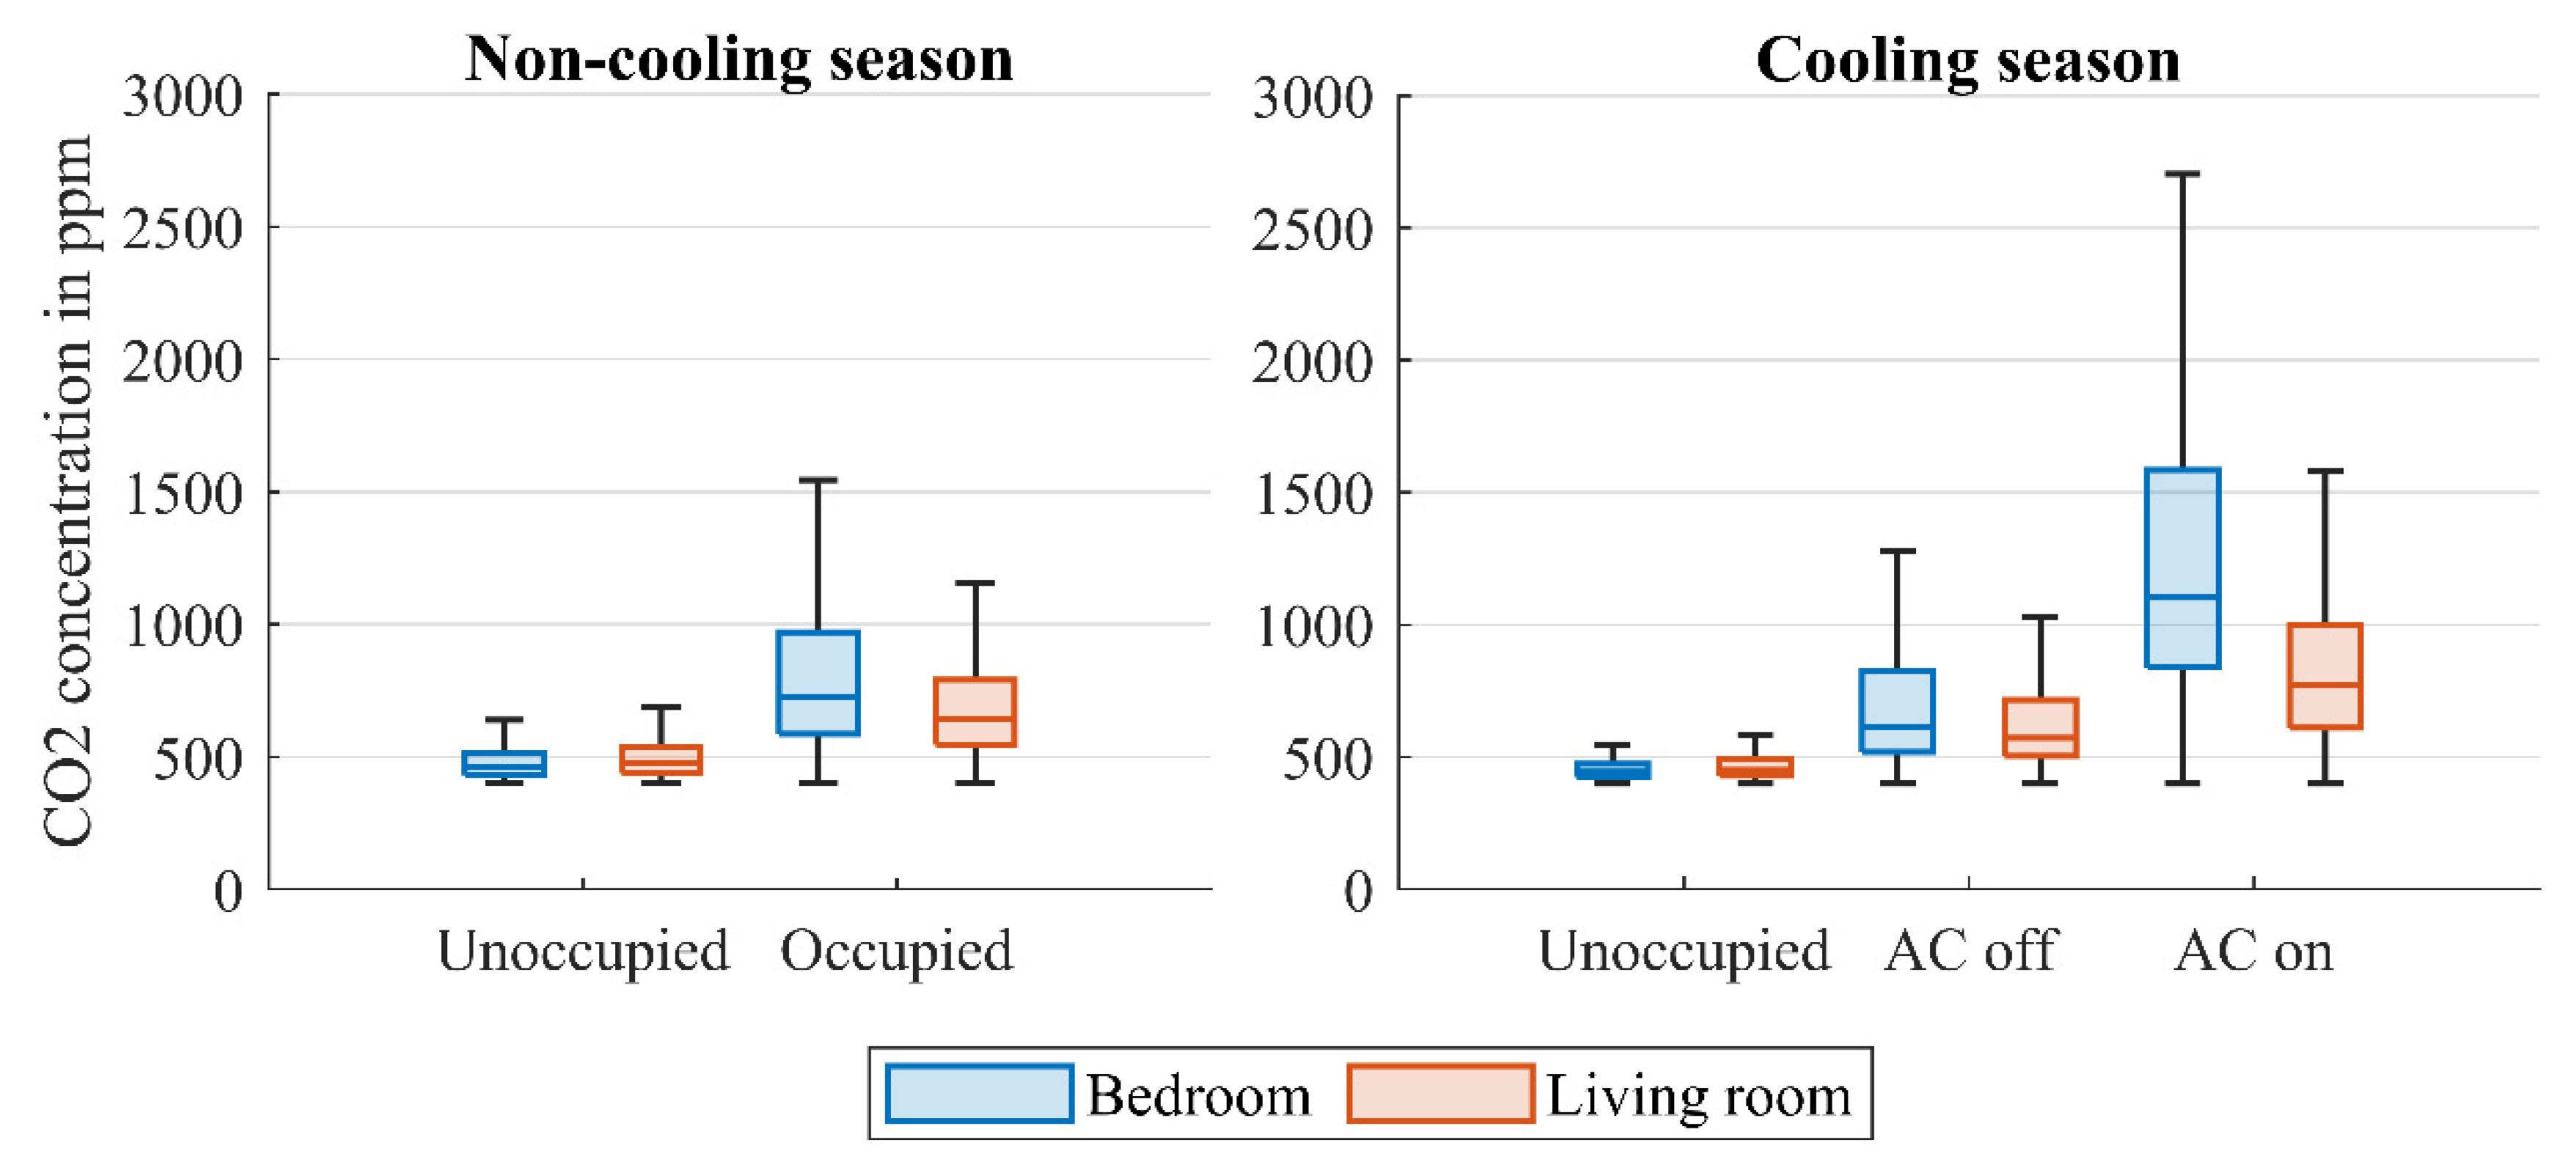
The CO
2 concentrations in the measured bedrooms and living rooms under various room states and seasons are presented as box plots in
Figure 11. When unoccupied, the CO
2 levels in these rooms are similar, with a median value of about 470 ppm. Some elevated CO
2 concentration values are recorded shortly after the occupants leave, likely due to the time lag in air exchange.
During occupied periods without AC usage, most measured CO2 concentrations remain below 1000 ppm, indicating adequate ventilation. The CO2 concentrations in the occupied bedrooms during the non-cooling season are slightly higher than those recorded during the cooling season. This can be attributed to the occupants’ ventilation habits: windows tend to be closed when outdoor temperatures are too low, thus reducing natural ventilation.
A significant increase in CO2 concentrations is observed when ACs are used, particularly in bedrooms, where the median value reaches 1100 ppm, with maximum concentrations exceeding 2500 ppm. This is primarily due to occupants closing windows to minimize cooling energy loss and, in some cases, closing interior doors when using AC in bedrooms. Since split-type ACs do not bring in outdoor air, ventilation is significantly reduced, leading to higher CO2 concentrations in enclosed spaces.
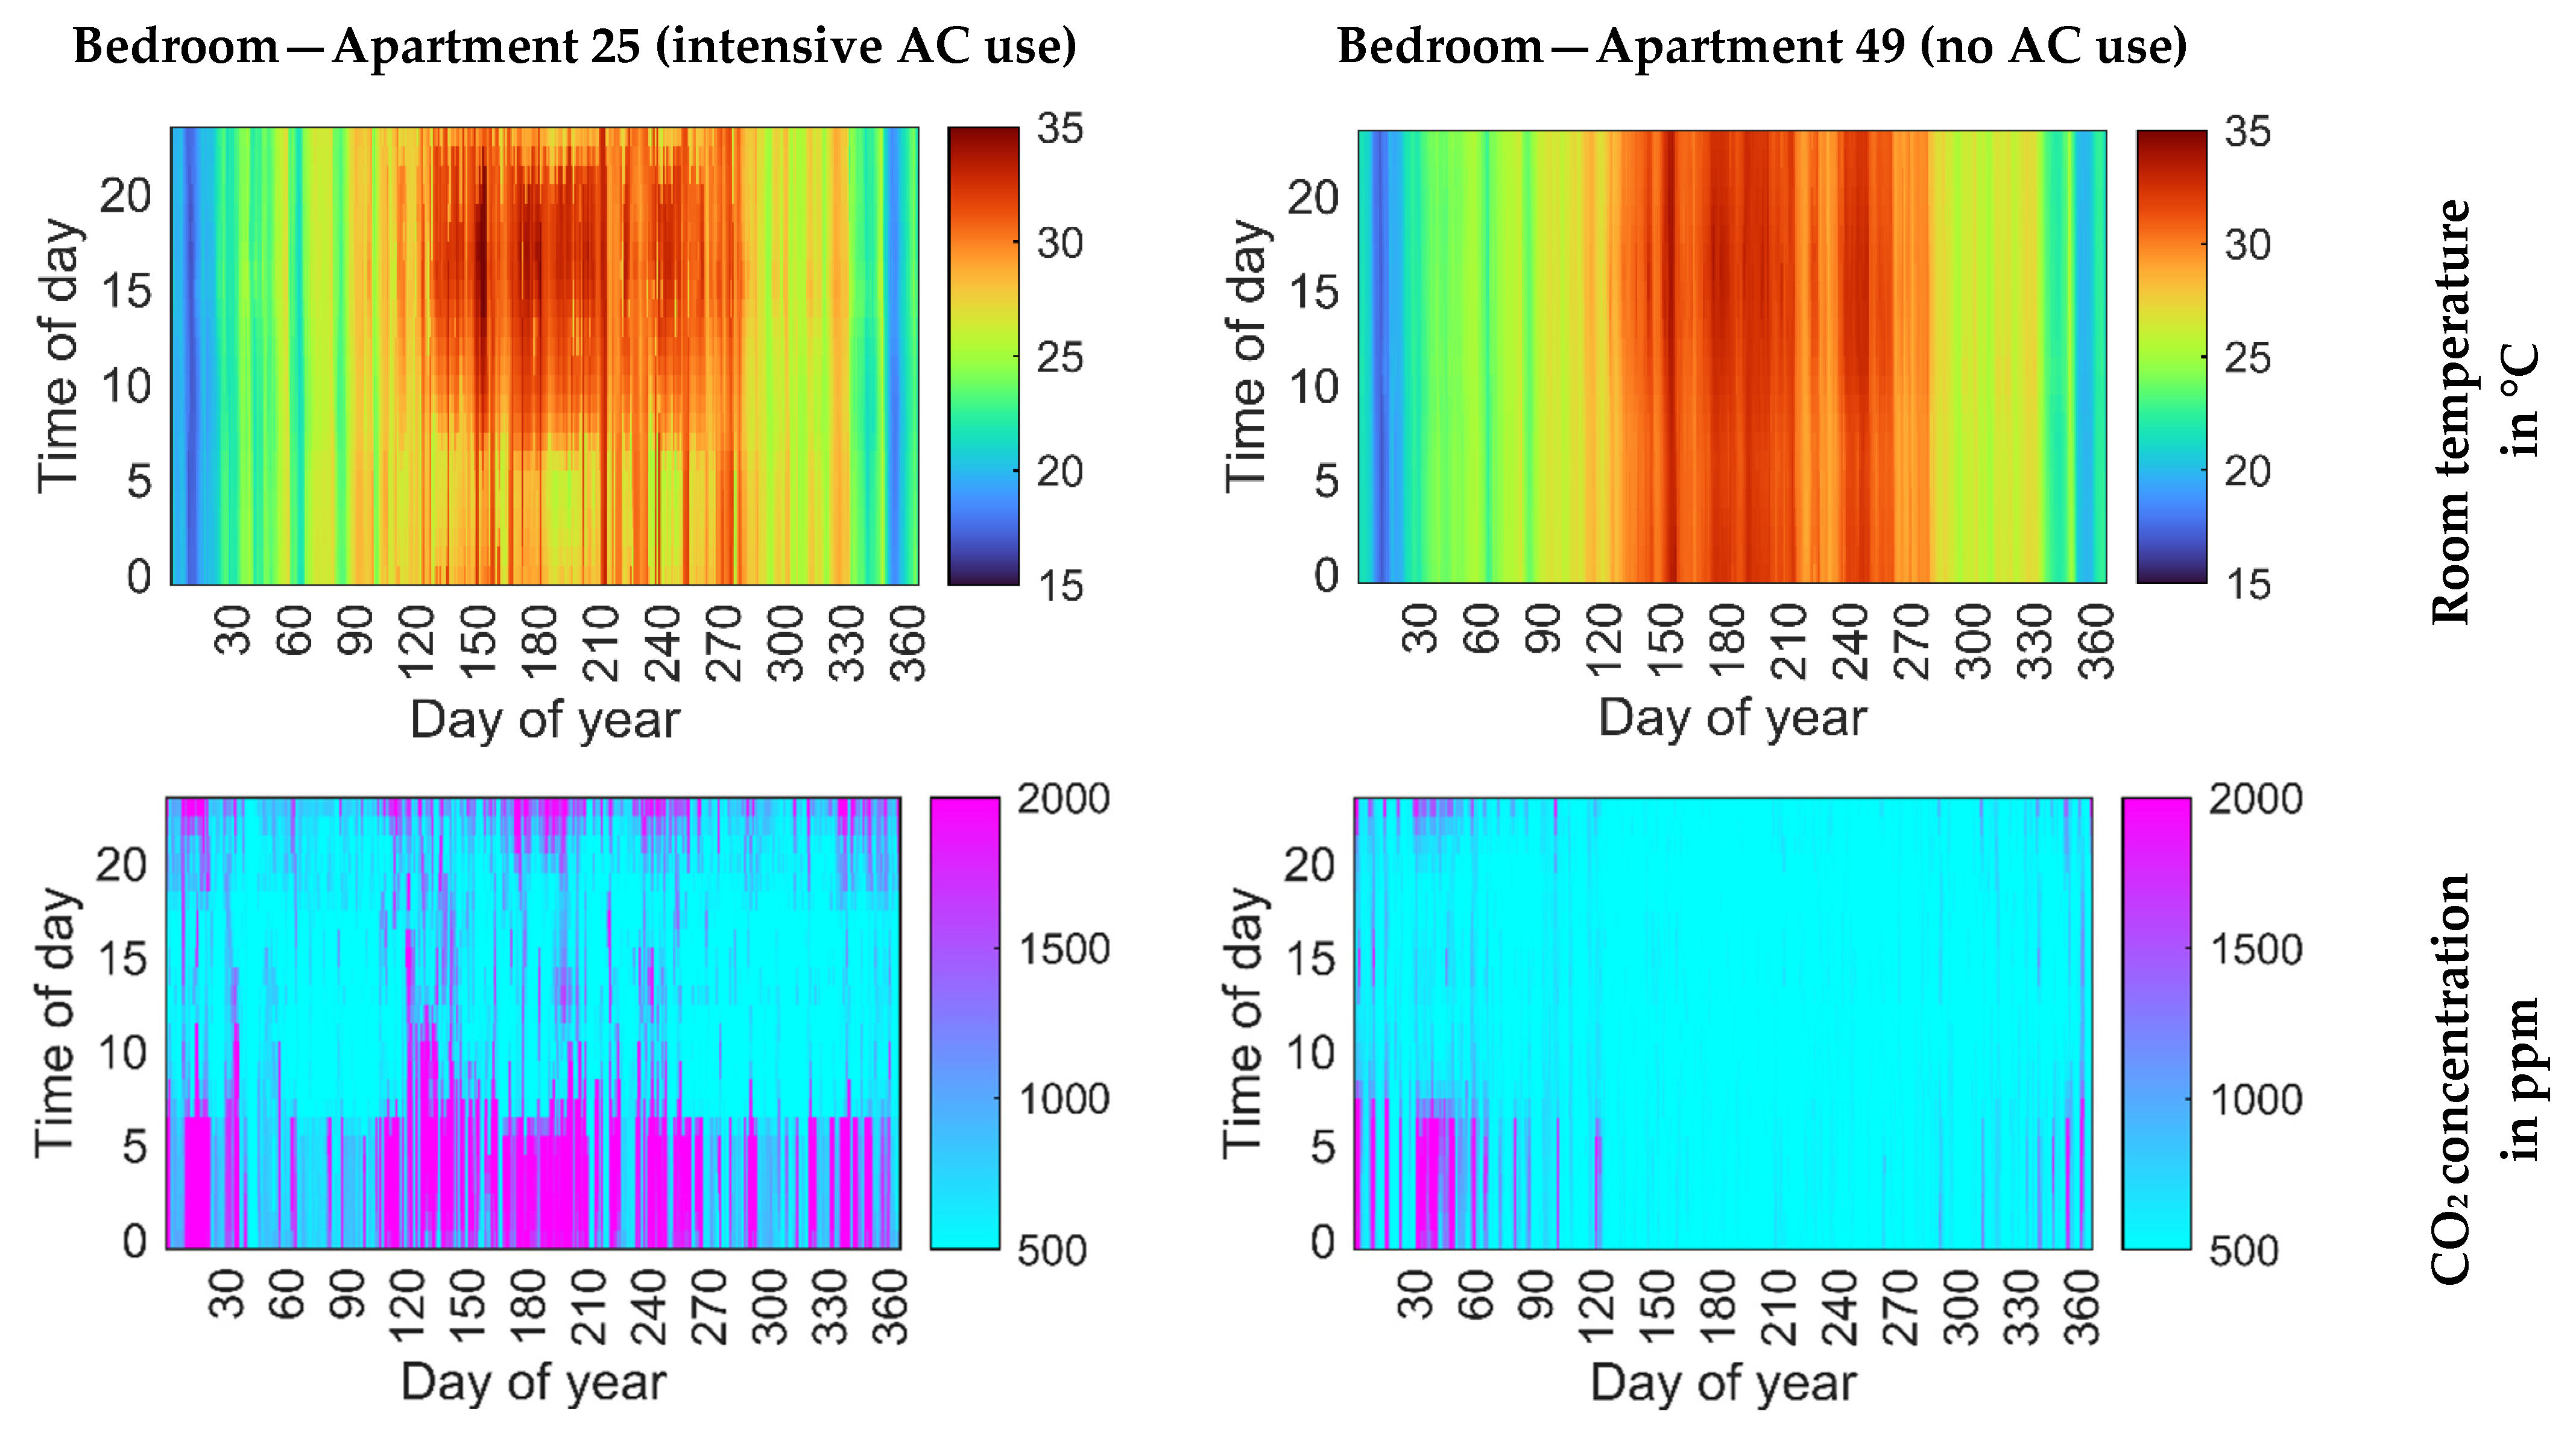
The significant variation in CO
2 measurements can be attributed to differences in ventilation habits and AC usage intensities. To further analyze the impact of occupant behavior on the indoor environment, temperature and CO
2 data from the bedrooms of two representative apartments (AP 25 and AP 49) are visualized as heat maps with a high temporal resolution (15 min intervals), as shown in
Figure 12. Among all the apartments investigated, AP 25 exhibits relatively high AC usage, whereas the occupants of AP 49 never use AC.
During the cooling season, the bedroom in AP 49 maintains relatively high temperatures due to the absence of AC usage. In contrast, AP 25 shows significant temperature drops at certain times, indicating AC usage. The occupants of AP 25 typically operate the AC between 20:00 and 6:00 the following day, during which CO2 concentrations also increase noticeably. This suggests that windows and interior doors are kept closed to minimize cooling energy loss. Conversely, the bedroom in AP 49 remains well-ventilated throughout the cooling season. Given that AC use can negatively impact indoor air quality and pose health risks, appropriate measures are needed to ensure adequate ventilation while saving cooling energy.
During the non-cooling season, temperature patterns remain relatively stable, with no significant fluctuations, indicating the absence of space heating. However, inadequate ventilation frequently occurs in AP 25, and elevated CO2 concentrations are observed in AP 49, particularly in January and February. As mentioned earlier, occupants tend to close windows to reduce heat loss in cold weather. Additionally, in both apartments, bedroom doors are commonly kept closed during sleeping hours, further restricting outdoor air supply and resulting in inadequate ventilation. Since tolerance to cold conditions varies among individuals, the frequency of closing windows in winter differs between apartments, explaining the variation in the inadequate ventilation between AP 49 and AP 25 during the non-cooling season.
4. Conclusions
This study provides a comprehensive analysis of indoor environmental quality, energy consumption, and occupant behavior in high-rise residential buildings in Hanoi, Vietnam, offering new insights into cooling patterns and their implications for building energy standards. The findings reveal that the assumption of “full-time and full-space” AC usage in current design standards overestimates cooling demand, as actual AC operation follows a “part-time and part-space” pattern. Electricity consumption for AC use peaks from May to September, while in the cold season, most surveyed rooms experience overcooling, highlighting the need to balance cooling and insulation strategies. Additionally, closing bedroom doors while using AC without proper ventilation poses risks to indoor air quality and occupant health, emphasizing the importance of adequate ventilation standards in residential building design.
Building codes should incorporate realistic occupant behavior, ventilation strategies, and improvements in thermal insulation to improve energy efficiency and indoor comfort. For example, enhancing the building envelope through solar control glazing can help reduce heat gain while maintaining indoor comfort. Other passive design strategies, such as improved shading, controlled natural ventilation, and better insulation, should also be considered to optimize cooling demand while ensuring energy-efficient building operation. Given the dominance of mixed-mode cooling behavior, current energy efficiency standards should be updated to reflect actual AC usage patterns, preventing the overestimation of energy demand and allowing for more effective energy management policies.
This study contributes to developing energy benchmarks for Hanoi’s high-rise residential buildings by providing empirical data on occupant behavior, energy use, and indoor environmental conditions, supporting more accurate building energy performance assessments and policy recommendations. However, several limitations should be acknowledged. The sample size of 49 apartments in Hanoi may not have fully represented Vietnam’s diverse housing stock, and while long-term measurements were conducted, more extensive statistical validation is needed. Additionally, caution should be exercised when applying these findings to regions with different climatic conditions, as occupant behavior, cooling demand, and ventilation strategies may vary across different climate zones.
Future research should incorporate a more extensive and regionally diverse dataset, explore socio-economic influences on cooling behavior, and apply advanced statistical modeling to further quantify the relationships between occupant behavior, energy use, and indoor comfort. In particular, a socio-technical systems framework could provide deeper insights into how electricity pricing policies, family structure, and cultural preferences shape AC usage patterns.
Future studies can refine energy efficiency policies, enhance building performance standards, and support sustainable urban development in Vietnam and similar hot–humid climates by expanding research in these areas.


 ,
, 