Article

Mineral Composition of Chelidonium majus L. and Soils in Urban Areas

1
Institute of Earth Sciences, Faculty of Natural Sciences, University of Silesia in Katowice, Będzińska 60, 41-200 Sosnowiec, Poland
2
Institute of Social and Economic Geography and Spatial Management, Faculty of Natural Sciences, University of Silesia in Katowice, Będzińska 60, 41-200 Sosnowiec, Poland
3
Faculty of Chemistry, University of Opole, Oleska 48, 45-052 Opole, Poland
*
Author to whom correspondence should be addressed.
Appl. Sci. 2025, 15(9), 4718; https://doi.org/10.3390/app15094718
Submission received: 1 April 2025 / Revised: 16 April 2025 / Accepted: 22 April 2025 / Published: 24 April 2025
(This article belongs to the Section Environmental Sciences)

Abstract

:
Chelidonium majus L. is a species with a wide medicinal use, commonly found in anthropogenically degraded habitats, forest edges, and urban parks. This study aimed to determine the chemical composition of the leaves, stems, and roots of Ch. majus and the soil in its rhizosphere in terms of the content of the main elements (Fe, Ca, P, Mg, Al, Na, K, S), trace elements and rare earth minerals (Ti, Mo, Ag, U, Au, Th, Sb, Bi, V, La, B, W, Sc, Tl, Se, Te, Ga, Cs, Ge, Hf, Nb, Rb, Sn, Ta, Zr, Y, Ce, In, Be, and Li), and their comparison in the parts analyzed. The study was conducted in five urban parks in southern Poland in a historically industrialized area. The results showed that Ca has the highest content among the macroelements. Its leaf content ranges from 24,700 to 40,700 mg·kg−1, while in soil, it ranges from 6500 to 15,000 mg·kg−1. In leaves, low values of Al (100–500 mg·kg−1) and Na (100 mg·kg−1) were found in comparison to the other elements tested, while high values of Al (5100–9800 mg·kg−1) were found in soils. Among the macroelements in the Ch. majus stems, K showed the highest concentration (>100,000 mg·kg−1), while the Ca content was 3–4 times lower in the stems than in the leaves. Rhizomes of Ch. majus accumulate the most K and Ca, in the range of 22,800–29,900 mg·kg−1 and 5400–8900 mg·kg−1, respectively. Fe and Al in all locations have higher values in the soil than in the tissues. In turn, the content of Ca, P, Mg, K, and S is higher in plants than in the soil. Determining the elemental content of medicinal plants is important information, as the plant draws these elements from the soil, and, at higher levels of toxicity, it may indicate that the plant should not be taken from this habitat for medicinal purposes.

1. Introduction

Greater celandine, a perennial herb native to Europe and parts of Asia, has an ex-tended medicinal use dating back to Ancient Greece and Rome. As a medicinal plant, it has attracted the interest of researchers. The results of research on its use in various ailments have been widely published, and, recently, these findings have been summarized in articles [1,2,3,4,5,6,7]. Traditionally, greater celandine was valued for its ability to treat a wide range of disorders, and its use spanned many centuries across different cultures. The plant’s name is derived from the Greek word chelidōn, meaning “swallow”, as it was believed to bloom when the swallows returned in spring and wither when they left in autumn. This species is also known under many different names [4,8,9]. Ancient physicians used its sap to treat cataracts and other eye ailments. During medieval times, greater celandine was a prominent herb in the European pharmacopoeia. In China, Chelidonium majus has been used for centuries to treat liver and digestive disorders and it is also known as a heat-clearing herb [1,5]. The plant was also combined with other herbs to treat inflammation, abscesses, and various skin problems [6,8]. Today, greater celandine continues to be used in herbal medicine, though with more caution due to its potential toxicity. Modern scientific studies have explored its bioactive compounds, particularly alkaloids like chelidonine, berberine, and sanguinarine, known for their medicinal effects [2]. Ch. majus is still used for disorders and treatments, such as in the case of liver and gallbladder support [10], digestive tract issues, and gastrointestinal issues [11,12]. It also has anti-microbial and antiviral effects [1,4,13,14], can be used for skin treatments, and has anti-inflammatory and analgesic properties [15,16]. Although the species has significant potential medicinal properties, it also contains toxic compounds in excessive doses (like coptisine, chelerythrine, sanguinarine, chelidonine, protopine), and the alkaloids in the plant can cause damage to internal organs [4,5,6].
The medicinal significance of Ch. majus is strictly connected with its phytochemical profile, which is complex, containing a wide variety of bioactive compounds [5,17]. The main classes of compounds found in Ch. majus include alkaloids, flavonoids, phenolic acids, and various other secondary metabolites [2]. Ch. majus is rich in isoquinoline alkaloids (chelidonine, coptisine), flavonoids (quercetin, rutin), phenolic acids (caffeic acid, ferulic acid), and saponins, which are glycosides with surfactant properties [4,17,18,19,20], and most studies are devoted to the phytochemistry of Ch. majus.
Chelidonium majus, primarily known for its alkaloids and other organic compounds, also contains various minerals that contribute to its overall medicinal value. These minerals play a key role in metabolic processes and are essential for maintaining normal physiological functions in the body. Studies have determined the concentrations of major and trace elements in various medicinal plant species from different ecological niches, focus-ing on mineral contamination in plant tissues [21,22,23] and the physiological significance of Mg, Ca, K, Na, Al, and Fe in the growth and development of medicinal plants [24,25]. In the case of Ch. majus, similar studies were also conducted [8,9,26,27,28,29].
The study of the mineral composition of plants and soils is essential for assessing the transfer of metals from soil to plants. The chemical composition of the soil is often mirrored in that of plants. Minerals absorbed and accumulated by plants are transported to the human body through nutrition and play an important role in the physiological processes of organisms [30,31]. The role and importance of both trace elements and major elements in maintaining health have been known for a long time [26,32,33], and their monitoring is recommended, especially if it concerns medicinal plants. The contamination of medicinal plants with potentially toxic metals has also been described [34], including in the aboveground and underground parts of Ch. majus and the soil in which this species develops [8,9,29]. On the other hand, the broad-spectrum elemental composition of Ch. majus has not been thoroughly studied so far. Earlier attempts were made to analyze major and trace elements in medicinal and aromatic plants in different regions of the world [23,35,36,37,38,39,40,41,42,43,44], and most of these studies concerned the content of Zn, Pb, Mn, Cu, Co, and other heavy metals. Other studies, to a small extent, concerned the content of major elements such as Ca, Mg, Na, P [45], and trace elements (except heavy metals) in Ch. majus, except for the work of Tolgyesi [26], which examined some minerals in this species (Ca, K, Na, P, Fe, Zn, Cu, Mo); apart from that, no additional information is available. Therefore, the conducted research is enriched with information on the elemental composition of the tissues of Ch. majus, which has not been studied so far. Additionally, the geoaccumulation index (Igeo) is used to assess the degree of contamination of soil and sediments with metals and trace elements. It is used in environmental geochemistry to determine to what extent the concentration of a given element in a sample is higher than its natural geochemical background and it thus facilitates the identification of the degree of anthropogenic impact on the environment. Environmental indicators (enrichment factor EF) were used to analyze differences in the content of the major elements (Ca, Mg, Na, K, Fe, P, Al, S) to show the sources of the elements (22, 29, 38).The aim of the research was to determine and compare the chemical composition of parts (leaves, stems, roots) of Chelidonium majus and the soil developing under its tufts in terms of the content of macro- and microelements in urban parks.

2. Materials and Methods
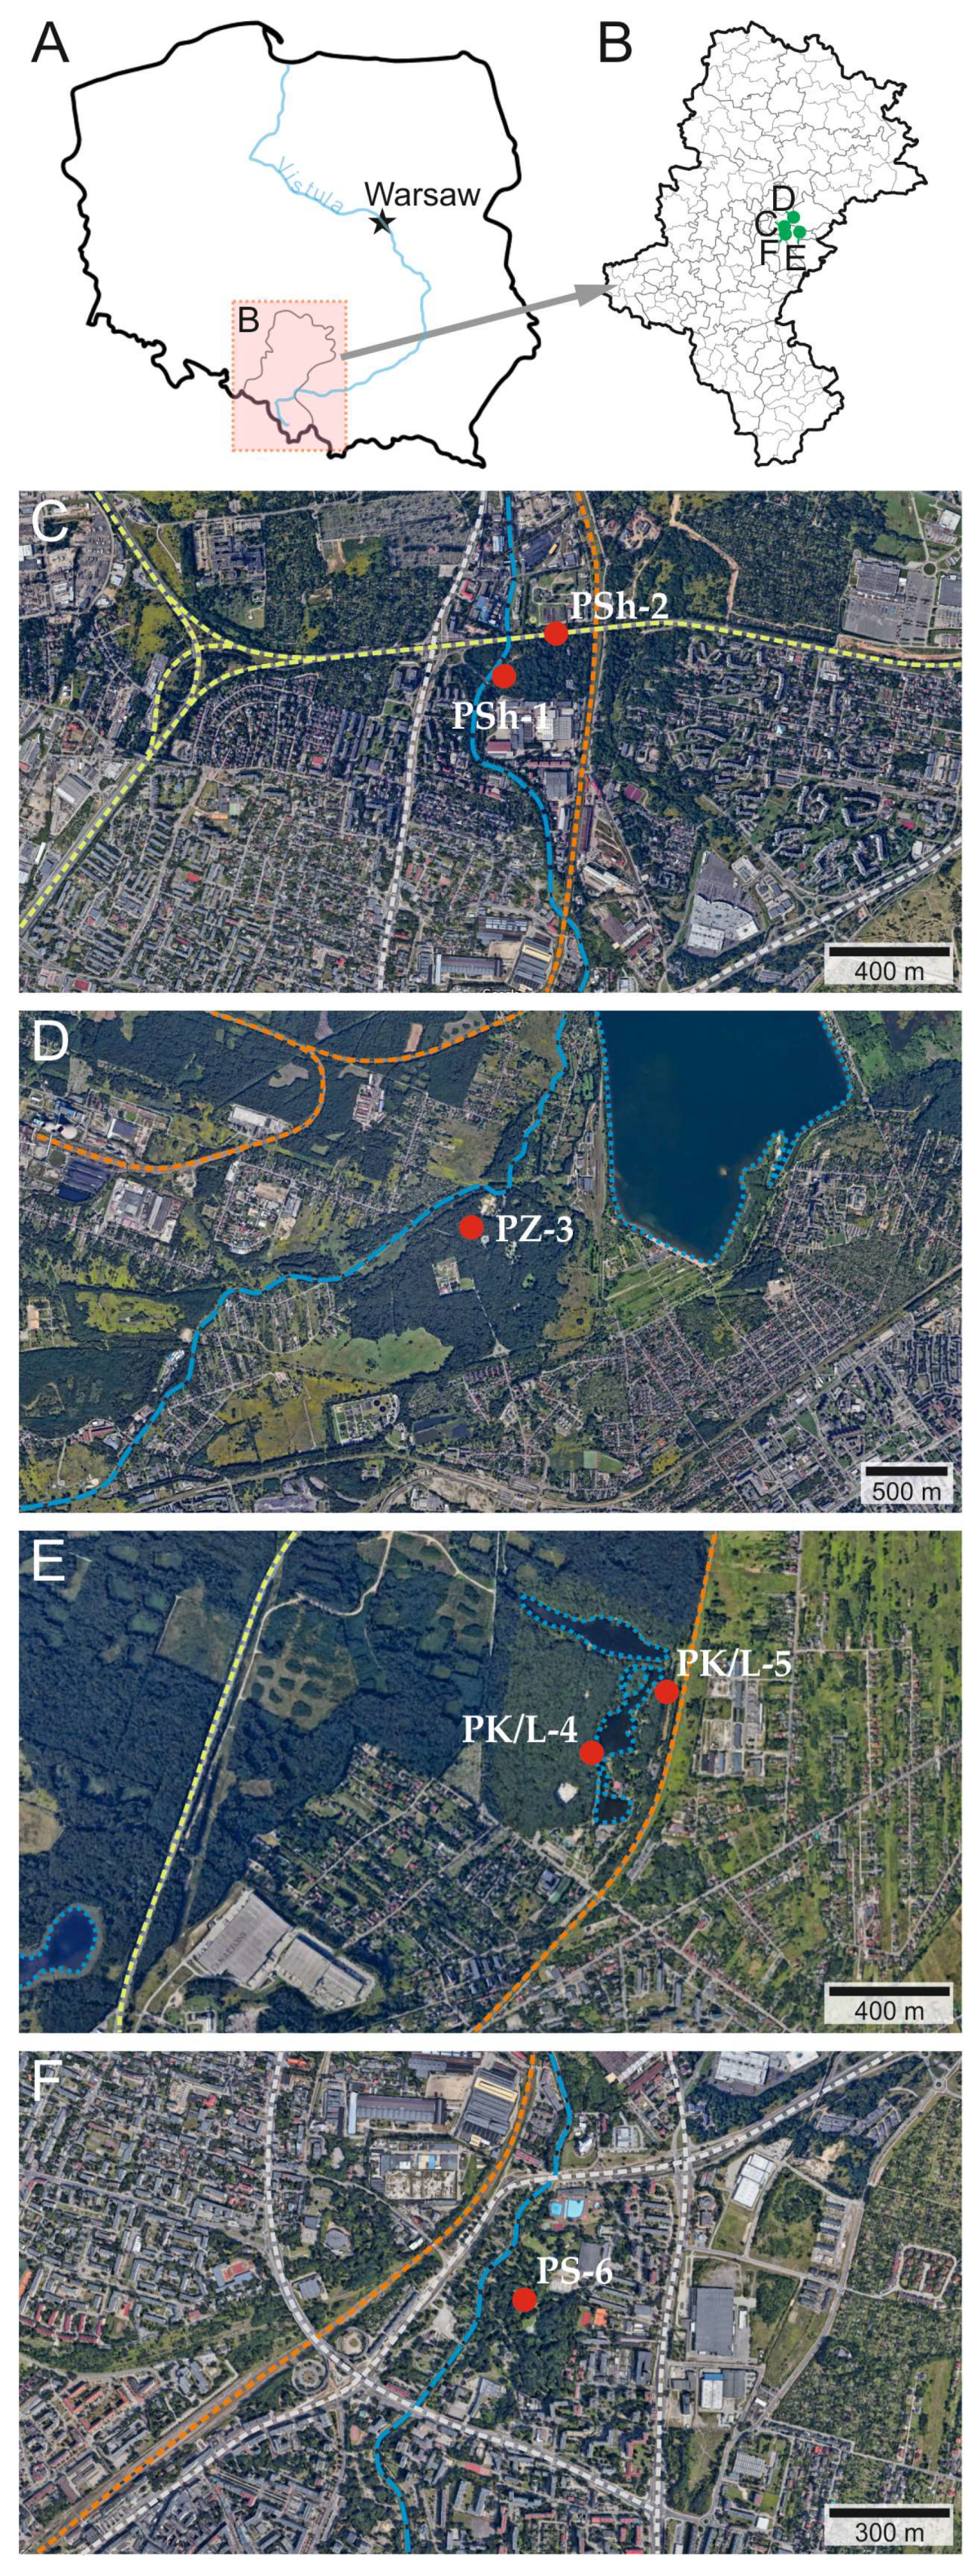
2.1. Study Area

The research was conducted in parks located in the industrialized region of southern Poland (Figure 1). These cities have historically been, and continue to be, associated with the mining and metallurgical industries. This industry activity has significantly influenced the plant landscape and contributed to the formation of soil features. Samples were collected from city parks in Sosnowiec, including: Park Shöen (PSh-1, PSh-2: 50°17′57.99″ N 19°08′20.76″ E), Park Leśna, also known as Park Kuronia (PK/L-4, PK/L-5: 50°18′01.05″ N 19°14′29.87″ E), and Park Sielec (PS-6: 50°16′59.08″ N 19°08′34.82″ E). Additionally, samples were taken from Park Zielona in Dąbrowa Górnicza (PZ-3: 50°20′41.79″ N 19°10′56.63″ E). All locations are situated in the Silesian Upland macroregion.
The parks studied vary in age, area, and degree of development, particularly regarding greenery and park infrastructure. However, they share the common feature of being located in areas influenced by industrial activity and urban transportation, and the local communities regularly use them for sports and recreational purpose. These parks serve a variety of functions, including biocenotic, sports, recreational, economic, cultural, and entertainment roles. The park vegetation is diverse, with species differing in habitat requirements, and it represents semi-natural habitats (PZ-III), transforming habitats associated with park infrastructure completely. The main element of the parks is dendroflora of foreign origin. Chelidonim majus grows on the park’s edge in exposed places, often alongside nitrophilous species growing on anthropogenic soil [8,9,29].

2.2. Plant and Soil Martials Sampling

For laboratory tests, plant material of leaves, stems (above-ground), and roots/rhizome (underground) was collected at the end of the growing season. At the turn of September and October 2023, samples of plant material of the species Ch. majus were collected in the maturing phase, growing in city parks. Five individuals of Ch. majus were collected at one location and mixed to obtain one sample. The sample was then ground and subjected to further laboratory testing. A similar approach was followed at another study site, where 30 plant material samples were collected. Initial sample preparation for analysis included washing the plant material with distilled water, drying it at room temperature, and then homogenizing it; the plant sample preparation procedures were carried out according to the protocols presented by MacNaeidhe [46] and Markert [47].
The soil samples were taken directly from the tufts of Ch. majus specimens, and the soil was shaken off the roots of this species. As in the case of plants from a single site, five soil samples were taken and mixed into one sample, which was then sent for laboratory analysis.
The total elemental composition of macro- and microelements such as Ca, Mg, Na, K, Fe, P, Al, S, Ti, Mo, Ag, U, Au, Th, Sb, Bi, V, La, B, W, Sc, Tl, Se, Te, Ga, Cs, Ge, Hf, Nb, Rb, Sn, Ta, Zr, Y, Ce, In, Be, and Li in plant material and soil was measured by ICP-OES (inductively coupled plasma optical emission spectrometry) after wet mineralization in aqua regia (3HCl + HNO3). Vegetation analyses were performed using a 1 g split digested in HNO3 and then aqua regia, and then there was analysis for ultralow detection limits. The prepared soil samples were digested to complete dryness with an acid solution (H2O-HF-HClO4-HNO3). HCl (50%) was added to the residue and heated using a mixing hot block. After cooling, the solutions were transferred and brought to volume using dilute HCl. The analyses were carried out in the Acme Laboratory in Canada (www.bureauveritas.com, accessed on 13 April 2025) using the AQ250_EXT (soil samples) and VG105_EXT (leaves, stems, and rhizomes) procedures with 5 g samples
The total nitrogen (Nt) content in the leaves, rhizomes, and stems were determined using the Kjeldahl method. All of the plant and soil samples were analyzed in triplicate for all of the parameters studied, and mean values were calculated.

2.3. Analytical Studies of Soil–Plant Composition by Indices

The content of selected major and trace elements in the tissues of Ch. majus and the soil developing beneath it was analyzed.
The geoaccumulation index (Igeo) is determined by the formula:
I g e o = l o g 2 ( C n 1.5 B n ) ,
where Cn is the concentration of the element being tested in the sample, Bn is the geochemical background value, and 1.5 is a correction factor that takes into account natural fluctuations in the levels of elements. The content of elements in the upper continental crust is given as a reference value [48].
The enrichment factor (EF) is commonly used in environmental metal contamination studies to identify anthropogenic sources caused by industrial activities, agriculture, mining, and other human activities [49]. The formula is as follows:
E F = [ C m e t a l / C n o r m a l i z e r ] s o i l [ C m e t a l / C n o r m a l i z e r ] c o n t r o l ,
where Cx is the metal content and Cref is the background concentration of the reference element in the natural baseline sample.
The contamination factor (CF) can be calculated using the following formula [50]:
C F = C n B n ,
where Cn is the element content in the examined soil, and Bn is the background concentration of the same element [48].
The bio-accumulation factor (BAF) can be employed to quantify the element accumulation efficiency in plants by comparing the concentration in the plant and soil.
B A F = C b C s ,
where Cb and Cs are heavy metal concentrations in aerial parts of the plant and in soil, respectively. BAF was categorized as <1 for excluders, 1–10 for accumulators, and >10 for hyperaccumulators [51,52].
The translocation factor (TF) was calculated according to the formula:
T F = C n R n ,
where Cn is the element content in the above-ground parts of the plant, and Bn is the concentration of the same element in the roots [53,54]. The results distinguish four classes: low contamination factor (<1), moderate contamination factor (1–3), considerable contamination factor (3–6), and very high contamination factor (>6).

2.4. Statistical Analysis

In this study, Pearson’s linear correlation analysis was used to determine the strength and direction of the linear relationship between the selected plant and soil parameters. This analysis examined the relationships between parameters such as the content of macro- and microelements in the soil and in the tissues of Ch. majus (stem, leaves, roots). Pearson’s linear correlation allows for the determination of whether changes in soil parameters are associated with changes in plant parameters, which helps to better understand the cycle of elements in the plant–soil system. Additionally, a statistical significance test was conducted for each calculated correlation at a significance level of p < 0.05 [55]. All statistical analyses were performed using SPSS Statistics 14.0 software.

3. Results

3.1. The Concentration of Major Elements in Ch. majus and Soil

Regarding elemental composition, the examined parts of Ch. majus show clear differences (Table 1). Among the macronutrients, Ca and K have the highest content in all tissues. Their leaf content range from 24,700 (PZ-3) to 40,700 (PS-6) mg·kg−1, while in soil, they range from 6500 to 15,000 mg·kg−1. Considerable values of Mg (3500–4500 mg·kg−1), Fe (700–17,000), K (35,000–50,000), and P (3100–5100 mg·kg−1) were also found in the leaves, and their concentrations (range) in soil were 1700–4500 mg·kg−1 (Mg), 10,700–27,600 (Fe), 700–1200 (K), and 600–1100 mg·kg−1 (P). Low values of Al (100–500 mg·kg−1) and Na (100 mg·kg−1) occur in the leaves compared to the other elements tested. High values of Al (5100–9800 mg·kg−1) are found in soils (Table 1). Sulfur has mostly similar contents (except for PSh-1, PSh-2, PK\L-4,5) in Ch. majus leaves; its concentrations at all sites are in the range (2200–3700 mg·kg−1).
The elemental content of the Ch. majus stem varied at all sites (Table 1). Among the analyzed elements, the highest concentration was found for potassium and its highest value, >100,000 mg·kg−1, was observed at sites PSh-1, PSh-2, and PZ-3, while at the other sites, its range was from 53,100 to 63,000 mg·kg−1. Another element with significant content in the stem was calcium (Ca), and, on average, its concentration was 3–4 times lower, and in one case (PS-6), even 6 times lower than in the leaves (Table 1). Similar patterns were observed for P, Mg, Fe, and S, where the concentrations in the stem were lower compared to those in the leaves. The total nitrogen (Nt) content did not show any significant differences in the roots (2.783%), leaves (2.296%), and stems (2.469%) of greater celandine.
The rhizomes of Ch. majus accumulated the most K and Ca, with a range of 22,800–29,900 mg·kg−1 (K) and 5400–8900 mg·kg−1, respectively. With the exception of site PS-6, where Fe concentration was 1100 mg·kg−1, Fe was found in higher concentrations in the roots than in the leaves and stems. A similar trend was observed at most sites for P, where its concentration was higher in the roots than in the leaves and stems, while Al consistently showed high values in the roots and was not translocated to the stems. Iron and aluminum exhibited high concentrations in the soil at all sites, several times higher than the concentrations found in the leaves, stems, and roots of Ch. majus combined. In contrast, the concentrations of Ca, P, Mg, K and S, were much higher in the plant than in the soil.

3.2. Concentration of Microelements in Tissues of Chelidonium majus and Soil

The content of microelements in the individual parts of Ch. majus (leaves, stems, and roots) varied, as shown in Table 2. In most cases, high concentrations of Mo, Sr, B, Ba, Rb, Sn, and Re (present only in leaves) were found. In contrast, Ag, Co, Ti, Tl, Ga, Zr, Y, Ce, Be, and Li were detected in the roots. The remaining elements analyzed were present in trace amounts and were below detection limits (Table 2).
As for the content of trace elements and rare earth elements in the soil under the tufts of Ch. majus, there was substantial variation, and their small amounts were also reflected in the composition of Ch. majus tissues (Table 2). In the analyzed samples from all locations, silver and antimony exceeded the geochemical background (Table 2), with their values ranging from 179 to 619 mg·kg−1 and 0.94 to 9.92 mg·kg−1, respectively. Bismuth, selenium, lithium (except PK/L-4,5), tin (PSh-1, PSh-2, PS-6), beryllium (PSh-2), and palladium (PSh-2, PS-6) also exceeded the acceptable thresholds.

3.3. Environmental Indicators

Table 3 shows an analysis of the variation in the geo-accumulation index (I-geo), enrichment factor (EF), and contamination factor (CF) for individual sites for the major elements. Negative values were obtained in almost all samples, indicating the absence or low content of these elements, whereas positive values suggested their increased contribution as contaminants. The lowest values for most elements, such as Na, show a very low index (e.g., PSh-1: −8.59, PSh-2: −7.91), suggesting no significant contamination. The highest values were obtained for S at locations PSh-1 (0.55) and PK/L-4 (0.33), indicating low contamination with this element.
Enrichment factor (EF) (Table 3) indicates the degree of enrichment of an element relative to a standard (usually iron) from an anthropogenic source. The higher the EF, the higher the contamination. The enrichment values for the element S values were highest, especially at sites PK\L-4 (2.89), PK\L-5 (3.33), and PS-6 (2.20). P also had high values at sites PK\L-4 andPK\L-5 at 2.39 and 4.56, respectively. This indicates significant and increasing enrichment of these elements from external sources.
Contamination factor (CF) analysis indicated that the soil does not contain an excess of major elements; only low to moderate contamination was found in the case of S (PS-6: 2.20, PK\L-4: 1.89), and P (1.14–1.58) (Table 3). The PK\L-4 and PK\L-5 sites showed significantly higher contamination rates than the others, especially with respect to the elements P and S.
Bioaccumulation values refer to the ability of organisms (most often plants) to accumulate elements in their tissues from the environment. According to the BAF category, Ch. majus is an excluder (Fe, Al, and Na), accumulator (Ca, Mg, and S), and hyperaccumulator (P and K, Table 4) in relation to the elements analyzed at the studied sites. As mentioned above, translocation values describe the ability of elements to move within plants, i.e., between roots and shoots. The highest translocation values were found for Ca (5.51) and Mg (1.90), indicating that they are efficiently transported within plants. Fe (1.23) and P (1.74) also showed a relatively high ability to move. No translocation or limited transport were observed for Al (0.81) and Na (0.95).

3.4. Analysis of the Correlation of Major Element Content in the Plant–Soil System

The highest correlations were found between the magnesium (Mg) content in leaves and the phosphorus (P) content in soil (Mg-P = 0.8662). This strong positive correlation suggests that an increase in phosphorus content in the soil is strongly associated with an increase in magnesium content in the leaves. A strong positive correlation was also observed between sulfur (S) and iron (Fe) (S-Fe = 0.7768) as well as sulfur (S) and potassium (K) (S-K = 0.7351) in the leaves and soil. Additionally, a high positive correlation was found between aluminum (Al) and iron (Fe) (Al-Fe = 0.6885), magnesium (Mg) and calcium (Ca) (Mg-Ca = 0.6278), and magnesium (Mg) and phosphorus (P) (Mg-P = 0.6352) in the rhizomes and soil. This indicates a relationship between the content of these elements in both the soil and rhizomes of Ch. majus. Similar correlations were found in the stems and soil for sulfur (S) and aluminum (Al) (S-Al = 0.6556) as well as sulfur (S) and sodium (Na) (S-Na = 0.6987). Other relationships are presented in Table 5.
The smallest correlations were found between phosphorus (P) and iron (Fe) (P-Fe = 0.0735) in the leaves and soil. The correlation of 0.0649 between phosphorus and iron indicates a lack of a significant relationship between iron content in the soil and phosphorus content in the rhizomes. Practically no correlation was observed between sulfur (S) and phosphorus (P) (S-P = 0.0035) regarding phosphorus content in the soil and sulfur content in the leaves (Table 5).

3.5. Analysis of Correlation of Microelement and Rare Earth Metal Content in the Plant–Soil System

The correlation coefficients regarding the content of trace elements within the studied tissue of Ch. majus indicate significant variability (Table S1). A strong correlation was observed between the soil and rhizome for elements such as Zr, which strongly correlates with soil elements like Mo (0.924), Co (0.966), U (0.959), Th (0.929), V (0.923), and W (0.900). A high and statistically significant correlation was found in the stem–soil system for Sr-Li (0.905), W-Sn (0.913), Sb-Ag (0.890), G-Ag (0.837), and others (Table S2). The relationship between soil elements and leaves was identified for parameters such as Sr-Mo (0.970), Sb-Ag (0.962), Ge-W (0.993), and others (Table S3). Overall, the system of dependencies within plant tissues and soil element content for trace elements is highly diverse, which may be linked to the soil materials (parent rock), which, in most cases, in urban parks are of anthropogenic origin. Often, during the construction of urban parks, the soil has been transported from other areas and composting sites.
The concentrations of metals in the analyzed tissues and soil are arranged in the order given in Table 6. In the chemical composition of the leaves and rhizomes of Ch. majus, K ranks first in the order in all of the analyzed tissues. Ca ranks second in both tissues and soils. The order of elements in soils is slightly different (Table 6). The plants show selective uptake of elements from the soil, concentrating those that are most needed for their functioning. The distribution of elements in the plant varies depending on the part of the plant (Table 6). In leaves, boron (B), in stems, rubidium (Rb), and in rhizomes and soil (in all locations), silver (Ag) rank first in terms of content (Table 2). The next elements with significant values in the order are Ba and Sr.

4. Discussion

The elemental composition of Ch. majus has not been studied in detail to date, despite its status as a medicinal plant. Essential elements play a crucial role in plant metabolism, with some (Ca, Fe, Mg, P, S, K) being more significant than others (Al, Na) depending on the habitat [56]. Macroelements in the tissues of various plant species usually accumulate in the order K > Ca > Mg. Depending on the growth conditions, the calcium contents in plants can vary greatly, ranging from 0.1 to more than 5% Ca in the plant dry weight. Ca concentration in old leaves sometimes can reach more than 10% calcium in the dry matter without showing serious symptoms of growth inhibition [57]. They are called basic macroelements in higher plants due to the high demand for these elements for plant growth [36,57]. Element content in plant tissues depends on many factors, such as the parent rock, soil type, anthropogenic sources, available forms of elements, plant species, and plant part (leaves, stems, roots). Studies on the mineral composition of Ch. majus, which have been published earlier, and our results show significant similarity and are partly consistent with the literature data [26,45,58]. Calcium (Ca) is a key structural element that stabilizes cell walls and membranes, regulates enzyme activity, and participates in cell division and elongation, which is why its share is higher than other elements [57]. In analyzed urban parks, Ca is usually stored in more significant amounts in leaves (25,100 mg·kg−1—PK\L-5 and 40,700 mg·kg−1—PS-6) than in stems (6300 mg·kg−1—PS-6, 9700 mg·kg−1 PSh-1) and roots (5400 mg·kg−1—PS-6; 8900 mg·kg−1 PSh-2, Table 1), and plants take it up from the soil as Ca²⁺ cations. Ca is relatively immobile in the phloem, accumulating in older parts of the plant, and fruits generally contain lower Ca levels than leaves [57]. The results of Ca content in Ch. majus tissues obtained by Sárközi et al. [26] differ from the results in this work. These authors found high Ca content in roots (19,240 mg·kg−1) and lower content in leaves (11,871 mg-kg−1), while in this study, the situation is reversed (Table 1). Similar contents of K (22,800 mg·kg−1) in the rhizome and Ca (25,100 mg·kg−1, in the leaves), as in the case of Ch. majus, were found in medicinal plants such as Spondias mombin L. and Zingiber officinale Rosc. [59], while Chizolla & Franz [36] show calcium content in Artemisia dracunculus L. (Ca: 8160 mg·kg−1) and Plantago lanceolata L. (Ca: 48,000 mg·kg−1). A high concentration of Ca in therapeutic plants has also been demonstrated by other authors [60,61].
The iron (Fe) and potassium (K) content results obtained in this study are several times higher than those reported in other studies (Table 1) [26], as displayed by the case of the aboveground part, where the average Fe value was 11,112 mg·kg−1; in the roots a similar result was obtained (1088 mg·kg−1). Low potassium content was noted in the aboveground part (33,054 mg·kg−1) and it was higher in the underground part (46,733 mg·kg−1) of Ch. majus; an inverse relationship was found in this study. Potassium (K) is usually found in the highest concentrations in plant tissues (>100,000. Table 1) and performs many metabolic functions (enzyme activation, protein synthesis, photosynthesis, phloem transport, osmoregulation, etc.). K is easily mobile in the phloem and can be redistributed within the plant [57]. The variation in plant iron and potassium content depends on their available form in the soil. In this case, anthropogenic soils are characterized by a high content of various elements in the soil, with most of these elements originating from anthropogenic sources [62]. The potassium concentration in Ch. majus was consistent with previous studies on medicinal herbs [61,63,64].
Studies by other authors [26] have reported higher Mg content in Ch. majus roots (3148 mg·kg−1) compared to the results of this study (Table 1), while a lower Mg content was observed in leaves (1785 mg·kg−1), while, in this study, the range of Mg was from 3500 mg·kg−1 to 4500 mg·kg−1. Mg is absorbed from the soil as Mg²⁺ cations. Magnesium (Mg) is a chlorophyll component involved in enzyme activation and carbohydrate partitioning. The average range of Mg content in green tissues is 0.15 to 0.35% on a dry weight basis [57]. The Mg content observed in Ch. majus in this study aligns closely with earlier findings [36,39,61,65].
Sodium (Na) and aluminum (Al) play a marginal role in plant metabolism, and, therefore, their content in plant tissues is low [57]. Sárközi et al., [26] reported similar results to those obtained in this study, with a low Al content (164.5 mg·kg−1) and Na content (214 mg·kg−1) in leaves and roots (Al: 964.7 mg·kg−1; Na: 484 mg·kg−1). These values are generally higher than those observed in this study, except for the aluminum content in the leaves. Other studies have also confirmed the low sodium content in plants [61].
Phosphorus (P) is a key component of nucleic acids, essential for storing and transmitting energy in plant cells, and it also affects root growth and flowering [66]. The obtained results (Table 1) are consistent with previous studies [26,45,58], which report an average value of phosphorus in leaves, where it is 5383 mg·kg−1 and 3609 mg·kg−1 in roots. The studied soils are rich in phosphorus, which enters the soil, among other matter, as a result of the fertilization of parks [8,9,29] and biomass decomposition. Phosphorus is absorbed by plants from the soil in the form of phosphate anions (H2PO4⁻ and HPO42−).
Sulfur (S) is a component of amino acids, vitamins, and enzymes, essential for protein synthesis and detoxifying heavy metals in plant cells [67]. Sulfur in plants can occur in amounts from several to several dozen mg·kg−1 of dry mass. This corresponds to the tested samples, where the S content in the leaves varied from 2200 mg·kg−1 to 3300 mg·kg−1 (Table 1). Sárközi et al., [26] reported average S values in leaves (2850 mg·kg−1) and roots (2265 mg·kg−1). The sulfur content in the roots observed in that study was higher than the values obtained in this work (Table 1).
The chemical composition of urban soils, including those in the studied urban parks, is shaped by both natural and anthropogenic soil-forming processes. These processes involve the input of substances from various sources that influence the soil’s physicochemical properties [8,9,29,68]. In urban environments, the sources of the main elements, such as calcium (Ca), iron (Fe), magnesium (Mg), potassium (K), sodium (Na), phosphorus (P), sulfur (S), and aluminum (Al), are diverse and can come from both natural and anthropogenic processes. The most important sources of element supplies include construction materials, ash from furnaces and the combustion of fossil fuels, industrial waste (Ca, Mg, Al), metallurgy, steel industry, dust and pollution from road traffic, metal waste (Fe, Mg, Al), organic waste, fertilizers, detergents, municipal waste (P), road de-icing agents (Na), the combustion of fossil fuels containing sulfur, and emissions from road transport (S). All of the examined sites are located in the areas of historically industrial cities along rail and road transport routes, which affects the soil conditions in the analyzed city parks [29,33,69].
The boron (B) content in Ch. majus roots (22.69 mg·kg−1) reported by Szentmihályi et al. [40] is similar to our results (average 27.33 mg·kg−1), with almost three-fold higher values obtained in the case of the stem. In turn, low B values in roots (18.7 mg·kg−1) and leaves (12.39 mg·kg−1) were presented by Sárközi et al., [26] and, in this study, they were twice as high, and, in the case of leaves, many times higher (Table 2).
Cobalt occurs in small amounts in leaves and in more significant amounts in roots; other authors have found such regularities [26,40]. Similarly, Li values were recorded in leaves (L: 0.52 mg·kg−1), roots (R: 3.17 mg·kg−1), Mo (L: 0.12 mg·kg−1, R: 3.17 mg·kg−1), and Ti (L: 4.13 mg·kg−1, R: 20.24 mg·kg−1) by the authors mentioned above [26,40]. Sárközi et al., [26] reported vanadium (V) content in the aerial part of Ch. majus (1.05 mg·kg−1) and roots (2.07 mg·kg−1); however, this element was not detected in our study. Similar Mo concentrations in Ch. majus (Table 2) were found in medicinal plants such as Cynoglossum furcatum Wall. (L: 158 mg·kg−1, R: 0.302 mg·kg−1) and Thalictrum foliolossum DC (L: 0.211 mg·kg−1, R: 0.156 mg·kg−1) [70].
The Se content in Alchornea cordifolia Schum. & Thonn. is 8.50 mg·kg−1 [59], compared to Ch. majus 0.70 mg·kg−1 in leaves. The authors of this study also noted higher Ti values in Acalypha wilkensiana Müll. Arg. (475.2 mg·kg−1) and Aframomum melegueta (Roscoe) K. Schum (778.5 mg·kg−1). In Ch. majus, the Ti content is in the range of 4.00-19.0 mg·kg−1 in the aboveground part of the plants, while the content of this element in the soil is on average 0.02 mg·kg−1. Similar results were obtained in the range of results for Rb in Datura metel L. (41.1 mg·kg−1) and Colotropis procera (Aiton) Dryand. (30.1 mg·kg−1), with the Rb content in the aboveground part of Ch. majus ranging from 17.0 to 70.0 mg·kg−1. In the case of V, different results varied for different species, ranging from 21.1 to 320 mg·kg−1 [59], whereas in Ch. majus, only 2.00 mg·kg−1 was found only once in roots (PSh-2). Similarly, Sr in Chelidonium majus has similar values (Table 2) to Momordica charantia L. (73.2 mg·kg−1) and Mangifera indica L. (59.3 mg·kg−1) with respect to strontium and antimony.
Strontium (Sr) and antimony (Sb) show high correlations between the soil and tissues of Ch. majus and other elements (e.g., Mo, Li, La, Ge, Table S1). This high correlation may result from a common source of pollution from human activity (the metallurgical industry, mining, or car exhausts). Sb comes from fuel combustion and brake pad wear [68,69]. Sr is emitted from the ceramic and chemical industry, phosphate fertilizers, and some sources of industrial dust, to which city parks are exposed, mainly since they occur in city centers and along communication routes. These elements (Sr and Sb) have similar mobility in soil due to a low soil reaction (pH). These elements can bind to similar mineral phases in the soil, such as clay, iron and manganese oxides, which may cause their co-occurrence [71].

4.1. Environmental Indices

The I-geo analysis showed the degree of occurrence of the main studied elements in relation to the geochemical background. Almost all I-geo results have negative values and indicate that the elements are not present in excess. Previous I-geo analysis conducted in the same parks regarding heavy metals indicated that the soil is contaminated to varying degrees from moderate to very contaminated [8,9,29]. I-geo results also confirmed the enrichment factor (EF) and contamination factor (CF).

4.2. Bioaccumulation and Translocation

The analysis has shown that Ca is an element with high bioaccumulation and translocation. This phenomenon is associated with the need to maintain metabolism and functioning in plants [72]. Mg and Fe can also effectively translocate, but Fe is less bioaccumulated. On the other hand, P and K show high bioaccumulation but low translocation, meaning they are intensively accumulated in plants, yet exhibit limited internal movement. The bioaccumulation index shows that Al and Na have a low rates of bioaccumulation and translocation, which may indicate their minor role in plant physiology compared to other elements (Ca, Fe, Mg, and others). In high concentrations, Na and Al are toxic and damage cells, potentially leading to plant death; therefore, they are less absorbed from the soil.

5. Conclusions

Chelidonium majus, as a medicinal plant, grows on the edges of forests and in city parks, on soils transformed by man, whose properties are closely related to human activity. This act can directly or indirectly affect soils’ and plants’ chemical composition by taking the components necessary for growth from the soil. The study shows that the pattern of element distribution differs in the individual analyzed parts of the plant, such as the leaves, stem, and rhizome, both in terms of the value of macroelements and microelements:
  • In all analyzed tissues, the dominant element in terms of content was potassium (K), with the highest value recorded in the stems of Ch. majus, while, in the soil, it had low values;
  • The highest calcium (Ca) content was found in the leaves in all locations, while, in the rhizomes and stems, the values differed between locations. Compared to K, Ca is characterized by a higher value in the soil;
  • The contents of phosphorus, magnesium, and sulfur in tissues and soil are varied, while sodium and aluminum have low values in both the underground and aboveground parts of Ch. majus. The contents of phosphorus, iron, magnesium. and sulfur in tissues and soil are varied. At the same time, sodium and aluminum have low values in both the underground and aboveground parts of Ch. majus, while high contents in the soil characterize Fe and Al;
  • In the case of microelements, boron (B) predominates in the leaves, rubidium (Rb) in the stems, and silver (Ag) in the rhizomes and soil;
  • The results of the analyzed environmental indicators I-geo, EF, and CF did not show (except for a few cases) significant changes in soil enrichment with major elements from external sources;
  • The study found good agreement between the results obtained in this work and the levels of elements in the literature on medicinal plants. However, higher values of some elements (Ba, K) were found in some samples.
Determining the content of elements in terms of macro, micro, and rare earth elements in medicinal plants is important information for several reasons: to check the purity of plant tissues for potentially toxic major elements and to determine the presence of these elements in the soil, because the plant takes them from the soil, and, with a higher content of toxic elements, it may indicate that the plant should not be taken from this habitat for medicinal purposes. By conducting this study, it is also possible to monitor environmental pollution by repeating the study in the same area.

Supplementary Materials

The following supporting information can be downloaded at: https://www.mdpi.com/article/10.3390/app15094718/s1, Table S1: Correlation coefficients between rhizomes and soil; Table S2: Correlation coefficients stems and soil; and Table S3: Correlation coefficients between rhizomes and soil.

Author Contributions

Conceptualization, O.R.; methodology, O.R., D.Ś. and S.P.; validation, O.R., and D.Ś.; formal analysis, O.R.; investigation, O.R.; data curation, O.R.; writing—original draft preparation, O.R.; writing—review and editing, D.Ś., T.K. and N.M.; visualization, O.R. and D.Ś.; supervision, O.R. All authors have read and agreed to the published version of the manuscript.

Funding

This research received no external funding.

Institutional Review Board Statement

Not applicable.

Informed Consent Statement

Not applicable.

Data Availability Statement

The original contributions presented in this study are included in the article/Supplementary Material. Further inquiries can be directed to the corresponding author.

Conflicts of Interest

The authors declare no conflicts of interest.

References

  1. Gilca, M.; Gaman, L.; Panait, E.; Stoian, I.; Atanasiu, V. Chelidonium majus—An integrative review: Traditional knowledge versus modern findings. Forsch Komplementarmedizin 2010, 17, 241–248. [Google Scholar] [CrossRef] [PubMed]
  2. Maji, A.K.; Banerji, P. Chelidonium majus L. (Greater celandine)—A review on its phytochemical and therapeutic perspectives. Int. J. Herb. Med. 2015, 3, 10–27. [Google Scholar] [CrossRef]
  3. Pantano, F.; Mannocchi, G.; Marinelli, E.; Gentili, S.; Graziano, S.; Busardò, F.P.; di Luca, N.M. Hepatotoxicity induced by greater celandine (Chelidonium majus L.): A review of the literature. Eur. Rev. Med. Pharmacol. 2017, 21 (Supp. 1), 46–52. [Google Scholar]
  4. Zielińska, S.; Jezierska-Domaradzka, A.; Wójciak-Kosior, M.; Sowa, I.; Junka, A.; Matkowski, A.M. Greater Celandine’s Ups and Downs−21 Centuries of Medicinal Uses of Chelidonium majus From the Viewpoint of Today’s. Pharmacology. Front. Pharmacol. 2018, 9, 299. [Google Scholar] [CrossRef]
  5. Li, X.; Sun, Y.; Wang, M.; Wang, Z.; Kuang, H. Alkaloids in Chelidonium majus L.: A review of its phytochemistry, pharmacology and toxicology. Front. Pharmacol. 2024, 15, 1440979. [Google Scholar] [CrossRef]
  6. Ciornolutchii, V.; Ismaiel, A.; Sabo, C.M.; Al Hajjar, N.; Seicean, A.; Dumitrascu, D.L. A hidden cause of hypertransaminasemia: Liver toxicity caused by Chelidonium majus L.: Report of two cases of herb-induced liver injury and literature review. Am. J. Ther. 2024, 31, e382–e387. [Google Scholar] [CrossRef]
  7. Borges, A.; Calvo, M.L.M.; Vaz, J.A.; Calhelha, R.C. Enhancing Wound Healing: A Comprehensive Review of Sericin and Chelidonium majus L. as Potential Dressings. Materials 2024, 17, 4199. [Google Scholar] [CrossRef]
  8. Rahmonov, O.; Środek, D.; Pytel, S.; Kupka, T.; Makieieva, N. Accumulation of heavy metals in soil and Chelidonium majus L. in an urban environment. J. Elem. 2023, 28, 1329–1351. [Google Scholar] [CrossRef]
  9. Rahmonov, O.; Środek, D.; Pytel, S.; Makieieva, N.; Kupka, T. Relationships between Heavy Metal Concentrations in Greater Celandine (Chelidonium majus L.) Tissues and Soil in Urban Parks. Int. J. Environ. Res. Public Health 2023, 20, 3887. [Google Scholar] [CrossRef]
  10. Zare, G.; Diker, N.Y.; Arituluk, Z.C.; Tatli Cankaya, I.I. Chelidonium majus L. (Papaveraceae) morphology, anatomy and traditional medicinal uses in Turkey. İstanbul J. Pharm. 2021, 51, 123–132. [Google Scholar] [CrossRef]
  11. European Medicines Agency (EMA) Committee on Herbal Medicinal Products (HMPC): Public Statement on Chelidonium majus L., Herba EMA/HMPC/743927/2010. Available online: https://www.ema.europa.eu/en/documents/public-statement/final-public-statement-chelidonium-majus-l-herba_en.pdf (accessed on 12 February 2025).
  12. Moro, P.A.; Cassetti, F.; Giugliano, G.; Falce, M.T.; Mazzanti, G.; Menniti-Ippolito, F.; Raschetti, R.; Santuccio, C. Hepatitis from Greater celandine (Chelidonium majus L.): Review of literature and report of a new case. J. Ethnopharmacol. 2009, 124, 328–332. [Google Scholar] [CrossRef]
  13. Kokoska, L.; Polensky, Z.; Rada, V.; Nepovim, A.; Vanek, T. Screening of some Siberian medicinal plants for antimicrobial activity. J. Ethnopharmacol. 2002, 82, 51–53. [Google Scholar] [CrossRef] [PubMed]
  14. Zuo, G.; Meng, F.; Hao, X.; Zhang, Y.; Wang, G.; Xu, G. Antibacterial alkaloids from Chelidonium majus Linn (Papaveraceae) against clinical isolated of methicillin resistant Staphylococcus aureus. J. Pharm. Pharm. Sci. 2008, 11, 90–94. [Google Scholar] [CrossRef] [PubMed]
  15. Huang, C.K. The Pharmacology of Chinese Herbs, 2nd ed.; CRC Press: Boca Raton, FL, USA, 1999. [Google Scholar]
  16. Lee, Y.; Kim, S.; Roh, S.; Choi, H.; Seo, Y. Suppressive effects of Chelidonium majus methanol extract in knee joint, regional lymph nodes, and spleen on collagen-induced arthritis in mice. J. Ethnopharmacol. 2007, 112, 40–48. [Google Scholar] [CrossRef]
  17. Kedzia, B.; Łozykowska, K.; Gryszczynska, A. Chemical composition and contents of biological active substances in Chelidonium majus L. Postępy Fitoter. 2013, 3, 174–181. [Google Scholar]
  18. Monavari, S.; Shahrabadi, M.; Keyvani, H.; Bokharaei-Salim, F. Evaluation of in vitro antiviral activity of Chelidonium majus L. against Herpes simplex virus type-1. Afr. J. Microbiol. Res. 2012, 6, 4360–4364. [Google Scholar]
  19. Hao, D.; Gu, X.; Xiao, P. Medicinal Plants Chemistry, Biology and Omics; Woodhead Publishing: Cambridge, UK, 2015; pp. 171–216. [Google Scholar]
  20. Makieieva, N.; Kupka, T.; Spaleniak, G.; Rahmonov, O.; Marek, A.; Błażytko, A.; Pentak, D.; Kuś, P.; Kusz, J.; Książek, M. Experimental and theoretical characterization of chelidonic acid structure. Struct. Chem. 2022, 33, 2133–2145. [Google Scholar] [CrossRef]
  21. Gjorgieva, D.; Kadifkova-Panovska, T.; Bačeva, K.; Stafilov, T. Metalic trace elements in medicinal plants from Macedonia. MEJSR 2011, 7, 109–114. [Google Scholar]
  22. Prashanth, L.; Kattapagari, K.; Chitturi, R.; Baddam, V.; Prasad, L.K. A review on role of essential trace elements in health and disease. J. Dr. YSR Univ. Health Sci. 2015, 4, 75–85. [Google Scholar]
  23. Silva, P.; Francisconi, L.; Gonçalves, R. Evaluation of major and trace elements in medicinal plants. J. Braz. Chem. Soc. 2016, 27, 2273–2289. [Google Scholar] [CrossRef]
  24. Lovkova, M.; Buzuk, G.; Sokolova, S.; Kliment’eva, N. Chemical features of medicinal plants. Appl. Biochem. Microbiol. 2001, 37, 229–237. [Google Scholar] [CrossRef]
  25. Soetan, K.; Olaiya, C.; Oyewole, O. The importance of mineral elements for humans, domestic animals and plants: A review. Afr. J. Food Sci. 2010, 4, 200–222. [Google Scholar]
  26. Sárközi, Á.; Then, M.; Szentmihályi, K. Mineral element content of greater celandine (Chelidonium majus L.). Acta Aliment Hung 2005, 34, 113–120. [Google Scholar] [CrossRef]
  27. Badea, D.N. Determination of potentially toxic heavy metals (Pb, Hg, Cd) in popular medicinal herbs in the coal power plant area. Rev. Chim. 2015, 66, 1132–1136. [Google Scholar]
  28. Szentmihályi, K.; Szőllősi-Varga, I.; Then, M. Elements, alkaloids and antioxidant value of Chelidonium majus L. and the extracts obtained by different extraction methods. Eur. Chem. Bull. 2021, 10, 58–66. [Google Scholar] [CrossRef]
  29. Rahmonov, O.; Kowal, A.; Rahmonov, M.; Pytel, S. Variability of Concentrations of Potentially Toxic Metals in the Topsoil of Urban Forest Parks (Southern Poland). Forests 2024, 15, 1020. [Google Scholar] [CrossRef]
  30. Hantos, M.; Tekes, K.; Szalay, F. Peripheral nociceptin levels in Wilson disease. Acta Pharm. Hung 2002, 72, 260–264. [Google Scholar] [PubMed]
  31. Hegedus, D.; Ferencz, V.; Lakatos, P.; Mészáros, S.; Lakatos, P.; Horvath, C.; Szalay, F. Decreased bone density, elevated serum osteoprotegerin, and β-cross-laps in Wilson disease. J. Bone Miner. Res. 2002, 17, 1961–1967. [Google Scholar] [CrossRef]
  32. Chandra, R. Essential and Toxic Trace Elements in Human Health and Disease; Alan R. Liss Inc.: New York, NY, USA, 1988; pp. 337–346. [Google Scholar]
  33. Kabata-Pendias, A.; Pendias, H. Trace Elementsin Soil and Plants, 3rd ed.; CRC Press: Boca Raton, FL, USA, 2001. [Google Scholar]
  34. De Pasquale, A.; Paino, E.; De Pasquale, R.; Germano, M.P. Contamination by heavy metals in drugs from different commercial sources. Pharmacol. Res. 1993, 27, 9–10. [Google Scholar] [CrossRef]
  35. Jain, L.; Shahoo, R.; Sondhi, S. Analysis for mineral elements of some medicinal plants. Indian Drugs 1992, 29, 187–190. [Google Scholar]
  36. Chizzola, R.; Franz, C. Metalic trace elements in medicinal and aromatic plants from Austria. Angew. Bot. 1996, 70, 52–56. [Google Scholar]
  37. Maday, E.; Szentmihályi, K.; Then, M.; Szőke, É. Mineral element content of chamomile. Acta Aliment. 2000, 29, 51–57. [Google Scholar]
  38. Leśniewicz, A.; Jaworska, K.; Żyrnicki, W. Macro-and micro-nutrients and their bioavailability in polish herbal medicaments. Food Chem. 2006, 99, 670–679. [Google Scholar] [CrossRef]
  39. Bello, M.; Ibrahim, A.; Ogunwande, I.; Olawore, N. Heavy trace metals and macronutrients status in herbal plants of Nigeria. Food Chem. 2004, 85, 67–71. [Google Scholar]
  40. Szentmihályi, K.; Marczal, G.; Then, M. Medicinal plants in view of trace elements. Thaiszia J. Bot. 2006, 16, 99–107. [Google Scholar]
  41. Ebrahim, A.; Eltayeb, M.; Khalid, H.; Mohamed, H.; Abdalla, W.; Grill, P.; Michalke, B. Study on selected trace elements and heavy metals in some popular medicinal plants from Sudan. J. Nat. Med. 2012, 66, 671–679. [Google Scholar] [CrossRef]
  42. Aziz, M.A.; Adnan, M.; Begum, S.; Azizullah, A.; Nazir, R.; Iram, S. A review on the elemental contents of Pakistani medicinal plants: Implications for folk medicines. J. Ethnopharmacol. 2016, 188, 177–192. [Google Scholar] [CrossRef] [PubMed]
  43. Lemberkovics, É.; Czinner, E.; Szentmihályi, K.; Balázs, A.; Szőke, É. Comparative evaluation of Helichrysi flos herbal extracts as dietary sources of plant polyphenols, and macro-and microelements. Food Chem. 2002, 78, 119–127. [Google Scholar] [CrossRef]
  44. Karahan, F. Evaluation of trace element and heavy metal levels of some ethnobotanically important medicinal plants used as remedies in Southern Turkey in terms of human health risk. Biol. Trace Elem. Res. 2023, 201, 493–513. [Google Scholar] [CrossRef]
  45. Then, M.; Szentmihalyi, K.; Sárközi, Á.; Illés, V.; Forgacs, E. Effect of sample handling on alkaloid and mineral content of aqueous extracts of greater celandine (Chelidonium majus L.). J. Chromatogr. A 2000, 889, 69–74. [Google Scholar] [CrossRef]
  46. MacNaeidhe, F. Procedures and Precautions Used in Sampling Techniques and Analysis of Trace Elements in Plant Matrices. Sci. Total Environ. 1995, 176, 25–31. [Google Scholar] [CrossRef]
  47. Markert, B. Sample Preparation (Cleaning, Drying, Homogenization) for Trace Element Analysis in Plant Matrices. Sci. Total Environ. 1995, 176, 45–61. [Google Scholar] [CrossRef]
  48. Wedepohl, K. The Composition of the Continental Crust. Geochim. Cosmochim. Acta 1995, 59, 1217–1232. [Google Scholar] [CrossRef]
  49. Bern, C.R.; Walton-Day, K.; Naftz, D.L. Improved enrichment factor calculations through principal component analysis: Examples from soils near breccia pipe uranium mines, Arizona, USA. Environ. Pollut. 2019, 248, 90–100. [Google Scholar] [CrossRef] [PubMed]
  50. Okedeyi, O.; Dube, S.; Awofolu, O.; Nindi, M. Assessing the Enrichment of Heavy Metals in Surface Soil and Plant (Digitaria eriantha) around Coal-Fired Power Plants in South Africa. Environ. Sci. Pollut. Res. 2014, 21, 4686–4696. [Google Scholar] [CrossRef]
  51. Baker, A.; McGrath, S.; Reeves, J.; Smith, J. Metal Hyberaccumulator Plants: A Review of the Ecology and Physiology of a Biological Resource for Phytoremediation od Metal-Polluted Soils. In Phytoremediation of Conatminated Soil and Water; Terry, N., Banuelos, G., Eds.; CRC Press: Boca Raton, FL, USA, 2000; pp. 1–23. [Google Scholar]
  52. Sekabira, K.; Oryem-Origa, H.; Mutumba, G.M.; Kakudidi, E.; Basamba, T.A. Heavy Metal Phytoremediation by Commelina benghalensis (L.) and Cynodon dactylon (L.) Growing in Urban Stream Sediments. Int. J. Plant Physiol. Biochem. 2011, 3, 133–142. [Google Scholar]
  53. Álvarez-Mateos, P.; Alés-Álvarez, F.; García-Martín, J. Phytoremediation of highly contaminated mining soils by Jatropha curcas L. and production of catalytic carbons from the generated biomass. J. Environ. Manag. 2019, 231, 886–895. [Google Scholar] [CrossRef]
  54. Dinu, C.; Vasile, G.G.; Buleandra, M.; Popa, D.E.; Gheorghe, S.; Ungureanu, E.M. Translocation and accumulation of heavy metals in Ocimum basilicum L. plants grown in a mining-contaminated soil. J. Soils Sediments 2020, 20, 2141–2154. [Google Scholar] [CrossRef]
  55. Runge, J. Research Methods In Socio-Economic Geography—Elementary Methodology, Selected Research Tools; Wydawnictwo Uniwersytetu Śląskiego: Katowice, Poland, 2007. (In Polish) [Google Scholar]
  56. White, P.; Broadley, M. Calcium in plants. Ann. Bot. 2003, 92, 487–511. [Google Scholar] [CrossRef]
  57. Marschner, H. Mineral Nutrition of Higher Plants, 2nd ed.; Academic Press, Harcourt Press and Co.: London, UK, 1995; p. 889. [Google Scholar]
  58. Tölgyesi, G. A Növények Mikroelem-Tartalma és Ennek Mezőgazdasági Vonatkozásai; Mezőgazdasági Kiadó: Budapest, Hungary, 1969. [Google Scholar]
  59. Obiajunwa, E.; Adebajo, A.; Omobuwajo, O. Essential and trace element contents of some Nigerian medicinal plants. J. Radioanal. Nucl. Chem. 2002, 252, 473–476. [Google Scholar] [CrossRef]
  60. Sheded, M.; Pulford, I.; Hamed, A. Presence of major and trace elements in seven medicinal plants growing in the South-Eastern Desert, Egypt. J. Arid. Environ. 2006, 66, 210–217. [Google Scholar] [CrossRef]
  61. Jabeen, S.; Shah, M.; Khan, S.; Hayat, M. Determination of major and trace elements in ten important folk therapeutic plants of Haripur basin, Pakistan. J. Med. Plants Res. 2010, 4, 559–566. [Google Scholar]
  62. Sen, I.; Peucker-Ehrenbrink, B. Anthropogenic disturbance of element cycles at the Earth’s surface. Environ. Sci. Technol. 2012, 46, 8601–8609. [Google Scholar] [CrossRef]
  63. Badri, M.; Hamed, A. Nutrient value of plants in an extremely arid environment (Wadi Allaqi biosphere reserve, Egypt). J. Arid. Environ. 2000, 44, 347–356. [Google Scholar] [CrossRef]
  64. Özcan, M.; Akbulut, M. Estimation of minerals, nitrate and nitrite contents of medicinal and aromatic plants used as spices, condiments and herbal tea. Food Chem. 2008, 106, 852–858. [Google Scholar] [CrossRef]
  65. Ghani, A.; Ali, Z.; Ishtiaq, M.; Maqbool, M.; Parveen, S. Estimation of macro and micro nutrients in some important medicinal plants of Soon Valley, District Khushab, Pakistan. Afr. J. Biotechnol. 2012, 11, 14386–14391. [Google Scholar] [CrossRef]
  66. Raghothama, K. Phosphorus and plant nutrition: An overview. In Phosphorus: Agriculture and the Environment; Sims, T., Sharpley, A., Eds.; American Society of Agronomy, Inc.: Madison, WI, USA, 2005; Volume 46, pp. 353–378. [Google Scholar]
  67. Narayan, O.; Kumar, P.; Yadav, B.; Dua, M.; Johri, A. Sulfur nutrition and its role in plant growth and development. Plant Signal. Behav. 2023, 18, 2030082. [Google Scholar] [CrossRef]
  68. Hulisz, P.; Charzyński, P.; Greinert, A. Urban soil resources of medium-sized cities in Poland: A comparative case study of Toruń and Zielona Góra. J. Soils Sediments 2018, 18, 358–372. [Google Scholar] [CrossRef]
  69. Li, Z.; Zhang, G.; Liu, Y.; Wan, K.; Zhang, R.; Chen, F. Soil nutrient assessment for urban ecosystems in Hubei, China. PLoS ONE 2013, 8, e75856. [Google Scholar] [CrossRef]
  70. Anal, J.; Chase, P. Trace elements analysis in some medicinal plants using graphite furnace-atomic absorption spectroscopy. Environ. Eng. Res. 2016, 21, 247–255. [Google Scholar] [CrossRef]
  71. Hammel, W.; Debus, R.; Steubing, L. Mobility of antimony in soil and its availability to plants. Chemosphere 2000, 41, 1791–1798. [Google Scholar] [CrossRef] [PubMed]
  72. Beek, B.; Böhling, S.; Bruckmann, U.; Franke, C.; Jöhncke, U.; Studinger, G. The assessment of bioaccumulation. Bioaccumulation–New aspects and developments. In The Book of Environmental Chemistry; Part J, Bioaccumulation, Beek, B., Eds.; Springer-Verlag: Berlin/Heidelberg, Germany, 2000; Volume 2, pp. 235–276. [Google Scholar]
Figure 1. (A) Location of research areas in background of Poland and (B) sampling sites in the Silesian Region; (CF): satellite photos of the sampling sites. Green dot—parks localisation, red dot—sampling points, blue dotted line—watercourses, blue line—water reservoirs, yellow line—railroads, grey lines—larger access roads, orange lines—railway tracks.
Applsci 15 04718 g001
Table 1. The concentration of major elements in leaves, aerial, and underground parts of Chelidonium majus.
FeCaPMg AlNaK S
[mg·kg−1]
Reference Values4.32 *3.85 *0.08 *2.20 *7.96 *2.36 *2.14 *0.07 *
PSh-1Leaves170029,90056004400500100452003200
Stems600970035001700200100>100,000800
Rhizomes180072004500300070010026,5001700
Soil25,70010,600800190085002001200800
PSh-2Leaves70034,4003100410010010043,9003300
Stems400840018001500n.d.100>100,000700
Rhizomes150089003700260050020024,4002000
Soil27,60012,600600210094002001200900
PZ-3Leaves70024,70036003500200n.d.50,0002200
Stems300820021001600n.d.100>100,000700
Rhizomes80085003600290030010026,6001800
Soil14,400650050013005300100700800
PK\L-4Leaves140032,6004800440040010037,7002600
Stems50081004500200020010053,100800
Rhizomes130054004700360060010025,9001700
Soil20,20021,40010004500980090012001800
PK\L-5Leaves80025,1004400450020010046,7002700
Stems50065003000150020010063,000700
Rhizomes70072004300380030010022,8001500
Soil10,70015,00011003200600010012001100
PS-6Leaves80040,70051004300100n.d.35,4002700
Stems600630031001000100n.d.59,200700
Rhizomes110054004800240030010029,9001900
Soil21,00011,0009001700510010011002100
*—values given by Wedepohl [48]—average element concentrations in the Continental Crust.
Table 2. The concentration of micro and trace elements in leaves, aerial, and underground parts of Chelidonium majus.
MoAgCoUAuSrSbBiVLaBaTiBWScTlSe
[mg·kg−1]
Reference Value *1.1 *70 *24 *1.7 *2.5 *333 *0.3 *0.09 *98 *30 *584 *4010 *11 *1 *16 *0.53 *0.12 *
1.3 ** 5.5 ** 87 ** 67 ** 330 **26,0004.4 ** 5 ** 0.25 **
PSh-1Leaves4.7451.000.480.060.8068.800.310.03n.d.0.5629.1018.0055.000.100.100.120.10
Stems0.4728.000.200.020.2040.800.10n.d.n.d.0.2131.808.0026.00n.d.n.d.0.23n.d.
Rhizomes0.76100.000.750.110.2029.600.350.033.000.8832.9023.0025.000.100.200.380.20
Soil2.02619.0010.201.301.9054.909.920.4528.0011.20278.800.01n.d.1.701.900.801.60
PSh-2Leaves3.7951.000.340.010.4096.500.350.03n.d.0.1384.306.0083.00n.d.n.d.0.130.20
Stems0.2819.000.120.02n.d.40.200.10n.d.n.d.0.1053.705.0025.00n.d.n.d.0.25n.d.
Rhizomes0.6265.000.590.10n.d.39.800.410.032.000.5557.6015.0030.000.100.100.300.20
Soil2.75583.0012.201.701.1061.202.410.3452.0011.60215.200.02n.d.0.902.800.651.60
PZ-3Leaves1.8725.000.190.020.3052.200.09n.d.n.d.0.1950.707.0042.00n.d.n.d.0.11n.d.
Stems0.4211.000.10n.d.n.d.27.700.02n.d.n.d.0.0838.804.0025.00n.d.n.d.0.21n.d.
Rhizomes0.5429.000.320.05n.d.30.000.10n.d.n.d.0.3845.8011.0031.00n.d.n.d.0.21n.d.
Soil0.87179.004.000.800.8018.300.940.2115.007.5071.900.01n.d.0.500.800.420.70
PK\L-4Leaves5.4244.000.480.05n.d.64.400.200.04n.d.0.4839.8019.0056.00n.d.0.100.41n.d.
Stems0.6017.000.190.03n.d.24.100.07n.d.n.d.0.1621.3010.0023.00n.d.n.d.0.64n.d.
Rhizomes0.5836.000.590.08n.d.20.300.17n.d.n.d.0.6322.4022.0025.00n.d.0.100.31n.d.
Soil1.57421.0012.001.401.6098.202.840.3327.0012.30232.500.0369.000.802.100.731.60
PK\L-5Leaves1.8728.000.250.03n.d.46.500.150.04n.d.0.2622.209.0075.00n.d.n.d.0.05n.d.
Stems0.3212.000.180.02n.d.22.100.06n.d.n.d.0.2720.708.0023.00n.d.n.d.0.07n.d.
Rhizomes0.2718.000.280.05n.d.26.700.09n.d.n.d.0.3725.3010.0027.00n.d.n.d.0.09n.d.
Soil0.62264.004.900.901.2035.801.090.2616.009.90115.200.01n.d.0.600.800.461.00
PS-6Leaves5.0329.000.190.010.3068.000.320.02n.d.0.1233.607.0086.00n.d.n.d.0.44n.d.
Stems0.5213.000.150.01n.d.19.200.06n.d.n.d.0.1322.807.0021.00n.d.n.d.0.99n.d.
Rhizomes1.1649.000.300.04n.d.18.200.15n.d.n.d.0.3222.7012.0026.000.10n.d.1.07n.d.
Soil1.49515.005.300.701.4035.702.020.3016.006.60197.500.01n.d.0.700.900.861.70
TeGaCsGeHfNbRbSnZrYCeInReBeLiPd
[mg·kg−1]
Reference value *0.00515 *3.4 *1.4 *4.9 *19 *78 *2.3 *203 *24 *60 *0.05 *0.4 *2.4 *18 *0.4 *
22 **
PSh-1Leavesn.d.0.200.070.150.010.0718.400.680.410.511.20n.d.4.000.100.54n.d.
Stemsn.d.n.d.0.030.08n.d.0.0230.600.190.190.180.40n.d.n.d.n.d.0.52n.d.
Rhizomesn.d.0.300.090.150.010.0919.000.360.340.731.70n.d.n.d.0.201.33n.d.
Soil0.044.101.11n.d.n.d.0.578.9033.500.7010.1222.400.042.003.308.90n.d.
PSh-2Leavesn.d.n.d.0.050.06n.d.0.0319.700.310.170.110.30n.d.6.00n.d.0.252.00
Stemsn.d.n.d.0.040.07n.d.0.0231.500.110.120.090.20n.d.n.d.n.d.0.33n.d.
Rhizomesn.d.0.200.070.190.010.0714.500.470.410.511.10n.d.n.d.0.100.63n.d.
Soil0.045.501.210.30n.d.0.579.2012.701.0011.1123.900.0512.005.809.9014.00
PZ-3Leavesn.d.n.d.0.040.03n.d.0.0319.700.140.160.150.40n.d.2.00n.d.0.28n.d.
Stemsn.d.n.d.n.d.0.04n.d.n.d.24.200.040.080.060.20n.d.n.d.n.d.0.15n.d.
Rhizomesn.d.0.100.060.050.010.0412.400.110.230.300.70n.d.n.d.n.d.0.55n.d.
Soil0.031.901.11n.d.n.d.0.547.502.100.503.8315.300.03n.d.0.505.80n.d.
PK\L-4Leavesn.d.0.100.130.050.010.0938.200.240.410.380.90n.d.n.d.n.d.0.95n.d.
Stemsn.d.n.d.0.060.04n.d.0.0350.900.060.180.130.30n.d.n.d.n.d.0.67n.d.
Rhizomesn.d.0.200.080.060.010.0726.000.150.350.521.20n.d.n.d.0.101.35n.d.
Soil0.053.900.96n.d.0.030.959.202.301.6010.1223.100.04n.d.2.4013.6013.00
PK\L-5Leavesn.d.n.d.0.050.040.010.0530.800.220.240.210.50n.d.3.00n.d.0.26n.d.
Stemsn.d.n.d.0.040.040.010.0340.000.100.190.200.50n.d.n.d.n.d.0.23n.d.
Rhizomesn.d.n.d.0.050.040.010.0317.700.130.220.300.70n.d.n.d.n.d.0.31n.d.
Soil0.042.301.19n.d.n.d.0.418.602.600.508.3719.100.03n.d.0.906.00n.d.
PS-6Leavesn.d.n.d.0.150.040.000.0129.600.150.120.100.20n.d.2.00n.d.0.34n.d.
Stemsn.d.n.d.0.110.050.000.0151.100.080.130.120.30n.d.n.d.n.d.0.34n.d.
Rhizomesn.d.0.100.140.130.010.0432.400.120.250.250.60n.d.n.d.n.d.0.58n.d.
Soil0.042.301.25n.d.n.d.0.449.303.100.305.3213.600.03n.d.1.305.1010.00
*—Values given by Wedepohl [48]—average element concentrations in the Continental Crust, **—according to Kabata-Pendias et al. [33]—average element concentrations in soil.
Table 3. The calculated geo-accumulation index (I-geo), enrichment factor, and contamination factor of major elements within examined soils.
FeCaPMgAlNaKS
The geo-accumulation index (I-geo)PSh-1−1.14−2.01−0.13−3.58−4.51−8.59−5.290.55
PSh-2−0.75−1.81−0.76−3.27−3.63−7.91−5.16−0.67
PZ-3−1.69−2.76−0.91−3.96−4.45−9.33−5.94−0.84
PK\L-4−1.20−1.050.06−2.17−3.57−5.47−5.160.33
PK\L-5−2.11−1.560.07−2.66−4.28−8.74−5.16−0.38
PS-6−1.14−2.01−0.13−3.58−4.51−8.59−5.290.55
The enrichment factor (EF)PSh-11.000.431.370.170.130.010.051.01
PSh-2n.d0.480.990.170.140.010.051.06
PZ-3n.d0.471.710.210.150.010.051.80
PK\L-4n.d1.112.390.510.190.050.062.89
PK\L-5n.d1.474.560.690.220.010.123.33
PS-6n.d0.552.010.190.100.010.062.20
The contamination factors (CF)PSh-10.830.361.140.140.110.010.040.84
PSh-20.890.430.890.160.120.010.040.94
PZ-30.470.220.800.100.070.000.020.84
PK\L-40.650.731.560.330.130.030.041.89
PK\L-50.350.511.580.240.080.000.041.15
PS-60.680.371.370.130.070.000.062.20
Table 4. Bioaccumulation (BAF) and translocation (TF) factor values for macroelements.
FeCaPMgAlNaKS
Bioaccumulation0.143.6014.303.590.110.9989.444.23
Translocation1.235.511.741.900.810.952.781.99
Table 5. Correlation coefficients between the content of major elements in the soil and the analyzed tissues of Ch. majus.
Soil
FeCaPMgAlNaK
LeavesCa0.6116
P0.07350.2043
Mg0.13840.66720.8662 *
Al0.17130.30120.23640.3632
Na−0.2675−0.6312−0.3901−0.6186−0.7831
K−0.3501−0.5222−0.4674−0.3624−0.1839−0.468
S0.77680.1020.0035−0.04750.5973−0.08340.7371
StemsCa0.5777
P−0.02630.7141
Mg0.01890.50.0396
Al0.1278−0.508−0.8916 *−0.4883
Na0.0808−0.18010.1762−0.3089−0.5183
K0.3843−0.7005−0.8444 *−0.68240.1098−0.4636
S0.36130.48490.27860.48840.65560.69870.3873
RhizomesCa0.0717
P0.06490.5189
Mg−0.58320.62780.6352
Al0.68850.36460.02450.3104
Na0.5808−0.0243−0.4582−0.14410.4722
K0.2711−0.3237−0.163−0.417−0.3394−0.055
S0.6723−0.3427−0.6738−0.49930.1235−0.1333−0.1713
* Correlation coefficients are significant at p < 0.050.
Table 6. Averaged for all parks and sorted from the highest to the lowest content of elements, individual plant parts and soil.
Major Elements
LeavesK>Ca>P>Mg>S>Fe>Al>Na
StemsK>Ca>P>Mg>S>Fe>Al>Na
RhizomesK>Ca>P>Mg>S>Fe>Al>Na
SoilFe>Ca>Al>Mg>S>K>P>Na
Microelements and rare earth metals
LeavesB>Sr>Ba>Ag>Rb>Ti>Mo>Ce>Li>Co>La>Sn>Zr>Y>Sb>Tl>Cs>Ge>Nb>U>Hf>Ta
StemsRb>Ba>Sr>B>Ag>Ti>Mo>Tl>Li>Ce>La>Co>Zr>Y>Sn>Sb>Ge>Hf>Ta
RhizomesAg>Ba>Sr>B>Rb>Ti>Ce>Li>Mo>La>Co>Y>Tl>Zr>Sn>Sb>Ge>Cs>U>Nb>Hf>Ta
SoilAg>Ba>Sr>V>Ce>La>Sn>Rb>Li>Y>Co>Ga>Sb>Be>Mo>Sc>Se>Au>Cs>U>W>Zr>Tl>Th>Nb>Bi>Te>In>Ti
Disclaimer/Publisher’s Note: The statements, opinions and data contained in all publications are solely those of the individual author(s) and contributor(s) and not of MDPI and/or the editor(s). MDPI and/or the editor(s) disclaim responsibility for any injury to people or property resulting from any ideas, methods, instructions or products referred to in the content.

