1. Introduction
The reliable operation of electric power plants has become increasingly critical, driven by technical demands and economic pressures. To remain economically viable, the equipment must demonstrate substantial resilience against potential failures.
Power transformers represent crucial components within electrical power systems, and early identification of potential issues, especially during operation, is essential to reduce repair costs significantly. Maintaining the operational safety of oil-filled transformers requires thorough diagnostic assessments of essential insulating materials, including paper, barriers, and insulating oil. A variety of diagnostic techniques, such as insulation resistance measurement, capacitance testing, dissipation factor analysis, and partial discharge evaluation, are typically utilized to determine insulation condition and reliability [
1,
2].
Operational experience indicates the importance of measurement and diagnostic procedures for distribution transformers operating at voltage levels of 22 kV and 110 kV, in addition to transmission transformers. To prevent transformer failures, diverse measurement approaches are employed to precisely capture the actual state of equipment. Therefore, carefully selecting suitable diagnostic and measuring methods is vital for accurately forecasting transformer conditions [
3,
4].
Applying appropriate combinations of measurement and diagnostic methods enables non-destructive identification of insulation aging, moisture presence, or structural defects in power transformers, applicable both during active operation and downtime, irrespective of whether assessments are conducted online or offline.
Evaluating oil-paper-insulated power transformers, particularly regarding their moisture content, is gaining increased importance, both for managing aging transformers and for quality assurance of newly installed equipment. This heightened requirement for accurate and dependable diagnostic methods has spurred advancements in dielectric response techniques, while improvements in diagnostic procedures include the use of commercial technology. The growing need for advanced and dependable diagnostic approaches has driven the evolution of dielectric response techniques [
5,
6].
One traditional and straightforward approach for assessing insulation condition involves measuring insulation resistance. However, this method’s effectiveness is limited due to its dependency on insulation type and dimensions, as well as its inability to precisely identify whether insulation deterioration is primarily within the paper or the oil layers. Nonetheless, it remains capable of detecting minor local deteriorations traversing the oil-paper-insulation boundary [
7,
8].
More advanced techniques, including polarization and depolarization of current measurements and frequency domain spectroscopy (FDS), have demonstrated their efficacy in transformer diagnostics and are extensively adopted. These modern methods provide more detailed and reliable information about insulation conditions, solidifying their value as essential tools in power transformer evaluations [
9,
10,
11].
2. Overview of the Frequency Dielectric Spectroscopy Measurement and Domain Method
Due to the limitations associated with DC insulation testing methods used for high-voltage transformers, research since the year 2000 has increasingly focused on analyzing the polarization responses of dielectric materials within power equipment under varying AC voltage signals.
The fundamental principle behind frequency dielectric spectroscopy (FDS) is based on observing the physical responses of dielectric particles to input signals within a specific frequency range from very low to moderate frequencies (1 mHz to 10 kHz). Compared to other diagnostic methods, a significant advantage of FDS is its ability to individually analyze the insulation conditions of electrical equipment containing oil-paper insulation, specifically evaluating the solid insulation separately from the transformer oil [
12,
13].
Nevertheless, the FDS method itself has notable drawbacks. It exhibits high sensitivity to internal temperature variations within the transformer and to geometric configurations. Additionally, another significant limitation is the considerable duration required for comprehensive measurements, which can exceed three hours at extremely low frequencies (from 0.1 mHz).
Driven by multiple experimental studies, one of the primary objectives of our research on FDS is to mitigate the impact of temperature sensitivity within this diagnostic technique.
The FDS method is a critical diagnostic tool for assessing the insulation conditions of high-voltage equipment utilizing oil-paper insulation. This method evaluates the insulation system’s response, expressed through parameters like loss factor or capacitance, across a theoretical frequency range from 0.0001 Hz up to 10 kHz. Initially developed in the late 1990s, FDS was applied primarily to measure oil conductivity and the moisture content within solid insulation materials in high-voltage transformers and cables [
14,
15].
Previous research focused on electrical insulation condition monitoring has identified frequency domain spectroscopy as the most widely used technique for evaluating the deterioration of oil-paper insulation in power transformers. The inclusion of very low-frequency measurements (down to approximately 0.1 Hz) is essential for accurately detecting moisture levels, as these frequencies strongly correlate with moisture content. Alongside frequency sweep assessments, experimental analyses involving dielectric responses to varying voltage levels have also been performed and discussed extensively [
14].
The focus lies in evaluating and comparing modern dielectric spectroscopy methods with traditional measurement techniques, such as dielectric absorption ratio, polarization index, and dielectric dissipation factor assessments conducted at power frequency and at 0.1 Hz. Conventional methods often exhibit limitations due to restricted time and frequency ranges, complicating the distinction among various dielectric properties [
16,
17].
When sinusoidal voltage is applied to insulation comprising both resistive and capacitive components, the resulting current passing through the insulation will also consist of resistive and capacitive components shifted by a particular phase angle φ. The dissipation angle δ represents the angular difference between this resultant current and the imaginary axis. It quantifies how much the insulation deviates from ideal capacitive behavior, where the current would be purely capacitive. Insulation without losses occurs when the phase angle φ equals 90°, corresponding to a dissipation angle δ of 0° [
18].
The tangent of angle δ is widely referred to as the dissipation factor, defined mathematically as
In the FDS method, a sinusoidal voltage at a specific frequency is applied to the sample being tested, and the resulting current flowing through the transformer under test is measured. The current through the test object, characterized by its geometric capacitance
, is described by the equation
where
denotes geometric capacitance,
represents the applied voltage,
σdc indicates the DC conductivity,
is the high-frequency permittivity,
and
are the real and imaginary components of permittivity, respectively, and
and
represent the real and imaginary sensitivities, respectively [
16,
19].
The measured current can be separated into real and imaginary components, corresponding respectively to the in-phase and quadrature-phase currents relative to the applied voltage. The imaginary component of the current represents energy losses, which can be categorized into two main parts:
When geometric information about the test object is unavailable, it is most practical to represent the dielectric response using the loss factor (tan
δ). This factor is expressed as the ratio of the imaginary permittivity
to the real permittivity
, provided by the following equation
It is not possible to clearly identify whether higher energy losses originate primarily from cellulose paper insulation or from insulating oil.
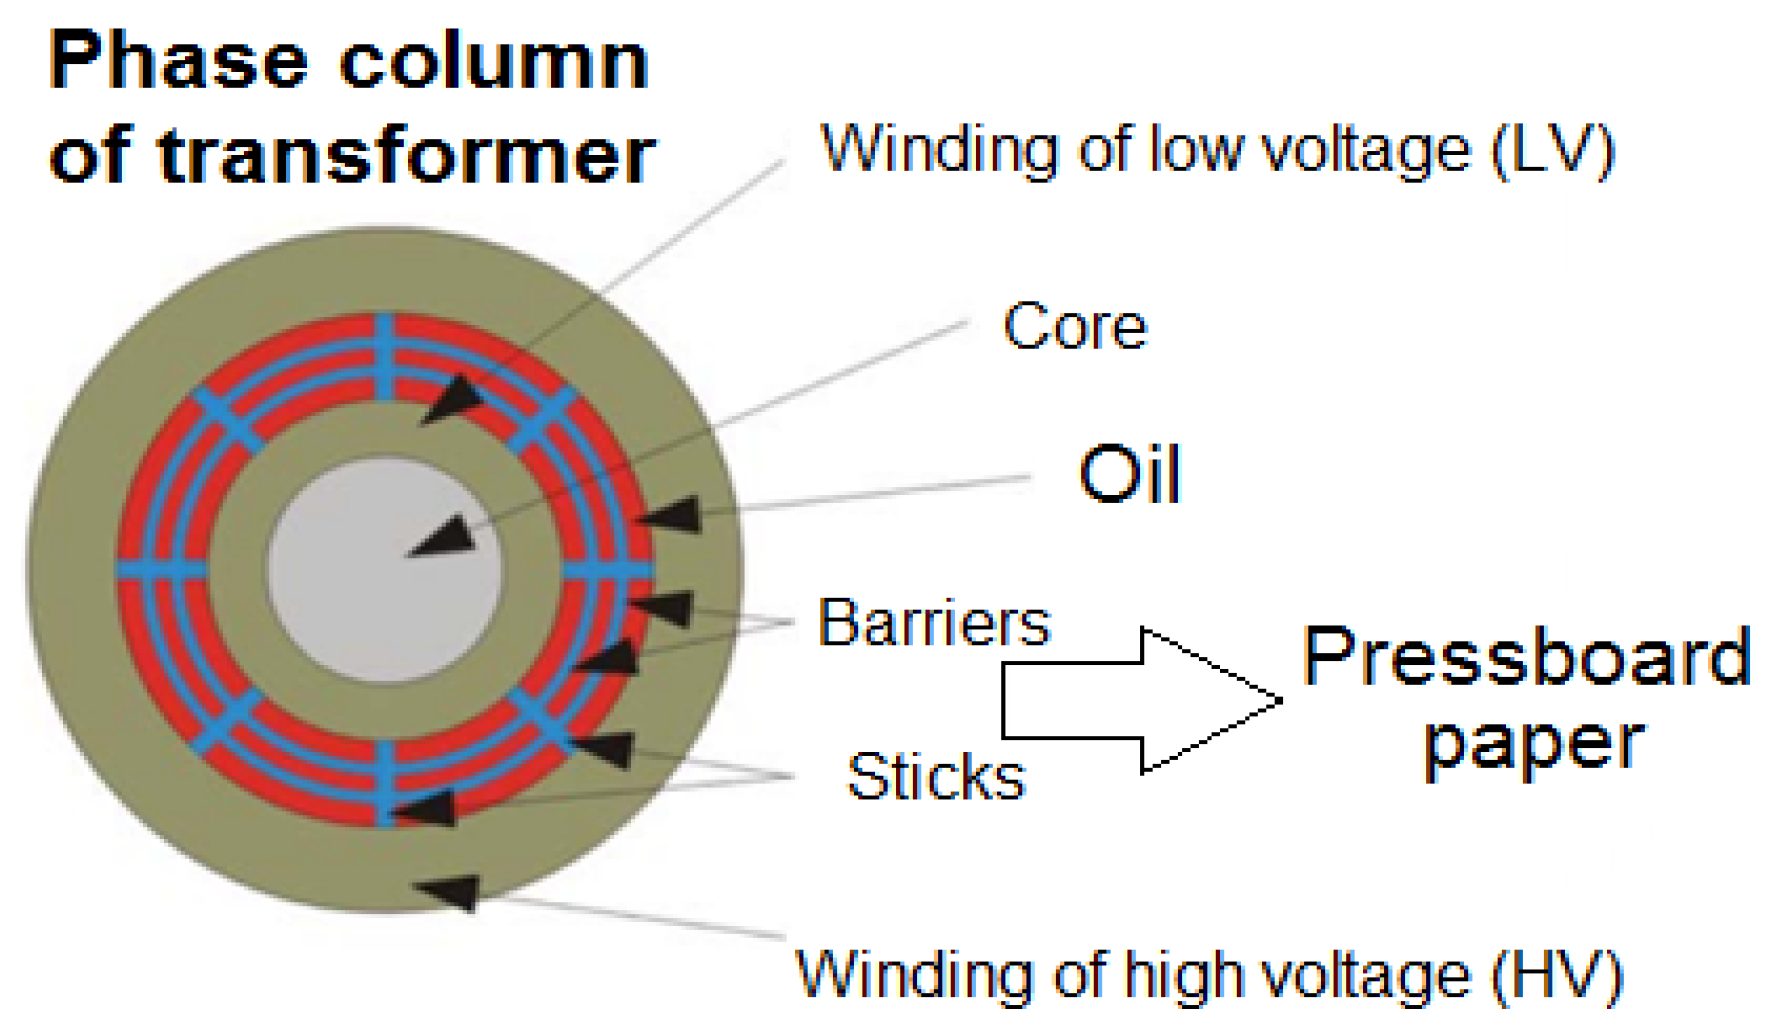
Figure 1 illustrates the insulation system of a single-phase column of a distribution transformer.
The dielectric response of a transformer’s overall insulation system is influenced by several factors, including the characteristics of impregnated paper, pressboard, insulating oil, and the geometric configuration of the insulation components. Precise evaluation of measured data necessitates mathematical analysis, which involves understanding how the properties of both oil and paper/pressboard vary with temperature and moisture content [
16].
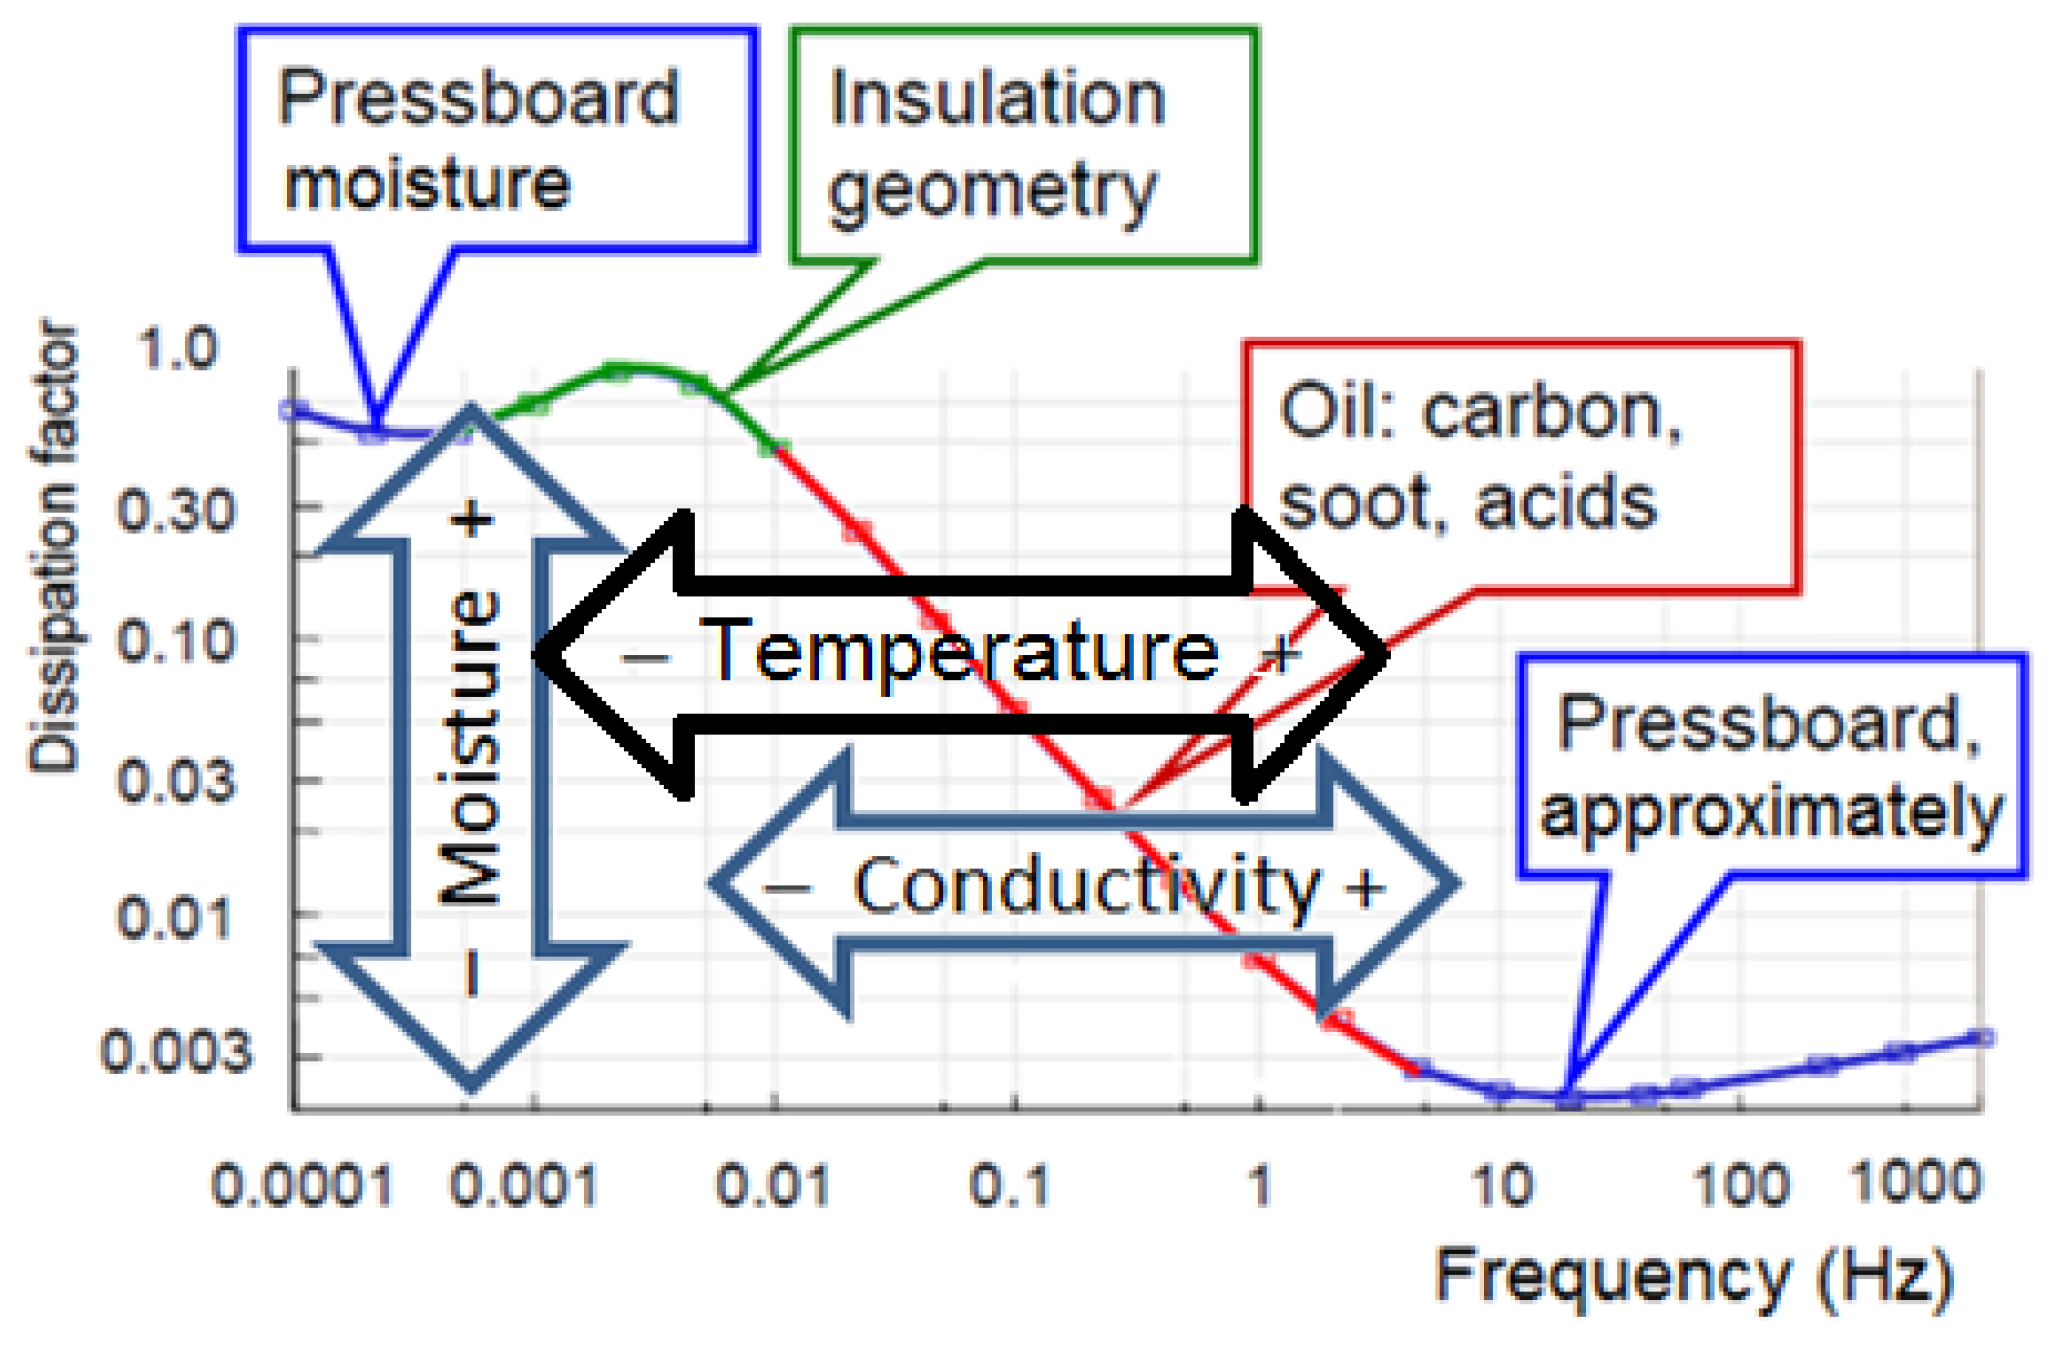
Figure 2 illustrates the measured frequency dependence of the dissipation factor for pressboard insulation paper containing 1% moisture and oil, highlighting also the effects of interfacial polarization related to insulation geometry.
Within the frequency range of 10 to 1000 Hz, cellulose-based insulation typically dominates the dielectric response. The conductivity of transformer oil is influenced by dissolved conductive aging by-products, soot, and high molecular weight acids present in transformer materials, causing fluctuations within this frequency spectrum. The local peak or “hump” observed around 0.003 Hz arises from interfacial polarization, which depends significantly on the oil-to-pressboard ratio and the geometric structure of the insulation [
16,
20,
21].
Based on the frequency-response analysis presented in
Figure 2, a significant limitation of the FDS technique is its sensitivity to temperature variations, which notably impacts the accurate determination of oil conductivity. Addressing this issue requires the application of correction relationships or mathematical models to minimize temperature-induced errors [
13,
22,
23].
3. Setup and Diagnostic Analysis of the Transformer Using the FDS Method
Diagnostic systems utilizing the FDS method typically offer temperature compensation features to account for temperature effects on insulation parameters. Such systems adjust the measured values, providing more precise and reliable results.
During the actual measurement, a sinusoidal test voltage (e.g., 140 V) at varying frequencies is applied to the terminals of the transformer, with the high-voltage winding short-circuited. Simultaneously, the low-voltage winding is connected to the diagnostic instrument’s measurement input.
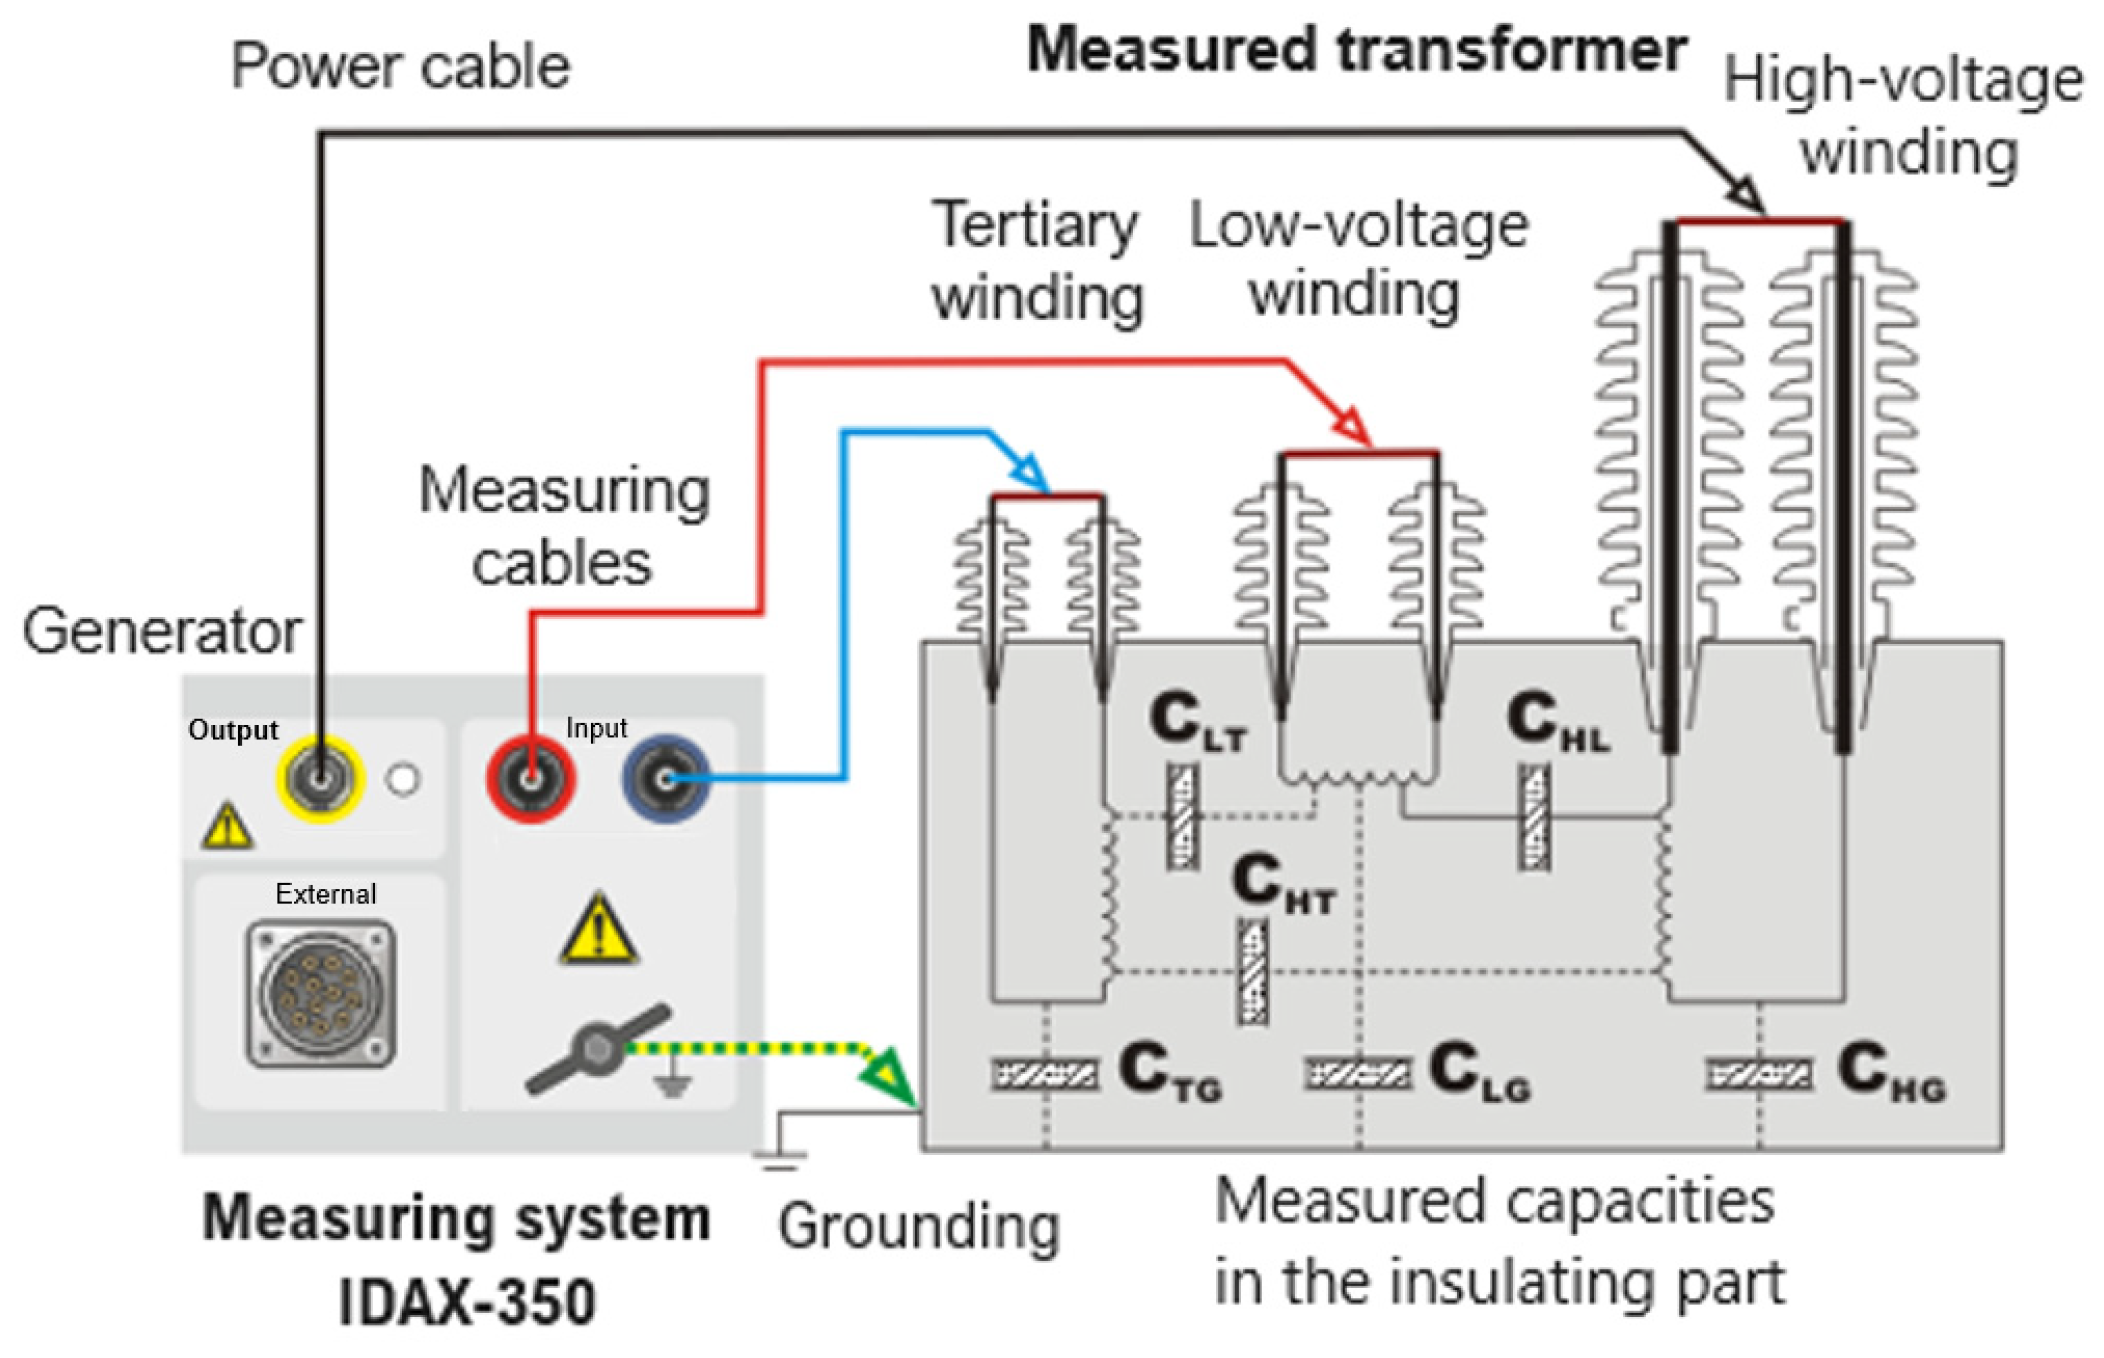
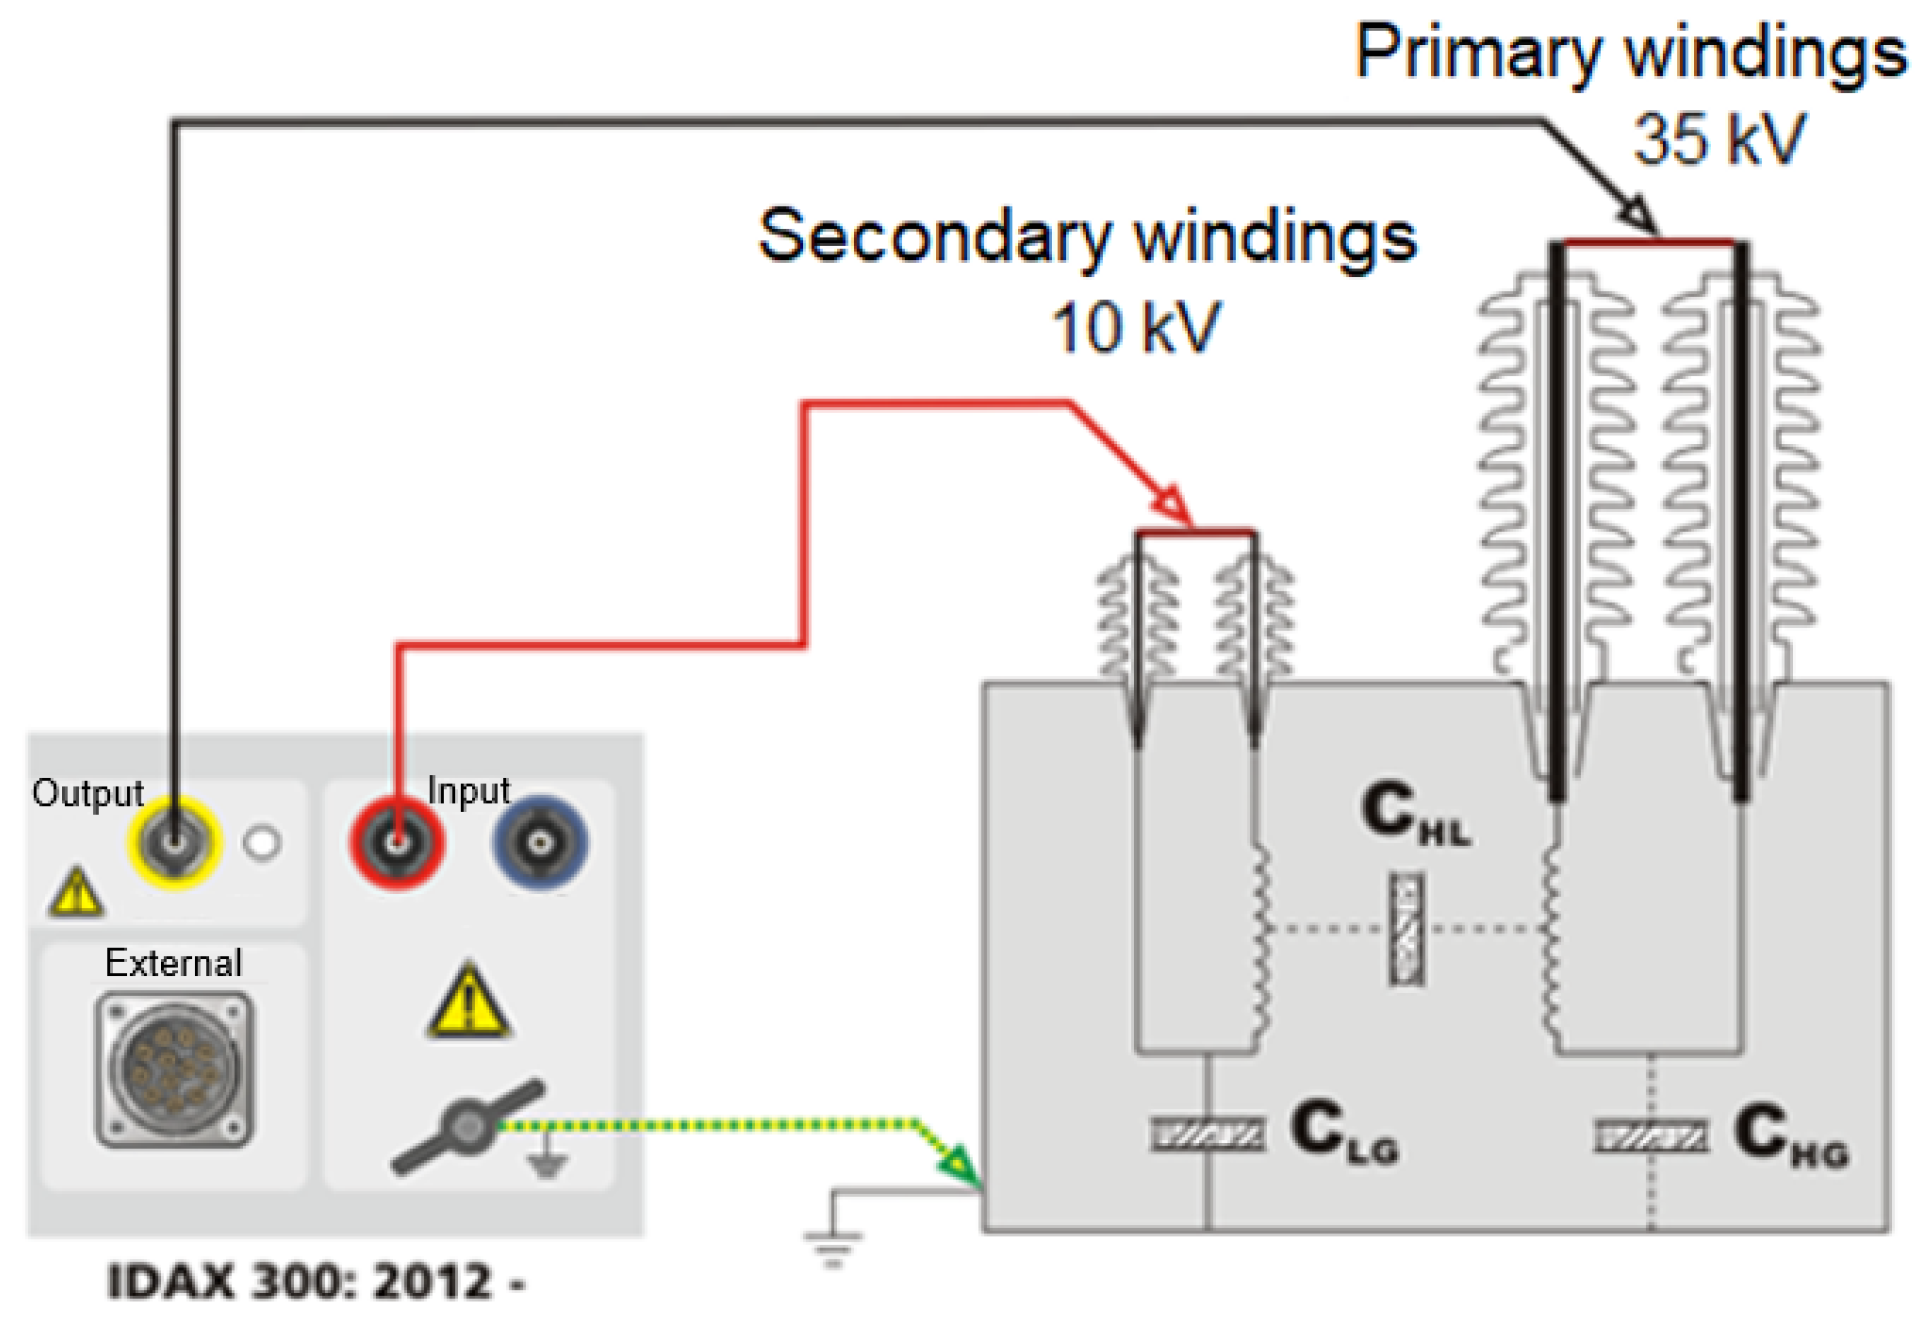
Figure 3 and
Figure 4 illustrate the connection schemes for the IDAX-350 diagnostic system from MEGGER with two-winding (HV/LV) and three-winding transformers, respectively. These diagnostic systems effectively measure and assess transformer insulation characteristics via frequency dielectric spectroscopy [
19,
20].
As depicted in
Figure 3 and
Figure 4, all high-voltage and low-voltage bushings of the transformer are interconnected. During measurements, a comprehensive insulation analysis is conducted by evaluating capacitances between high-voltage and low-voltage windings (CHL), between windings and transformer frame (ground) (CLG, CHG), and between these components and the tertiary winding (CLT, CHT, CTG), as shown in
Figure 3.
The MEGGER IDAX device analyzes measured curves by comparing them against theoretically modeled curves. Accurate measurement and recording of both ambient temperature and the transformer’s temperature are critical during this diagnostic process.
The measurement results yield frequency-dependent values for the loss factor, capacitance, and permittivity. These values enable the determination of moisture levels in the solid insulation and oil conductivity by precisely measuring extremely low currents (in the nanoampere to picoampere range) [
18].
Typically, in transformers, the low-voltage winding is positioned close to the core, while the high-voltage winding surrounds it. To ensure adequate dielectric strength and effective cooling, these windings are separated by multiple cylindrical barriers made from pressed cardboard. These barriers are supported by spacers, creating channels through which insulating oil can flow freely. A simplified depiction of the arrangement between two transformer windings is presented in
Figure 1.
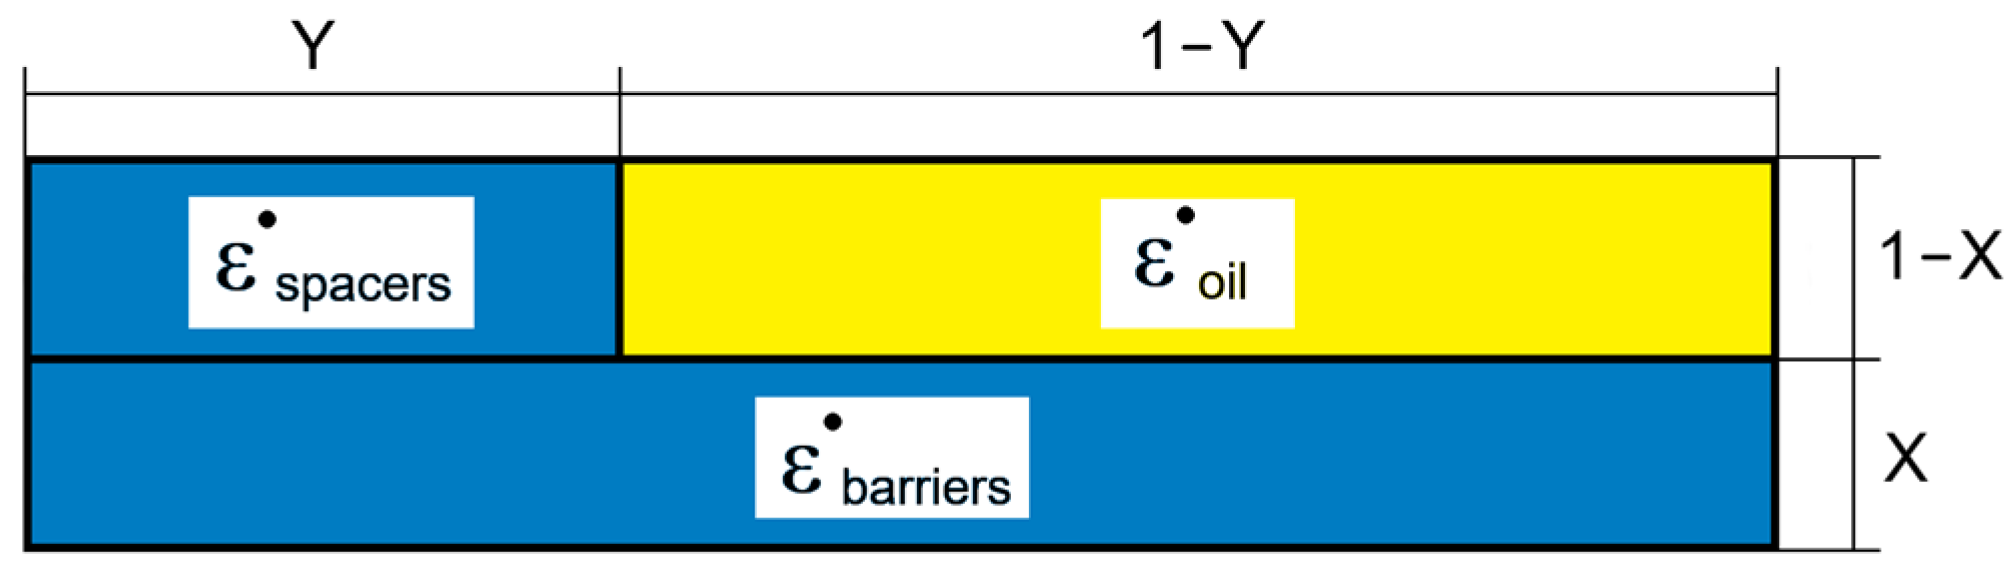
For modeling and analyzing frequency curves using the MEGGER IDAX system, the insulation structure between the windings is represented by the relative proportion of spacers and barriers within transformer channels (
Figure 5). Parameter X is defined as the sum of all barriers in the channel, consolidated into one unit, and divided by the channel width. Spacer coverage Y is calculated as the combined width of all spacers divided by the total length of the transformer channel [
14,
16,
19].
The description of the complex geometry of the barriers and spacers between the windings as one simple capacitance is a simplification of real conditions. This is one of the reasons why the modelled geometry may not exactly match the “real” geometry in the transformer. In most cases, the best fit/modelling is achieved by having the instrument software automatically calculate the geometry [
14,
16,
19].
The permittivity of oil, spacers, and barriers comprises complex functions dependent on both angular frequency (
ω) and temperature (
T), influencing the overall measured frequency response
Considering the number of barriers and spacers, the overall response of the insulation channel (
ch) can be represented by
Based on these defined relationships and calculated parameters, the MEGGER IDAX-350 diagnostic system assesses the insulation condition of high-voltage transformers by comparing measured and modeled frequency curves. The system’s software utilizes an evaluation table, presented beneath the displayed curves in the device’s interface, as shown in
Figure 6.
The MEGGER IDAX-350 system summarizes the quality assessment criteria for transformer oil and paper-insulation systems. The evaluation is based on parameters such as the loss factor at a standard frequency of 50 Hz normalized to 20 °C, paper moisture content (in %), and oil conductivity (in pS/m) normalized to 25 °C.
The basic limit between good and deteriorated condition of the insulation system of a high-voltage transformer is a value of 0.5% for the loss factor, 2% for the moisture in the paper, and 3.7 pS/m for the oil conductivity.
4. Challenges in Assessing Transformer Insulation Conditions via Capacitance Measurements
Measurements of capacitance and dissipation factor are valuable tools for evaluating the degree of insulation deterioration in power transformers [
20].
The dissipation factor reveals the presence of polar and ionic substances within transformer oil, typically associated with oil aging. Although temperature-dependent variations of the dissipation factor can indicate contamination by dissolved substances and humidity levels, its extreme sensitivity to temperature fluctuations poses a significant limitation, particularly for equipment lacking internal temperature-monitoring devices [
24,
25].
Therefore, the advantage of measuring the capacity compared to the loss factor is a lower sensitivity to temperature changes, at normal ambient values up to 40 °C.
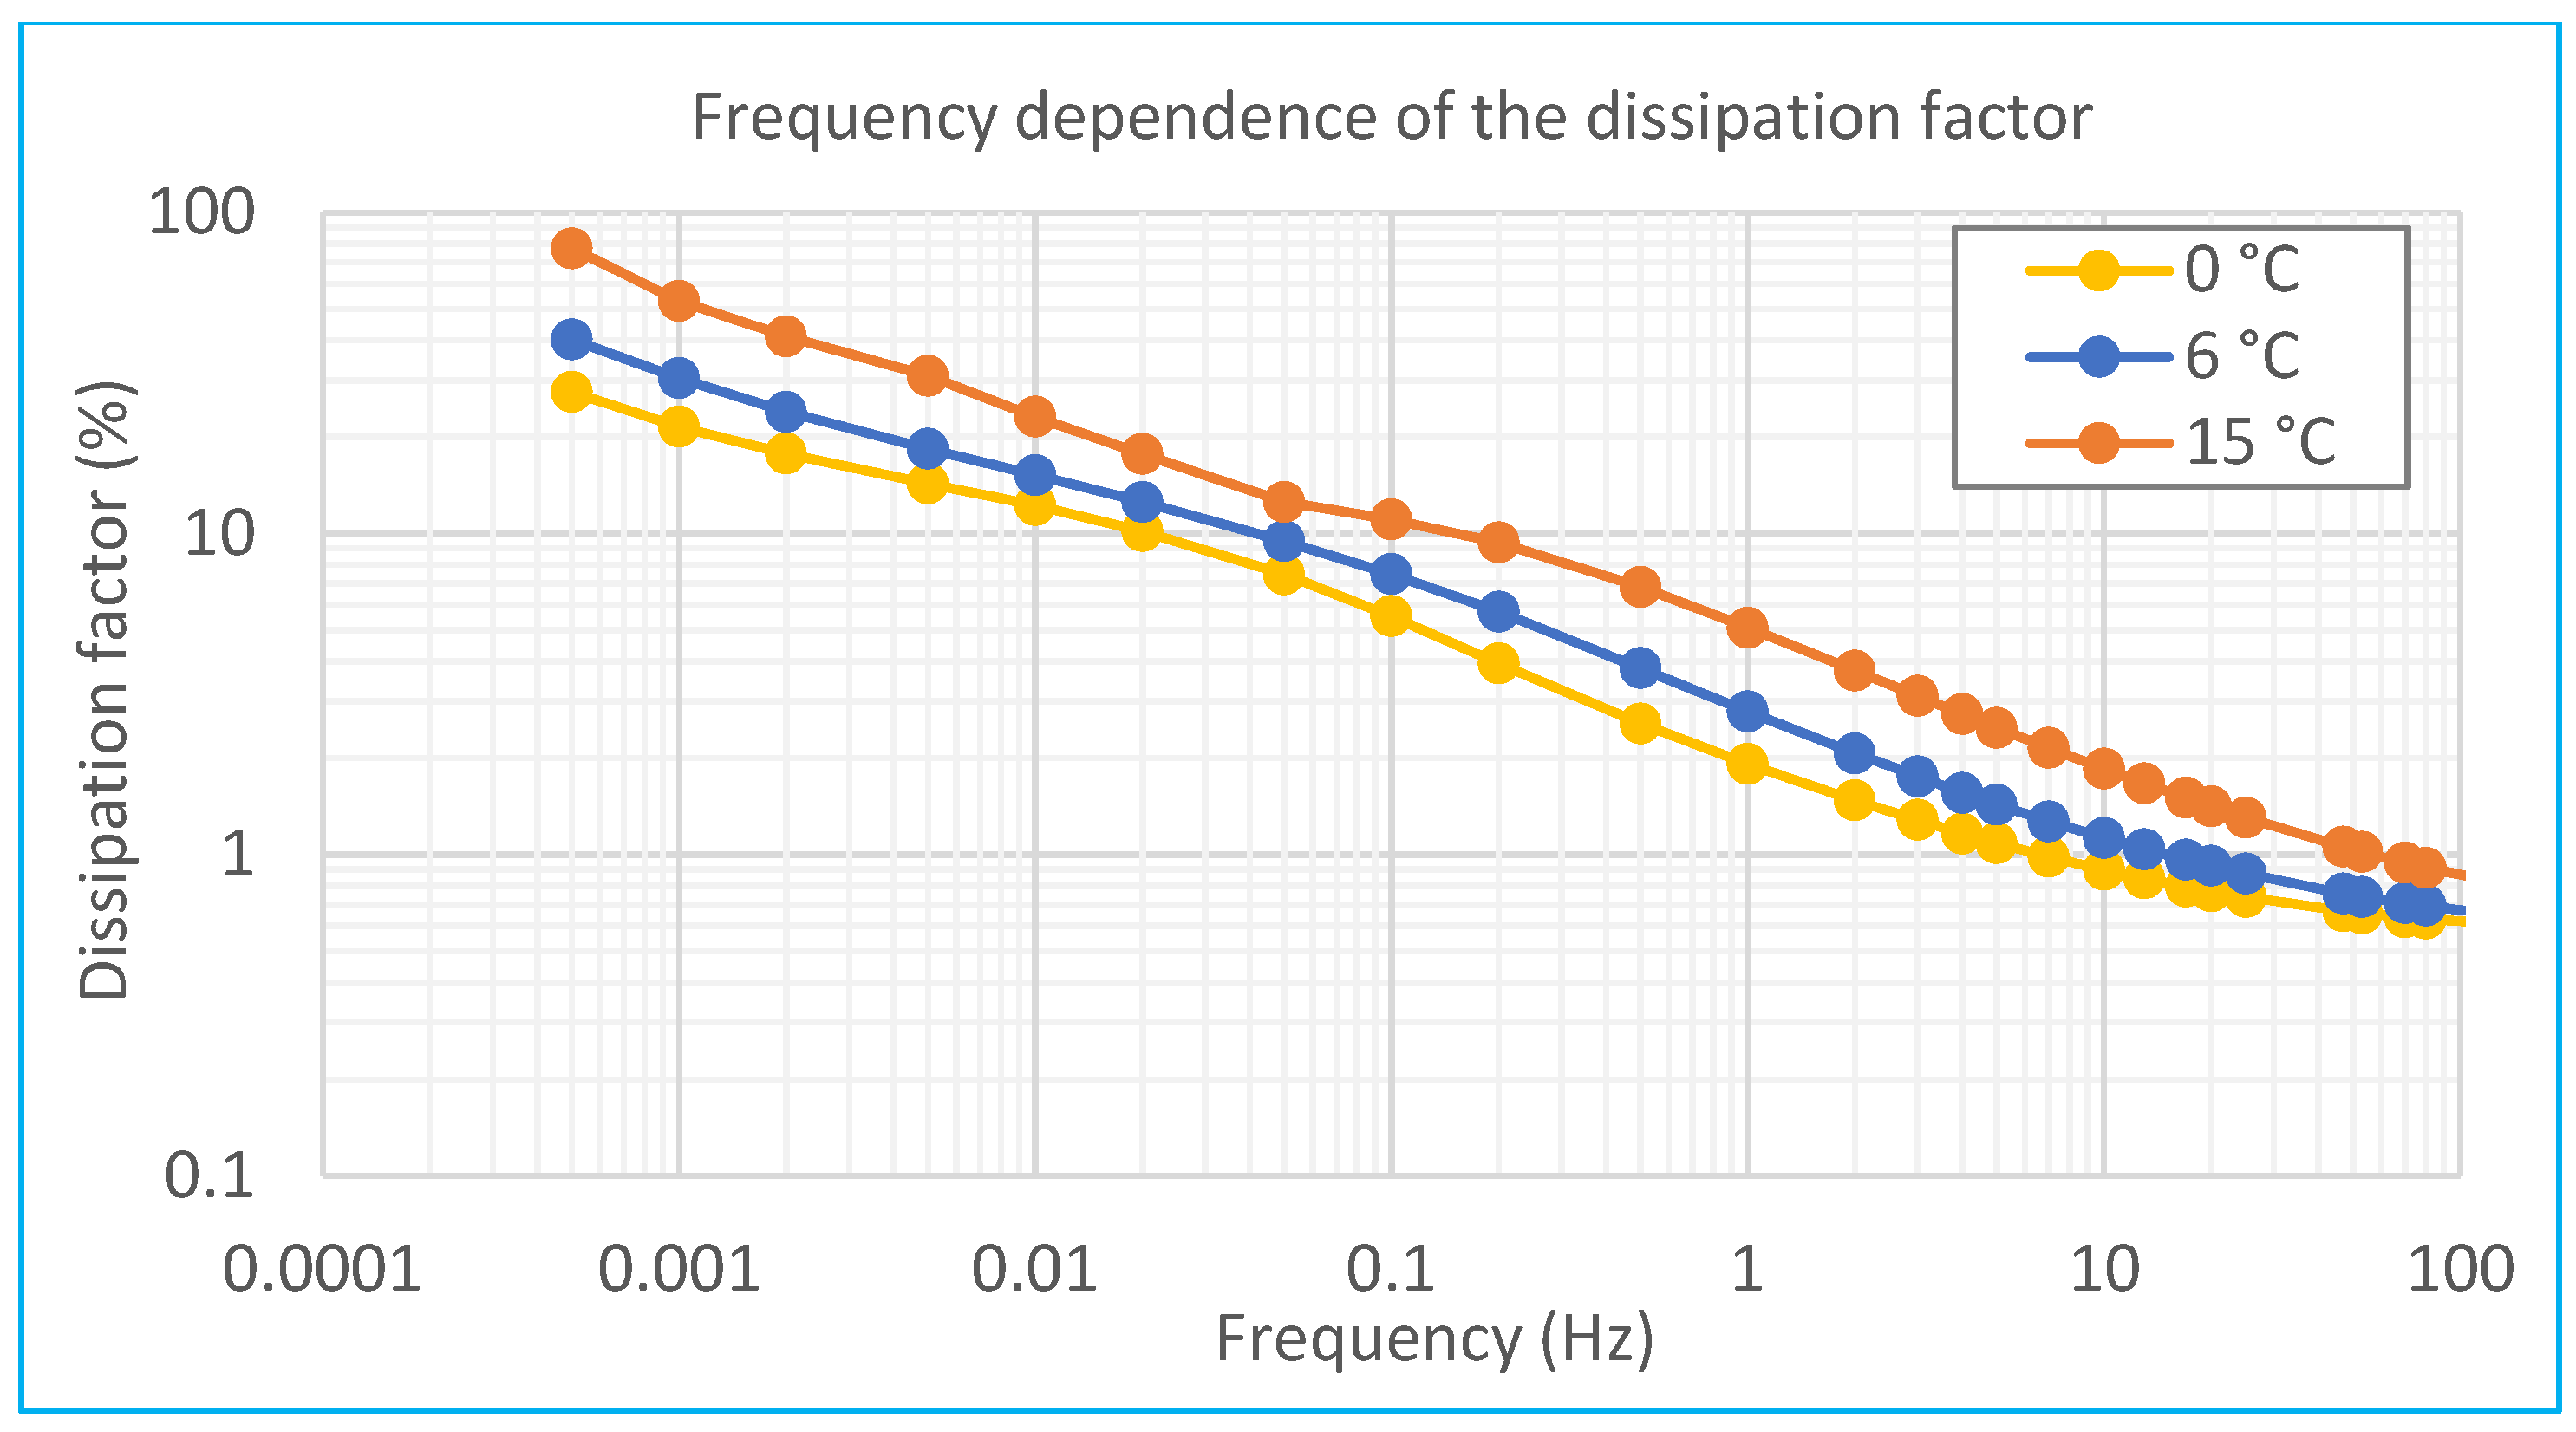
Figure 7 illustrates the frequency-dependent capacitance of a high-voltage transformer measured at temperatures of 15, 6, and 0 °C are determined at 2% paper humidity. For frequencies up to 1 Hz, relative differences remain minimal, calculated at around 10%. However, at extremely low frequencies (0.001 Hz), the maximum observed capacitance variation between temperature curves reaches up to 30%.
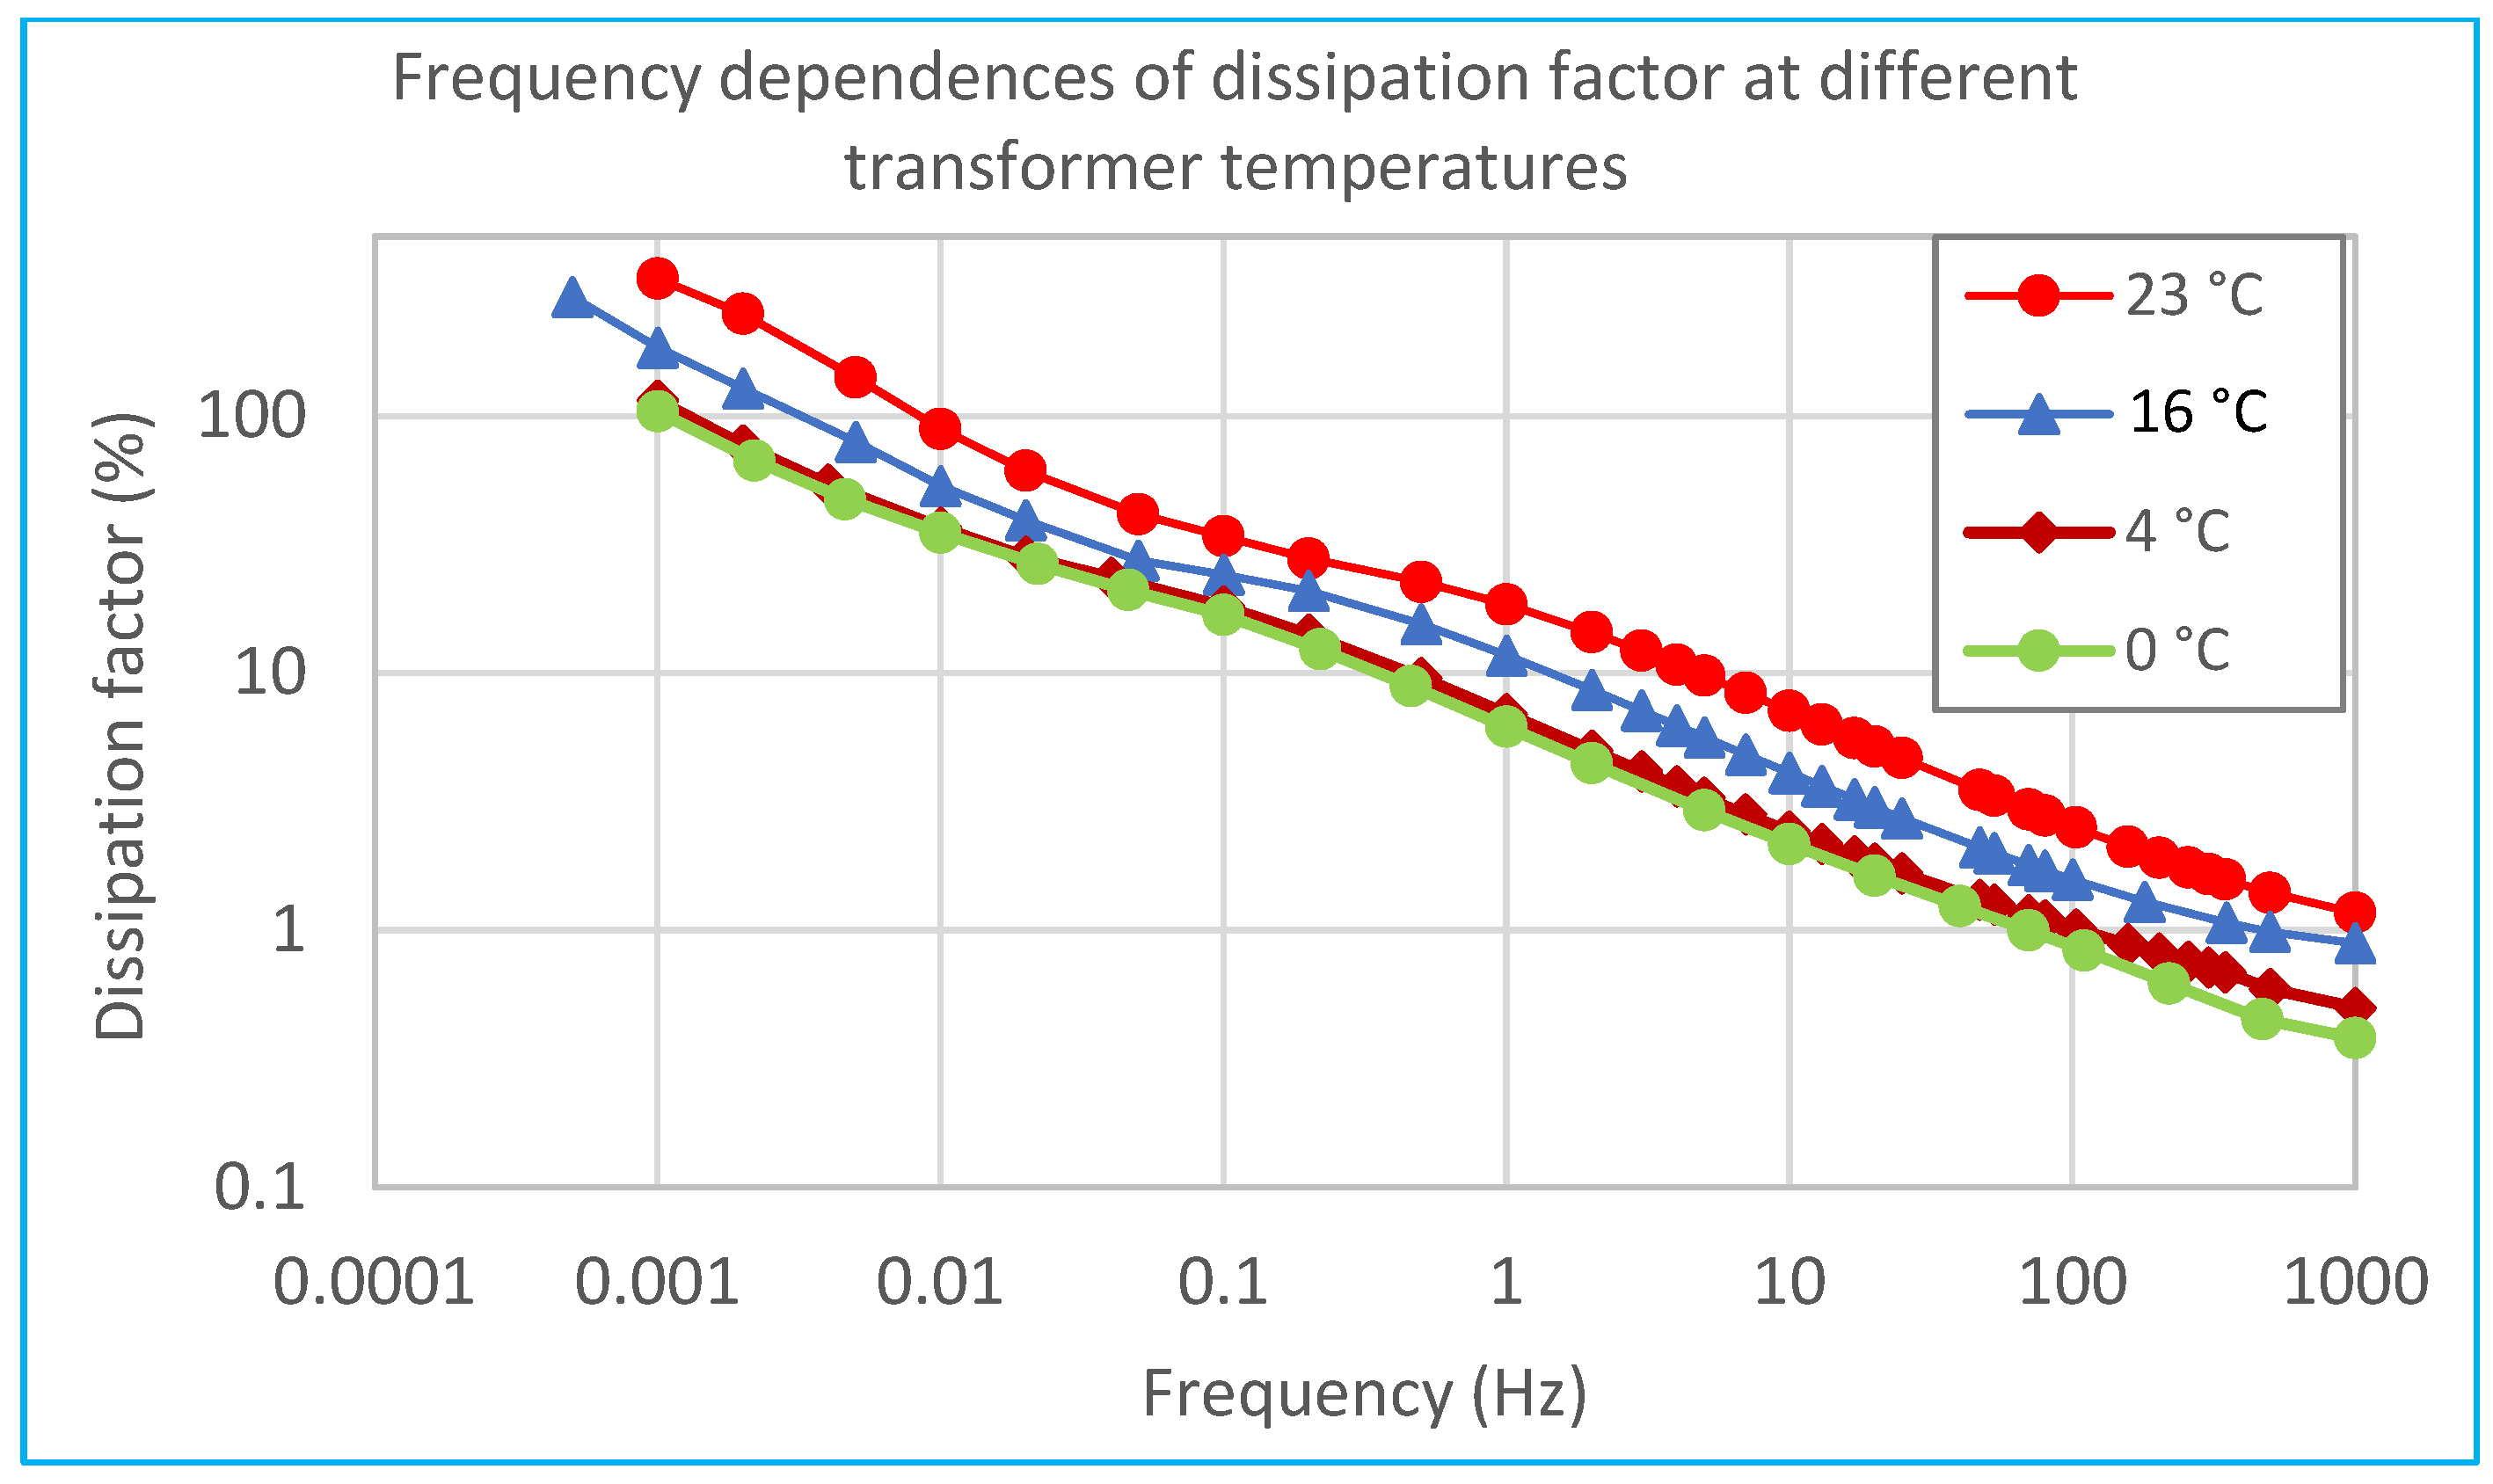
Compared to dissipation factor measurements (
Figure 8), these capacitance measurements demonstrate significantly smaller temperature-induced relative variations. In contrast, the dissipation factor exhibits variations of 45–55% across the same temperature range.
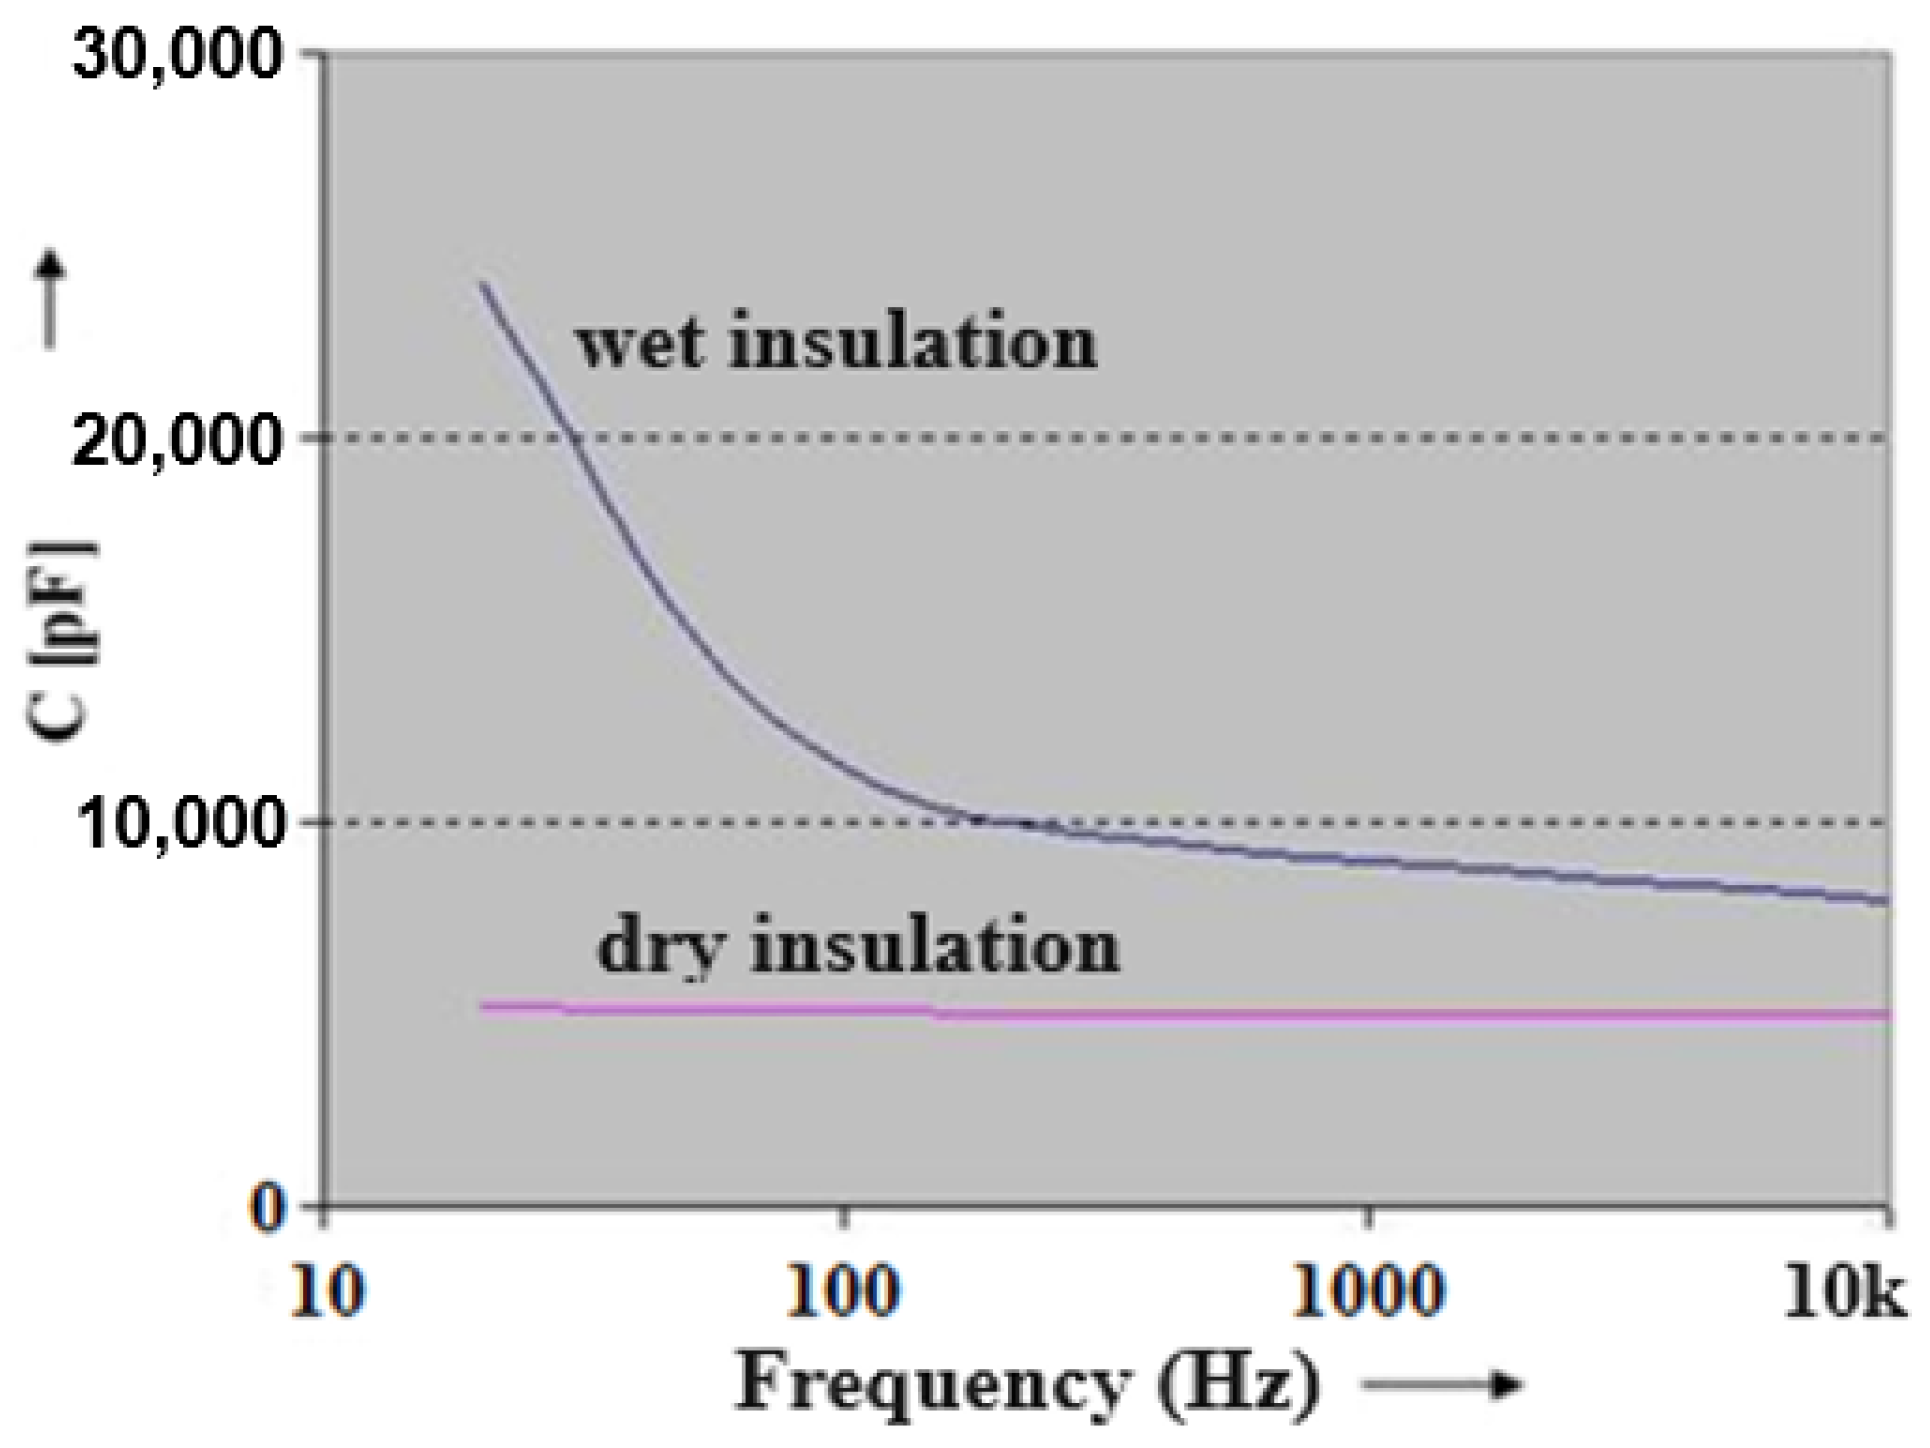
Moreover, capacitance curves can offer a straightforward method to assess and compare the insulation condition across different transformers, as depicted in
Figure 9.
When insulation is moist, absorption currents become dominated by larger, frequency-independent leakage currents. Thus, insulation status is commonly evaluated by calculating the capacitance ratio at two distinct frequencies. Ratios such as
C2Hz/
C50Hz are frequently employed to assess moisture levels in class A transformers, with pre-drying values typically ranging between 1.3 and 2.3, decreasing below 1.2 after drying [
8,
9].
Experimental analyses presented in Chapter III demonstrate that incorporating measurements at even lower frequencies (e.g., C0.1Hz/C50Hz or C0.01Hz/C50Hz) can enhance the reliability of this assessment method.
This capacitance-based method yields reliable results without requiring complicated temperature adjustments, simplifying the insulation evaluation process significantly [
10].
However, the main limitation of capacitance-based diagnostics remains its strong dependence on transformer power ratings and geometric configurations. While directly comparing insulation states among transformers with different power ratings using capacitance measurements can be problematic, combining capacitance analysis with frequency dielectric spectroscopy (FDS) effectively addresses this drawback.
5. Experimental Measurement and Analysis
Measurements using the FDS method with the Megger IDAX-350 instrument constructed in Danderyd in Sweden were conducted on seven 22/0.4 kV distribution transformers rated at 100, 630, and 1000 kVA, having varying insulation conditions. These tests were performed at a constant ambient temperature of 7 °C, eliminating temperature as a variable.
The analysis was divided into two categories: transformers with insulation at normal moisture levels and those with extremely high moisture content. The IDAX-350 system provided modeled values for the loss factor at 50 Hz, paper moisture percentage, and specific oil conductivity.
The analysis will be more readable and explanatory if we classify the transformers into two groups according to power and insulation properties.
5.1. Comparison of Frequency-Dependent Capacitance for Transformers with Normal Insulation Humidity
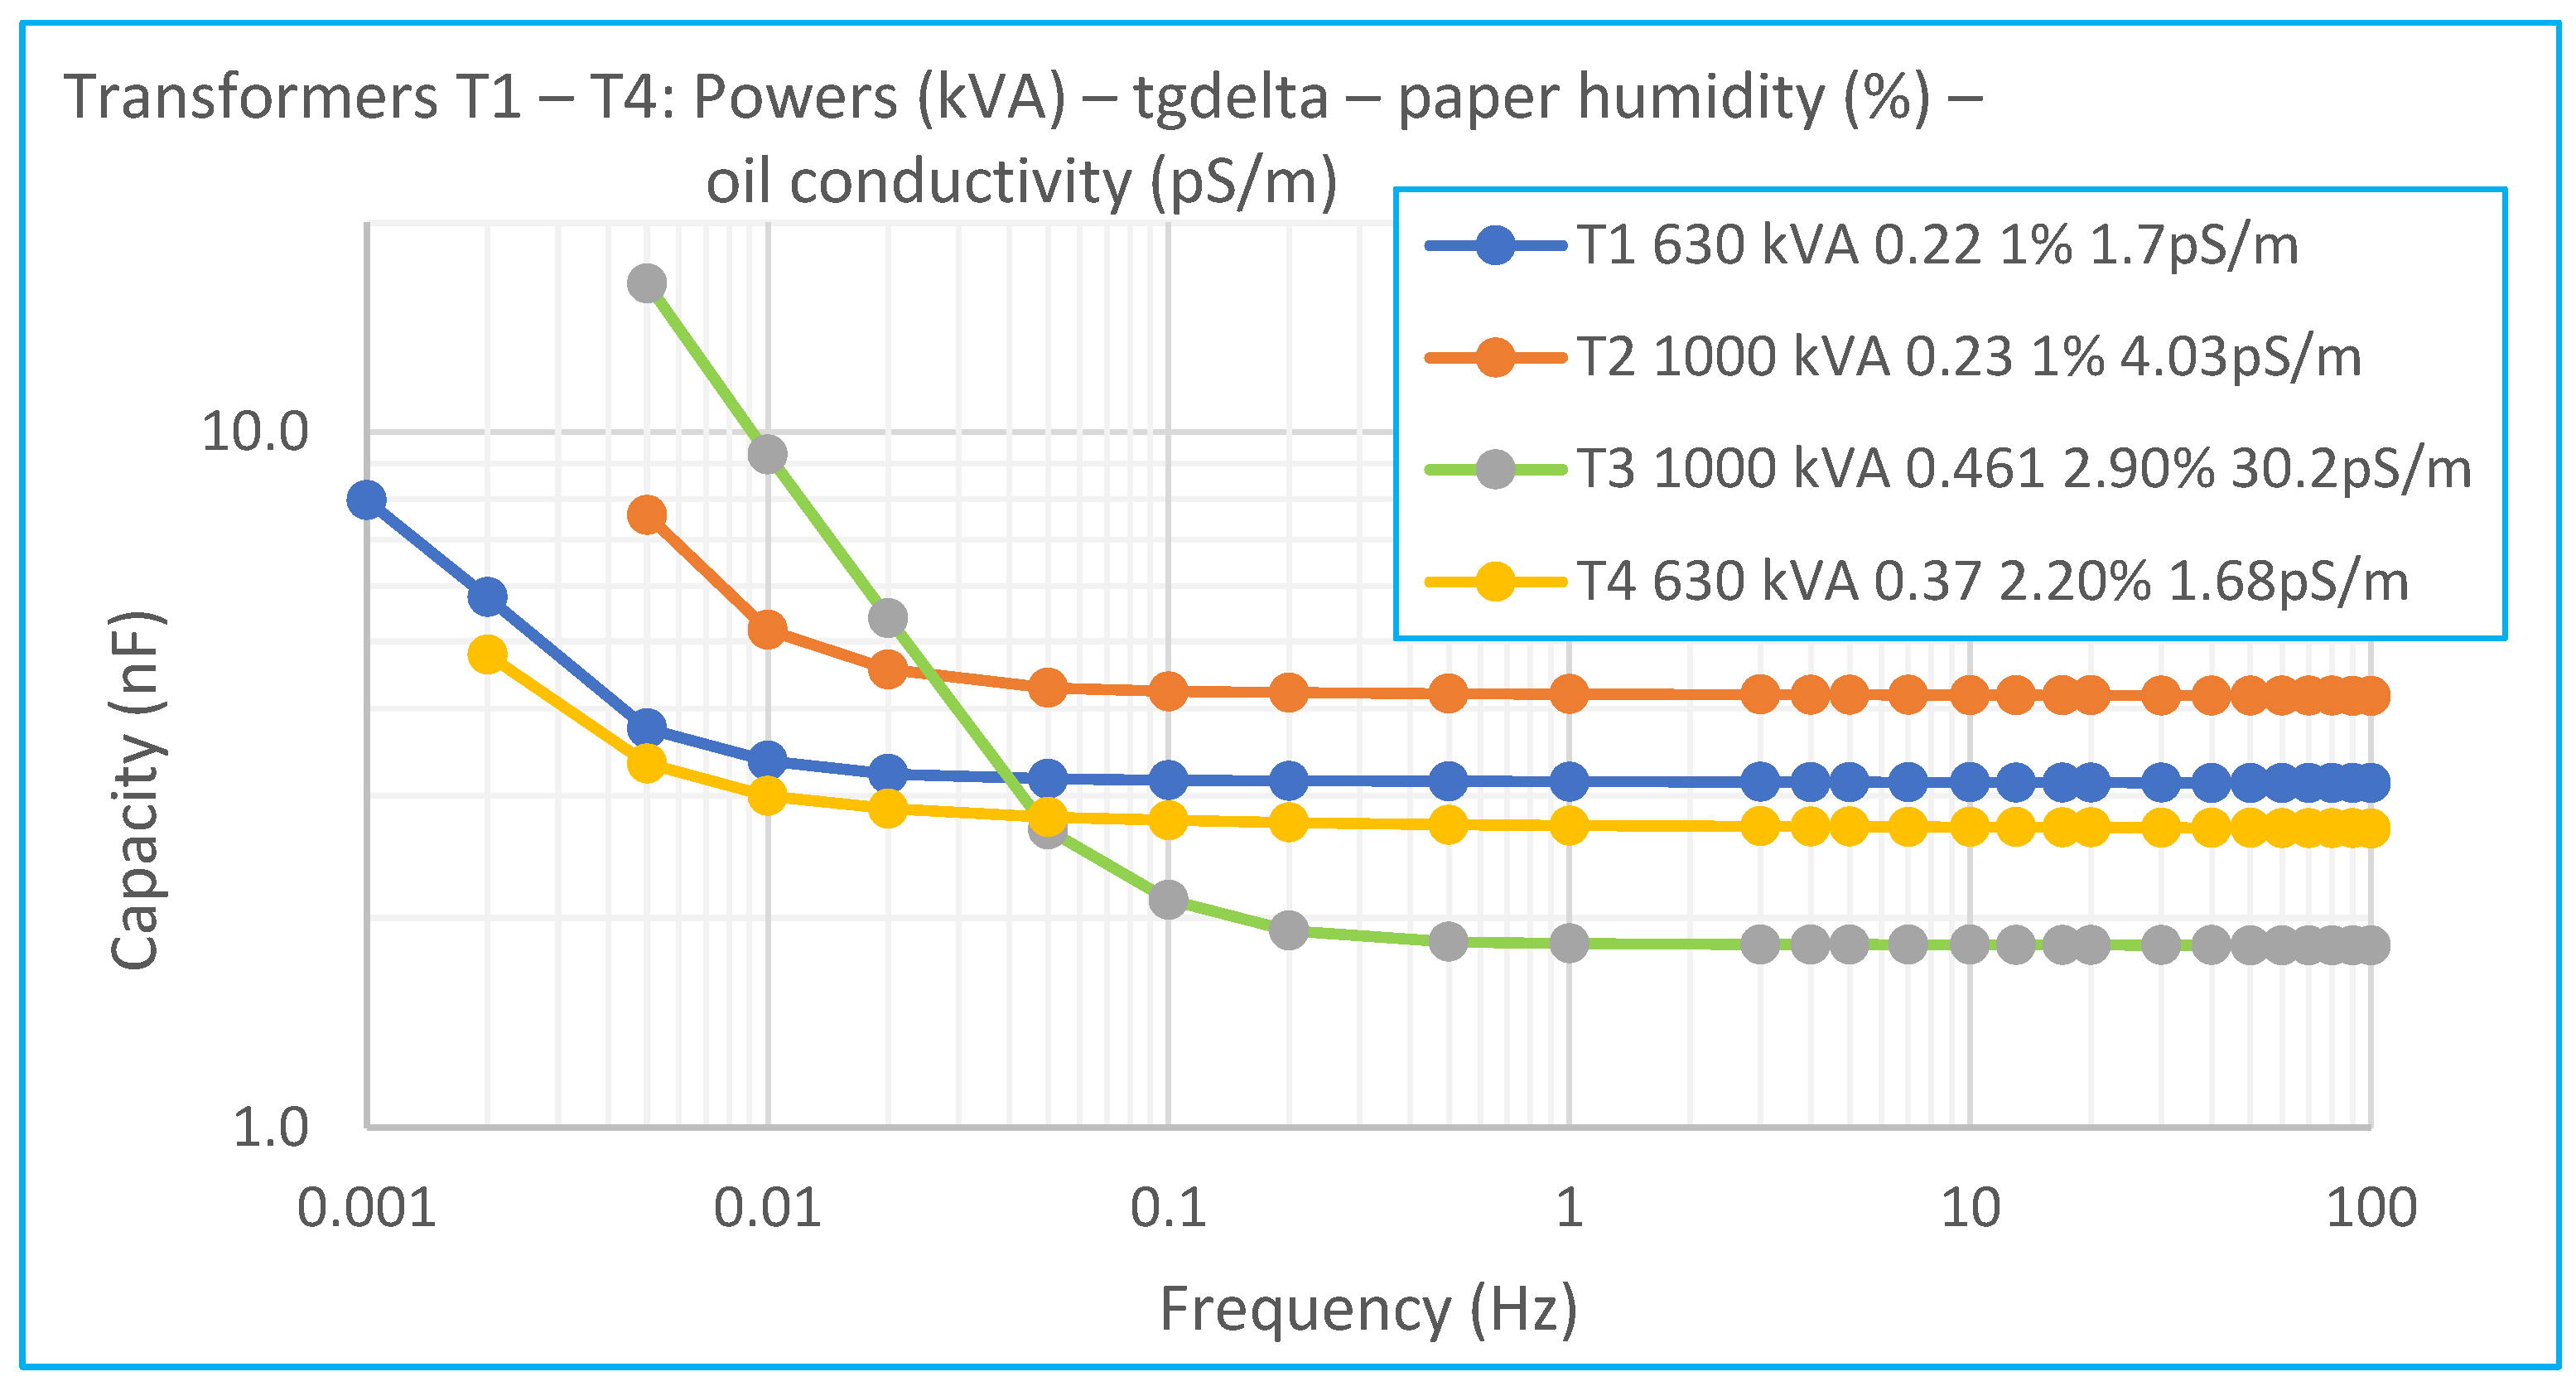
Figure 10 shows the frequency-dependent capacitance curves for two transformers rated at 630 kVA and two at 1000 kVA, each with different insulation conditions.
Comparing transformers T1 and T2, which exhibit similar loss factor values at 50 Hz (0.22 and 0.23) and identical moisture levels (1%), reveals significant capacitance differences at frequencies below 0.1 Hz. This discrepancy arises primarily from the larger geometric dimensions of insulation in the 1000 kVA transformer T2, affecting the steady-state region of the capacitance curve. This highlights a limitation when comparing capacitance among transformers of different sizes.
In comparing transformers T3 and T4, the differences in insulation geometry directly reflect their insulation conditions. Transformer T3 exhibits poorer insulation parameters (loss factor: 0.461, paper moisture: 2.9%, oil conductivity: 30.2 pS/m), correlating to lower capacitance values at frequencies up to 0.1 Hz.
Analysis of oil conductivity among these transformers reveals a correlation between increased capacitance and higher specific oil conductivity. Transformer T3, having the highest conductivity (30.2 pS/m), shows a sharp increase in capacitance beginning at higher frequencies (around 0.1 Hz). Transformers T1 and T4, with significantly lower conductivity (~1.7 pS/m), only exhibit a notable increase at lower frequencies (~0.01 Hz). Transformer T2’s capacitance begins rising at an intermediate frequency (0.02 Hz), reflecting its intermediate insulation condition.
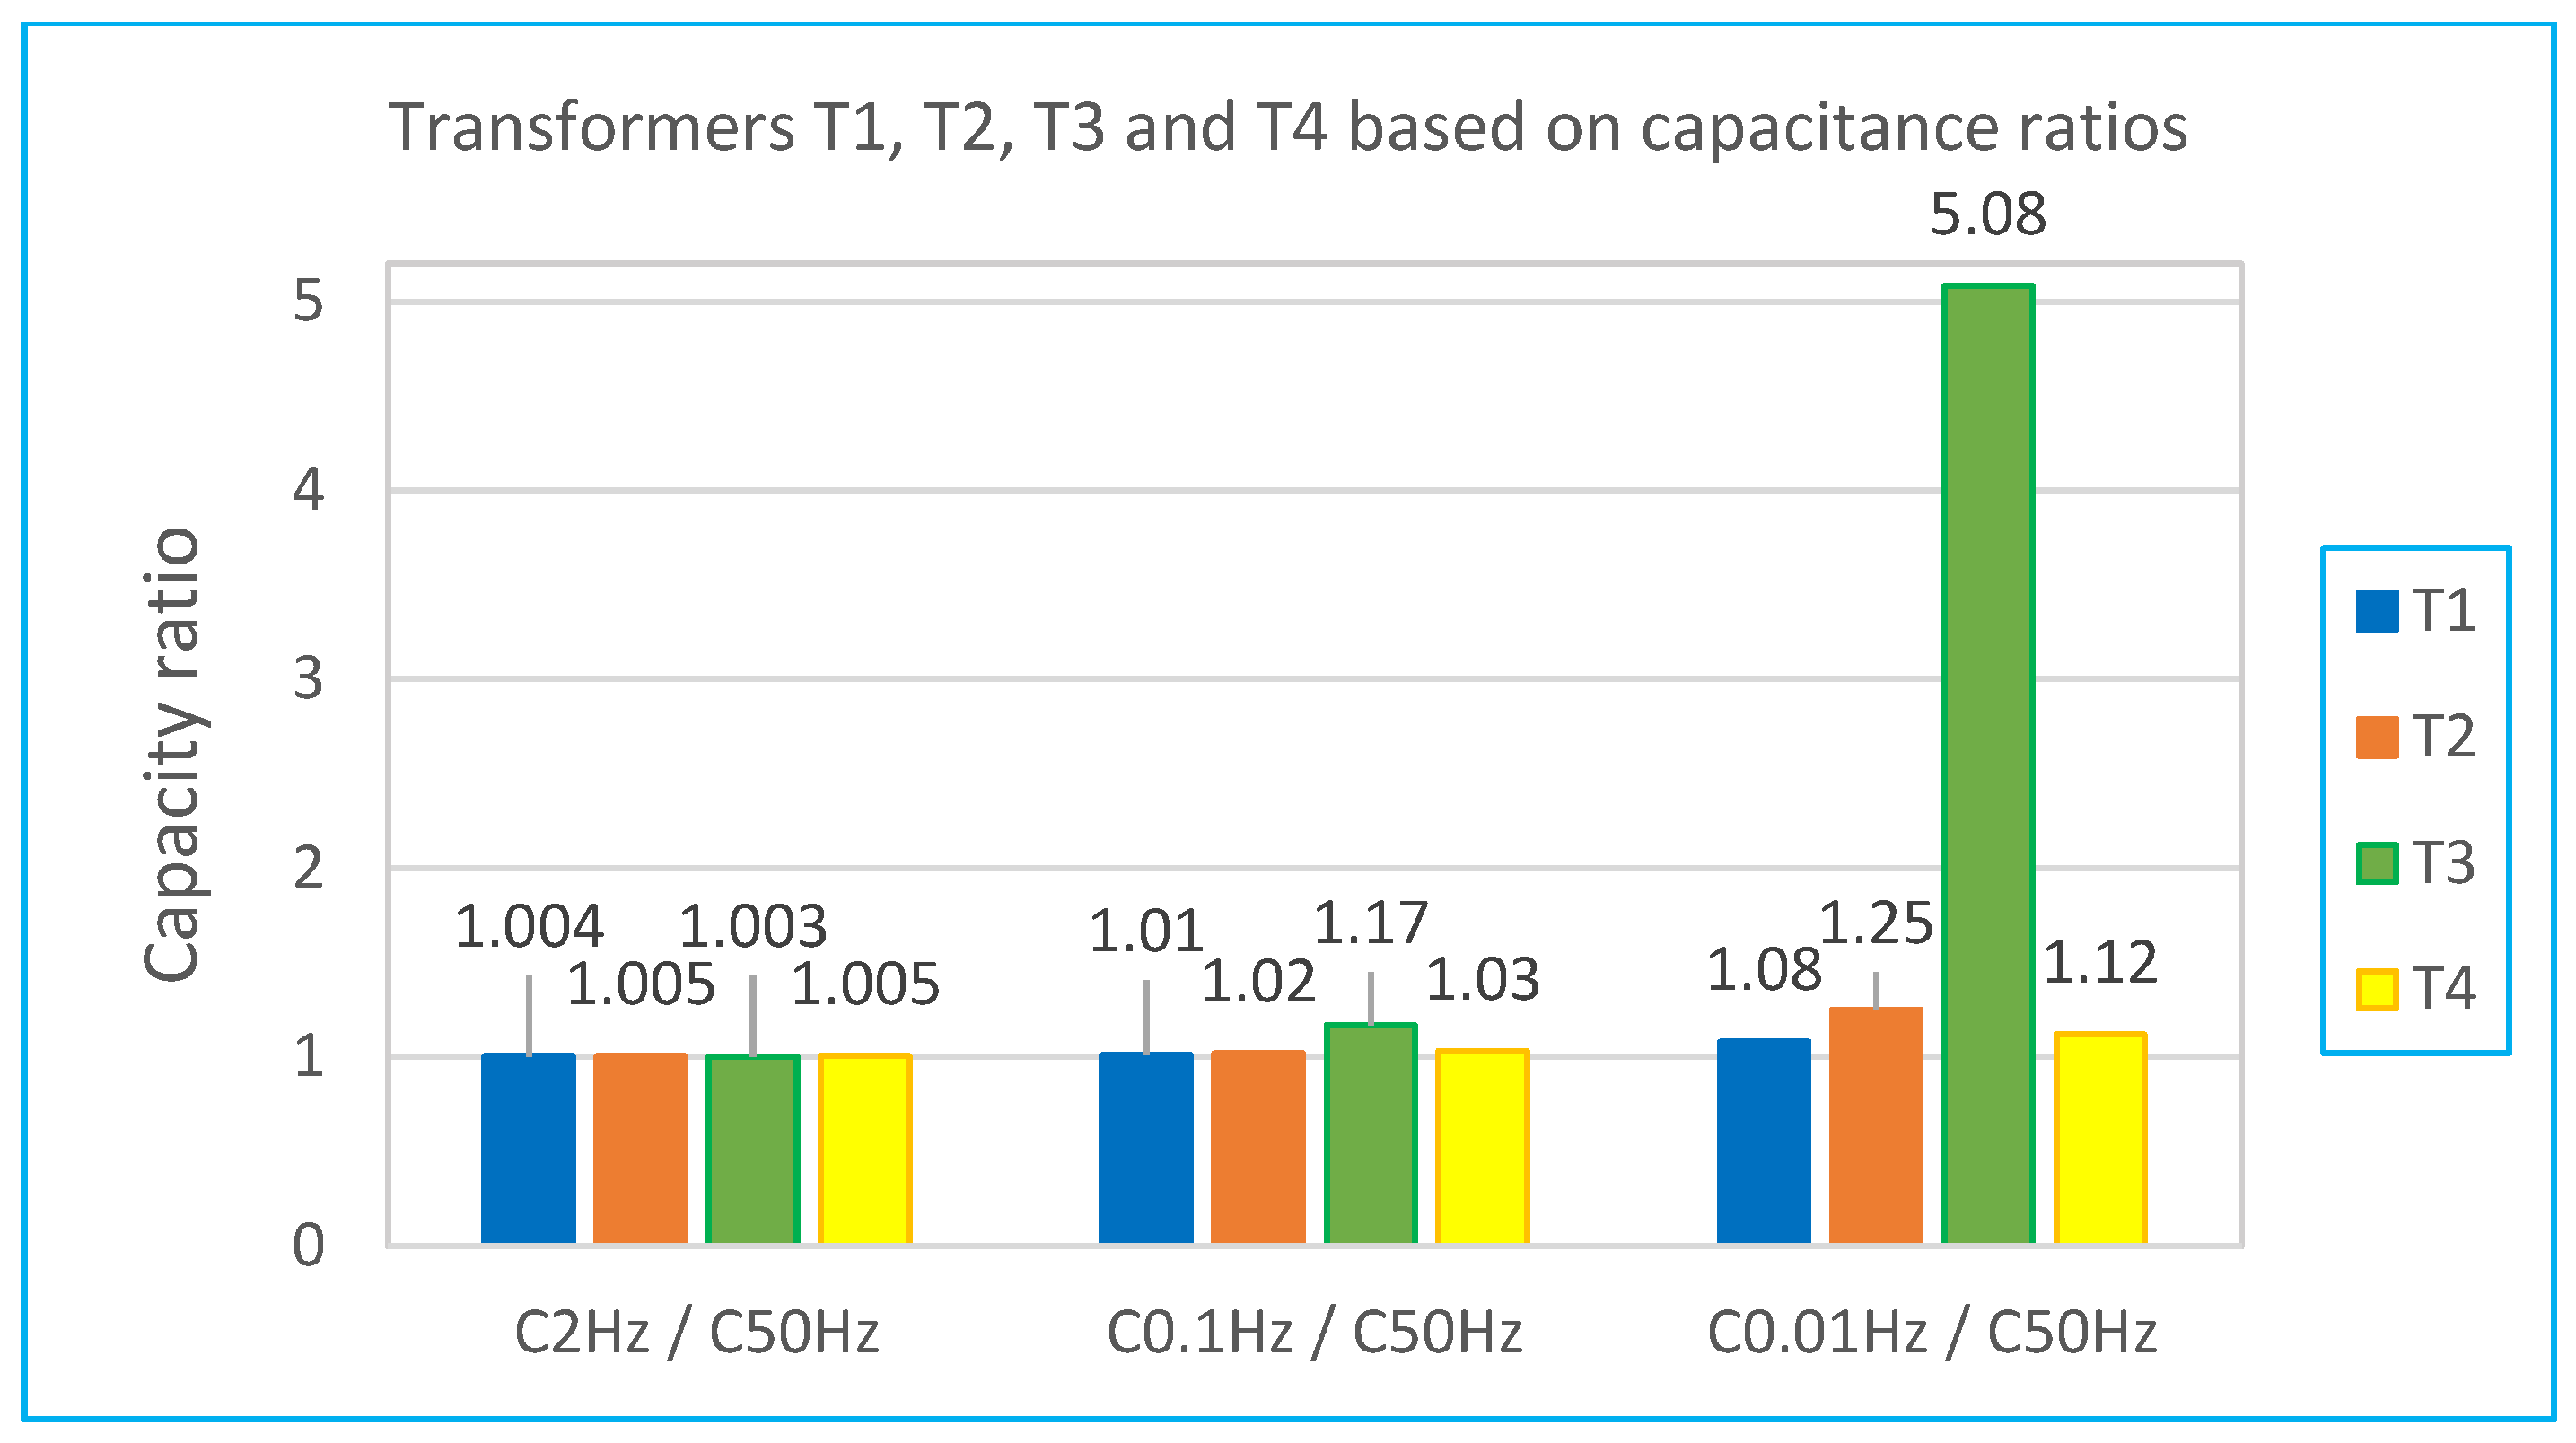
Capacitance ratio methods at two frequencies were applied for insulation condition evaluation (
Figure 11). For the most accurate assessment, the capacitance ratio at the lowest frequency of 0.01 Hz relative to 50 Hz was used. Transformer T3 demonstrated the poorest insulation with a ratio of 5.08, clearly distinguishing it from the others.
5.2. Comparison of the Frequency Dependence of High-Voltage Transformer Capacities with Extremely Wet Insulation
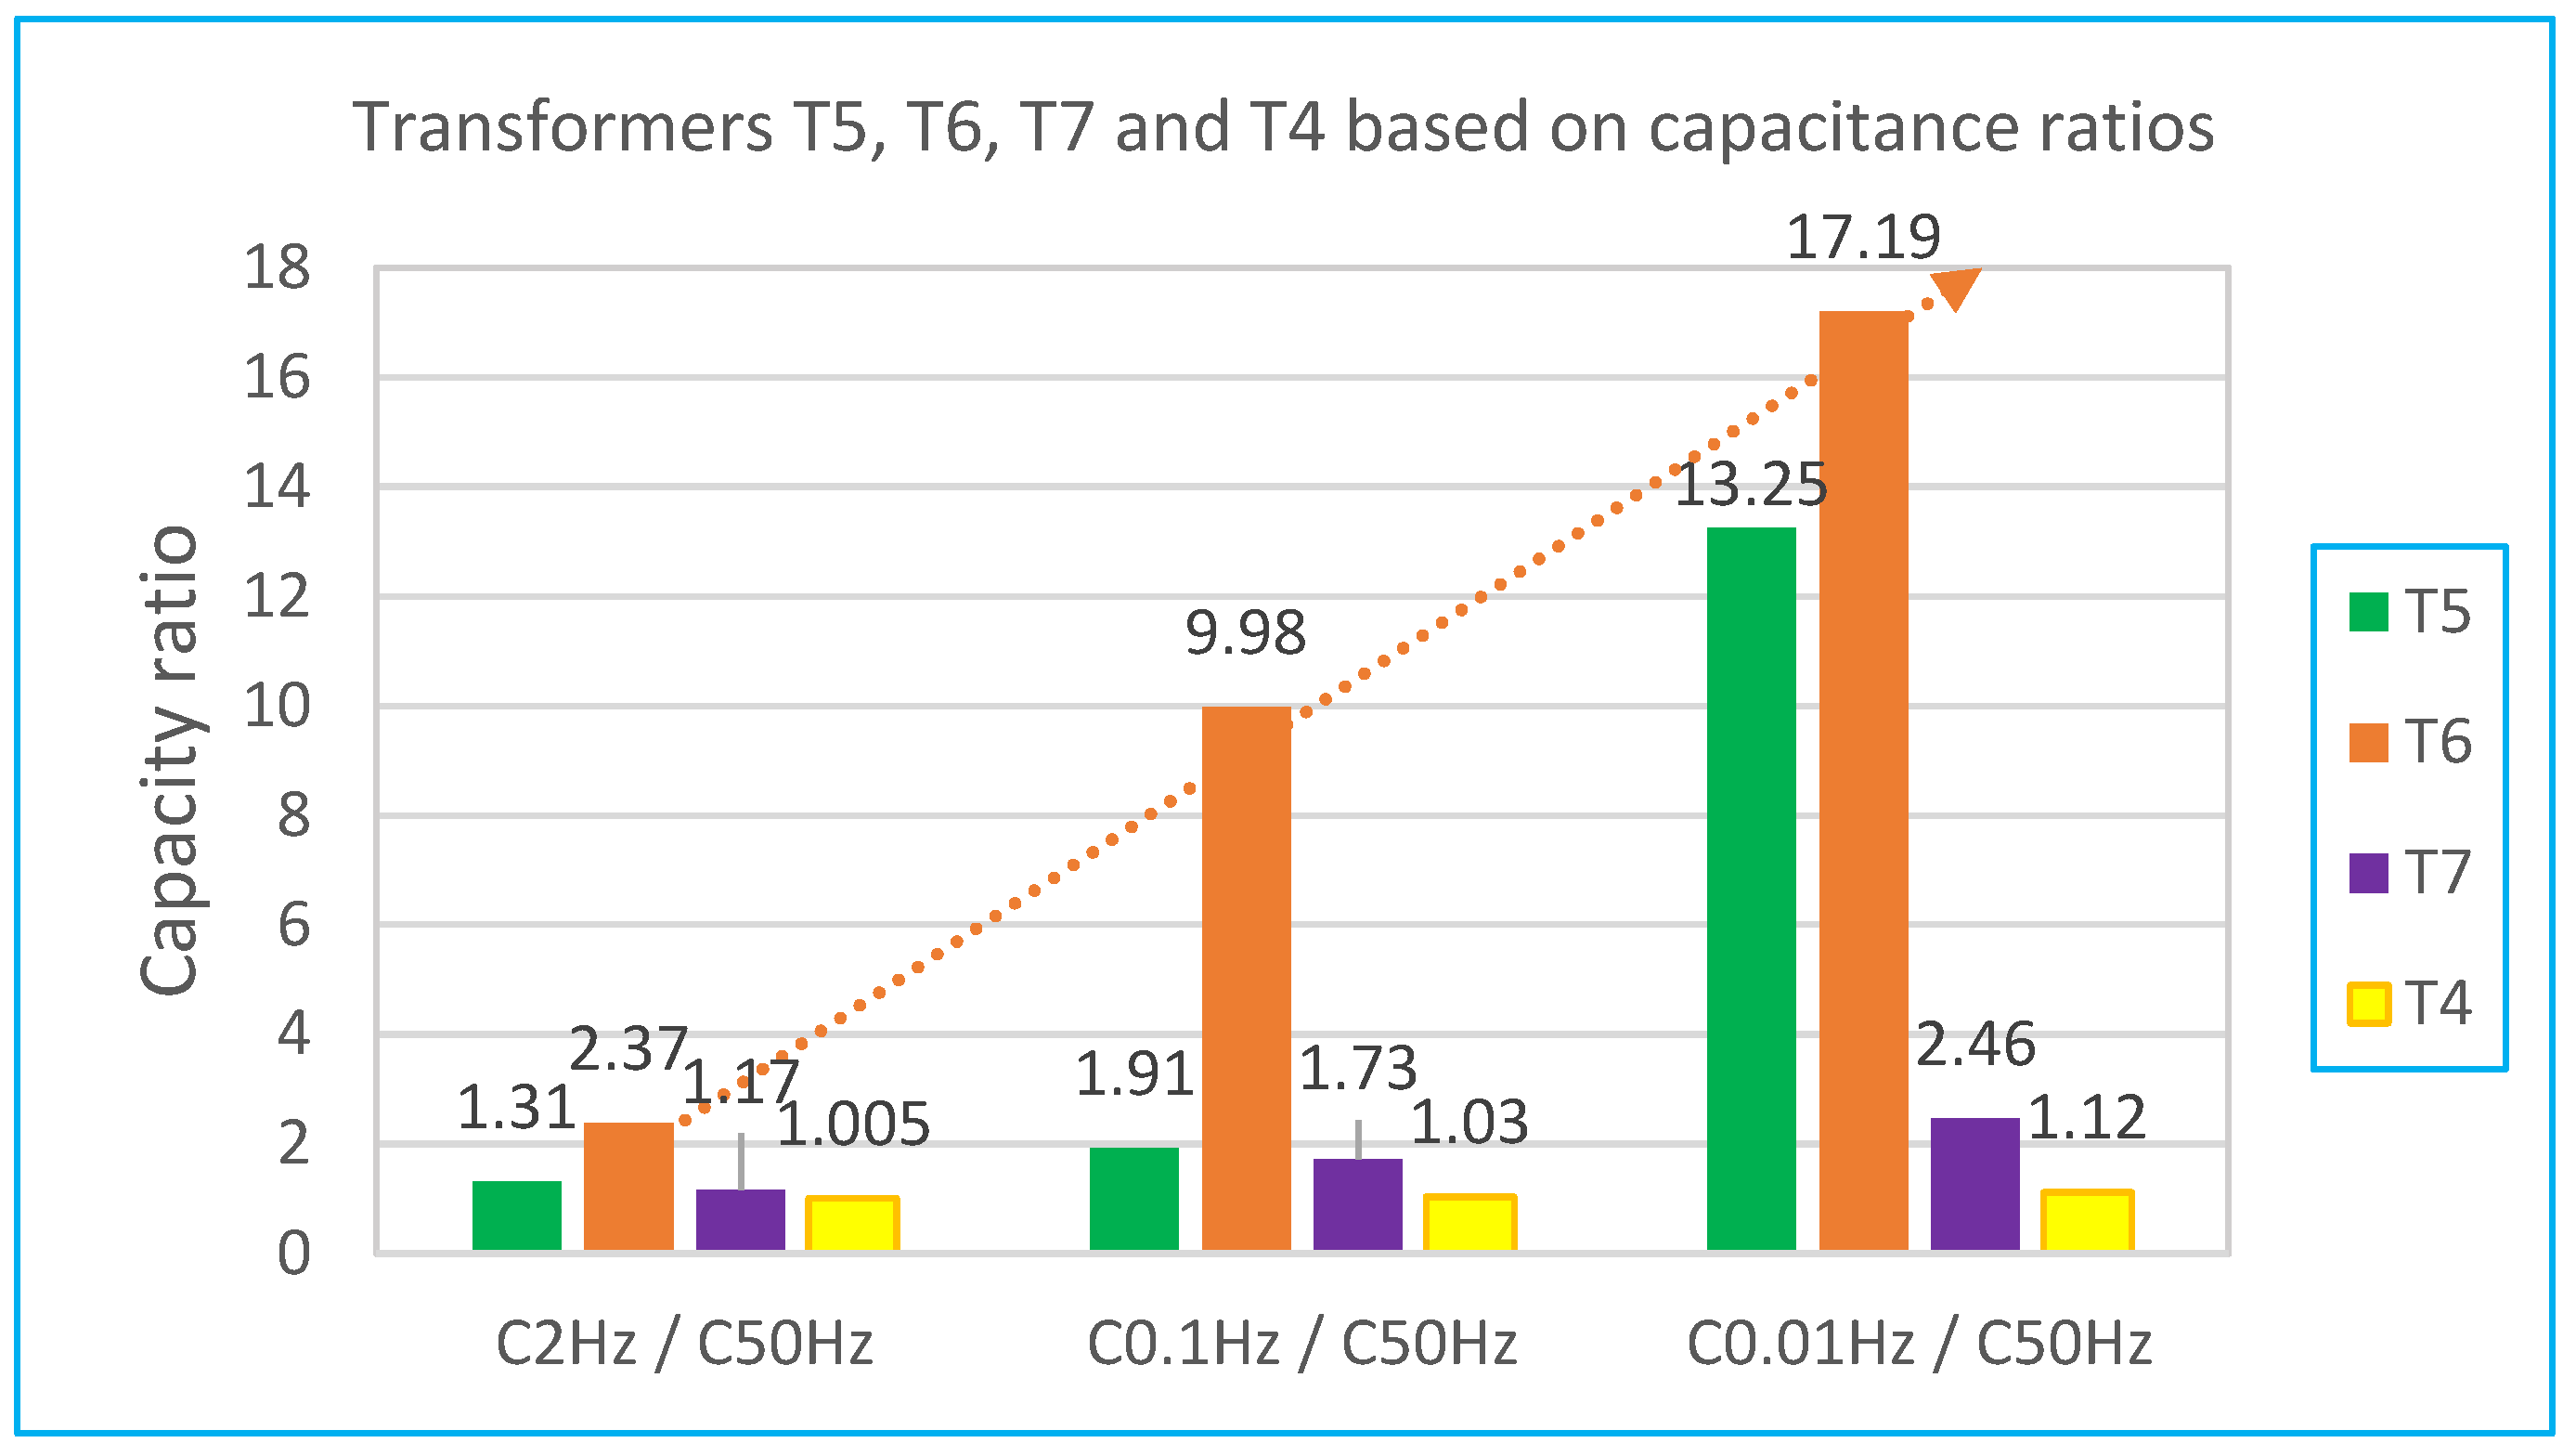
Figure 12 displays frequency-dependent capacitance curves for three transformers (T5, T6, and T7), each rated 100 kVA with extremely high insulation moisture, and one transformer (T4) at 630 kVA with normal insulation. Significant capacitance increases at lower frequencies (100–1000 Hz) in transformers T5, T6, and T7, relative to T4, reflect elevated oil conductivity, notably T6’s extremely high conductivity (17,164 pS/m).
These findings are confirmed using capacitance ratios at frequencies from 2 Hz to 50 Hz (
Figure 13), with transformer T6 exhibiting the highest ratio. Lower ratios for transformers T5 and T7 correlate directly to their relative oil conductivity. For better readability,
Figure 12 compares the insulation properties of the transformers together with transformer T4, which has already been analyzed in
Figure 10. The lowest capacitance ratios correspond to transformer T4 with normal insulation.
This observation is further confirmed by evaluating the capacitance ratio method at frequencies from 2 Hz to 50 Hz, as summarized in
Figure 13. Transformer T6 exhibits the highest capacitance ratio, followed by transformers T5 and T7, correlating directly with the relative conductivity levels of their insulating oils. Conversely, the reference transformer T4, having normal insulation conditions, shows the lowest capacitance ratio.
When comparing the capacitance values of transformer T4 (630 kVA) with those of transformers T5, T6, and T7 (each 100 kVA), it is no longer necessary to consider the differences in insulation geometry (oil-paper systems). In addition, it is possible to follow the trend line at three points and thus analyse the further development of the increase at lower frequencies of capacity relative to the capacity at 50 Hz.
Figure 13 shows an example of adding a trend line to transformer T6 with extremely high humidity.
5.3. Insulation Analysis of the Selected Transformer by the Capacity Ratio Method at Various Temperatures
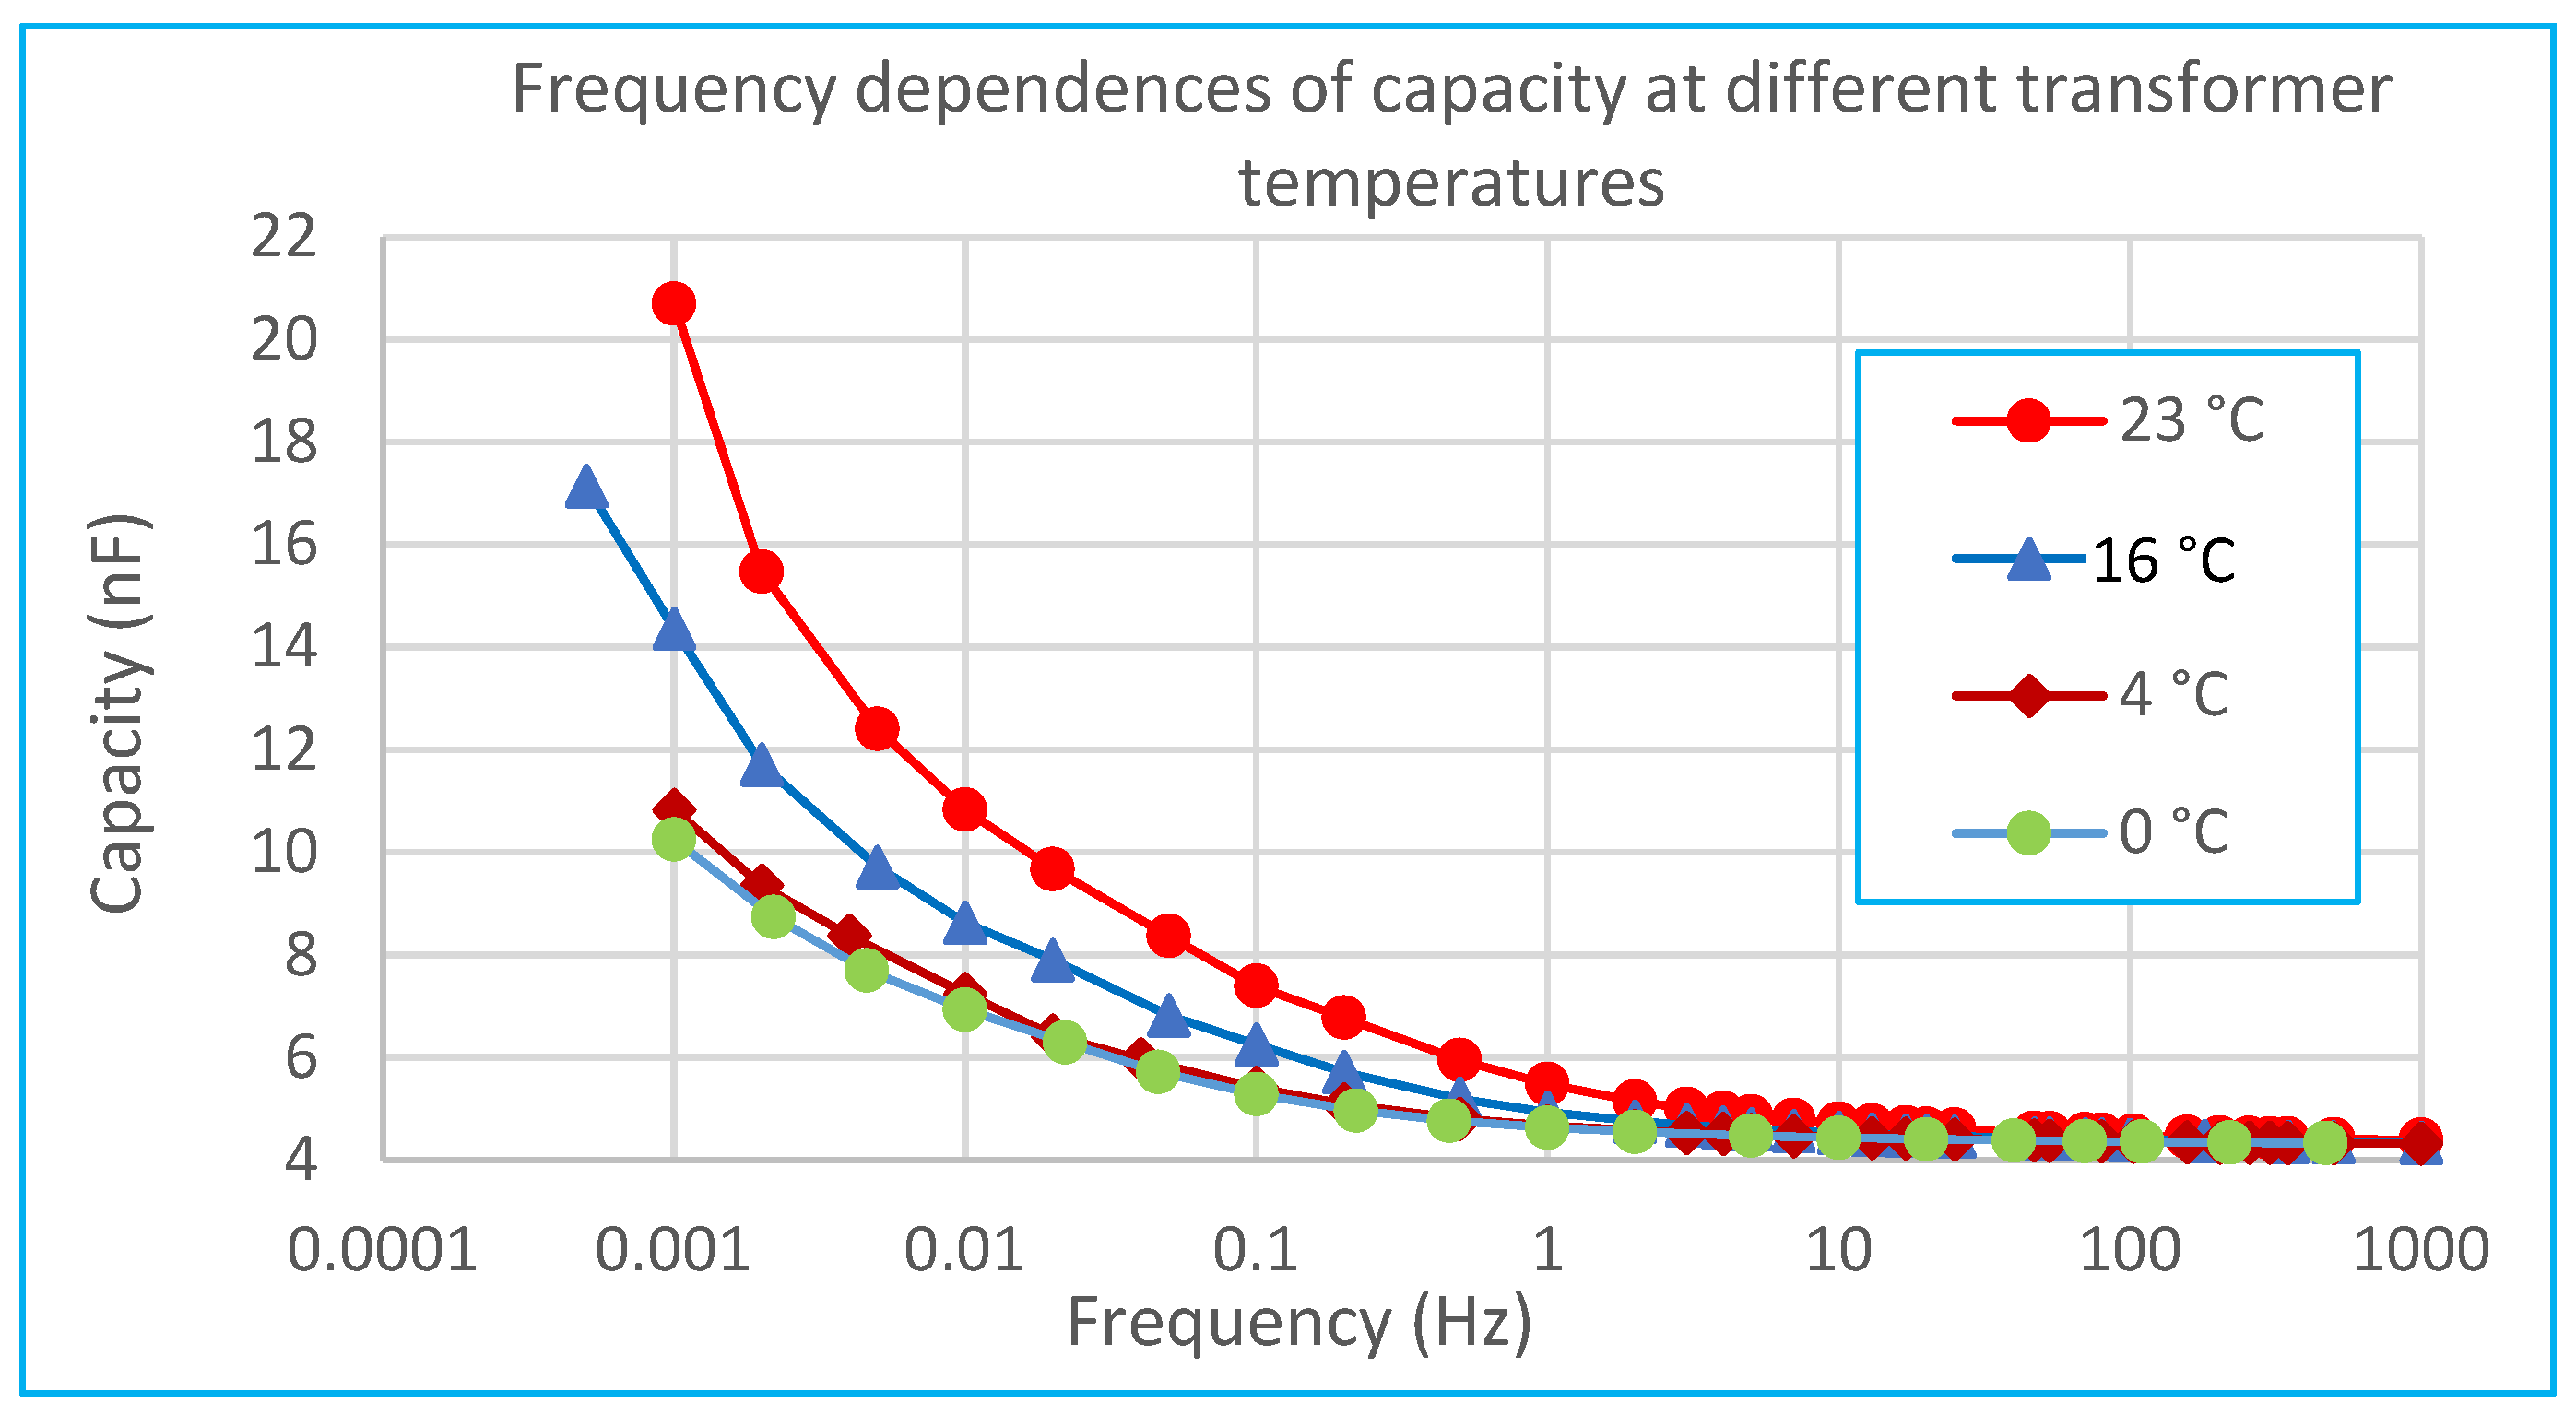
In addition to evaluating insulation conditions, the described capacitance ratio method can also compare capacitance measurements at multiple temperatures. For this analysis, frequency-dependent capacitance and dissipation factor curves of a selected transformer measured at four temperatures (0–4–16–23 °C) were used, as depicted in
Figure 14 and
Figure 15.
Applying the capacitance ratio method using frequencies such as
C2Hz/
C50Hz,
C0.1Hz/
C50Hz, and
C0.01Hz/
C50Hz requires selecting capacitance values at frequencies 0.01, 0.1, 2, and 50 Hz from the measured curves. The resulting capacitance ratios are summarized clearly in
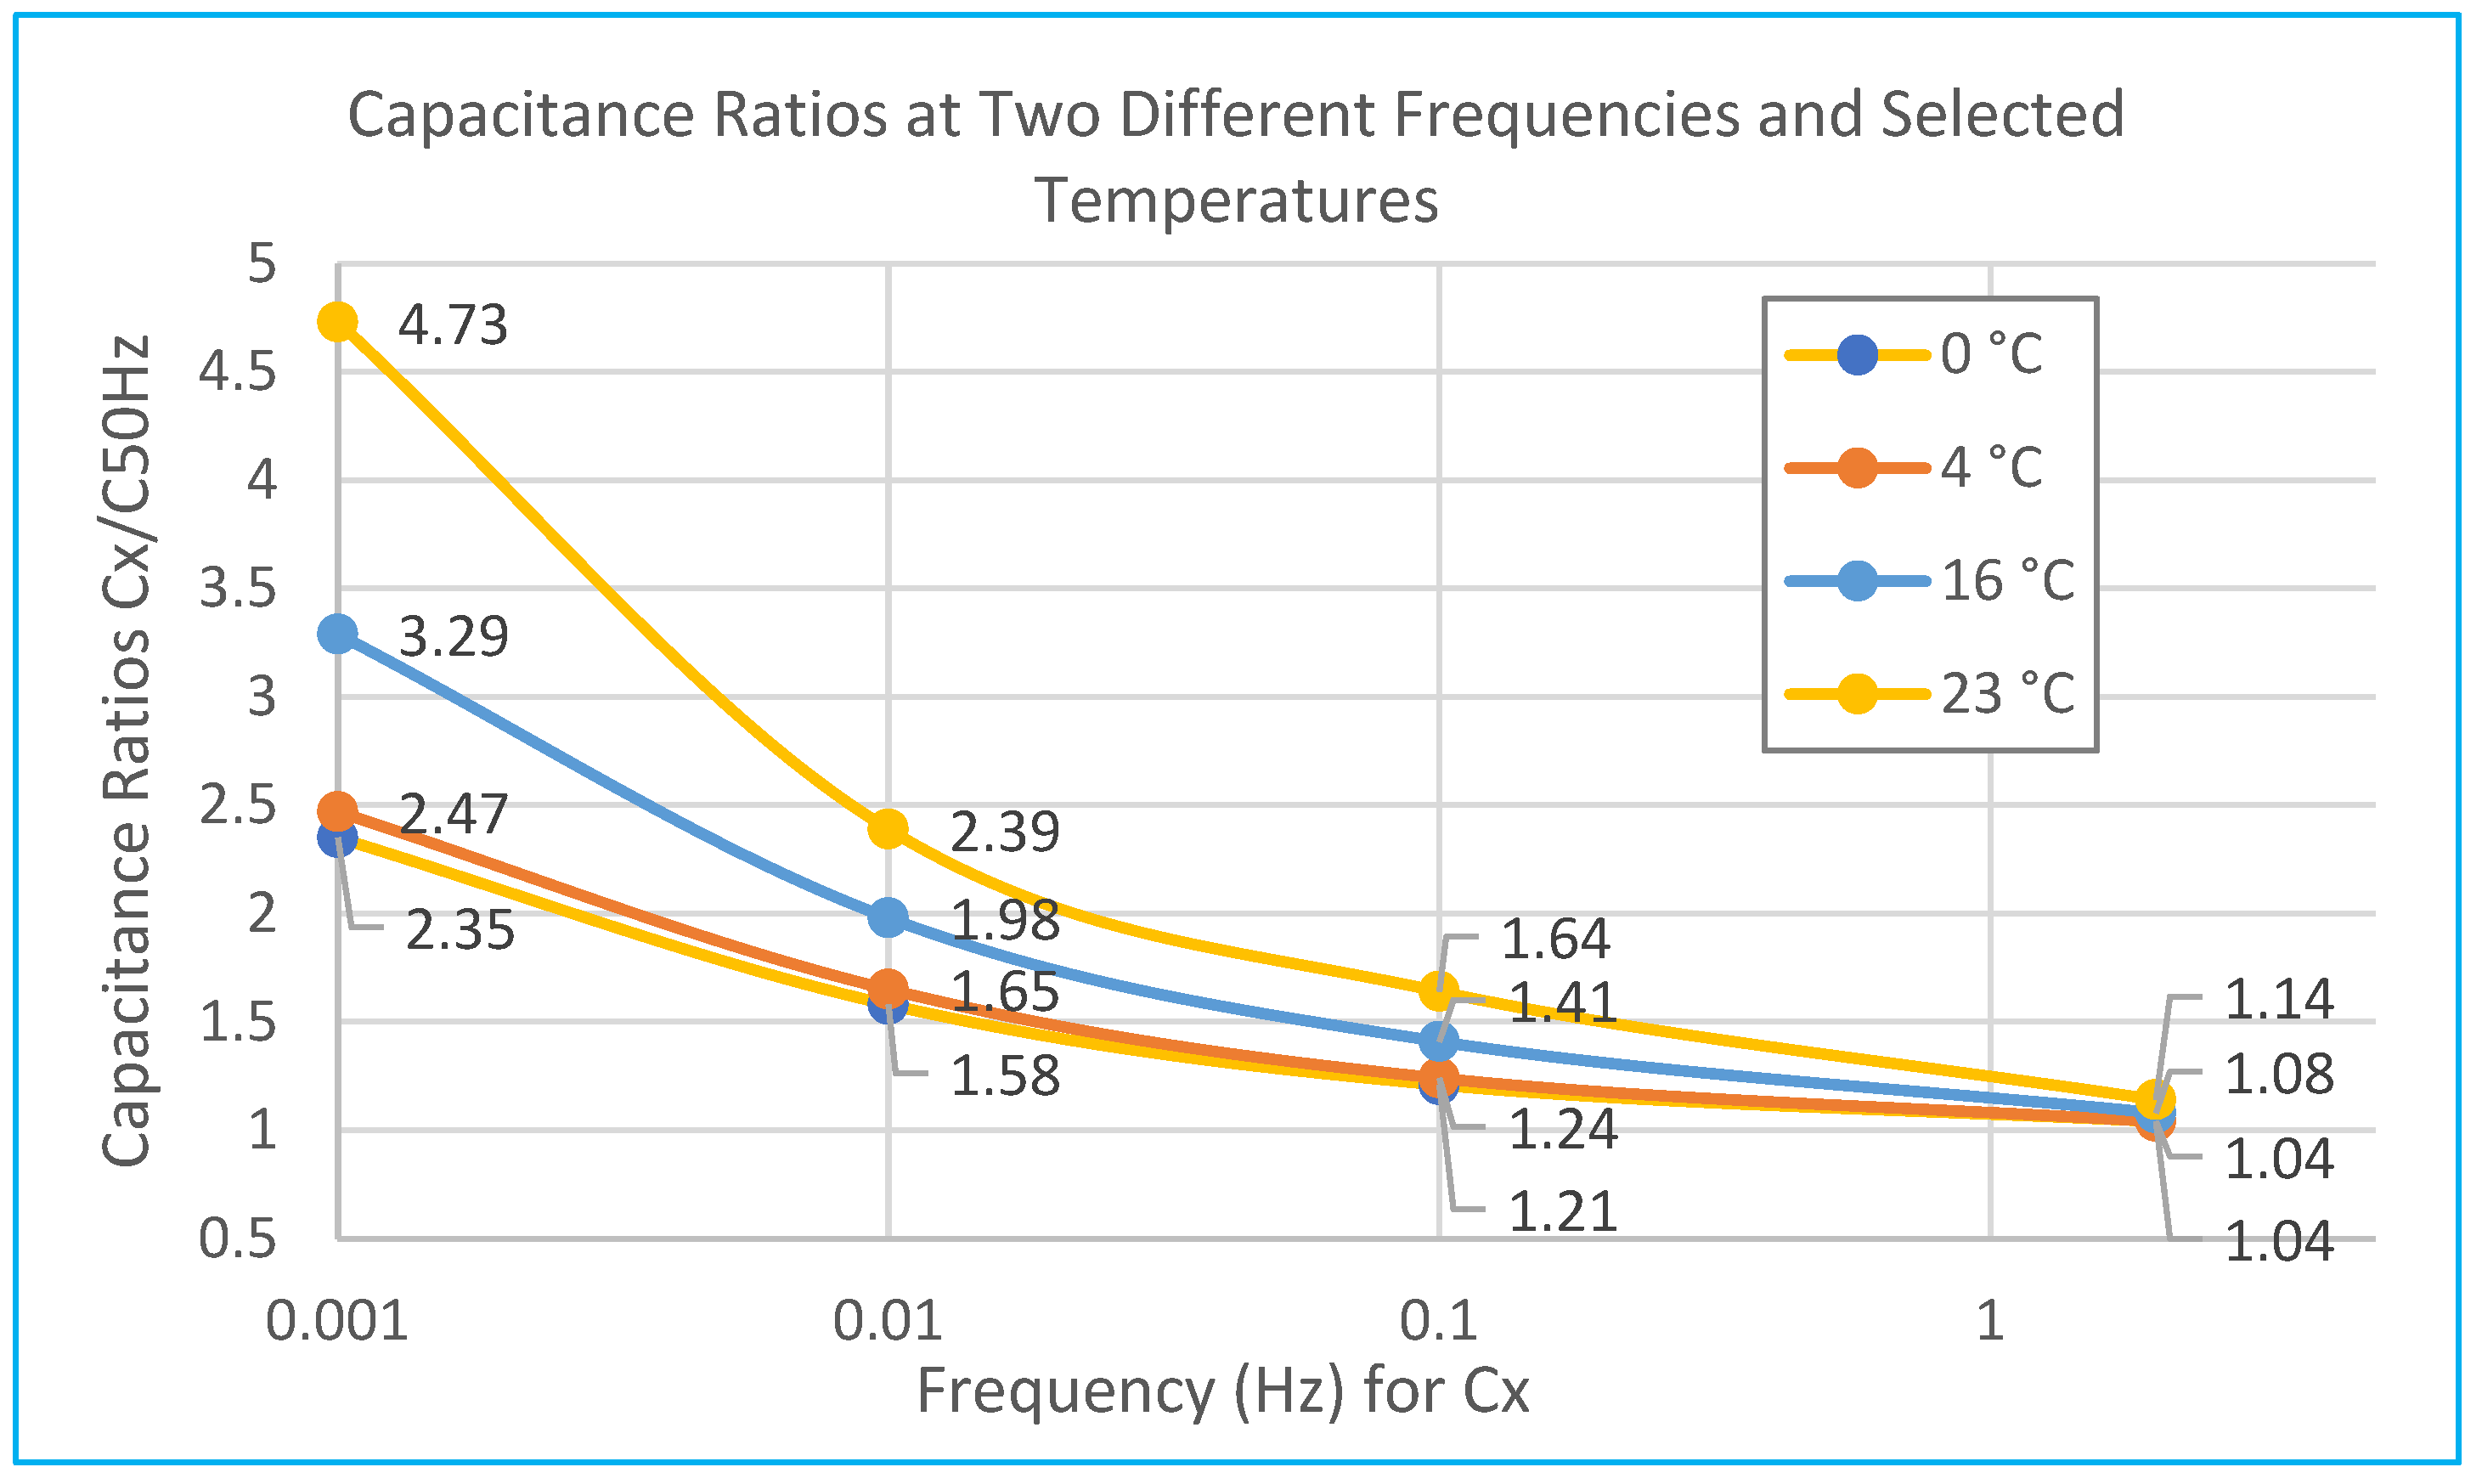
Figure 16.
Compared to the frequency-dependent dissipation factor of the tested high-voltage transformer, the relative differences between temperatures for the capacitance ratio are lower.
The traditional capacitance ratio (
C2Hz/
C50Hz) inaccurately indicated relatively dry insulation across all measured temperatures, with ratios not exceeding 1.2 (
Figure 16). However, by lowering the frequency ratio to
C0.1Hz/
C50Hz, ratios above 1.5 become noticeable. Further reducing the frequency to
C0.01Hz and
C0.001Hz clearly shows the highest ratio at 23 °C (2.39 and 4.72 in
Figure 16). However, a significant advantage of the
C2Hz/
C50Hz ratio is its temperature independence, as the differences for different temperatures are minimal (between 0 and 23 °C, it is only a 9.6% difference).
At the lowest temperatures (0 and 4 °C), the transformer presented the lowest capacitance ratios, misleadingly indicating superior insulation conditions. Thus, for reliable insulation assessment, it is recommended to perform evaluations at higher temperatures using capacitance ratios at lower frequencies, specifically C0.01Hz/C50Hz and C0.001Hz/C50Hz.
6. Discussion
In order to avoid the geometric influence of the insulation system depending on the transformer power, we performed an analysis of the comparison of the ratio of two capacitances against the determined parameters of paper humidity and oil conductivity. According to
Figure 17, transformers T1, T2, T3, T4, and T7 are sorted according to the ratio of the two capacities, sequentially from the lowest value to the highest, and the values of humidity (%) and relative oil conductivity (pS/m) are compared to them. Transformers T6 and T5 are not shown graphically due to significant oil conductivity values (17,164 and 2145 pS/m) compared to significantly lower values of the other compared transformers. They also have the same trend of increasing
C0.01Hz/
C50Hz ratio with increasing oil conductivity.
According to experimental measurements, the ratio of two capacitances C0.01Hz/C50Hz, i.e., for frequencies of 0.01 Hz to 50 Hz, was sufficient for the reliability of the above analysis. Therefore, it was not necessary to address the ratio of capacitances to a lower frequency (e.g., for 0.001Hz, i.e., C0.001Hz/C50Hz). These tests were performed at a constant ambient temperature of 7 °C, eliminating temperature as a variable.
Another significant advantage of the ratio
C0.01Hz/
C50Hz over
C0.001Hz/
C50Hz is the lower temperature influence on the measurement result in the temperature range 0–23 °C (
Figure 16). The higher the frequency with which we can reliably assess the quality of the insulation, the lower the demands on the accuracy of temperature determination.
From the above comparison of results according to
Figure 15, it is clear that when the ratio of capacitances to lower frequencies increases relative to 50 Hz, the relative conductivity of the oil also increases accordingly. On the contrary, a significant influence of the humidity content of the solid insulation on the provided capacitance ratio was not confirmed, as shown according to the theory in
Figure 9. Even with the capacitance ratio
C0.01Hz/
C50Hz (5.08) of the T3 transformer at a lower humidity of 2.9%, the magnitude of the capacitance ratio was influenced by its higher oil conductivity (30.2 pS/m) than that of the T7 transformer with a humidity of 3.3% and an oil conductivity of only 10.1 pS/m (
Figure 11 and
Figure 13). Thanks to this knowledge, the capacitance ratio method will only be used to investigate oil conductivity because it is not sensitive to paper-moisture analysis. In transformers T1 and T4 with the same power (630 kVA), there was a significant difference in paper moisture (by more than 100% – 1% and 2.2%) at almost the same oil conductivity value (1.7 pS/m). When analyzing the capacitance itself, there was an almost constant difference of 11 to 13% when analyzing the capacitance ratio, there was only a difference of 3% at
C0.01Hz/
C50Hz.
According to the above analysis, the ratio of two capacitances can only be used for oil-quality analysis with relatively high reliability.
7. Conclusions
Based on the conducted diagnostic analyses, the importance of frequency dielectric spectroscopy (FDS) in evaluating the insulation condition of high-voltage transformers has been clearly established. The FDS method allows for the independent evaluation of transformer oil quality and moisture content within solid insulation. Additionally, the research highlights those comparative analyses across multiple transformers significantly contribute to advancing diagnostic methods.
A notable advantage of using capacitance measurements via FDS to evaluate insulation conditions is their lower sensitivity to temperature fluctuations, compared to loss factor measurements. Consequently, when temperature determination is uncertain, it is advisable to prioritize capacitance frequency analyses over loss-factor evaluations.
However, a limitation of capacitance-based diagnostics is their sensitivity to insulation geometry, influenced by transformer type and power rating.
A beneficial finding of the aforementioned analysis was that the capacitance ratio showed smaller differences when analysing the insulation properties of transformers with different geometric designs and ratings than when measuring capacitance alone. According to these findings, it will be recommended for the diagnosis of insulating parts that when measuring various types and powers of transformers at the voltage level of 22/0.4 kV, the capacitance ratio should be used when measuring by the FDS method.
Another fact found was that it was not possible to identify a significant influence of paper humidity on the overall evaluation of transformer insulation using the capacitance ratio. Thanks to this knowledge, the capacitance ratio method will only be used for investigating oil conductivity because the paper’s moisture sensitivity analysis was not detected.
The experimental analyses also emphasized the critical role temperature determination plays in ensuring the accuracy and reliability of the FDS method for assessing insulation in oil-filled power transformers. To reduce the influence of temperature, a C2Hz/C50Hz ratio is recommended, as the differences for different temperatures in the range from 0 to 23 °C have been shown to be minimal.
The analyses underline the importance of accurately measured capacitance and dissipation factor values at selected frequencies for dependable evaluations using frequency dielectric spectroscopy.
Such diagnostic procedures facilitate predicting potential transformer failures due to insulation aging, enabling timely maintenance interventions (such as oil replacement, cleaning, or paper insulation drying) to ensure uninterrupted transformer operation.


