Article

An Automated and Efficient Slope Unit Division Method Coupled with Computer Graphics and Hydrological Principles

1
School of Geosciences and Info-Physics, Central South University, 932 Lushan South Road, Changsha 410083, China
2
Key Laboratory of Metallogenic Prediction of Nonferrous Metals and Geological Environment Monitoring (Central South University), Ministry of Education, 932 Lushan South Road, Changsha 410083, China
3
School of Civil Engineering, Yantai University, Yantai 264005, China
4
Hunan Province Geological Disaster Survey and Monitoring Institute, Changsha 410029, China
5
Geological Survey Institute of Hunan Province, Changsha 410083, China
*
Author to whom correspondence should be addressed.
Appl. Sci. 2025, 15(9), 4647; https://doi.org/10.3390/app15094647
Submission received: 20 March 2025 / Revised: 19 April 2025 / Accepted: 21 April 2025 / Published: 23 April 2025

Abstract

:
Slope units serve as fundamental spatial units for surface morphology modeling and multidisciplinary coupling analysis, holding significant theoretical value and practical implications in regional stability assessments, surface process simulations, and quantitative geological engineering research. The scientific delineation of slope units must simultaneously satisfy engineering implementation requirements and adhere to the unit homogeneity principle. However, conventional delineation like the hydrological process analysis method (HPAM) exhibits critical limitations, including strong threshold dependency, a low automation level, and single-attribute optimization, thereby restricting its applicability in complex scenarios. Based on the principles of unit consistency and hydrological processes, this study integrates computer graphics algorithms with hydrological process simulation techniques to propose an automated slope unit division method coupled with computer graphics and hydrological principles (SUD-CGHP). The method employs digital elevation model (DEM) input data to construct a three-stage hierarchical framework comprising (1) terrain skeleton extraction through a morphological erosion algorithm, (2) topological relationship iteration optimization, and (3) multisource parameter coupling constraints. This framework achieves automated slope unit delineation without thresholds while enabling multi-attribute fusion optimization, effectively addressing the shortcomings of HPAM. Field validation in Yanglousi Town, Hunan Province, demonstrates that SUD-CGHP-generated slope units exhibit superior internal homogeneity in flow direction, slope aspect, and gradient compared to HPAM while maintaining complete topographic–hydrological connectivity. The research findings indicate that this method significantly enhances the scientific validity and practical applicability of slope unit delineation, providing reliable spatial analysis units for multidisciplinary surface process modeling.

1. Introduction

The combined impacts of global climate change and anthropogenic engineering activities have significantly intensified geological environmental perturbations, which manifested through increased landslide occurrences and other associated geohazards [1,2,3,4,5,6]. According to official statistics from China’s Ministry of Emergency Management, annual direct economic losses attributed to landslides exceed USD 70 million, with over 100 fatalities recorded annually. The “Decision of the State Council on Strengthening Geological Disaster Prevention and Control” mandates that scientifically validated risk assessment systems constitute a critical technical foundation for implementing the national “community-based monitoring and prevention” policy. Given their fundamental role in risk evaluation [7,8,9,10,11,12], the methodological development of slope units [13,14,15] directly influences the precision of disaster early warning systems [3,16,17]. Therefore, innovative approaches achieving fine-grained resolution, full automation, and operational efficiency in slope unit delineation represent vital research directions.
Two principal paradigms dominate existing automated slope unit classification approaches based on digital elevation models (DEMs) [18,19,20,21,22]: the hydrological analysis methodology [23,24] and the unit homogeneity principle [25,26]. The hydrological analysis approach employs watershed extraction techniques to construct closed drainage basins. Notably, Huo et al. [27] developed a bidirectional DEM processing framework that integrates flow direction and flow volume parameters through forward and backward watershed analyses to establish slope units based on the hydrological process analysis method (HPAM). Extending this paradigm, Yan et al. [28] incorporated topographic curvature characteristics by deriving concave–convex terrain elements from curvature analysis, proposing a curvature watershed method for slope partitioning. Although these methods demonstrate operational simplicity, they exhibit critical limitations, including (1) dependency on expert-driven manual corrections and (2) significant intra-unit mechanical parameter heterogeneity.
The unit homogeneity principle posits that slope units should exhibit spatially consistent mechanical properties to satisfy the computational requirements of landslide stability analysis. Alvioli et al. [29,30] applied this principle by incorporating area and aspect control parameters, iteratively subdividing sub-watersheds obtained through flow accumulation analysis until user-defined threshold conditions were met. Wang et al. [31,32] redefined slope units as three-dimensional coherent, homogeneous, and closed regions by developing a hybrid methodology that combines morphological segmentation with aspect–slope homogeneity principles. Their approach involved both algorithmic automation and manual threshold adjustments. Huang et al. [33] further advanced this paradigm through multiscale segmentation algorithms that utilize slope and aspect inputs, achieving intra-unit consistency required for evaluation units. While these homogeneity-oriented methods enhance parameter uniformity, they neglect the hydrological processes’ regulatory role in landslide genesis, leading to systematic discrepancies between evaluation models and actual hydro-mechanical coupling mechanisms.
To address these methodological gaps, this research proposes an integrative framework that combines computer graphics algorithms [34,35,36] with hydro-mechanical principles. We redefine slope units as minimal closed hydrologically connected regions that simultaneously satisfy both hydrological connectivity and mechanical homogeneity requirements, overcoming traditional approaches’ techno-economic separation of hydrological features and mechanical parameters. Through the integration of connected component detection, KD-tree (K-dimensional tree) [37] spatial indexing, and adjacency region merging algorithms, we develop an adaptive segmentation model constrained by flow direction and aspect–slope parameters. This slope unit division method coupled with computer graphics and hydrological principles (SUD-CGHP) achieves synergistic optimization between hydrological boundaries and mechanical properties, preserving complete hydrological path continuity while maintaining parameter uniformity. It is noteworthy that Moretti and Orlandini [38] investigated the extraction of valley and ridge line networks from unmodified topographic data for constructing closed drainage basin systems, achieving highly terrain-conforming composite drainage basins with substantial practical value in hydrological modeling. However, considering the requirement for threshold-free automation in SUD-CGHP model development, this study opted to implement the KD-tree connectivity algorithm. Compared to conventional techniques, our framework provides geomechanically realistic fundamental units for landslide risk assessments through the integrated consideration of both hydrological processes and mechanical behavior mechanisms. Furthermore, SUD-CGHP facilitates the automation of geohazard [39,40,41,42] susceptibility assessments based on slope units while enhancing the unified application of multi-principal frameworks in slope unit methodologies. This approach establishes a novel analytical framework for evaluating model accuracy through comparative investigations of slope unit and raster-based cell representations. Moreover, building upon Schiavo’s [43] methodological advancement in shallow aquifer preferential flow network identification through quantile mapping optimization, this study proposes to employ mathematical optimization techniques for slope unit delineation improvements. This integrated approach enables simultaneous hydrological feature extraction and facilitates comprehensive integrated analysis with groundwater systems.

2. Methods

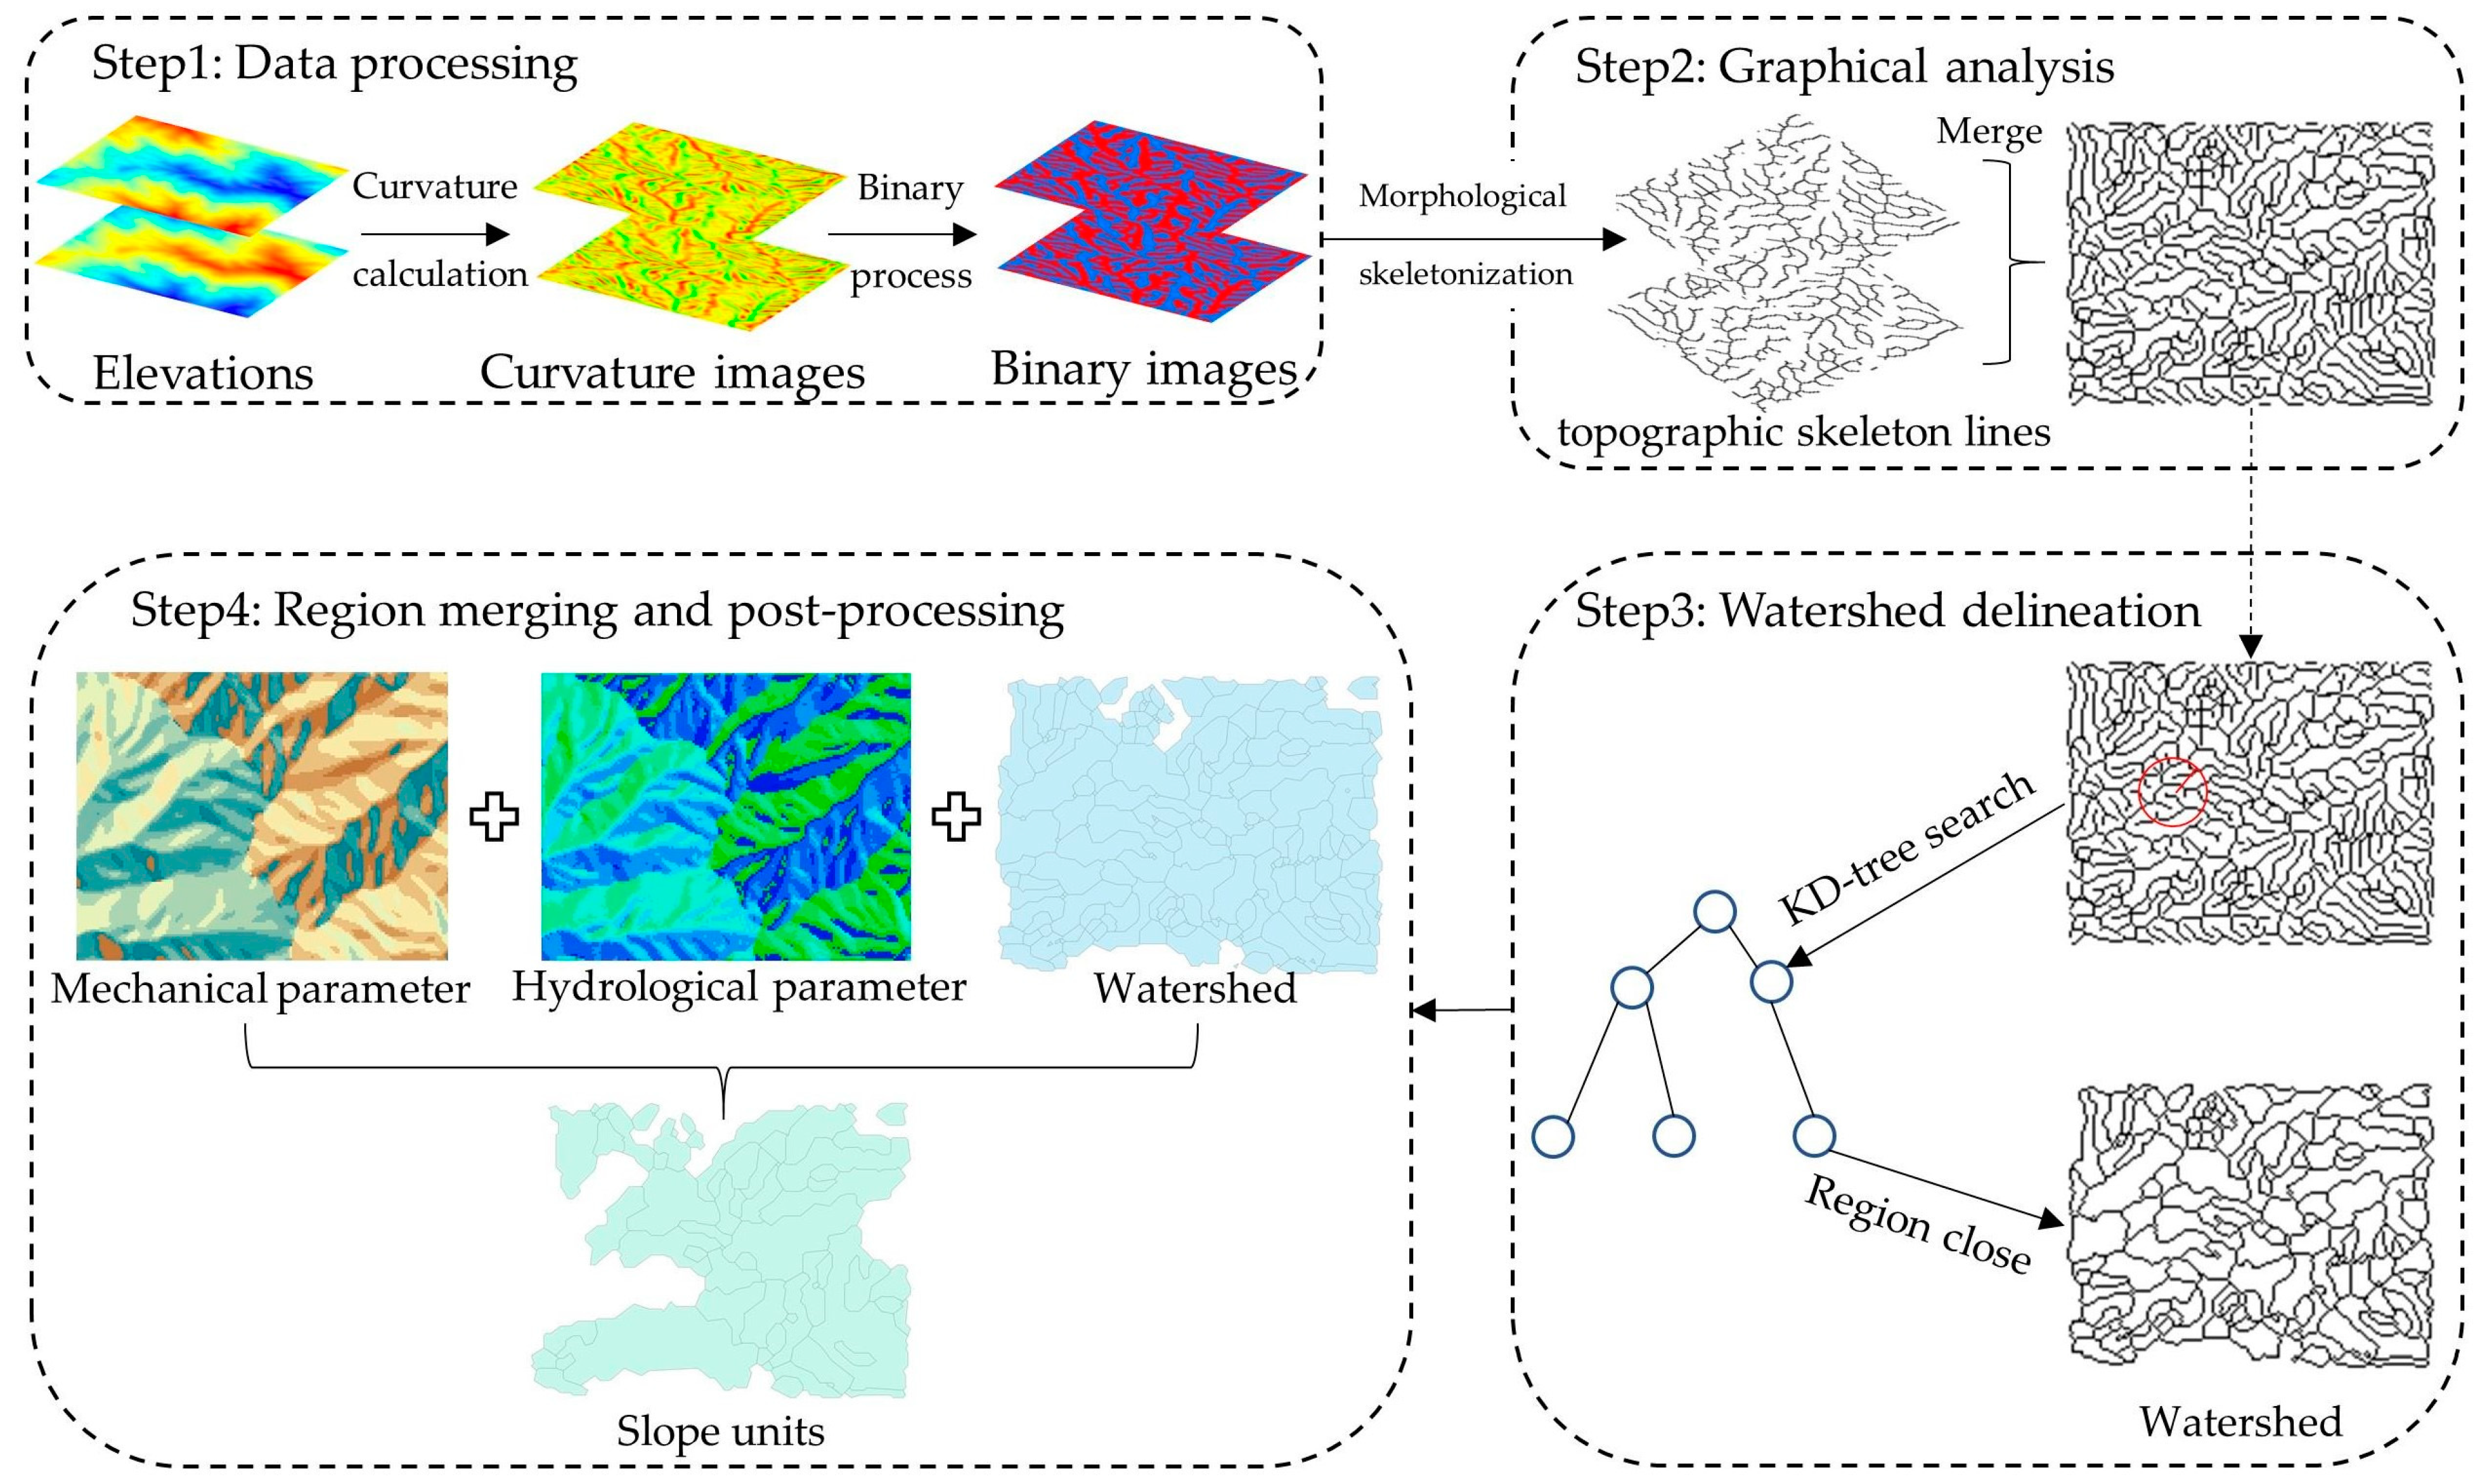
2.1. SUD-CGHP Method Workflow

This research develops an innovative slope unit delineation framework that integrates traditional hydrological partitioning methods with computer graphics technology, incorporating both hydrological and mechanical parameters as constraint conditions. The method enables fully automated and efficient mapping of scientifically valid slope units in the study area. The technical workflow is illustrated in Figure 1.
  • Step 1: Data Preprocessing
The method employs DEM as the primary terrain data source, followed by advanced digital image processing techniques including spatial filtering for noise reduction and mean curvature computation for terrain characterization. Through systematic thresholding based on computed mean curvature values, the processed DEM is classified into ridge and valley zones, which are subsequently converted into binary images through standardized thresholding operations to facilitate subsequent geometric analyses.
  • Step 2: Graphical Analysis
Morphological skeletonization is applied to the binary image matrix to extract topographic skeleton lines representing ridge and valley networks. This process involves graph–theoretic line simplification techniques to eliminate redundant vertices while preserving essential topographic features, ultimately generating a topologically consistent skeleton graph that captures the fundamental drainage patterns of the study area.
  • Step 3: Watershed Delineation
Building upon the extracted skeleton network, hydrological principles are integrated through iterative flow accumulation analysis and topological sorting algorithms to connect ridge–valley skeletons into coherent hydrological systems. This phase employs specific watershed construction protocols to form closed drainage regions, ensuring both geometric accuracy and hydrological consistency with the original terrain data.
  • Step 4: Region Merging and Post-processing
The initial watershed partitions are refined through hierarchical clustering based on the unit homogeneity principle. Multi-criteria merging criteria including mechanical parameter consistency, hydrological connectivity requirements, and topographical feature preservation guide the optimization process. Final post-processing includes morphological closing operations to eliminate artificial boundaries and achieve a balance between hydrological integrity and mechanical homogeneity, resulting in geomechanically valid slope units.

2.2. Implementation Process

2.2.1. Data Preprocessing

In computer image recognition applications, foreground elements are typically encoded as 1, while background features are represented as 0, with analysis focused on foreground data. However, conventional single-directional DEM processing can only effectively delineate ridge features. To obtain valley zones, DEM inversion is required to create complementary elevation profiles. This necessitates the integrated use of both forward and inverse DEM datasets for comprehensive terrain analysis.
To address the inherent noise sensitivity and directional artifacts arising from direct curvature computation on raw DEM data, we propose a two-stage multiscale filtering strategy that effectively balances noise suppression and topographic feature preservation. The initial preprocessing phase employs a low-pass filter to eliminate high-frequency elevation perturbations, which typically manifest as localized spikes and random variations. Subsequently, an anisotropic diffusion algorithm is applied to selectively attenuate directional streaks associated with data acquisition artifacts and geometric distortions while maintaining critical morphological elements such as ridge crests and valley bottoms. This hierarchical filtering approach ensures that both microscale noise components and macroscale linear features are appropriately conditioned, thereby enhancing the overall signal-to-noise ratio for subsequent curvature-based segmentation.
Based on Euler’s theorem of differential geometry, mean curvature (K) represents the averages of the profile curvature and the tangent curvature:
K = k v + k h 2
where kv denotes the profile curvature (first derivative of the slope along flowlines) and kh denotes represents the tangent curvature (second derivative of the aspect angle relative to flowlines). This combined curvature metric effectively captures both convex (ridge) and concave (valley) geomorphic elements. The profile curvature quantifies spatial slope variations, while the tangent curvature measures directional changes in the aspect angle, providing complementary geometric information for terrain characterization.
Following the two-stage filtering process, the conditioned DEM undergoes automated binary segmentation based on mean curvature values to achieve topological feature extraction. By assigning convex regions (K > 0) a numerical value of 1 and concave/flat regions (K ≤ 0) a numerical value of 0, this methodology effectively transforms continuous elevation data into a discrete representation of terrain elements. The thresholding operation not only distinguishes ridge–valley networks through curvature-based classification but also preserves geometric coherence by maintaining original surface connectivity and drainage patterns. This critical step establishes a clear separation between positive and negative curvature features while ensuring compatibility with downstream analyses that require binary terrain representations.

2.2.2. Graphical Analysis

Morphological skeletonization is a computational procedure that reduces binary shapes to their essential topological configurations through systematic thinning, preserving fundamental structural integrity and connectivity attributes. This method operationalizes the maximal circle algorithm (Figure 2) through complete iterative refinement, transforming binary images into skeleton curves where each point on the resultant line maintains equidistant relationships with multiple boundary pixels of the original object.
Using MATLAB’s bwmorph function, we implement skeletonization on the binary images generated through preceding data preprocessing stages. Conventional skeletonization approaches directly applied to raw binary matrices often produce fragmented loop closures with abundant small-area artifacts during post-processing. To mitigate this limitation, our methodology incorporates strategic morphological preprocessing prior to skeletonization to eliminate micronodules and isolated patches, as demonstrated by the comparative analysis in Figure 3. Finally, the skeleton lines extracted from both forward and inverse DEM computations undergo superposition and topological integration, resulting in a hybrid representation that synthesizes morphological refinements with geometric coherence. This final image achieves balanced preservation of topographic details and elimination of processing-induced artifacts, providing a robust foundation for advanced terrain analysis applications.

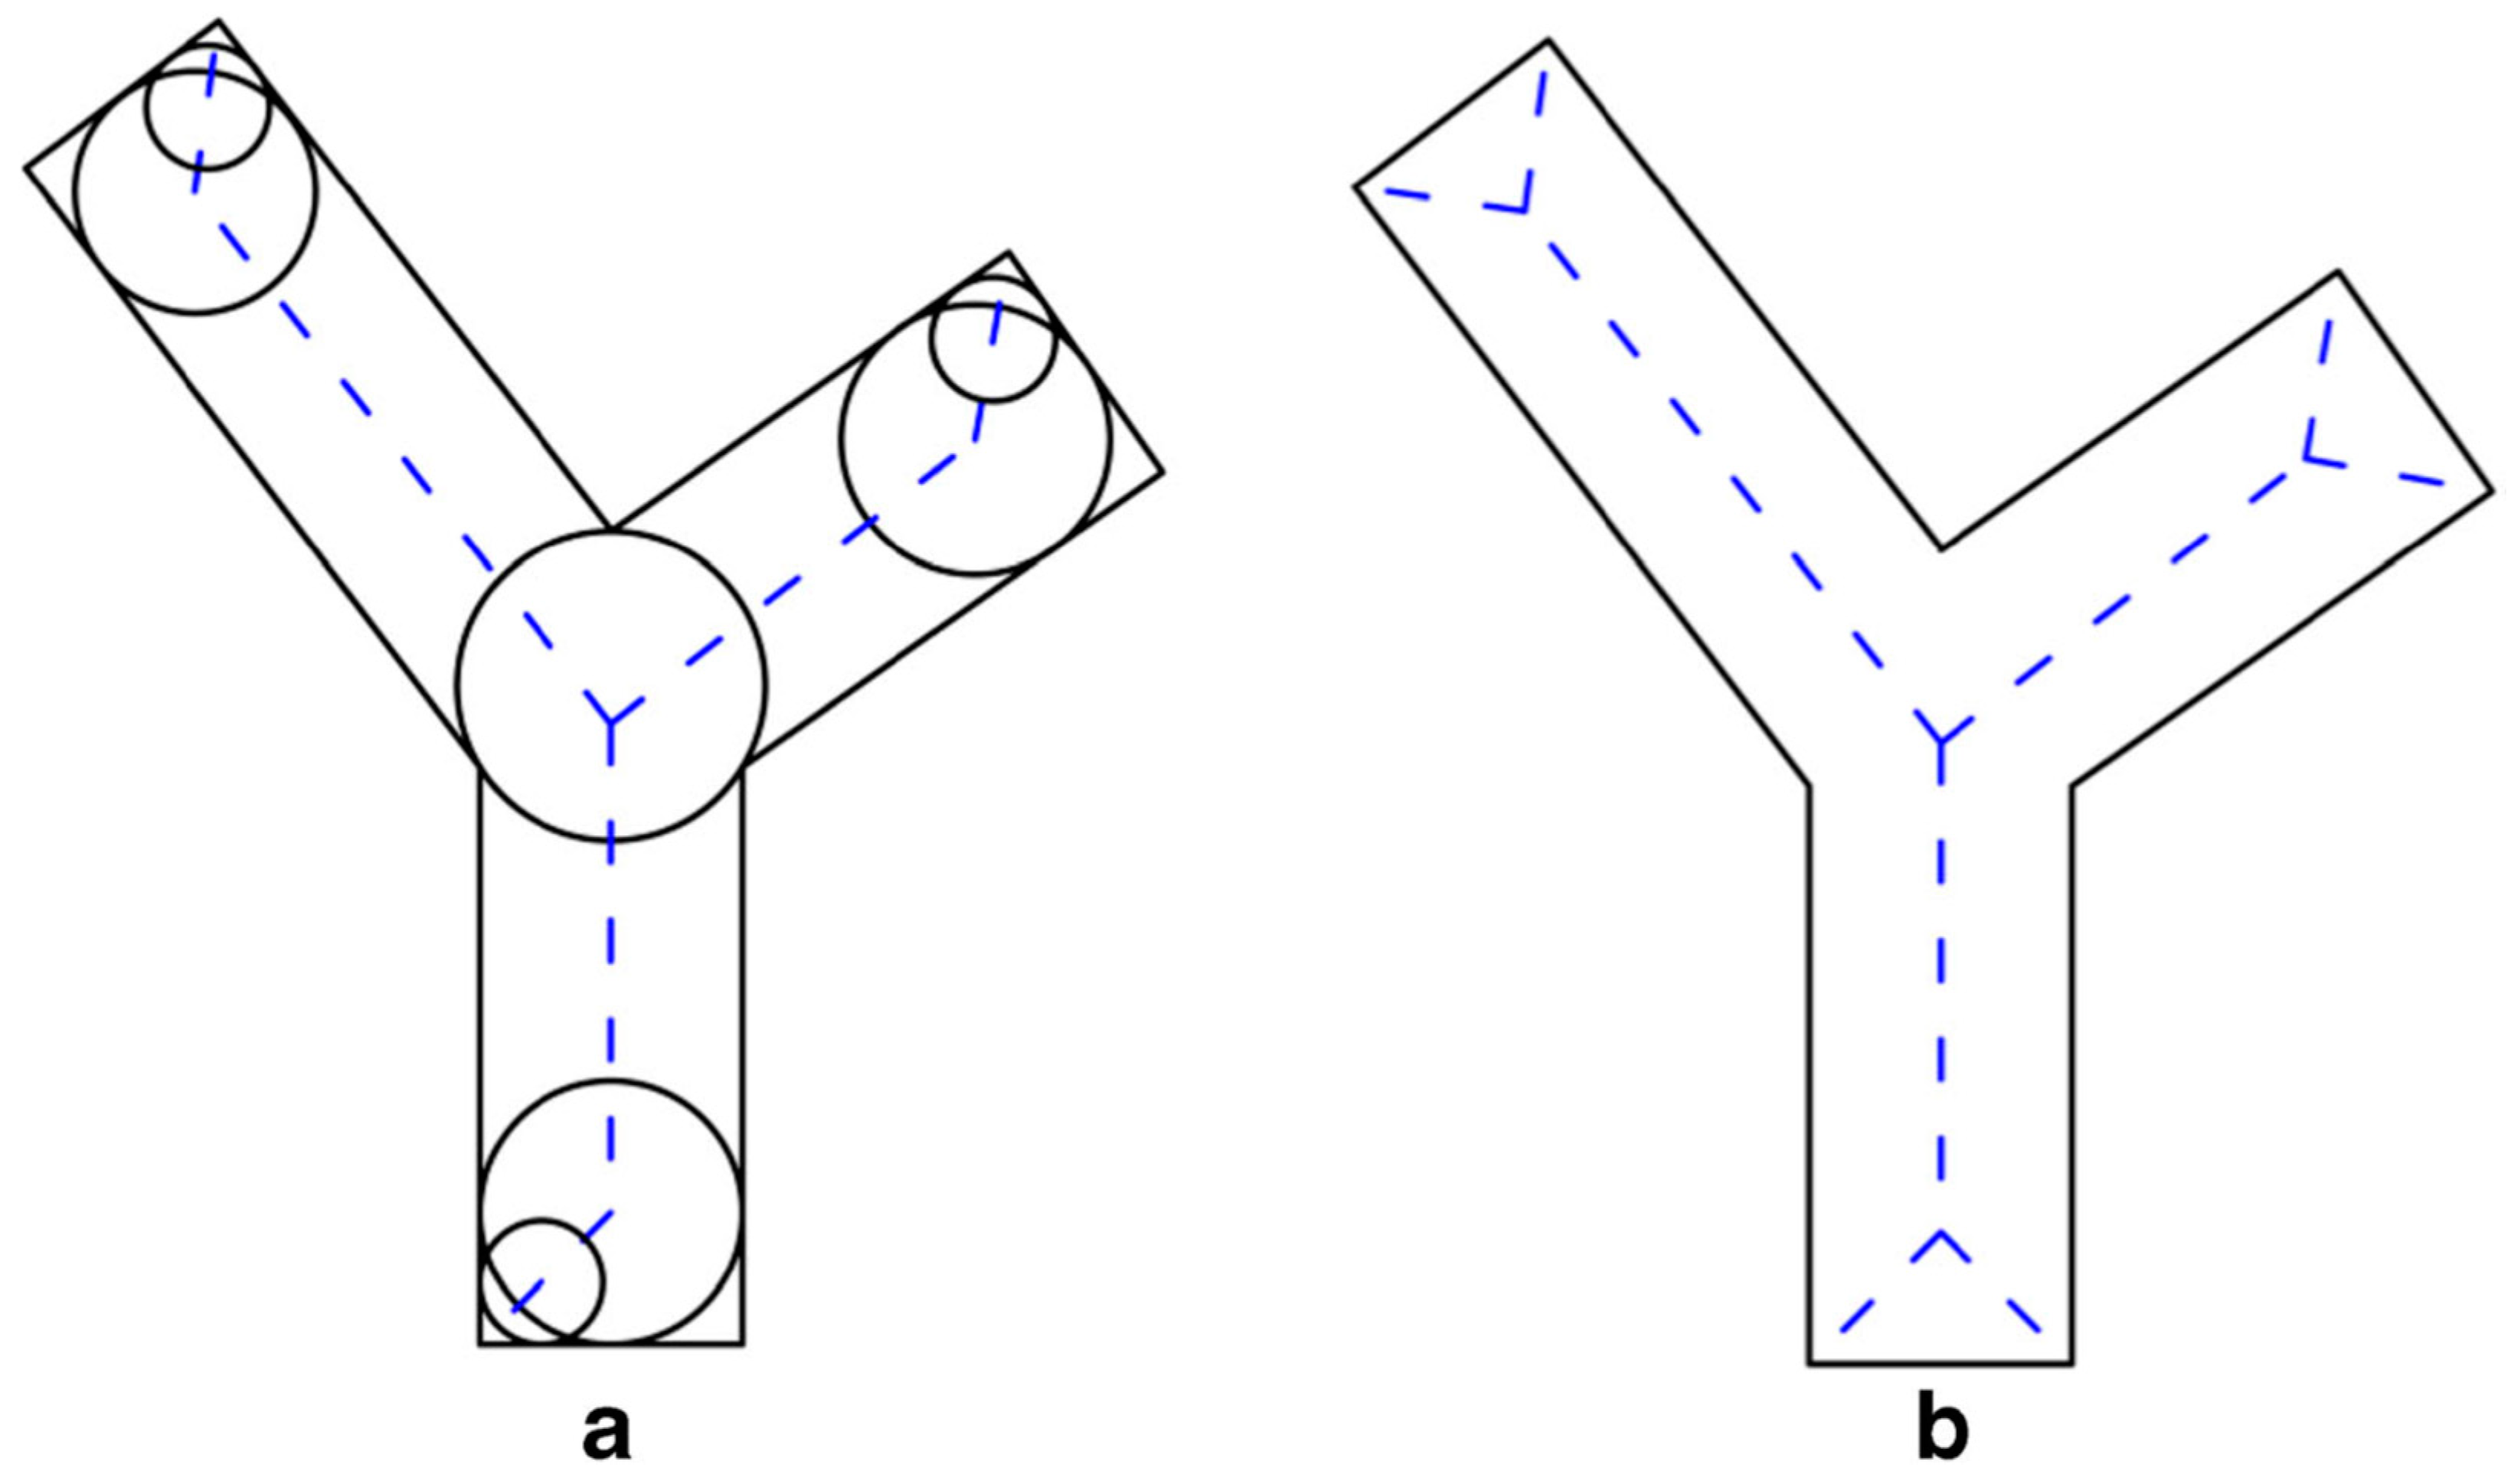
2.2.3. Watershed Delineation

The watershed is the principal tool of morphological segmentation [44]. Watershed regions are topographically defined by the conjunction of watershed boundaries and confluence boundaries, typically comprising ridge-line and valley-line elements. Building upon the skeletonized line network obtained through previous processing, this method employs a two-step spatial connectivity analysis: first by detecting critical connection points through spatial indexing and then constructing hydrological catchment boundaries using a KD-tree-based linking algorithm.
A KD-tree is a space-partitioning data structure designed for efficient nearest neighbor searches in multi-dimensional spaces. Each node in the tree represents a data point, and recursive partitioning along dimension axes subdivides the space into orthogonal hyperrectangles. During construction, points are hierarchically divided into subsets by selecting splitting criteria along alternating dimensions, creating a balanced binary search structure that enables logarithmic time complexity for proximity queries.
The connection process employs a bidirectional spatial linking strategy that utilizes skeleton line endpoints and intersections as key connection points. This two-phase procedure begins with ridge-based initiation: Starting from ridge-line endpoints or intersections, the KD-tree facilitates efficient nearest neighbor searches to identify corresponding valley-line connection points through Euclidean distance minimization. Edges are incrementally established between compatible points, expanding connectivity until either all reachable nodes are connected or dead-ends are encountered. Subsequently, valley-based completion reverses the linking direction by initiating connections from valley-line junctions, ensuring bidirectional topological integration between ridge and valley segments. Any residual unconnected points resulting from incomplete linkages undergo morphological pruning, where orphaned skeleton segments are systematically removed through iterative erosion or dilation operations. This integrated framework not only reconstructs watershed networks with geometric precision but also maintains hydrological coherence through adaptive spatial partitioning and intelligent connection strategies, effectively balancing computational efficiency with topographic accuracy.

2.2.4. Region Merging and Post-Processing

The catchment regions obtained from the previous step typically exhibit excessive fragmentation compared to actual slope units, necessitating a hierarchical aggregation process to merge adjacent sub-catchments belonging to homogeneous terrain regions. This consolidation procedure comprises four critical stages:
Stage 1: A 4-directional connectivity labeling algorithm is employed to identify and encode individualized catchment regions within the binary watershed framework. This process systematically assigns unique identifiers to each contiguous region through horizontal and vertical pixel adjacency analyses (excluding diagonal connections) while recording their spatial coordinates for subsequent processing. Building upon these labeled regions, a graph-theoretic approach constructs an adjacency matrix that represents the topological relationships between neighboring catchments. Each matrix element encodes whether two regions share a common boundary (edge adjacency) or contain spatially proximate but non-adjacent cells (node connectivity), thereby establishing a network structure that preserves both the hydrological connectivity and geometric integrity of the merged slope units. This step lays the foundation for downstream analyses requiring the quantitative characterization of watershed hierarchies and flow path dynamics.
Stage 2: The identified catchment regions are mapped onto the corresponding flow direction and slope gradient grids using their encoded identifiers and spatial coordinates. For each catchment, we compute the mean flow direction and the mean slope orientation:
m e a n = a r c t a n 1 n c o s x n 1 n s i n x n
where n is the total number of grid cells within the catchment and x represents individual grid values of the flow direction or slope orientation. This calculation aggregates directional vectors to determine the dominant flow orientation or slope orientation.
These directional metrics are subsequently classified into eight principal compass sectors (N, NE, E, SE, S, SW, W, and NW) using standard octant partitioning (45° angular intervals). This categorization establishes hydrological parameters (flow convergence patterns) and mechanical indices (slope stability indicators) critical for terrain analysis. The results provide quantifiable foundations for geomorphic process modeling and landslide susceptibility assessments.
Stage 3: Using the adjacency topology matrix established in Stage 1, we perform hydrological–hydraulic equivalence checks between all neighboring catchment regions. If adjacent catchments exhibit identical mean flow direction ( θ ) and slope gradient (m) values (i.e., θ i , j = θ k , l   a n d   m i , j = m k , l for neighboring regions (i, j) and (k, l)), their shared boundary is removed through topological fusion. This process merges contiguous catchments into unified grid-based slope units while preserving the inherent hydrological continuity of the terrain. The resultant merged units represent physically coherent regions with homogeneous water flow behavior and mechanical stability characteristics, forming the final product for geomorphic analysis and engineering applications.
Stage 4: Building upon the grid-based slope units generated in Stage 3, we conduct vectorization using the ArcGIS 10.8 software. Direct raster-to-vector conversion often introduces artifacts such as aliasing patterns and orphaned polygons due to the discrete nature of grid data. To mitigate these issues, our method employs topological cleaning operations through the “Eliminate” toolset. This step establishes a bridge between raster-based hydrological analyses and vector-based geomorphic modeling applications.

3. Case Study

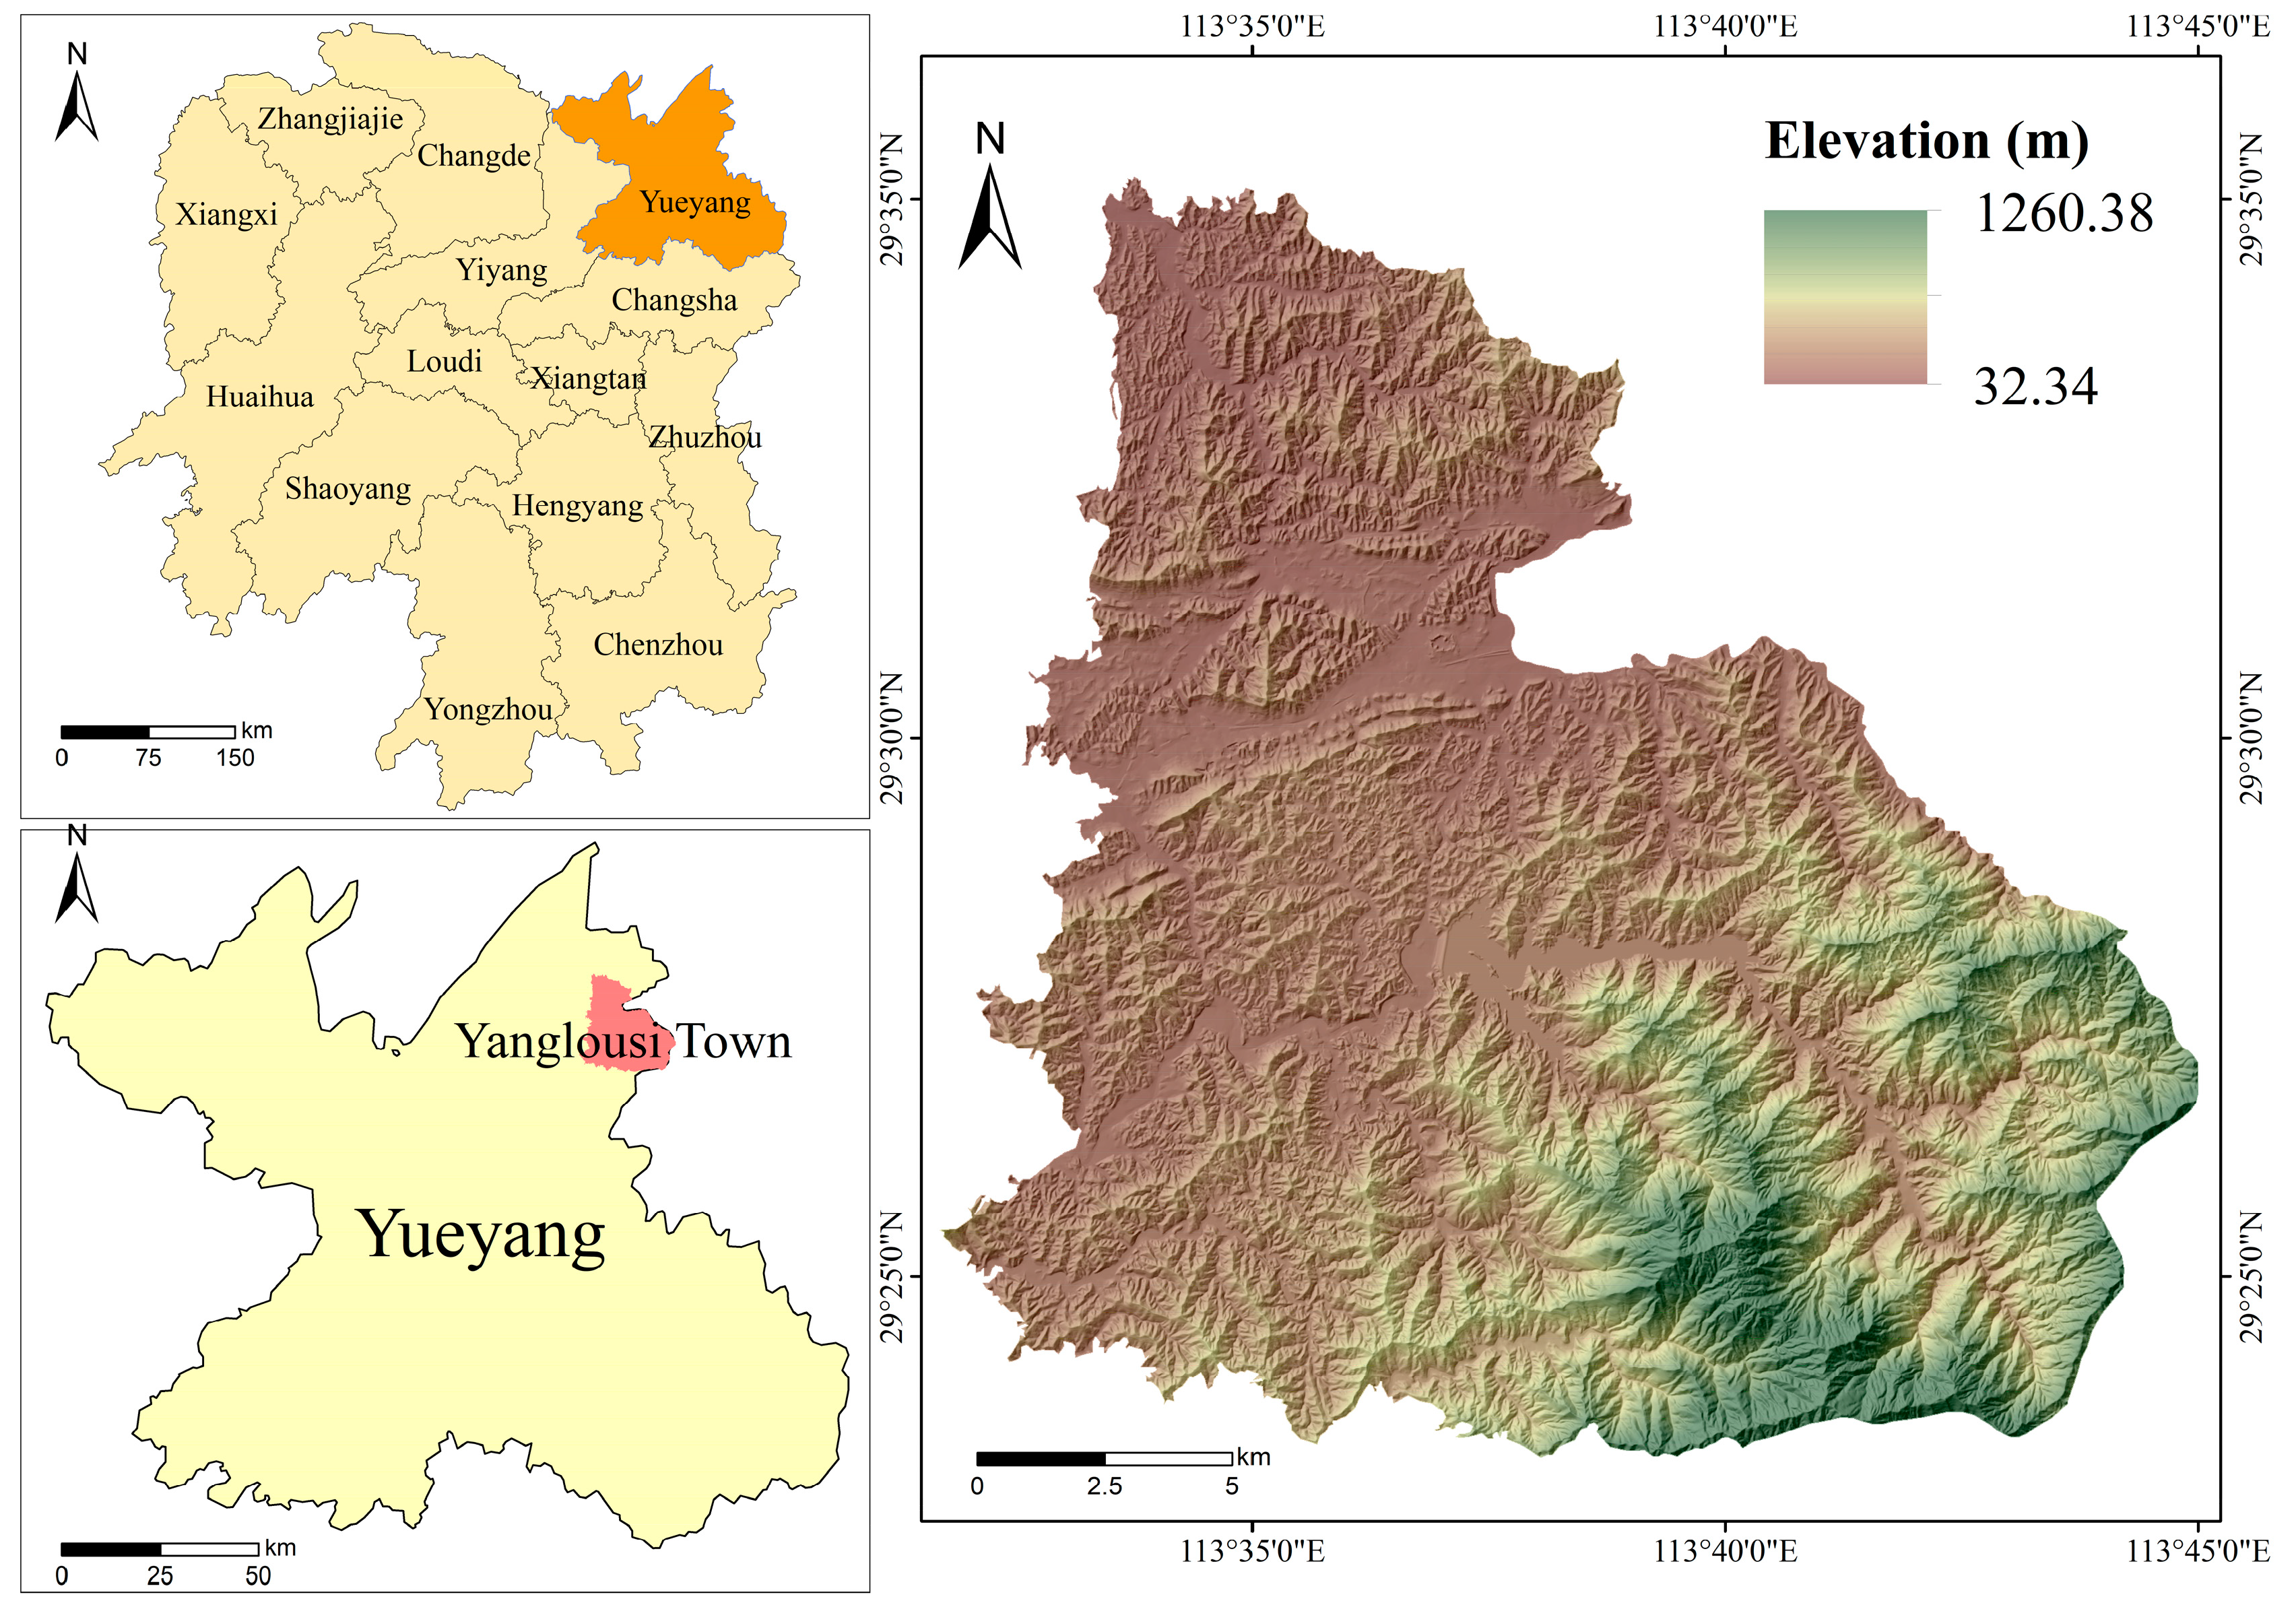
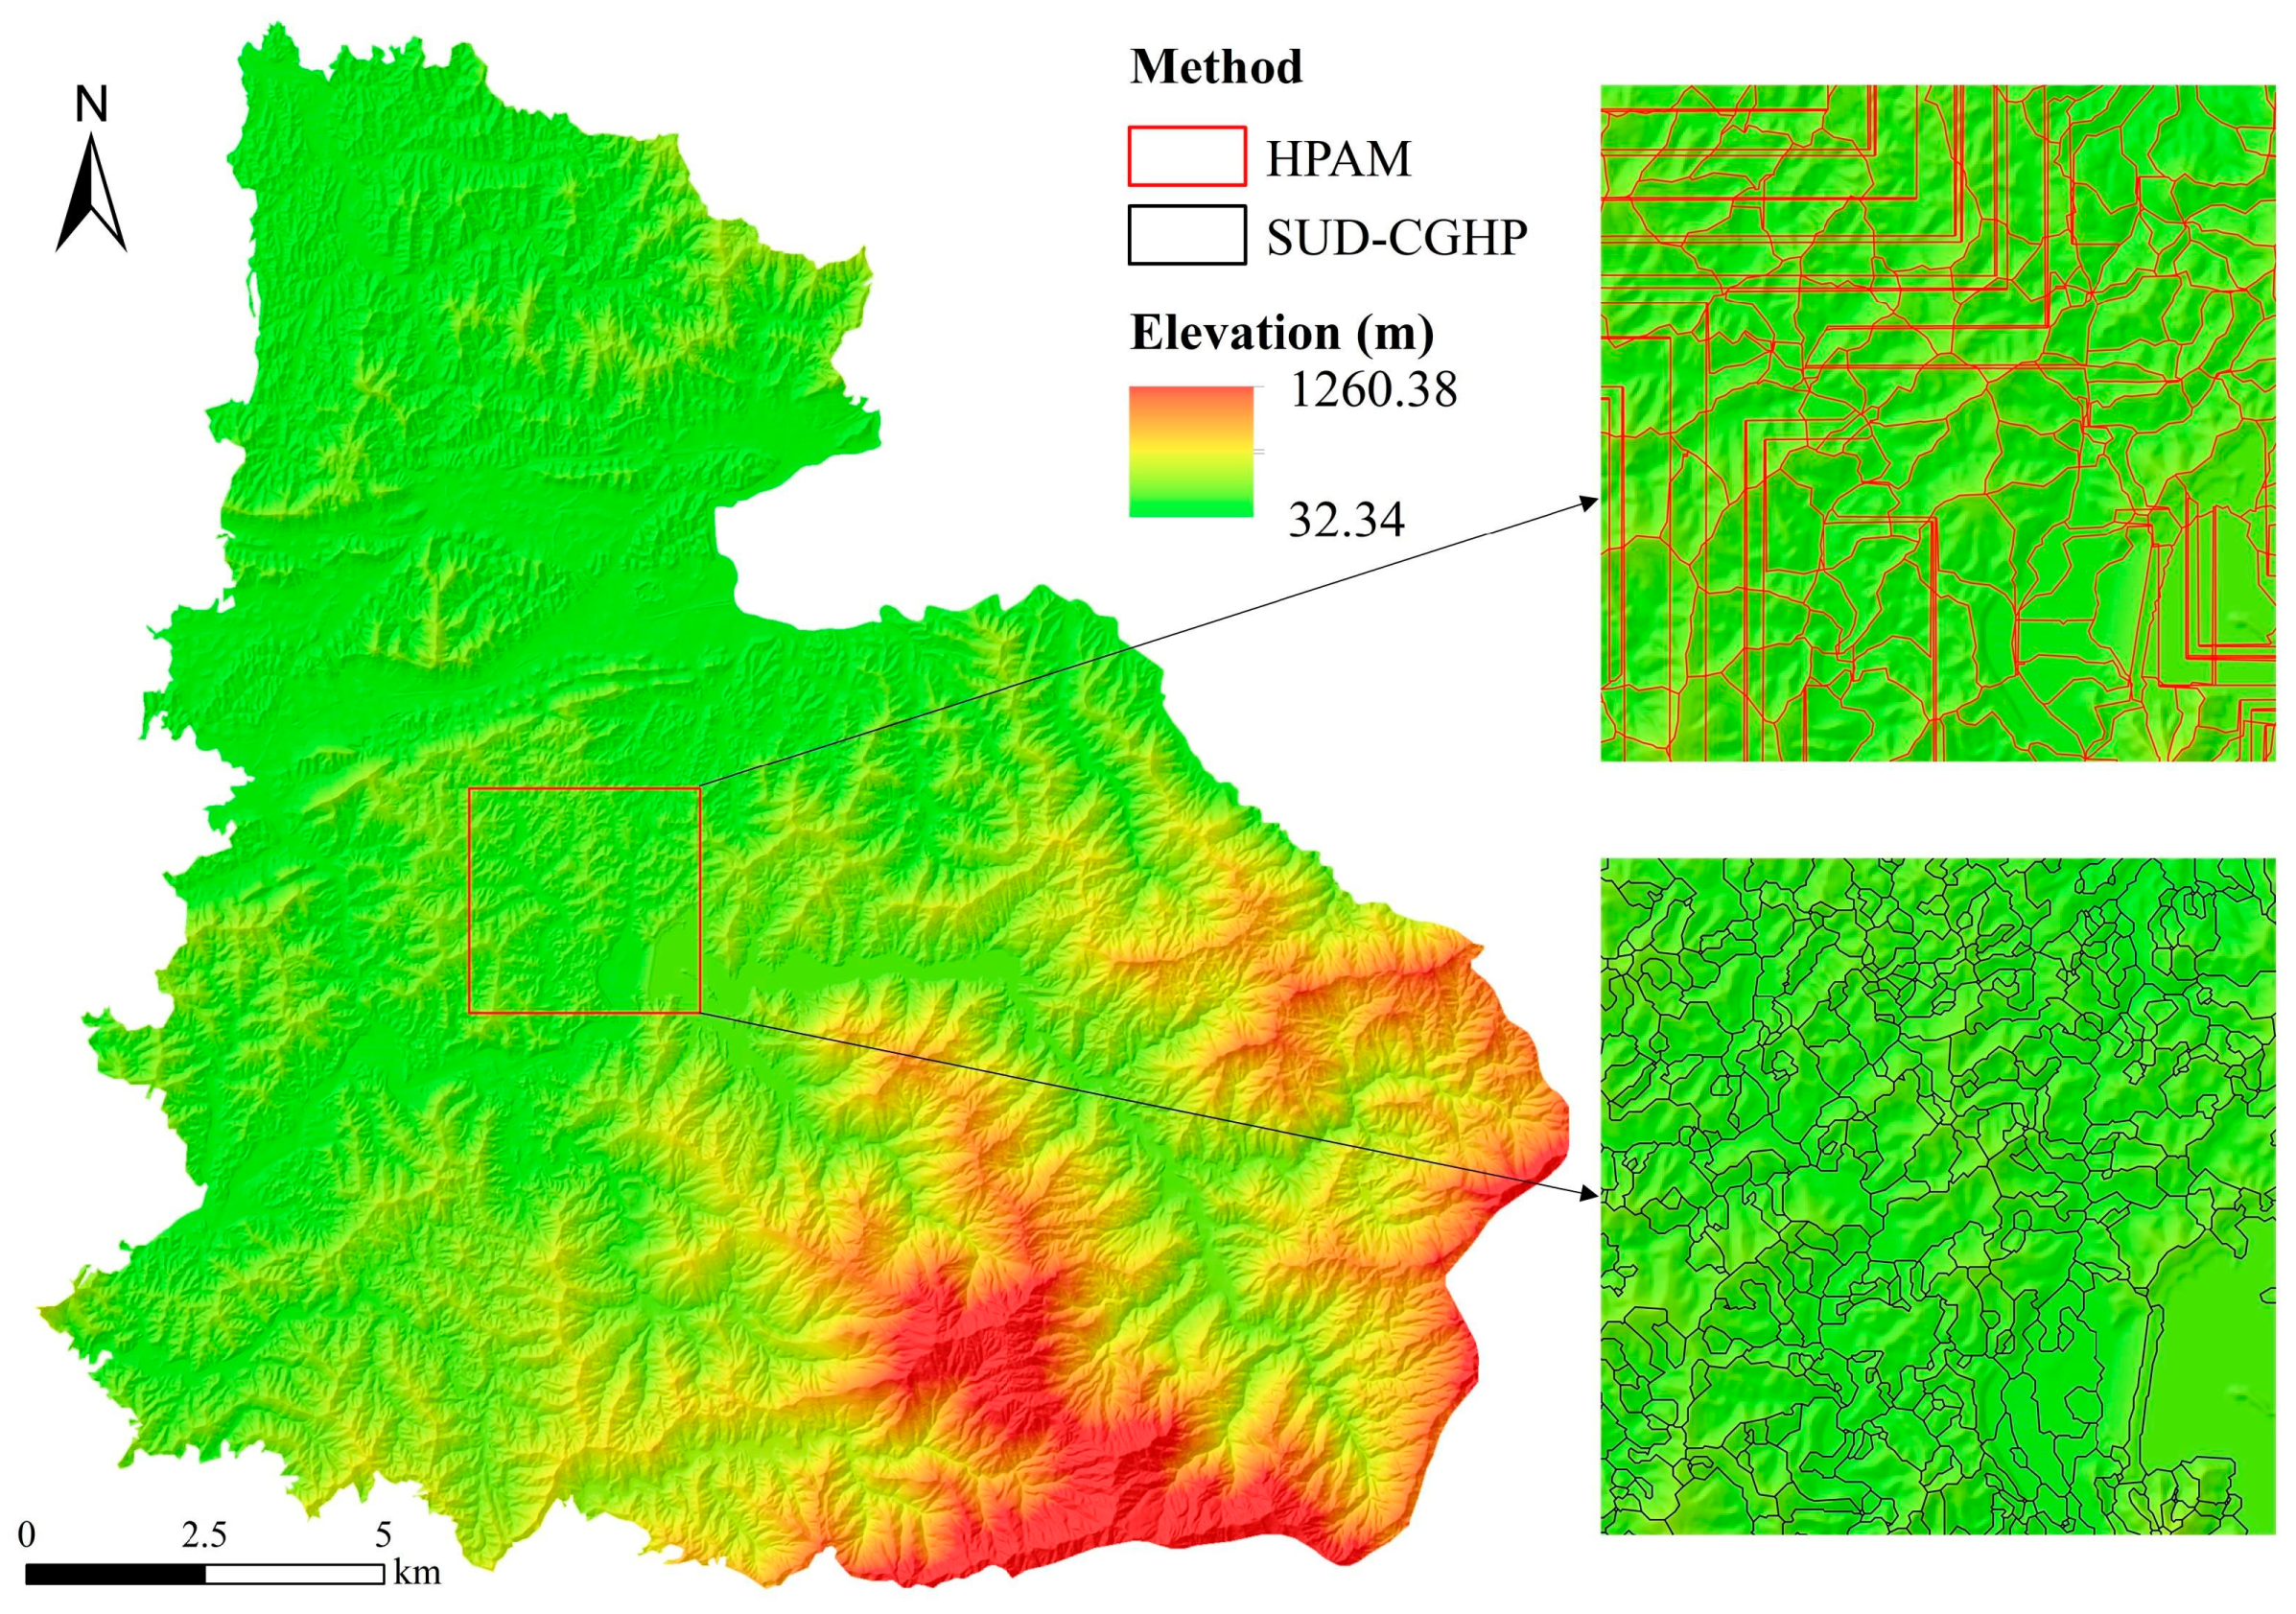
3.1. Research Areas and Data Sources

Yangloushi Town is located in Pingjiang County, Yueyang City, Hunan Province, China, with geographic coordinates spanning 29.2–29.6° N latitude and 113.5–113.7° E longitude. Occupying an area of approximately 156 square kilometers, the town features elevations ranging from 32 m to 1260 m, with an overall slope gradient of 0–62°. Geologically, it lies at the northern edge of the southeastern extension of the Nanling Mountains and the southern margin of the Yangtze Craton. The region has experienced complex tectonic evolution, including the Caledonian, Hercynian, and Yanshanian movements, which have created a diverse landscape of mountains, hills, and plains through intensive faulting and folding. This tectonic activity has rendered the area geologically unstable. This study utilizes high-resolution DEM data provided by the Hunan Provincial Geological Disaster Survey Institute (Figure 4), with a 10 m spatial resolution, to analyze the topographic characteristics and geological risks in the region.

3.2. Slope Unit Extraction

Using the Yangloushi Town DEM as the data source, this study employs both HPAM and SUD-CGHP to identify slope units. Partial results of the segmentation are illustrated in Figure 5. Figure 5 shows the corresponding slope unit divisions for the study area: the HPAM applied an 800 mm flow threshold, resulting in 8267 identified slope units, whereas the SUD-CGHP method, which requires no flow threshold adjustment, yielded 8378 slope units.

4. Qualitative and Quantitative Analyses

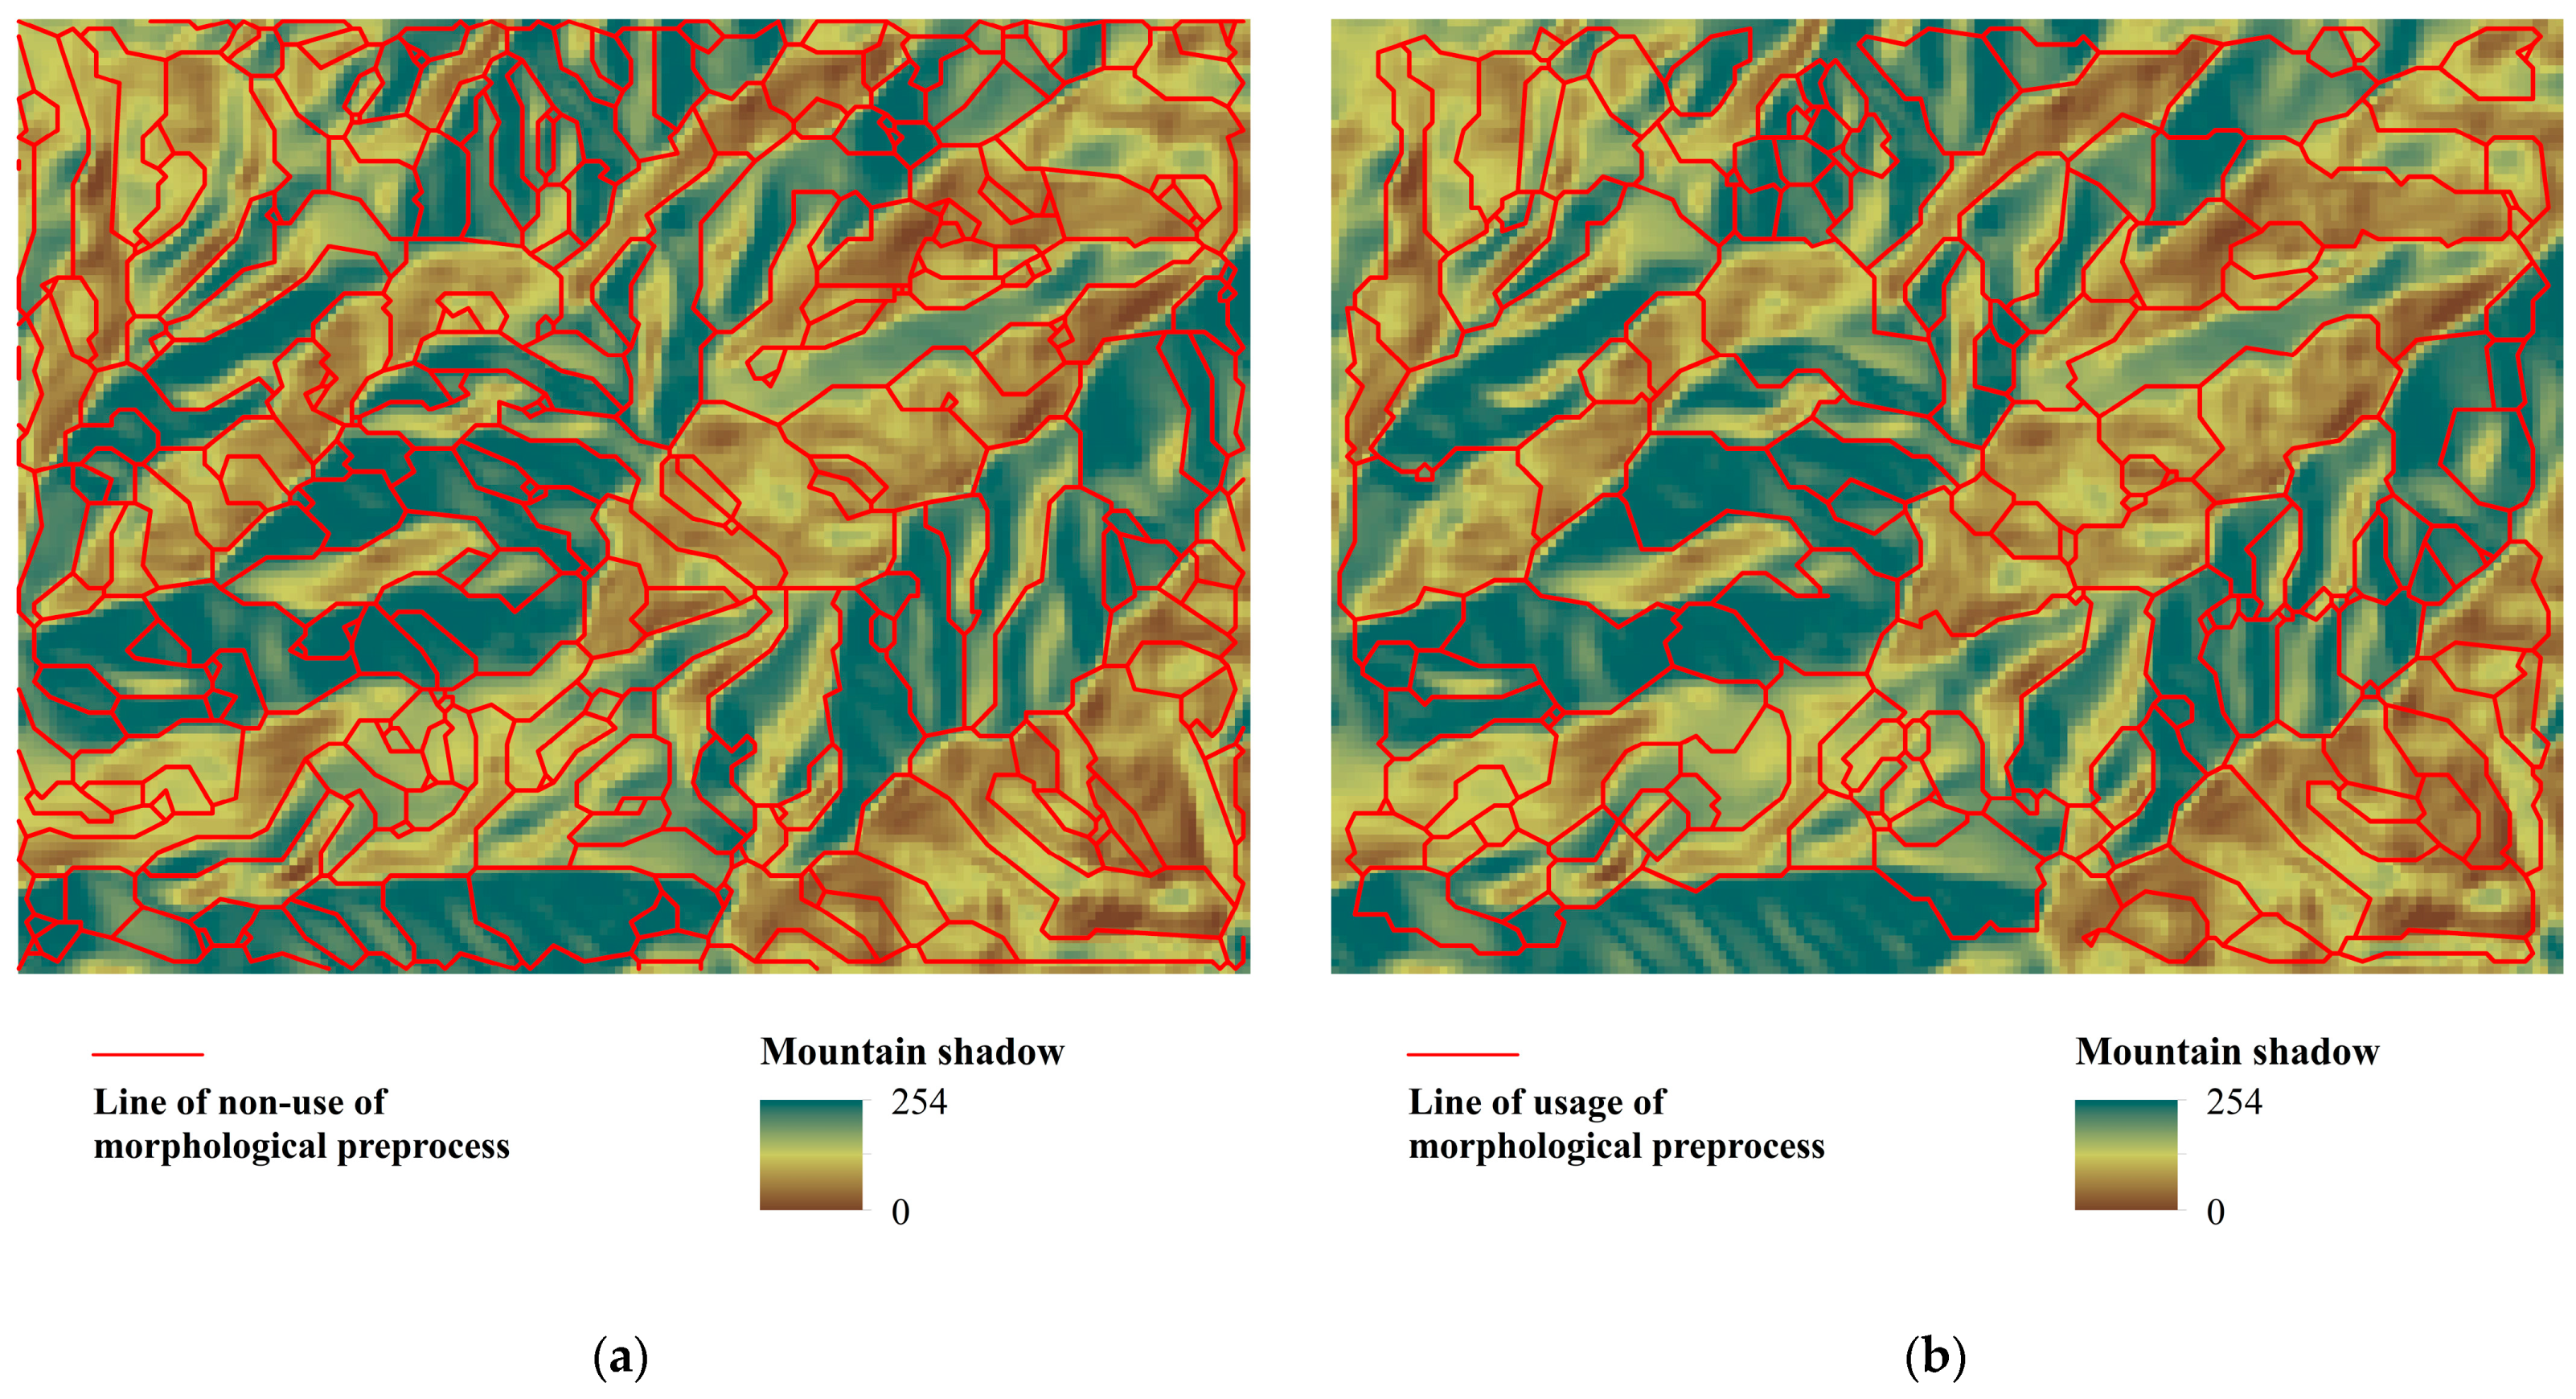
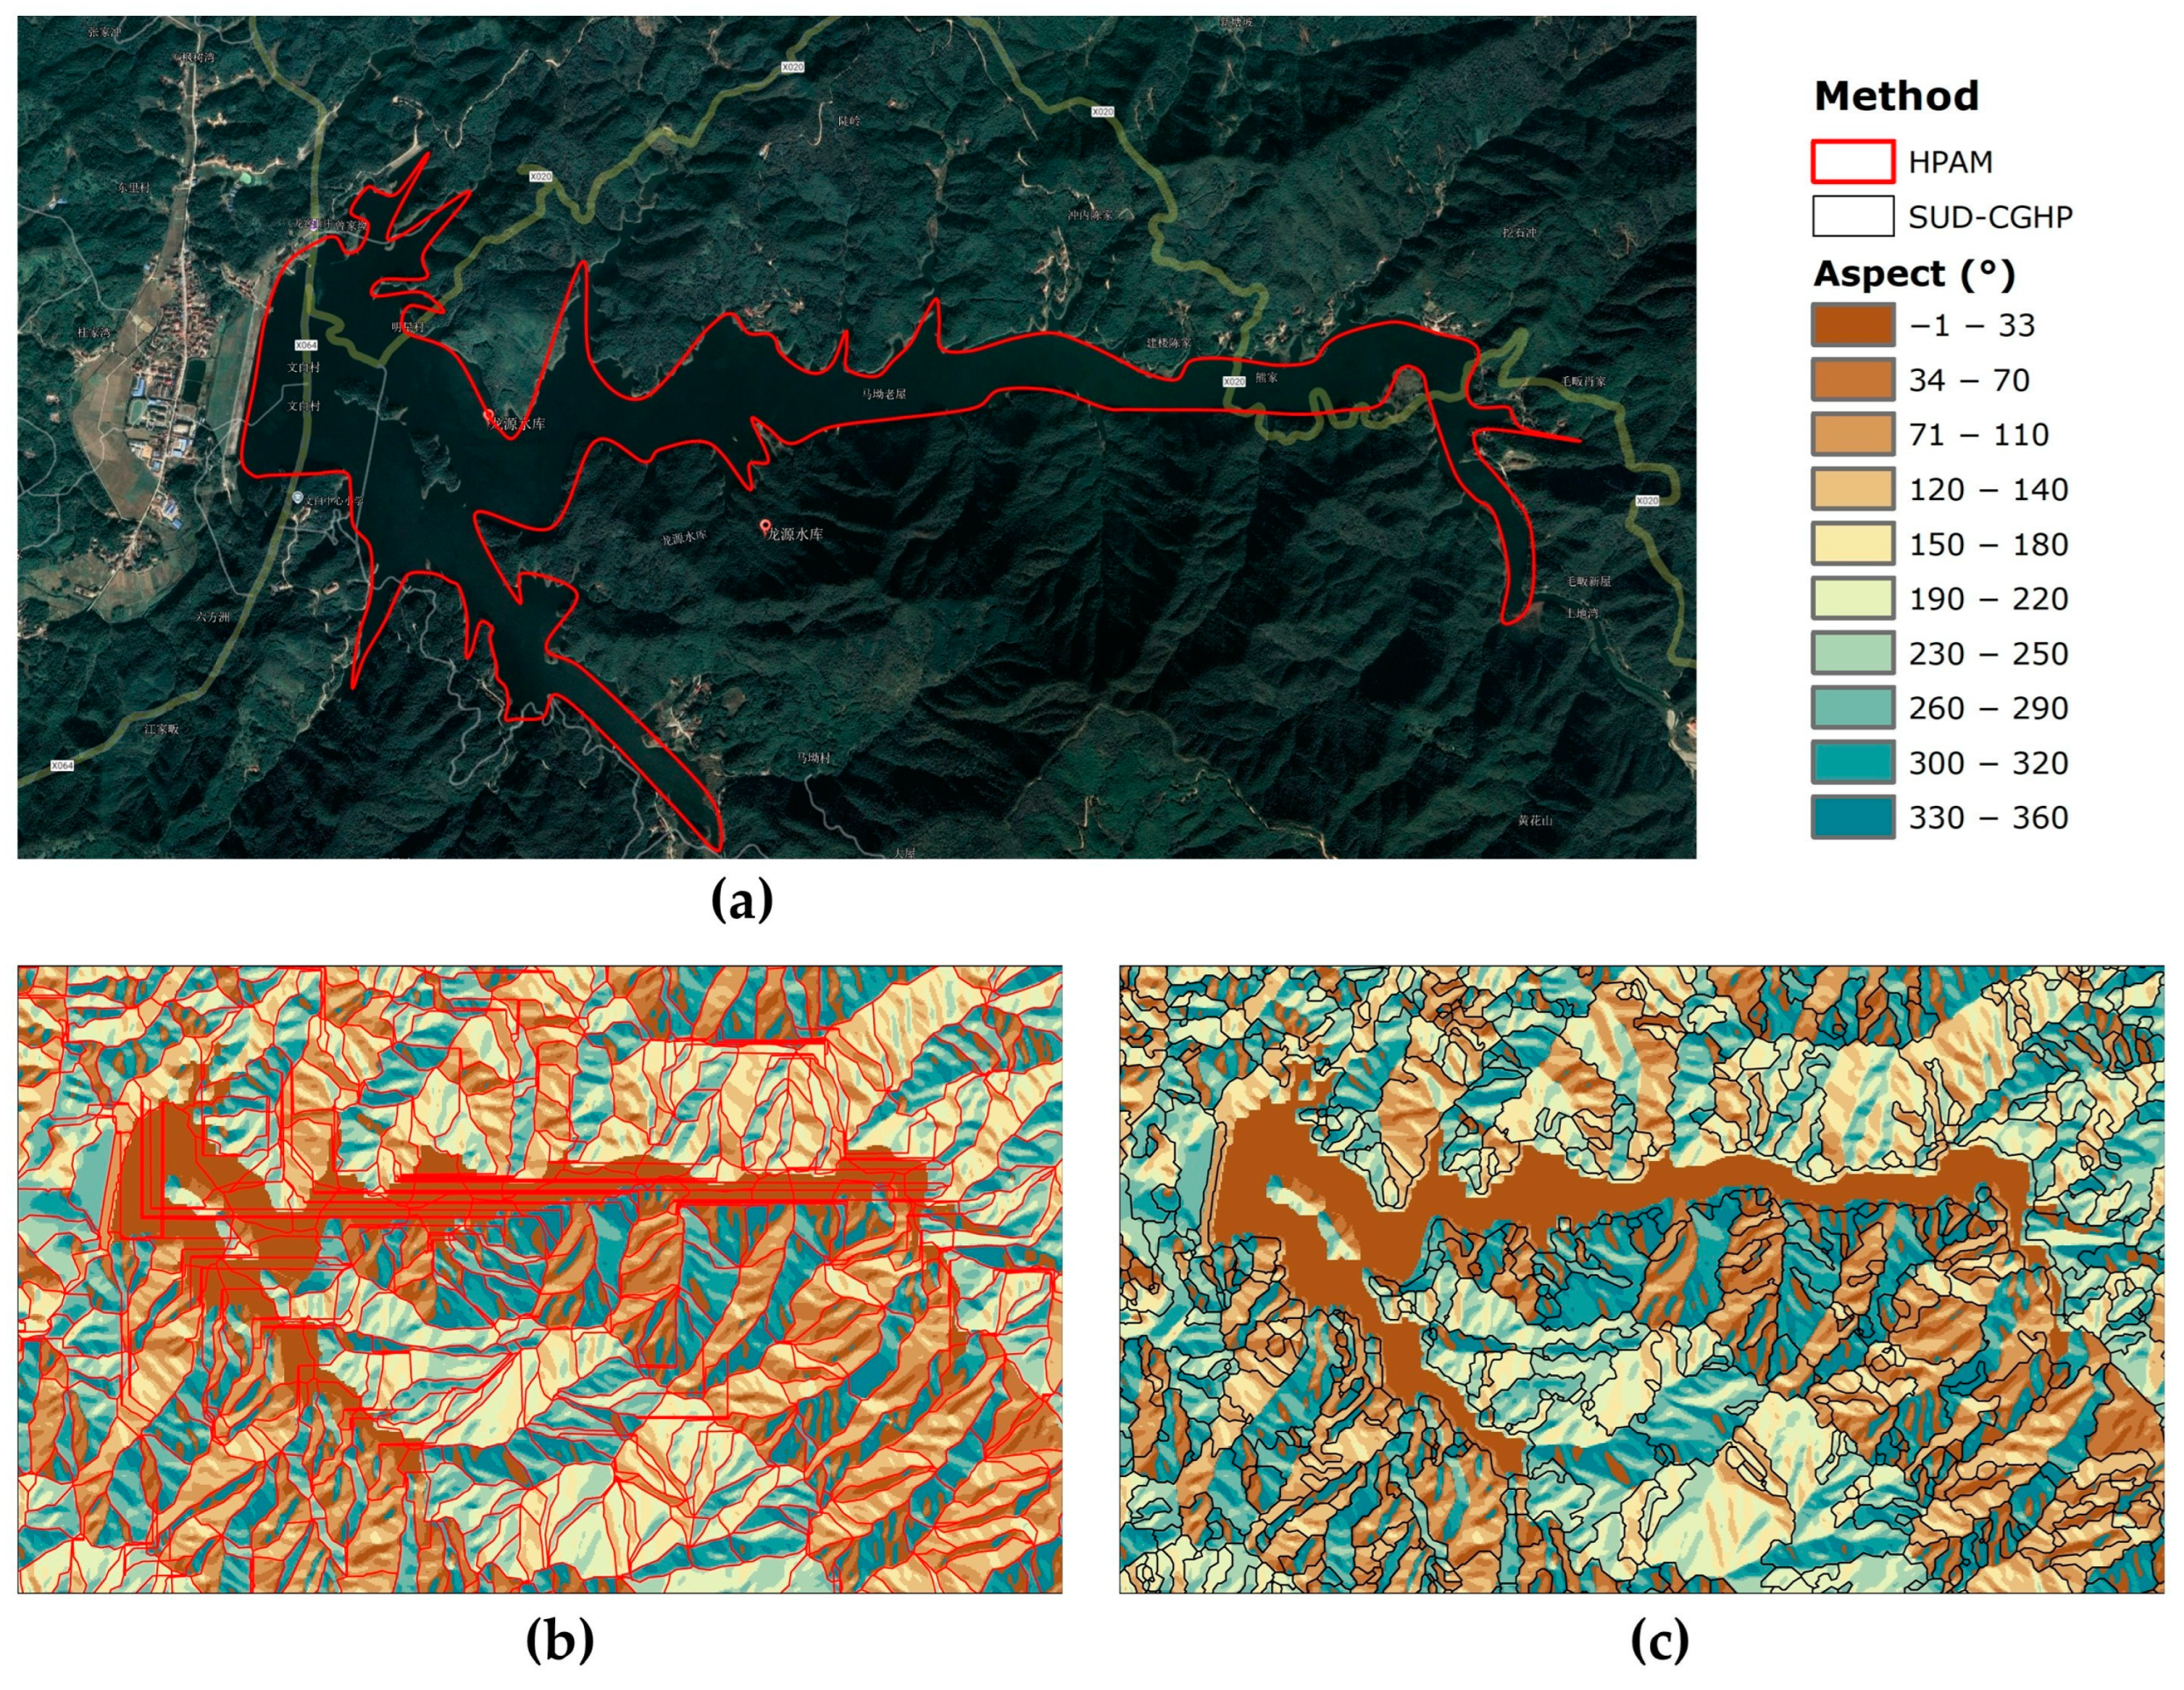
4.1. Qualitative Analysis

The morphological and regional features of slope units provide a qualitative basis for evaluating segmentation accuracy. The HPAM relies on watershed segmentation principles, involving depression filling and river network extraction. It is imperative to ensure the continuity of the regional hydrographic network for HPAM-based flow direction computations. This necessitates the systematic identification and comprehensive rectification of all topographic depressions during the depression filling phase. During the HPAM process, inverted depressions formed by elevation reversal require artificial filling, which may transform mountain peaks into depressions and generate extensive flat areas. River networks extracted from these plains often exhibit artificial geometric patterns such as parallel lines, right angles, or false channels (Figure 6b). In contrast, the SUD-CGHP method integrates terrain undulation with hydro-mechanical parameters through watershed merging to achieve more physically meaningful segmentation results (Figure 6c). Figure 6a shows the Longyuan Reservoir in Yangloushi Town, which corresponds to the slope value of −1 in Figure 6b,c. Comparative analysis reveals that SUD-CGHP demonstrates superior precision in identifying flat regions (a slope gradient of −1): it treats entire planar areas as coherent slope units, while the HPAM produces fragmented rectilinear patterns (including intersecting horizontal/vertical lines) that necessitate extensive manual correction.
The comparison demonstrates that SUD-CGHP achieves three critical advancements through its innovative approach: First, it preserves spatial coherence in flat terrain by employing holistic segmentation, treating planar areas as unified slope units rather than fragmented networks. Second, it eliminates artificial river network artifacts inherent in HPAM, a common issue caused by elevation reversal-induced depressions and rigid flow threshold constraints. Third, it enhances the automation capacity by reducing reliance on manual corrections, particularly in planar regions where HPAM produces intersecting horizontal/vertical lines that require extensive post-processing. These methodological breakthroughs collectively enable SUD-CGHP to deliver more physically realistic and operationally efficient slope unit delineations, holding significant implications for landslide risk assessments in mountainous regions through improved spatial accuracy and processing efficiency.

4.2. Quantitative Analysis

The homogeneity principle serves as a fundamental requirement for slope units to function as effective evaluation units. Based on this principle, we selected three quantitative indicators to assess the homogeneity of slope units between the SUD-CGHP and the HPAM: (1) flow direction grid variety, (2) the standard deviation (STD) of slope aspect grid values, and (3) the STD of slope gradient grid values.

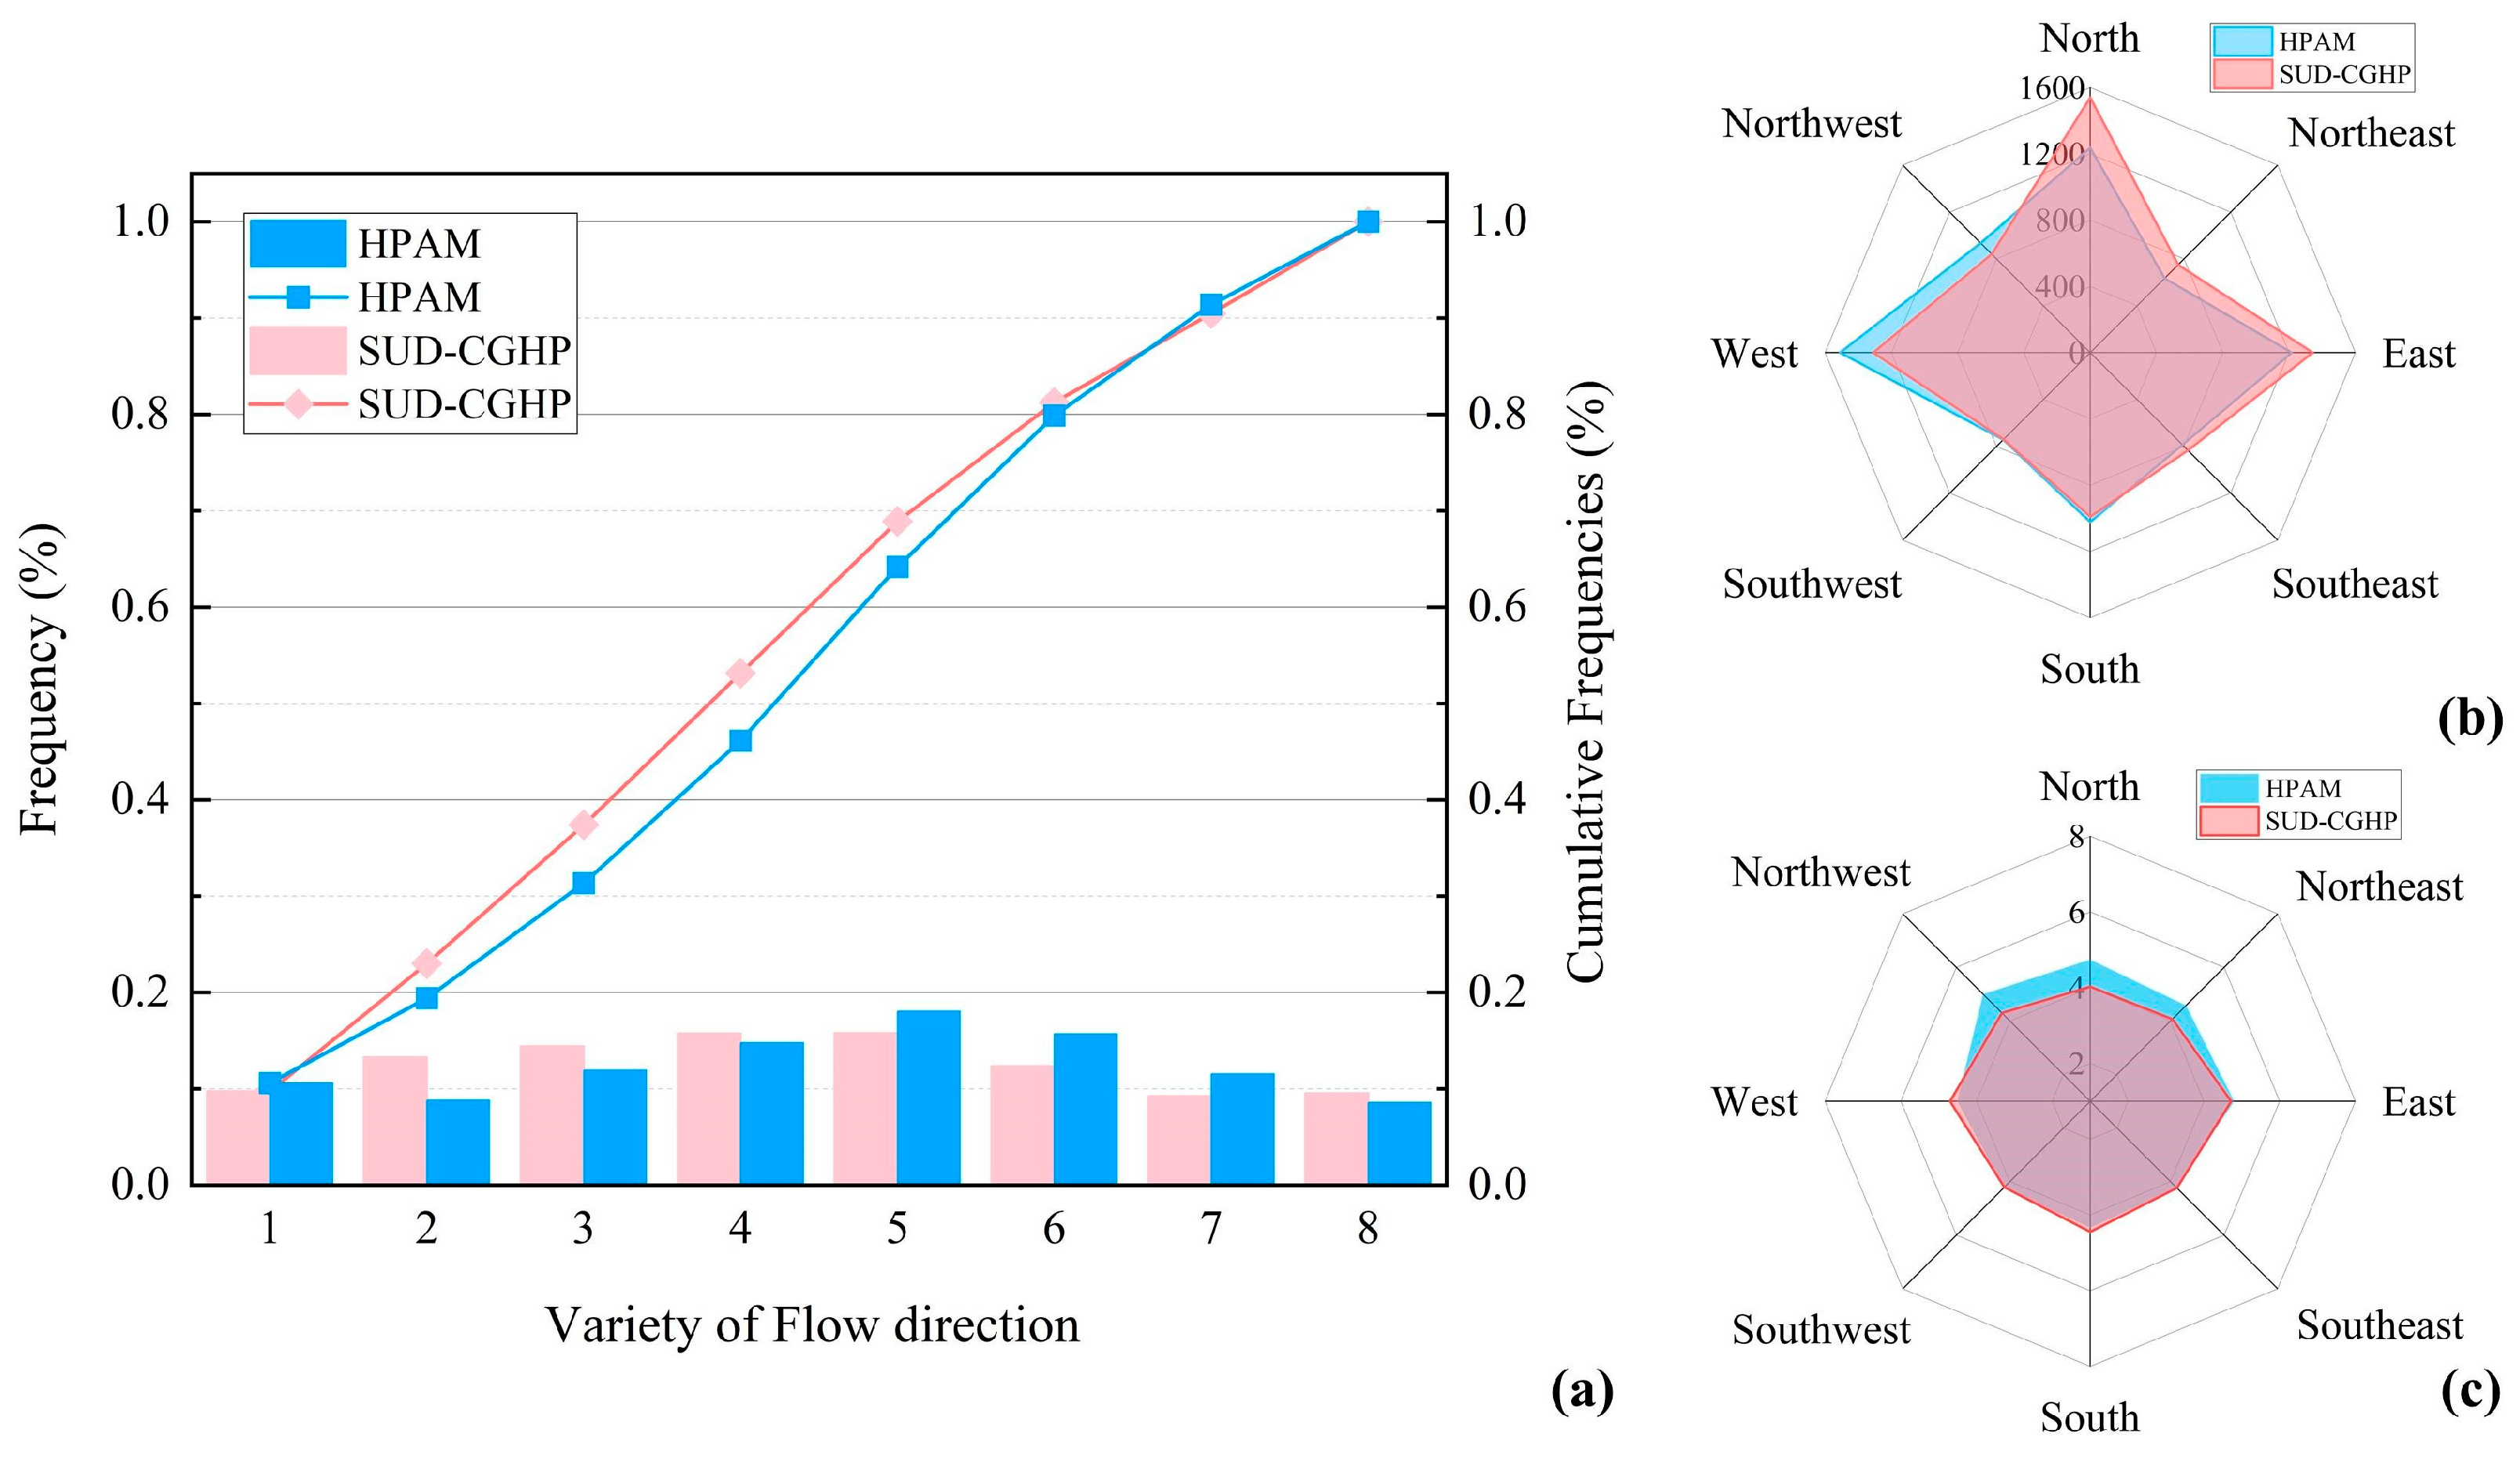
4.2.1. Flow Direction
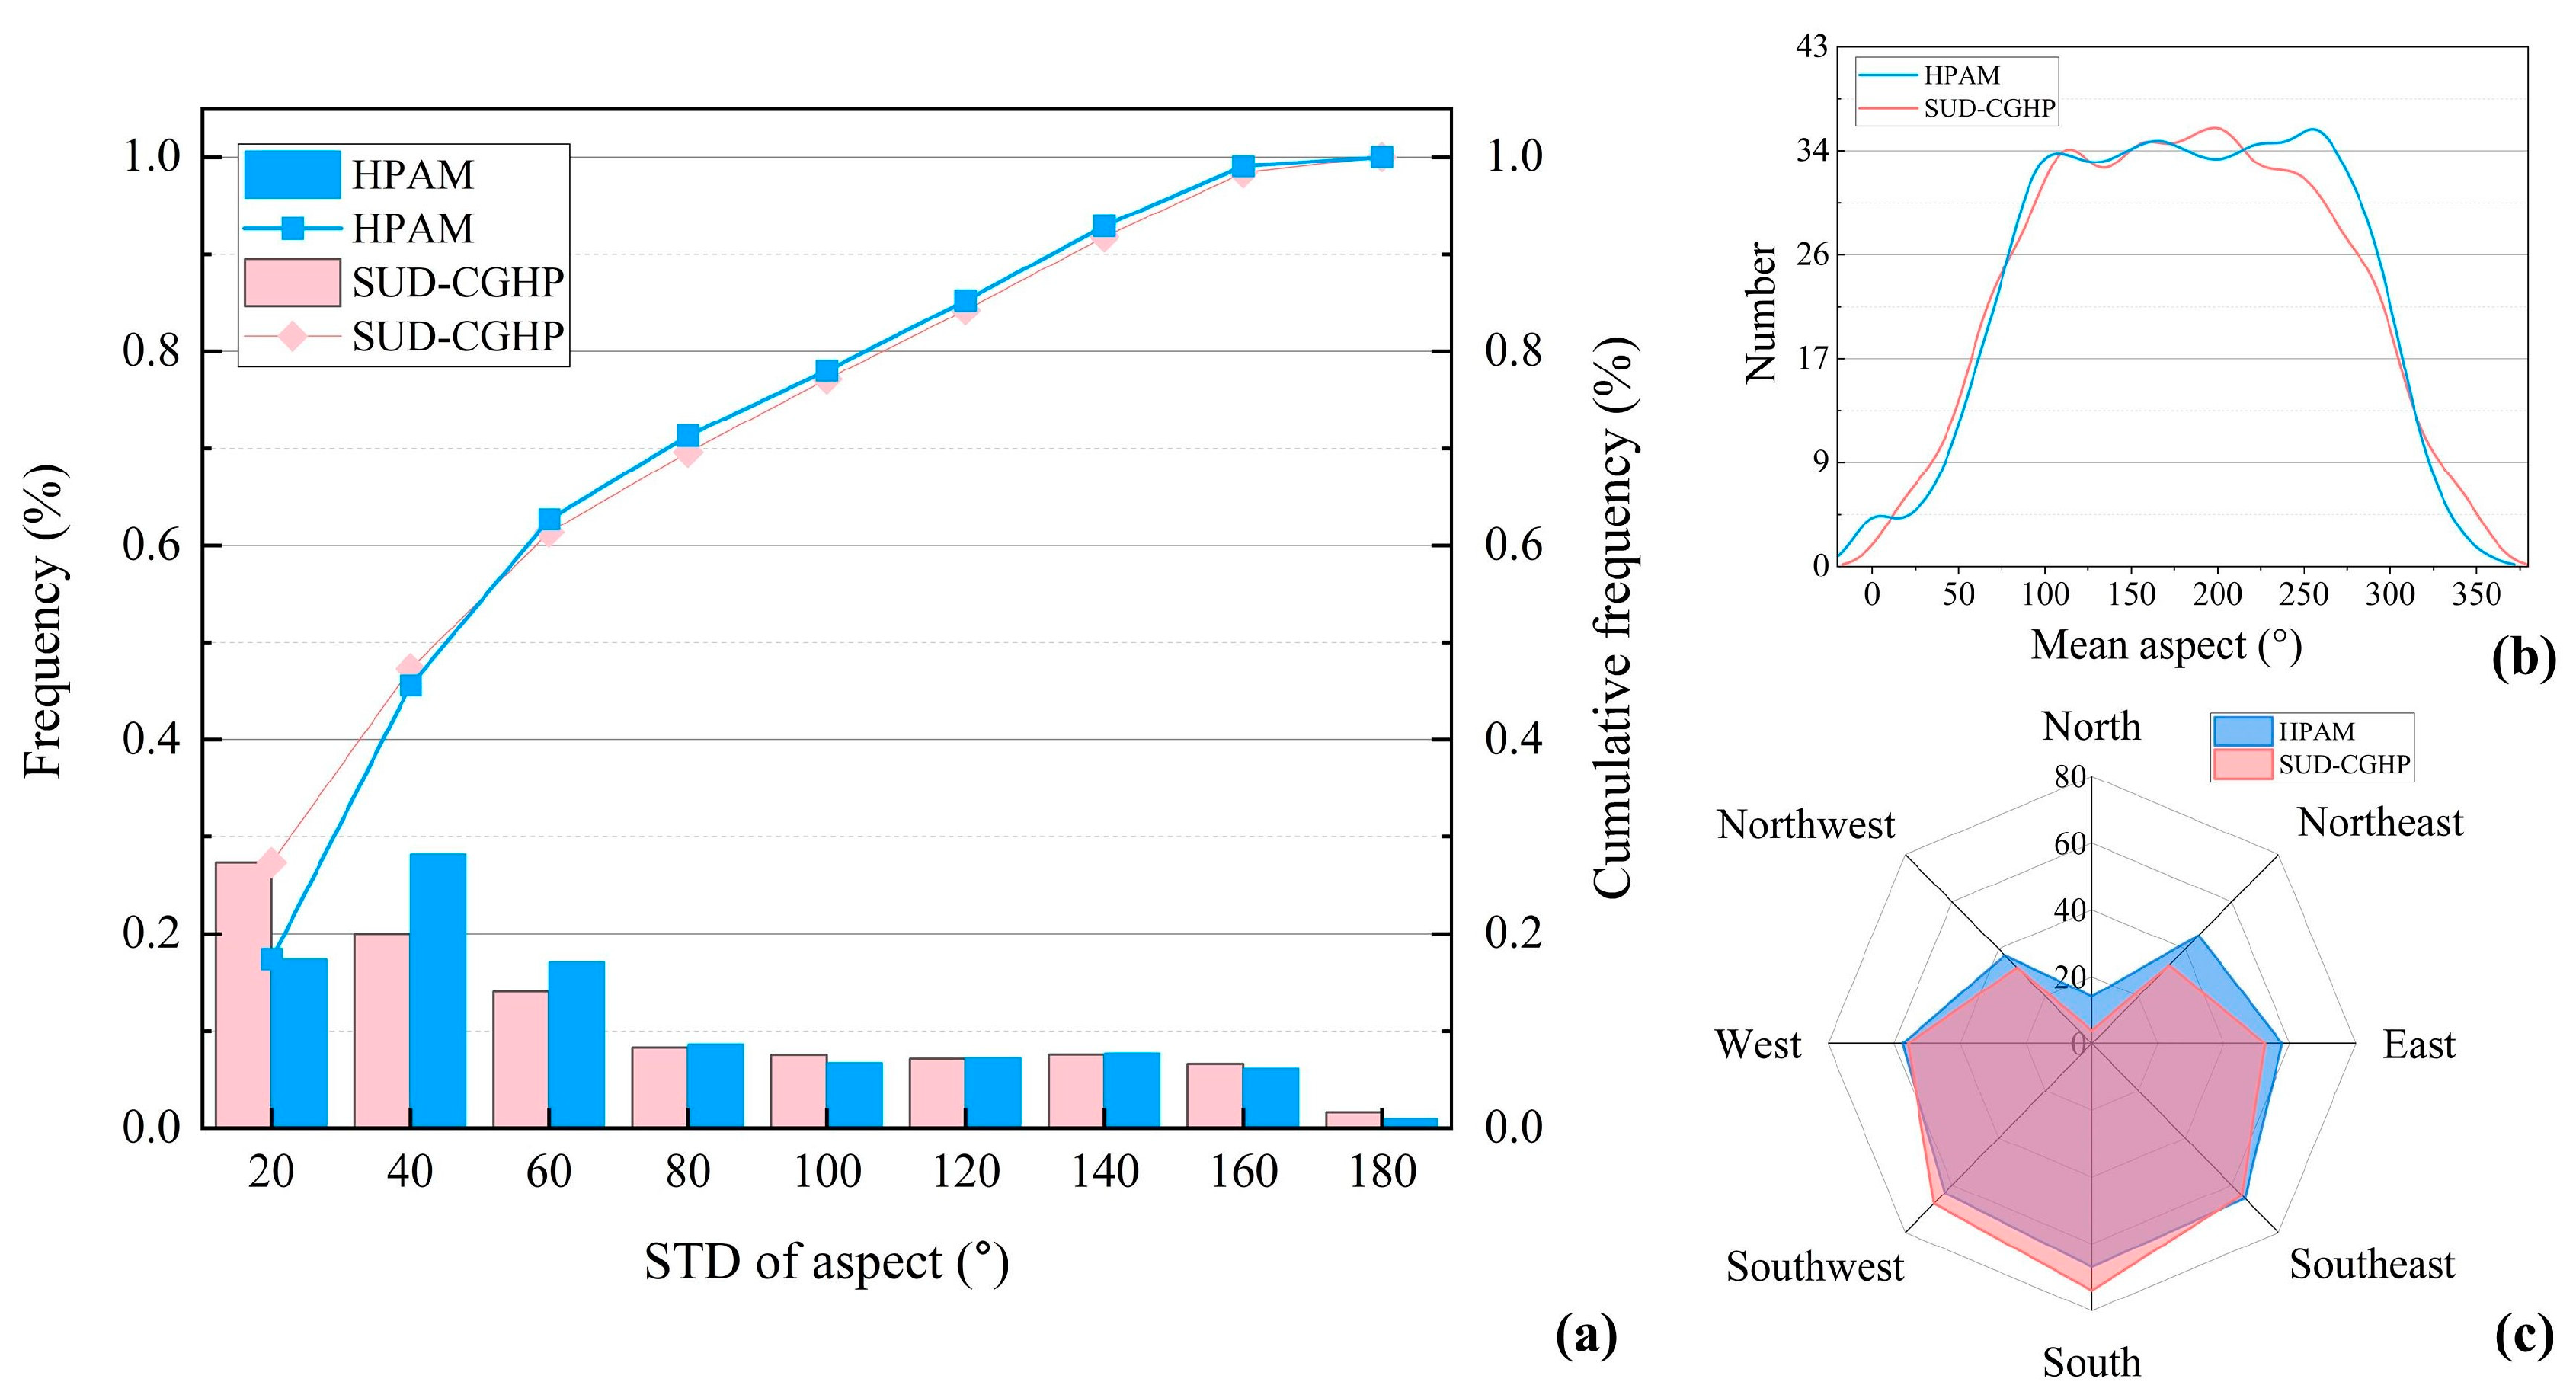
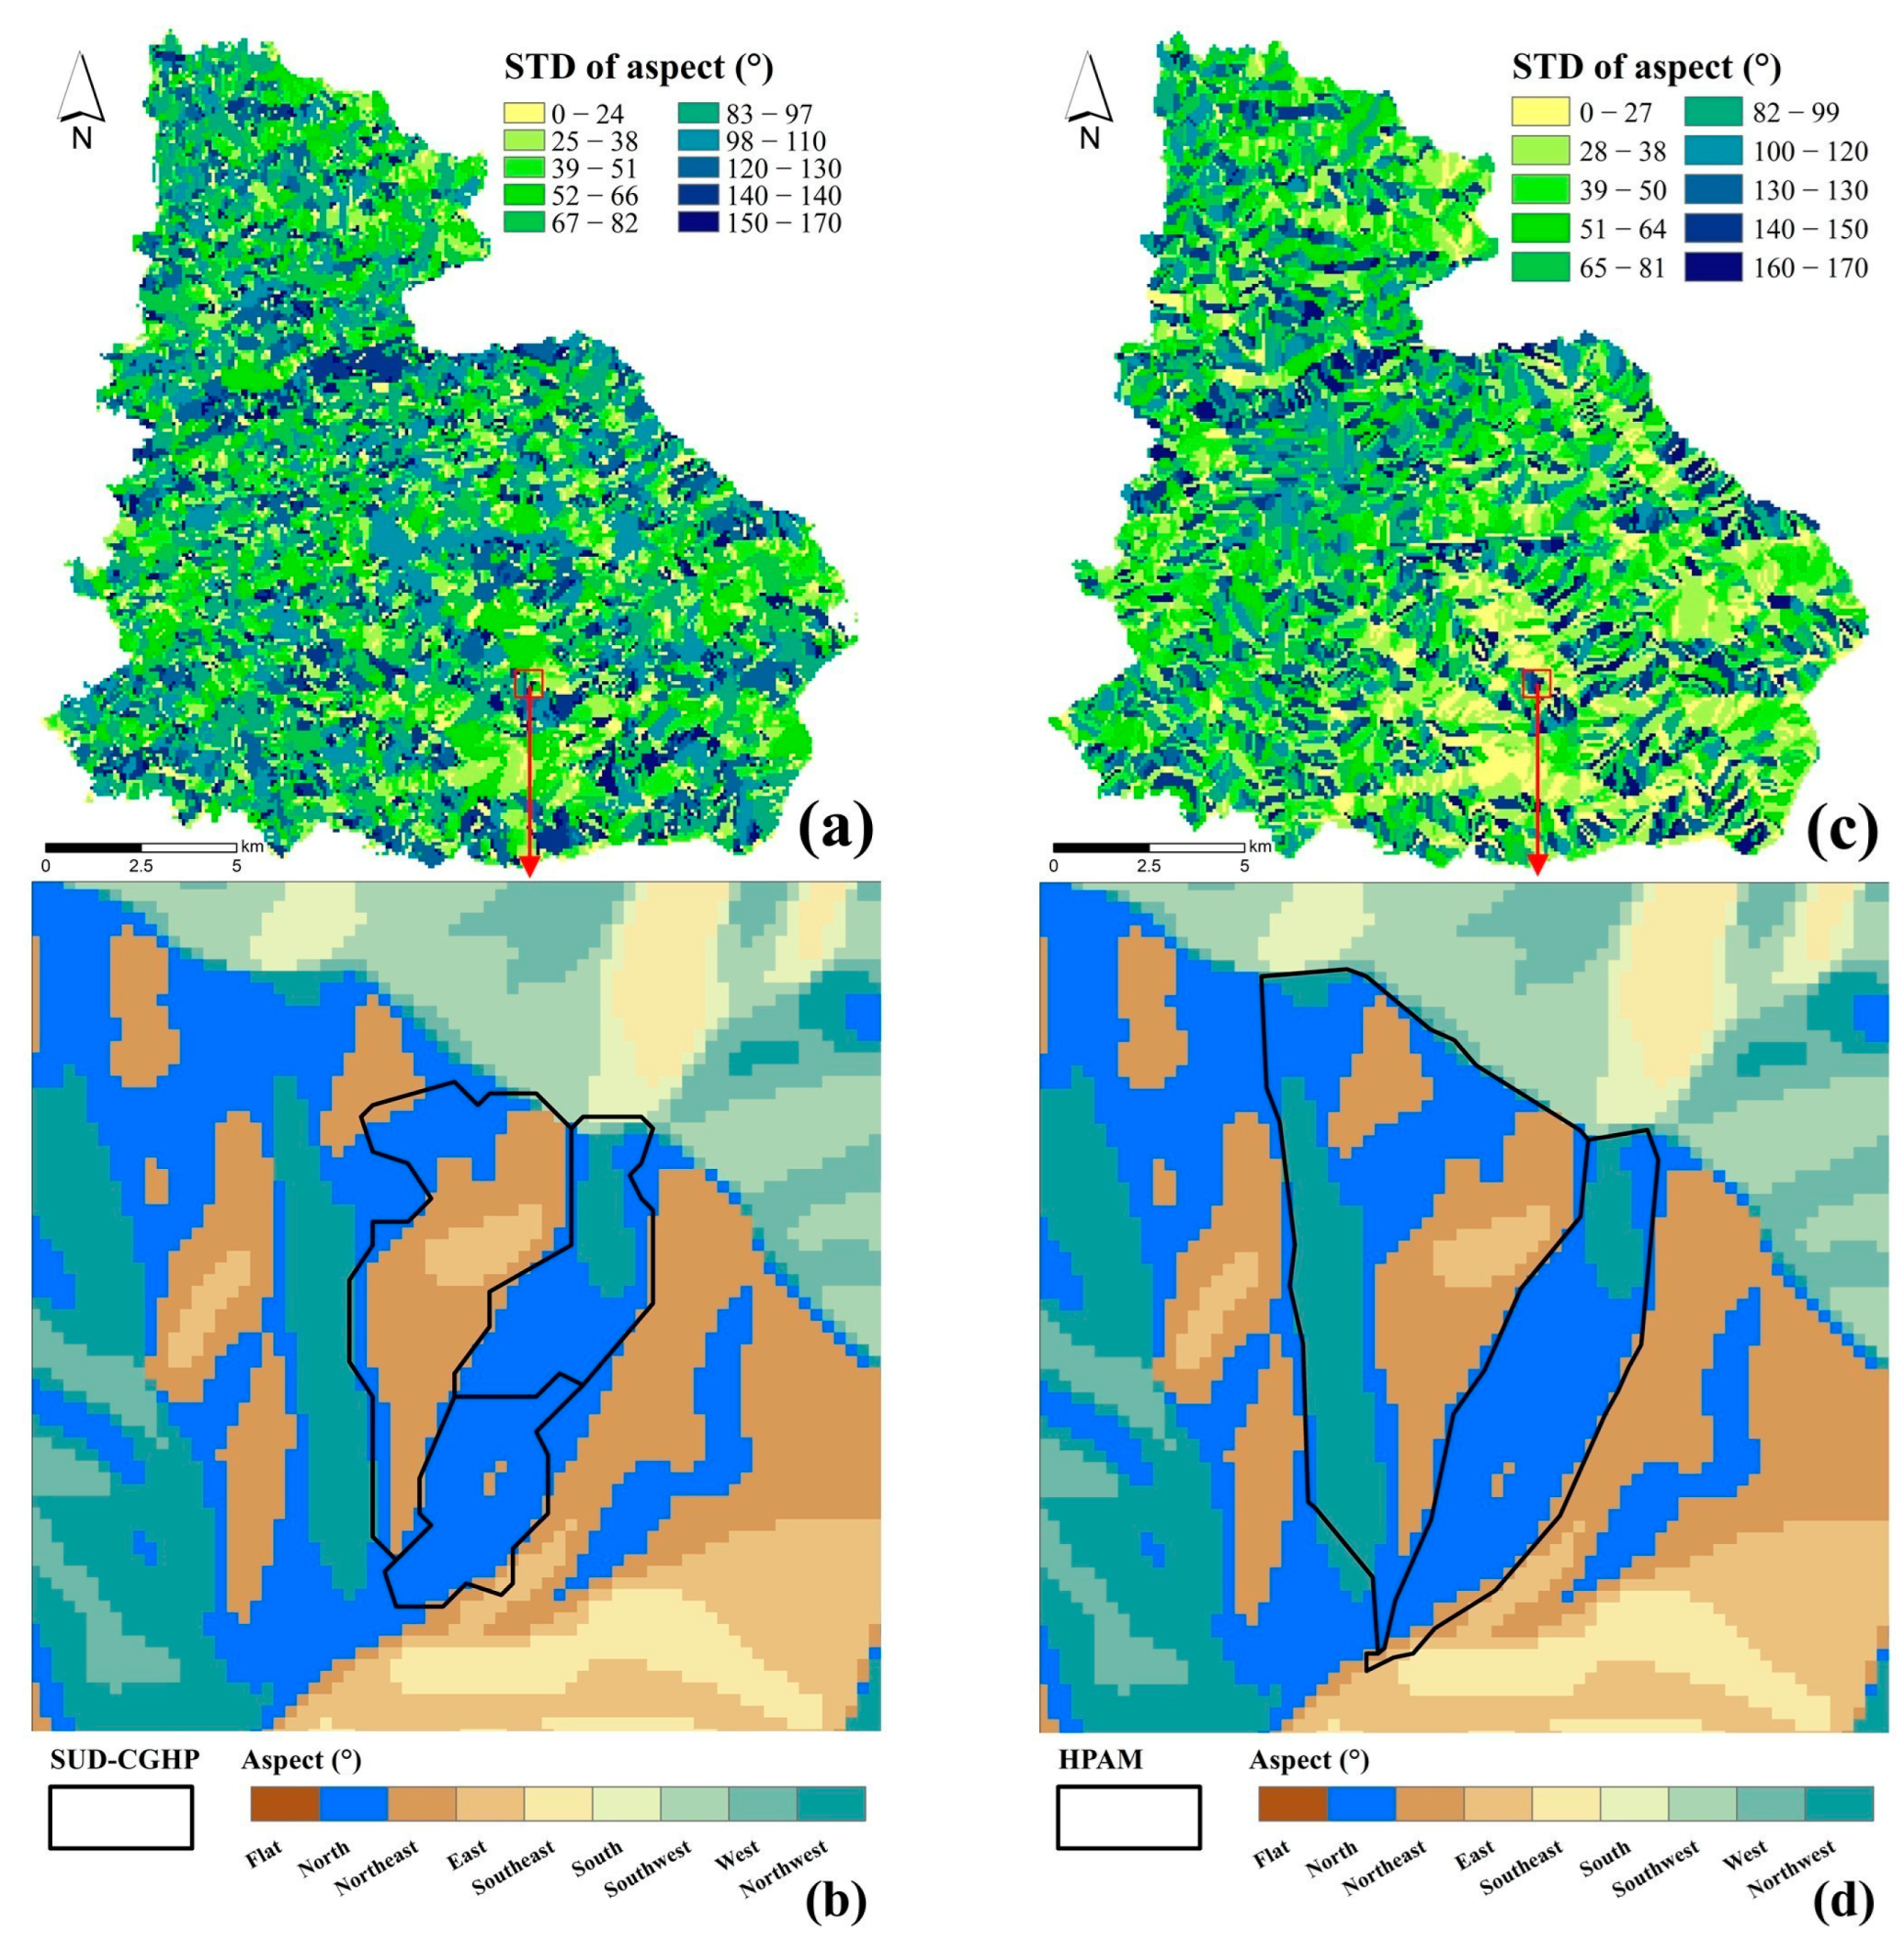
The flow direction grid variety, defined as the count of distinct flow direction categories within a single slope unit, quantifies the spatial complexity of water flow patterns. As shown in Figure 7, SUD-CGHP-derived slope units generally exhibit higher frequency percentages of low variety levels (1–4) compared to HPAM-derived units, while the HPAM dominates higher variety categories (5–8). Cumulative frequency analysis further reveals that SUD-CGHP maintains superior cumulative values for variety levels 1–6, achieving comparable results with the HPAM only at extreme variety levels (7–8). These findings suggest that although SUD-CGHP produces simpler flow direction patterns (lower overall variety), its segmentation demonstrates significantly higher internal directional consistency.
While both methods yield consistent mean flow directions across all slope units (Figure 7b), notable differences emerge in directional variety analysis (Figure 7c). SUD-CGHP-derived units exhibit substantially lower variety values in the northeast (NE), north (N), and northwest (NW) sectors compared to the HPAM. This directional selectivity indicates that SUD-CGHP achieves superior segmentation accuracy in northern-oriented terrains through its integrated hydro-mechanical framework, effectively capturing regional flow convergence patterns without introducing artificial complexity.
This analysis highlights two critical advantages of the SUD-CGHP method: (1) homogeneity optimization achieved through balanced simplicity–complexity trade-offs via controlled variation in flow direction patterns, resulting in superior internal consistency indices compared to conventional approaches, and (2) enhanced directional discrimination capability, as evidenced by reduced directional variability in key mountainous regions (the northeastern, northern, and northwestern sectors). Such advancements enable SUD-CGHP to deliver geometrically coherent and hydrologically representative slope unit delineations, offering significant practical value for watershed management, landslide susceptibility mapping, and sustainable land planning through improved spatial accuracy and processing efficiency.
Figure 8 provides the per-unit visualizations of the flow direction grid variety for slope units derived using SUD-CGHP and HPAM, accompanied by slope unit examples obtained using two methods and background flow direction grids of the same area which is conducted using D8 algorithms in selected regions. The D8 algorithm, widely recognized for its efficacy in surface water and groundwater hydrology [45,46], constitutes a critical computational component within the HPAM flow direction framework. This methodological choice stems from its proven capacity to resolve flow direction uncertainties across diverse terrain morphologies, particularly in complex watershed systems where topographic anisotropy demands high-fidelity directional discretization. Regionally, SUD-CGHP-derived units (Figure 8a) exhibit an alternating pattern of high- and low-variety zones across the entire study area, while HPAM-derived units (Figure 8c) display a pronounced east–west zonation, with western regions dominated by high variety and eastern areas characterized by low variety. This spatial distribution contrast highlights SUD-CGHP’s ability to balance variety variation while maintaining natural flow patterns. At the intra-unit scale, SUD-CGHP demonstrates superior internal flow direction homogeneity (Figure 8b) compared to HPAM (Figure 8d), as evidenced by the more uniform distribution of flow direction grids within individual slope units. Such enhanced internal coherence indicates that SUD-CGHP achieves physiologically meaningful segmentation by preserving natural flow convergence patterns without introducing artificial fragmentation. Collectively, these results confirm SUD-CGHP’s dual advantages: (1) generating zonally differentiated yet spatially balanced flow direction variety distributions and (2) producing geologically realistic slope units through integrated terrain–hydrological analysis. These methodological strengths hold critical implications for watershed-scale hydrological modeling, where accurate simulation of water movement rely on both spatial variability preservation and flow pattern integrity.

4.2.2. Slope Aspect

Slope aspect STD serves as a statistical measure of internal consistency within slope units by quantifying the variability of aspect grid values. Using identical analytical procedures, Figure 9 compares the STD distributions between SUD-CGHP-derived and HPAM-derived slope units. The results reveal distinct patterns: SUD-CGHP units exhibit a dominant proportion (over 20%) of STD values in the 0–20% range (Figure 9a), while HPAM-derived units are characterized by higher dominance in the 20–40% range. Cumulative frequency analysis further demonstrates that SUD-CGHP maintains superior cumulative percentages across all STD intervals up to 40%, converging with results by HPAM only at extreme values (>40%). These findings collectively indicate that SUD-CGHP achieves greater internal aspect consistency compared to HPAM.
Figure 9b,c present directional distribution patterns and their associated average aspect STDs for both methods. While both approaches yield comparable directional distributions across all slope units, significant differences emerge in STD performance: SUD-CGHP demonstrates superior consistency in the northwest (NW), north (N), and northeast (NE) sectors while showing inferior results in the southwest (SW) and south (S) directions compared to the HPAM. This directional variability reveals that SUD-CGHP achieves optimized balance between geometric coherence and hydrological representativeness, particularly in regions influenced by dominant northward drainage systems. The methodological strength lies in its ability to maintain natural aspect variability while minimizing artificial discretization artifacts commonly associated with traditional watershed-based approaches.
Figure 10 presents a comparative visualization of slope aspect STDs between SUD-CGHP-derived and HPAM-derived slope units, accompanied by slope unit examples obtained using two methods and background aspect grids. At the regional scale, SUD-CGHP units (Figure 10a) exhibit high-standard-deviation values that are primarily isolated as point-like clusters embedded within extensive low-standard-deviation zones. In contrast, HPAM-derived units (Figure 10c) display higher-standard-deviation regions predominantly as contiguous patches covering larger areas, suggesting less spatial fragmentation. When analyzing intra-unit aspect variability, SUD-CGHP-derived slope units demonstrate significantly greater internal homogeneity in aspect grid values compared to their hydrological counterparts. This superior consistency indicates that SUD-CGHP achieves more physiologically plausible segmentation by preserving natural aspect variability patterns while avoiding artificial discretization artifacts commonly associated with traditional watershed-based approaches.

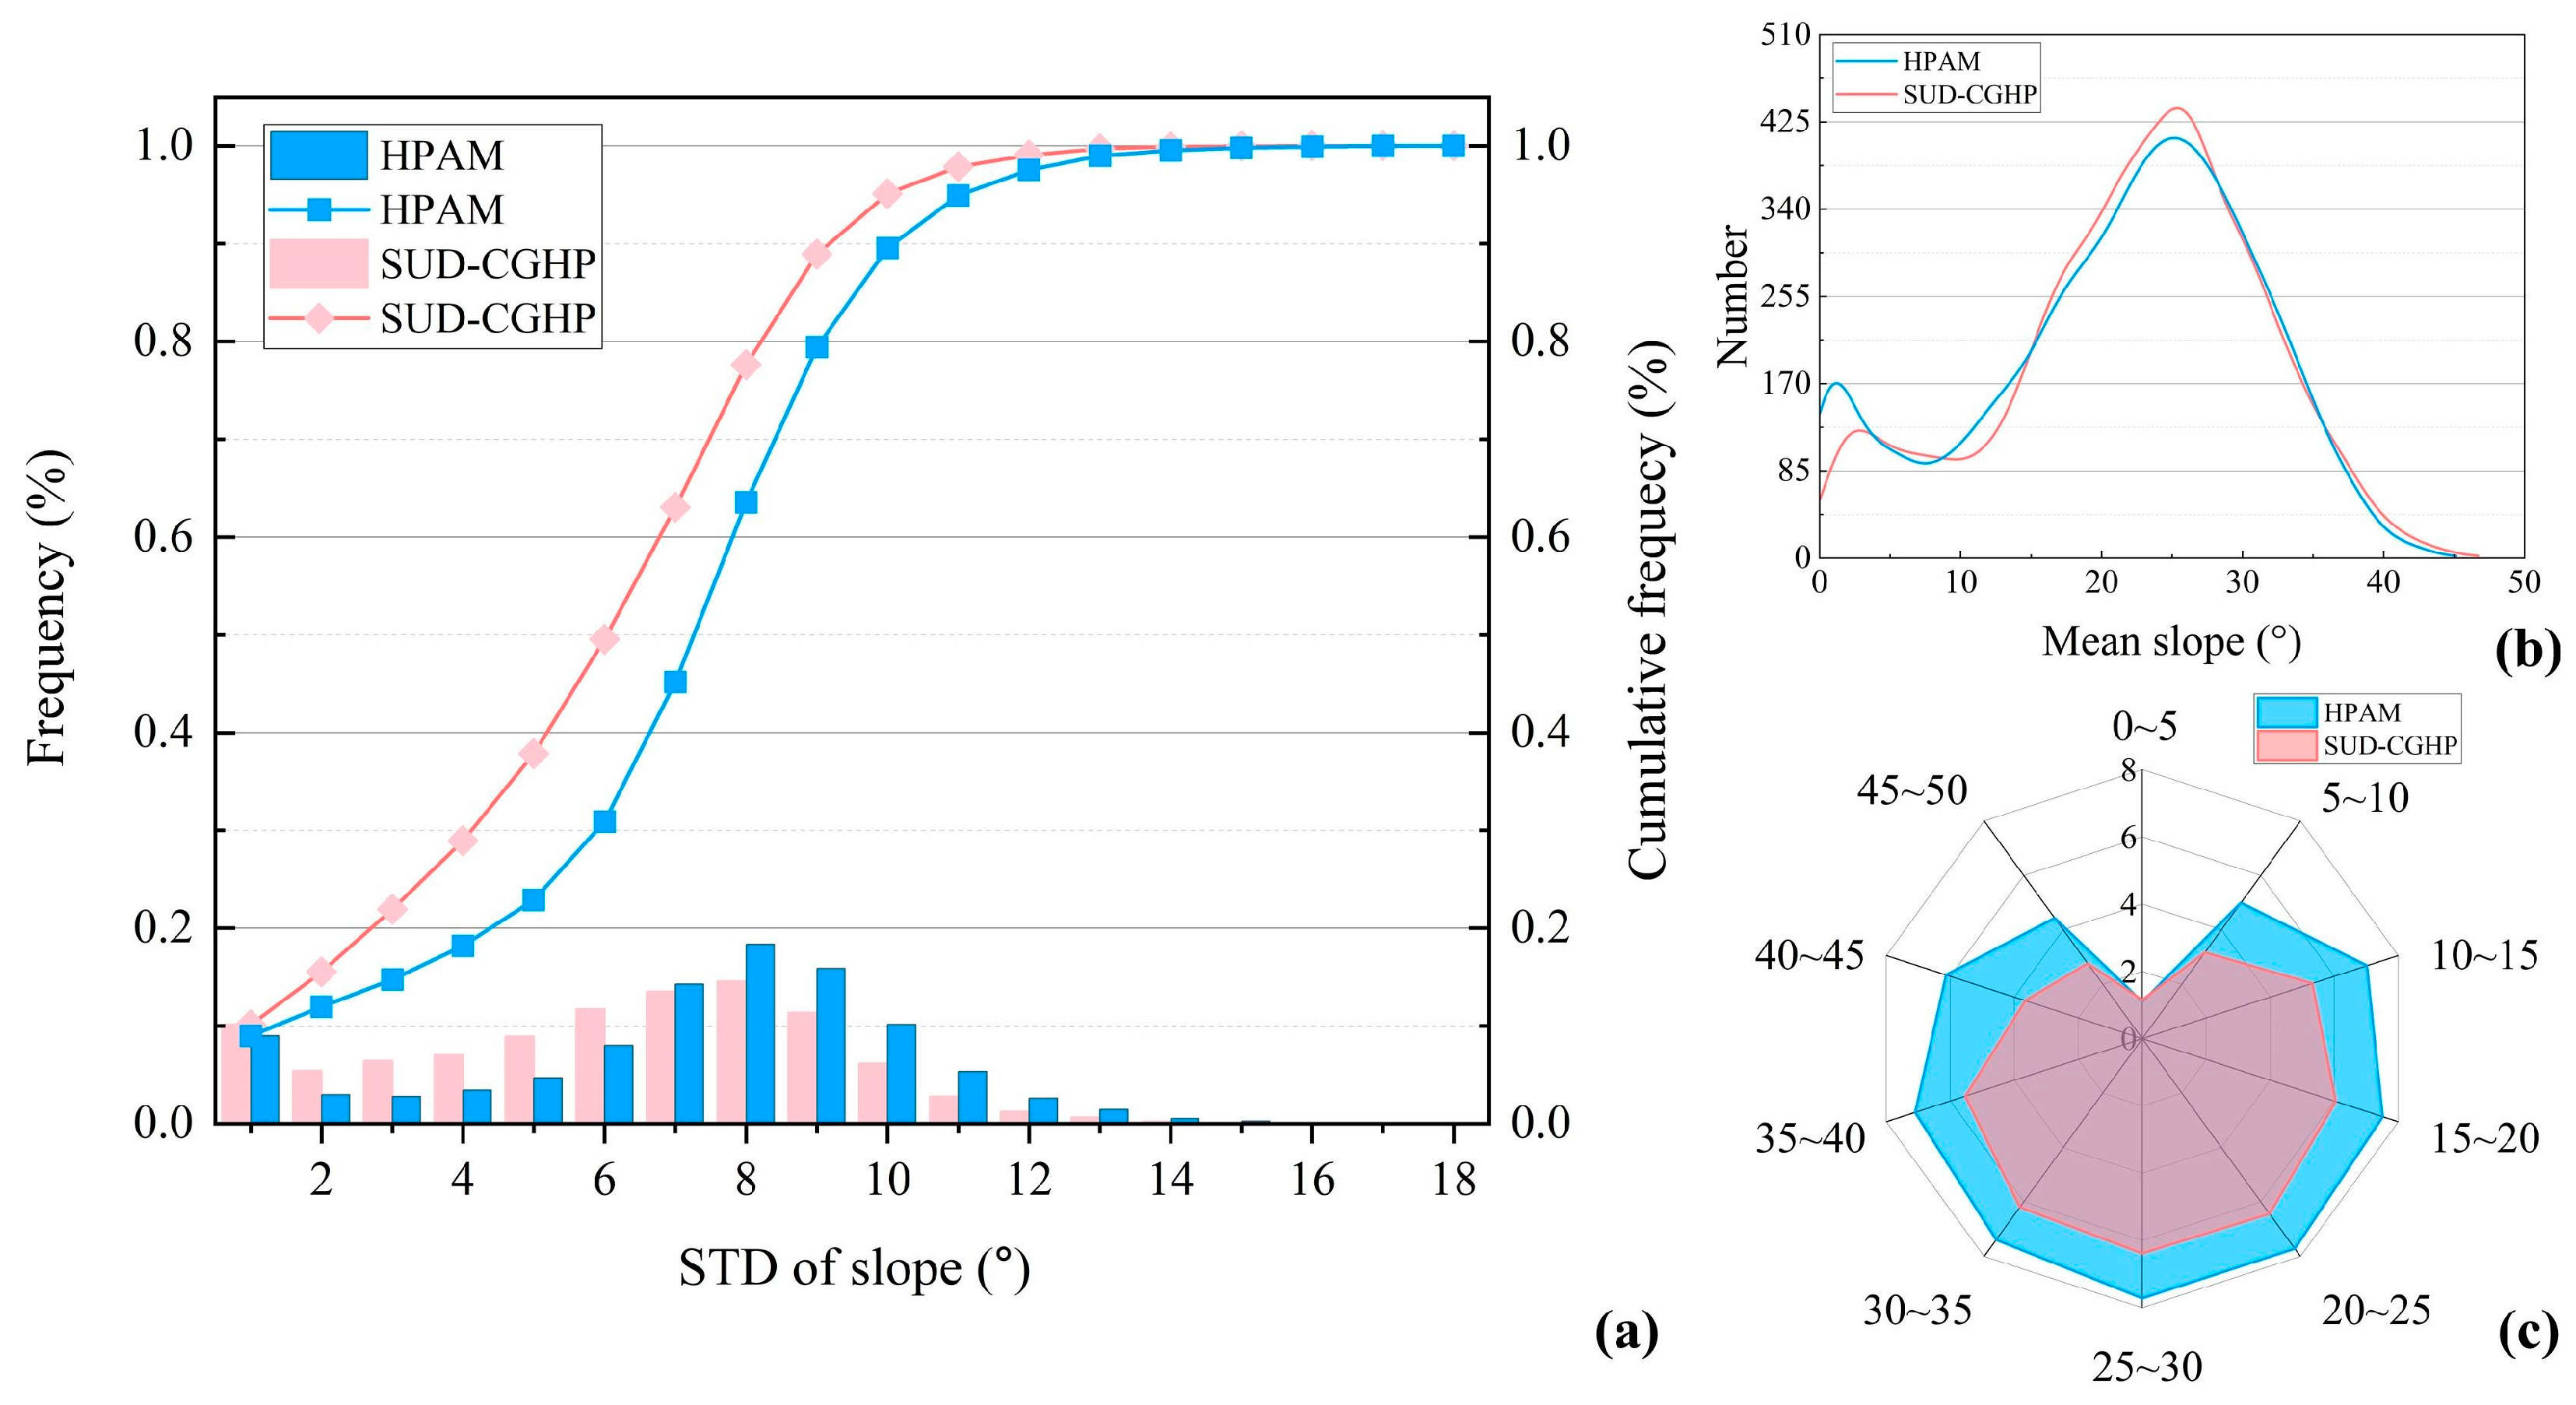
4.2.3. Slope Gradient

Slope gradient STD serves as a critical metric for evaluating internal consistency within slope units. As analyzed in Figure 11, SUD-CGHP-derived units exhibit higher STD values (0–6%) compared to HPAM-derived units while showing lower values in the extreme range (>6%). Cumulative frequency analysis further reveals that SUD-CGHP achieves superior overall consistency, with cumulative percentages exceeding those of the HPAM across all gradient intervals. This demonstrates that SUD-CGHP produces more homogeneous slope units by effectively balancing gradient variability and maintaining natural terrain characteristics.
Figure 11b,c compare the slope distribution patterns and their associated average STDs between the two methods. While both approaches yield comparable slope distributions (Figure 11b), SUD-CGHP demonstrates significantly lower average STDs across all slope intervals (Figure 11c). This superior homogeneity indicates that SUD-CGHP-derived slope units achieve higher internal consistency by minimizing artificial discretization errors commonly associated with HPAM segmentation. Such methodological advantages position SUD-CGHP as a more reliable tool for terrain analysis applications requiring both geometric coherence and hydrological representativeness.
Figure 12 presents a comparative visualization of slope gradient STDs between SUD-CGHP-derived and HPAM-derived slope units, accompanied by slope unit examples obtained using two methods and background slope grids. While both methods show comparable spatial distribution patterns of low and high STD values (Figure 12a), a closer inspection of the slope unit boundaries and contained grid values reveals significant differences (Figure 12b,c). Notably, SUD-CGHP-derived units exhibit superior alignment with actual terrain features through finer spatial resolution and more precise integration of gradient variations. This methodological superiority demonstrates that SUD-CGHP produces geologically realistic slope units with enhanced practical applicability, particularly in contexts requiring accurate representation of terrain heterogeneity for landslide risk assessments and soil erosion modeling.

5. Discussion

HPAM define slope units as regions between ridge and valley lines based on geomorphic features. While operationally straightforward and widely applied in engineering projects, this approach exhibits significant limitations in terms of refinement and automation. For instance, HPAM-derived slope units often fail to accurately represent complex terrain, as they may merge multiple natural slopes into single units or encompass entire watersheds in mountainous areas. The method’s strong reliance on subjective parameter settings leads to inconsistent results across different regions. Moreover, the segmentation process frequently generates elongated polygons that require extensive manual adjustments, reducing efficiency and accuracy for large-scale, high-resolution analyses. These inherent drawbacks restrict the HPAM’s applicability in geologically heterogeneous regions where precise slope unit delineation is critical for landslide risk assessments, soil erosion modeling, and sustainable land management.
Compared to HPAM, the SUD-CGHP integrates existing slope unit definitions with computer graphics techniques and hydrological principles to enable automated, high-precision slope unit delineation, significantly enhancing operational efficiency. This method demonstrates superior consistency in flow direction, aspect, and gradient parameters across derived units, overcoming the limitations of traditional approaches. Its strong adaptability extends to complex terrain and diverse geomorphic conditions, making it suitable for generating fundamental units in geological hazard prediction and assessments. Consequently, the proposed SUD-CGHP method offers notable advantages in terms of segmentation fineness, intelligent automation capabilities, and broader applicability compared to traditional hydrological techniques.
In this study, the SUD-CGHP and HPAM were implemented on an NVIDIA RTX 3060 laptop GPU platform, with processing times of 30 min and 15 min, respectively. Notably, the HPMA required an additional 48 h of manual correction, while SUD-CGHP achieved fully automated post-processing with zero human intervention. Although SUD-CGHP demonstrates significant advantages in automation and efficiency, its resource-intensive nature imposes strict computational demands, potentially limiting its application in environments with constrained computing resources. Specifically, handling large-scale datasets or real-time tasks may encounter performance bottlenecks due to its high hardware requirements. Therefore, while the new method offers theoretical superiority in segmentation precision and operational, practical deployment must carefully balance computational efficiency against available resources to optimize its applicability across diverse scenarios.
Compared to the HPAM that relies on empirical threshold parameters (e.g., flow thresholds), the SUD-CGHP method employs a dual-constraint fusion mechanism to achieve threshold-free parameterization. By integrating flow direction and aspect consistency as merging constraints during slope unit delineation, this method aligns with the fundamental characteristics of natural slope units. Specifically, it categorizes the continuous 0–360° directional spectrum into eight compass azimuth classes and uses overall directional coherence as a merging criterion. However, this discrete classification approach may introduce inherent biases when applied to real-world scenarios where both flow direction and aspect are inherently continuous variables. To address this limitation, future research could explore dynamic merging strategies under continuous numerical conditions, such as incorporating fuzzy logic methodology to reconcile slope unit micro-variations with continuous directional gradients, thereby enhancing the precision of merging processes through better integration of topographic features. Such advancements would bridge the gap between discrete categorization and continuous terrain variability, advancing the method’s applicability in complex geomorphic environments.
DEMs possess the capability to represent surface topography with varying levels of detail, where higher-resolution DEMs (e.g., 10 m) capture finer terrain features, producing more detailed slope aspect, gradient, and flow direction data that closely align with actual ground conditions. However, this increased resolution often leads to excessively fragmented slope units, complicating computational analysis. Conversely, lower-resolution DEMs (e.g., 90 m) generate coarser terrain representations but may yield appropriately sized slope units that meet practical needs. To address this trade-off, systematic investigations should be conducted to evaluate SUD-CGHP-derived slope units across multiple resolutions (e.g., 90 m, 30 m, and 10 m). Such studies would analyze how resolution affects both the geometric coherence of slope units and their internal mechanical and hydrological properties, providing critical insights for optimizing method selection in different application scenarios. Furthermore, this research could advance our understanding of scale-dependent effects in terrain analysis, particularly regarding the balance between spatial detail and computational feasibility.
The application adaptability of this methodology across diverse geomorphic types constitutes another critical research dimension. In the study area of Yanglousi Town, where hills dominate and plains occupy minor proportions, SUD-CGHP demonstrates commendable performance in classifying plain and hilly terrains. Nevertheless, its effectiveness remains constrained under other geomorphic conditions such as mountainous and plateau regions. Future research will extend the methodological application to these complex terrains by systematically evaluating slope unit behavior and deriving optimized implementation protocols across varied geomorphic environments.

6. Conclusions

This study conducted a comparative analysis of slope unit delineation between SUD-CGHP and HPAM in Yangloushi Town, Yueyang City, Hunan Province. The results demonstrate some key points of the SUD-CGHP approach:
(1)
SUD-CGHP not only identifies large planar areas with greater morphological regularity compared to HPAM but also avoids elongated slope units and extensive manual revision processes. This capability ensures geometric coherence while reducing post-processing efforts, making it suitable for real-world engineering applications.
(2)
The method exhibits superior internal consistency in flow direction, aspect, and gradient parameters across derived slope units. The findings demonstrate that the outcomes generated by SUD-CGHP represent a superior alternative for establishing geohazard evaluation units.
(3)
SUD-CGHP demonstrates advanced planar recognition performance and automated processing efficiency, enabling rapid and precise slope unit extraction even for large datasets. This innovative methodology represents a substantial advancement in automating geohazard susceptibility assessments, diversifying slope unit selection paradigms, and promoting theoretical integration across multiple disciplines, thereby establishing a robust methodological foundation for enhanced spatial analysis in geohazard research.
(4)
In the subsequent phase of this study, we will systematically investigate the predictive accuracy and optimization potential of landslide susceptibility mapping models based on slope units delineated within the Yanglousi Town study area through the integration of artificial intelligence technologies. Notably, this research will further explore the synergistic integration of slope units with raster-based approaches in geospatial analysis while elaborating on the practical implementation strategies for multiscale geospatial analysis frameworks.

Author Contributions

T.X.: original draft, writing—review and editing, conceptualization, formal analysis, methodology, investigation, and supervision. L.Z.: original draft, writing—review and editing, formal analysis, data curation, methodology, software, visualization, and validation. L.W.: original draft, writing—review and editing, methodology, resources, supervision, validation, and funding acquisition. B.Y.: conceptualization, writing—review and editing, methodology, and software. C.W.: writing—review and editing, data curation, resources, and validation. H.Y.: writing—review and editing and investigation. All authors have read and agreed to the published version of the manuscript.

Funding

This work was financially supported by the National Natural Science Foundation of China (No. 42307275), the Natural Science Foundation of Hunan Province, China (No. 2025JJ20030, 2024JJ6498), the Open Fund of Hunan Geological Disaster Monitoring, Early Warning and Emergency Rescue Engineering Technology Research Center (No. hndzgczx202404), and the Innovation Center for Automated Monitoring Technology of Geological Hazards, Ministry of Natural Resources (No. TICG-K2024008).

Institutional Review Board Statement

Not applicable.

Informed Consent Statement

Not applicable.

Data Availability Statement

The original contributions presented in this study are included in the article. Further inquiries can be directed to the corresponding author.

Conflicts of Interest

The authors declare no conflicts of interest.

Abbreviations

HPAMhydrological process analysis method
SUD-CGHPslope unit division method coupled with computer graphics and hydrological principles
DEMsdigital elevation models
STDstandard deviation

References

  1. Hadji, R.; Boumazbeur, A.; Limani, Y.; Baghem, M.; Chouabi, A.; Demdoum, A. Geologic, topographic and climatic controls in landslide hazard assessment using GIS modeling: A case study of Souk Ahras region, NE Algeria. Quat. Int. 2013, 302, 224–237. [Google Scholar] [CrossRef]
  2. He, S.; Pan, P.; Dai, L.; Wang, H.; Liu, J. Application of kernel-based Fisher discriminant analysis to map landslide susceptibility in the Qinggan River delta, Three Gorges, China. Geomorphology 2012, 171, 30–41. [Google Scholar] [CrossRef]
  3. Chau, K.T.; Sze, Y.; Fung, M.; Wong, W.; Fong, E.; Chan, L. Landslide hazard analysis for Hong Kong using landslide inventory and GIS. Comput. Geosci. 2004, 30, 429–443. [Google Scholar] [CrossRef]
  4. Liang, X.; Segoni, S.; Fan, W.; Yin, K.; Deng, L.; Xiao, T.; Barbadori, F.; Casagli, N. Integration of effective antecedent rainfall to improve the performance of rainfall thresholds for landslide early warning in Wanzhou District, China. Int. J. Disaster Risk Reduct. 2025, 109, 105317. [Google Scholar] [CrossRef]
  5. Arabameri, A.; Pradhan, B.; Pourghasemi, H.R.; Rezaei, K.; Kerle, N. Spatial Modelling of Gully Erosion Using GIS and R Programing: A Comparison among Three Data Mining Algorithms. Appl. Sci. 2018, 8, 1369. [Google Scholar] [CrossRef]
  6. Bi, R.; Han, Z. Experimental Investigation of the Normal Coefficient of Restitution in Rockfall Collisions: Influence and Interaction of Controlling Factors. Appl. Sci. 2025, 15, 3874. [Google Scholar] [CrossRef]
  7. Abramson, L.W.; Lee, T.S.; Sharma, S.; Boyce, G.M. Slope Stability and Stabilization Methods; John Wiley & Sons: Hoboken, NJ, USA, 2001. [Google Scholar]
  8. Warren, S.D.; Hohmann, M.G.; Auerswald, K.; Mitasova, H. An evaluation of methods to determine slope using digital elevation data. Catena 2004, 58, 215–233. [Google Scholar] [CrossRef]
  9. Wang, K.; Zhang, S.; Wei, F. Slope unit extraction methods: Advances and prospects. J. Chang. River Sci. Res. Inst. 2020, 37, 85. [Google Scholar]
  10. Chen, W.; Chen, Y.; Tsangaratos, P.; Ilia, I.; Wang, X. Combining Evolutionary Algorithms and Machine Learning Models in Landslide Susceptibility Assessments. Remote Sens. 2020, 12, 3854. [Google Scholar] [CrossRef]
  11. Zhang, Y.; Zhang, W.; Wang, L.; Xiao, T.; Meng, X.; Zhang, Z. Mechanism of the high-speed and long-run-out landslide considering the evolution of the frictional heat in the sliding zone. Nat. Hazards 2024, 120, 3299–3317. [Google Scholar] [CrossRef]
  12. Zhou, S.; Han, W.; Huang, M.; Xu, Z.; Li, J.; Zhang, J. Slope Stability Prediction Based on Incremental Learning Bayesian Model and Literature Data Mining. Appl. Sci. 2025, 15, 2423. [Google Scholar] [CrossRef]
  13. Schlögel, R.; Marchesini, I.; Alvioli, M.; Reichenbach, P.; Rossi, M.; Malet, J.-P. Optimizing landslide susceptibility zonation: Effects of DEM spatial resolution and slope unit delineation on logistic regression models. Geomorphology 2018, 301, 10–20. [Google Scholar] [CrossRef]
  14. Li, L.; Jia, M.; Xu, C.; Tian, Y.; Ma, S.; Yang, J. Enhancing Landslide Susceptibility Mapping by Integrating Neighboring Information in Slope Units: A Spatial Logistic Regression. Remote Sens. 2024, 16, 4475. [Google Scholar] [CrossRef]
  15. Ba, Q.; Chen, Y.; Deng, S.; Yang, J.; Li, H. A comparison of slope units and grid cells as mapping units for landslide susceptibility assessment. Earth Sci. Inform. 2018, 11, 373–388. [Google Scholar] [CrossRef]
  16. Liu, S.; Zhu, J.; Yang, D.; Ma, B. Comparative study of geological hazard evaluation systems using grid units and slope units under different rainfall conditions. Sustainability 2022, 14, 16153. [Google Scholar] [CrossRef]
  17. Zhang, M.; Gu, S. Stability Analysis of the Longitudinal Slope Linear Shield Tunnel Excavation Face. Appl. Sci. 2025, 15, 4083. [Google Scholar] [CrossRef]
  18. Nelson, A.; Reuter, H.; Gessler, P. DEM production methods and sources. Dev. Soil Sci. 2009, 33, 65–85. [Google Scholar]
  19. Mukherjee, S.; Joshi, P.K.; Mukherjee, S.; Ghosh, A.; Garg, R.; Mukhopadhyay, A. Evaluation of vertical accuracy of open source Digital Elevation Model (DEM). Int. J. Appl. Earth Obs. Geoinf. 2013, 21, 205–217. [Google Scholar] [CrossRef]
  20. Huang, F.; Tao, S.; Li, D.; Lian, Z.; Catani, F.; Huang, J.; Li, K.; Zhang, C. Landslide Susceptibility Prediction Considering Neighborhood Characteristics of Landslide Spatial Datasets and Hydrological Slope Units Using Remote Sensing and GIS Technologies. Remote Sens. 2022, 14, 4436. [Google Scholar] [CrossRef]
  21. Liu, H.; Zhang, X.; Lin, H.; Chen, Y.; Yang, C.; Ou, K. Shear Mechanical Properties of Rock Joints Under Non-Uniform Load Based on DEM. Appl. Sci. 2025, 15, 4257. [Google Scholar] [CrossRef]
  22. Zhou, F.; Yao, T.; Bian, J.; Xiao, Y. Improvement of Terrain Entropy Calculation for Grid Digital Elevation Models Considering Spatial Structural Features. Appl. Sci. 2025, 15, 2577. [Google Scholar] [CrossRef]
  23. Carrara, A.; Guzzetti, F. Geographical Information Systems in Assessing Natural Hazards; Springer Science & Business Media: Berlin/Heidelberg, Germany, 2013; Volume 5. [Google Scholar]
  24. Yang, Z.; Shao, W.; Qiao, J.; Huang, D.; Tian, H.; Lei, X.; Uchimura, T. A Multi-Source Early Warning System of MEMS Based Wireless Monitoring for Rainfall-Induced Landslides. Appl. Sci. 2017, 7, 1234. [Google Scholar] [CrossRef]
  25. Xie, M.; Esaki, T.; Zhou, G. GIS-based probabilistic mapping of landslide hazard using a three-dimensional deterministic model. Nat. Hazards 2004, 33, 265–282. [Google Scholar] [CrossRef]
  26. Gu, T.; Wang, J.; Fu, X.; Liu, Y. GIS and limit equilibrium in the assessment of regional slope stability and mapping of landslide susceptibility. Bull. Eng. Geol. Environ. 2015, 74, 1105–1115. [Google Scholar] [CrossRef]
  27. Huo, A.; Zhang, J.; Lu, Y.; Yao, Y. Method of Classification for Susceptibility Evaluation Unit for Geological Hazards: A Case Study of Huangling County, Shaanxi, China. J. Jilin Univ. (Earth Sci. Ed.) 2011, 41, 523–528+535. [Google Scholar] [CrossRef]
  28. Yan, G.; Liang, S.; Zhao, H. An Approach to Improving Slope Unit Division Using GIS Technique. Sci. Geogr. Sin. 2017, 37, 1764–1770. [Google Scholar] [CrossRef]
  29. Alvioli, M.; Marchesini, I.; Reichenbach, P.; Rossi, M.; Ardizzone, F.; Fiorucci, F.; Guzzetti, F. Automatic delineation of geomorphological slope units with r.slopeunits v1.0 and their optimization for landslide susceptibility modeling. Geosci. Model Dev. 2016, 9, 3975–3991. [Google Scholar] [CrossRef]
  30. Alvioli, M.; Guzzetti, F.; Marchesini, I. Parameter-free delineation of slope units and terrain subdivision of Italy. Geomorphology 2020, 358, 107124. [Google Scholar] [CrossRef]
  31. Wang, K.; Xu, H.; Zhang, S.; Wei, F.; Xie, W. Identification and extraction of geomorphological features of landslides using slope units for landslide analysis. ISPRS Int. J. Geo-Inf. 2020, 9, 274. [Google Scholar] [CrossRef]
  32. Wang, K.; Zhang, S.; DelgadoTellez, R.; Wei, F. A new slope unit extraction method for regional landslide analysis based on morphological image analysis. Bull. Eng. Geol. Environ. 2019, 78, 4139–4151. [Google Scholar] [CrossRef]
  33. Huang, F.; Tao, S.; Chang, Z.; Huang, J.; Fan, X.; Jiang, S.-H.; Li, W. Efficient and automatic extraction of slope units based on multi-scale segmentation method for landslide assessments. Landslides 2021, 18, 3715–3731. [Google Scholar] [CrossRef]
  34. Foley, J.D.; Van Dam, A.; Feiner, S.K.; Hughes, J.F.; Phillips, R.L. Introduction to Computer Graphics; Addison-Wesley Reading: Boston, MA, USA, 1994; Volume 55. [Google Scholar]
  35. Foley, J.D. Computer Graphics: Principles and Practice; Addison-Wesley Professional: Boston, MA, USA, 1996; Volume 12110. [Google Scholar]
  36. Agoston, M.K. Computer Graphics and Geometric Modeling; Springer: Berlin/Heidelberg, Germany, 2005; Volume 1. [Google Scholar]
  37. Zhou, K.; Hou, Q.; Wang, R.; Guo, B. Real-time kd-tree construction on graphics hardware. ACM Trans. Graph. (TOG) 2008, 27, 1–11. [Google Scholar]
  38. Moretti, G.; Orlandini, S. Thalweg and ridge network extraction from unaltered topographic data as a basis for terrain partitioning. J. Geophys. Res. Earth Surf. 2023, 128, e2022JF006943. [Google Scholar] [CrossRef]
  39. Affandi, E.; Ng, T.F.; Pereira, J.J. Integration of Geoscience Information for Disaster Resilience in Kuala Lumpur, Malaysia. Appl. Sci. 2023, 13, 7004. [Google Scholar] [CrossRef]
  40. Cao, J.; Zhang, Z.; Du, J.; Zhang, L.; Song, Y.; Sun, G. Multi-geohazards susceptibility mapping based on machine learning—A case study in Jiuzhaigou, China. Nat. Hazards 2020, 102, 851–871. [Google Scholar] [CrossRef]
  41. Ma, J.; Wang, X.; Yuan, G. Evaluation of Geological Hazard Susceptibility Based on the Regional Division Information Value Method. ISPRS Int. J. Geo-Inf. 2023, 12, 17. [Google Scholar] [CrossRef]
  42. Ahmad, H.; Ningsheng, C.; Rahman, M.; Islam, M.M.; Pourghasemi, H.R.; Hussain, S.F.; Habumugisha, J.M.; Liu, E.; Zheng, H.; Ni, H.; et al. Geohazards susceptibility assessment along the upper indus basin using four machine learning and statistical models. ISPRS Int. J. Geo-Inf. 2021, 10, 315. [Google Scholar] [CrossRef]
  43. Schiavo, M. Quantile-Based Approach for Improving the Identification of Preferential Groundwater Networks. Water 2025, 17, 282. [Google Scholar] [CrossRef]
  44. Meyer, F. The watershed concept and its use in segmentation: A brief history. arXiv 2012, arXiv:1202.0216. [Google Scholar]
  45. Orlandini, S.; Moretti, G.; Corticelli, M.A.; Santangelo, P.E.; Capra, A.; Rivola, R.; Albertson, J.D. Evaluation of flow direction methods against field observations of overland flow dispersion. Water Resour. Res. 2012, 48. [Google Scholar] [CrossRef]
  46. Schiavo, M.; Riva, M.; Guadagnini, L.; Zehe, E.; Guadagnini, A. Probabilistic identification of preferential groundwater networks. J. Hydrol. 2022, 610, 127906. [Google Scholar] [CrossRef]
Figure 1. SUD-CGHP method workflow.
Applsci 15 04647 g001
Figure 2. Maximal circle algorithm [32]: (a) the maximum circle tangent to the contour; (b) the morphological skeleton line.
Applsci 15 04647 g002
Figure 3. Comparison of whether to use morphological preprocessing: (a) non-use of morphological preprocessing; (b) usage of morphological preprocessing.
Applsci 15 04647 g003
Figure 4. DEM of Yangloushi Town.
Applsci 15 04647 g004
Figure 5. Slope unit division diagram.
Applsci 15 04647 g005
Figure 6. Plane slope unit extraction comparison diagram. (a) Yanglousi Town corresponding area satellite map; (b) slope units extracted using HPAM; (c) slope units extracted using SUD-CGHP.
Applsci 15 04647 g006
Figure 7. Variety of flow direction. (a) Flow direction variety frequency statistics; (b) flow direction distribution of slope unit; (c) average variety in all directions.
Applsci 15 04647 g007
Figure 8. (a) Variety of SUD-CGHP; (b) slope unit via SUD-CGHP. (c) Variety of HPAM. (d) Slope unit via HPAM.
Applsci 15 04647 g008
Figure 9. STD of aspect. (a) STD frequency statistics; (b) mean aspect distribution of slope units; (c) average STD in all directions.
Applsci 15 04647 g009
Figure 10. (a) STD of the aspect of SUD-CGHP; (b) slope unit using SUD-CGHP; (c) STD of the aspect of HPAM; (d) slope unit using HPAM.
Applsci 15 04647 g010
Figure 11. STD of slope. (a) STD frequency statistics; (b) mean slope gradient distribution of slope units; (c) average STD in all directions.
Applsci 15 04647 g011
Figure 12. (a) STD of the slope gradient of SUD-CGHP; (b) Slope unit using SUD-CGHP; (c) STD of the slope gradient of HPAM; (d) Slope unit using HPAM.
Applsci 15 04647 g012
Disclaimer/Publisher’s Note: The statements, opinions and data contained in all publications are solely those of the individual author(s) and contributor(s) and not of MDPI and/or the editor(s). MDPI and/or the editor(s) disclaim responsibility for any injury to people or property resulting from any ideas, methods, instructions or products referred to in the content.

