Article

Study on the Charge Structure Optimization for Coal–Rock Mixed Blasting and Separate Mining in Open-Pit Mine with High Benches

1
Institute of Blasting Technology, Liaoning Technical University, Fuxin 123000, China
2
School of Civil Engineering, Liaoning Technical University, Fuxin 123000, China
*
Author to whom correspondence should be addressed.
Appl. Sci. 2025, 15(8), 4521; https://doi.org/10.3390/app15084521
Submission received: 12 February 2025 / Revised: 28 March 2025 / Accepted: 16 April 2025 / Published: 19 April 2025

Abstract

:
This study systematically analyzes the influence of the charge length-to-diameter ratio and stemming length on the radius and volume of blasting craters in coal and rock blasting crater tests to effectively address the challenge of achieving coal–rock separation in mixed blasting construction. In addition, it examines the energy distribution mechanism of blasting fragmentation and establishes characteristic equations for coal and rock blasting craters. Numerical simulations and blasting tests are conducted to investigate the casting effect of rock benches and the fragmentation characteristics of coal and rock benches under different charge structures. The results indicate that when the ratio of charge length to stemming length exceeds 0.91 and 0.74 for the coal and rock benches, respectively, the utilization rate of explosive energy for rock fragmentation gradually surpasses that for rock throwing. The charging structure is identified as a key factor in achieving coal–rock mixed blasting and separation mining. The explosive energy is effectively utilized with a bottom interval length of 2 m for rock benches and a stemming length ranging from 2.5 to 3 m for coal seams. This configuration raises the connectivity of rock damage cracks, improves the distribution of tensile cracks at the top of the coal seam, and prevents bulging or coal–rock interactions (blasting mixing) at the coal–rock interface. The findings demonstrate that the optimized charging structure effectively achieves separate mining in coal–rock mixed blasting, fulfilling the requirement of avoiding coal–rock mixing during blasting. The research provides valuable mining strategies and technical experience for achieving separate mining in coal–rock mixed blasting in open-pit coal mines and improving the recovery of thin coal seams.

1. Introduction

Cast blasting is crucial in enhancing stripping efficiency [1,2,3] and reducing production costs [4,5,6]. During the open-pit mining process, due to the layout of the mining system and the spatiotemporal coordination of stripping operations, thin coal seams are often blasted together with rock and discarded as waste, resulting in significant coal resource loss. Experimental studies on optimizing the explosive charge structure for coal–rock mixed blasting under deep-hole bench conditions have been conducted to improve the recovery rate of thin coal seams and enhance coal resource extraction efficiency. They propose a rational charge structure to facilitate the mixed blasting of coal and rock, achieving selective mining. Advancing the development of deep-hole bench coal–rock mixed blasting selective mining technology is of substantial practical importance for enabling economic, efficient, and environmentally friendly mining.
In recent years, significant advancements have been made in blasting theory research and practical exploration, including throw blasting theory analysis and methods such as blast effect control and prediction. For instance, Xiao et al. [6] employed regression analysis and other techniques to develop a model that related throw blasting bench parameters to stripping costs and introduced a multi-objective optimization model-solving method based on the non-dominated sorting genetic algorithm (NSGA-II) with an elitism strategy. Ma et al. [7] applied the factor analysis method (FAM) to develop a correlation analysis model for the factors affecting throw blasting results and derived the calculation formulas for the limit charge coefficient and blast hole spacing. Huang et al. [8] developed calculation methods for the casting velocity and energy of debris in two blasting modes: spherical charge and cylindrical charge. An in-depth analysis was conducted on the impact of key factors such as borehole layout (burden) [9,10], borehole spacing [10], specific charge [11], delay time [12,13], and stripping work line length [14] on the throw effect, improving both throw blasting results and mining efficiency to optimize the throw blasting effect.
In addition, with the rapid advancement of computers, machine learning theory has been extensively applied to the study of throw blasting pile morphology prediction. For example, the BP neural network prediction model [15], the predictive model based on the combined application of the ELM neural network and the Weibull function [16], the predictive model integrating the genetic algorithm and extreme learning machine (GA-ELM) [17], the HHO-LSSVM predictive model based on the Gaussian distribution [18], and other methods [19] have been extensively researched and successfully implemented, thereby ensuring the reliability and accuracy of throw blasting parameter design.
However, the charge structure is key in adjusting the explosive energy distribution and controlling the blasting outcomes [20,21]. Optimizing the radial or axial decoupled charge structure is essential for improving the blasting effect and controlling blasting hazards by controlling the explosive distribution density in the borehole and changing the filling or spacing media [22,23]. For radial decoupled charge blasting, the borehole wall’s stress intensity and damage characteristics are primarily related to the gap size between the borehole and the explosive (decoupling coefficient) and the decoupling medium [24,25]. For example, Chen et al. [26], X. Li et al. [27], and Chi et al. [28] compared the blasting effects of decoupled charge structures to air, water, sand, and clay as coupling media through theoretical, numerical, and experimental analyses. The results indicated that decoupled charge blasting with water as the filling medium has higher energy transfer efficiency, contributing to better blasting effects. In addition, Yuan et al. [29] further explored the attenuation pattern of explosive stress along the radial direction under different coupling coefficients of water medium in charge structures. The results showed that as the decoupling coefficient of water in the charge increases, the peak value of explosive stress along the radial direction first decreases and then increases, and the distribution range of the crack network is closely related to the attenuation of blasting stress.
During the axial decoupling charge blasting process, the distribution of explosive stress on the borehole wall and the fractal damage and crack propagation (characteristics of rock fragmentation) within the rock mass are primarily influenced by the coupling medium, spacing length, and spacing position [30,31]. For instance, Liu et al. [30] analyzed the distribution pattern of explosive stress on the borehole wall in water medium interval charge structures. Similarly, Lou et al. [32,33] derived a force calculation formula for the initial shock pressure in boreholes with air interval charge structures and elaborated on the pressure distribution characteristics of such structures. Li et al. [34] formulated a calculation method for axial borehole stress attenuation based on rock debris filling and segmented charge structures, revealing the patterns of explosive stress attenuation in holes with various rock debris fillings and charge configurations. This study also described the influence of the detonation rate and interval pressure-holding length on the internal damage distribution in concrete specimens. Jang et al. [35], J. Liu, Gao, Zhang, and Xu [36], and S. Liu et al. [31] investigated the effects of different installation positions and lengths of water separation columns on the rock fragmentation characteristics of decoupled charge blasting, and explored the failure evolution patterns in rock blasting. Wu et al. [37] and Yin et al. [38] investigated the effect of the relative position of the interval on rock fragmentation during blasting. Their findings demonstrated that the interval position determines the propagation paths of stress waves and explosive gases, directing energy to extend in specific directions and enhancing the fracture penetration effect in the rock mass.
Currently, optimization methods and technologies for charging structures have been extensively implemented in open-pit blasting projects, effectively improving the distribution of blasting energy and significantly enhancing blasting performance. However, the existing research mainly focuses on optimizing charging structures in single rock layers, whereas research on optimizing charging structures for simultaneous blasting and stratified mining in multi-lithologic mining areas remains insufficient; in particular, there is a lack of systematic research on charging parameter optimization under simultaneous blasting conditions of different lithologies. This study initially optimizes the charge structure based on the different mechanical properties of coal and rock and investigates the effects of various charge structures on stress propagation and rock damage. It is essential to develop charge structures that minimize damage to the rock mass at the coal–rock interface to mitigate the mixing phenomenon near the coal–rock interface post-blasting. Therefore, the mixed blasting technology, which combines upper rock layer casting with lower coal seam loosening, is achieved. These findings provide new approaches for optimizing the design of decoupling charge structures and serve as technical references for reducing costs and enhancing efficiency in extracting thin coal seams in open-pit coal mining.

2. Site Overview

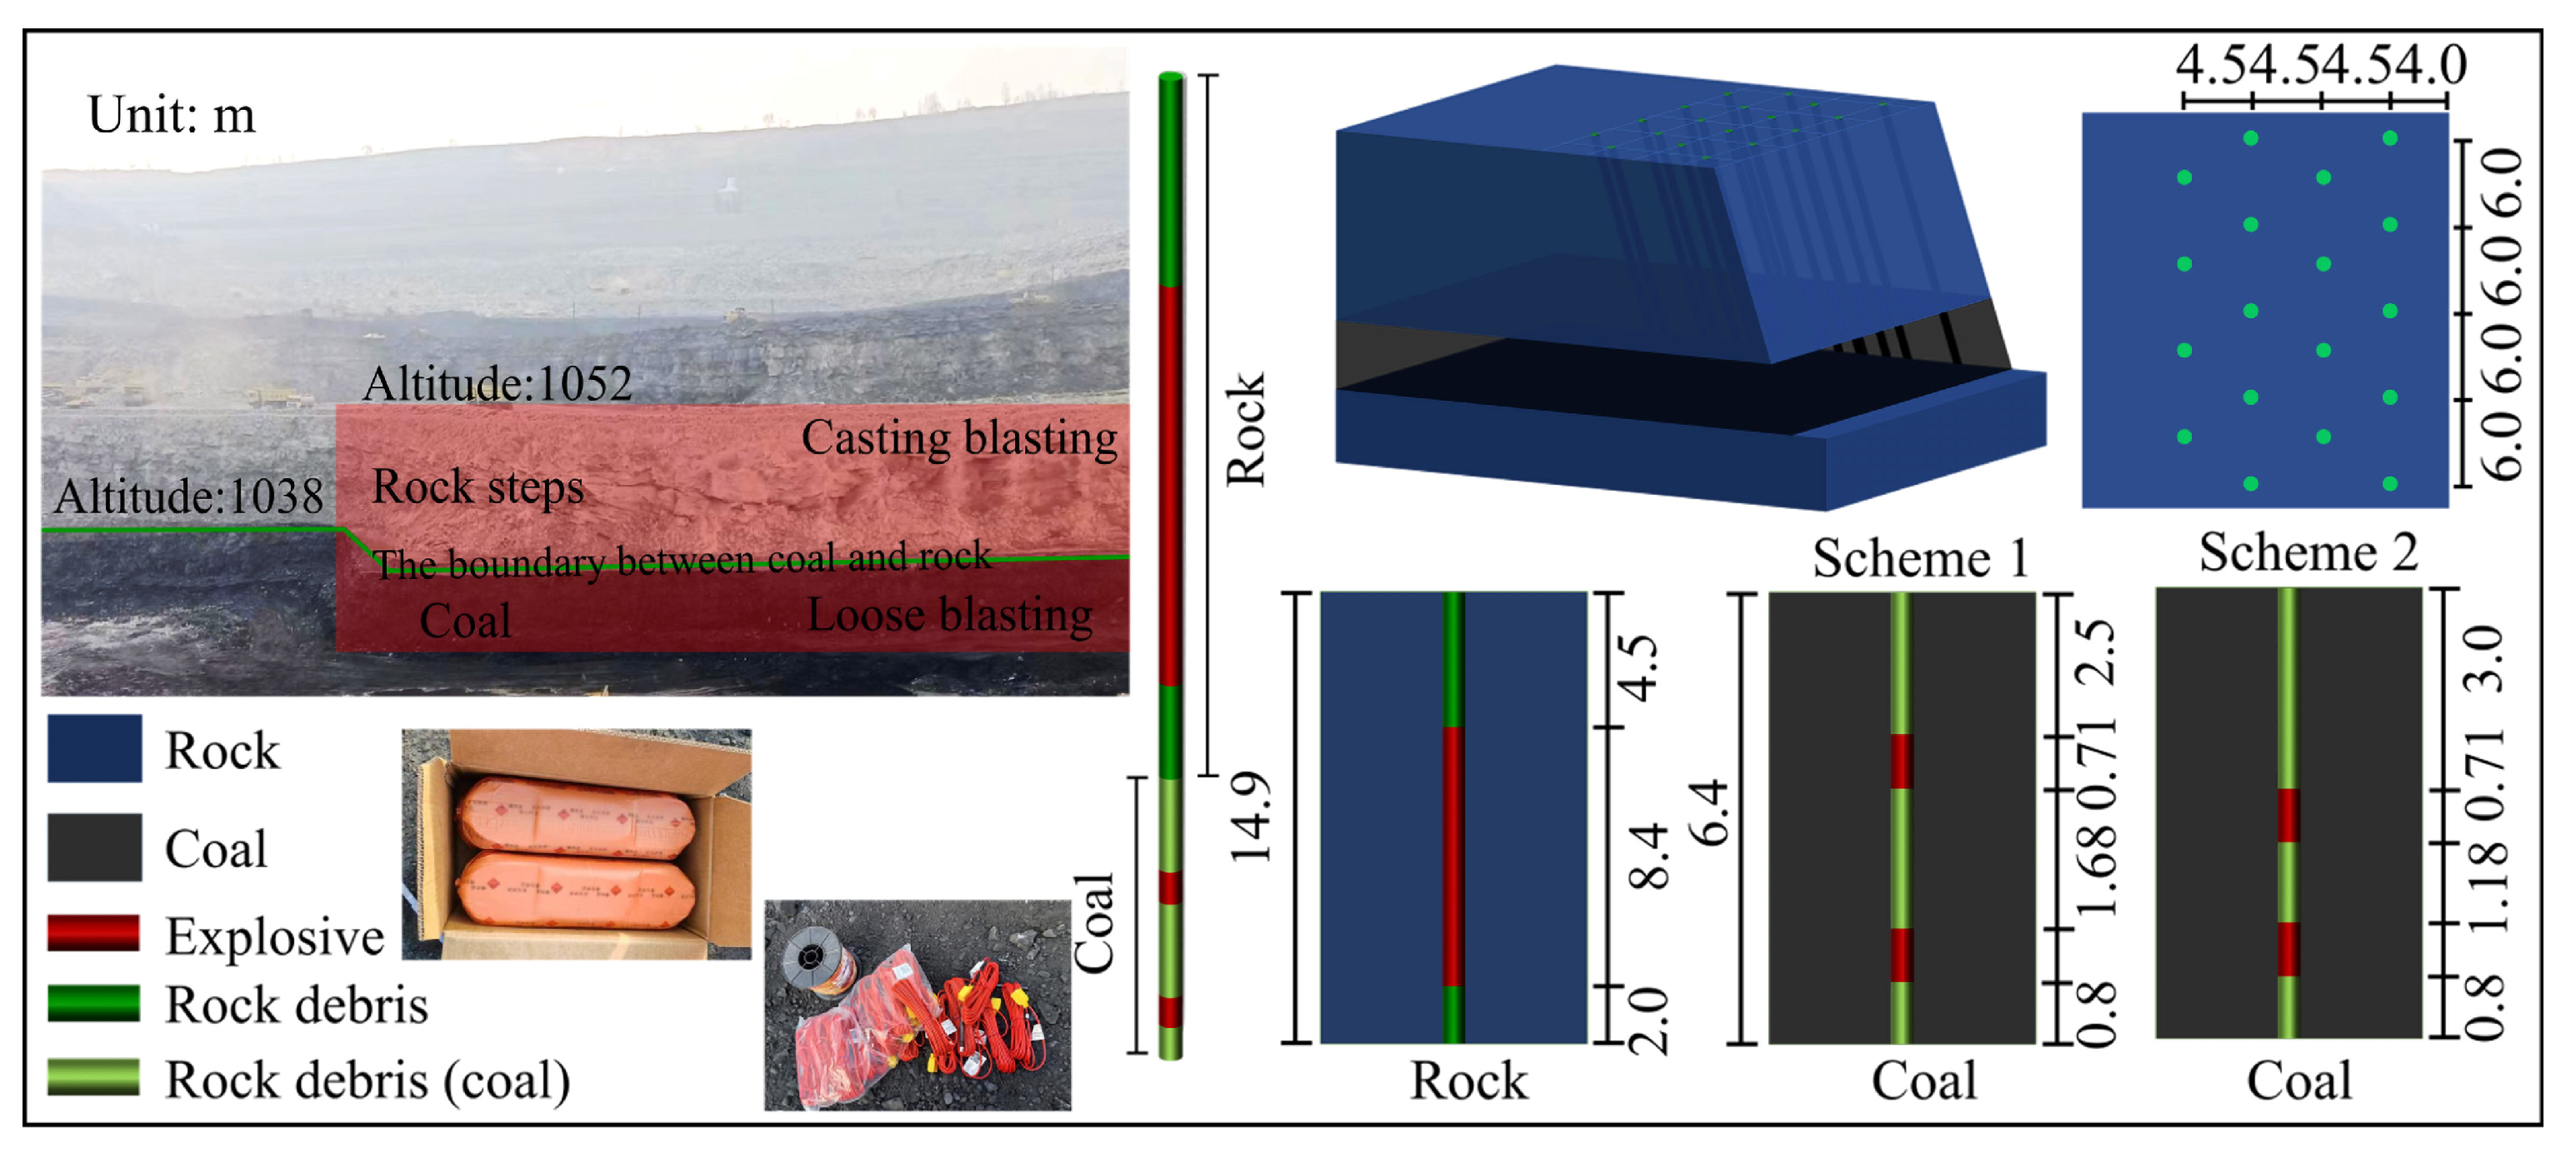
The Wujiata open-pit coal mine is located in Ordos, China. The primary rock types in the mining area are sandstone and mudstone, which are classified as semi-hard to hard rocks. The exploitable coal seams include #1, #2, and #3, with the primary mining seams being #2 and #3. The #1 seam is partially exploitable. The occurrence conditions of the coal seams, along with their roof and floor, are presented in Table 1. The primary mining method in the open-pit mine currently involves blasting stripping, where the stripping benches are divided horizontally, and coal is mined by separately dividing the benches for whole-layer extraction. The current mining situation is depicted in Figure 1. During the blasting operation, the #1 coal seam was blasted and stripped along with the overlying rock layers and discarded, resulting in the failure to recover coal resources and causing significant resource waste. The research aims to achieve mixed blasting and separate mining, reduce production costs, and improve resource recovery rates and production efficiency to achieve the “mixed blasting but not explosion mixed” technique under high-bench coal–rock mixed blasting, where the coal seam is loosened after blasting, and the overlying rock layers are thrown after blasting. Therefore, research on coal–rock mixed blasting and separate mining technology will be conducted for the #3 coal seam and the overlying rock layers, focusing on optimizing blasting parameters and charge structure to establish a technical foundation for recovering the #1 coal seam.

3. Single-Hole Column Charge Blasting Crater Test for Coal and Rock

The blasting crater test is a critical approach to studying rock fragmentation mechanisms and enhancing the scientific basis of blasting technology. It is also an effective method for qualitative and quantitative analyses of the blasting crater. This test is instrumental in optimizing blasting parameters and evaluating the compatibility between various explosives and rocks. Field blasting crater tests were conducted, considering different explosive masses and borehole depths in the coal seams and overlying rock layers. Based on Livingston’s theory, qualitative and quantitative parametric analyses, such as specific explosive consumption and rock strain energy coefficient, were performed by examining the shape of the blasting crater and the mass of rock fragmentation. These analyses provide a foundation for parameter selection in numerical simulations and blasting tests for coal–rock mixed blasting.

3.1. Blasting Crater Test Plan and Parameter Design

This blasting crater test was conducted in the northern section of the #3 coal bench (1038 m) and the overlying sandstone bench (1054 m) at the Wujiata open-pit coal mine. The test borehole arrangement for each bench consisted of 4 rows of boreholes, 6 holes per row, totaling 24 holes. The distance between holes was 5 m, and the row spacing was 7 m. The borehole diameter was 70 mm, and the borehole depths for each row were 1.0, 1.2, 1.4, and 1.6 m, respectively. The charge structure and priming circuit are illustrated in Figure 2.
The explosive masses used in the coal bench blasting tests were 0.6, 0.8, 1.0, 1.2, 1.4, and 1.6 kg, labeled as C1 to C6. The explosive charges for the overlying rock bench blasting tests were 1.6, 1.8, 2.0, 2.2, 2.4, and 2.6 kg, labeled as R1 to R6. The explosive cartridge diameter was 70 mm, and the charge length was l E . For each bench, explosives were sequentially loaded into each borehole in each row based on the designed charge quantity. After loading, rock powder was utilized to seal the boreholes, with the sealing height noted as l S . The priming circuit was designed with a 200 ms delay between boreholes and a 1000 ms delay between rows, employing bottom initiation. The parameters of the blasting crater test are listed in Table 2.
The operational process of the field blast crater test is shown in Figure 3.

3.2. Analysis of Blast Crater Test Results

3.2.1. Measurement and Statistics of the Blast Crater Volume

After the blast, the boundaries of the blast crater are defined, debris inside the crater is cleared, and the crater diameter is measured from different directions (spaced 45° apart), along with depth measurements of the crater.
The results of the statistics are presented in Table 3. Due to the excessive burial depth of explosives in some test holes and the significant confinement effect of the rock, it led to the irregular shape of the crater’s bottom, resulting in significant errors in the volume statistics. Therefore, the parabolic method was employed to measure and calculate the statistical volume of each blasting crater. The method is as follows: a plane perpendicular to the borehole axis and aligned with the height of the fractured uplift at the crater perimeter is used as the reference plane. The blasting crater cross-section is divided into a 200 × 200 mm grid, and the distance “ Y ” from each point on the blasting crater’s contour to the reference plane is measured, representing the blasting fracture depth at each measurement point. The cross-sectional area is then calculated using Formula (1).
S i = B 3 Y 1 + Y m + 2 Y 2 + Y 4 + + Y 2 j + + 4 Y 1 + Y 3 + + Y 2 j + 1 +
where S i is the area of the i-th section, i = 1, 2, 3, …, m2; B is the distance between measurement points, B = 0.2 m; Y j is the blasting depth at the j-th point, j = 1, 2, 3, …, m.
Then, based on the area of each section, the statistical volume V (m3) of the blasting crater is calculated using the frustum formula, as shown below:
V = B 3 S 1 + S n + 2 S 1 + S 2 + S i + + i = 1 n S i S i 1 1 / 2
The statistical results of the coal and rock blasting crater parameters are listed in Table 3.

3.2.2. Analysis of Blasting Crater Test Outcomes

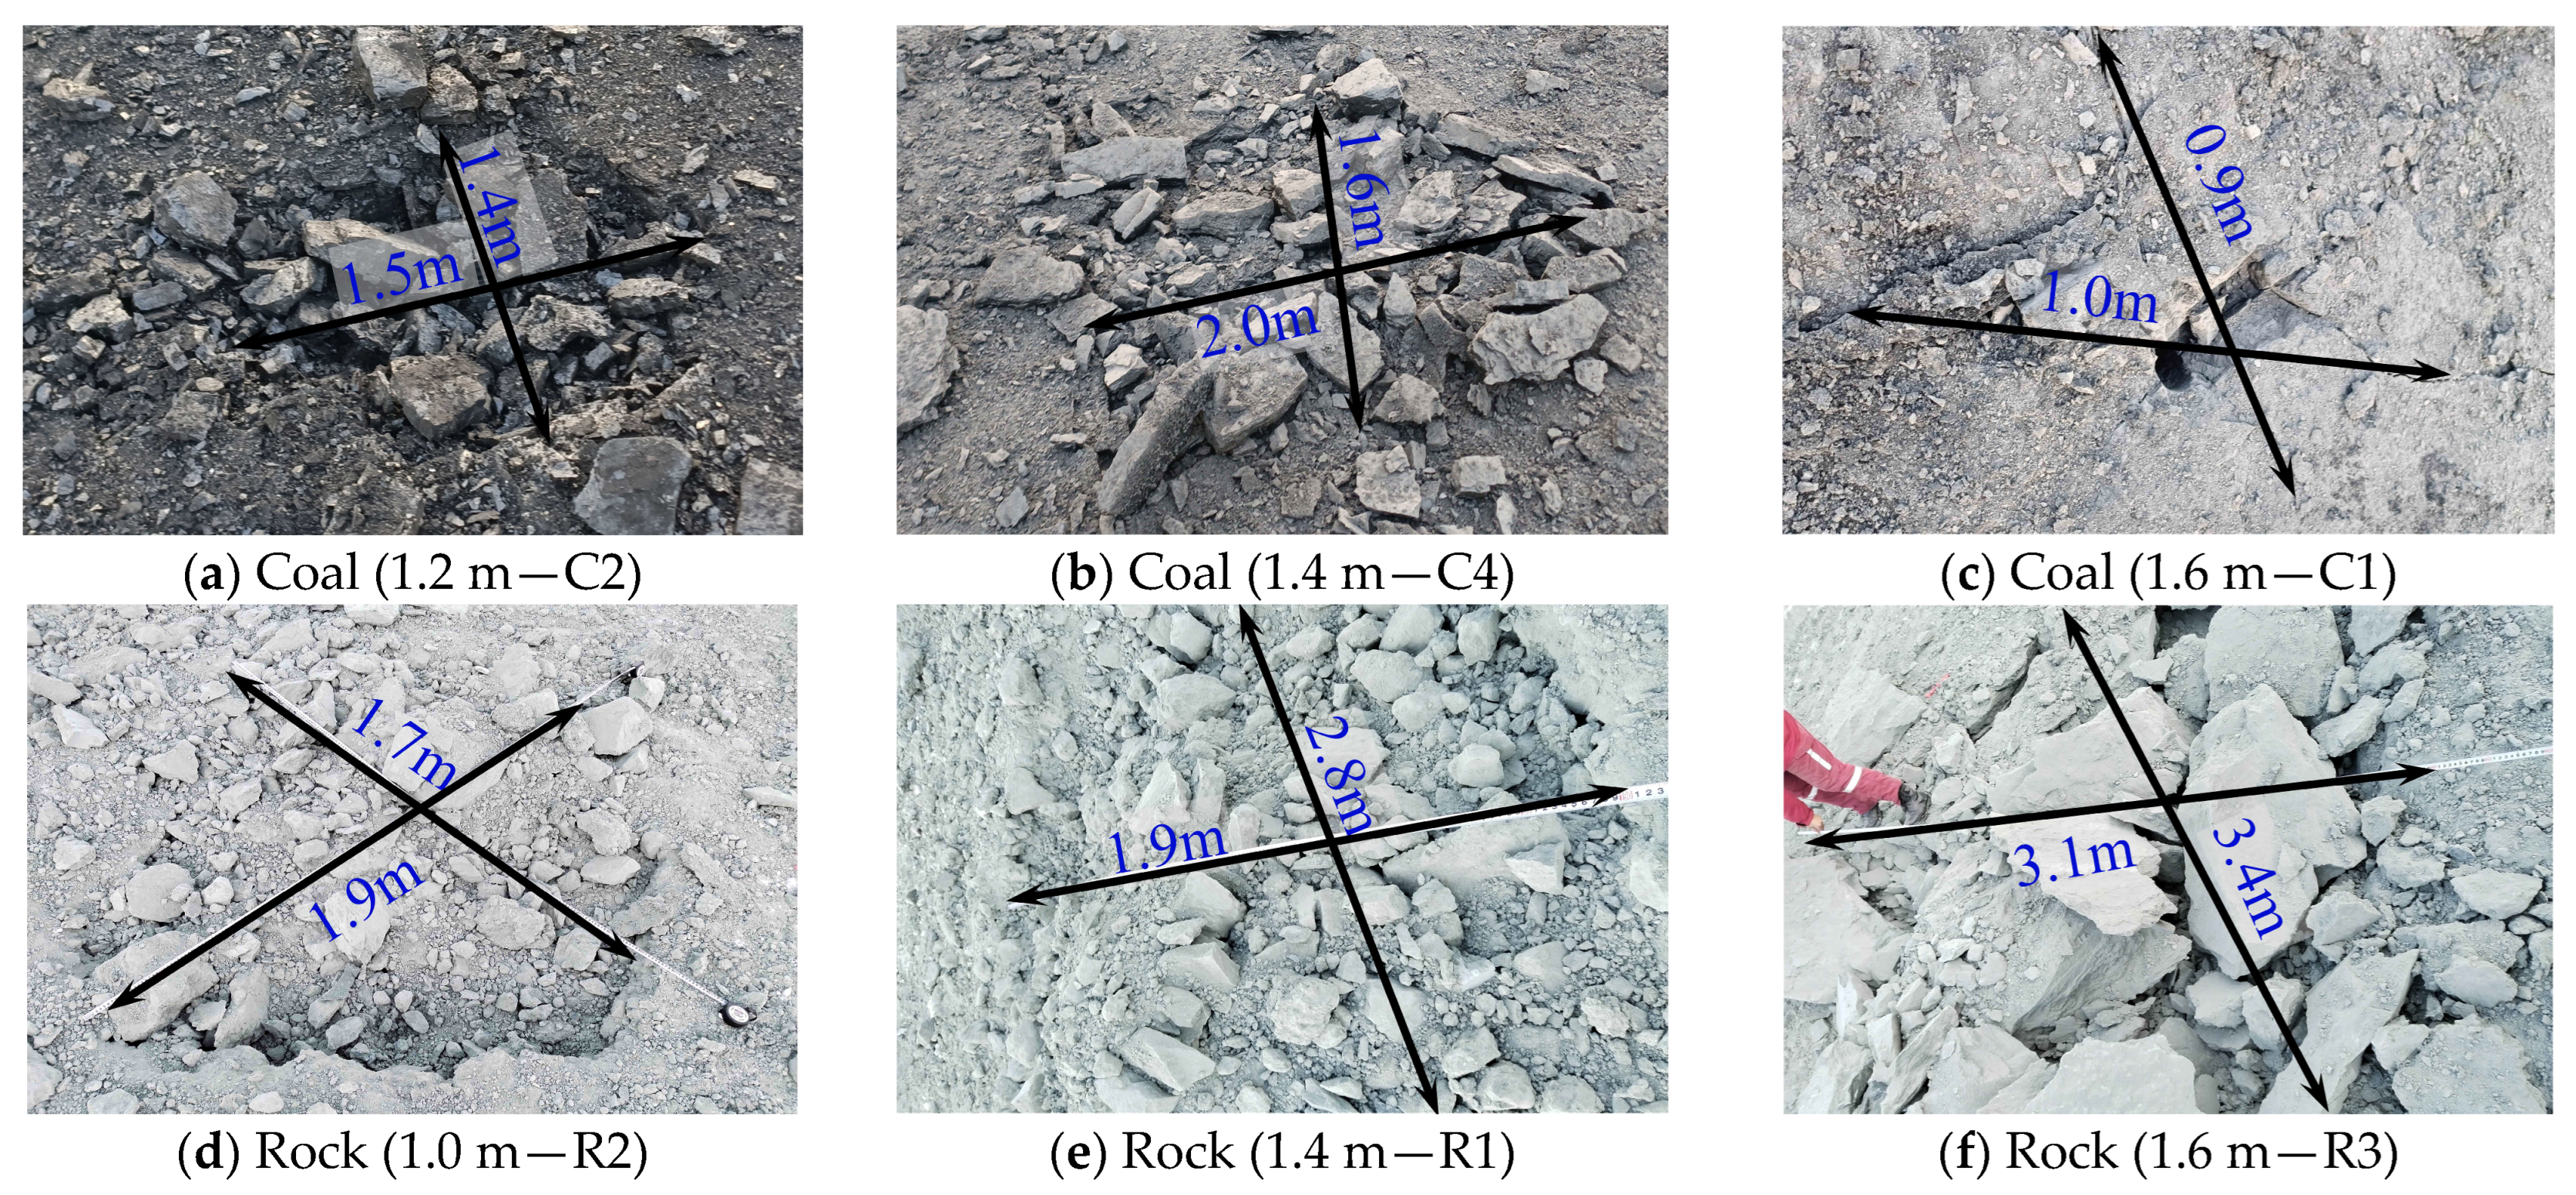
After the blast, the boundaries of the blast crater are defined, debris inside the crater is cleared, and the crater diameter is measured from different directions (spaced 45° apart), along with depth measurements of the crater. The typical fragmentation morphology of the coal and rock blast crater test results (partial) is illustrated in Figure 4.
(1)
Analysis of Blast Fragmentation Morphology
The fragmentation morphology analysis of the coal bench blasting crater test results indicates that under the same borehole depth, an increase in the charge amount led to a gradual increase in the blast crater’s fragmentation volume and a reduction in fragment size. As the borehole depth increased, the cast volume gradually decreased. No blast crater was formed when the borehole depth was 1.4 m with charge C1 and 1.6 m with charges C1 and C2. In the rock bench blasting test, blast craters were formed in all cases, and the fragmentation behavior was similar to that of the coal bench.
In addition, the test results for coal and rock benches demonstrated that as the explosive mass increased, the large block rate of coal and rock blasting fragmentation improved effectively. With increasing borehole depth, the casting rate of blasting-fragmented coal and rock was controlled, and the large block rate was further optimized. However, as the borehole depth increased further, the upper rock mass of the borehole exhibited a higher large block rate, while the internal rock fragments became smaller. This indicated that with an increase in filling depth, more explosive energy acted on the internal rock, significantly increasing the upper rock mass’s large block rate and enhancing the internal rock’s crushing rate, adversely affecting the uniformity of the rock’s fragmentation.
(2)
Analysis of Geometric Parameters of Blast Craters by Cartridges with Different Length-to-Diameter Ratios
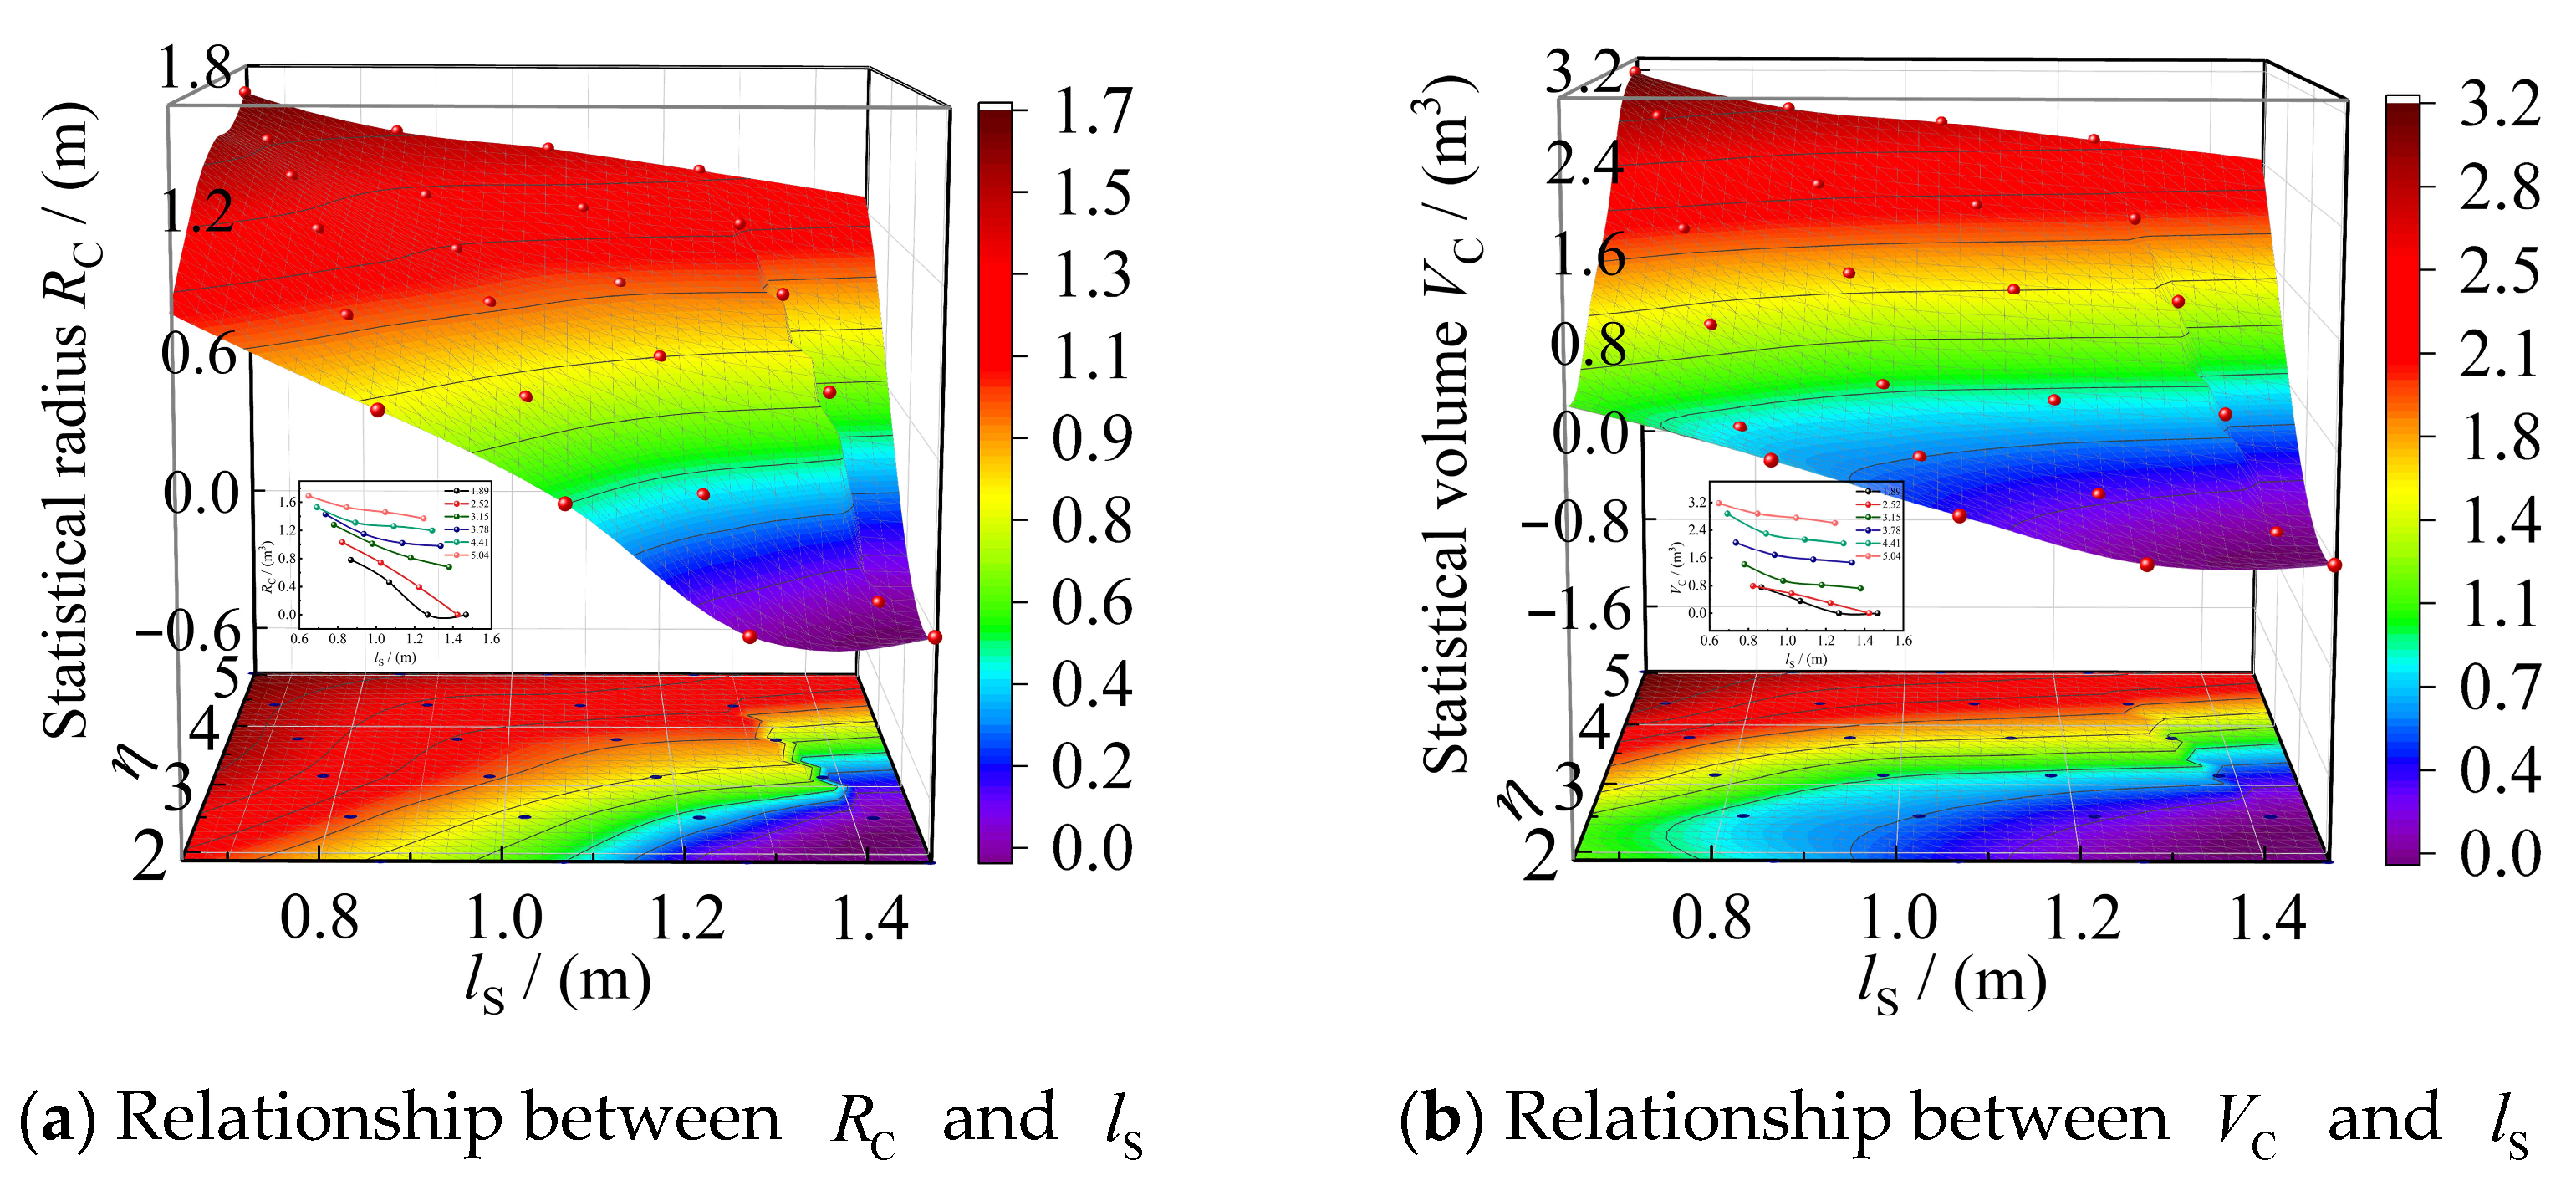
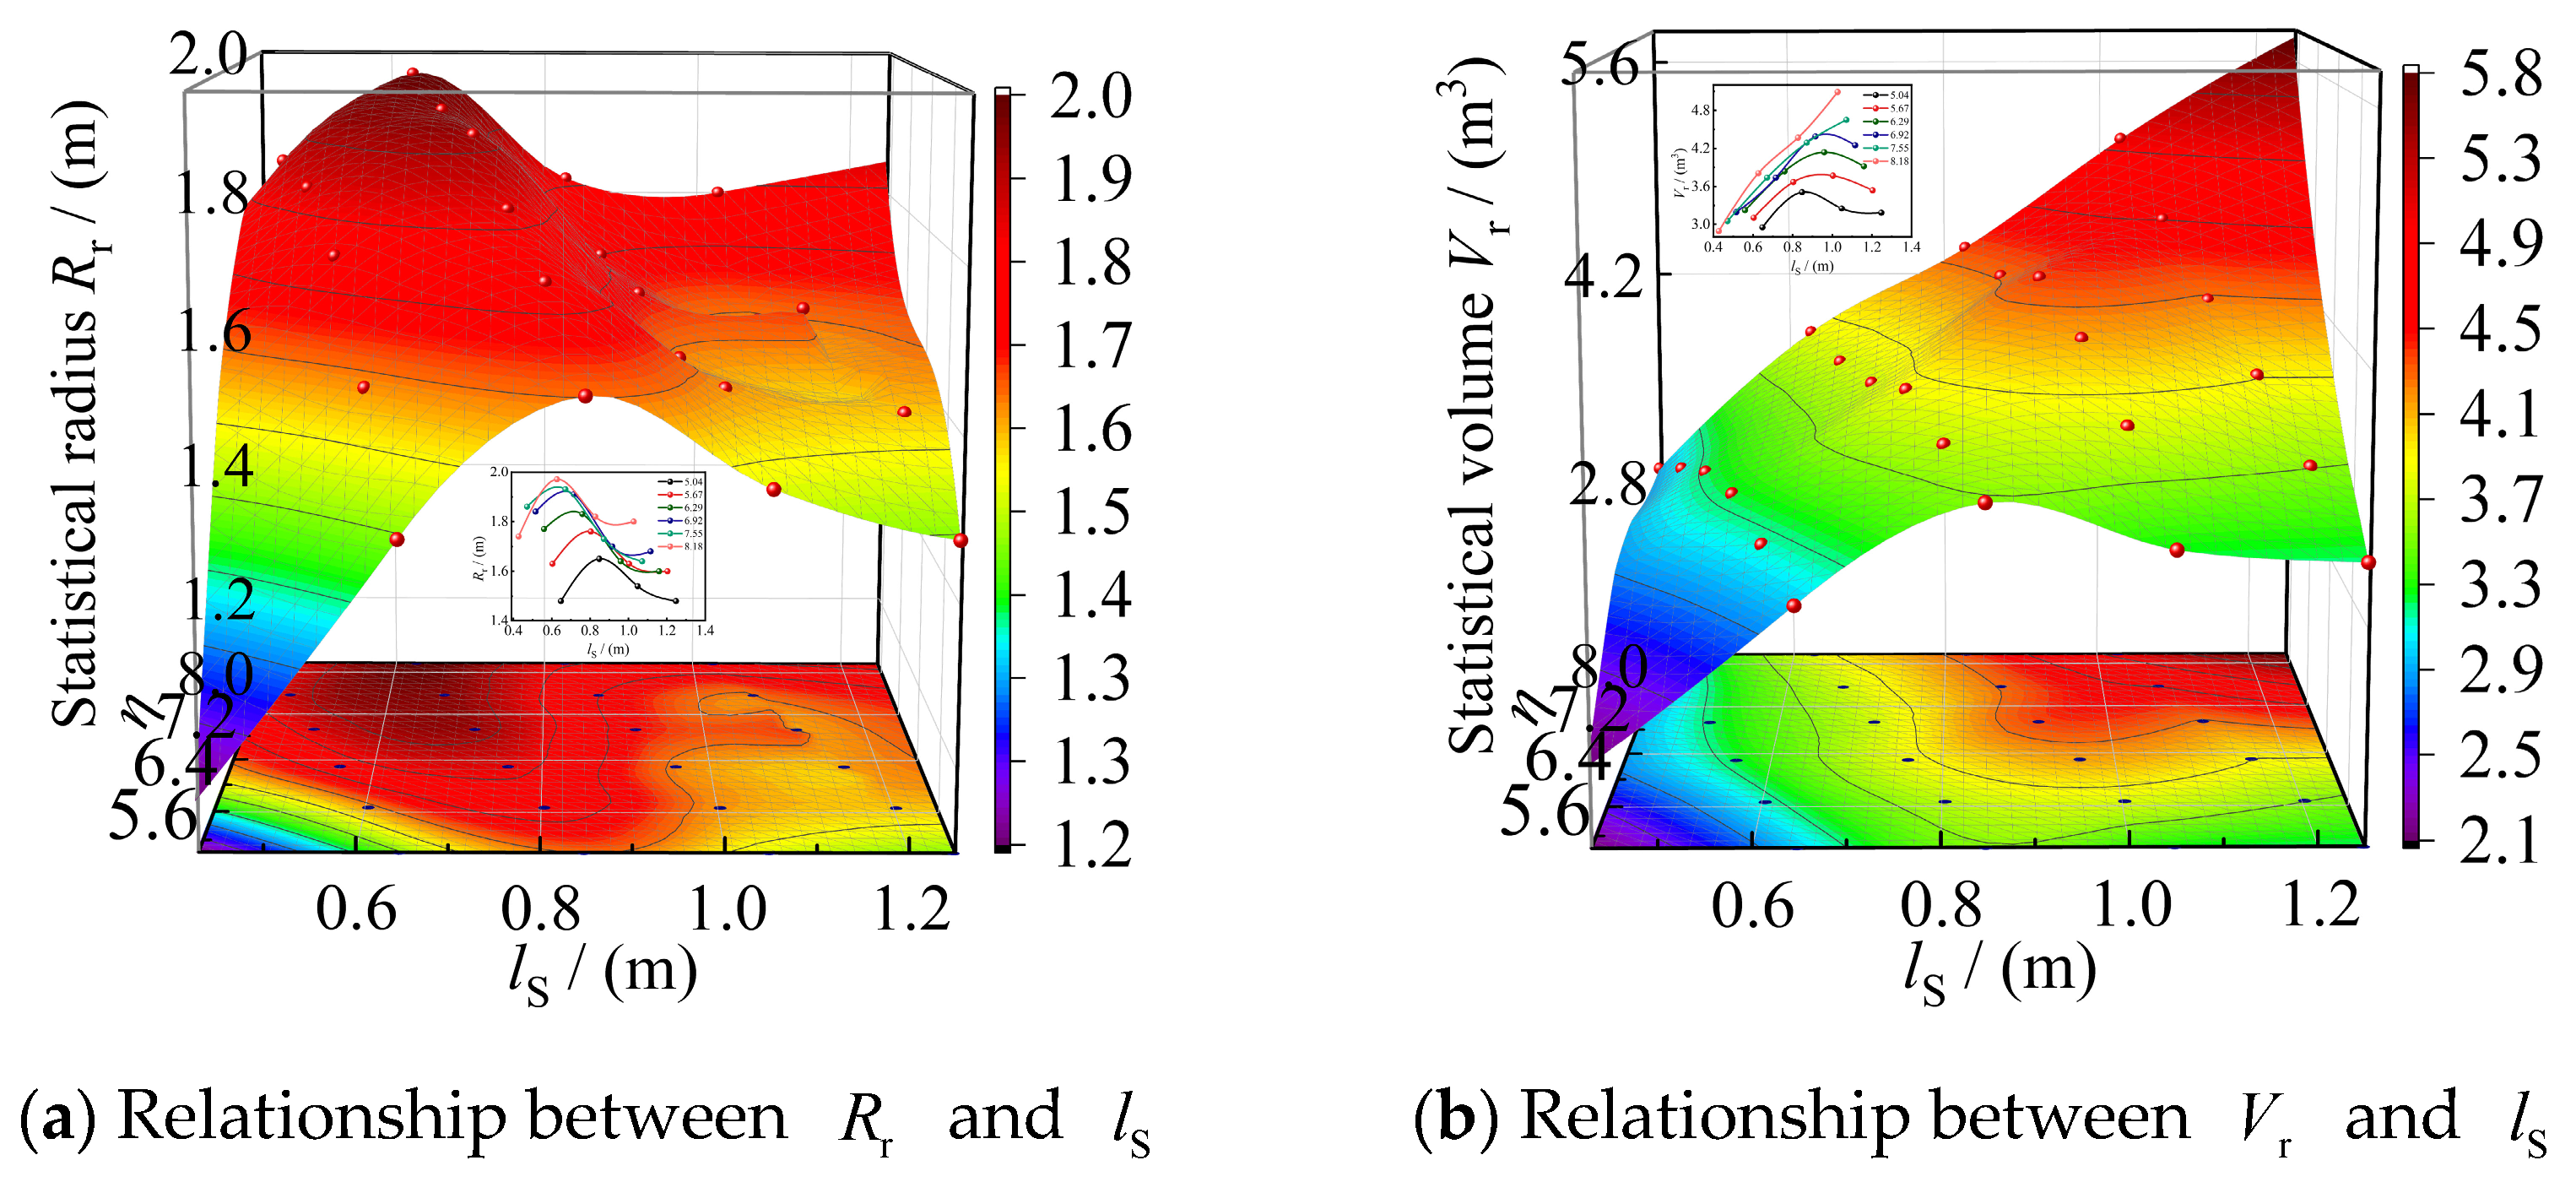
The statistical results in Table 3 were utilized to analyze the geometric parameters of the blast craters formed under six different length-to-diameter ratio η charge conditions for coal and rock. The relationships between crater statistical radius R and crater volume statistical radius V and fill height l S are illustrated in Figure 5 and Figure 6.
Figure 5 illustrates the statistical analysis results of the geometric parameters of the blasting crater in coal benches under various length-to-diameter ratios. The results demonstrate that as the stemming length increases, the blasting crater’s statistical radius and volume decrease. In addition, when the length-to-diameter ratio of the explosive cartridge is less than 4 (approximately equivalent to a spherical charge), the decrease in the radius and volume of the blasting crater is more pronounced than in craters with length-to-diameter ratios of 4.6 and 5.1. This analysis highlights the significance of selecting an appropriate charge length-to-diameter ratio and stemming to control the fragmentation range in coal blasting.
The statistical analysis results of the geometric parameters of the sandstone bench blasting crater, presented in Figure 6, show a non-linear relationship between the stemming length and the radius and volume of the crater. As the stemming length increases, the rock crater’s statistical radius and volume exhibit an overall trend of first increasing and then decreasing. A larger length-to-diameter ratio of the explosive corresponds to a greater average crater radius, with the peak radius gradually increasing within the stemming length range of 0.6 to 0.9 m. Similarly, the blasting crater’s volume gradually increases as the explosive’s length-to-diameter ratio rises. For a length-to-diameter ratio of 5.1 to 7.1, the crater volume reaches its peak within the stemming length range of 0.8 to 1.0 m, whereas for ratios exceeding 7.1, the crater volume continues to grow after the stemming length surpasses 1.0 m. These test results align with Livingston’s theory.

3.2.3. Blasting Crater Throwing and Crushing Energy Distribution and Parameter Analysis

A non-linear relationship analysis was conducted between the charge burial depth ratio K b and the crater volume under various burial depths to determine the optimal charge burial depth and the corresponding specific explosive consumption for coal and rock benches. In addition, the energy distribution law of charge burial depth and rock fragmentation was explored.
Based on the blasting crater theory [39], the following are the calculation formulas for the critical explosive burial depth L e (m), the optimal burial depth L j (m), and the rock strain energy coefficient E b :
L e = E b Q 3
L j = Δ j E b Q 3
where Q is the charge mass, kg; Δ j is the best depth ratio, Δ j = L j / ( E b Q 3 ) , and E b = L e / Q 3 .
Based on similarity criteria, the main influencing factors of the blasting crater fragmentation volume V are the charge amount Q and depth W , i.e.,
V = f Q , W
The relationship between the charge amount Q , depth W , and blast crater fragmentation volume V is simplified to more clearly describe the non-linear relationship between the charge proportion depth E b and the crater volume of coal and rock under different burial depths as follows:
Y = f ( X )
where Y is the unit explosive rock breaking volume, Y = V / Q , m; X is the charge proportion depth, X = W / Q 1 / 3 , m/kg−3; W is the charge depth, m, W = L 1 + L 0 / 2 ; L 1 is the stemming length, m; L 0 is the charge length, m.
Based on the statistical results of the coal and rock blast crater tests in Table 3 and subsequent supplementary rock step blasting test data, a non-linear fitting analysis of the charge proportion depth ( W / Q 1 / 3 ) and unit explosive rock-breaking volume ( V / Q ) was performed using Equation (6). The characteristic curves of the coal and rock bench blast craters are depicted in Figure 7.
The fitting formula for the coal bench blast crater can be obtained from the characteristic curve: Y = 5.07 X 3 25.79 X 2 + 34.24 X 8.14 . The fitting formula for the characteristic curve of the rock bench blasting crater is Y = 21.88 X 3 63.42 X 2 + 57.62 X 13.55 . In addition, based on the fitting curve, the charge depth ratios for coal and rock benches during blasting are 0.91 and 0.74, respectively, where the corresponding volume ratios are maximized. This indicates that these values are the optimal charge depth ratios for coal and rock, which will yield the best rock-breaking effect. The fitting results show that when the charge depth ratio is less than optimal, the volume ratio increases with the charge depth. However, the volume ratio decreases rapidly when it exceeds the optimal charge depth ratio. This indicates that a reasonable charge amount and depth significantly impact the blasting effect.
Based on the extrema and zero points of the curve, the strain energy coefficient E b for #3 coal–rock is 1.74, the optimal depth ratio is 0.91/1.74 = 0.523, and the maximum rock-breaking volume per charge is 5.47 m3, with a corresponding fragmentation-specific consumption of 0.18 kg/m3. For the overlying rock layer (sandstone) of #3 coal, the strain energy coefficient is 2.60, the optimal depth ratio is 0.74/2.60 = 0.285, and the maximum rock-breaking volume per charge is 3.16 m3, with a corresponding fragmentation-specific consumption of 0.32 kg/m3. In addition, based on the on-site cast blasting parameters, the specific charge for rocks is 0.57 kg/m3. The coal seam loosening blasting charge is 0.18 kg/m3, using the fragmentation-specific charge and optimal depth ratio obtained from the coal–rock blasting crater tests. The stemming length for rock benches is calculated as 4.369 m, while the stemming length for coal benches is determined as 2.99 m by applying Equation (4) and the unit charge amount.

4. Numerical Simulation

4.1. Numerical Analysis of Charge Structure

During the coal–rock mixed blasting process, to prevent explosive mixing caused by excessive fragmentation at the top of the coal bench and the bottom of the rock mass after detonation, specific length intervals must be set at the top of the borehole in the coal bench and the bottom of the borehole in the rock bench. This approach ensures that the preset fragmentation requirements for coal and rock are met on-site, achieving the objective of separate mining. Numerical simulations were conducted to analyze the rock mass damage and cast blasting effects near the coal–rock interface under different stemming lengths of boreholes by optimizing the charge structure parameters based on on-site conditions. Reasonable charge structure parameters for coal–rock mixed blasting and separate mining are selected.

4.1.1. Numerical Model

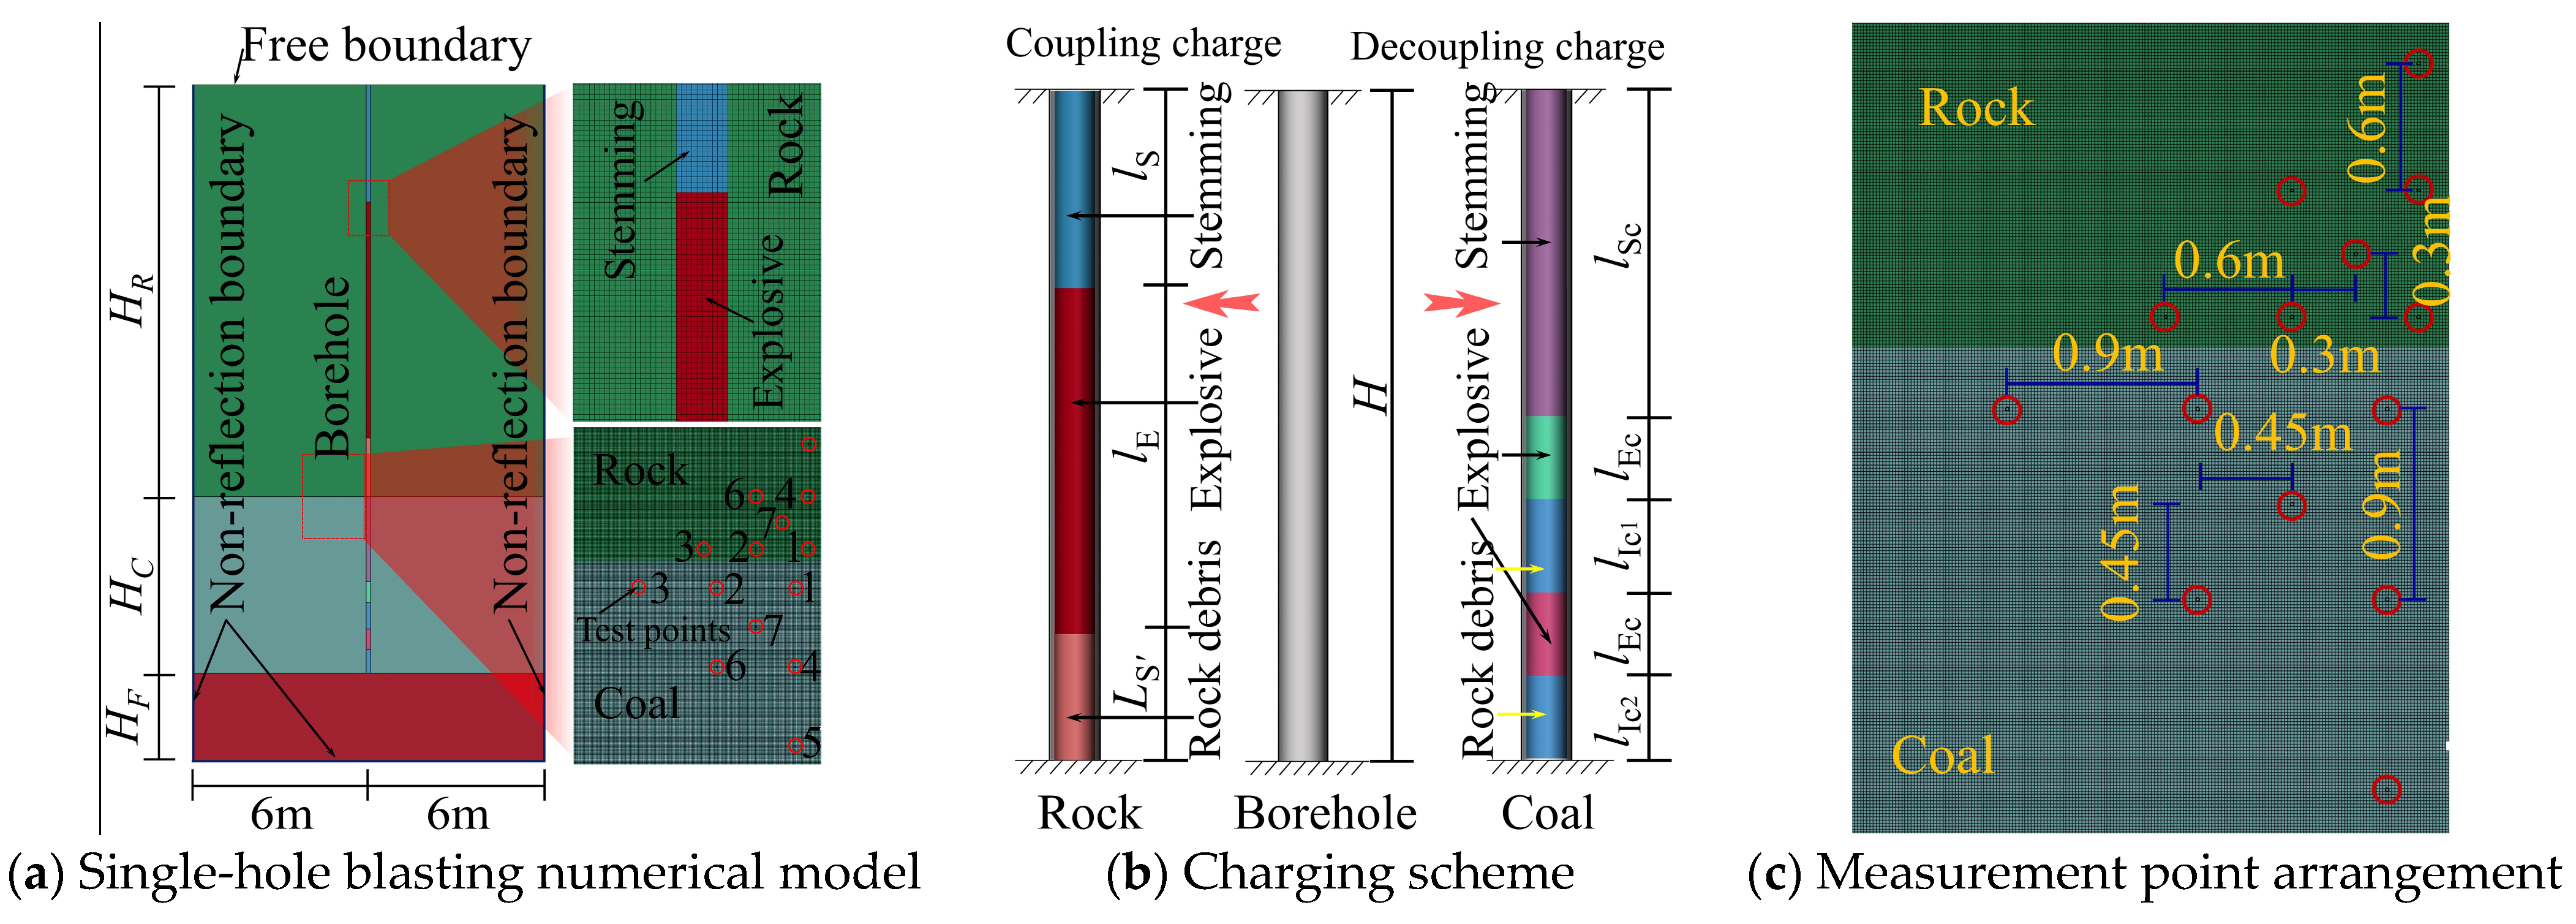
A quasi-three-dimensional finite element model for coal–rock mixed blasting under different stemming lengths of boreholes was developed using the dynamic analysis software Ansys/Ls-dyna (2022) to assess the rationality of the charge structure. Charge structure optimization analysis was performed. The blasting parameters of the numerical model are listed in Table 4. For the model, an axial uncoupled charge is applied for loosening blasting in the coal seam location, and a coupled charge is used for cast blasting in the overlying rock location. The numerical calculation model is shown in Figure 8.
Non-reflective boundary conditions are applied to the bottom and lateral surfaces of the model to minimize the impact of stress wave reflection at the model boundaries on the calculation results. Gravitational acceleration is applied in the vertical direction, and a fixed-end constraint is imposed at the model’s bottom. The ALE algorithm is employed between coal, rock, and explosives to avoid mesh distortion in the Lagrangian grid during large deformation analysis, which can lead to computational inaccuracy.

4.1.2. Numerical Model Parameters

(1)
Constitutive Models and Parameters of Coal and Rock
The *MAT_RHT constitutive model is a tensile-compressive damage model based on the modified HJC model, which accounts for the effects of confining pressure, strain rate, strain hardening, and damage softening on the failure strength of rock materials under blasting and dynamic loading. This model is utilized to simulate the damage of brittle materials and is widely applied to the tensile and compressive damage evolution of brittle materials such as concrete and rock under dynamic loads. The detailed mathematical formulation is presented in references [40,41].
The primary model parameters for coal and sandstone are listed in Table 5. Among these, some RHT parameters, such as density ρ 0 , compressive strength f c , tensile strength f t , and elastic shear modulus G , are derived from the mechanical parameters of coal and rock.
Then, in the RHT model, the relationship between strain rate parameters and strength is given by Equation (7) [41].
F rate ( ε ˙ p ) = ( ε ˙ p / ε ˙ 0 c ) β c P f c / 3 P + f t / 3 f c / 3 + f t / 3 ( ε ˙ p ε ˙ 0 c ) β c P f c / 3 f c / 3 + f t / 3 ( ε ˙ p ε ˙ 0 c ) β t f t 3 < P < f c 3 ( ε ˙ p / ε ˙ 0 t ) β t P f t / 3
where F rate ( ε ˙ p ) is the increase factor for the strain rate; ε ˙ p is the strain rate under load P ; P is the pressure, MPa; β c and β t are the compressive and tensile strain rate dependence exponents, respectively, β c = 4 / ( 20 + 3 f c ) and β t = 2 / ( 20 + f c ) ; ε ˙ 0 c and ε ˙ 0 t are the reference strain rates under compression and tension, respectively; ε ˙ 0 c = 3.0 × 10 5 s - 1 and ε ˙ 0 t = 3.0 × 10 6 s - 1 ; ε ˙ c and ε ˙ t are the failure strain rates under compression and tension, respectively. Their values are ε ˙ c = ε ˙ t = 3.0 × 10 25 s - 1 .
Next, in the RHT model, the equation of state for the P-α compaction of the rock mass is given as follows [41,42]:
P R = 1 α 0 ( ( B 0 + B 1 μ ) α 0 ρ e + A 1 μ + A 2 μ 2 + A 3 μ 3 )
where P R is the pressure for the equation of state, GPa; α 0 is the initial porosity; e is the internal energy per unit mass; μ is the volumetric strain; the parameters for the polynomial EOS are determined by B 0 = B 1 = 2 s 1 , T 1 = ρ c 0 2 , and T 2 = 0 ; s is the empirical constant of the material; c 0 is the sound speed at ambient pressure and temperature, m/s; the Hugoniot polynomial coefficients are determined by A 1 = ρ c 0 2 , A 2 = ρ c 0 2 ( 2 s 1 ) , and A 3 = ρ c 0 2 ( 3 s 2 4 s + 1 ) ; finally, the crush pressure is denoted by P crush = 2 f c / 3 .
The damage variable D in the RHT model is defined as the accumulation of plastic strain ε P .
D = d ε P ε P f
ε P f = D 1 [ P 0 ( 1 D ) P t * ] D 2 P 0 * ( 1 D ) P t * + ( ε P m / D 1 ) D 2 ε P m   P 0 * < ( 1 D ) P t * + ( ε P m / D 1 ) D 2
where ε P f is the plastic strain at failure; ε P m is the minimum damaged residual strain; P t * is the failure cutoff pressure; D 1 and D 2 are the damage constants, with values of 0.04 and 1.0, respectively.
Based on the basic physical and mechanical properties of coal and rock, combined with theoretical calculations and derivations, parameters ρ 0 , f c , G , β c , β t , ε ˙ 0 c , ε ˙ 0 t , ε ˙ c , ε ˙ t , α 0 , B 0 , B 2 , T 1 , T 2 , A 1 , A 2 , A 3 , P crush , D 1 , and D 2 can be determined, totaling 20 parameters.
The remaining 14 parameters are obtained based on mechanical test results and using calculation methods from the literature [42,43]. For instance, for the determination of failure surface parameters, when 3 P * σ f * , the failure surface is expressed as [41]
σ f * ( P * , F rate ) = A ( P * F rate / 3 + ( A / F rate ) 1 / N ) N 3 P * F rate
where σ f * is the normalized strength, σ f * = σ f / f c , σ f = σ 1 σ 3 ; σ 1 ( σ 3 ) is the first (third) principal stress, MPa; P 0 * is the normalized pressures, P 0 * = P / f c ; A and N are failure surface parameters, which are determined through triaxial compression tests.
The ratio of the radii of the tensile and compressive meridians is given by [43].
Q = Q ( P * ) = Q 0 + B P *
where Q 0 and B are lode angle dependence factors.
The relative tensile (shear) strength F t * ( F s * ) , compressive yield surface parameter G c * , tensile yield surface parameter G t * , shear modulus reduction factor ξ , shear modulus reduction factor ε P m , residual surface parameter (index number) A f ( N f ) , compaction pressure P CO , porosity exponent N P , and other parameters not explicitly defined or calculated are summarized using relevant parameters from concrete [40,44].
(2)
Explosive Model and State Equation
The *MAT_HIGH_EXPLOSIVE_BURN material model was selected for the explosives, and the *EOS_JWL equation of state was utilized to describe the relationship between the relative volume V and the specific initial internal energy E 0 under the pressure of the detonation products. The explosive parameters were determined primarily based on the actual performance parameters of the explosives in use at the site [45].
P e = A 1 ω R 1 V e - R 1 V + B 1 ω R 2 V e R 2 V + ω E 0 V 0
where P e is the explosive pressure, GPa; V 0 is the initial relative volume; R 1 , R 2 , and ω are the state constants of the equation; E 0 is the initial internal energy, J/m3; A and B are the material constants.
The material parameters and equation of state parameters are listed in Table 6.
The parameters for the air materials and the stemming material in this paper are as given by [46].

4.1.3. Numerical Results

Numerical simulation analysis was conducted on the damage evolution process and dynamic damage characteristics of coal and rock bench blasting under different interval lengths of borehole charges to effectively control the damaging effect of bench blasting on coal seams. The damage evolution process of coal–rock mixed blasting under different charge structures is depicted in Figure 9.
Figure 9 illustrates the damage evolution of coal–rock mixed blasting under varying filling lengths. Under the intense effect of explosive detonation pressure, the cavity volume around the borehole increases, forming a compressive damage zone. As the propagation distance increases, the tangential tensile stress caused by radial compression leads to tensile failure in the rock mass, forming a fracture zone. Transmission and reflection effects occur when the blast stress wave reaches the coal–rock interface. The transmitted stress wave further enhances the damage to the coal–rock mass, while the reflected stress wave induces tensile stress in the coal–rock mass, causing tensile failure and forming a tensile damage zone. Significant differences can be observed in the blasting damage effects on coal and rock under varying stemming or decoupling lengths.
(1)
Damage effect of rock blasting
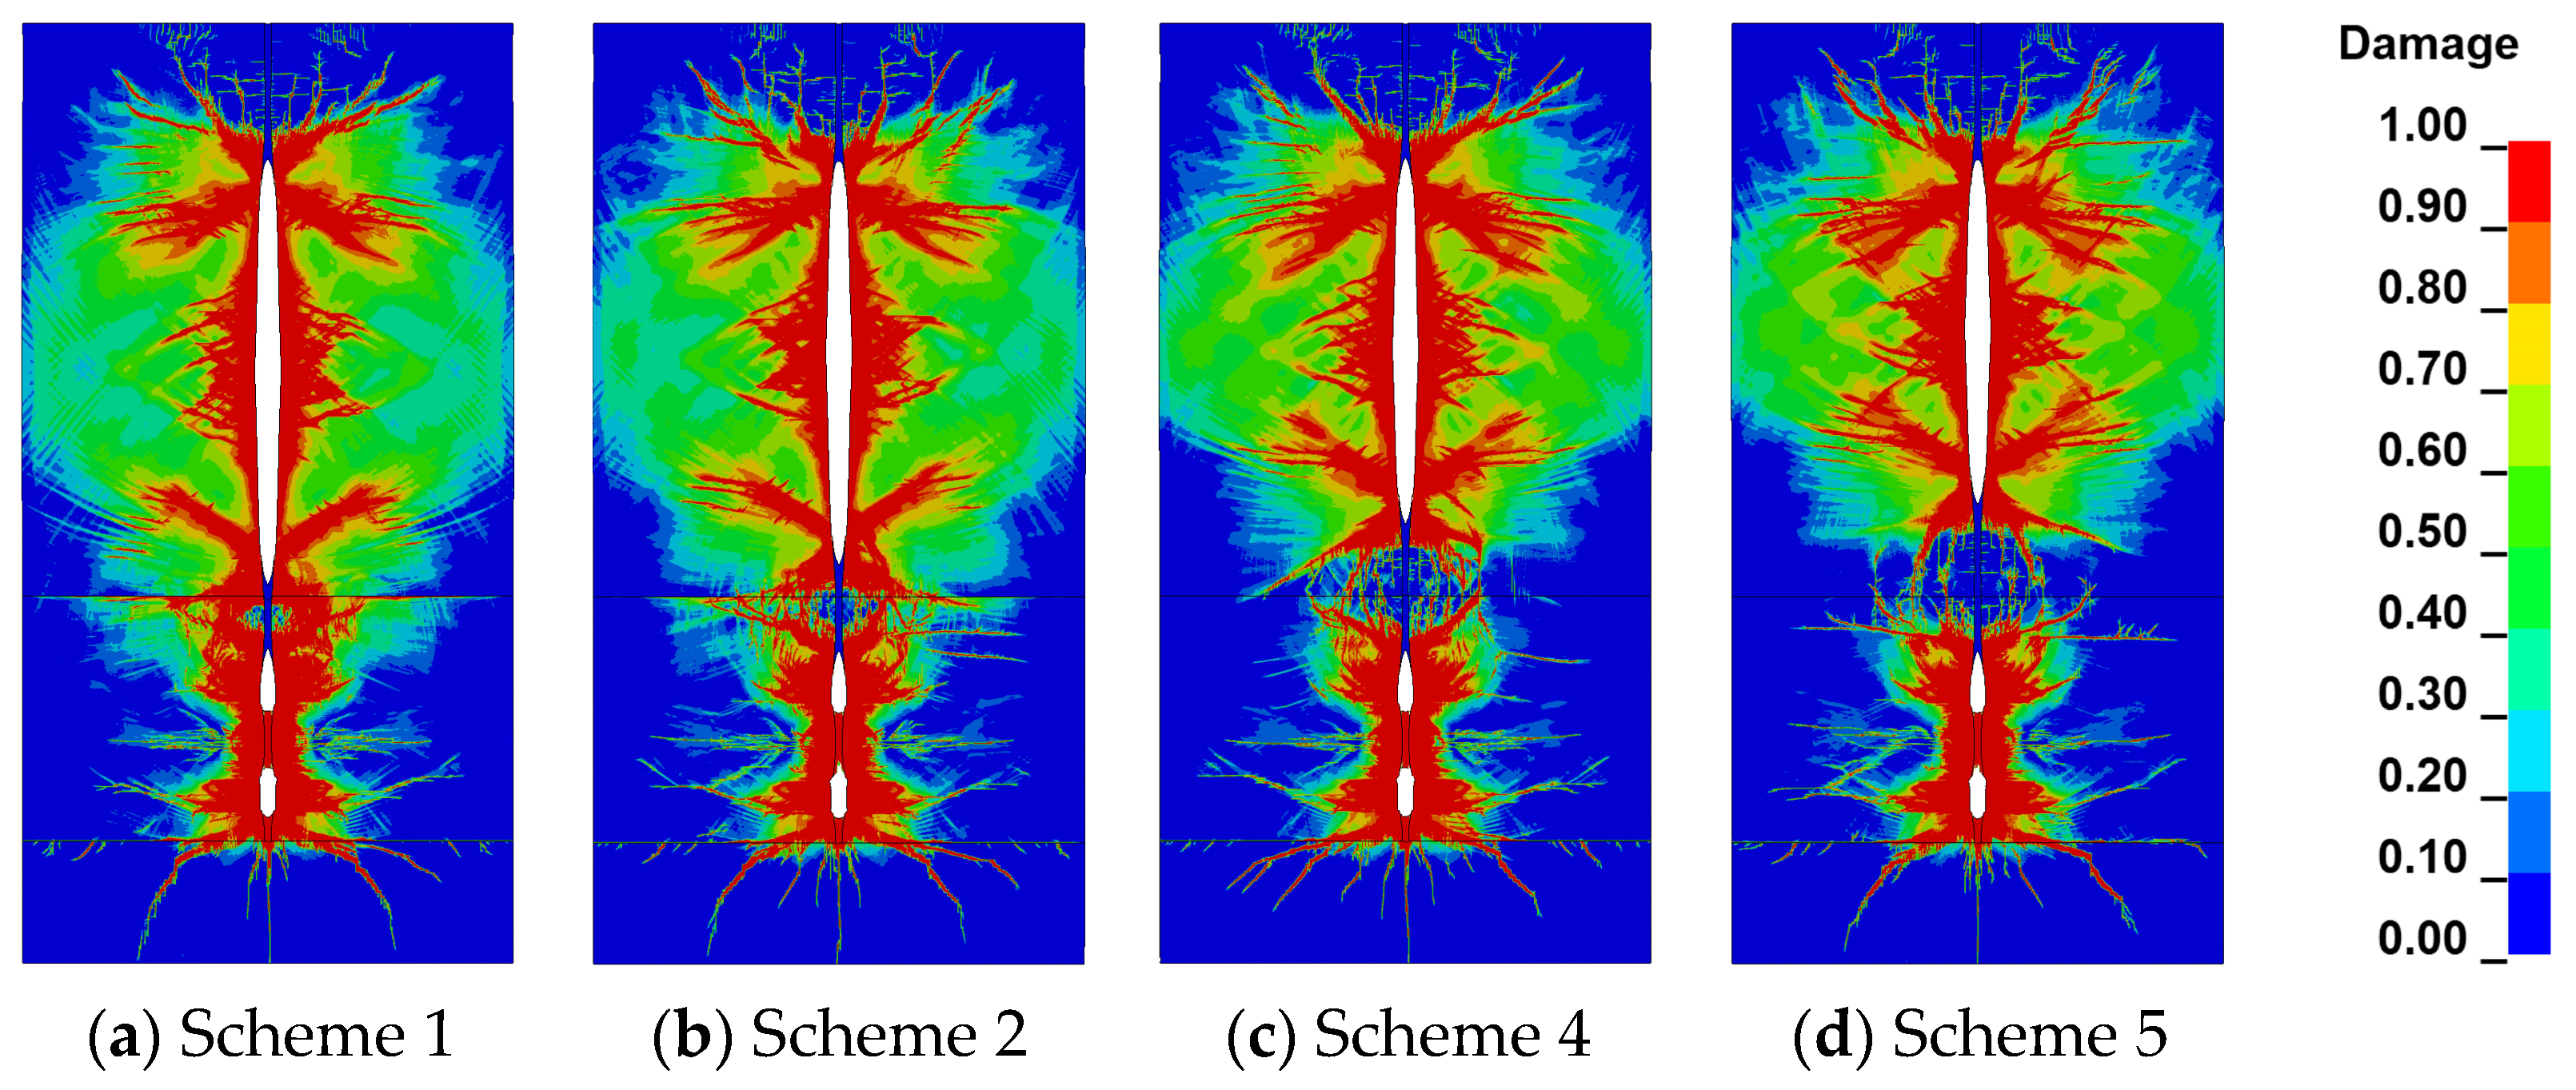
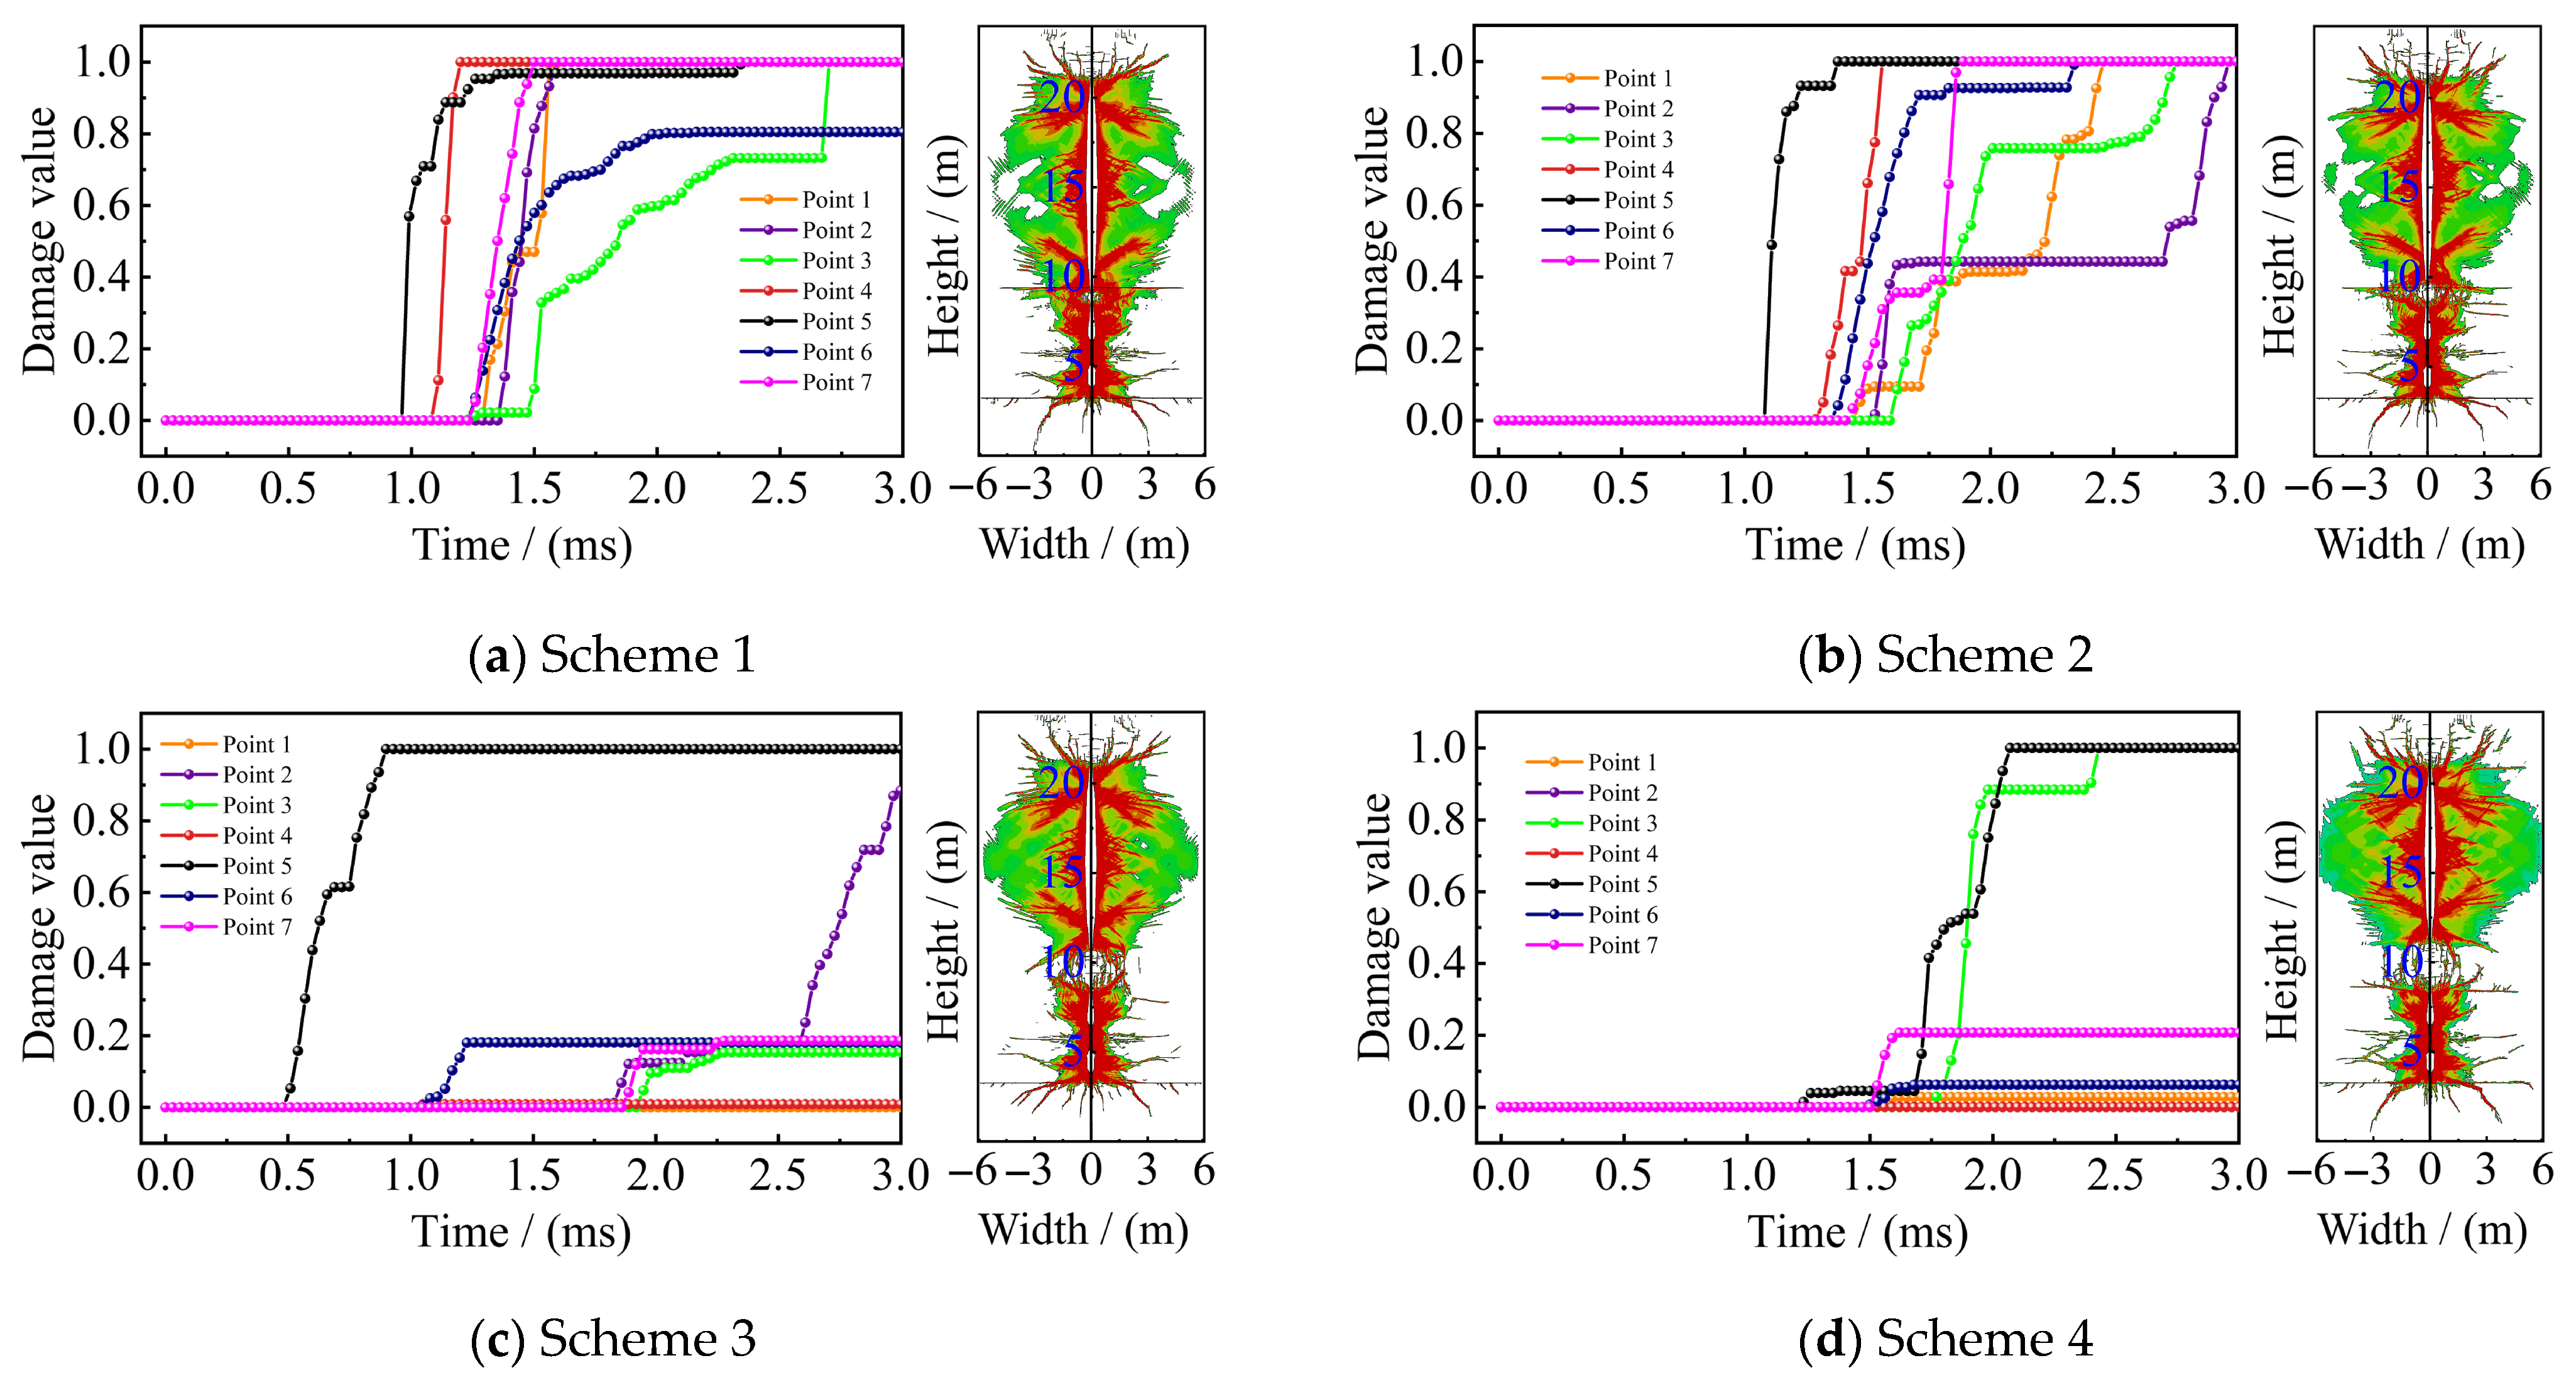
A study on the blasting damage characteristics of different decoupling lengths at the bottom of rock benches was conducted to determine the reasonable range of decoupling lengths. The blasting damage contour maps and damage curves under different charge structures were extracted from the simulation results, as shown in Figure 10 and Figure 11.
Figure 10 indicates that when the interval length at the bottom of the rock is 1 m, as illustrated in Figure 10a, the charge position in the rock is close to the coal–rock interface, resulting in strong reflection stress. This causes significant reflection tensile failure near the interface, leading to extensive tensile damage and full rock mass fracturing. Simultaneously, the transmitted stress wave also causes significant damage to the bottom of the coal seam. Figure 10b presents the blasting damage when the spacing length at the bottom of the rock is 1.5 m. Its stress wave effects are similar to those of Scheme 1; however, due to the increased stemming length, the duration of the blast stress wave in the rock mass increases, leading to a decrease in the tensile stress intensity near the interface, though the damage to the coal–rock mass remains severe. When the interval length is 2.0 m, as shown in Figure 12a, the tensile damage to the rock is significantly mitigated, and the damage to the coal seam is effectively reduced. Figure 10c shows the condition when the interval length is 2.5 m, where the tensile failure of the rock mass near the interface further decreases, though the crack connectivity remains adequate. When the interval length increases to 3.5 m, as depicted in Figure 10d, the damage range of the rock mass near the interface does not propagate effectively.
Figure 11 illustrates the blasting damage curves of the rock at each measurement point under varying stemming lengths of charge structures. The results indicate that when the interval length is 1.0 m, the damage to the rock mass near the interface is most severe, suggesting that the blasting energy transmitted to the layering interface is greater, thereby making the mixed coal and rock blasting extraction difficult to achieve. As the stemming length increases, the blasting energy that acts on and damages the rock mass around the borehole increases, while the energy transmitted to the interface decreases, resulting in a gradual decrease in damage at the measurement points. When the interval length is 2.0 m, the distribution of coal damage values near the interface becomes more reasonable. However, when the interval length increases to 3.0 m, the blasting energy transmitted to the interface is insufficient to cause effective rock mass damage, and the rock damage value decreases significantly, resulting in greater fragmentation unevenness in the coal.
(2)
Coal bench damage effect
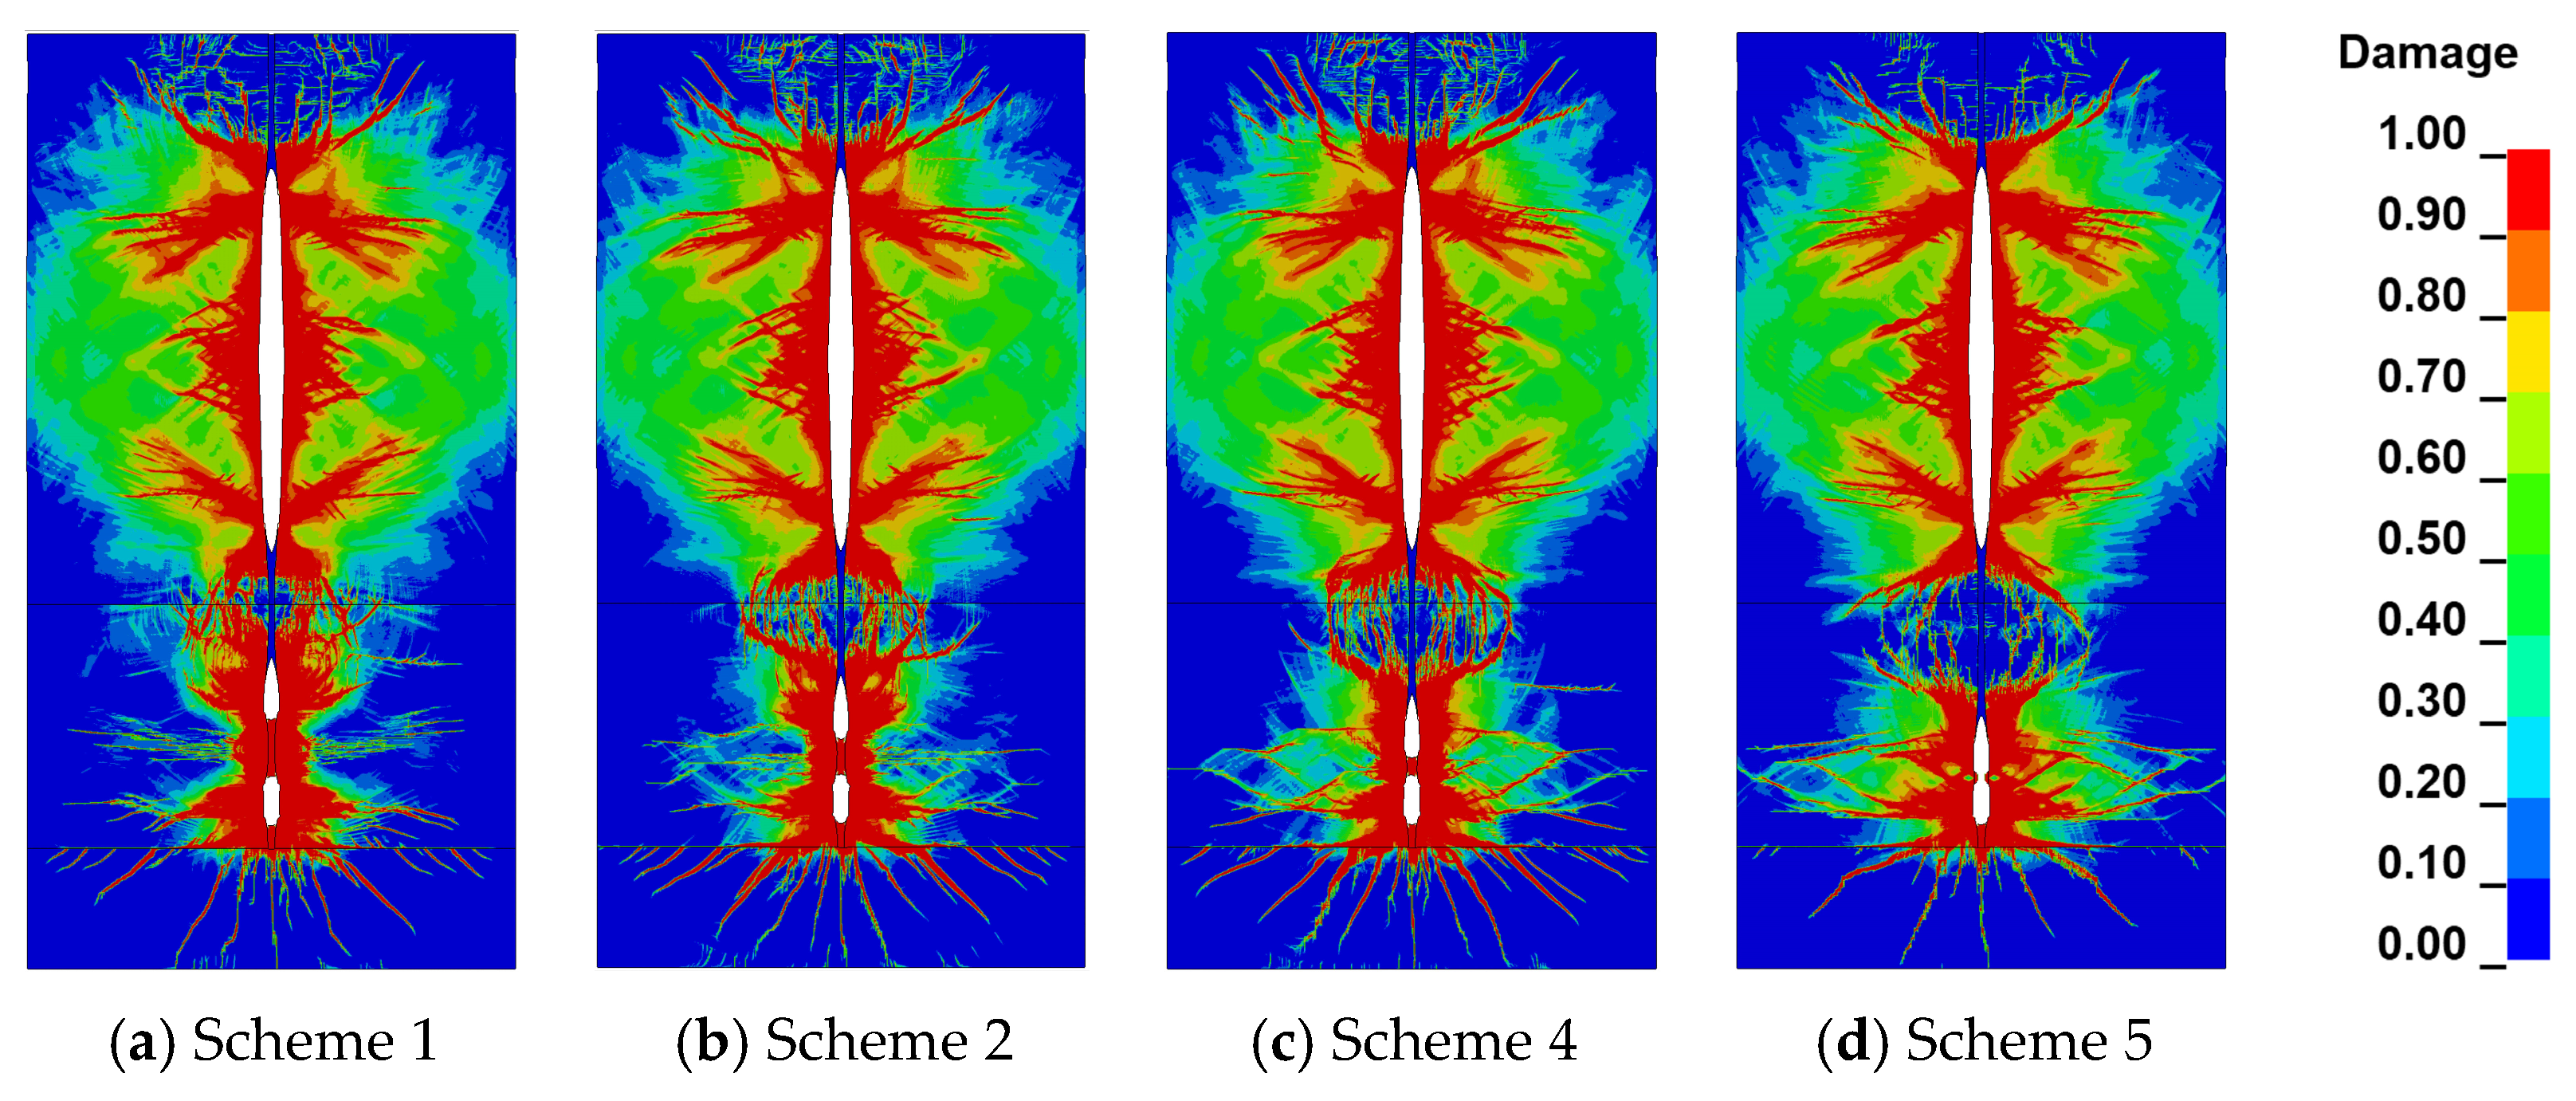
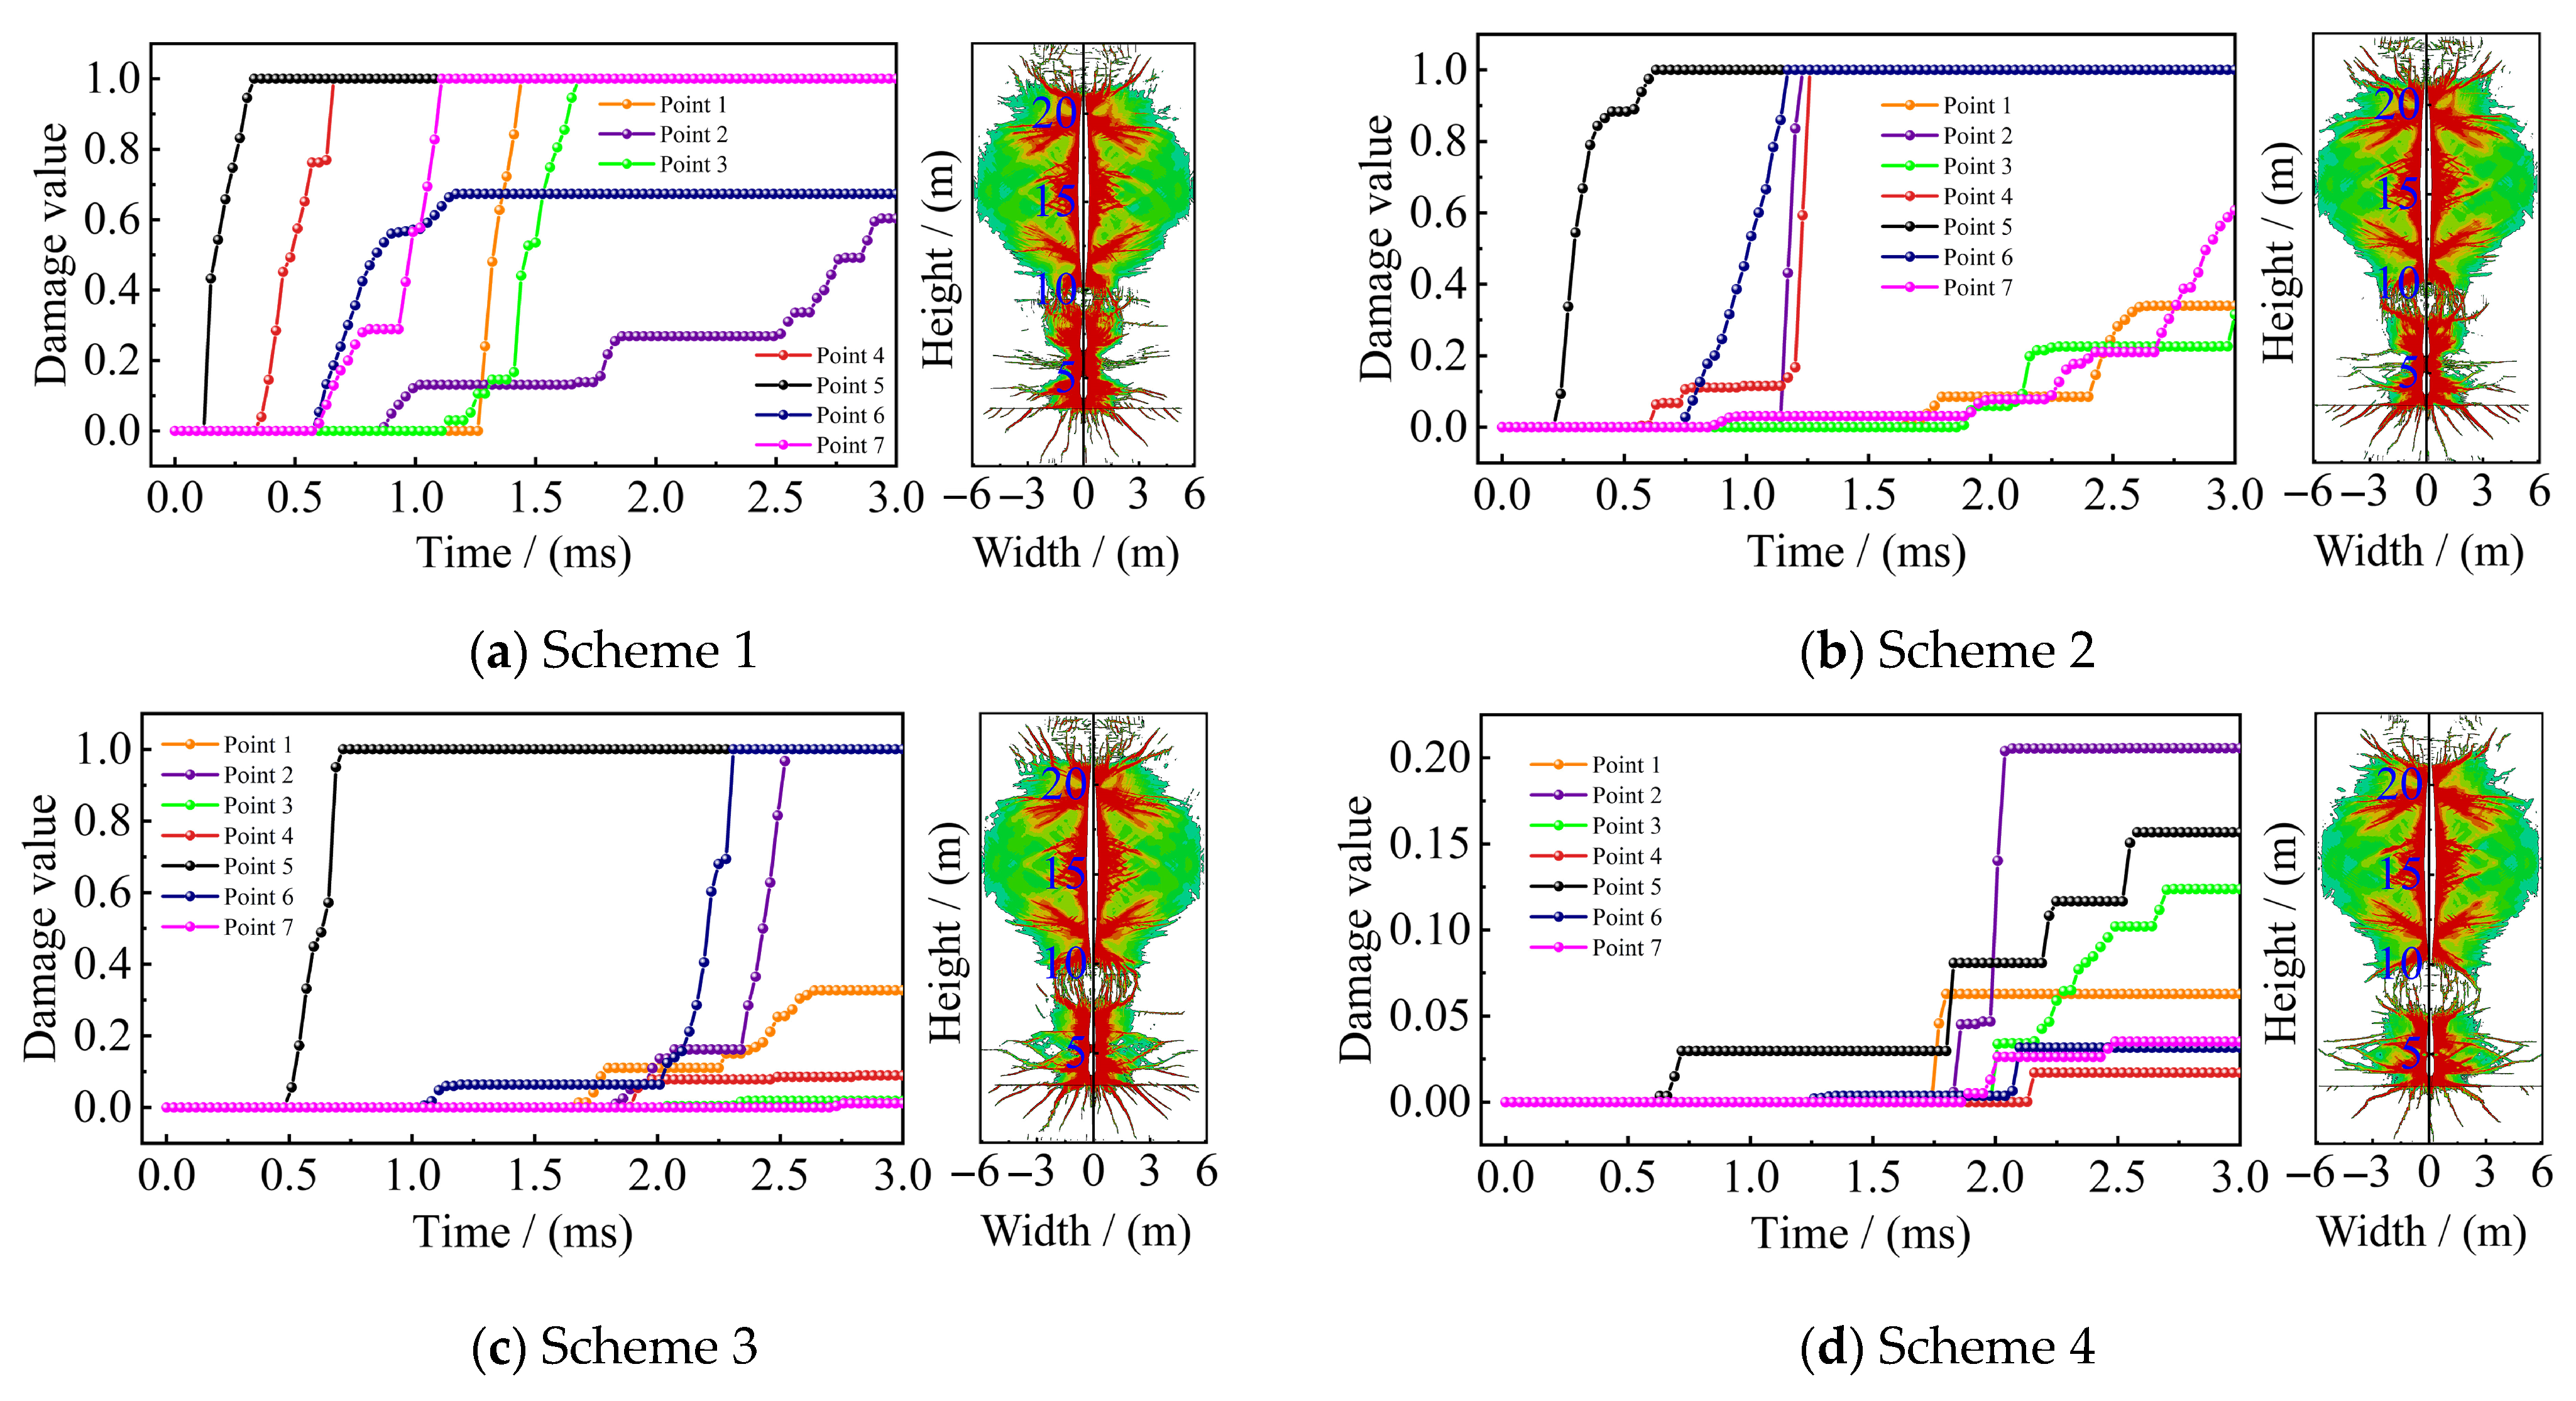
The damage to coal and rock under different charge structures was assessed based on simulation results with a rock bench spacing of 2.0 m to evaluate the rationality of the coal bench charge structure. Figure 12 and Figure 13 present the blasting damage contour maps and damage curves for the different charge structures.
Figure 12a indicates that the rock mass damage near the coal–rock interface is significant when the stemming length of the coal seam is 2.0 m, with the combined effect of blasting and reflection stress waves causing extensive coal damage and complete fracturing. Figure 12b demonstrates that when the coal fill length increases to 2.5 m, the tensile stress intensity at the interface is reduced, and the rock mass blasting damage decreases. Figure 12c shows the blasting damage when the fill length is 3.0 m, where the tensile failure of the rock mass near the interface further decreases, and the crack connectivity improves. In addition, the damage in the interval section increases, and crack propagation becomes more uniform. When the stemming length increases to 3.5 m, as depicted in Figure 12d, the damage range of the coal near the interface does not effectively propagate, but the damage in the interval section between the two charge segments of the coal seam increases.
Figure 13 illustrates the coal damage curves at each measurement point under varying stemming lengths of charge structures. The results indicate that the damage at the measurement points gradually decreases as the stemming length increases. When the stemming length is 2.0 m, the rock mass damage near the interface is more severe, indicating that the blasting energy applied to the coal seam interface is greater, which hinders the mixed coal–rock blasting extraction. As the stemming length increases in Scheme 2 and Scheme 3, the damage degree gradually decreases, the intensity of blasting energy is moderate, and the damage value distribution becomes more reasonable. When the stemming length reaches 3.5 m, the rock mass damage value is lower, the blasting energy is insufficient to break the upper part of the coal, and the expected fragmentation effect cannot be achieved.
The simulation results demonstrate that the charge structure is rational when the rock bench spacing is 2.0 m and the stemming length of the charge structure in the coal seam ranges between 2.5 and 3.0 m. The blasting energy intensity transmitted to the interface by the rock and coal layer explosions is moderate, the damage cracks in the rock mass are well developed, and the fragmentation effect near the interface is favorable.

4.2. Casting Blasting Simulation

4.2.1. Establishment of the Casting Blasting Model

Based on the actual rock accumulation range and coal layer fragmentation requirements, simulation schemes of two charge structures were designed using the optimized charge structure to verify the effect of cast blasting. Using the SPH-FEM algorithm [47,48], a bench model with four rows and a total of 12 blast holes was established for coal–rock mixed blasting numerical simulation. This analysis focused on the damage to the coal layer near the coal–rock interface and the rock blasting fragments’ throwing effect under different stemming lengths. The model size is 100 × 31 × 30 m, as shown in Figure 14, with the model scheme and parameters listed in Table 7.
(1)
The SPH-FEM coupled analysis method was adopted, where explosives and the core blasting region (coal and rock mass) were modeled as SPH particles in the bench model, while the coal–rock boundary rock mass and coal bottom rock mass were modeled using FEM grid elements [48].
(2)
The *LOAD_BODY_Y command was employed to apply gravitational acceleration in the Y-direction, and fixed boundary conditions were applied at the bottom of the model.
(3)
Non-reflective boundary conditions were applied on all sides of the bench model, except for the free surface, to eliminate the influence of stress wave reflections on the accuracy of the simulation results.
(4)
The detonation time for each explosive SPH particle in the boreholes was set sequentially to achieve hole-by-hole detonation.

4.2.2. Blast Effect Analysis

(1)
Rock Throw Law and Coal–Rock Fragmentation Effect Analysis
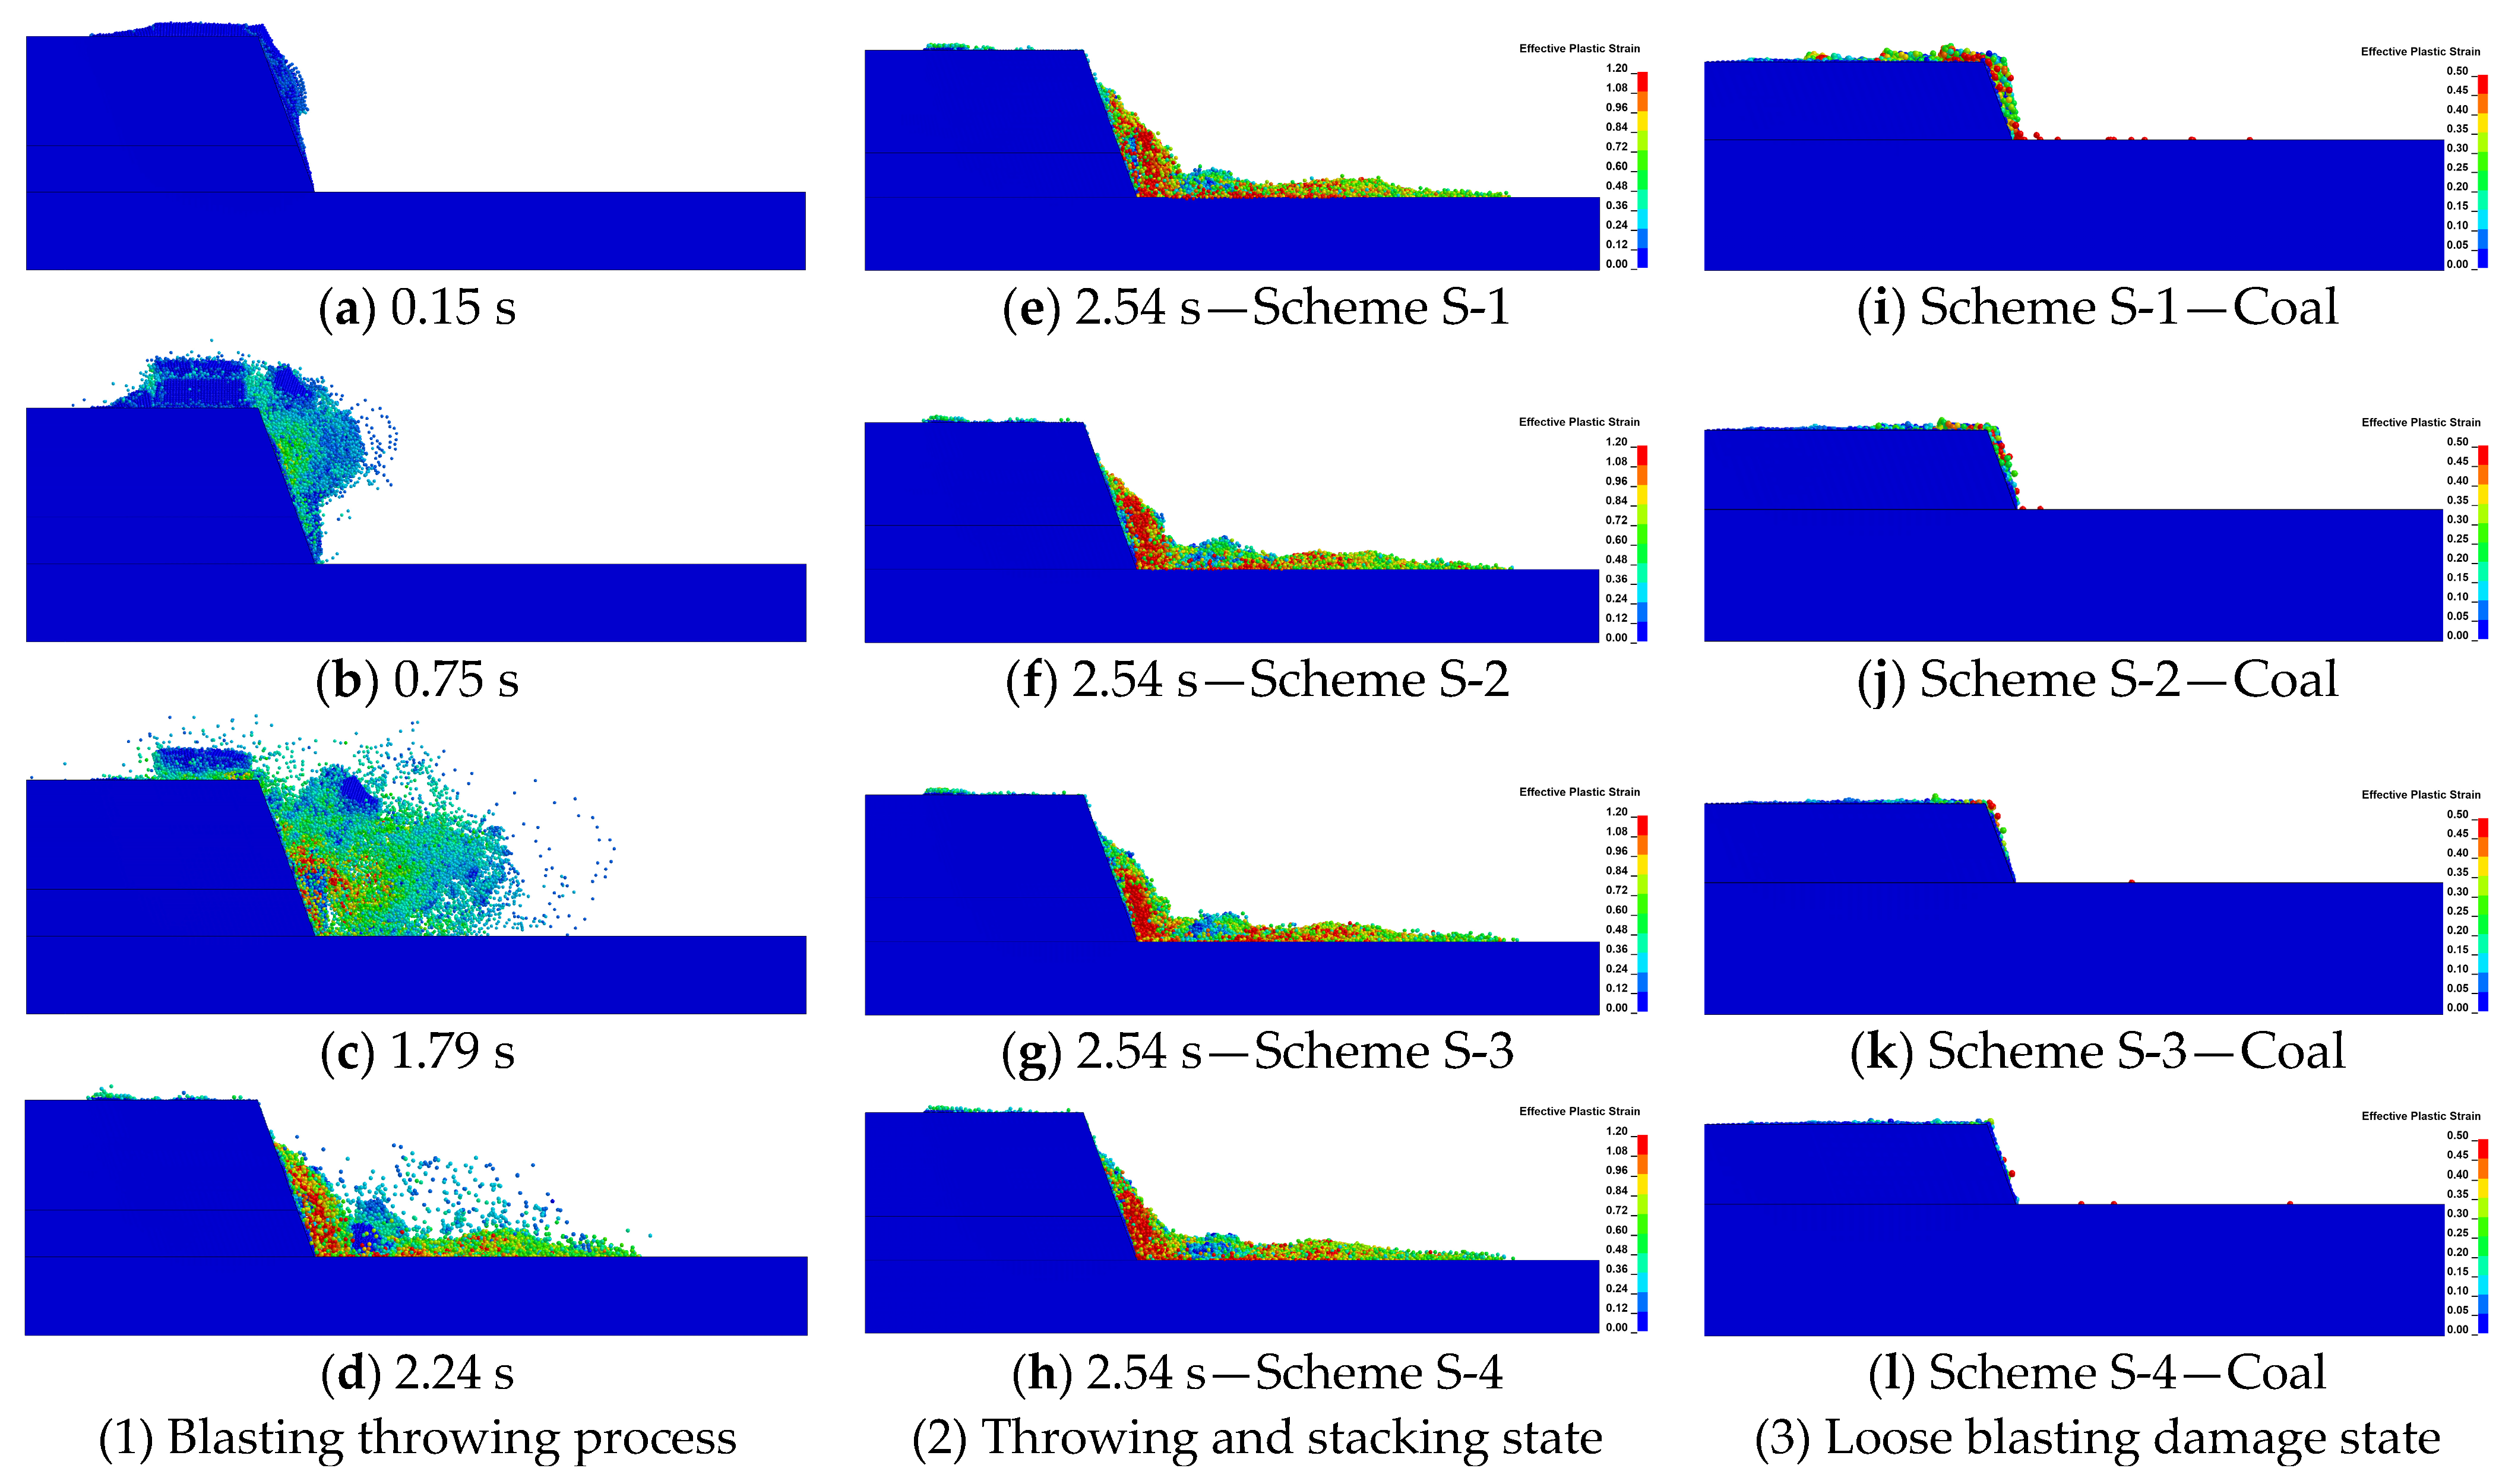
The numerical simulation of the cast blasting of the rock bench and loosening blasting of the coal seam with different charge structures extracted the equivalent strain cloud maps of the rock mass at 0.2, 0.4, 0.6, and 0.8 s during the blasting process, as shown in Figure 15.
Figure 15a–d present the effects of coal–rock blasting under varying charge structures. The analysis begins with the ejection blasting effect of the rock bench. First, the cast blasting effect of the rock bench was analyzed. Under the action of detonation pressure and explosive gases, the rock mass surrounding the borehole was damaged and gradually moved toward the free face. Simultaneously, due to the reflection of the shock waves at the free face and the tensile effect, the rock mass near the free face was thrown. As the explosives detonated hole by hole based on the delay time, the explosive energy acted on the rock mass, causing more rock mass to be thrown, as shown in Figure 15e–h. However, the front-row damaged rock fragments obstructed the movement space of the rear-row rock mass, causing the rear-row damaged rock fragments to be thrown more upward, failing to achieve effective casting. The casting volume of the rock bench was approximately 37%, concentrated within 37.75 m, the maximum casting distance was 50.37 m, and the pile height was about 4 m, demonstrating a good casting effect.
When the stemming length in the loosening blasting of the coal seam was 2.0 m, as shown in Figure 15i, the coal at the seam interface experienced blasting stress, causing a bulging phenomenon and significant interaction between coal and rock. Simultaneously, the upper rock body near the coal layer’s free face sustained significant damage and throwing. When the stemming length increased to 2.5 m (Figure 15j), the bulging phenomenon at the seam interface was effectively alleviated, and no casting phenomenon occurred. When the stemming length reached 3.0 m (Figure 15k), the bulging phenomenon at the coal–rock interface was not apparent. At the free surface of the coal bench, due to the concentration of explosives in the middle of the borehole, the coal was severely broken in the middle of the coal bench, resulting in coal bulging at the free surface, but no casting phenomenon occurred. Similarly, when the stemming length was 3.5 m (Figure 15l), there was no significant bulging phenomenon at the coal seam interface, and the coal in the middle and lower part of the coal bench’s free surface was cast. The results indicate that when the stemming length is between 2.5 and 3.0 m, the coal and rock blasting effect meets the mining requirements, with no significant coal–rock interaction at the coal–rock interface and no coal casting phenomenon.
(2)
Coal and Rock Blasting Damage Analysis
Based on the numerical model with different charge structures, the damage contour maps of coal and rock fragmentation under different charge structures were extracted and analyzed for damage characteristics, as shown in Figure 16.
Figure 16 illustrates the damage contour maps of the coal seam bench under various charge structures. In Scheme S-1, the bench damage contour map (Figure 16a) reveals that the rock mass near the stratified interface exhibits significant tensile crack propagation and severe damage due to the combined effects of blasting stress waves and reflected tensile stress waves.
Scheme S-2 (Figure 16b), compared to Scheme S-1, demonstrates that the increase in stemming length results in a longer duration of the stress wave within the rock mass, which is fully utilized internally. This causes the intensity of the stress wave reaching the stratification interface to decrease, resulting in weakened damage to the rock at the interface; however, the damage degree remains relatively sufficient. The degree of damage to the bench on the free face is consistent with Scheme S-1.
Figure 16c shows the damage to the coal seam bench under Scheme S-3, with a stemming length of 3.0 m. The damage to the stratification interface rock mass is further weakened, but the damage cracks can still penetrate successively. However, the damaged rock in the middle of the free face of the bench is more significant compared to the previous two schemes. This is primarily due to the shortening of the explosive interval, which concentrates the explosive energy, increasing the rock damage at the middle of the bench.
For Scheme S-4 (Figure 16d), the stemming length is 3.5 m, and the interval length is shortened to 0.35 m. The explosive energy is concentrated and fully utilized in the bench’s middle and lower rock mass, significantly reducing rock damage at the coal–rock interface. The tensile cracks fail to propagate effectively, and the surrounding rock damage at the free surface is concentrated in the lower part of the borehole. However, the overall damage characteristics do not achieve the required homogeneous fragmentation of the rock mass. These results indicate that when the interval length at the rock bottom is 2.0 m, and the stemming length in the upper layer is between 2.5 and 3.0 m, the damaged rock is evenly distributed, with moderate fragmentation, and there is no bulging or coal–rock interaction (explosion mixing) phenomenon. When the stemming length is ≤2.0 m, transitional damage near the coal–rock interface with severe fragmentation is unfavorable for achieving coal–rock mixed blasting separation. However, when the stemming length is ≥3.5 m, the damage to the rock mass near the coal bench stratification interface is minimal, and the fragmentation is insufficient. Although this facilitates mixed blasting separation, the increase in large rock fragments raises mining and transportation costs.

5. Field Experimental on Open-Pit Bench Coal–Rock Mixed Blasting

5.1. Mixed Blasting Experimental Plan

A blasting test was conducted at the 1054 Platform 1 mining area in the Wujiata open-pit coal mine, Ordos City, employing the optimized charge structure and borehole layout to verify the feasibility of the parameters. The bench slope angle was approximately 70°, and the rock layer and coal seam thicknesses are 14 and 6 m, respectively.
The blasting scheme was as follows: weak cast blasting was applied to the rock bench, while loosening blasting was applied to the coal bench. The charge structures were coupling and axial decoupling, respectively. The blast area was designed with four rows of blast holes. The hole pattern parameters were 6.0 × 4.5 m, and the total hole length was approximately 21.3 m, with no over-drilling. The initiation method was micro-delay sequential hole initiation, with a delay time of 65 ms between rows of boreholes and 42 ms between boreholes. The explosive used was an emulsion explosive with a density of 1.1 kg/m3 and a detonation velocity of approximately 4200 m/s. The detonator was a digital electronic detonator. The location of the blasting test is shown in Figure 17, and specific blasting parameters are listed in Table 8.

5.2. Mixed Blasting Test Results Analysis

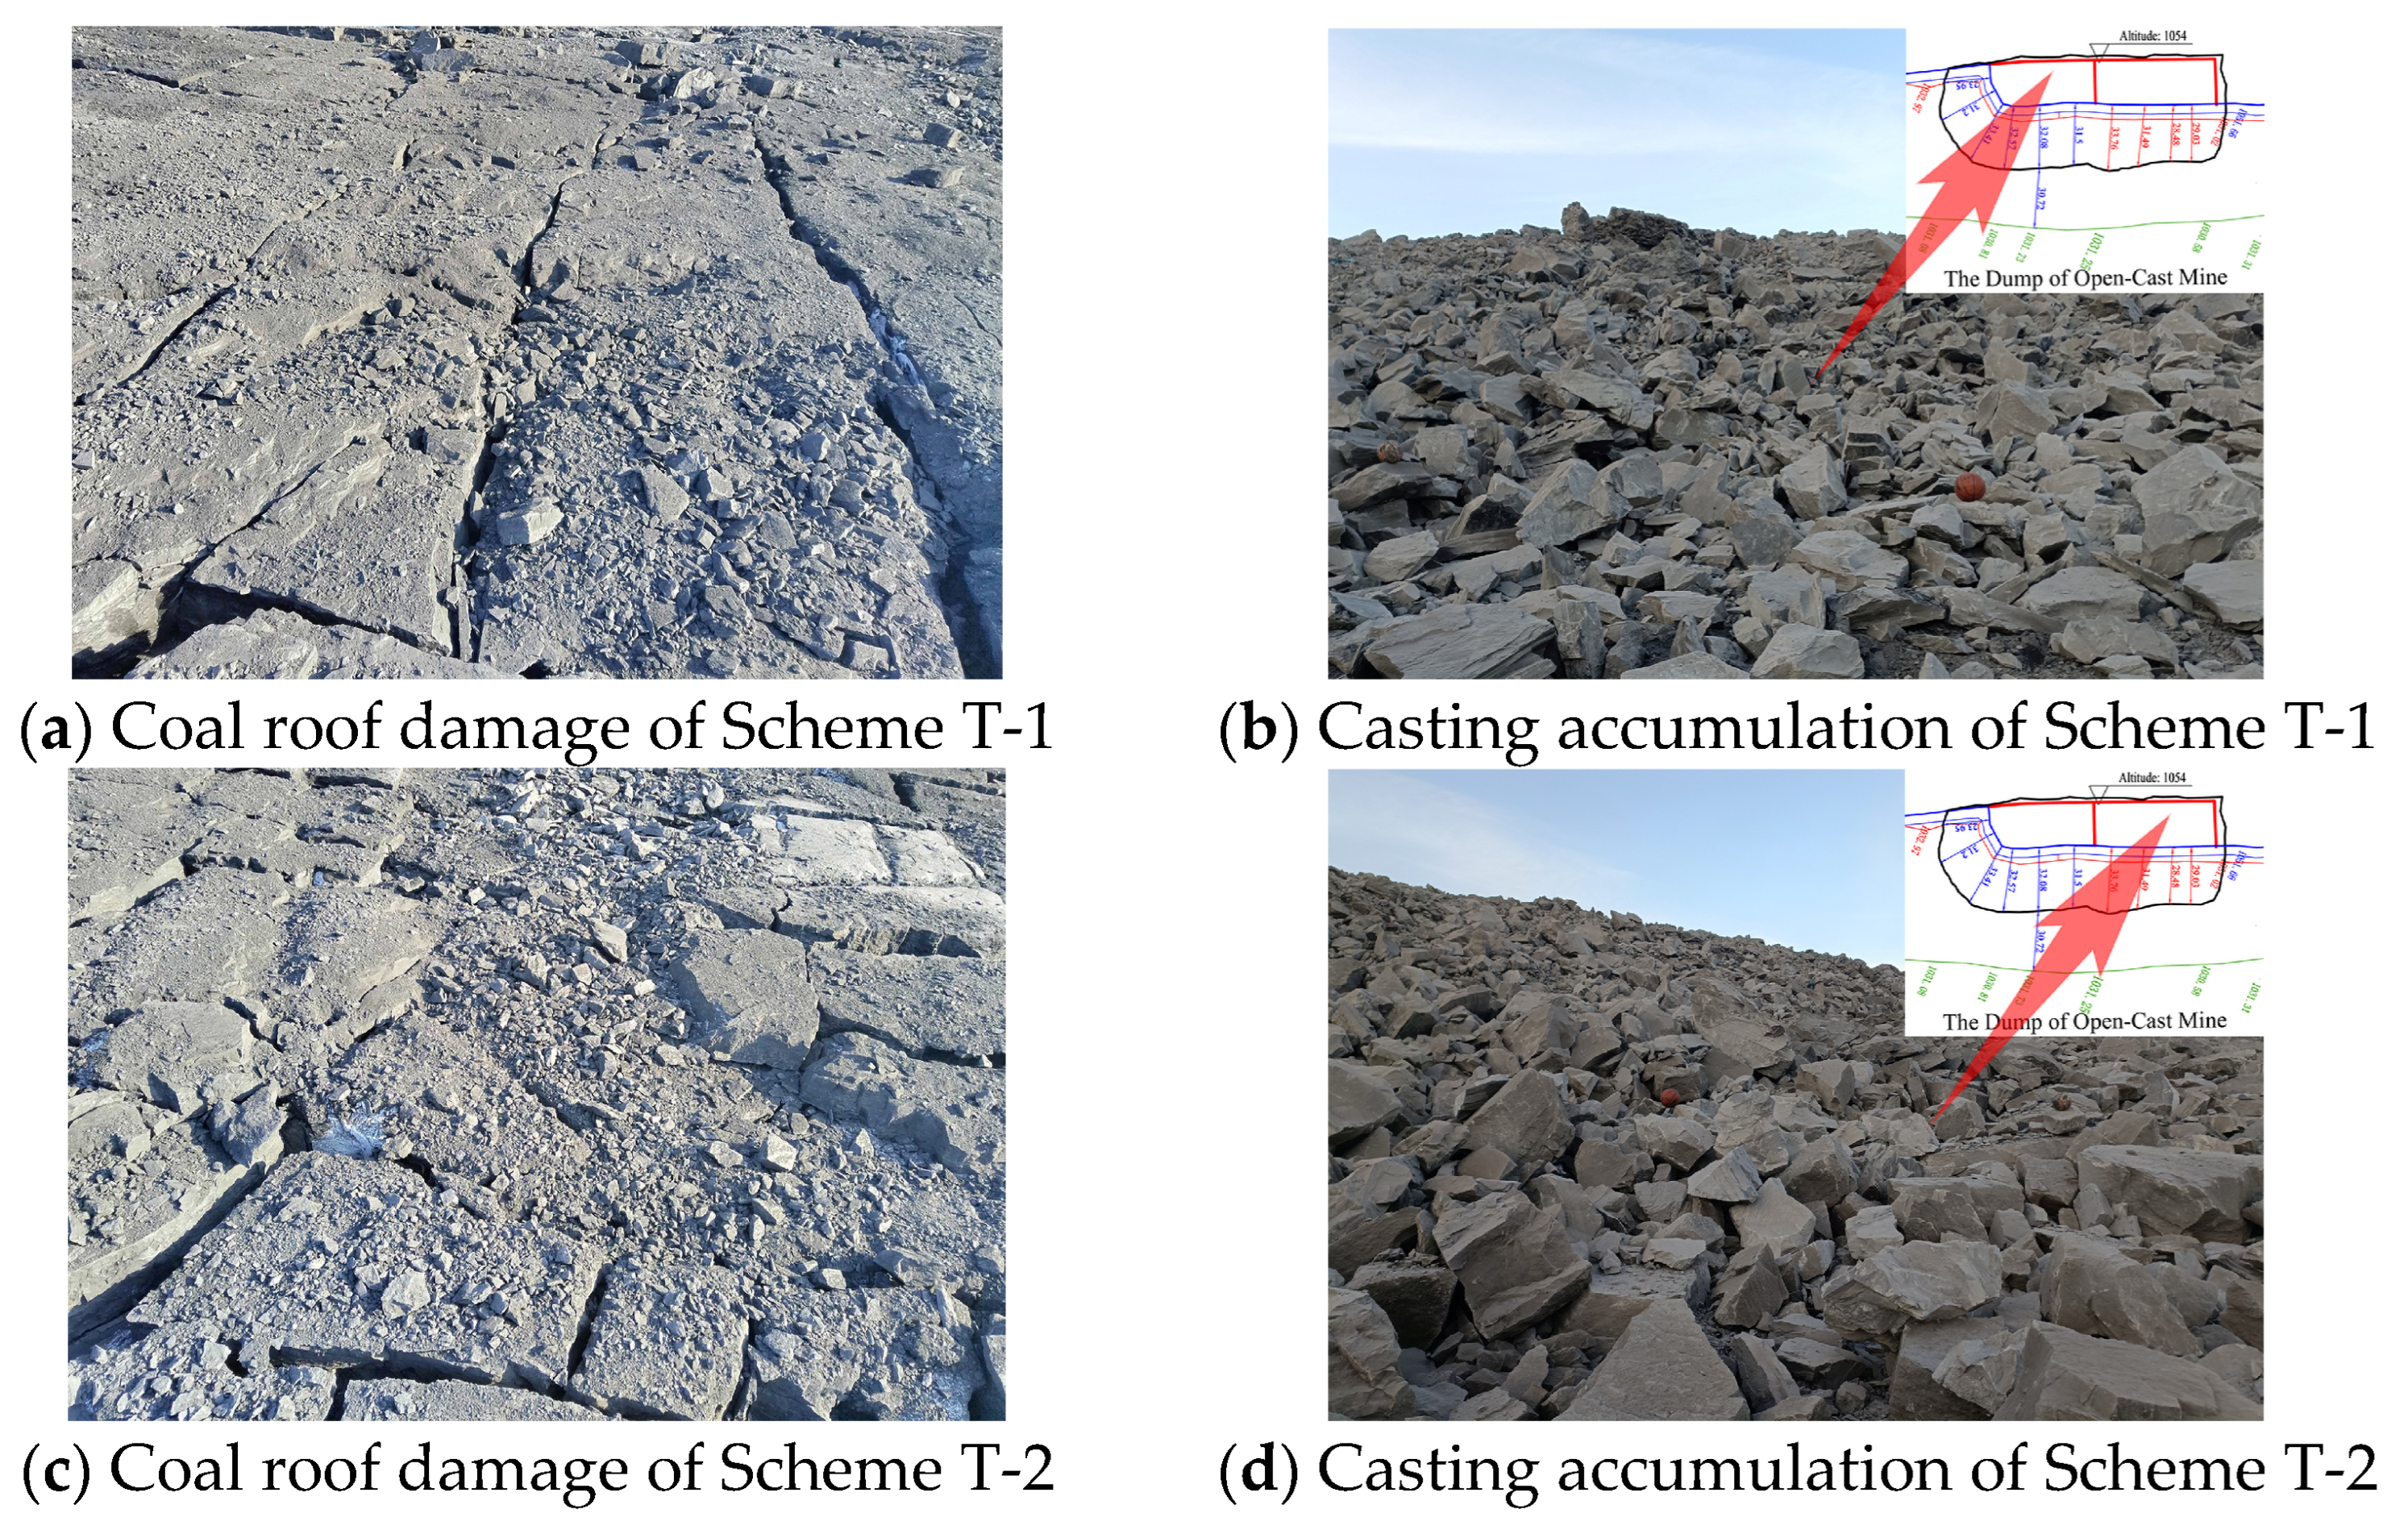
Figure 18 illustrates the field mixed blasting test results. Figure 18a,b represent the casting effect after blasting with Scheme T-1 and the damage to the coal seam roof exposed after clearing the rock layer. Figure 18c,d depict the blasting results of Scheme T-2.
Field measurements show that the casting distance of the rock fragments after blasting with the two schemes was within the ideal range, ranging from 28.48 to 33.76 m, and the fragmentation of the rock was relatively uniform, without the formation of significant large blocks. Tension cracks were formed at the top of the coal seam with high smoothness. In addition, no significant bulging or explosive mixing phenomena were observed. This indicates that the field mixed blasting test achieved the expected results. The comparison of the fragmentation at the top of the coal seam in Figure 18b,d reveals that in Scheme T-1 (with a fill length of 2.5 m), the cracks at the top of the coal seam were well-developed, and the fragmentation size was moderate. However, in Scheme T-2 (with a fill length of 3.0 m), although through-tension cracks were formed at the top of the coal seam, the number of cracks was small, and the fragmentation was coarse, which is unfavorable for loading and transportation. This indicates that the blasting stress wave intensity and reflection stress wave intensity in Scheme T-1 were more moderate, resulting in a more uniform distribution of tensile cracks in the rock mass near the coal–rock interface and complete fragmentation. Accordingly, the results demonstrate that the reasonableness of the stemming length is one of the key factors in achieving successful coal–rock mixed blasting. They validate the rationality of the charge structure design in Scheme T-1, confirming the accuracy of the numerical results.

6. Conclusions

This study focuses on optimizing the charge structure to achieve separate mining in coal and rock mixed blasting. Based on coal and rock blasting crater tests, the energy distribution law during coal and rock mixed blasting was analyzed. The throwing process and damage characteristics of coal and rock blasting under different charge structures were studied through numerical simulations. In addition, field mixed blasting separate mining experiments were conducted using the optimized charge structure. The following conclusions are drawn:
(1)
A characteristic curve of the coal bench blasting crater is established based on the results of on-site blasting crater tests. When the ratio of charge length to stemming length in coal and rock bench blasting exceeds 0.91 and 0.74, respectively, the internal crushing effect of the rock mass is enhanced, and the utilization rate of explosive energy in coal and rock fragmentation gradually surpasses that in rock casting.
(2)
The numerical results of coal and rock mixed blasting indicate that when the bottom spacing length of the rock bench is 2 m, and the stemming length of the coal seam ranges from 2.5 to 3 m, the distribution of explosive energy within the rock mass near the stratified interface is optimized, enhancing the rational utilization of energy, facilitating the connectivity of rock damage cracks, and improving the tension cracks’ distribution at the coal seam’s top. In addition, no bulging or coal–rock interaction (explosive mixing) phenomenon occurs at the coal–rock interface, and the blasting effect satisfies the requirements of mixed separate mining.
(3)
The coal and rock mixed blasting test results indicate that a reasonable charge structure is one of the key factors in achieving coal and rock mixed blasting separate mining. After optimizing the charge structure, the cast blasting distance of the rock bench ranges from 21.65 to 32.59 m. The crushing effect of Scheme 1 at the stratified interface is superior to that of Scheme 2; however, both schemes meet the requirements of separation and crushing. These results demonstrate that the optimized charge structure effectively fulfills the purpose and requirements of coal and rock mixed blasting separate mining.

Author Contributions

Conceptualization, A.J., H.F. and Y.L.; methodology, A.J., Y.L. and Y.Y.; software, A.J.; validation, Y.Y. and S.B.; formal analysis, A.J., Y.Y. and J.G.; investigation, Y.L.; resources, Y.L. and H.F.; data curation, A.J., H.F. and Y.L.; writing—original draft preparation, A.J., H.F. and Y.L.; writing—review and editing, A.J., H.F., Y.Y. and S.B.; visualization, A.J. and S.B.; supervision, H.F. and Y.Y.; project administration, Y.Y.; funding acquisition, H.F. and Y.Y. All authors have read and agreed to the published version of the manuscript.

Funding

The study is supported by The National Natural Science Foundation of China (Grant No. 52208477) and the Collaborative Innovation Center for Major Disasters Prevention and Restoration in Mines (Grant No. CXZX-2024-07), which are gratefully acknowledged.

Institutional Review Board Statement

Not applicable.

Informed Consent Statement

Not applicable.

Data Availability Statement

The data presented in this study are available on request from the corresponding author; due to the fact that the data will also be utilized in the preparation of a dissertation, they cannot be publicly disclosed.

Conflicts of Interest

The authors declare no conflicts of interest.

References

  1. Chironis, N.P. Efficient Stripping New Washer Build Markets. Coal Age 1962, 67, 64–67. [Google Scholar]
  2. Ray, S.K.; Zutshi, A.; Sarkar, M. Cast Blasting—State of the Art. Fragblast 1999, 3, 291–302. [Google Scholar] [CrossRef]
  3. Zhang, Z.; Zhang, R.; Sun, J. Research on the Optimization of Open-Pit Mine Cast Blasting Parameters Based on the Optimal Economy of Dragline Stripping Technology. Appl. Sci. 2023, 13, 10888. [Google Scholar] [CrossRef]
  4. Sharma, P.D. Overburden Side Casting by Blasting—An Effective Way of Reducing Operating Cost in Large Opencast Coal Mines. J. Mines Met. Fuels 2006, 52, 284–288. [Google Scholar]
  5. Mishra, A.K.; Sinha, M.; Rout, M. Cast Blasting for Improved Mine Economics. In Proceedings of the Blasting in Mining-New Trends: 10th International Symposium on Rock Fragmentation by Blasting, FRAGBLAST; CRC Press: Boca Raton, FL, USA, 2013; Volume 10, pp. 73–80. [Google Scholar]
  6. XIAO, S.; DING, X.; Ma, L. Optimization on Bench Parameters of Casting Blast Based on Multi-Objective Programming. J. China Coal Soc. 2018, 43, 2422–2431. [Google Scholar]
  7. Ma, L.; Lai, X.; Zhang, J.; Xiao, S.; Zhang, L.; Tu, Y. Blast-Casting Mechanism and Parameter Optimization of a Benched Deep-Hole in an Opencast Coal Mine. Shock Vib. 2020, 2020, 1396483. [Google Scholar] [CrossRef]
  8. Huang, Y.; Zhao, Z.; Zhang, Z.; Zhou, J.; Li, H.; Li, Y. Calculation Method of the Blasting Throwing Energy and Its Variation Affected by the Burden. Appl. Sci. 2022, 12, 6524. [Google Scholar] [CrossRef]
  9. Chironis, N.P. Angled Drilling Aids Casting. Coal Age 1984, 89, 64–67. [Google Scholar]
  10. Wang, P.; Zhou, W.; Yang, H.; Zhang, G. Analysis on Reasonable Layout and Row Spacing of Casting Blasting in Open Pit Coal Mine. Coal Eng. 2011, 11, 72–74. [Google Scholar]
  11. LI, X.; LUO, H.; HU, H.; ZHANG, S.; LI, K. High Bench Cast-Blasting Effects Influenced by Delay Time. Trans. Beijing Inst. Technol. 2018, 38, 579–584. [Google Scholar]
  12. Zuo, Y.F.; Zhang, J.Y.; Yang, L.D.; Wang, F.R.; Wang, Z.A. A Study on the Effect of Different Charge Structures on the Permeability Enhancement of Coal Seam Blasting. Processes 2024, 12, 1645. [Google Scholar] [CrossRef]
  13. Bhagade, N.V.; Murthy, V.M.S.R.; Ali, M.S. Enhancing Rock Fragmentation in Dragline Bench Blasts Using Near-Field Ground Vibration Dynamics and Advanced Blast Design. Powder Technol. 2021, 381, 421–439. [Google Scholar] [CrossRef]
  14. Ma, L.; Zhang, J.; Lai, X. Optimization on Working Face Length of Blast Casting Stripping System in Comprehensive Technology. J. China Coal Soc. 2021, 46, 3186–3192. [Google Scholar] [CrossRef]
  15. Han, L.; Liu, D.-S.; Li, G.-J.; Wang, Y.-T. BP Neural Network Forecast of Blasting Muck Pile Form of High Bench Cast Blasting Based on Weibull Model. J. China Coal Soc. 2013, 38, 1947–1952. [Google Scholar]
  16. Huang, Y.-H.; Li, S.-L.; Fan, X.-W.; Wang, Y.-T.; Zhou, M.-G. Research and Application of Throwing Blast Effect Prediction Model of ELM Neural Network. J. China Coal Soc. 2012, 37, 65–69. [Google Scholar]
  17. Tingxin, W.; Xiaoyu, C.; Liangshan, S. Prediction on Parameters Optimized GA-ELM Model for Cast Blasting in Open-Pit Mine. J. China Coal Soc. 2017, 42, 630–638. [Google Scholar]
  18. Ma, N.; Ma, L.; Li, T.; Yang, S.; Wang, X.; Zhang, Q. HHO-LSSVM Prediction of Throwing Blasting Stockpile Morphology Based on Gaussian Distribution. J. China Coal Soc. 2024, 49, 4701–4712. [Google Scholar] [CrossRef]
  19. Zhao, Z.; Zhang, R.; Sun, J.; Xu, X.; Tao, Y.; Lv, S.; Feng, D. Study on the Determination Method of Cast Blasting Stockpile Forms in an Open-Pit Mine. Appl. Sci. 2022, 12, 6428. [Google Scholar] [CrossRef]
  20. Huo, X.F.; Qiu, X.Y.; Shi, X.Z.; Chen, H.; Zong, C.X.; Xie, C. Attenuation Characteristics of Blasting Stress Under Decoupled Cylindrical Charge. Rock Mech. Rock Eng. 2023, 56, 4185–4209. [Google Scholar] [CrossRef]
  21. Ma, S.Z.; Liu, K.W.; Yang, J.C. Investigation of Blast-Induced Rock Fragmentation and Fracture Characteristics with Different Decoupled Charge Structures. Int. J. Impact Eng. 2024, 185, 104855. [Google Scholar] [CrossRef]
  22. Xia, X.; Yu, C.; Liu, B.; Liu, Y.; Li, H. Experimental Study on the Seismic Efficiency of Rock Blasting and Its Influencing Factors. Rock Mech. Rock Eng. 2018, 51, 2415–2425. [Google Scholar] [CrossRef]
  23. Yu, K.; Lin, P.; Chitombo, G.; Ma, L.; Peng, C. Study on the Optimization of Blasting Parameters and Blastholes Charging Structure for Broken Orebody. Tunn. Undergr. Space Technol. 2024, 152, 105948. [Google Scholar] [CrossRef]
  24. Yuan, W.; Wang, W.; Su, X.; Li, J.; Li, Z.; Wen, L.; Chang, J. Numerical Study of the Impact Mechanism of Decoupling Charge on Blasting-Enhanced Permeability in Low-Permeability Sandstones. Int. J. Rock Mech. Min. Sci. 2018, 106, 300–310. [Google Scholar] [CrossRef]
  25. Hong, Z.X.; Tao, M.; Li, X.D.; Zhao, H.T.; Zhao, M.S. Experimental Study on the Influences of Charging Structure with Various Filling Mediums on Rock Blasting Performances. Powder Technol. 2023, 429, 118925. [Google Scholar] [CrossRef]
  26. Chen, M.; Ye, Z.; Lu, W.; Wei, D.; Yan, P. An Improved Method for Calculating the Peak Explosion Pressure on the Borehole Wall in Decoupling Charge Blasting. Int. J. Impact Eng. 2020, 146, 103695. [Google Scholar] [CrossRef]
  27. Li, X.; Liu, K.; Sha, Y.; Yang, J.; Song, R. Numerical Investigation on Rock Fragmentation under Decoupled Charge Blasting. Comput. Geotech. 2023, 157, 105312. [Google Scholar] [CrossRef]
  28. Chi, L.Y.; Wang, C.; Zhang, Z.X.; Xu, X.; Yang, J. Experimental Investigation of Decoupled Charge Effect on Rock Fragmentation by Blasting. Rock Mech. Rock Eng. 2022, 55, 3791–3806. [Google Scholar] [CrossRef]
  29. Yuan, W.; Wang, W.; Su, X.; Wen, L.; Chang, J. Experimental and Numerical Study on the Effect of Water-Decoupling Charge Structure on the Attenuation of Blasting Stress. Int. J. Rock Mech. Min. Sci. 2019, 124, 104133. [Google Scholar] [CrossRef]
  30. Liu, J.; Gao, W.; Zhang, S.; Li, X. Distribution Law of Explosion Stress on Hole Wall of Water Interval Charge. Acta Armamentarii 2021, 42, 2646–2654. [Google Scholar] [CrossRef]
  31. Liu, S.; Sui, J.; Jia, H.; Fu, M.; Yu, T.; Yao, B. Optimization of Solid-Hydraulic Coupled Charge Structure and Borehole Arrangement in Deep Buried Bottom Draw Lane Gunnery. J. Min. Strat. Control Eng. 2023, 6, 5–16. [Google Scholar] [CrossRef]
  32. Lou, X.; Zhou, P.; Yu, J.; Sun, M. Analysis on the Impact Pressure on Blast Hole Wall with Radial Air-Decked Charge Based on Shock Tube Theory. Soil Dyn. Earthq. Eng. 2020, 128, 105905. [Google Scholar] [CrossRef]
  33. Lou, X.; Wang, Z.; Chen, B.; Wang, Z.; Yu, J. Initial Shock Pressure Analysis for Hole Wall with Air-Decked Charge. J. China Coal Soc. 2017, 11, 2875–2884. [Google Scholar] [CrossRef]
  34. Li, Z.; Wu, Y.; Zhang, X.; Li, X.; Zhao, W.; Gao, W.; Li, H.; Li, Y.; Yan, T. Study on Explosion Impact Pressure and Damage Distribution Law of Rock Powder Segmented Charge. Eng. Fail. Anal. 2024, 163, 108517. [Google Scholar] [CrossRef]
  35. Jang, H.; Handel, D.; Ko, Y.; Yang, H.-S.; Miedecke, J. Effects of Water Deck on Rock Blasting Performance. Int. J. Rock Mech. Min. Sci. 2018, 112, 77–83. [Google Scholar] [CrossRef]
  36. Liu, J.; Gao, W.; Zhang, S.; Xu, H. Numerical Analysis and Application of Uncoupled Coefficient of Water Sealed Blasting on Blasting Effect. IOP Conf. Ser. Earth Environ. Sci. 2021, 719, 32035. [Google Scholar] [CrossRef]
  37. Wu, L.; Zhou, Y.; Guo, Z. The Rock Failure Mechanism of Air-Decked Blasting in Hole Bottom. Appl. Mech. Mater. 2012, 201–202, 375–378. [Google Scholar] [CrossRef]
  38. Yin, Z.; Wang, X.; Wang, D.; Dang, Z.; Bi, J. Analysis and Application of Stress Distribution in 24-m High Bench Loosening Blasting with Axially Uncoupled Charge Structure in Barun Open-Pit Mine. IOP Conf. Ser. Earth Environ. Sci. 2021, 804, 22059. [Google Scholar] [CrossRef]
  39. Honglu, F. Blasting Theory and Applications; China Coal Industry Publishing House: Beijing, China, 2017; ISBN 750203305X. [Google Scholar]
  40. Borrvall, T.; Riedel, W. The RHT Concrete Model in LS-DYNA. In Proceedings of the 8th European LS-DYNA User Conference, Ulm, Germany, 23–24 May 2011; pp. 1–14. [Google Scholar]
  41. Wang, H.; Wang, Z.; Wang, J.; Wang, S.; Wang, H.; Yin, Y.; Li, F. Effect of Confining Pressure on Damage Accumulation of Rock under Repeated Blast Loading. Int. J. Impact Eng. 2021, 156, 103961. [Google Scholar] [CrossRef]
  42. LI, H.; LIU, D.; ZHAO, L.; LI, C.; ZHANG, Z. Study on Parameters Determination of Marble RHT Model. Trans. Beijing Inst. Technol. 2017, 37, 801–806. [Google Scholar]
  43. Xie, L.X.; Lu, W.B.; Zhang, Q.B.; Jiang, Q.H.; Chen, M.; Zhao, J. Analysis of Damage Mechanisms and Optimization of Cut Blasting Design under High In-Situ Stresses. Tunn. Undergr. Space Technol. 2017, 66, 19–33. [Google Scholar] [CrossRef]
  44. Qiu, X.; Liu, X.; Hu, A.; Li, H.; Wang, Y. Research on Numerical Simulation of Coal Dynamic RHT Constitutive Model. J. China Coal Soc. 2024, 49, 261–273. [Google Scholar]
  45. Himanshu, V.K.; Mishra, A.K.; Roy, M.P.; Vishwakarma, A.K.; Singh, P.K. Numerical Simulation Based Approach for Assessment of Blast Induced Deformation Pattern in Slot Raise Excavation. Int. J. Rock Mech. Min. Sci. 2021, 144, 104816. [Google Scholar] [CrossRef]
  46. Kan, J.; Dou, L.; Li, X.; Cao, J.; Bai, J.; Chai, Y. Study on Influencing Factors and Prediction of Peak Particle Velocity Induced by Roof Pre-Split Blasting in Underground. Undergr. Space 2022, 7, 1068–1085. [Google Scholar] [CrossRef]
  47. Zhang, H.; Li, T.; Du, Y.; Zhu, Q.; Zhang, X. Theoretical and Numerical Investigation of Deep-Hole Cut Blasting Based on Cavity Cutting and Fragment Throwing. Tunn. Undergr. Space Technol. 2021, 111, 103854. [Google Scholar] [CrossRef]
  48. Li, C.; Yang, R.; Wang, Y.; Kang, Y.; Zhang, Y.; Xie, P. Theoretical and Numerical Simulation Investigation of Deep Hole Dispersed Charge Cut Blasting. Int. J. Coal Sci. Technol. 2023, 10, 15. [Google Scholar] [CrossRef]
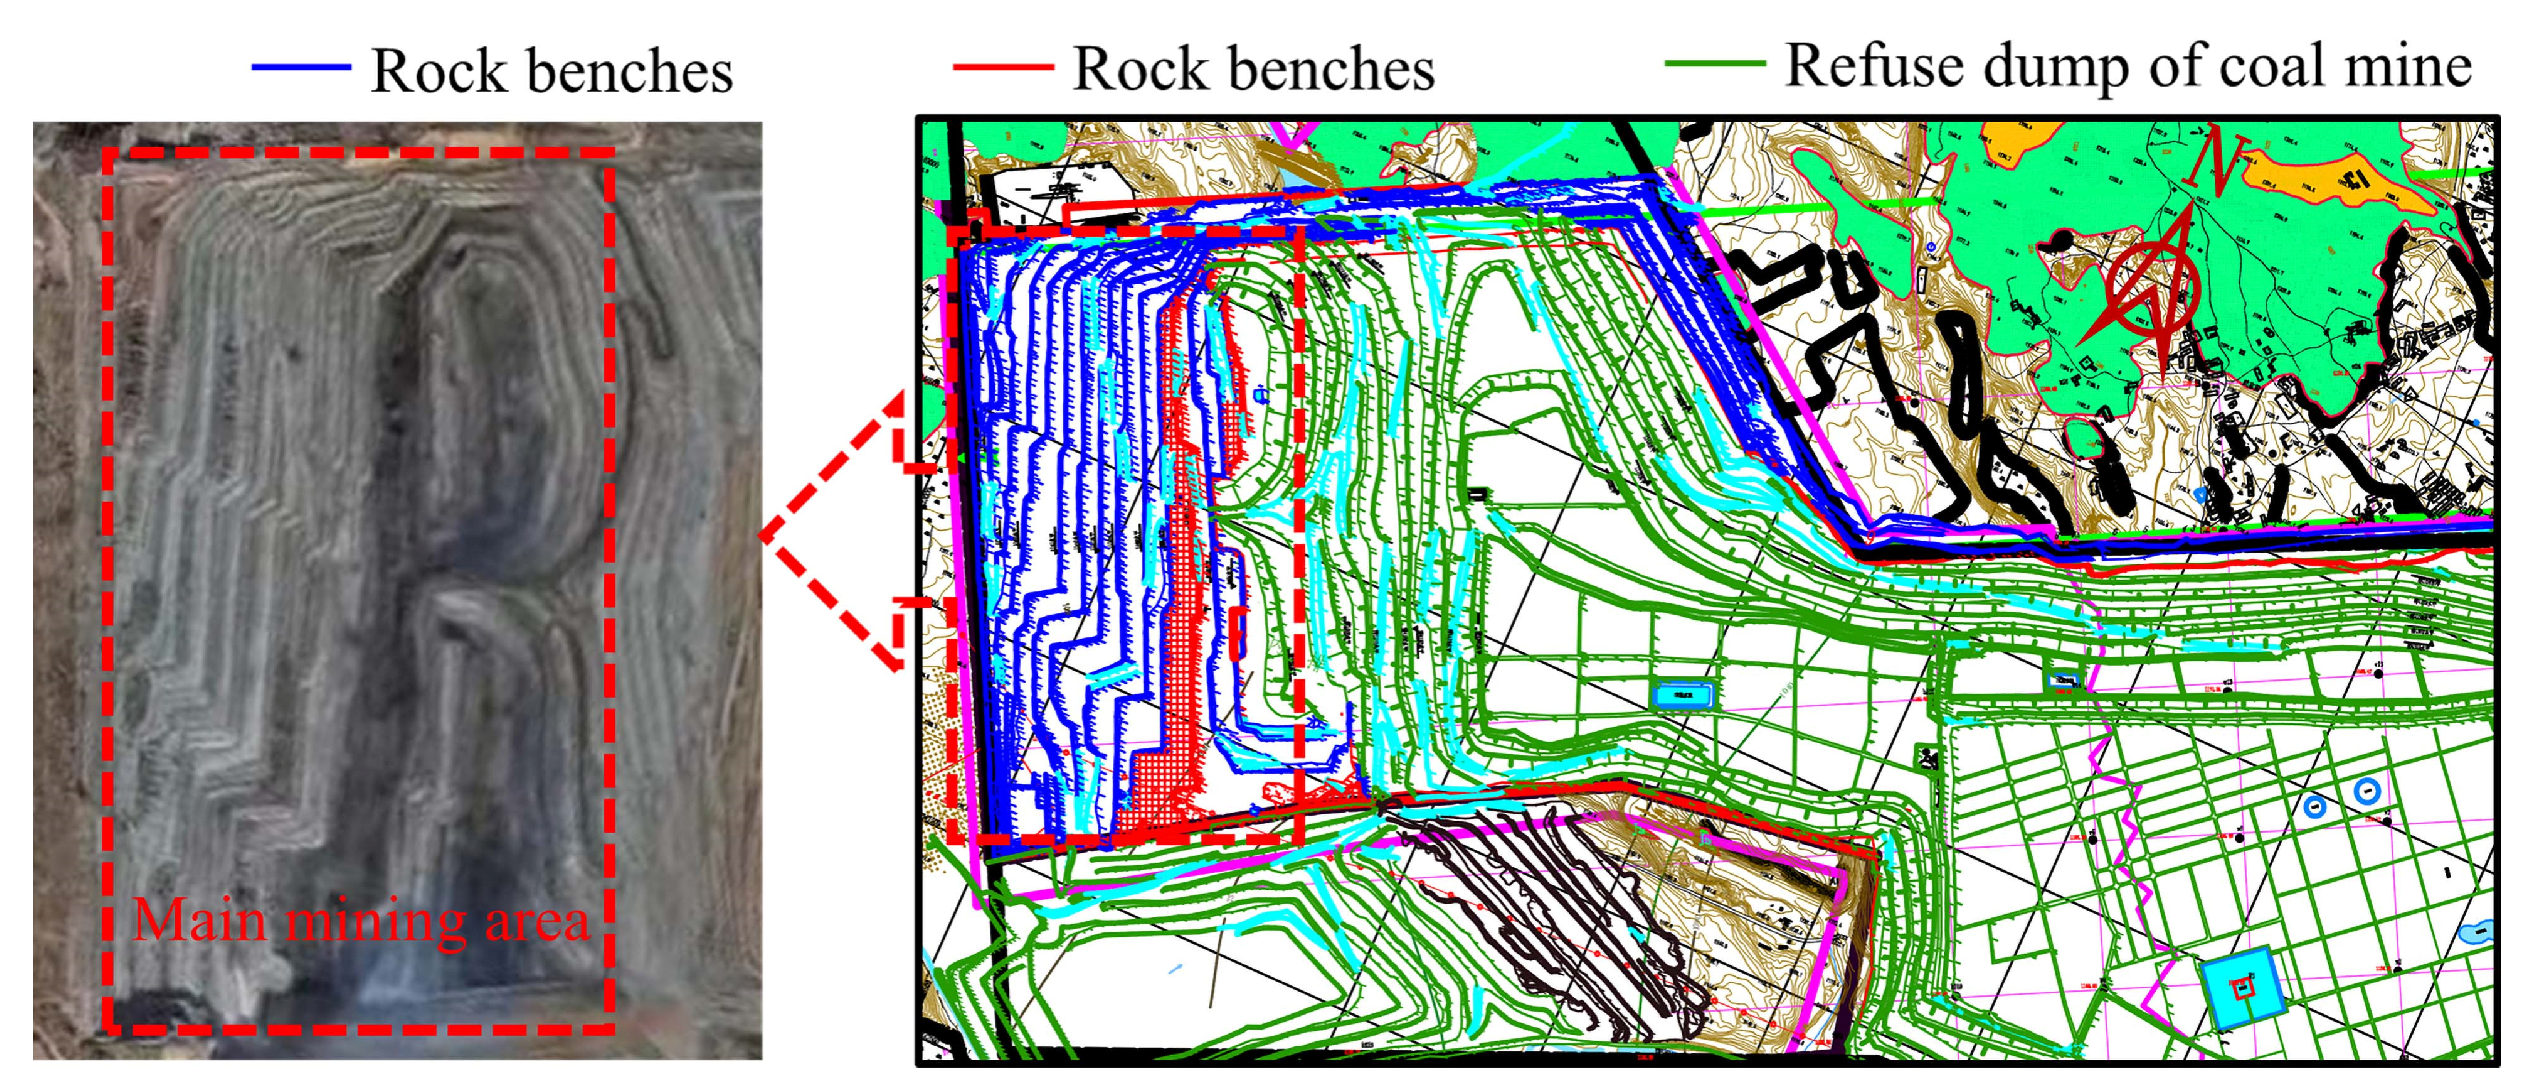
Figure 1. Mine plan.
Applsci 15 04521 g001
Figure 2. Orthogonal test design for blasting crater and parameters.
Applsci 15 04521 g002
Figure 3. Operational bench of the experiment.
Applsci 15 04521 g003
Figure 4. Typical coal and rock blast crater test results (partial).
Applsci 15 04521 g004
Figure 5. Statistical diagram of geometric parameters of coal bench crater.
Applsci 15 04521 g005
Figure 6. Statistical diagram of geometric parameters of rock bench crater.
Applsci 15 04521 g006
Figure 7. The characteristic curves of the coal and rock bench blast craters.
Applsci 15 04521 g007
Figure 8. Finite element calculation model and measurement point arrangement.
Applsci 15 04521 g008
Figure 9. Damage evolution of coal and rock mixed blasting with different fill lengths.
Applsci 15 04521 g009
Figure 10. Coal and rock mixed blasting damage with different charge structures (1).
Applsci 15 04521 g010
Figure 11. Rock damage curves at each measuring point.
Applsci 15 04521 g011
Figure 12. Coal and rock mixed blasting damage with different charge structures (2).
Applsci 15 04521 g012
Figure 13. Coal damage curves at each measuring point.
Applsci 15 04521 g013
Figure 14. SPH-FEM numerical calculation model.
Applsci 15 04521 g014
Figure 15. Effective strain cloud image of bench.
Applsci 15 04521 g015
Figure 16. Cloud map of coal bench damage.
Applsci 15 04521 g016
Figure 17. Coal and rock mixed blasting test site and parameter design.
Applsci 15 04521 g017
Figure 18. Blasting test results.
Applsci 15 04521 g018
Table 1. Occurrence conditions of the coal seams and their roof and floor rock layers.
Coal Seam IDCoal Seam Thickness DensityElastic ModulusCompressive StrengthTensile StrengthPoisson’s RatioRock Types of the Roof and Floor
(Average) (m) ρ (kg∙m−3) E (GPa) σ 1 (MPa) σ c (MPa) ν RoofFloor
#11.1~2.92 (1.06)12486.4218.371.970.27Sandy mudstoneFine sandstone
#24.5~10.2 (8.8)12756.8124.862.510.29Sandy mudstoneFine sandstone
#34.4~6.8 (5.8)13105.9421.071.990.27Fine sandstoneCoarse sandstone
Table 2. Parameters of blasting crater test.
BenchStep
Height
Borehole
Diameter
Cartridge
Diameter
Hole
Pitch
Row
Space
Hole DepthCharge QuantityCharge Length
H (m) D (mm) d (mm) a (m) b (m) L (m) Q (kg) l E (m)
Rock14.00 70.0070.05.07.01, 1.2,
1.4, 1.6
1.6, 1.8, 2.0,
2.2, 2.4, 2.6
0.36, 0.40, 0.45,
0.50, 0.54, 0.58
Coal6.00 70.00 70.0 5.07.01, 1.2,
1.4, 1.6
0.6, 0.8, 1.0,
1.2, 1.4, 1.6
0.13, 0.18, 0.22,
0.26, 0.31, 0.35
Table 3. Statistical results of coal and rock blasting crater experiments (part).
StratumTypeStatistics of Experimental Results
CoalBorehole depth (m)1.001.001.001.001.001.001.201.201.201.201.201.20
Charge specificationsC1C2C3C4C5C6C1C2C3C4C5C6
Filling height (m)0.870.820.780.740.690.651.071.020.980.940.890.85
Statistical volume (m3)2.544.285.556.367.328.112.323.794.386.527.738.77
Specific charge (kg∙m−3)0.240.190.180.190.190.200.260.210.230.180.180.18
Borehole depth (m)1.401.401.401.401.401.401.601.601.601.601.601.60
Charge specificationsC1C2C3C4C5C6C1C2C3C4C5C6
Filling height (m)1.271.221.181.141.091.051.471.421.381.341.291.25
Statistical volume (m3)--2.804.095.277.088.30----3.344.736.547.47
Specific charge (kg∙m−3)--0.290.240.230.200.19----0.300.250.210.21
RockBorehole depth (m)1.001.001.001.001.001.001.201.201.201.201.201.20
Charge specificationsR1R2R3R4R5R6R1R2R3R4R5R6
Filling height (m)0.650.600.560.520.470.430.850.800.760.720.670.63
Statistical volume (m3)3.654.745.936.777.066.284.935.746.457.197.768.35
Specific charge (kg∙m−3)0.440.380.340.330.340.410.320.310.310.310.310.31
Borehole depth (m)1.401.401.401.401.401.401.601.601.601.601.601.60
Charge specificationsR1R2R3R4R5R6R1R2R3R4R5R6
Filling height (m)1.051.000.960.920.870.831.251.201.161.121.071.03
Statistical volume (m3)4.585.516.006.567.107.854.225.455.826.975.847.04
Specific charge (kg∙m−3)0.350.330.330.340.340.330.380.330.340.320.410.37
Table 4. Model parameters.
Type ϕ (mm)RockCoal
Scheme H R (m) l S (m) l E (m) l S (m) H C (m) l Sc (m) l Ec (m) l Ic 2 (m) l Ic 1 (m)
117014.94.59.01.06.420.7150.82.17
217014.94.58.51.56.420.7150.82.17
3170144.58.02.06.420.7150.82.17
4170144.57.52.56.420.7150.82.17
5170144.57.03.06.420.7150.82.17
6170144.58.02.06.42.50.7150.81.67
7170144.58.02.06.43.00.7150.81.17
8170144.58.02.06.43.50.7150.80.67
Table 5. Parameters of the RHT model for sandstone and coal.
ParameterValueParameterValueParameterValue
RockCoalRockCoalRockCoal
ρ 0 (kg⋅m−3)23001310 β c 0.03680.0481 Q 0 0.680.61
G (GPa)11.761.93 G c * 0.530.35 B 0.010.0105
f c (MPa)34.421.07 G t * 0.70.45 A 2.11.6
T 1 (GPa)34.208.90 F t * 0.09420.0944 N 0.6370.61
B 0 1.221.68 F s * 0.210.18 N f 0.60.45
B 1 1.221.68 A 1 (GPa)34.198.90 A f 1.611.25
P crush (MPa)22.9314.05 A 2 (GPa)41.7214.96
β t 0.03250.0487 A 3 (GPa)8.779.14
Table 6. Explosive material parameters and *EOS_JWL parameters.
ρ 0 D PCJBETA K G SIGY A B R 1 R 2 ω E 0 V 0
(kg/m3)(m/s)(GPa) (Pa)(GPa)(GPa) (J/m3)
110042005.15000049.461.893.90771.1180.332.668 × 1091
Table 7. Model blasting parameters.
SchemeType H
(m)
D
(mm)
L
(m)
θ
(°)
a
(m)
b
(m)
q
(kg∙m−3)
L F (m) L E
(m)
L F
(m)
W
(m)
Charge
Form
UpDown
Rock1417014.9706.04.50.574.528.404.0coupled
S-1Coal61706.4706.04.50.182.00.80.7152.174.0interval
S-2Coal61706.4706.04.50.182.50.80.7151.674.0interval
S-3Coal61706.4706.04.50.183.00.80.7151.174.0interval
S-4Coal61706.4706.04.50.183.50.80.7150.674.0interval
Note: H : bench height, m; D : borehole diameter, mm; θ : borehole inclination angle, °; a : hole spacing, m; b : row spacing, m; q : specific charge, kg∙m−3; L F : fill length or interval length, m; L E : charge length, m; W : resistance line, m.
Table 8. On-site test blasting parameters.
SchemeType H
(m)
D
(mm)
L
(m)
θ
(°)
a
(m)
b
(m)
q
(kg∙m−3)
L F (m) L E
(m)
L F
(m)
W
UpDown
Rock1417014.9706.04.50.574.528.404.0
T-1Coal61706.4706.04.50.182.50.80.7151.674.0
T-2Coal61706.4706.04.50.183.00.80.7151.174.0
Disclaimer/Publisher’s Note: The statements, opinions and data contained in all publications are solely those of the individual author(s) and contributor(s) and not of MDPI and/or the editor(s). MDPI and/or the editor(s) disclaim responsibility for any injury to people or property resulting from any ideas, methods, instructions or products referred to in the content.