Article

Research on X-Ray Weld Defect Detection of Steel Pipes by Integrating ECA and EMA Dual Attention Mechanisms

1
School of Mechanical Engineering, Guangxi University, Nanning 530004, China
2
Natural Gas Branch of SINOPEC, Beijing 100029, China
*
Author to whom correspondence should be addressed.
Appl. Sci. 2025, 15(8), 4519; https://doi.org/10.3390/app15084519
Submission received: 1 March 2025 / Revised: 12 April 2025 / Accepted: 14 April 2025 / Published: 19 April 2025

Abstract

:
The welding quality of industrial pipelines directly impacts structural safety. X-ray non-destructive testing (NDT), known for its non-invasive and efficient characteristics, is widely used for weld defect detection. However, challenges such as low contrast between defects and background, as well as large variations in defect scales, reduce the accuracy of existing object detection models. To address these, an optimized detection model based on You Only Look Once (YOLO) v5 is proposed. Firstly, the Efficient Multi-Scale Attention (EMA) attention mechanism is integrated into the first Cross Stage Partial (C3) module of the backbone to enhance the model’s receptive field and the initial feature extraction. Secondly, the Efficient Channel Attention (ECA) attention mechanism is embedded before the Spatial Pyramaid Pooling Fast (SPPF) layer to enhance the model’s ability to extract small targets and key features. Finally, the Complete Intersection over Union (CIoU) loss is replaced with Wise Intersection over Union (WIoU) to improve localization accuracy and multi-scale detection performance. The experimental results show that the optimized model achieves a precision of 94.1%, a recall of 89.2%, and an mAP@0.5 of 94.6%, representing improvements by 11.5%, 5.4%, and 6.9%, respectively, over the original YOLOv5. The optimized model also outperforms several mainstream object detection models in weld defect detection. In terms of mAP@0.5, the optimized YOLOv5 model shows improvements of 14.89%, 13.02%, 6.1%, 19.37%, 7.1%, 7.5%, and 10.7% compared with the Faster-RCNN, SSD, RT-DETR, YOLOv3, YOLOv8, YOLOv9, and YOLOv10 models, respectively. This optimized model significantly enhances X-ray weld defect detection accuracy, meeting industrial application requirements and offering another high-precision solution for weld defect detection.

1. Introduction

Steel pipe welding technology is widely employed in chemical, petroleum, natural gas, nuclear, and shipbuilding industries. However, limited by factors such as welding processes and the welding characteristics of materials, defects including circular, linear, non-fusion, non-penetration, and crack defects inevitably occur in pipeline welds [1], which critically endanger pipeline transportation safety [2]. To ensure the quality of welded pipelines, X-ray is widely used to detect internal defects in steel pipes. The inspection results serve as a fundamental basis for analyzing weld defects and evaluating weld quality. Traditional manual inspection faces limitations in efficiency and accuracy when handling large-scale detection tasks due to subjective human judgment, equipment variability, and image quality constraints, which often result in false positives and missed detections. Recent advancements in artificial intelligence, particularly deep learning methodologies, have been progressively implemented in pipeline weld defect detection systems, significantly enhancing the automation and intelligence of both defect recognition and spatial localization processes [3,4].
The current object detection methodologies in artificial intelligence primarily fall into two categories: conventional neural network algorithms and deep learning-based Convolutional Neural Networks (CNN). Compared to traditional neural network algorithms, deep learning-based CNN architectures directly accept raw weld images as input and autonomously learn discriminative features of various weld defects through hierarchical representation learning. This paradigm eliminates the need for separate feature extraction, selection, and classification modules, enabling end-to-end intelligent recognition and localization of weld defects, from the original weld images to defect classification and localization [5]. Deep learning-based object detection models are broadly classified into two categories. Single-stage detectors (SSD [6,7], YOLO [8,9,10,11]) perform direct localization and classification through anchor point regression, offering computational efficiency at the cost of reduced accuracy. Conversely, two-stage models represented by Faster-RCNN first generate region proposals and then perform further classification and regression adjustments on these regions. These models achieve higher precision but are more computationally expensive, making them challenging to meet the real-time detection requirements of industrial applications.
With the development of deep learning-based object detection models, continuous improvements have been made to models applied to pipeline weld defect detection. The YOLO series models utilize regression principles to directly predict bounding box coordinates and target categories at different positions in the image. Through continuous improvements in each module, these models are progressively optimized in terms of detection speed, accuracy, and parameter efficiency. Xu et al. [12] integrated the Coordinate Attention (CA) mechanism, Scylla Intersection over Union (SIoU) loss function, and Flexible Rectified Linear Unit (FReLU) activation function into YOLOv5, significantly enhancing small object detection, spatial sensitivity under low sensitivity conditions, and global optimization capability. Cheng et al. [13] also implemented the Squeeze and Excitation (SE) attention mechanism in the backbone of YOLOv5 and replaced the Cross Stage Partial (C3) module with GhostBottleneck, achieving both lightweight characteristics and enhanced accuracy. Xu et al. [14] incorporated Le-HorBlock modules with the CA mechanism and SIoU loss function into YOLOv7, strengthening both feature extraction and representation capabilities, while reducing the flexibility of the loss function, thereby significantly lowering the miss detection rate compared to the original model. Notably, Wu et al. [15] augmented YOLOv8 with the Simple Attention Mechanism (SimAM) and WIoU loss function, replacing conventional convolutions with Focus modules, significantly improving the model’s weld defect detection performance. Models for weld defect detection in industrial pipelines must jointly consider accuracy, speed, and ease of deployment. While two-stage detectors (e.g., Faster R-CNN) and Transformer-based architectures (e.g., DETR) offer high accuracy, their large parameter sizes and slow inference speeds hinder their suitability for real-time industrial inspection. The YOLO series of models are known for effectively balancing accuracy and speed. As one of the most mature and high-performing variants [16,17], YOLOv5 features a lightweight architecture, fast inference, and high detection accuracy compared to other mainstream models. These strengths enable it to deliver excellent performance in industrial inspection tasks and contribute to its broad adoption in practical applications.
Given the challenges in practical weld defect detection scenarios, such as low contrast between the weld and the background in X-ray images, limited defect features, and large variation in the scale of defect targets [18], it is difficult for the YOLOv5 model to effectively extract weld defect features, resulting in suboptimal detection performance. To address these issues and meet industrial detection requirements, this study attempts to optimize the YOLOv5 model by integrating the Efficient Multi-Scale Attention (EMA) and Efficient Channel Attention (ECA) mechanism, and introducing the Wise Intersection over Union (WIoU) loss function to replace the Complete Intersection over Union (CIoU) loss function, aiming to achieve accurate and automatic detection of pipeline weld defects in complex scenarios.

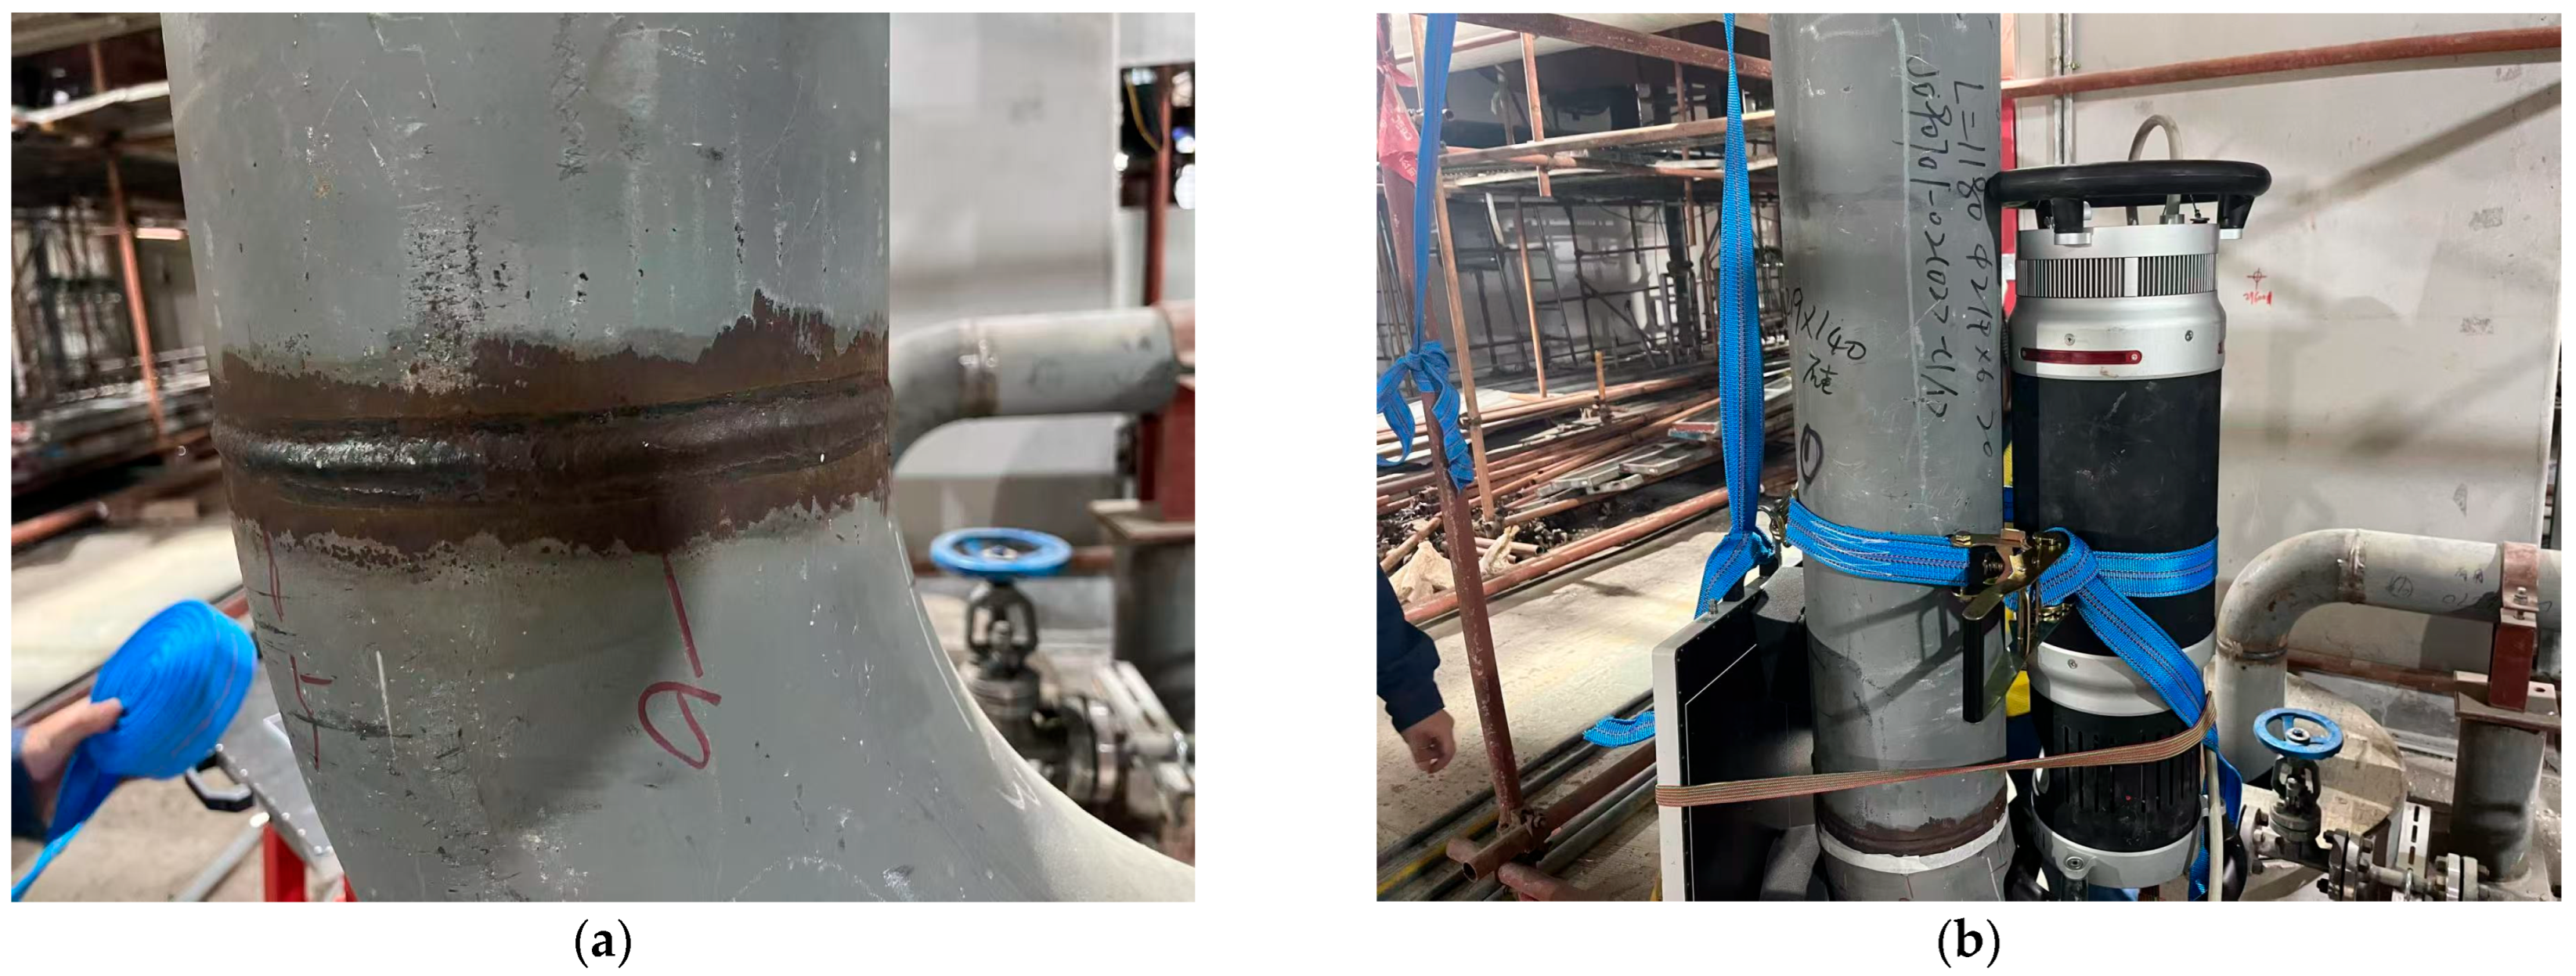
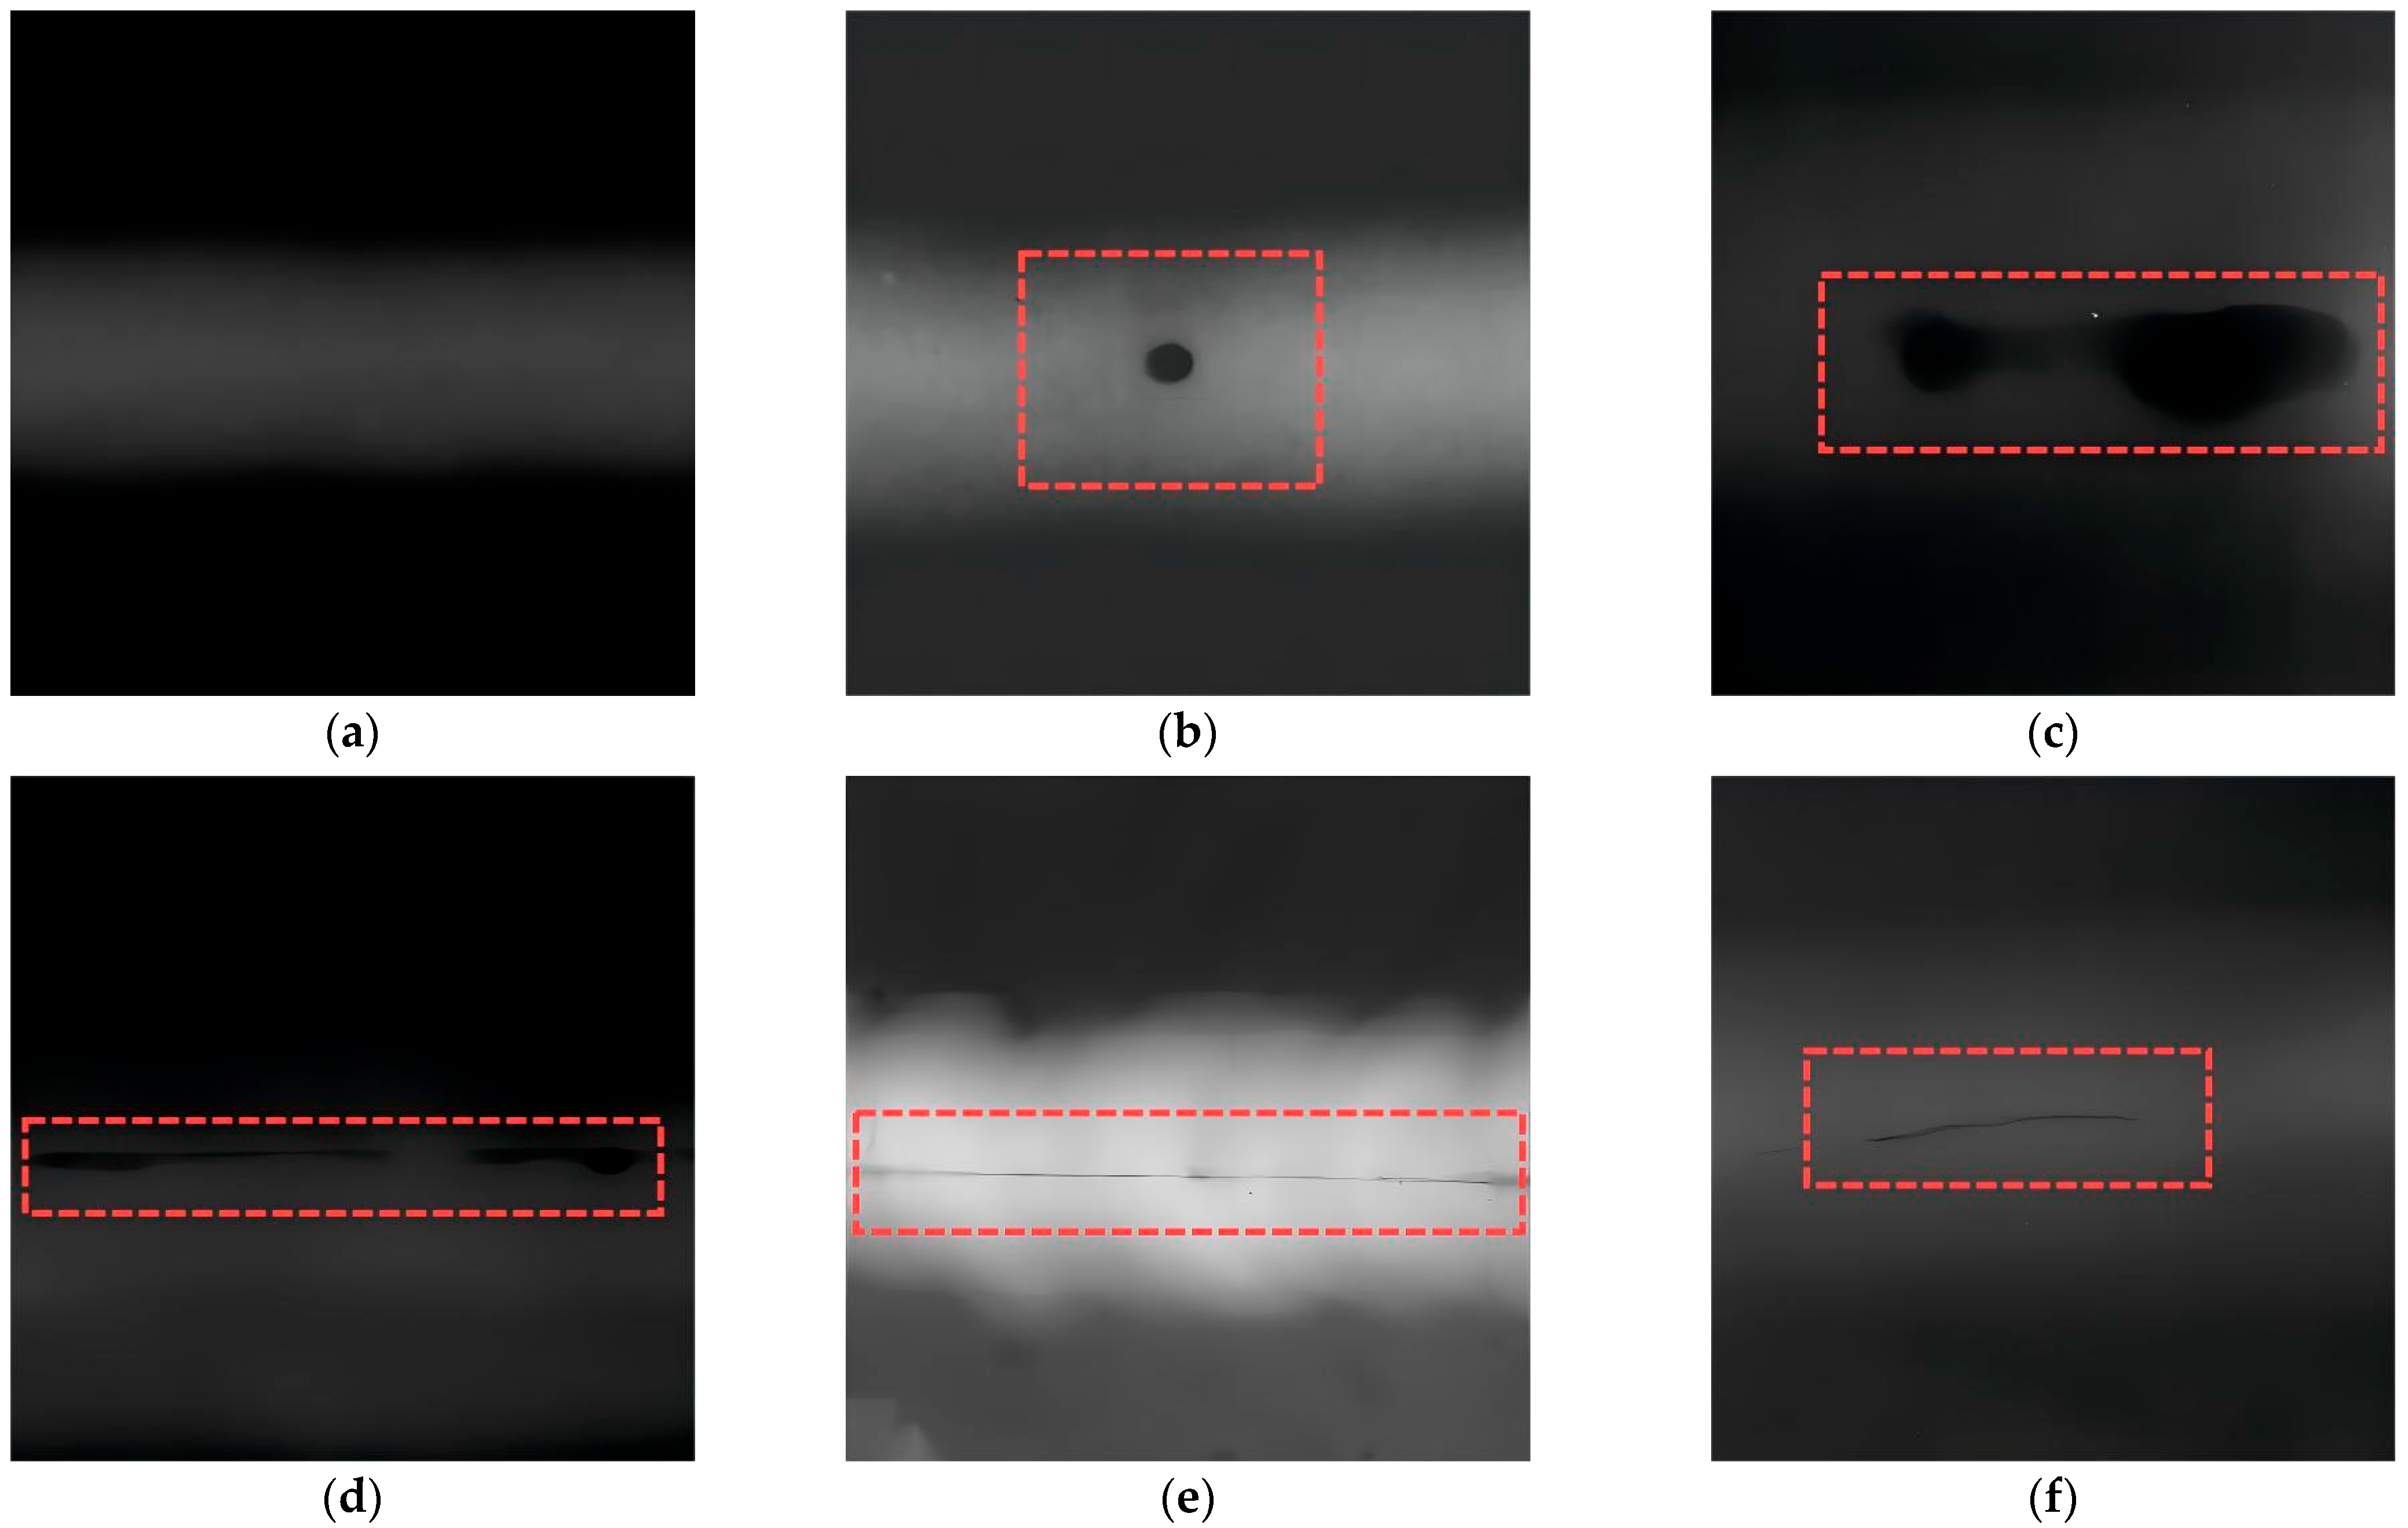
2. X-Ray Detection of Weld Defect Features and Dataset Construction

Weld defects in pipeline joints can lead to local thickness variations, causing differences in X-ray intensity transmission across different areas. This results in varying levels of blackness in the film or Digital Radiography (DR) image, allowing the X-ray detection system to identify whether defects exist at the weld joint. By analyzing the difference in Blackness Difference between a small region and its adjacent area, the presence of a defect at the weld can be determined. The X-ray weld defect images studied in this paper were obtained through on-site captures by the author and provided by the Guangxi Special Equipment Inspection and Research Institute. The dataset contains 1234 images, which include typical defects such as circular, linear, non-fusion, non-penetration, and crack defects, with some images containing multiple types of defects. The X-ray inspection equipment used for capturing weld defect images is shown in Figure 1.
Different defect types exhibit distinct characteristics in X-ray detection images, as shown in Figure 2: (1) circular defects appear as circular or elliptical dark spots, with an aspect ratio of less than or equal to 3; (2) linear defects appear as irregularly shaped dark strips or blocks, with an aspect ratio greater than 3; (3) non-fusion manifests as black lines or strips of varying width, usually located away from the center of the weld; (4) non-penetration appears as discontinuous or continuous black lines with neat contours on both sides, typically located in the middle of the weld; (5) cracks appear as sharp-contoured black lines or threads with fine serrations, generally thinner at the ends and wider at the center. The original image dataset comprises 572 images of circular defects, 396 images of linear defects, 200 images of non-fusion, 142 images of non-penetration, and 135 images of cracks. It was subsequently split into training, validation, and test subsets in a ratio of 8:1:1. To enhance the robustness of the model, each image in the divided dataset was augmented using three local data augmentation techniques: horizontal and vertical flipping, random rotation, and random scaling. After augmentation, the dataset consisted of 4936 defect-containing images. In addition, during model training, the Mosaic online data augmentation technique was employed. This method combines four images into one through stitching and blending, incorporating random rotation and scaling, which effectively increases the diversity of a single image and improves training efficiency. Defect types in all images were annotated using the MakeSense tool, with the labeling results independently validated by non-destructive testing (NDT) engineers from the Guangxi Institute of Special Equipment Inspection and Research.

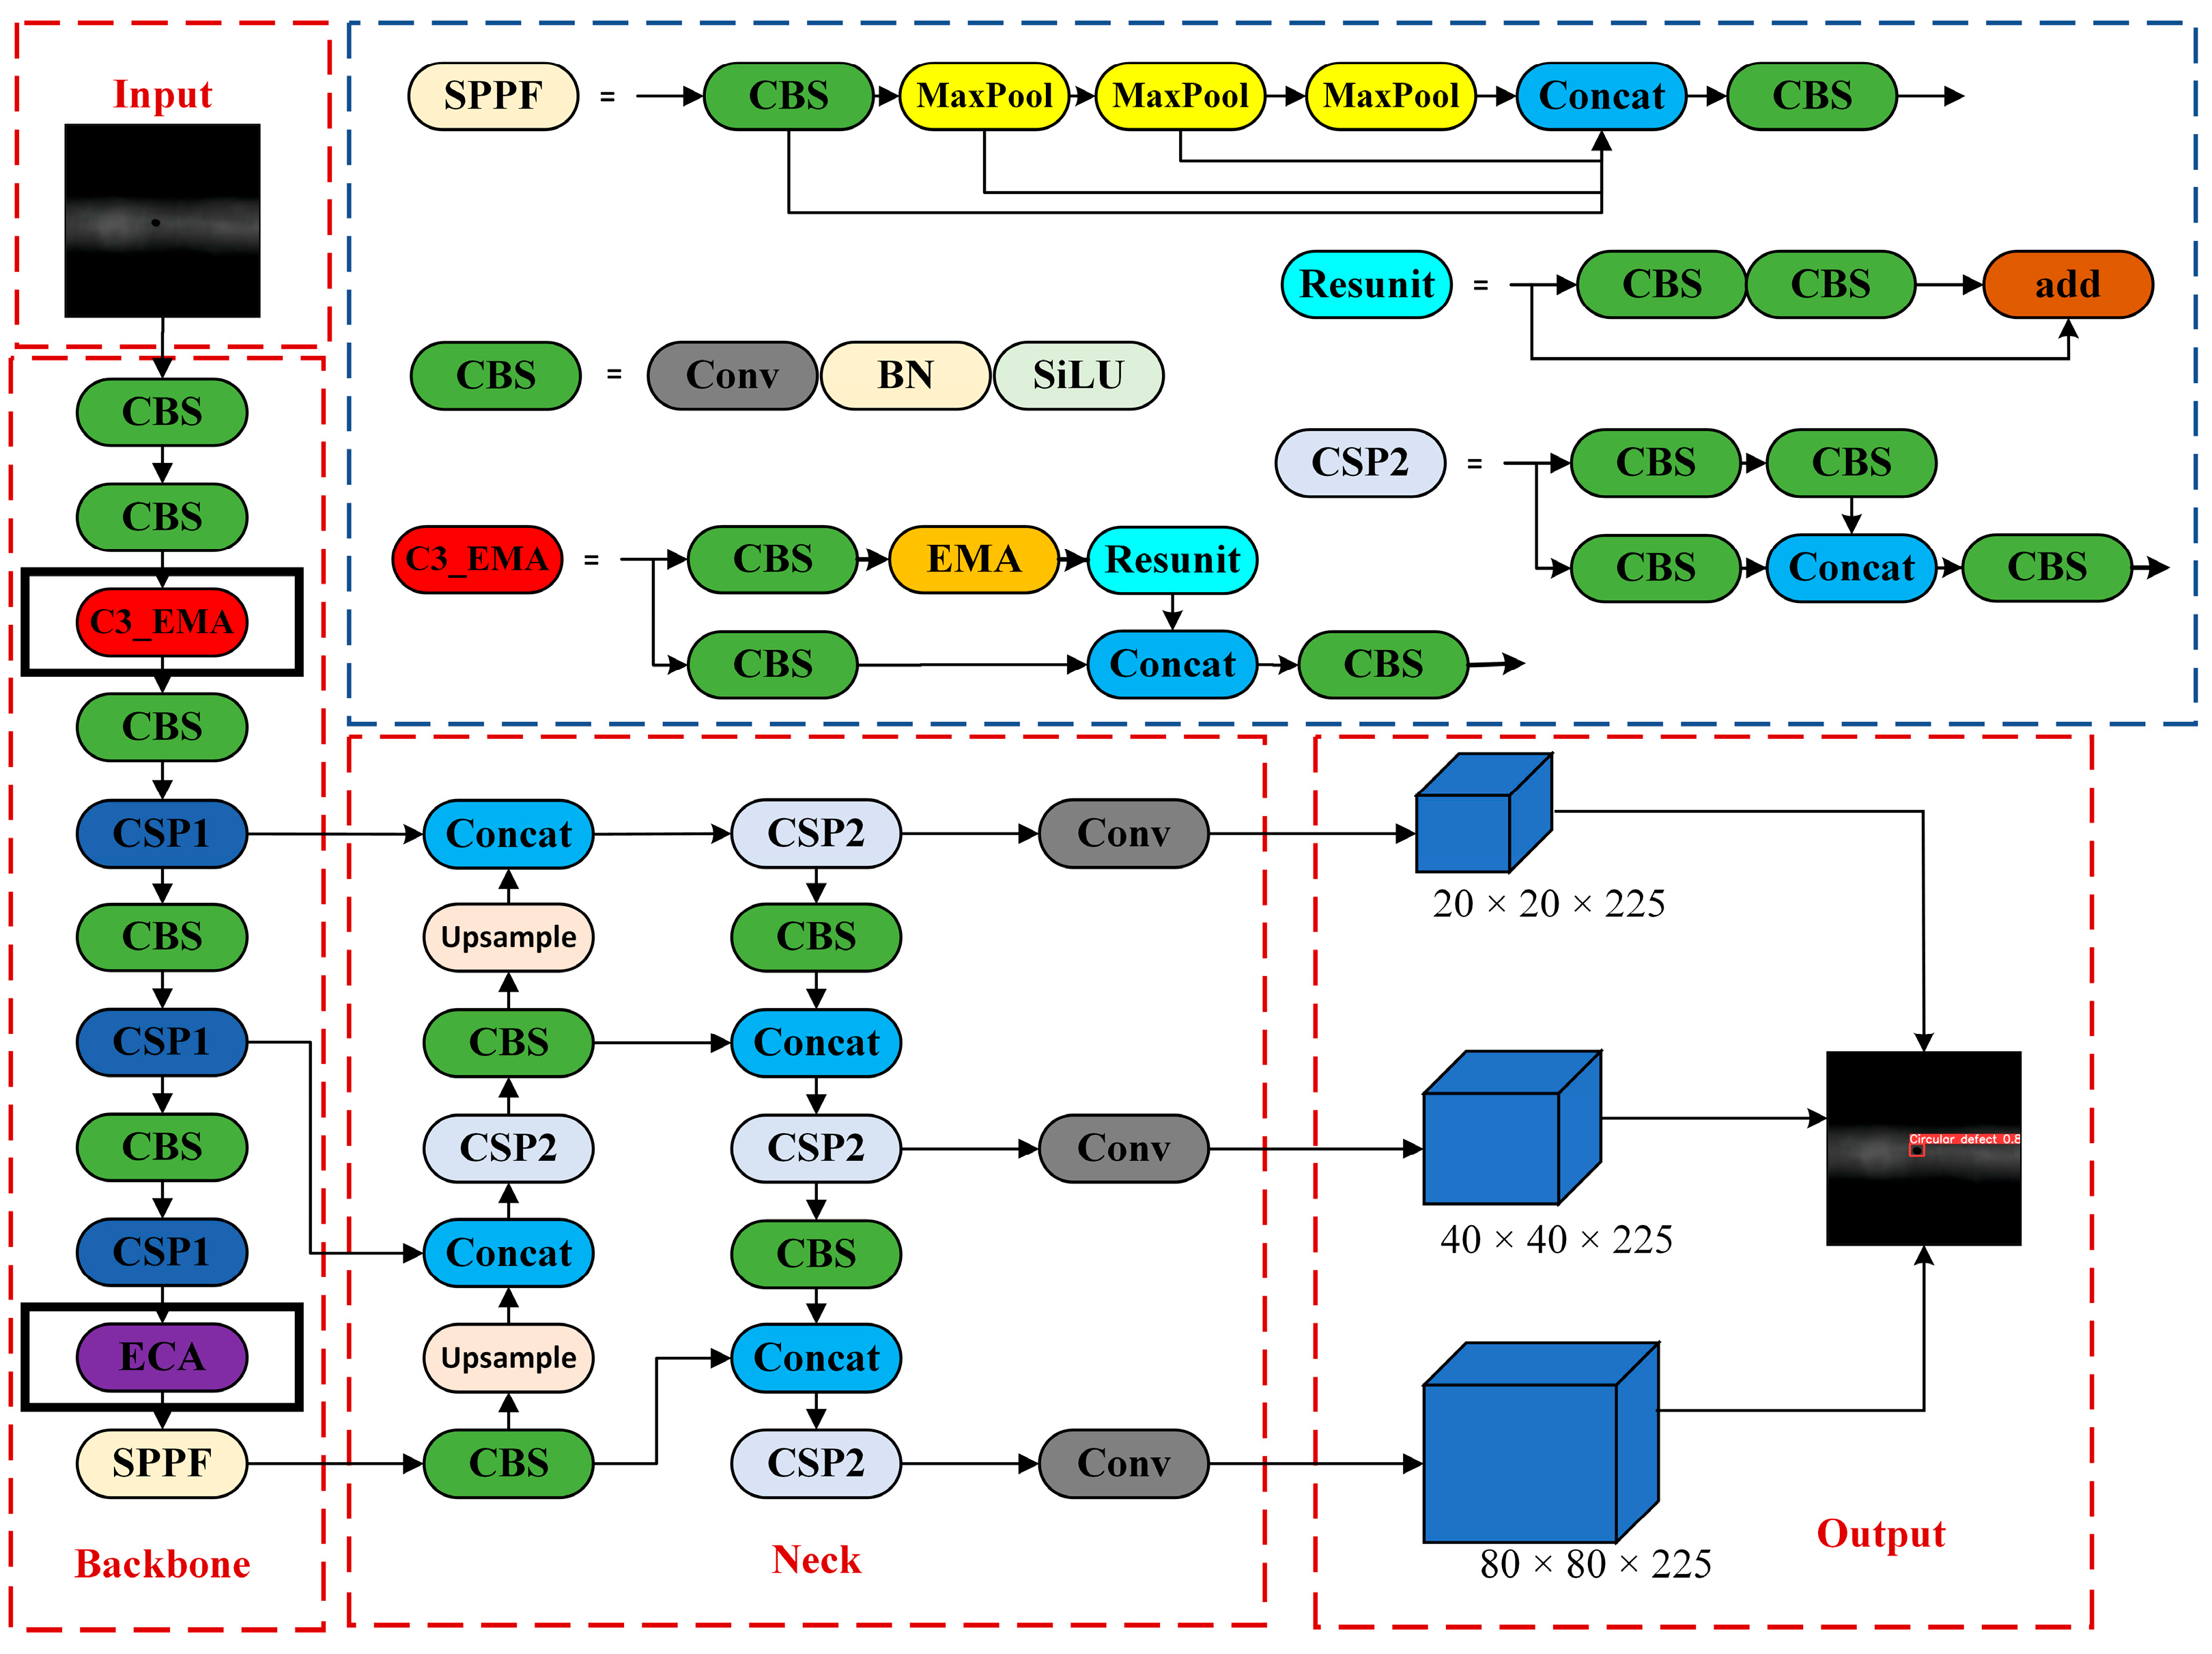
3. Establishment of YOLOv5-Based Optimized Detection Model and Evaluation Metrics

YOLOv5 is a single-stage object detection model consisting of four main components: input, backbone, neck, and head. The backbone incorporates several Cross Stage Bottleneck (CSB) modules, Cross Stage Partial (CSP) modules, and a Spatial Pyramid Pooling Fast (SPPF) module. The CSB module is composed of convolutional layers, batch normalization (BN), and the SiLU activation function. The model performs convolution operations directly on the entire image to predict the presence and bounding boxes of objects at each location in the feature map, enabling faster object detection compared to multi-stage approaches. However, due to the low contrast, significant large size variations, and complex shapes of defects in X-ray weld images, the detection accuracy of defects using YOLOv5 is relatively low. To address these issues, three key improvements have been made to the YOLOv5 model. The location where the attention mechanisms are incorporated is highlighted with solid black lines in the architecture diagram, as shown in Figure 3. Specifically, the modifications are as follows: (1) The EMA attention mechanism is integrated into the first C3 module of the backbone to enhance the model’s receptive field and improve its initial feature representation [19,20]; (2) The ECA attention mechanism is added before the SPPF layer to improve the model’s ability to extract small targets and key features [21,22]; (3) the WIoU loss function replaces the CIoU loss function to enhance the model’s localization accuracy and improve its multi-scale target recognition capabilities [23,24].

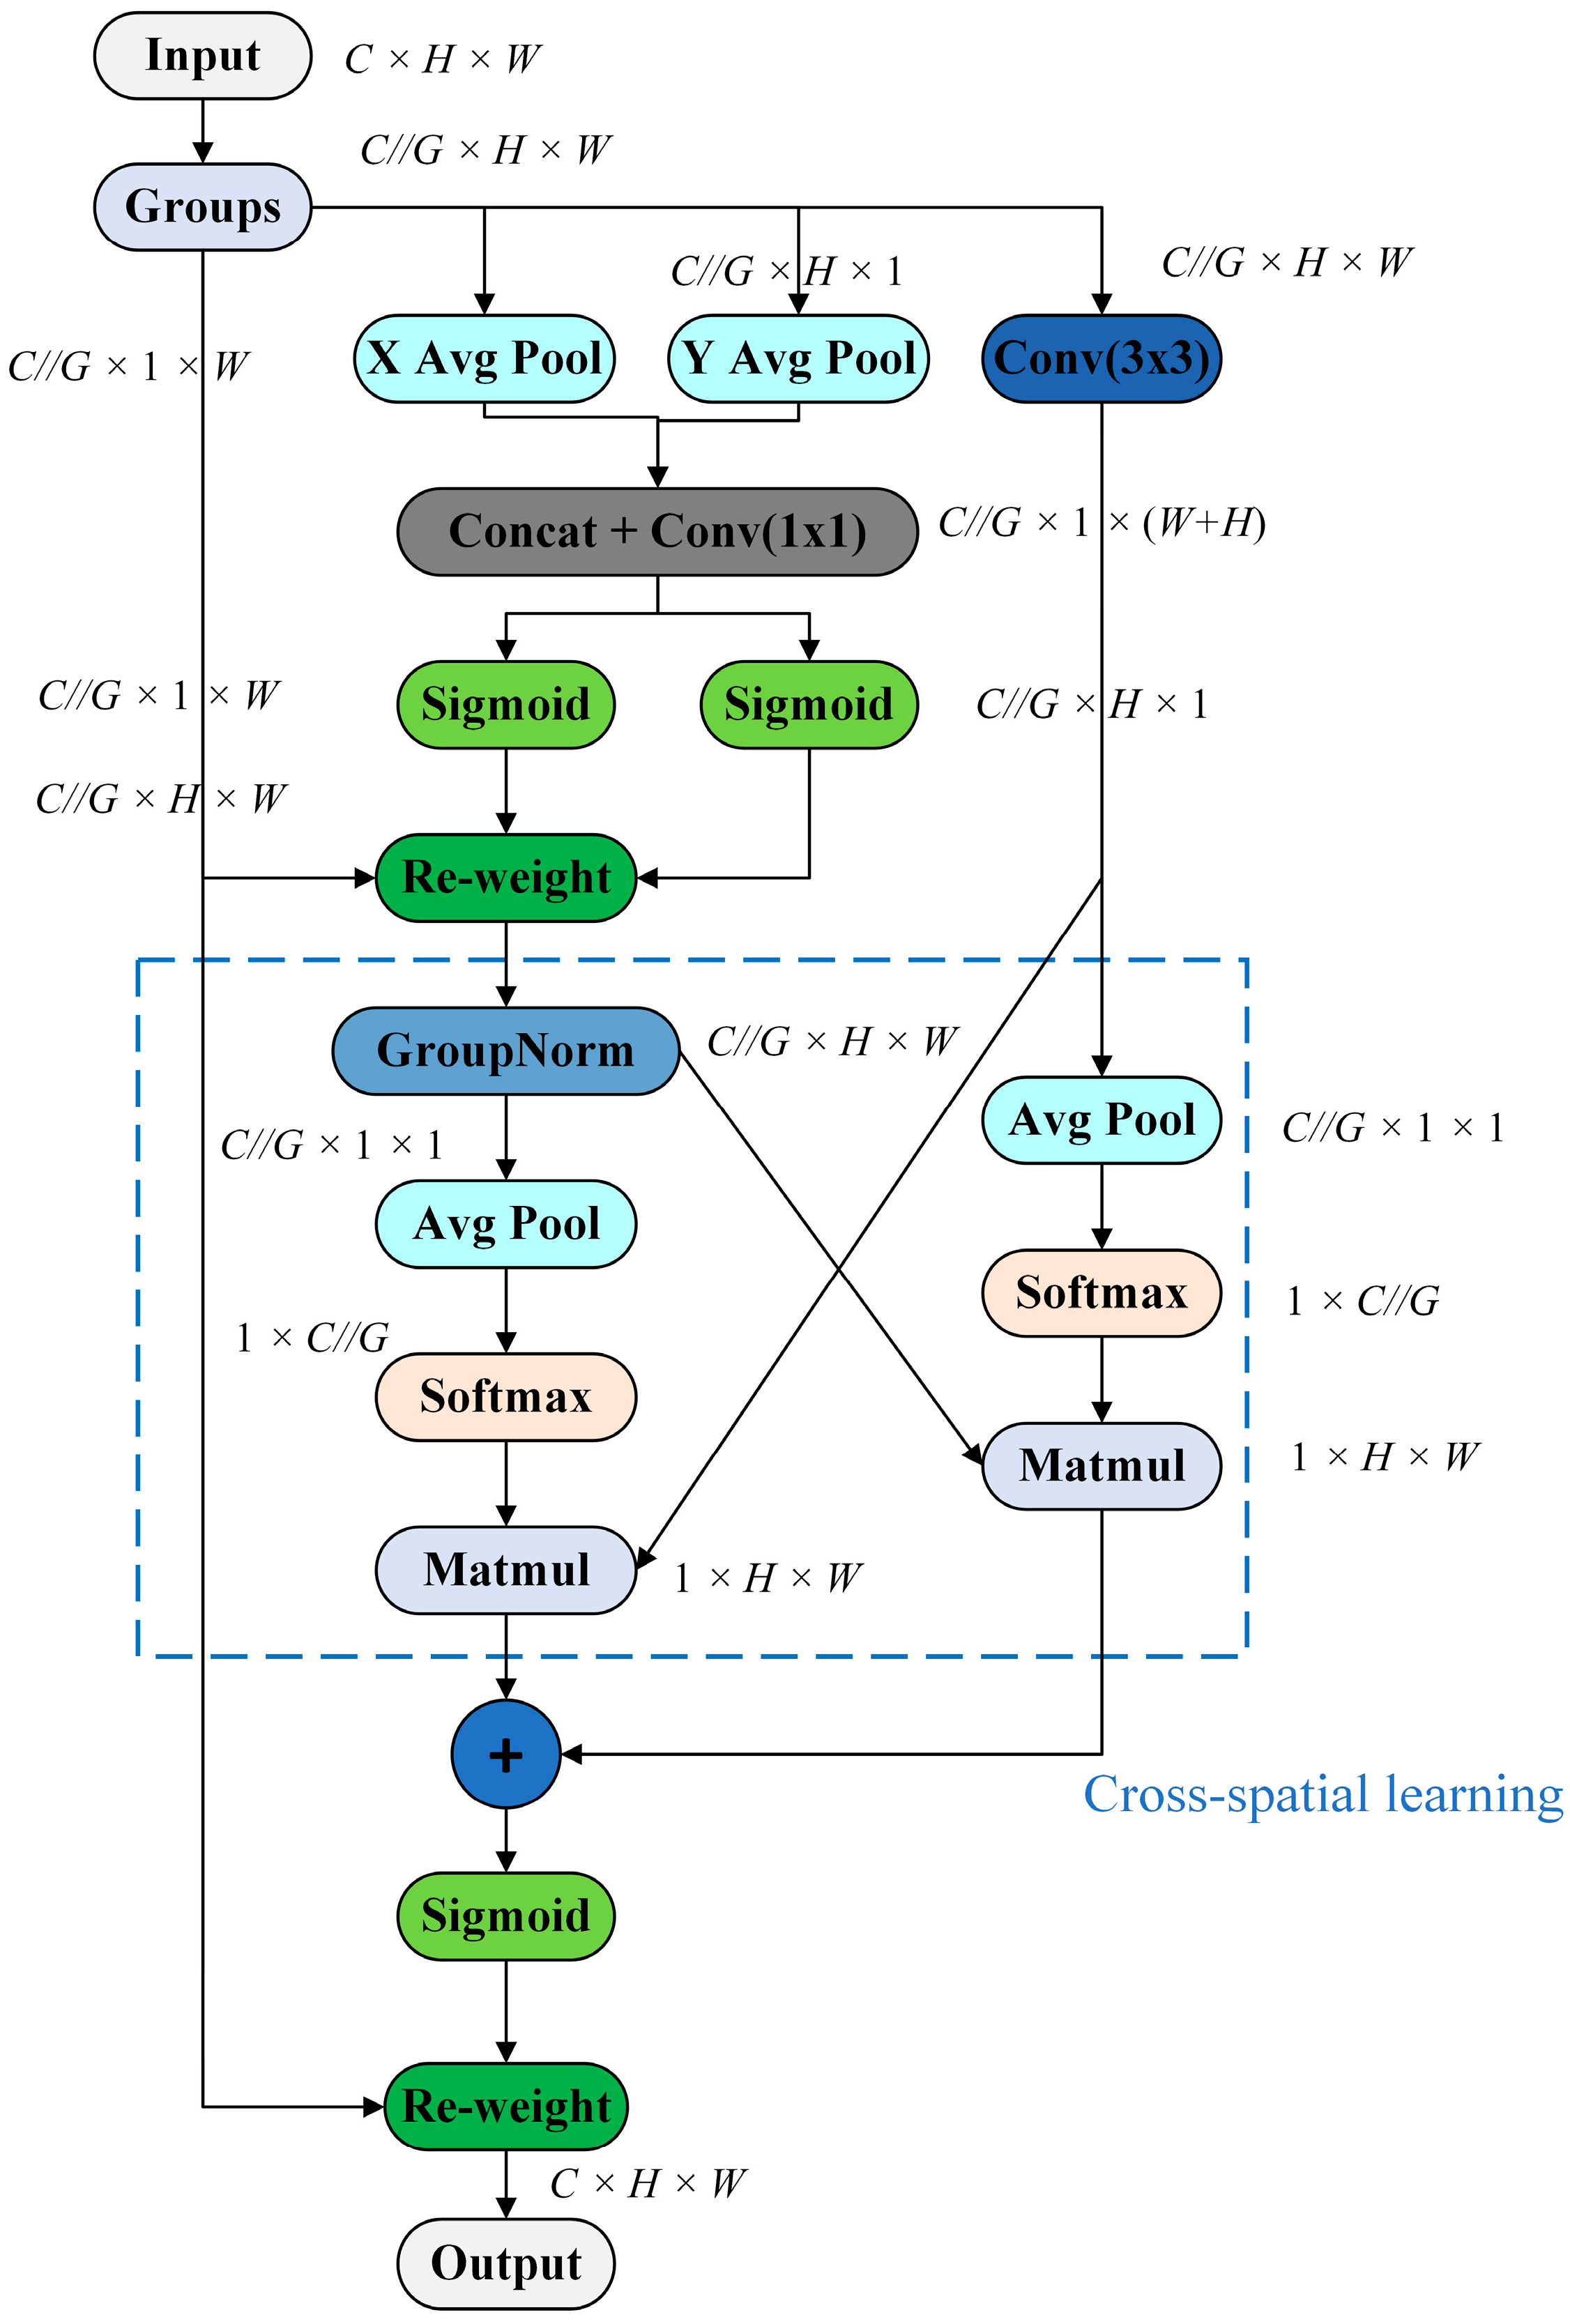
3.1. Efficient Multi-Scale Attention (EMA) Mechanism

To address the challenges in weld images, such as the wide variation in defect sizes and the subtle nature of defect regions, EMA is introduced to dynamically assign weights to the critical areas in the feature maps, thereby enhancing detection accuracy. The overall structure of the EMA model is shown in Figure 4. By reshaping part of the channel dimensions into the batch and cross-dimensional interactions, it avoids channel dimensionality reduction, effectively retaining the information from each channel.
Initially, the input feature X ∈ RC×H×W is divided into G sub-features along the channel dimension, where X = [X0, Xi, …, XG-1], and Xi ∈ RC//G×H×W. Here, H and W represent the height and width of the image, and C represents the number of channels. To maintain generality, G is chosen to be much smaller than C, and the learned attention weights are used to strengthen the feature representation of the areas of interest in each sub-feature. Then, to enable the local receptive field of neurons to capture multi-scale spatial information, EMA uses three parallel branches to extract attention weights from the grouped feature maps. These branches include two parallel 1 × 1 convolution branches and one 3 × 3 convolution branch. The first two branches use adaptive 1D horizontal global pooling and 1D vertical global pooling to encode the channels. The encoded channel features are processed with 1 × 1 convolutions to capture cross-channel interaction information, and the Sigmoid activation function is used for feature selection. The third 3 × 3 convolutional branch skips normalization and average pooling to capture local cross-channel interaction features, thereby expanding the feature space. The cross-space learning part encodes global spatial information through 2D global average pooling, which essentially performs mean aggregation across spatial dimensions, as follows:
Z c = 1 H × W j = 1 H i = 1 W x c i , j
where Zc represents the output features of the channel with index c after pooling; xc (i, j) represents the input features of the channel with index c with a width of i and a height of j.
Additionally, a Softmax operation is applied to the pooled feature map to normalize the outputs, converting the response values for each class into a probability distribution. Cross-space learning extends the feature space through three branches to achieve aggregation of cross-space information, building short- and long-term dependencies of the information. To adapt to changes in the defect detection box scale, EMA is integrated into the first C3 module of the backbone network, forming the C3_EMA module. This effectively combines the advantages of both, enabling it to handle complex local features while also capturing and understanding the global contextual information. Therefore, this method can dynamically adjust feature attention across various scales and types of weld defects, enhancing multi-scale object detection capability, making it highly suitable for weld defect detection.

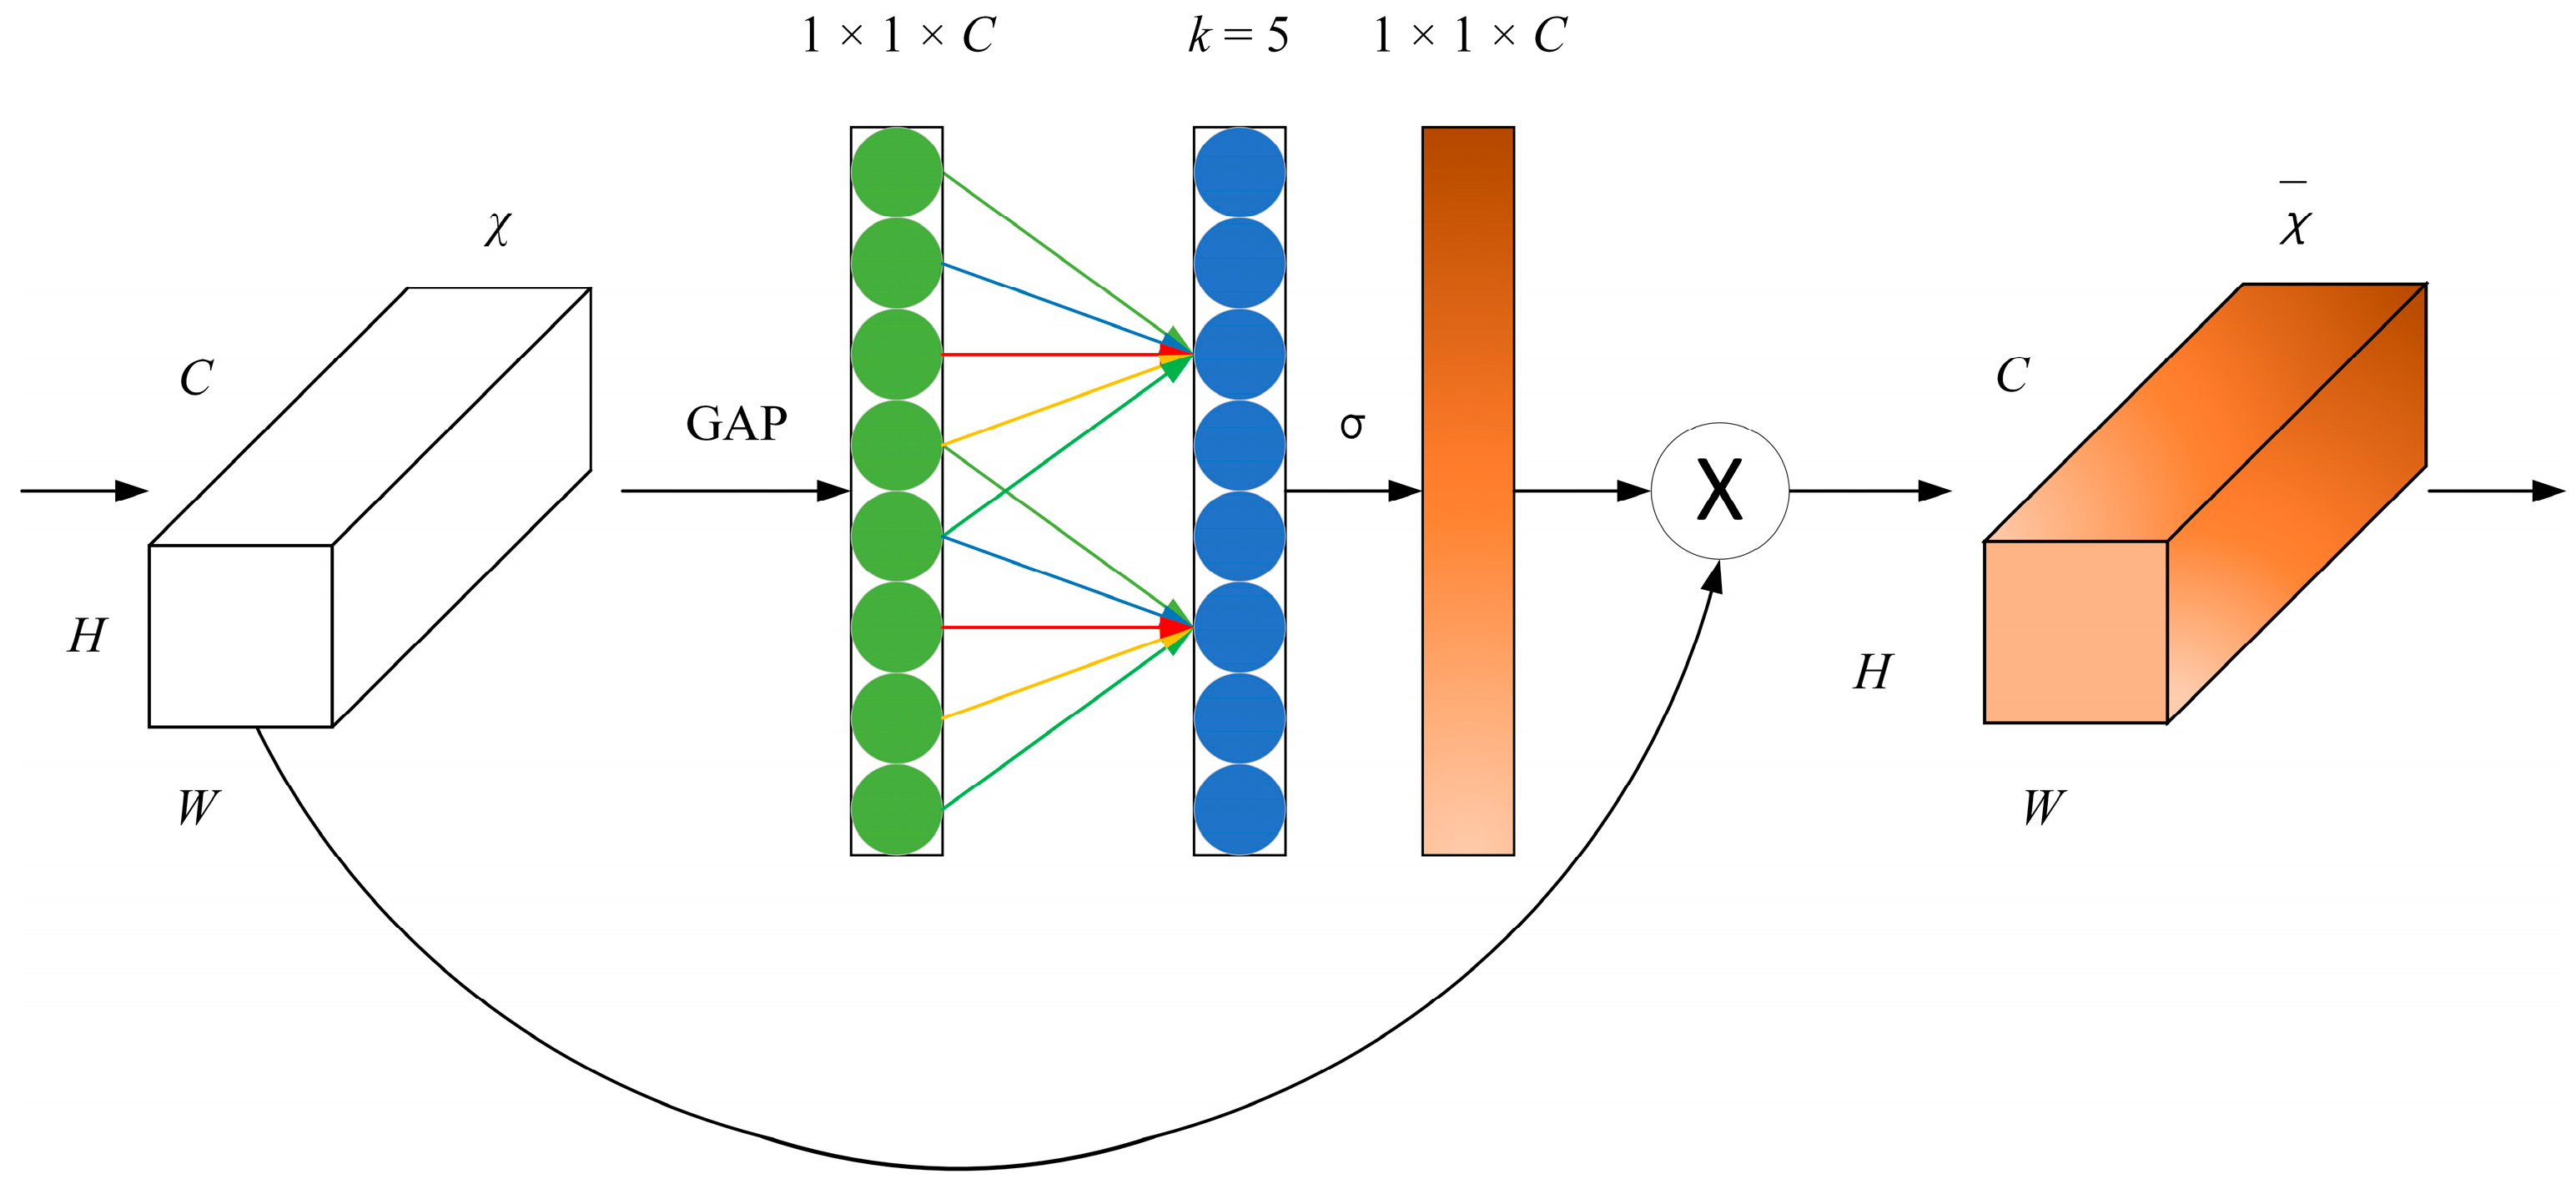
3.2. Efficient Channel Attention (ECA) Mechanism

To address the challenges in weld images, such as small defect sizes and low contrast, the ECA mechanism is introduced to automatically adjust the weights of each channel, highlighting key weld defect features while suppressing irrelevant information. The overall structure of the ECA model is shown in Figure 5. It captures cross-channel interactions and nonlinear information through an adaptive selection of a convolutional kernel of size k, using a one-dimensional convolution instead of a fully connected layer. This approach reduces the number of parameters and computational complexity while maintaining the original dimensionality. Initially, a global average pooling operation is applied to the input feature map of size H × W × C, aggregating the information of each channel into a single value, resulting in a 1 × 1 × C feature map with the same number of channels, without any dimensionality reduction. Then, local interactions are performed through a one-dimensional convolution along the channel dimension, where the kernel size k is adaptively adjusted based on the number of channels φ(C), as follows:
k = φ C = log 2 C γ + b γ o d d
where |t|odd represents the nearest odd number of t. In this paper, the adjustment factors γ and b are set to 2 and 1, respectively.
This allows each channel to interact with the channels in its local neighborhood, capturing finer dependencies between channels. After the one-dimensional convolution, attention weights are obtained, representing the importance of each channel in the feature vector. Finally, the computed weights are remapped to the channels of the original feature map, and channel-wise multiplication is applied for weighting, enhancing useful channel features and suppressing irrelevant ones, resulting in a new feature map of size H × W × C. Incorporating the ECA attention mechanism into the layer preceding the SPPF effectively distinguishes between background and defect target features, enhancing the ability to extract detail features related to defects while simultaneously optimizing the feature fusion process. Therefore, this method can highlight the features of defect regions and reduce interference caused by low contrast or background noise, especially demonstrating remarkable performance in detecting low-quality weld images.

3.3. Improvement of the Loss Function

The default CIoU loss function in YOLOv5, while considering the distance between the center points of the ground truth and predicted boxes as well as the aspect ratio of the bounding boxes, fails to penalize the width and height mismatch when the aspect ratios of the predicted and ground truth boxes are the same. This results in the aspect ratio penalty term having no effect, thereby limiting further optimization of the model. In practical weld defect detection, the CIoU loss function often has limitations when dealing with small targets, complex-shaped defects, and background noise. Considering that the WIoU loss function uses a dynamic non-monotonic focusing mechanism, it enables the model to flexibly focus on relevant anchor boxes by dynamically adjusting attention across different anchor boxes. This mechanism not only improves the model’s convergence accuracy and overall performance but also enhances its adaptability to variations in defect target scales and the presence of background noise. Therefore, the WIoU loss function is used as a replacement for the CIoU loss function. The WIoU loss function uses the outlier degree β instead of IoU to assess the quality of the predicted boxes. The WIoU loss function has three versions: v1, v2, and v3. Given the prevalence of low-quality samples in pipeline weld defect images, version v3 is adopted in this study due to its adaptive training strategy, which effectively balances the learning of hard and easy samples, resulting in the best overall performance. The expression of the WIoU-v3 loss function and the parameter β is as follows:
L W I o U = r R W I o U L I o U
r = β δ α β δ
R W I o U = exp ( ( x x g t ) 2 + ( y y g t ) 2 ( W g 2 + H g 2 ) * )
L I o U = 1 I o U = 1 W i H i w h + w g t h g t W i H i
β = L I o U * L I o U [ 0 , + )
where LWIoU represents the WIoU loss function; r is the dynamic non-monotonic focusing factor; RWIoU ∈ [0, 1) is the penalty term of WIoU, representing distance attention; LIoU ∈ [0, 1] is the IoU loss function, representing the ratio of the intersection between the ground truth box and the predicted box; δ and α are hyperparameters set to 3 and 1.9, respectively [23]; x and y are the horizontal and vertical coordinates of the top-left corner of the predicted box, respectively; xgt and ygt are the horizontal and vertical coordinates of the top-left corner of the ground truth box, respectively; Wg and Hg represent the width and height of the minimum enclosing box, respectively; w and h represent the width and height of the predicted box, respectively; wgt and hgt represent the width and height of the ground truth box, respectively; L I o U is the mean of L I o U across the batch; L I o U * is the result obtained after separation.
The smaller β indicates a higher quality of the anchor box. Since L I o U is dynamically changing, the criteria for classifying anchor box quality are also dynamic. Therefore, the WIoU loss function can adaptively adjust the gradient gain distribution strategy, enhancing overall detection performance.

3.4. Model Evaluation Index

In practical detection, common metrics such as Precision, Recall, Average Precision (AP), and mean Average Precision (mAP) are used to evaluate the model.
Precision refers to the proportion of correctly predicted positive samples out of all samples identified as positive. Its expression is shown in Equation (8):
Precision = T P T P + F P
where TP is the number of true positive samples correctly predicted as positive, and FP is the number of false positive samples incorrectly predicted as positive.
Recall refers to the proportion of correctly identified positive samples out of all actual positive samples. Its expression is shown in Equation (9):
Recall = T P T P + F N
where FN is the number of false negative samples incorrectly predicted as negative.
Average Precision refers to the mean value of recall for each detection, and its value is equal to the area under the Precision–Recall (P-R) curve. Its expression is shown in Equation (10):
AP = p r i r
where Pri is the precision value corresponding to r on the P-R curve, and ∑r = 1 indicates the summation over all recall values.
Mean Average Precision refers to the average value of AP calculated across all classes. Its expression is shown in Equation (11):
mAP = AP num _ classes
where mAP ∈ [0, 1], and the closer its value is to 1, the better the performance; num_classes represents the number of classes.

4. Experiments and Result Analysis

4.1. Experimental Procedure and Experimental Setup

After constructing the model, both the improved YOLOv5 model and the original YOLOv5 model were trained and tested on the weld seam defect dataset developed in this study, and the results were compared. To mitigate the adverse effects of data imbalance, such as gradient dominance, distortion of evaluation metrics during training, and prediction bias or decision boundary shift in classification tasks, this study adopts a transfer learning strategy. Specifically, the model is first pre-trained on the ImageNet dataset, which is large-scale and features a balanced class distribution, allowing it to learn generalizable visual representations while reducing the risk of bias toward specific defect types. The pre-trained weights are then transferred to the weld defect dataset used in this study, followed by fine-tuning to adapt the model to the target task. This approach provides high-quality initial parameters, thereby effectively alleviating performance degradation caused by data imbalance.
The experimental setup for this study is as follows: the operating system is Windows 10, the CPU is a 14 vCPU Intel(R) Xeon(R) Gold 6330 CPU @ 2.00 GHz, the GPU is an NVIDIA GeForce RTX 3090, the Python compiler version is Python 3.8.19, the deep learning framework is PyTorch 1.11.0, and the CUDA version is CUDA 11.3. During the training phase, the learning rate is set to 0.01, the number of training epochs is set to 300, and the batch size is set to 4.

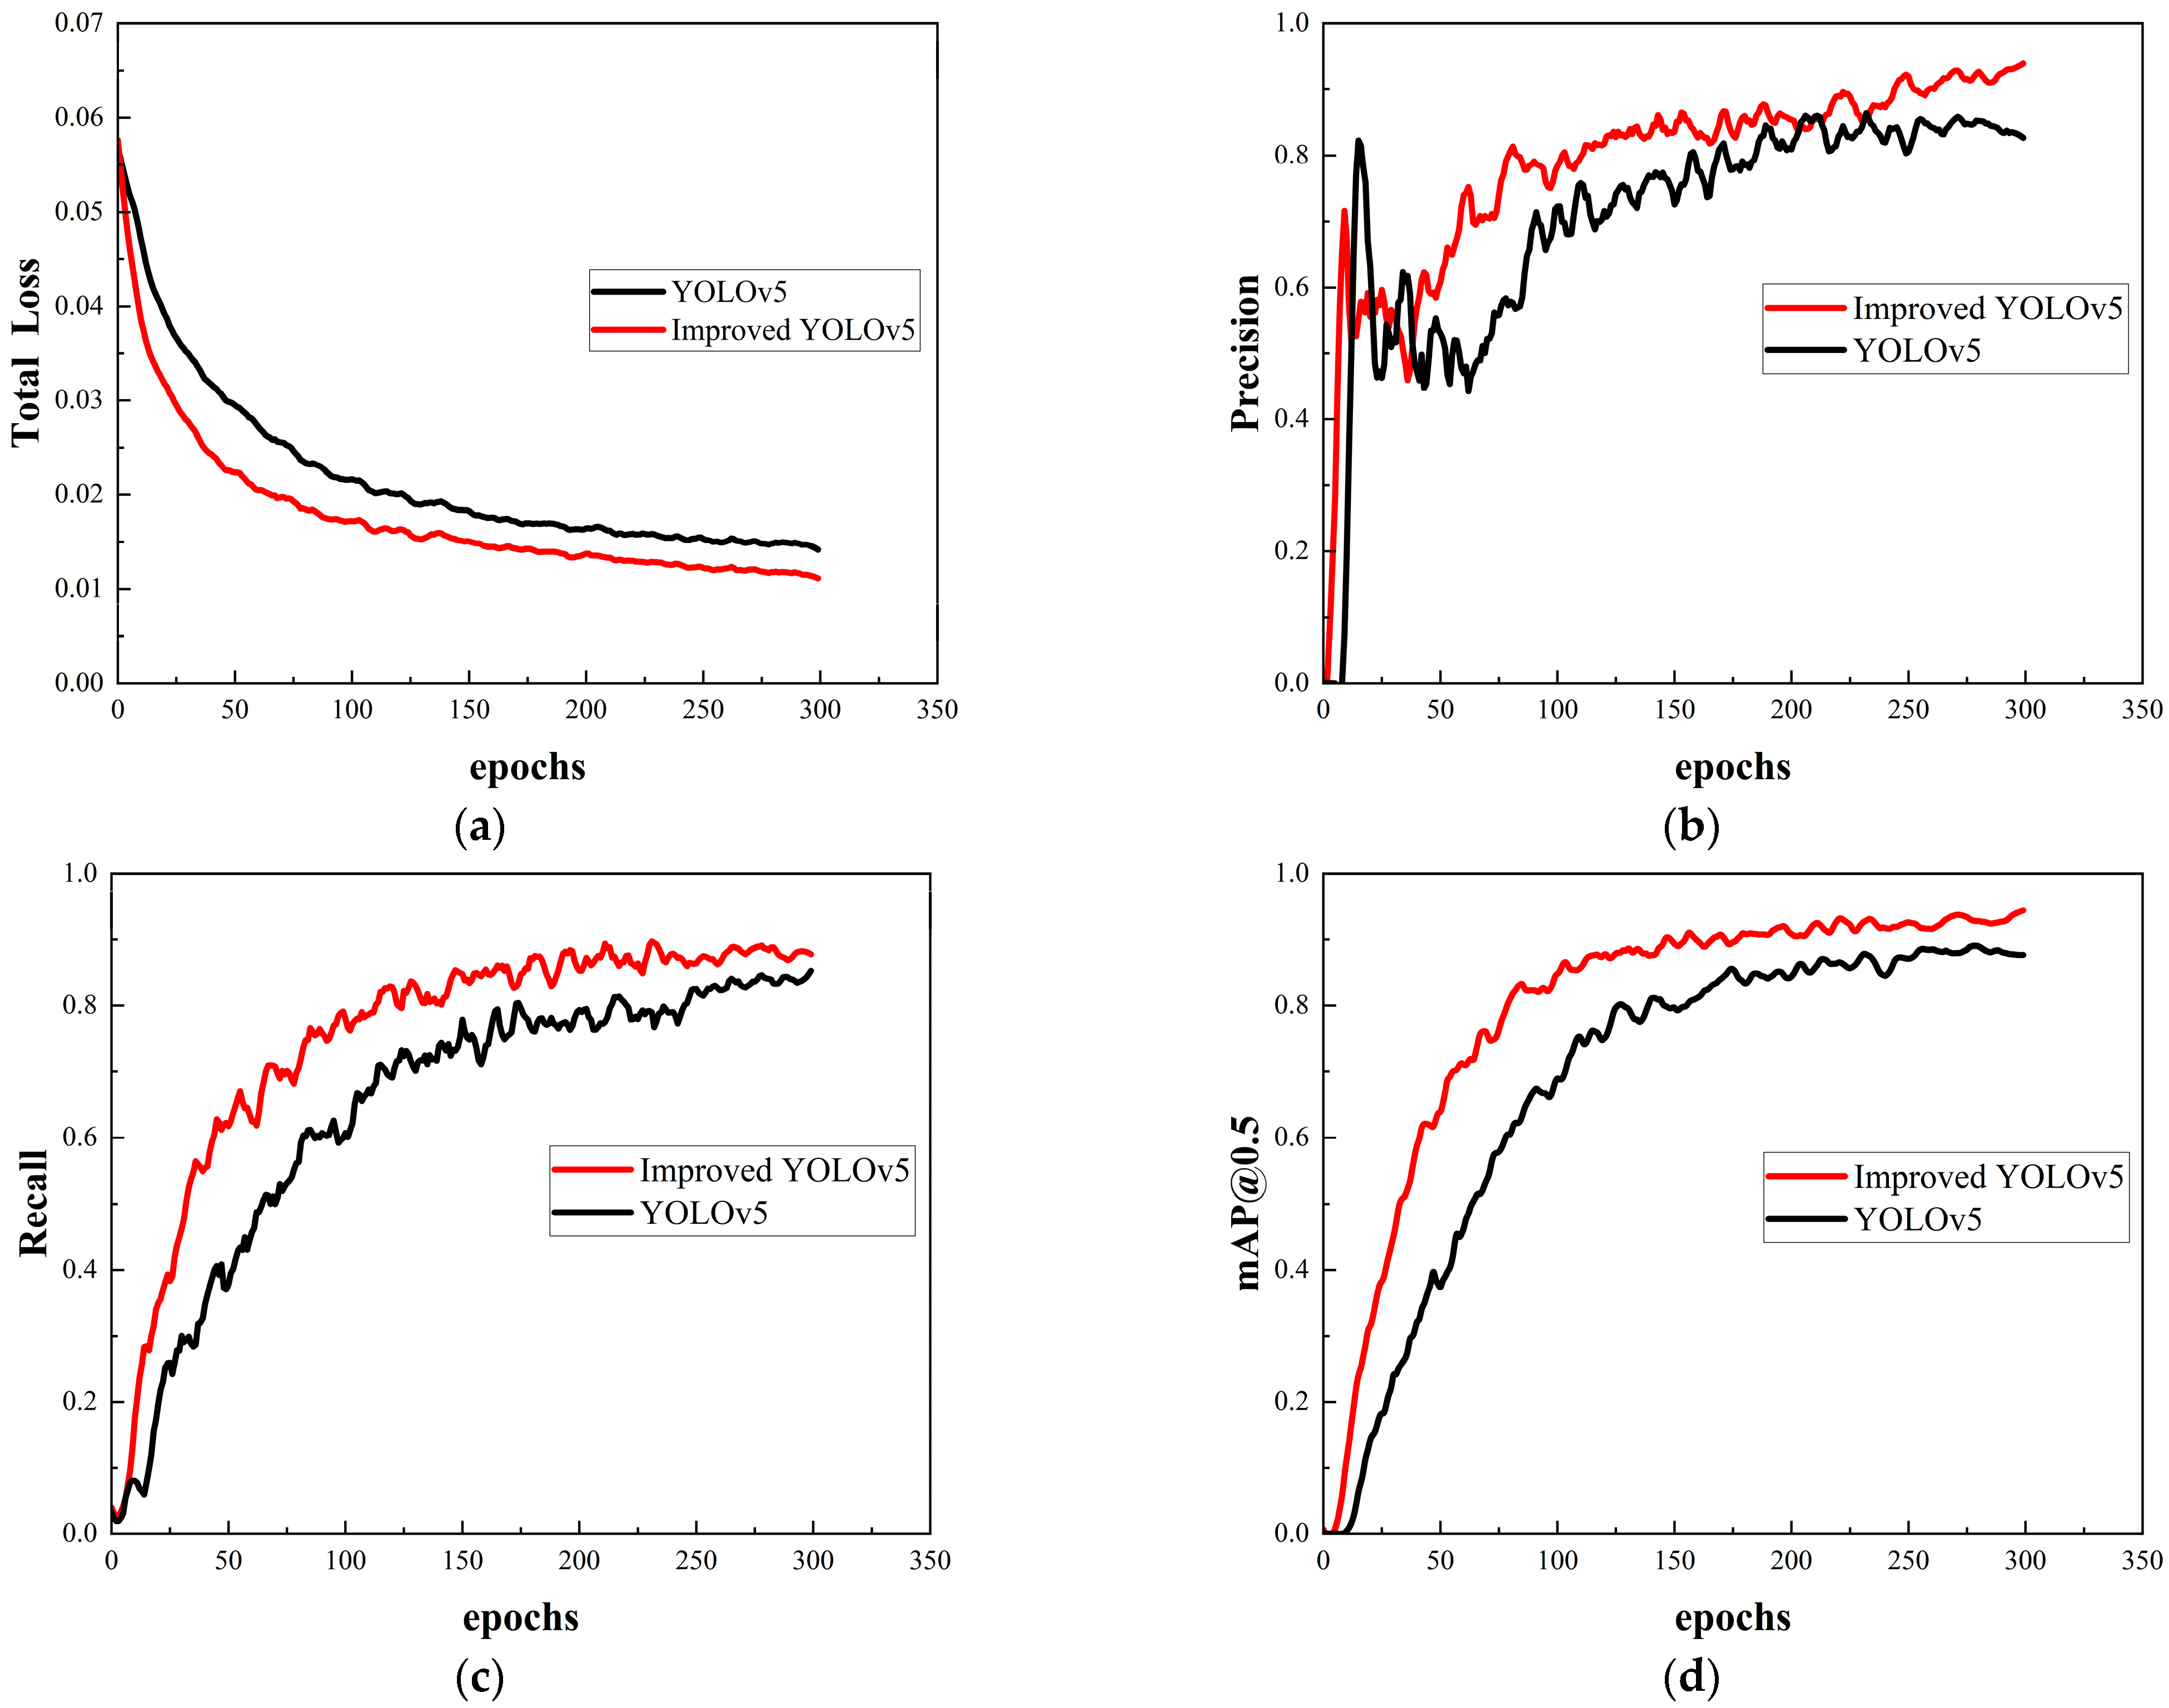
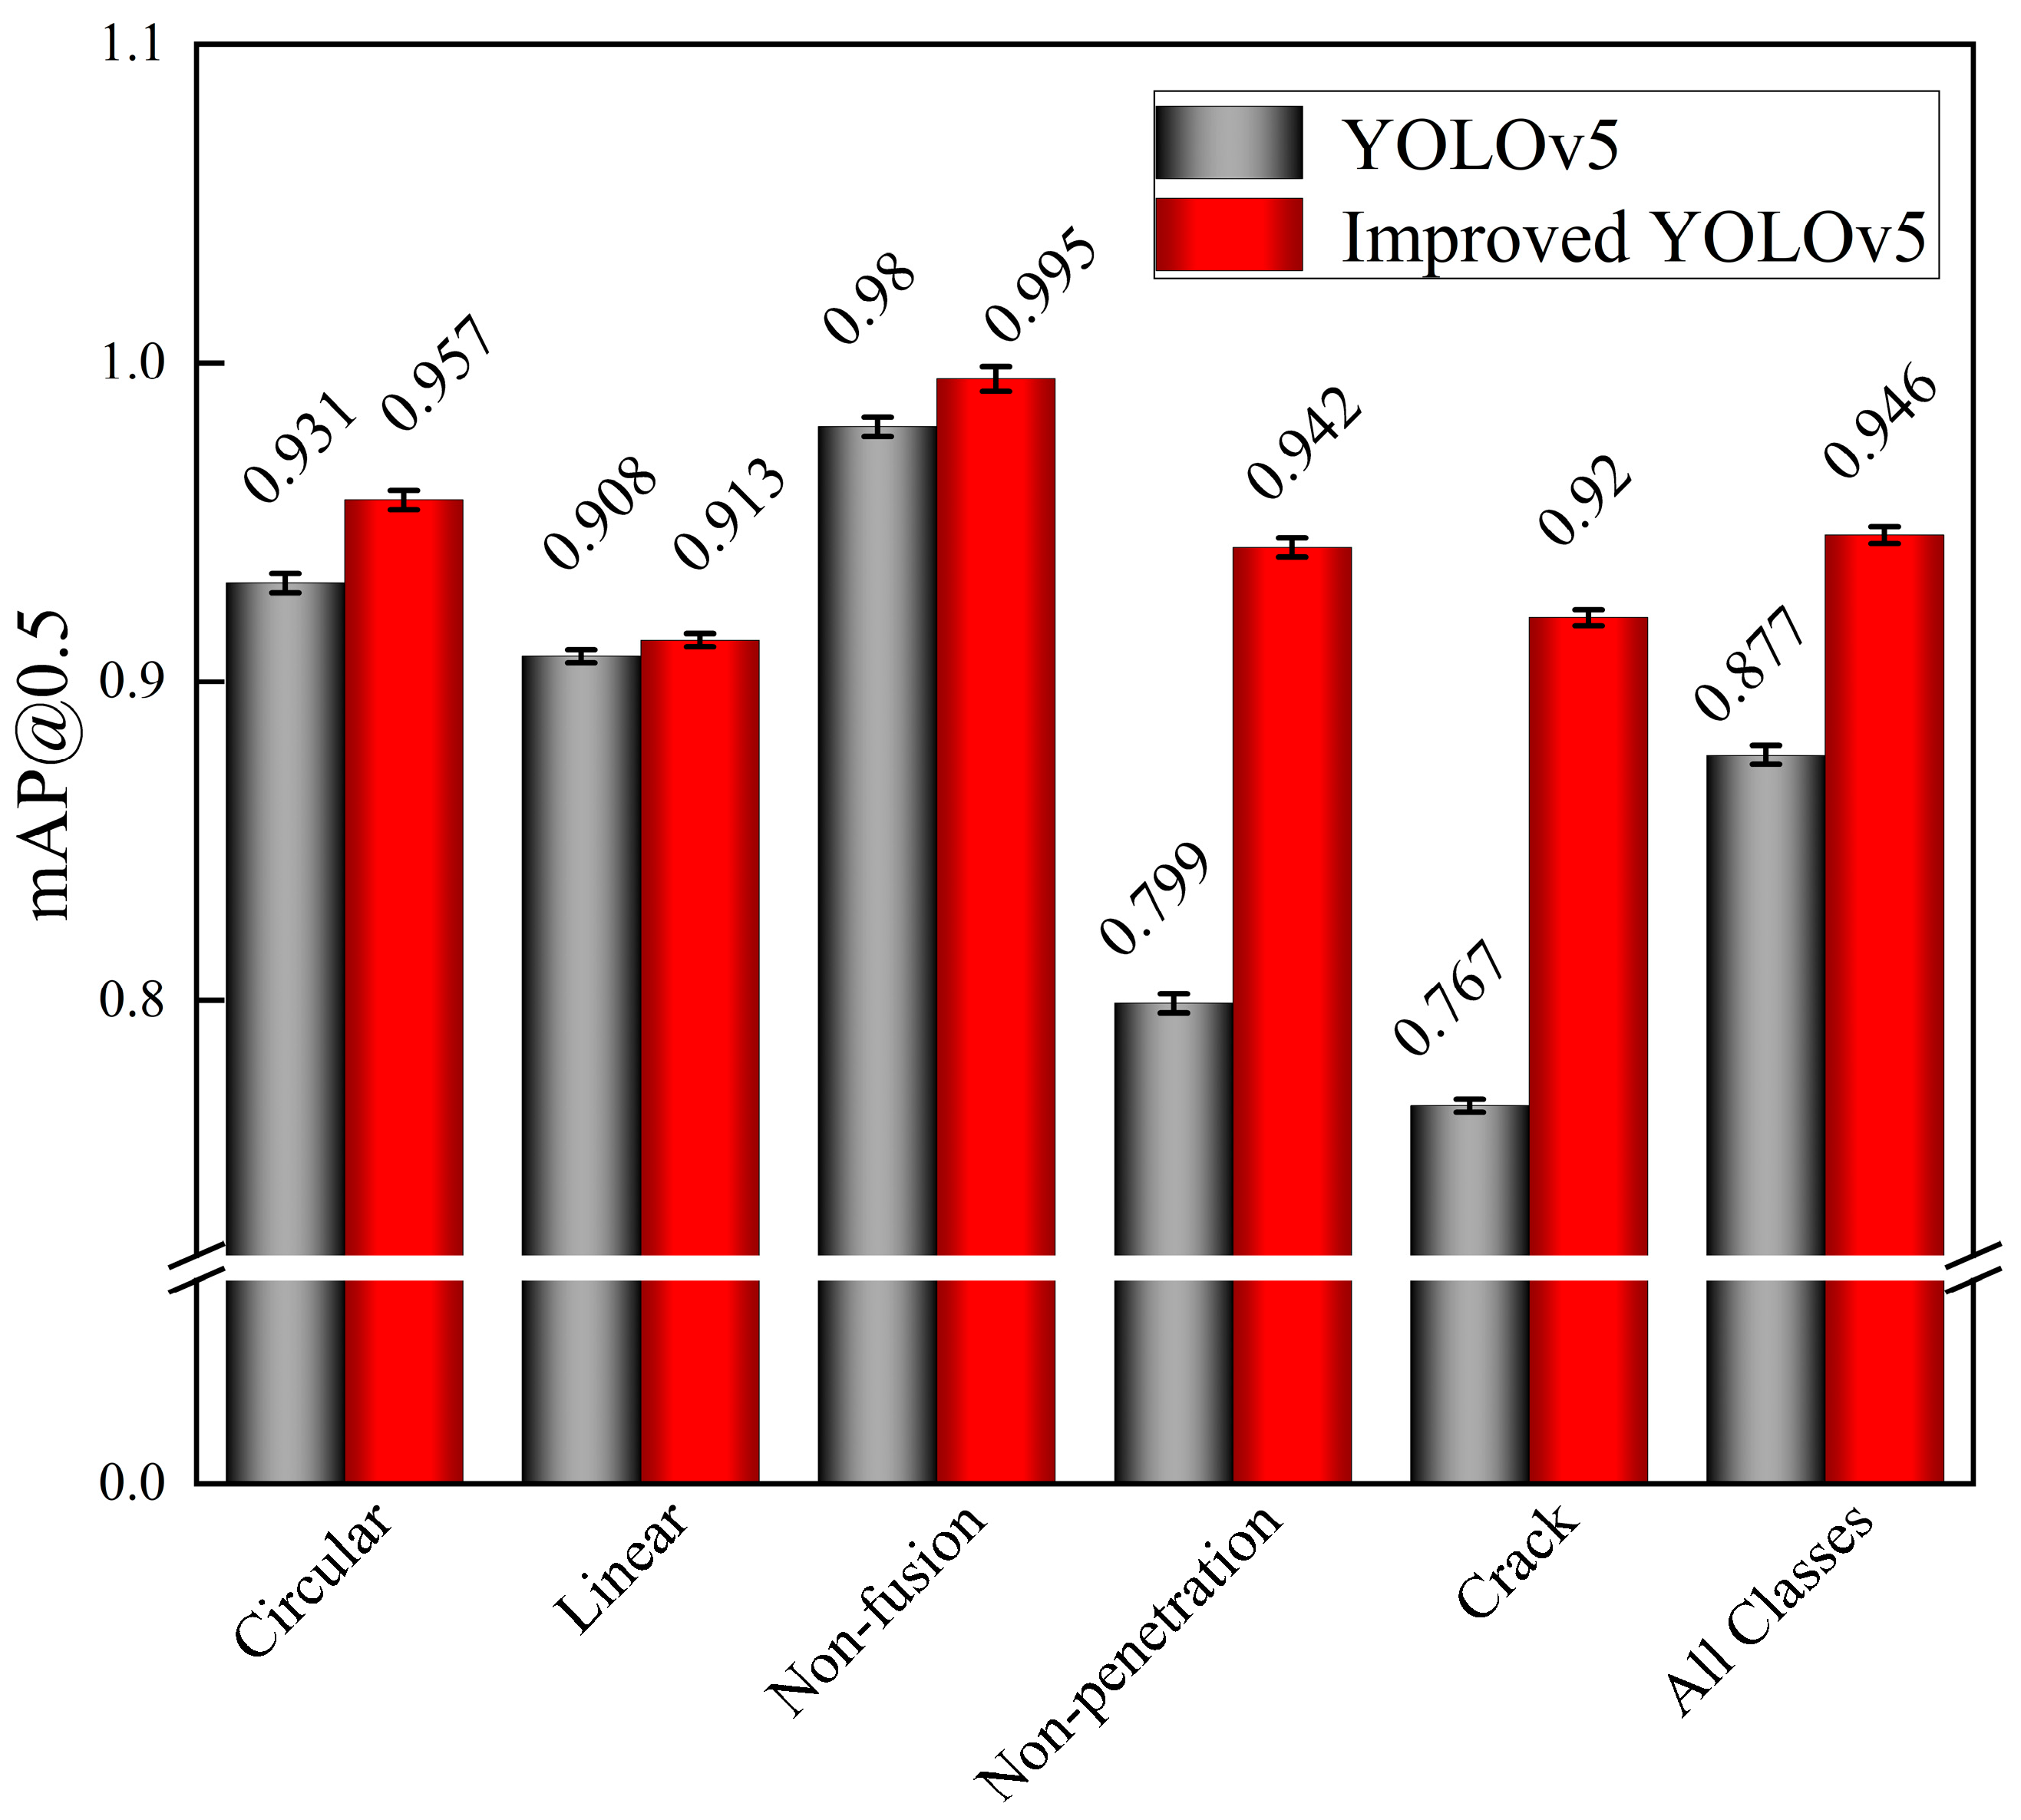
4.2. Result Analysis

Figure 6 illustrates the changes in key metrics during the training process before and after the improvement of the YOLOv5 model. Detailed values are provided in Table 1. As shown in Figure 6a, the improved model converges faster and achieves a lower optimal loss value during stabilization, decreasing from 0.014 to 0.011. This indicates that the WIoU loss function better optimizes boundary box matching and localization during training, effectively handling complex defect shapes while improving model performance and significantly accelerating the convergence speed. Upon examining Figure 6b,c, it is observed that the improved YOLOv5 achieves a precision of 0.941, which is 11.5% higher than the value of 0.826 before the improvement. Additionally, the recall rate of the improved YOLOv5 is 0.892, showing a 5.4% increase compared to the value of 0.838 before the improvement. Figure 6d shows that a higher mAP@0.5 value indicates better detection accuracy and overall model performance. The improved YOLOv5 achieves an mAP@0.5 value of 0.946, which is 6.9% higher than the value of 0.877 before the improvement. Notably, as shown in Table 1, the improved model introduces only a slight increase in the number of parameters compared to the original model. Although its inference speed (FPS) decreases by 18.94, the mAP@0.5 significantly improves by 6.9%. These results suggest that the improved model achieves a more favorable balance between accuracy and speed, making it better suited for real-time industrial X-ray weld defect detection.
Figure 7 compares the optimal mAP@0.5 values for circular defects, linear defects, non-fusion defects, non-penetration defects, and crack defects before and after the YOLOv5 model improvement. It is evident that the improved model shows enhanced detection accuracy for all types of defects, with a significant increase in accuracy for non-penetration and crack, which improved by 14.3% and 15.3%, respectively. This indicates that the increase model effectively addresses the original model’s poor detection accuracy for non-penetration and crack defects, thereby enhancing the overall defect detection precision.

4.3. Comparative Experiments

To further evaluate the detection performance of the model, a comparative analysis was conducted under identical experimental conditions. The proposed improved model was trained and tested on the constructed dataset and compared with several mainstream object detection models. The detection results of each model during the training process are shown in Table 2.
From the data in Table 2, it is evident that the improved model in this study outperforms the currently popular mainstream models in terms of the AP values for detecting various types of defects. Overall, in terms of mAP@0.5, the proposed model shows an improvement of 14.89% compared to the Faster-RCNN model, 13.02% compared to the SSD model, 6.1% compared to the RT-DETR model, 19.37% compared to the YOLOv3 model, 7.1% compared to the YOLOv8 model, 7.5% compared to the YOLOv9 model, and 10.7% compared to the YOLOv10 model. In addition to detection accuracy, model lightweighting and inference speed are critical considerations in real-world industrial applications. The proposed model contains 7.02 million parameters and achieves an FPS of 208, demonstrating clear advantages in model size and inference speed compared to Faster R-CNN, SSD, RT-DETR, YOLOv3, YOLOv8, and YOLOv9. Although its FPS is 9.06 lower than that of YOLOv10, the proposed model exhibits a notable improvement in detection accuracy. It is evident that under the experimental environment based on an NVIDIA GeForce RTX 3090, the improved model achieves a parameter size of 7.02 M, a detection accuracy of 94.6%, and an inference speed of 208.33 FPS, demonstrating a well-balanced performance across all key metrics. The model maintains a relatively small parameter size while achieving an effective balance between detection accuracy and real-time performance, indicating strong potential for deployment on embedded devices. Therefore, the proposed model can effectively meet the dual requirements of accuracy and real-time performance in steel pipe weld defect detection, making it more suitable for practical inspection scenarios.

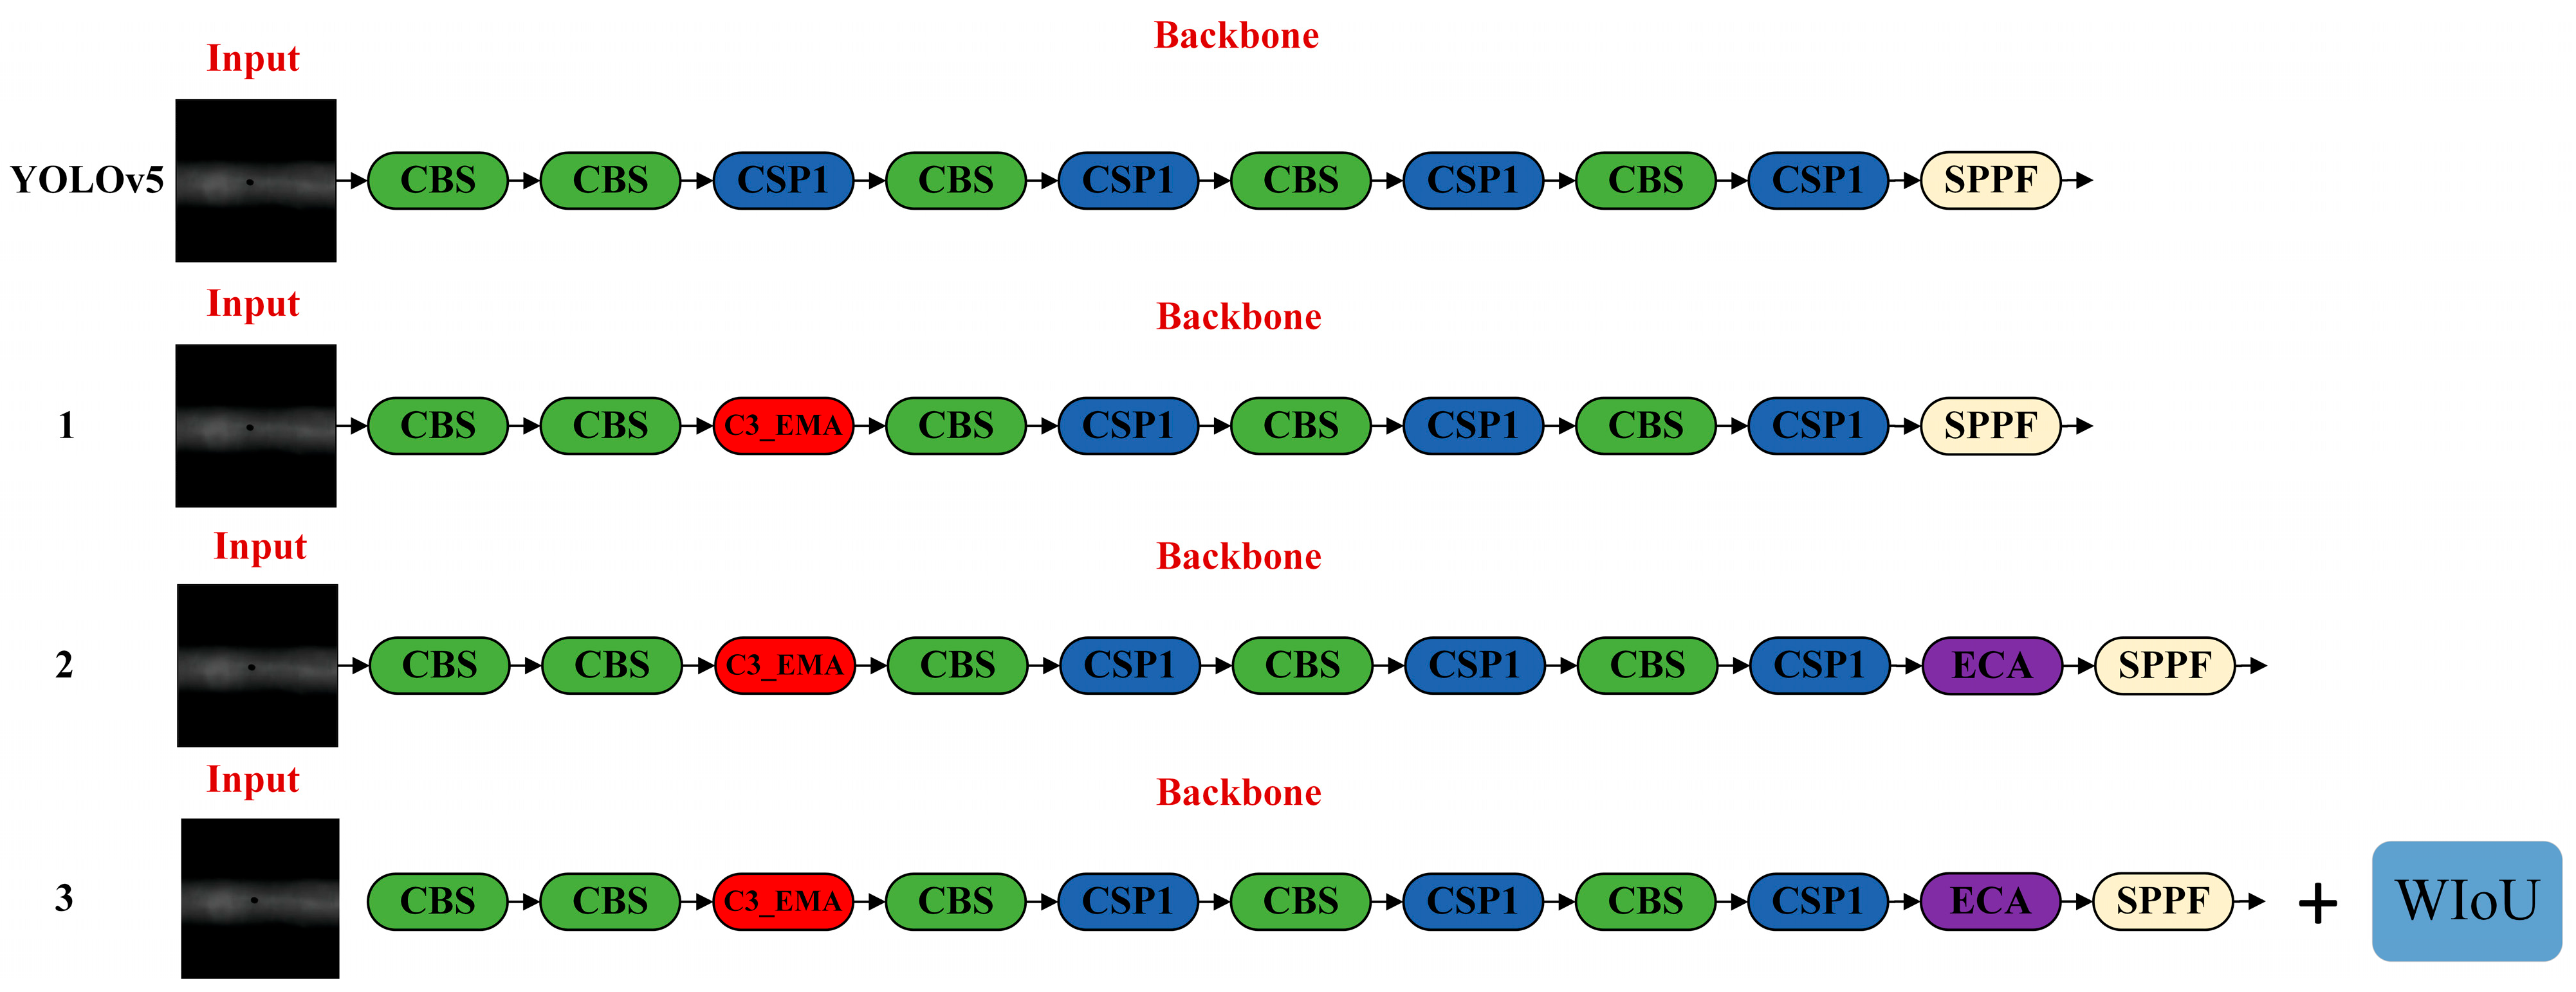
4.4. Ablation Experiment

To verify the effectiveness of the three proposed improvements in enhancing the detection performance of the YOLOv5 model, a series of ablation experiments were designed using the original YOLOv5 model as the baseline. In these experiments, the EMA, ECA attention mechanisms, and WIoU loss function were progressively incorporated into the original model. The detailed integration process is illustrated in Figure 8. The detection accuracy of the model was evaluated using the AP values of each defect category and the mAP@0.5 score, with the results shown in Table 3. After adding the ECA attention mechanism, the model’s detection accuracy for unpenetrated and cracked defects significantly improved, resulting in a 1.5% increase in the optimized mAP@0.5 value compared to the original model. Adding both the ECA and EMA attention mechanisms further enhanced the detection accuracy for all defect types, leading to a 5.1% increase in the optimized mAP@0.5 value. Finally, when both attention mechanisms were incorporated alongside the replacement of the loss function with WIoU, the model’s detection accuracy for all five defect types showed notable improvements, with the optimized mAP@0.5 value increasing by 6.9% compared to the original model. These results further quantitatively validate the harmonious integration of the EMA and ECA attention mechanisms without structural conflict. Specifically, EMA contributes in the early stages by providing global contextual information, which expands the receptive field and enhances the initial feature representation. This enables the model to dynamically adjust feature focus across different scales and defect types, thereby improving its ability to detect multi-scale targets. In contrast, the ECA module refines local features in the later stages by adaptively reweighting channel-wise information, enhancing the representation of small objects and critical local features. This highlights key information related to weld defects while suppressing irrelevant background noise, leading to improved detection of small-sized and low-contrast defects.

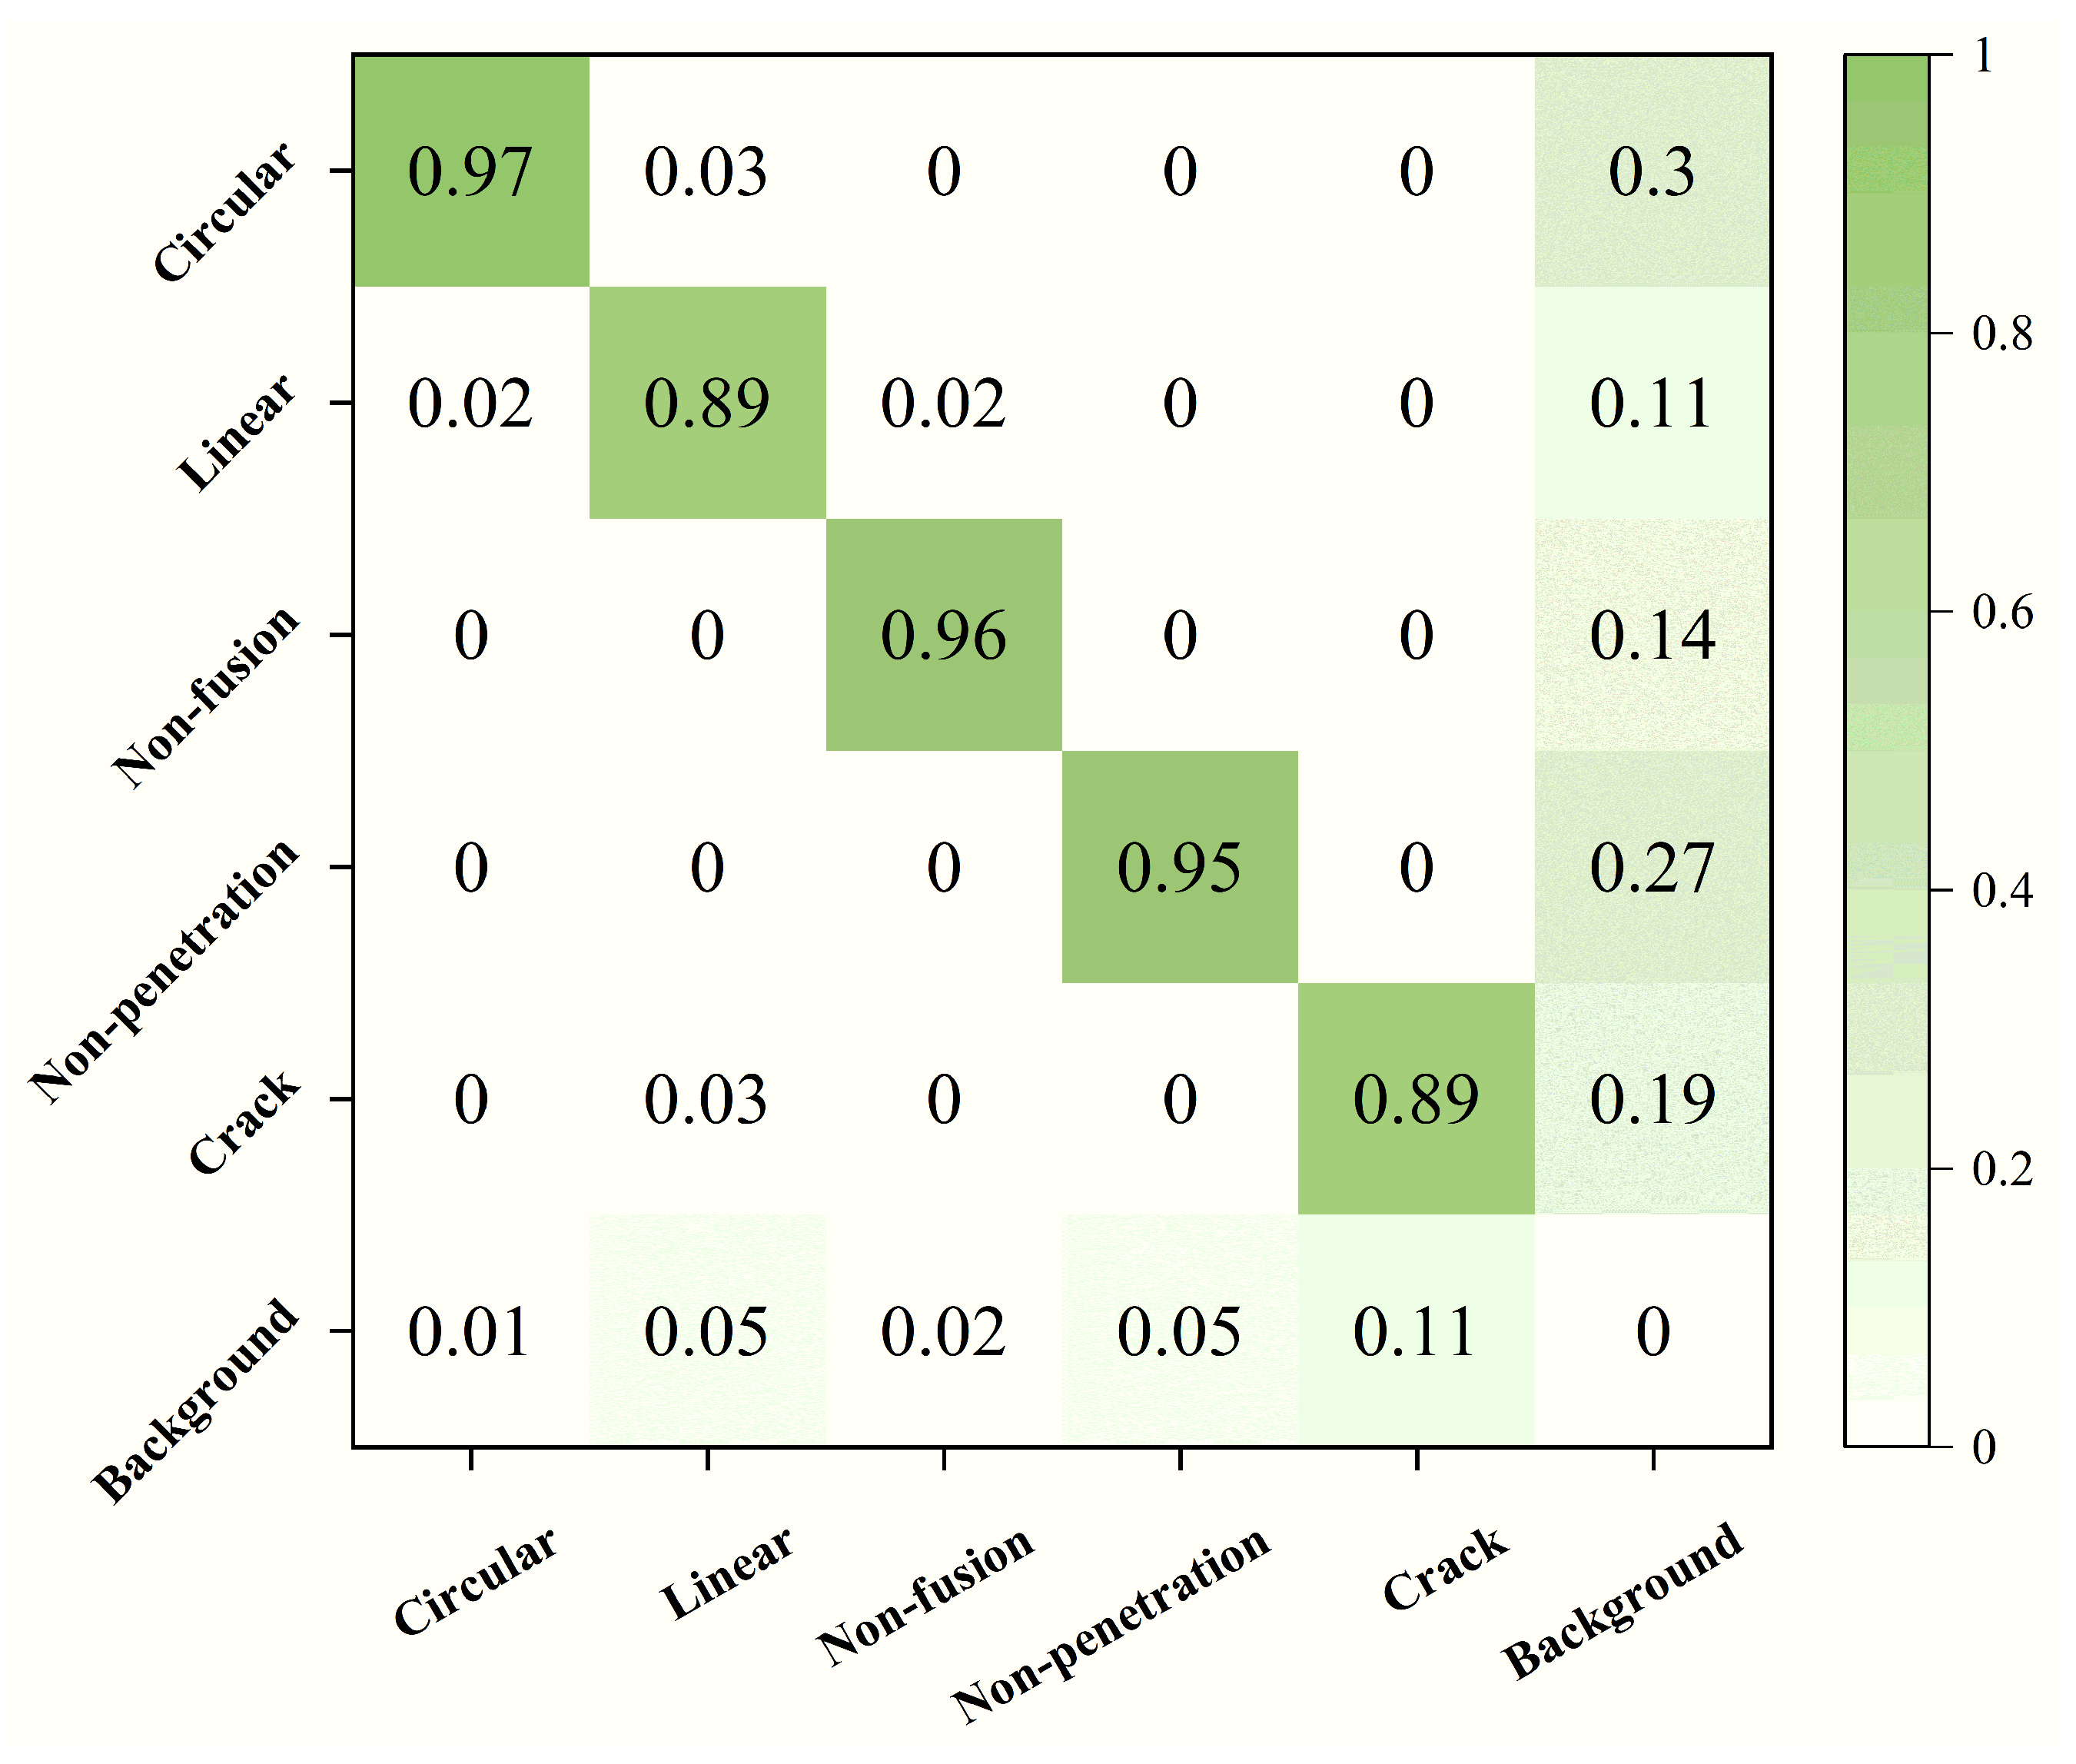
4.5. Confusion Matrix Analysis

Figure 9 presents the confusion matrix generated on the test set, providing a detailed evaluation of the classification performance of the improved model. The horizontal axis denotes the ground truth labels, while the vertical axis represents the predicted labels; values along the diagonal indicate correctly classified instances for each defect type. The improved model demonstrates strong predictive performance across most defect categories. Specifically, the detection accuracy for circular defects reaches 97%, with 2% misclassified as linear defects and 1% as background. For linear defects, the accuracy is 89%, with 3% misclassified as circular defects, 3% as cracks, and 5% as background. For non-fusion defects, the model achieves 96% accuracy, with 2% incorrectly labeled as linear defects and 2% as background. Non-penetration defects are classified with 95% accuracy, with 5% misclassified as background. Crack defects are detected with 89% accuracy, with 11% misclassified as background. These results indicate that the improved model performs satisfactorily across all defect types; however, some degree of false positives and false negatives remains. Notably, the misclassification rate for linear defects is relatively high, and the missed detection rate for crack defects is also considerable. Future work will focus on expanding targeted datasets and refining the model to further enhance overall performance and robustness.

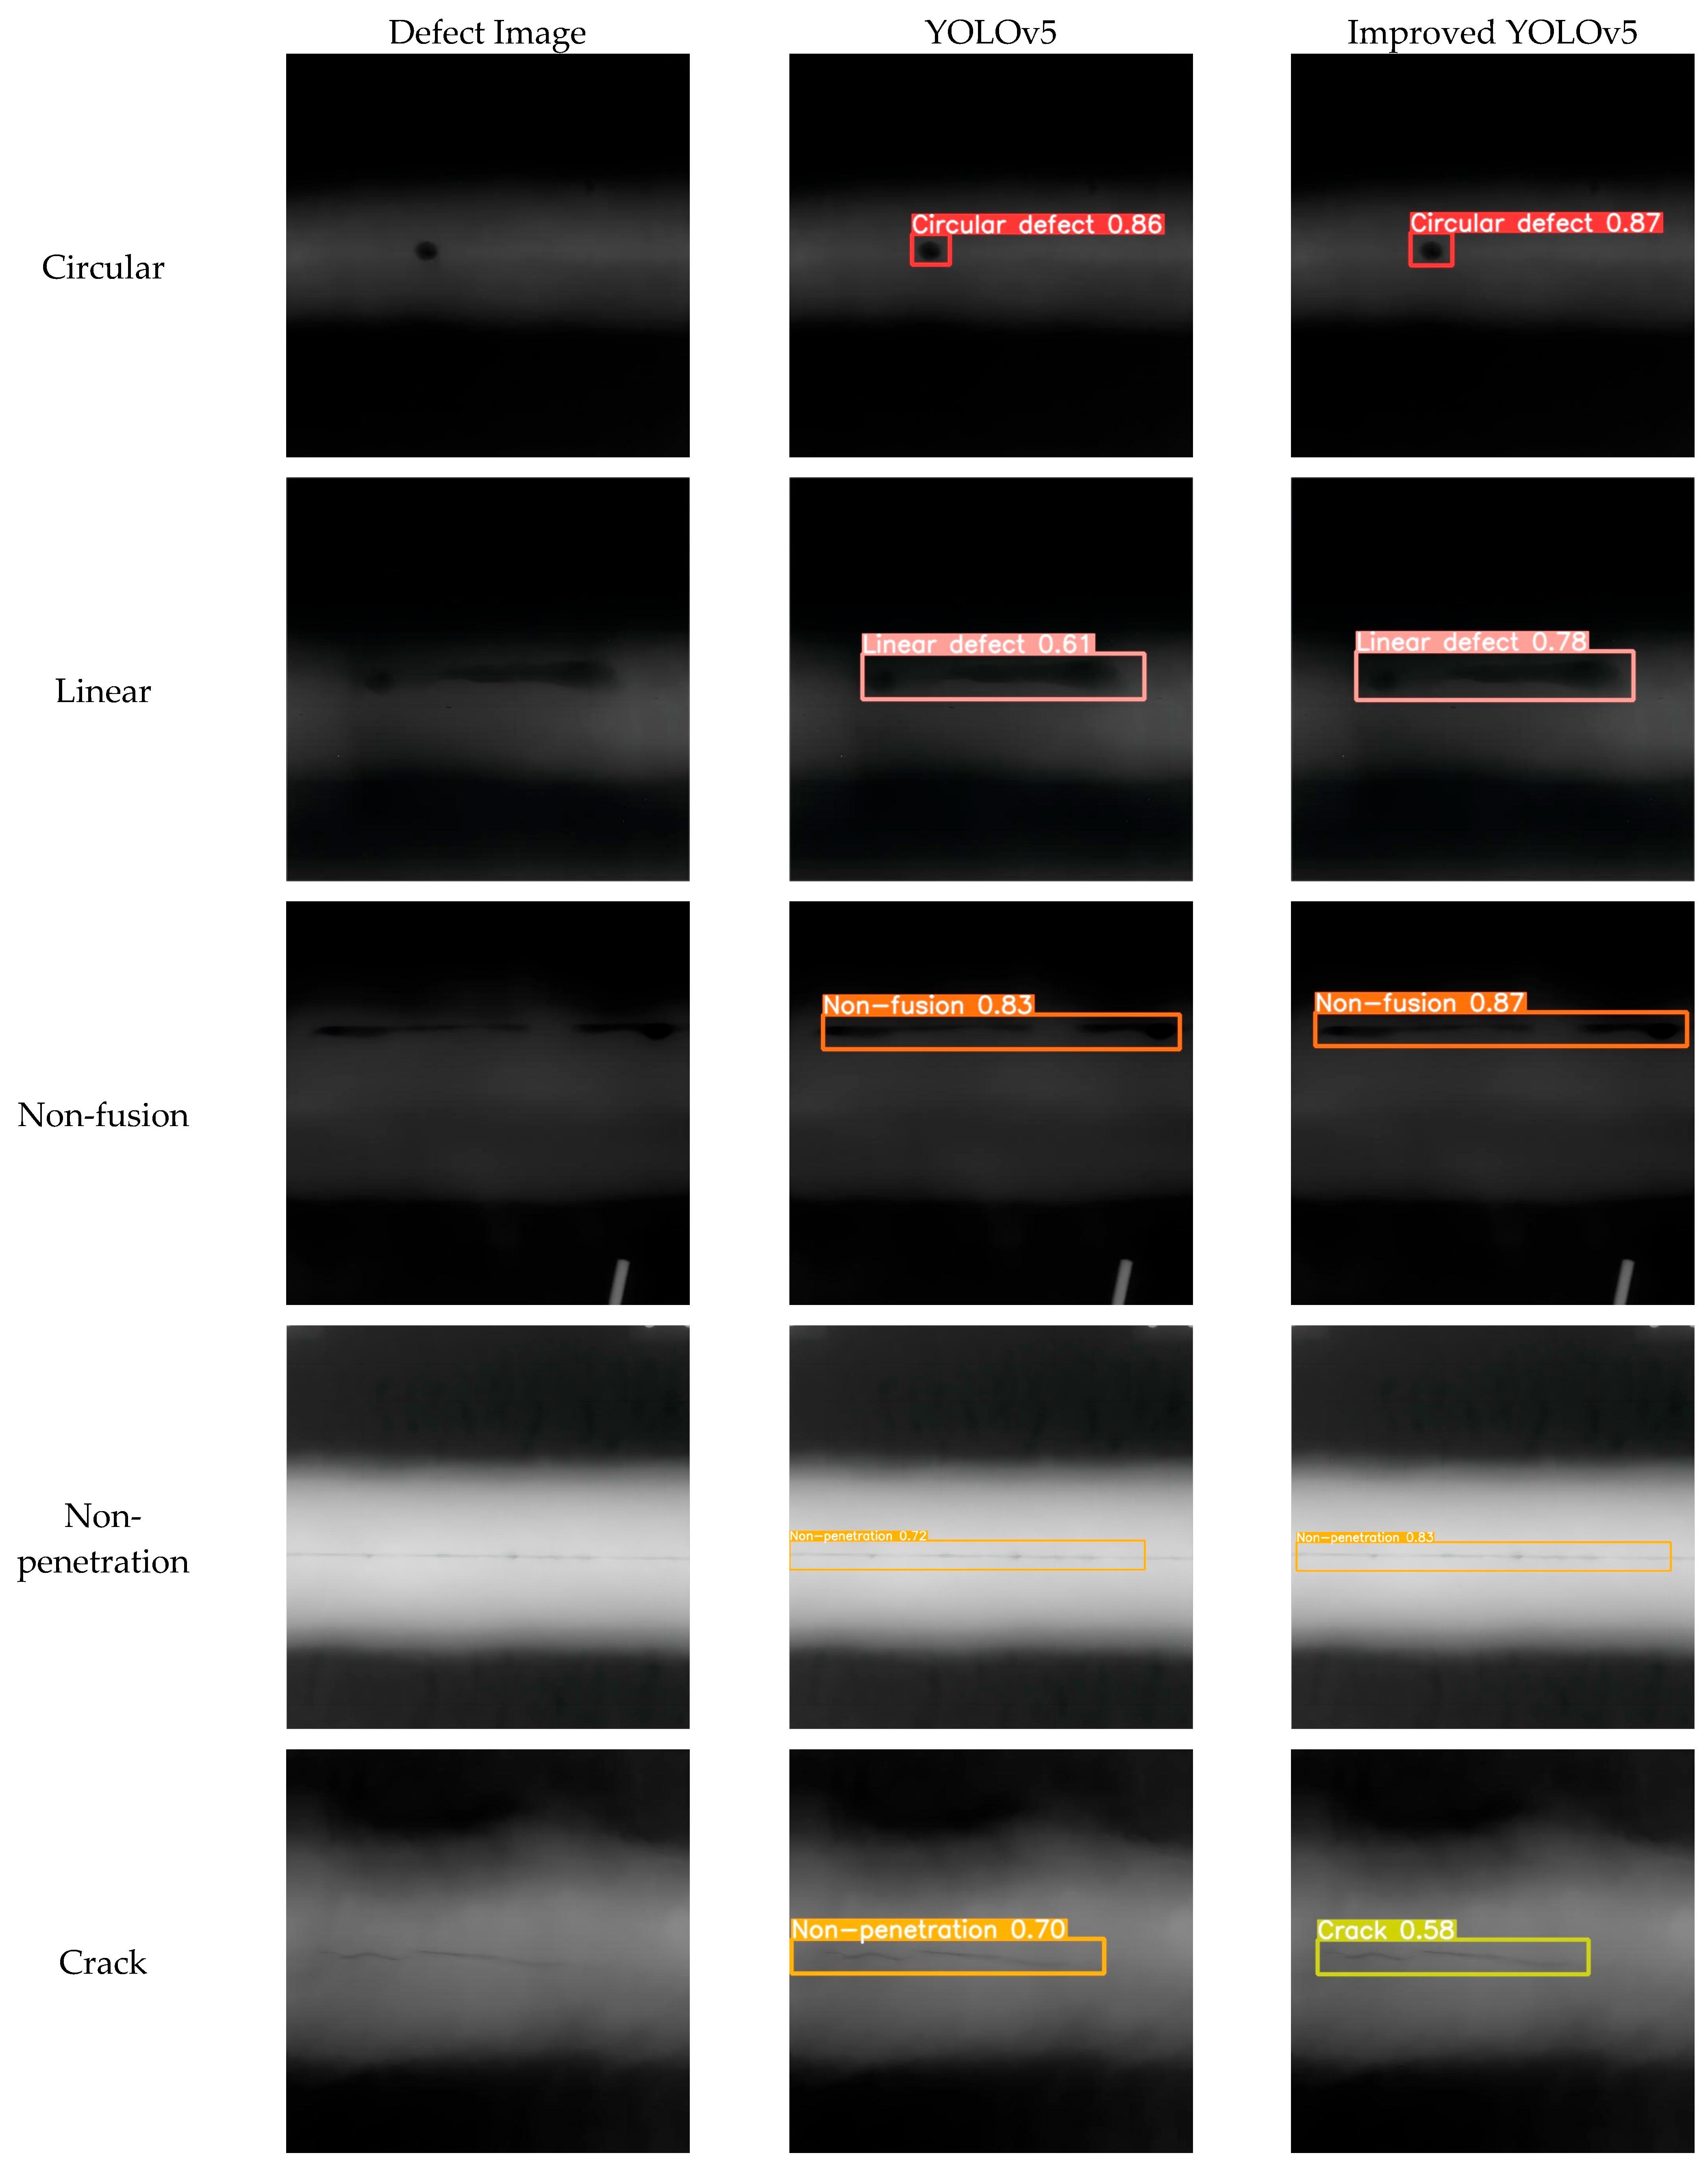
4.6. Comparison of Actual Detection Effect

To more intuitively compare the performance differences between the original YOLOv5 model and its improved version in the actual defect detection task, both models were used to detect five types of weld seam defect images from the test set. The results are shown in Figure 10. In the practical detection process, the optimized model outperforms the original model in overall detection performance. Notably, the detection performance for defects categorized as linear, non-fusion, and crack has significantly improved. The recognition confidence for linear defects and non-fusion increased by 17% and 11%, respectively. The original model misclassified crack defect as non-fusion defect, while the optimized model correctly identified and classified the crack defect. These results demonstrate that the proposed YOLOv5 optimization model meets the requirements for industrial pipeline X-ray weld seam defect detection, offering higher detection accuracy and robustness.

5. Conclusions and Prospect

This study proposes an optimized industrial pipeline X-ray weld seam defect detection model based on YOLOv5, in which the EMA attention mechanism is incorporated into the first C3 module of the backbone network, the ECA attention mechanism is added before the SPPF layer, and the WIoU loss function replaces the CIoU loss function.
The training experiments demonstrate that, compared to the original YOLOv5 model, the improved version introduces only a minimal increase in parameter count. Although the inference speed (FPS) decreases by 18.94, the Precision, Recall, and mAP@0.5 values reach 94.1%, 89.2%, and 94.6%, respectively—representing improvements of 11.5%, 5.4%, and 6.9%. Comparative evaluations show that the improved model outperforms several mainstream object detection algorithms, including Faster R-CNN, SSD, RT-DETR, YOLOv3, YOLOv5, YOLOv8, YOLOv9, and YOLOv10, achieving higher AP and mAP@0.5 scores across various defect categories, while maintaining a better balance between speed and accuracy. Specifically, the mAP@0.5 of the optimized YOLOv5 model exceeds that of Faster R-CNN, SSD, RT-DETR, YOLOv3, YOLOv8, YOLOv9, and YOLOv10 by 14.89%, 13.02%, 6.1%, 19.37%, 7.1%, 7.5%, and 10.7%, respectively, demonstrating its effectiveness in addressing the automated detection of weld seam defects. Ablation studies confirm that the three improvement strategies work synergistically to significantly enhance the model’s detection performance, with particularly notable improvements observed in the accuracy of detecting non-penetration and crack defects. Confusion matrix analysis further reveals that, overall, the improved model exhibits strong classification capability for all defect types. However, some misclassification of linear defects and missed detections of cracks remain. In practical defect detection scenarios, the optimized model substantially increases the confidence scores for all defect types compared to the baseline YOLOv5 and accurately identifies defect categories, thereby reducing the incidence of misclassification. These findings indicate that the proposed model can significantly improve the accuracy of X-ray weld seam defect detection and meet the demands of industrial applications.
Since deep learning-based detection models typically require large datasets for effective training, future work will focus on expanding the defect image database by collecting more annotated X-ray images to enhance the model’s generalization capability. Additionally, due to the complex and irregular morphological characteristics of cracks—often appearing as filamentous or reticulated structures—the current model still shows limitations in accurately detecting crack defects. Enhancing the detection accuracy for this particular defect type will be a key focus in subsequent research. Furthermore, to enable deployment on embedded devices, future work will explore network structure optimization and model compression techniques such as pruning and knowledge distillation to achieve further model lightweighting.

Author Contributions

Conceptualization, G.S. and W.L. (Wei Lu); methodology, G.S. and X.S.; software, G.S. and Q.W.; validation, G.S., X.S. and Q.W.; formal analysis, G.S. and X.S.; investigation, G.S., Q.W. and W.L. (Weihong Luo); resources, G.S.; data curation, G.S. and W.L. (Weihong Luo); writing—original draft preparation, G.S.; writing—review and editing, W.L. (Wei Lu); visualization, G.S. and X.S.; supervision, W.L. (Wei Lu); project administration, W.L. (Wei Lu); funding acquisition, W.L. (Wei Lu). All authors have read and agreed to the published version of the manuscript.

Funding

This research was funded by National Natural Science Foundation of China (grant no. 52066002).

Institutional Review Board Statement

Not applicable.

Informed Consent Statement

Not applicable.

Data Availability Statement

The data presented in this study are available on request to the authors and will not be made public due to privacy and ethical concerns.

Conflicts of Interest

Author Xuanhe Su was employed by the company Natural Gas Branch of SINOPEC. The remaining authors declare that the research was conducted in the absence of any commercial or financial relationships that could be construed as a potential conflict of interest.

References

  1. Yang, D.; Cui, Y.; Yu, Z.; Yuan, H. Deep learning based steel pipe weld defect detection. Appl. Artif. Intell. 2021, 35, 1237–1249. [Google Scholar] [CrossRef]
  2. Yang, L.; Wang, H.; Huo, B.; Li, F.; Liu, Y. An automatic welding defect location algorithm based on deep learning. NDT E Int. 2021, 120, 102435. [Google Scholar] [CrossRef]
  3. Ji, C.; Wang, H.; Li, H. Defects detection in weld joints based on visual attention and deep learning. NDT E Int. 2023, 133, 102764. [Google Scholar] [CrossRef]
  4. Zuo, F.; Liu, J.; Fu, M.; Wang, L.; Zhao, Z. An X-Ray-based multiexpert inspection method for automatic welding defect assessment in intelligent pipeline systems. IEEE/ASME Trans. Mechatron. 2024, 1–12. [Google Scholar] [CrossRef]
  5. Li, Y.; Liu, C.; Wu, Z.; Sun, Q.; Zhu, Y.; Li, K. One-stage identification method for weld defects based on deep learning network. J. Guangxi Univ. 2021, 46, 362–372. [Google Scholar]
  6. Yang, L.; Wang, Z.; Gao, S. Pipeline magnetic flux leakage image detection algorithm based on multiscale SSD network. IEEE Trans. Ind. Inform. 2019, 16, 501–509. [Google Scholar] [CrossRef]
  7. Wu, Y.; Yan, S.; Zhao, X. Weld defect detection model based on machine vision. In Proceedings of the Third International Conference on Advanced Manufacturing Technology and Electronic Information (AMTEI 2023), Tianjin, China, 22–24 December 2023; Volume 13081, pp. 170–174. [Google Scholar]
  8. Kwon, J.-E.; Park, J.-H.; Kim, J.-H.; Lee, Y.-H.; Cho, S.-I. Context and scale-aware YOLO for welding defect detection. NDT E Int. 2023, 139, 102919. [Google Scholar] [CrossRef]
  9. Yao, J.; Qi, J.; Zhang, J.; Shao, H.; Yang, J.; Li, X. A real-time detection algorithm for Kiwifruit defects based on YOLOv5. Electronics 2021, 10, 1711. [Google Scholar] [CrossRef]
  10. Zhang, Y.; Ni, Q. A novel weld-seam defect detection algorithm based on the s-yolo model. Axioms 2023, 12, 697. [Google Scholar] [CrossRef]
  11. Wang, Q.; Cheng, M.; Huang, S.; Cai, Z.; Zhang, J.; Yuan, H. A deep learning approach incorporating YOLO v5 and attention mechanisms for field real-time detection of the invasive weed Solanum rostratum Dunal seedlings. Comput. Electron. Agric. 2022, 199, 107194. [Google Scholar] [CrossRef]
  12. Xu, L.; Dong, S.; Wei, H.; Ren, Q.; Huang, J.; Liu, J. Defect signal intelligent recognition of weld radiographs based on YOLO V5-IMPROVEMENT. J. Manuf. Process. 2023, 99, 373–381. [Google Scholar] [CrossRef]
  13. Cheng, S.; Yang, H.; Xu, X.; Li, M.; Chen, Y. Improved lightweight X-ray aluminum alloy weld defects detection algorithm based on YOLOv5. Chin. J. Lasers 2022, 49, 2104005. [Google Scholar]
  14. Xu, X.; Li, X. Research on surface defect detection algorithm of pipeline weld based on YOLOv7. Sci. Rep. 2024, 14, 1881. [Google Scholar] [CrossRef] [PubMed]
  15. Wu, L.; Chu, Y.; Yang, H.; Chen, Y. Sim-YOLOv8 Object Detection Model for DR Image Defects in Aluminum Alloy Welds. Chin. J. Lasers 2024, 51, 29–38. [Google Scholar]
  16. Cheng, K.; Hu, X.; Chen, H.; Li, H. Remote Sensing Object Detection Methods Based on Improved YOLOv5s. Laser Optoelectron. Prog. 2024, 61, 285–291. [Google Scholar]
  17. Wang, D.; Xiao, B.; Yao, C.; Zhao, W.; Zhu, R. Improved YOLOv5-Based Deeplearning Method for Detecting “Hot Spot Effect” in Phtotvoltaic Modules. Acta Energiae Solaris Sin. 2024, 45, 342–348. [Google Scholar]
  18. Wang, X.; Zhang, B.; Cui, J.; Wu, J.; Li, Y.; Li, J.; Tan, Y.; Chen, X.; Wu, W.; Yu, X. Image analysis of the automatic welding defects detection based on deep learning. J. Nondestruct. Eval. 2023, 42, 82. [Google Scholar] [CrossRef]
  19. Ouyang, D.; He, S.; Zhang, G.; Luo, M.; Guo, H.; Zhan, J. Efficient multi-scale attention module with cross-spatial learning. In Proceedings of the ICASSP 2023—2023 IEEE International Conference on Acoustics, Speech and Signal Processing (ICASSP), Rhodes Island, Greece, 4–10 June 2023; pp. 1–5. [Google Scholar]
  20. Li, Y.; Zhong, X.; Yao, Z.; Hu, B. Detection of dress code violations based on improved YOLOv5s. J. Graph. 2024, 45, 433–455. [Google Scholar]
  21. Wang, Q.; Wu, B.; Zhu, P.; Li, P.; Zuo, W.; Hu, Q. ECA-Net: Efficient channel attention for deep convolutional neural networks. In Proceedings of the IEEE/CVF Conference on Computer Vision and Pattern Recognition, Seattle, WA, USA, 13–19 June 2020; pp. 11534–11542. [Google Scholar]
  22. Cao, Y.; Liu, F.; Jiang, L.; Cheng, B.; You, M.; Chen, C. Detection of wood surface defects using YOLOv5-LW model. J. For. Eng. 2024, 9, 144–152. [Google Scholar]
  23. Tong, Z.; Chen, Y.; Xu, Z.; Yu, R. Wise-IoU: Bounding box regression loss with dynamic focusing mechanism. arXiv 2023, arXiv:2301.10051. [Google Scholar]
  24. Zhao, X.; Fang, J.; Zhao, Y. Tomato Potting Seedling Classification and Recognition Model Based on Improved YOLOv5s. Sci. Technol. Eng. 2024, 24, 11774–11785. [Google Scholar]
Figure 1. X-ray inspection of the scene: (a) weld appearance image; (b) X-ray equipment.
Applsci 15 04519 g001
Figure 2. Representative types of weld defects detected by X-ray: (a) no defect; (b) circular defect; (c) linear defect; (d) non-fusion defect; (e) non-penetration defect; (f) crack defect.
Applsci 15 04519 g002
Figure 3. Flowchart of the network structure for the optimized YOLOv5 model.
Applsci 15 04519 g003
Figure 4. Network structure for EMA module.
Applsci 15 04519 g004
Figure 5. Network structure for ECA module.
Applsci 15 04519 g005
Figure 6. Comparison of the performance between the original YOLOv5 model and its improved version: (a) Total Loss; (b) Precision; (c) Recall; (d) mAP@0.5.
Applsci 15 04519 g006
Figure 7. Optimal mAP@0.5 values for various types of weld defects detected by original YOLOv5 model and its improved version.
Applsci 15 04519 g007
Figure 8. Flowchart of ablation experiment.
Applsci 15 04519 g008
Figure 9. Confusion matrix of improved model.
Applsci 15 04519 g009
Figure 10. Effect comparison of weld defects detected by YOLOv5 model and its improved version.
Applsci 15 04519 g010
Table 1. Comparison of evaluation metrics between the original YOLOv5 model and its improved version.
ModelLossPrecision/%Recall/%mAP@0.5/%ParamsFPS
YOLOv50.01482.6 ± 0.283.8 ± 0.187.7 ± 0.27,023,610227.27
Improved YOLOv50.01194.1 ± 0.389.2 ± 0.194.6 ± 0.27,023,789208.83
Table 2. Comparison of detection performance across different object detection models.
ModelAP/%mAP@0.5/%Params/MFPS
CircularLinearNon-FusionNon-PenetrationCrack
Faster-RCNN57.7278.8393.9198.6069.4779.7 ± 0.541.1442.20
SSD69.1567.5494.5597.0879.5781.6 ± 0.424.2851.60
RT-DETR91.0086.1087.6094.0083.8088.5 ± 0.131.9981.97
YOLOv383.7368.9279.8285.4258.2975.2 ± 0.312.1362.89
YOLOv593.1090.8098.0079.9076.7087.7 ± 0.27.02227.27
YOLOv891.9088.6095.6091.4070.0087.5 ± 0.211.13108.70
YOLOv992.591.591.182.0078.4087.1 ± 0.37.17107.53
YOLOv1094.2090.2086.1075.6073.2083.9 ± 0.32.70217.39
Ours95.7091.3099.5094.2092.0094.6 ± 0.27.02208.33
Table 3. Comparison of ablation results.
ECAEMAWIoUAP/%mAP@0.5/%
CircularLinearNon-FusionNon-PenetrationCrack
93.190.898.079.976.787.7 ± 0.2
91.292.595.585.381.789.2 ± 0.1
95.294.398.891.584.392.8 ± 0.3
95.791.399.594.292.094.6 ± 0.2
Note: “√” represents the addition of the scheme, while “—” represents the absence of the scheme.
Disclaimer/Publisher’s Note: The statements, opinions and data contained in all publications are solely those of the individual author(s) and contributor(s) and not of MDPI and/or the editor(s). MDPI and/or the editor(s) disclaim responsibility for any injury to people or property resulting from any ideas, methods, instructions or products referred to in the content.

