1. Introduction
One of the key environmental factors influencing honeybee productivity is vegetation cover, particularly that provided by bee plants. This is because it determines the availability and quality of the forage base. Honeybees undertake foraging flights to collect nectar, honeydew, pollen, propolis, and water. Eckert [
1] demonstrated that bees typically forage within a radius of 2–3 km, although under favourable conditions, this range can exceed 3 km and reach up to 6 km in exceptional cases. Analyses of waggle dance behaviour have revealed that bees adjust their foraging distance based on nectar quality, preferring more calorific sources when flying over longer distances [
2]. Other studies have indicated foraging distances of approximately 3 km [
3], up to 5 km [
4], and even 13.5 km, as calculated by von Frisch [
5]. Mathematical models determining the optimal foraging distance indicate that honeybees select routes with the lowest energetic cost, which often translates to a preference for foraging sites located 500 m to 3 km away while avoiding longer flights when closer sources are available [
6]. The most efficient foraging distances are typically up to 2 km [
7,
8].
The quantity of forage available to honeybees can be recorded using standard hive scales at daily intervals. However, the advent of smart devices, such as automated hive weighing systems, has enabled continuous monitoring of hive mass, facilitating real-time tracking of honey production and the influence of environmental and weather conditions on bee activity [
9,
10,
11]. The analysis of daily fluctuations in hive weight facilitates the determination of the optimal time for honey harvesting and supports beekeeping management decisions [
12]. Furthermore, the integration of contemporary artificial intelligence algorithms facilitates the prediction of hive weight fluctuations, thereby augmenting the automation of apiary management [
13]. The utilisation of automated hive weighing systems has facilitated the evaluation of landscape influences on bee productivity and the optimisation of honey harvesting operations [
14]. The question of the number of measurement points within an apiary was addressed by Gerula et al. [
15], who demonstrated that a single hive scale is sufficient to provide a representative characterisation of the surrounding area and its forage availability for bees.
The classification of land cover based on satellite imagery has been utilised for a considerable duration. A seminal early study was that of Rouse et al. [
16], which introduced the Normalized Difference Vegetation Index (NDVI)—a tool that remains fundamental for assessing vegetation status and dynamics. Subsequent studies, including Tucker’s seminal work [
17], further refined these methodologies, enabling increasingly precise analyses of vegetation cover change on a global scale. The ongoing advancements in satellite technologies and image analysis techniques have rendered satellite imagery a widely used tool in environmental sciences, agriculture, and natural resource management. Satellite imagery supported by Geographic Information Systems (GIS) has been demonstrated to assess forage availability for honeybees [
18]. The identification of bee-attractive vegetation using multispectral UAV (Unmanned Aerial Vehicle imagery) was demonstrated by Papachristoforou et al. [
19], who employed drones to detect and classify plants based on their spectral signatures. The continuous advancements in these techniques and the development of new algorithms have made it possible to identify vegetation not only from satellite imagery but also from data acquired via aircraft and drones [
20,
21].
Urban environments have been found to offer richer floral resources for
Apis mellifera than suburban or agricultural areas [
22]. This phenomenon may be attributed to the greater diversity of flowering plants observed in urban areas [
23,
24]. However, findings by Sponsler et al. [
25] challenge this view, suggesting that rural environments may provide better forage availability for honeybees. The presence of bees in urban ecosystems depends on land use types and, consequently, on the characteristics of urban vegetation. Different environmental conditions support different bee species [
26,
27]. Pollinator preferences also vary over time and may be influenced by the degree of industrialisation. Certain species may emerge or increase in abundance, while others may decline or even disappear [
28].
Research by Tommasi et al. [
29] demonstrated that the diversity and abundance of
Apoidea bees in urban environments can be significantly influenced by the presence of parks and green spaces. Despite occupying a small proportion of urban areas, these environments play a crucial role as forage sources. Notably, Fox et al. [
22] found that non-native and invasive plant species play a significant role in sustaining urban bee populations alongside native flora.
The landscape structure, incorporating the presence of broad-leaved forests, grasslands, and shrublands, plays a pivotal role in nectar availability and influences the foraging patterns of honeybees [
30]. The abundance of bees has been found to be unrelated to the extent of paved roads or buildings but strongly dependent on the type and amount of vegetation [
31,
32]. The presence of forests, irrespective of their type, was found to be positively correlated with bee diversity, with larger forest areas exhibiting higher diversity [
33]. This finding is corroborated by two other studies, which also confirmed the beneficial impact of forest proximity on bees. In Kenya, hives located in closer proximity to forest fragments produced higher volumes of honey, while in France, areas with greater forest coverage supported larger and stronger colonies despite being situated in the vicinity of intensive agricultural activities [
34,
35].
Agricultural monocultures may provide large quantities of nectar, but only over short periods, followed by forage gaps. Therefore, the introduction of diverse crops and semi-natural habitats is essential. The conservation of wild plants and shrublands in agricultural landscapes can offer additional sources of pollen and nectar beyond the main crop flowering season [
36]. The type and nutritional quality of pollen collected by bees depend on the surrounding landscape structure. The higher the proportion of agricultural land, the lower the protein content of the stored pollen [
37]. Anthropogenic land cover is most associated with high colony losses in honeybees. Conversely, land cover classes such as grain maize, mixed forests, and coniferous–mixed forests have been predominantly linked to low colony losses. The prevailing data indicate that land cover related to transportation infrastructure, industrial zones, and recreational areas exhibits a stronger correlation with overwintering colony losses in developed countries [
38].
The primary objective of this study is to make a comparison between artificial urban and rural ecosystems concerning the availability of sugar-based forage for honeybees. The availability is measured by the number of foraging days and the amount of nectar collected. Additionally, the survey aims to assess the suitability of specific vegetation types found in these ecosystems as forage sources for bees. This analysis will facilitate an evaluation of the impact of urbanisation and agricultural land use on the productivity of honeybee colonies. The findings will enhance the understanding of ecological factors affecting pollinators and offer practical guidance for sustainable beekeeping. The findings will contribute to a better understanding of the ecological factors influencing pollinator health and provide practical recommendations for optimising landscape management strategies to support sustainable beekeeping.
2. Materials and Methods
2.1. Experimental Setup and Study Site
Building upon previous research on the relationship between environmental characteristics of urban and rural ecosystems and their suitability for honeybees [
39], this study was conducted in five regions of Poland during 2021–2022 (see
Table 1 and
Figure 1). Each region included an experimental apiary located in the largest city or the most urbanised area (urban) and control apiaries situated in surrounding agricultural areas (rural) at distances ranging from 4.5 to 47.3 km, depending on the region.
The average annual air temperature in these regions ranged from 8.2 to 8.7 °C, and the total annual precipitation varied from 530 to 700 mm (
Table 1), indicating relatively similar climatic conditions across all locations. In each of the 10 apiaries, one test hive was placed on a hive scale. The surrounding forage base was assessed, and changes in hive weight were monitored using Capaz hive scales (Oberkirch, Germany). For a detailed description and photographic documentation of the scales, see [
14]. The data thus obtained were then used to calculate three key annual indicators for each bee colony/apiary (April to August): hive weight gain (gross increase, kg)—the sum of all daily weight gains, reflecting the total amount of forage (mainly nectar, but also pollen and other materials—no distinction was made) collected by the bees. It should be noted that this value does not directly correspond to potential honey production; hive weight loss (gross decrease, kg)—the sum of all daily weight losses, representing the number of consumed stores and other weight reductions (e.g., water evaporation); the number of foraging days is defined as the number of days on which a positive daily weight gain was recorded (i.e., scale readings above 0). For analysis, the mean values of these indicators from both years were used to generate a single representative observation per location.
2.2. Landscape Structure Analysis
The landscape characteristics surrounding each apiary were assessed using remote sensing data. For each location, land cover maps were generated within a 1.5 km and 3 km radius. The analysis was based on the national land cover map S2GLC-PL National Satellite Information System [
40] derived from Sentinel-2 satellite imagery with a spatial resolution of 10 m (European Space Agency (ESA) under the Copernicus Programme of the European Union). Photographs of land within a 3 km and 1.5 km radius of the apiaries were processed using Image Colour Summarizer software v0.80 (Canada’s Michael Smith Genome Sciences Centre (GSC), Vancouver, BC, Canada). Using these maps, pixels were classified into the following land cover and land use categories:
Anthropogenic—Built-up areas, industrial zones, roads, and paved surfaces (non-vegetated);
Agricultural—Arable land and seasonal crops (excluding permanent grasslands);
Broad-leaved forest—Forested areas dominated by deciduous trees;
Coniferous forest—Forested areas dominated by coniferous trees;
Grassland—Meadows, pastures, lawns (including urban green lawns), and other herbaceous vegetation;
Shrubs and scrubland—Areas covered with dense shrub vegetation;
Wetlands—Marshes and other water-saturated areas;
Water bodies—Rivers, lakes, and other surface water features.
For each area (1.5 km and 3 km), the percentage share of each land cover category was calculated. It was established that the total land cover was constant at 100% per location. It is important to note that the ‘anthropogenic’ category includes only impervious, non-vegetated surfaces (e.g., buildings and roads), while green areas in urban settings (such as parks) were classified as forests, grasslands, or shrublands, depending on the dominant vegetation type. This classification system enabled a comparison of the landscape composition between urban and rural apiaries and its relation to nectar foraging activity.
2.3. Statistical Methods
The following variables were analysed to ascertain the differences between location types (urban vs. rural): annual hive weight gain, annual hive weight loss, and the number of forage days. Student’s t-test was utilised for this purpose. Seasonal variation in nectar collection (i.e., monthly hive weight gains) was analysed using the non-parametric Kruskal–Wallis test separately for urban and rural apiaries. The medians were then compared across April, May, June, July, and August, where the Kruskal–Wallis test indicated significant differences; post hoc pairwise comparisons were conducted using the Mann–Whitney U test with Bonferroni correction. The Mann–Whitney U test was also used to assess differences in the percentage share of individual land cover classes within a 3 km radius around urban and rural apiaries. The proportion of each land cover class in the areas around the hives (1.5 km vs. 3 km) was compared using a chi-squared test (χ2) based on contingency tables.
To explore the relationship between landscape structure and nectar foraging efficiency, a multivariate and rank-based approach was applied. Kendall’s tau coefficient (τ) was calculated between annual hive weight gain and the percentage cover of each land cover type within the surrounding landscape. Additionally, pairwise correlations were computed between all landscape variables to assess co-occurrence patterns.
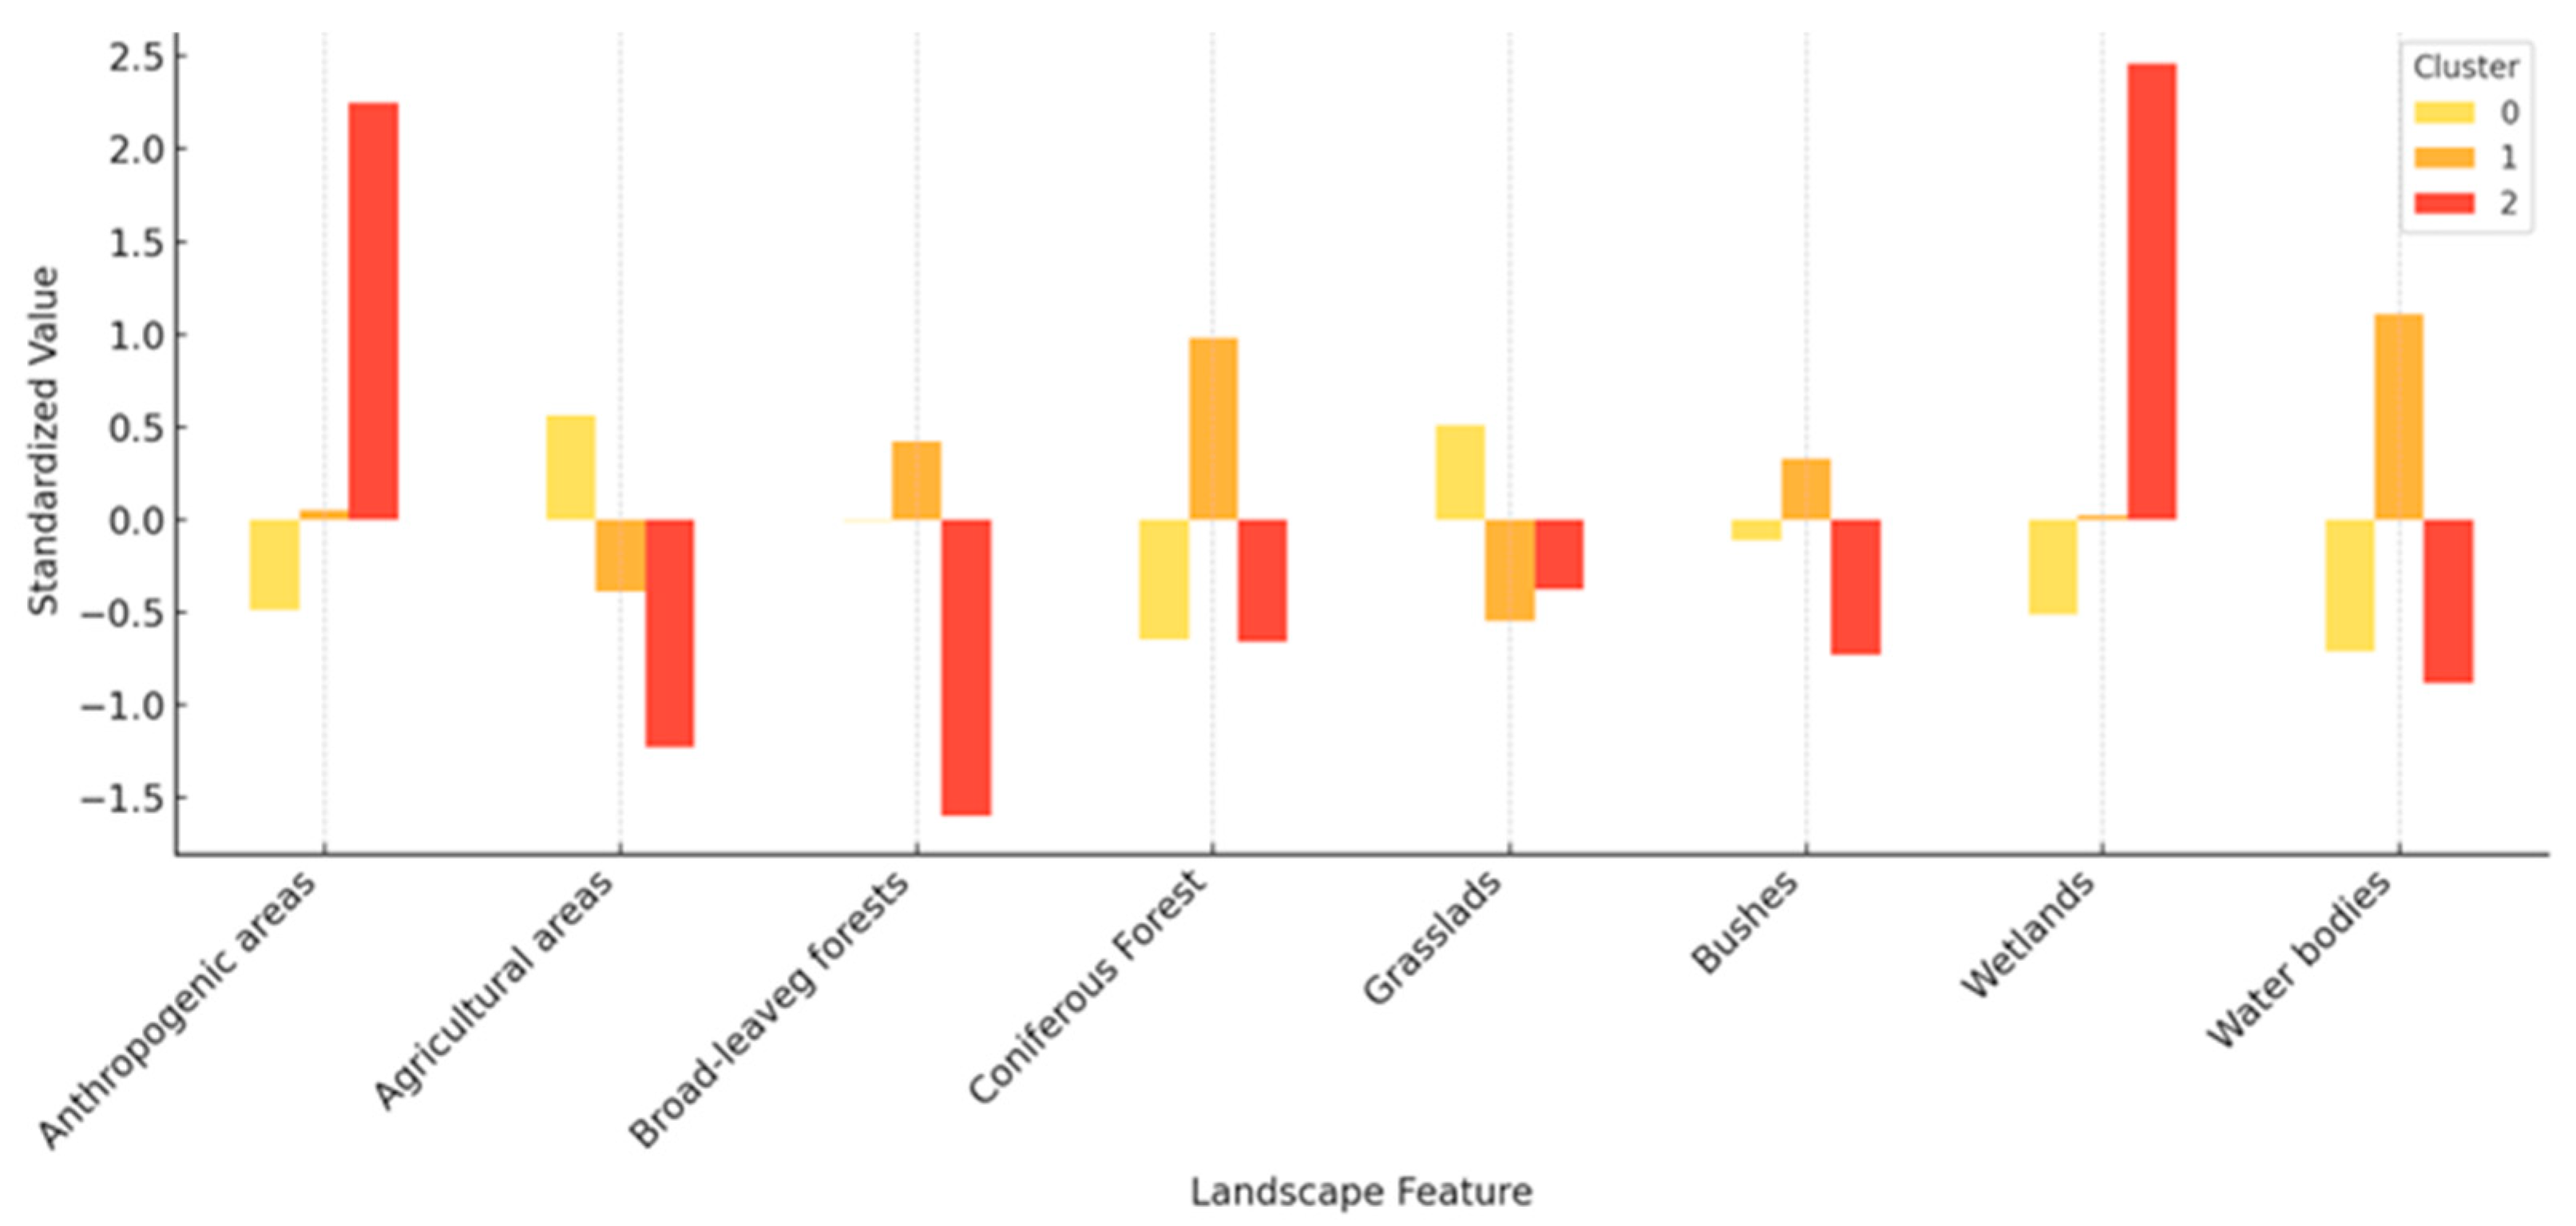
A principal component analysis (PCA) was performed to reduce multicollinearity among landscape variables. The analysis was based on a data matrix consisting of 10 apiaries × 8 variables (i.e., the percentage share of each of the 8 land cover classes). Principal components were then extracted and interpreted based on their variable loadings. The coordinates of the apiaries on the first two components (PC1 and PC2) were then utilised for apiary site clustering. Two clustering methods were evaluated: non-hierarchical k-means clustering and DBSCAN (Density-Based Spatial Clustering), with the latter adapted for small sample sizes. The objective of this analysis was to ascertain whether apiaries naturally grouped according to similar landscape compositions. To this end, differences in nectar yield between the identified clusters were subjected to one-way ANOVA. All analyses and graphical interpretations were performed using Statistica 13 (Informer Technologies Inc., Los Angeles, CA, USA) [
41].
4. Discussion
The findings demonstrated that there was no statistically significant variation in the total annual nectar yield of honeybees between urban and rural apiaries. However, the active foraging period, defined as the number of days on which nectar is gathered, was found to be longer in urban areas. This finding indicates that urban environments may offer honeybees comparable nectar resources to those found in agricultural landscapes. These findings are consistent with observations by Fox et al. [
22], who demonstrated that complex urban ecosystems offer a richer and more diverse foraging base for
Apis mellifera than suburban or rural landscapes. Concurrently, Samuelson et al. [
23] corroborated the hypothesis that bees in urban environments may exhibit a predilection for urban forage sources over those available in agricultural areas. However, research conducted in Ohio by Sponsler and Johnson [
25] suggests that agricultural landscapes may support higher colony success, highlighting the complex nature of this relationship. Consequently, our findings align with the hypothesis that the structural characteristics of the environment and the perpetual accessibility of nectar resources may hold more significance than the simple categorisation of environments as urban or rural. The increased number of foraging days observed in urban areas suggests that urban honeybees had access to floral resources over a longer portion of the season. This phenomenon may be attributed to the presence of more diverse and prolonged blooming vegetation, which is commonly observed in urban environments, such as parks, gardens, and green spaces, as well as ruderal and invasive plant species [
22]. Furthermore, Donkersley et al. [
37] observed that intensive agricultural landscapes shorten the period of forage availability and reduce pollen quality, particularly in terms of protein content.
Seasonal analysis revealed a distinct peak in honey yields during May and June for both urban and rural apiaries (
Figure S2). This pattern is consistent with the phenology of plants in temperate climates and with previous studies—for example, Meikle et al. [
11] reported that hive weight dynamics are strongly influenced by periods of intense flowering. Similarly, Odoux et al. [
35] emphasised that the availability of spring forage is critical for the energy balance of honeybee colonies in agricultural landscapes. In urban environments, however, the peak in nectar collection shifted slightly towards later months (
Figure S2), likely due to the blooming of linden trees (
Tilia spp.) and ornamental plantings that flower in June and July. A similar seasonal shift was observed by McMinn-Sauder et al. [
27], who found that differences in plant phenology between urban and agricultural areas in the U.S. led to variations in foraging dynamics.
Notwithstanding the marked disparities in land cover structure—notably, a higher proportion of built-up areas in urban sites and more arable land in rural areas—correlation analysis failed to establish any discernible relationship between the proportion of specific land cover classes and nectar yield. The strongest correlation, albeit statistically non-significant, was observed for shrub-covered areas. These findings suggest that honeybees may be able to forage effectively across diverse landscapes, provided that sufficient nectar-producing plants are available. The quality and diversity of vegetation, rather than the type of land cover per se, are the determining factors in pollinator presence and activity, as highlighted in studies by Ayers and Rehan [
31] and Rahimi et al. [
32]. Conversely, Sande et al. [
34] and Odoux et al. [
35] reported a positive correlation between forest proximity and honey yield. However, this correlation was not observed in the present study. This discrepancy may be attributable to the limited sample size or the high foraging flexibility of honeybees in resource selection [
5,
6]. Furthermore, Clermont et al. [
38] hypothesise that specific land cover types, notably those associated with transportation infrastructure or industrial areas, may potentially augment the risk of winter colony losses. This finding suggests that the presence of forage resources alone does not fully capture the complexity of landscape effects on honeybees. To illustrate the relationship between landscape structure and nectar yield in a precise manner, third-degree non-linear regressions were performed for each land cover class. These plots, which depict the relationship between the proportion of a given land cover type within a 3 km radius and the annual hive weight gain, corroborate the general conclusions drawn from Kendall’s correlation analysis, namely, the absence of strong, consistent linear relationships. Concurrently, these plots unveiled specific non-linear patterns, which might offer variable interpretative value.
For shrub-covered areas and coniferous forests, an upward trend was observed at intermediate levels of land cover, which may indicate a beneficial effect of mosaic-like woodland and shrub habitats on forage availability—consistent with previous findings by Sande et al. [
34] and Odoux et al. [
35]. In the case of shrubs, a distinct peak appears within the range of 6–7.5% coverage, suggesting the existence of an optimal proportion of this land cover class that supports high floral diversity (e.g., brambles, wild roses, and goldenrod). In contrast, for agricultural areas and anthropogenic areas, a clear decline in nectar yield was observed at intermediate levels of land cover (approximately 30–40%), which supports earlier conclusions regarding the negative impact of monoculture farming and built-up areas on the balance and sustainability of floral resources [
37,
38]. Interestingly, at very high levels of anthropogenic land cover (>50%), the model indicates a renewed increase in yields. This may be attributed to the presence of green infrastructure in densely built urban environments—such as parks, gardens, and rooftop vegetation—which are classified separately but strongly correlated with built-up areas [
22]. Furthermore, in urban areas, individual trees, which are not categorised separately, can assume a significant role. The total number of these trees within the flight radius of bees can be substantial. This phenomenon is especially apparent in urban environments, as evidenced by the case study of Warsaw, the largest city where linden trees have been extensively planted. The study found that trees exhibited the most pronounced levels of nectar production because of the heat island effect. The plots for the remaining land cover classes—wetlands, water bodies, and grasslands—show broad confidence intervals and low effect sizes, indicating high uncertainty in the estimates and a relatively weak influence on nectar yield. This may suggest that these land cover types do not directly provide significant forage resources but could enhance nectar availability indirectly through effects on microclimate or the presence of specific nectar-producing plants, such as willows along watercourses.
In summary, the relationships between land cover composition and apiary productivity may follow curvilinear patterns, which helps explain the lack of strong linear correlations. Identifying optimal ranges of certain land cover types—such as 6–8% shrub cover or 10–20% coniferous forest—may provide useful insights for both beekeeping practices and spatial planning.
The PCA revealed clear differences in landscape structure between urban and rural apiaries; however, these differences did not translate into distinct groups of apiaries with varying nectar yields. The application of clustering methods based on landscape features did not result in the identification of productivity-based classes, thereby suggesting a high degree of flexibility in the way honeybees exploit available resources. This finding underscores the potential significance of qualitative factors that were not incorporated in the analysis, such as floral species composition, water availability, and exposure to agrochemicals. Honeybees have a wide foraging range, up to 13 km, according to Eckert [
1], which enables them to compensate for local shortages by accessing distant foraging patches. Furthermore, studies by León and Arias-Castro [
2] and Couvillon et al. [
7] emphasise that bees optimise their foraging routes based on the energetic value of available resources. This suggests that even in landscapes that appear to be poor in resources, bees may efficiently exploit the most productive areas within their reach. The absence of correlation between nectar yield and landscape type may, therefore, be indicative not only of the high mobility and adaptive foraging behaviour of honeybees but also of certain methodological limitations. For instance, the relatively low spatial resolution of remote sensing data utilised in this study (pixel size 10 m) may fail to capture subtle qualitative variations in vegetation that are pertinent to foraging. In future research, the use of UAV (Unmanned Aerial Vehicle) technologies and multispectral imaging for more precise identification of nectar-producing plants, as suggested by Papachristoforou et al. [
19] and Anderson et al. [
21], may prove beneficial.
The results of this study have significant practical implications. Firstly, the findings indicate that urban beekeeping can achieve comparable levels of productivity to that of rural beekeeping, contingent on the presence of suitable urban green structures. The promotion of diverse flowering plantings in urban green spaces, including parks, community gardens, and wildflower meadows, has the potential to support honeybees. In contrast, rural areas require landscape diversification, encompassing the preservation of shrublands, the establishment of flower strips, the reduction in monocultures, and the promotion of nectar-rich cover crops [
36,
37]. From a spatial planning and environmental management perspective, it is essential to integrate pollinator needs into green space design, both in urban and agricultural settings. The findings of this study lend support to the notion that the continuity and diversity of floral resources are of greater importance than the landscape type alone, thus making this a central consideration for sustainable land use strategies and pollinator conservation.
The findings of this study highlight the need for a more in-depth analysis of the relationship between landscape structure and honeybee productivity, considering factors that go beyond basic land cover classification. In particular, expanding the number of study locations and observation years would allow for a better understanding of interannual variability, as well as a more accurate assessment of the influence of meteorological conditions and dominant nectar sources in each season. As shown in [
42], factors such as flower opening time and environmental conditions directly affect nectar secretion in winter oilseed rape varieties, which can significantly modulate forager behaviour and nectar collection dynamics at the colony level. Future research should incorporate more detailed indicators of bee forage, including vegetation classified by species, flowering seasonality, and nectar production potential. Remote sensing technologies such as multispectral drone imagery [
19] and other UAV-based floral resource detection systems [
21] offer promising tools for mapping the actual foraging base available to bees. It would also be valuable to integrate hive weight data with other sources of information, such as weather conditions, the presence of agrochemicals near apiaries, or colony health indicators. This systems-based approach would allow researchers to assess not only the impact of forage availability on honey production but also on overall colony condition and resilience. Finally, the use of artificial intelligence and predictive models represents a promising avenue for future work. These tools could combine landscape, meteorological, and hive monitoring data to forecast nectar yields and assess environmental risks [
13]. Such innovations could transform apiary management, particularly in the face of climate change and increasing urbanisation.


