Article

Stability Monitoring and Numerical Simulation of Weathering Transition Zones in Dam Slopes of Tropical Islands

1
School of Civil Engineering and Architecture, Hainan University, Haikou 570228, China
2
State Key Laboratory of Hydroscience and Engineering, Tsinghua University, Beijing 100084, China
*
Author to whom correspondence should be addressed.
Appl. Sci. 2025, 15(8), 4499; https://doi.org/10.3390/app15084499
Submission received: 17 February 2025 / Revised: 16 April 2025 / Accepted: 16 April 2025 / Published: 18 April 2025

Abstract

:
Rainfall infiltration and groundwater fluctuations induced by cyclonic rainfall are the main causes of slope failure. Slope stability monitoring is key to preventing and controlling rock slope failure. Aiming at the monitoring theory and technical problems of dam slope failure under a cyclonic rainfall environment, this study carried out a physical model test and numerical simulation on the stability monitoring of the weathering transition zone in rock slopes. The results show that: (1) Under cyclonic rainfall, the increased permeability, the expansion of the rock fracture network, and the decrease of effective stress are the main causes of increased lateral deformation of the slope. (2) Physical model test results showed that rain spatter erosion and runoff erosion could lead to rapid loss of anchor bolt preload. In the hydraulic fluctuation stage, the anchor bolt axial force decreased first, then increased, and finally tended to be stable. The unloading response of the Intelligent Terminal Structure was significant during rock block sliding. In the numerical simulation, the anchor bolt axial force increased continuously with the increase of lateral displacement of slope. (3) By analyzing the evolution of anchor bolt axial force and pore water pressure in the weathering transition zone, a monitoring criterion for the stability of the weathering transition zone of rock slopes based on the Logistic function was proposed.

1. Introduction

Extreme cyclonic rainfall events have become a significant threat to the safety of urban infrastructure in coastal areas [1]. The tropical monsoon marine climate makes the surface of Hainan Island subject to strong weathering effects. The strata of Hainan Island have the sedimentary transition characteristics of residual soil, strongly weathering zone, weakly weathering zone, and intact bedrock from surface to deep layer [2,3]. The fracture seepage of the rock blocks in the weathering transition zone is significantly enhanced under the cyclonic rainfall environment, and the weathering fracture can evolve into the dominant structural plane under the hydraulic fluctuation, inducing dam slope failure [4,5,6]. Therefore, it is of great significance to study the stability monitoring method of the weathering transition zone to prevent dam slope failure.
To evaluate the stability of slope anchoring systems through stress response, He [7] developed a landslide monitoring system based on the interaction between slopes and support structures. Zhou et al. [8] showed that changes in the internal forces of support structures can promptly reflect the sliding trends of structural surfaces. Meng et al. [9] carried out a model test on the stability of the seabed data center infrastructure and proposed a stability evaluation method based on the loss of anchor bolt prestress. Zerradi et al. [10] optimized the design method of the maximum safe foot of fractured rock slopes by using the stereographic projection method of key block theory. Sdvyzhkova et al. [11] studied the distribution of the safety factor along the perimeter of the Kacharsky open pit with a numerical simulation method and revealed the influence of ore excavation completeness on the stripping ratio.
The physical model test is a crucial method for studying slope failure mechanisms and monitoring theories. Research progress in this area includes: (1) Systematic results have been achieved regarding the disaster mechanisms of external factors such as hydrology and climate. Some studies show that different rainfall patterns significantly affect slope failure modes [12,13]. Infiltration boundary conditions also play an important role in slope failure [14]. Slope instability is common in typhoon environments, where wind-induced disturbances in the vegetation root zone accelerate rainwater infiltration, triggering typhoon-related landslides [15,16]. (2) Slopes with special structural planes and natural joints are susceptible to hydrodynamic disasters [17,18,19]. Under rainfall conditions, vertical joint surfaces within slopes can experience progressive damage due to seepage [20]. The permeability difference at geological interfaces and seepage crack propagation are the main causes of slope failure under rainfall [21,22]. (3) Many scholars have conducted physical model tests on anchoring support mechanisms, verifying the effectiveness of support structures such as pier-anchor active nets, ductile anchor bolts, and anchor piles [23]. While progress has been made in understanding the seepage disaster mechanisms and monitoring theories of soil and rock block jointed slopes, stability monitoring in the weathering transition zone of dam slopes under cyclonic rainfall remains a fundamental technical problem. Cyclonic rainfall is characterized by high intensity, long duration, and strong wind [24,25]. Rapid saturation of rock and soil by rainwater infiltration and excess pore water pressure from unstable seepage are key factors in inducing slope failure. Therefore, developing monitoring technologies for slope seepage disasters under cyclonic rainfall conditions is essential.
This study focuses on the theoretical issue of stability monitoring for the weathering transition zones of island-type dam slopes under extreme cyclonic rainfall conditions. The failure process of the weathering transition zone in dam slopes under cyclonic rainfall was simulated by a physical model test and numerical simulation. The mechanical response of the anchorage system and the evolution of pore water pressure in the weathering transition zone under cyclonic rainfall was obtained, and a stability monitoring criterion of the slope weathering transition zone was further proposed. This study can provide theoretical guidance and technical reference for the stability monitoring of dam slopes.

2. Methods

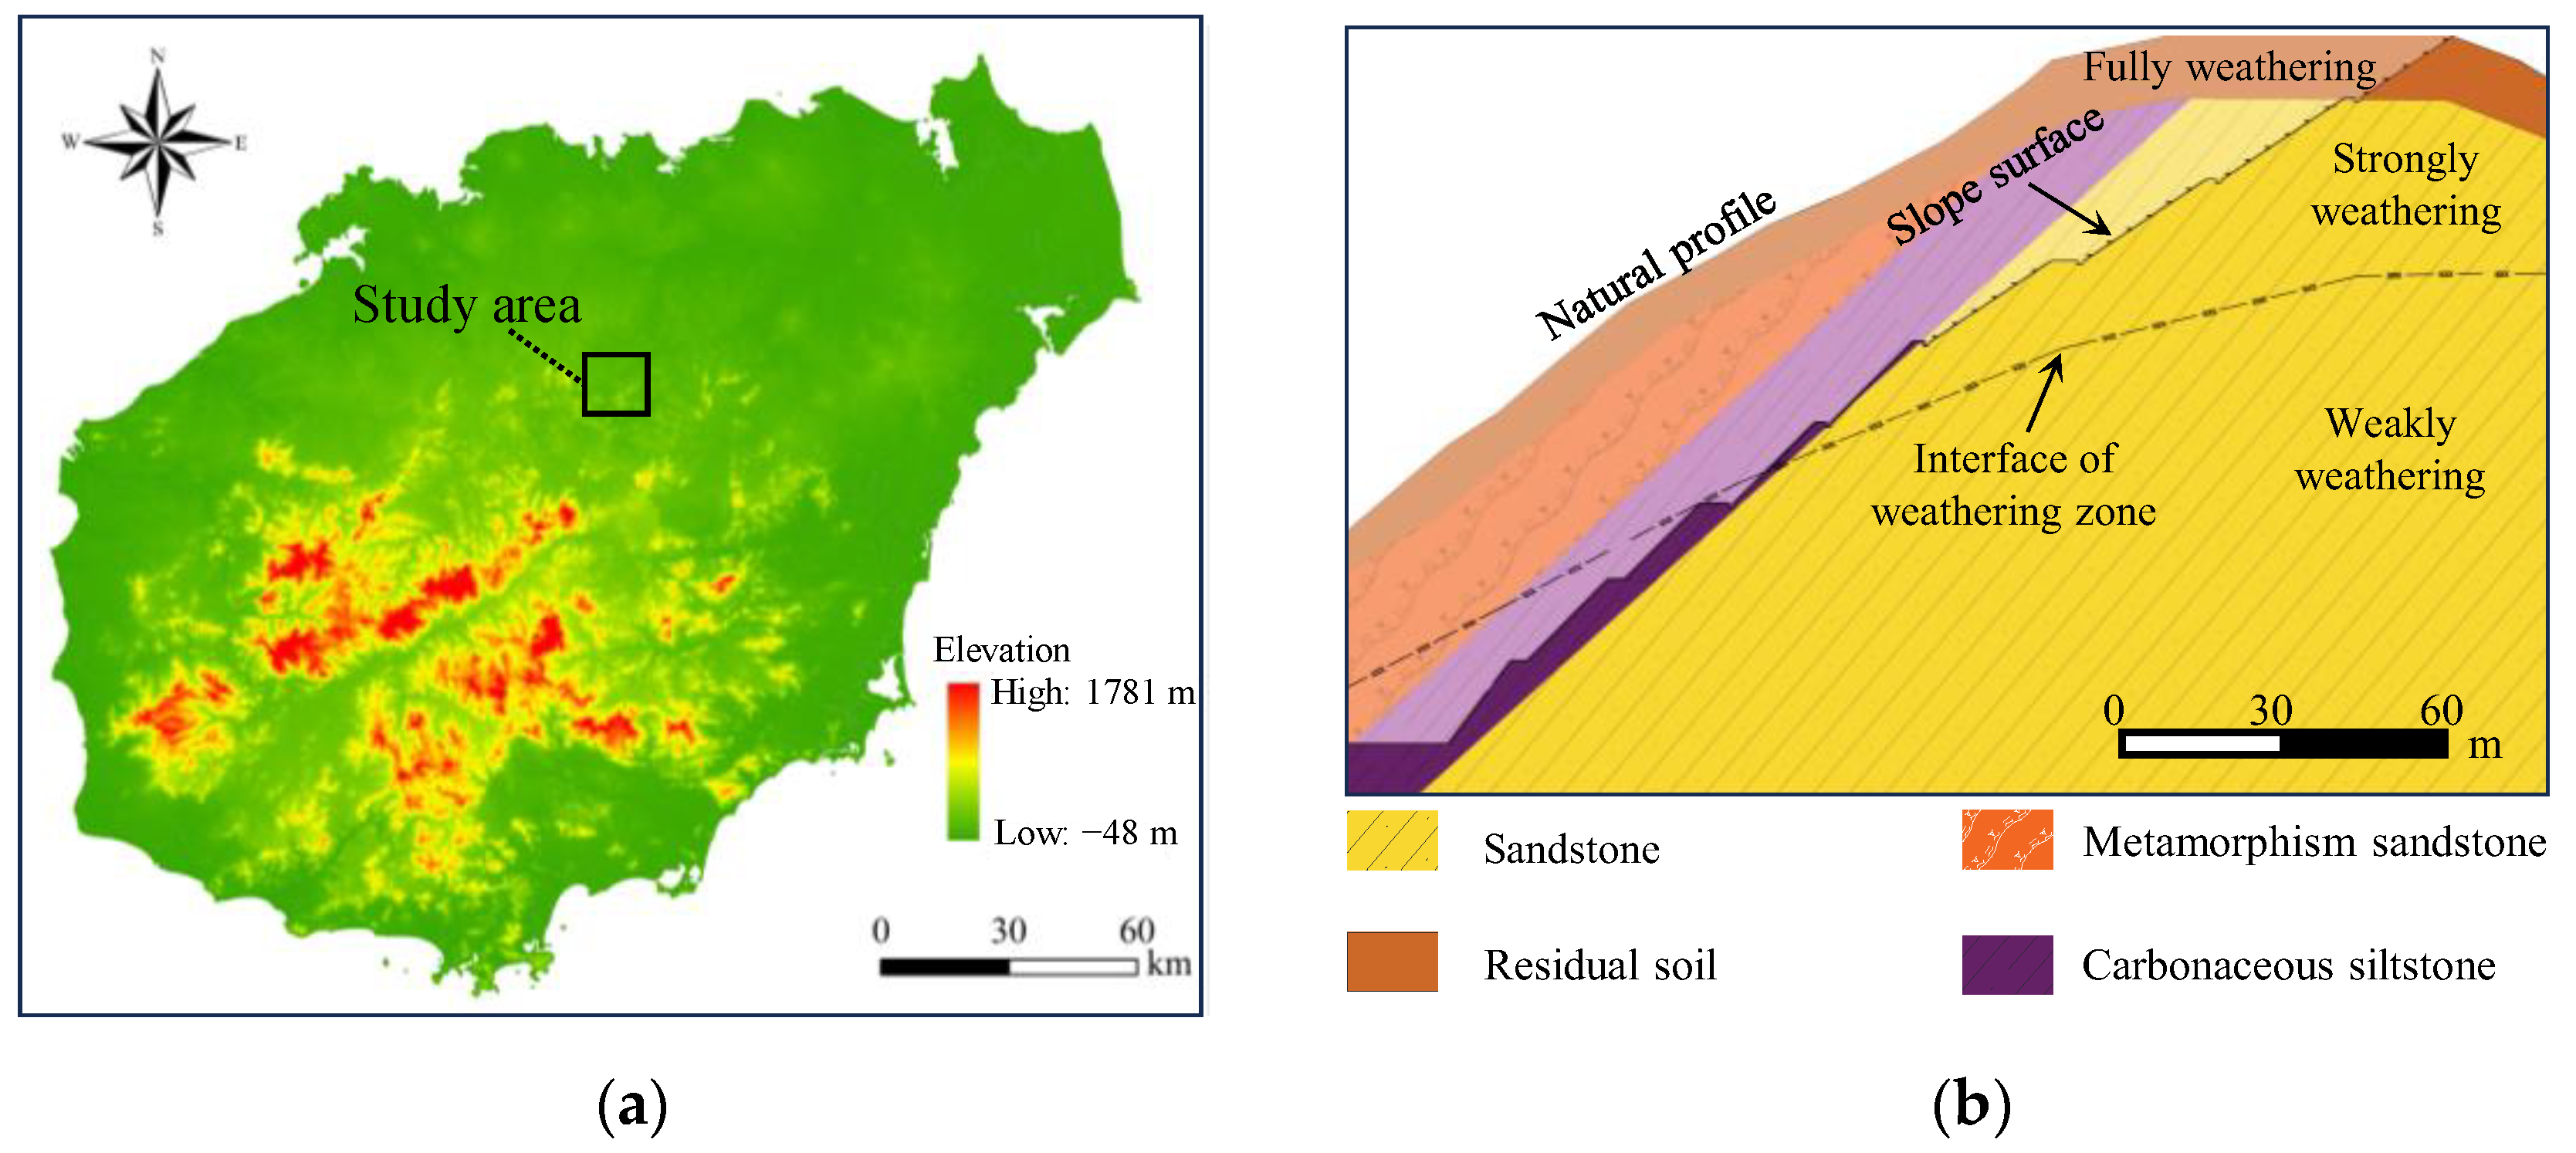
2.1. Project Background and Engineering Geology

Hainan Province proposed establishing an island-wide water conservancy network anchored by major hydrological hubs during the 14th Five-Year Plan period. Given the significant weathering transition characteristics of Hainan Island, cyclonic rainfall can cause rainwater infiltration and a strong groundwater fluctuation effect, which seriously threatens the stability of dam slopes [26]. This study takes a dam slope of a water conservancy construction project in Hainan Province, China as the engineering background (Figure 1a). As illustrated in Figure 1b, the slope comprises a thick weathering crust divided into four layers based on weathering intensity: fully weathering zone (thickness: 3.0~37.7 m), strongly weathering zone (upper boundary elevation: 55.7~131.7 m), weakly weathering zone (elevation: 28.9~102.3 m), and intact bedrock. The weathering transition zone (elevation: 39.95~121.82 m) consists of sandstone and low-grade metamorphic sandstone with abundant weathering fissures.

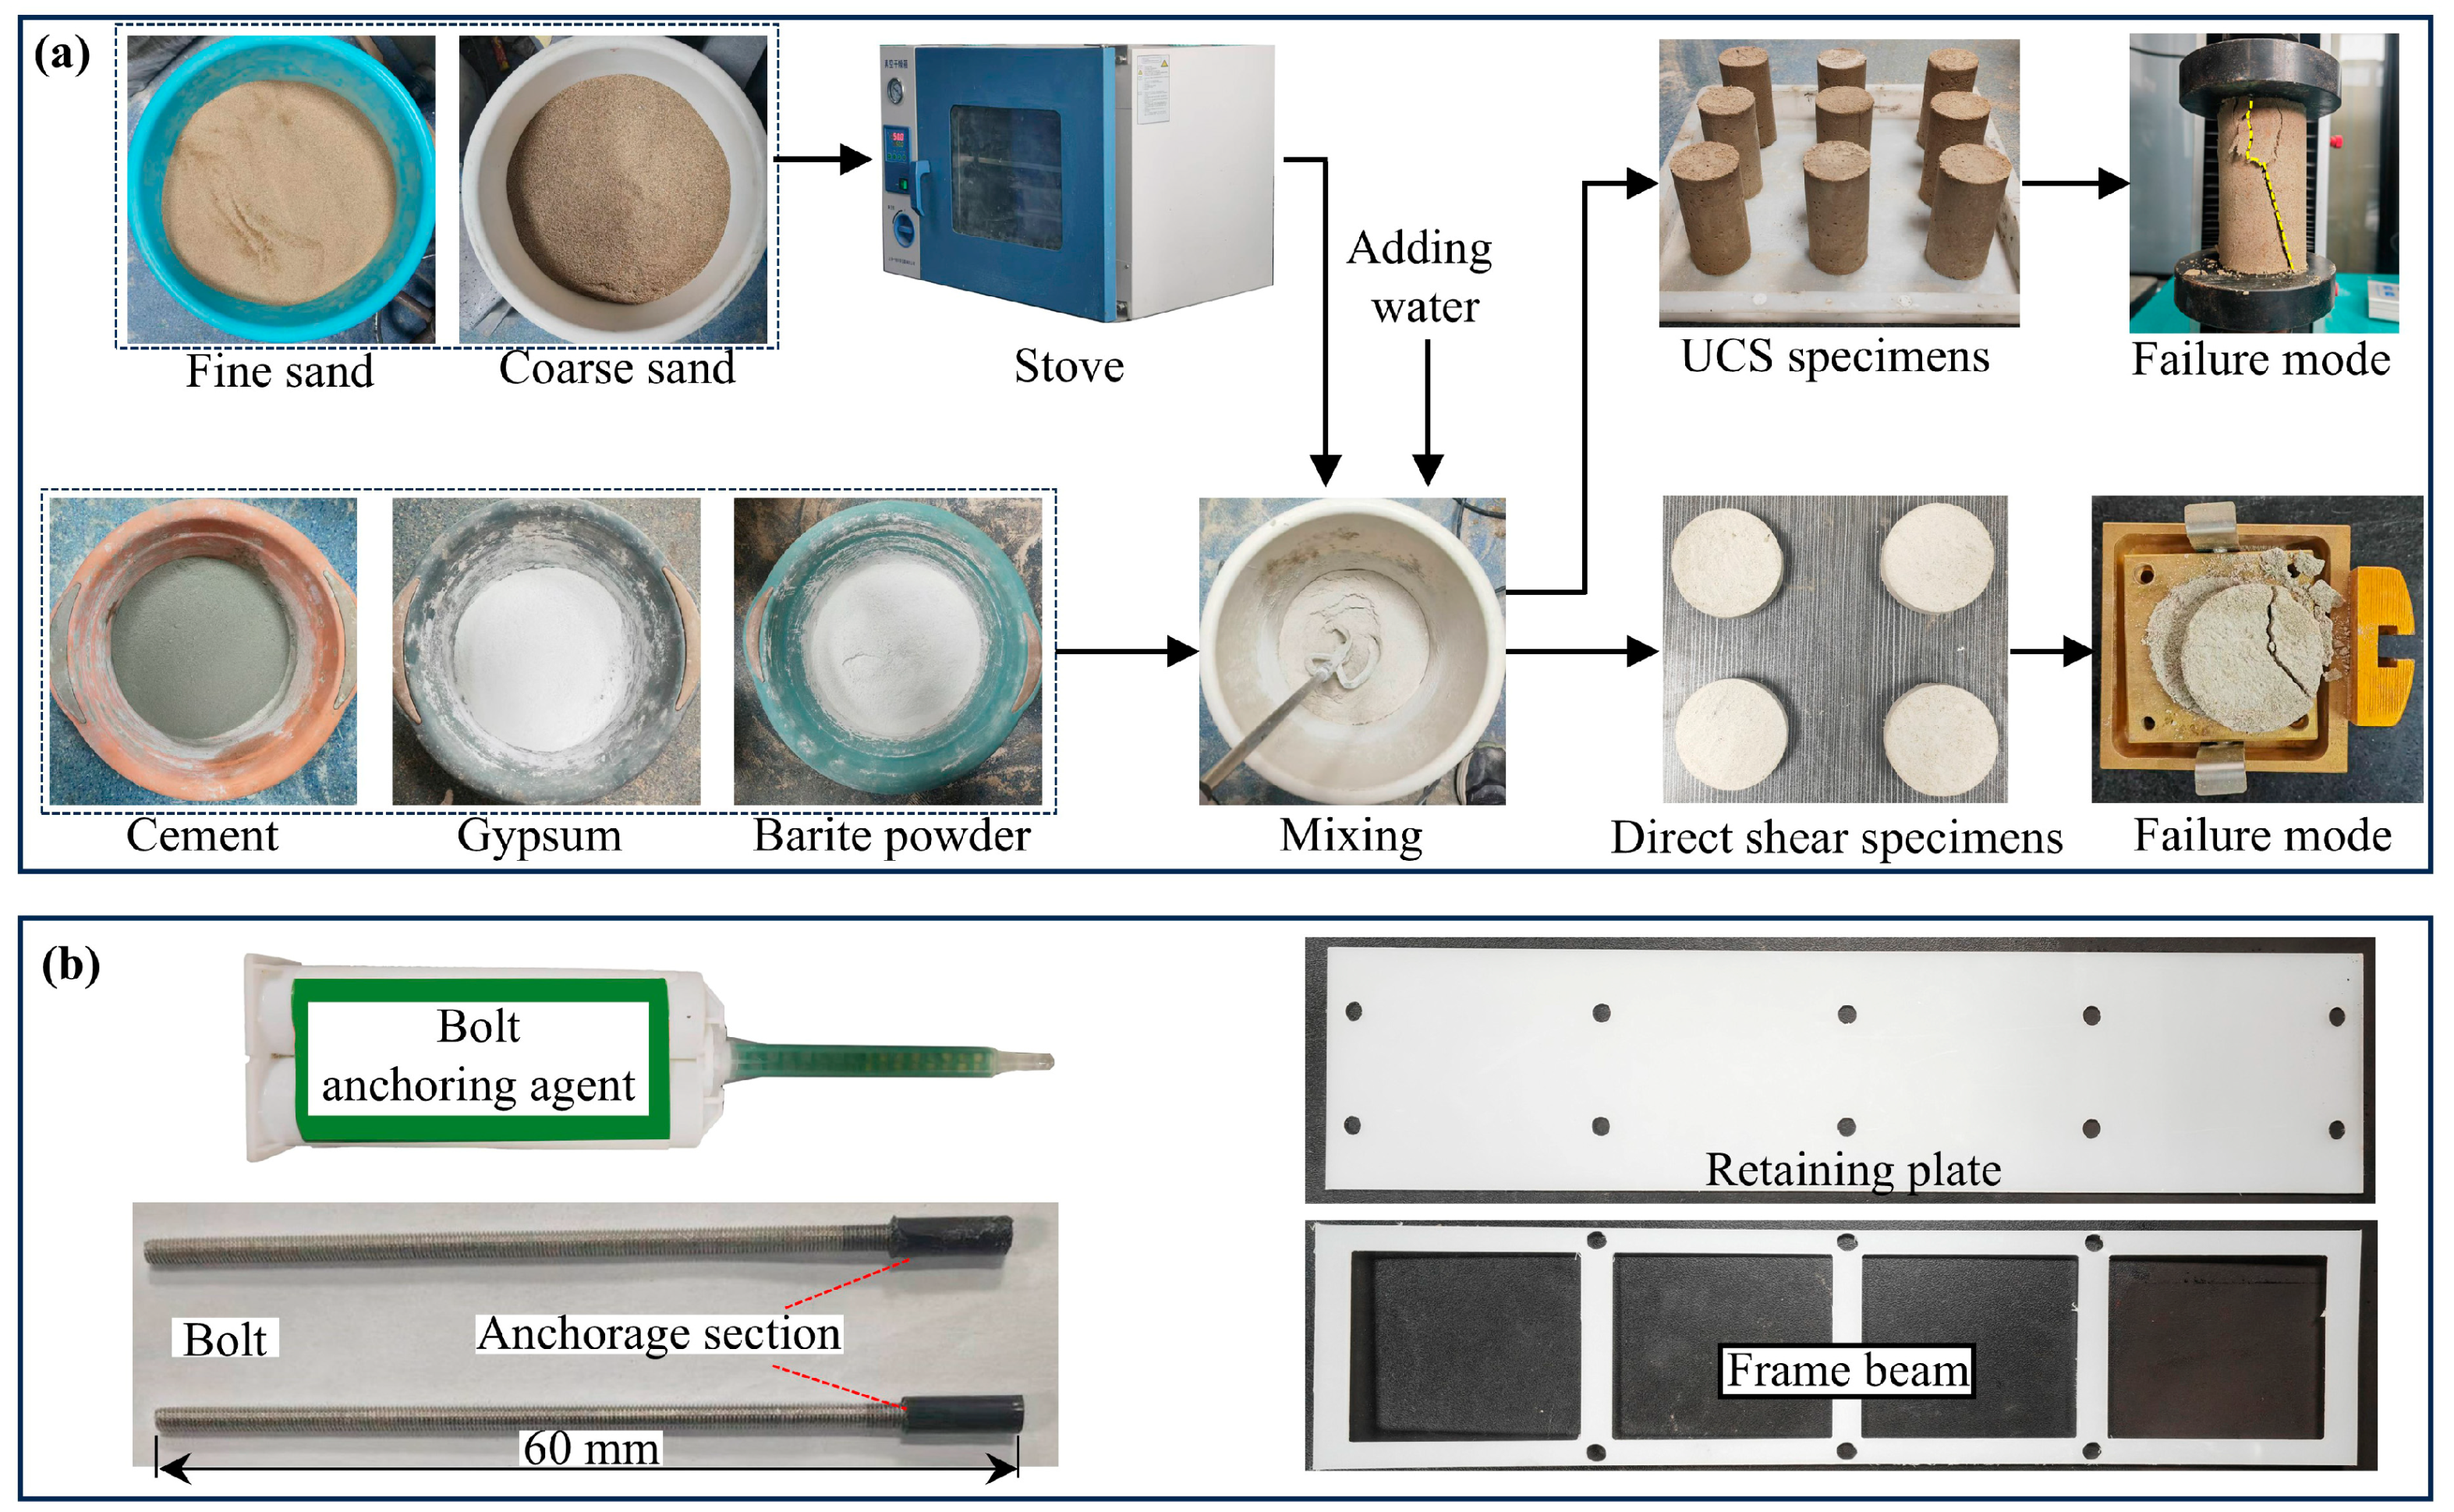
2.2. Similarity Theory and Materials

The model test is designed based on fundamental similarity theory, requiring that the relevant physical quantities of the model and prototype satisfy dimensional derivation equations [27]. The key physical quantities considered in the test include geometric dimensions L, density ρ , gravitational acceleration g, elastic modulus E, stress σ , internal friction angle φ , time t, and permeability k. Physical quantities L, ρ , and g were chosen as the basic physical quantities, with corresponding dimensions [L], [ M L 3 ], and [ L T 2 ], respectively. The similarity criterion function was obtained using the π theorem:
f π 1 , π 2 , π 3 = 0 ,
where, π 1 = σ ρ L g ; π 2 = k ( L g ) 0.5 ; π 3 = t L 0.5 g 0.5
The prototype slope has a height of 142 m, and the model box is 1.7 m in length × 0.45 m in width × 0.8 m in height. The geometric similarity constant CL is controlled by the ratio of slope height to model box height (142/0.8 = 177.5). In order to facilitate the model construction, CL = 200 was determined. Given that the weight of the slope rocks is relatively high, the density similarity constant C ρ = 1.3 was selected based on existing research experience [28]. As the test is conducted under 1-g conditions, the gravitational acceleration similarity constant Cg = 1 was determined. The similarity theory requires that the prototype and model similarity criteria are equal, allowing the remaining similarity constants to be calculated and summarized in Table 1.
Based on existing similar material studies [29], barite powder, fine river sand, coarse river sand, and gypsum were selected to prepare similar materials. The physical and mechanical parameters and the proportion of the similar materials are shown in Table 2 and Table 3, respectively. Through the uniaxial compression and direct shear tests, the mechanical properties of the materials were determined (Figure 2a). Rainfall infiltration is controlled by the permeability of the material, and the permeability coefficient was tested according to the variable head test. The frame beams and retaining plate were made of 2 mm thick polypropylene plates (Figure 2b).

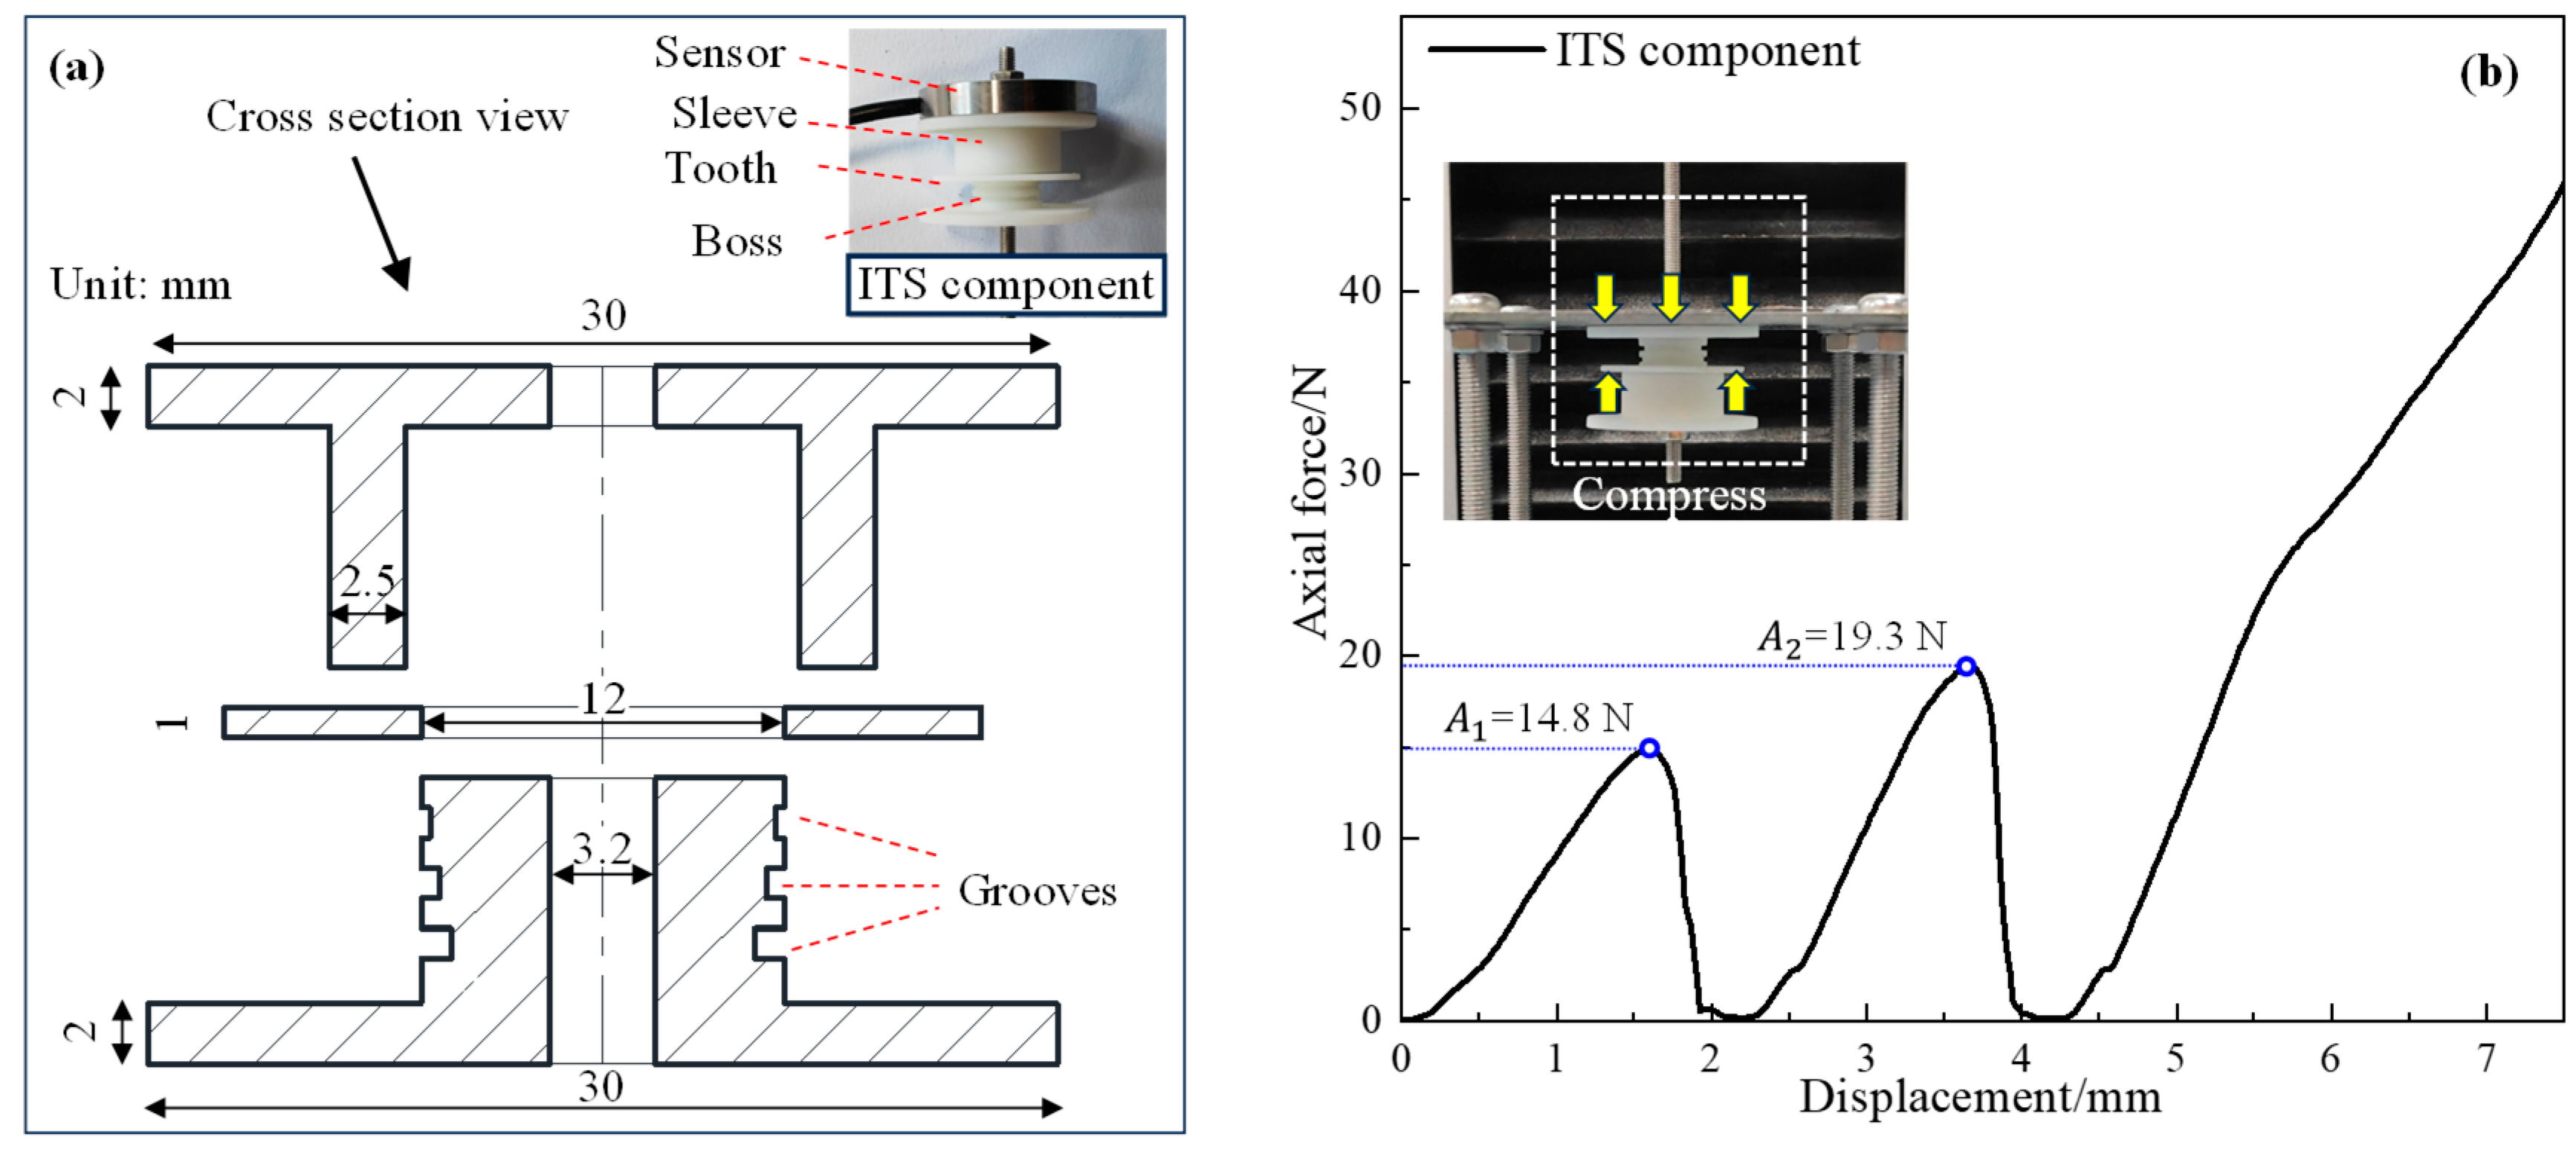
2.3. Experimental Instrument

The mechanical response of the supporting structure can reveal the surface and internal deformation of the slope [30,31]. Sun et al. developed an Intelligent Terminal Structure (ITS) sensing device for anchor systems in fractured rock blocks [32], which can perceive stress disturbances and deformation transfer in anchored jointed rock blocks [33]. In this study, 3D-printed ITS and bolts (diameter: 3 mm) were assembled as ITS components to monitor slope stability. As illustrated in Figure 3a, ITS consists of a ring, a boss, and a sleeve. The maximum outer diameter of the boss and the inner diameter of the ring are both 12.0 mm. The boss has three ring grooves, and the outer diameters from top to bottom are 11.9 mm, 11.8 mm, and 11.7 mm, respectively. The ring is initially located in the uppermost ring groove. When the axial pressure is greater than a certain value, the ring will be detached and moved to the next ring groove. When the ring groove moves, the axial force drops sharply. Therefore, there is a quantitative relationship between the unloading response of ITS and the axial deformation. As shown in Figure 3b, the ITS constitutive curve was tested by a uniaxial tensile test, demonstrating obvious unloading response characteristics. The two axial force peaks are 14.8 N and 19.3 N, and the deformations are 2.2 mm and 2.0 mm, respectively.
The strong groundwater fluctuation effect during cyclonic rainfall is an important cause of slope instability. Therefore, the groundwater fluctuation effect caused by rainstorms must be considered in the model test. The model test platform is shown in Figure 4. Referring to existing rainfall system design methods, a rainfall device composed of steel support and water pipe was made [31,34]. Based on existing strong wind simulation methods, 12 fans were used to create a strong wind simulation device with controllable wind speed [25]. In order to simulate the hydraulic fluctuation effect, a pre-buried pipe was used, and groundwater flow was controlled by adjusting the pump power (maximum flow: 0.025 L/s). In the test, a pore water pressure gauge (acquisition frequency: 1.0 Hz, resolution: 0.1 kPa) and an anchor bolt axial force sensor (acquisition frequency: 10.0 Hz, resolution: 0.1 N) were used to collect pore water pressure and the mechanical response of the anchoring system. The test process was recorded by a camera.

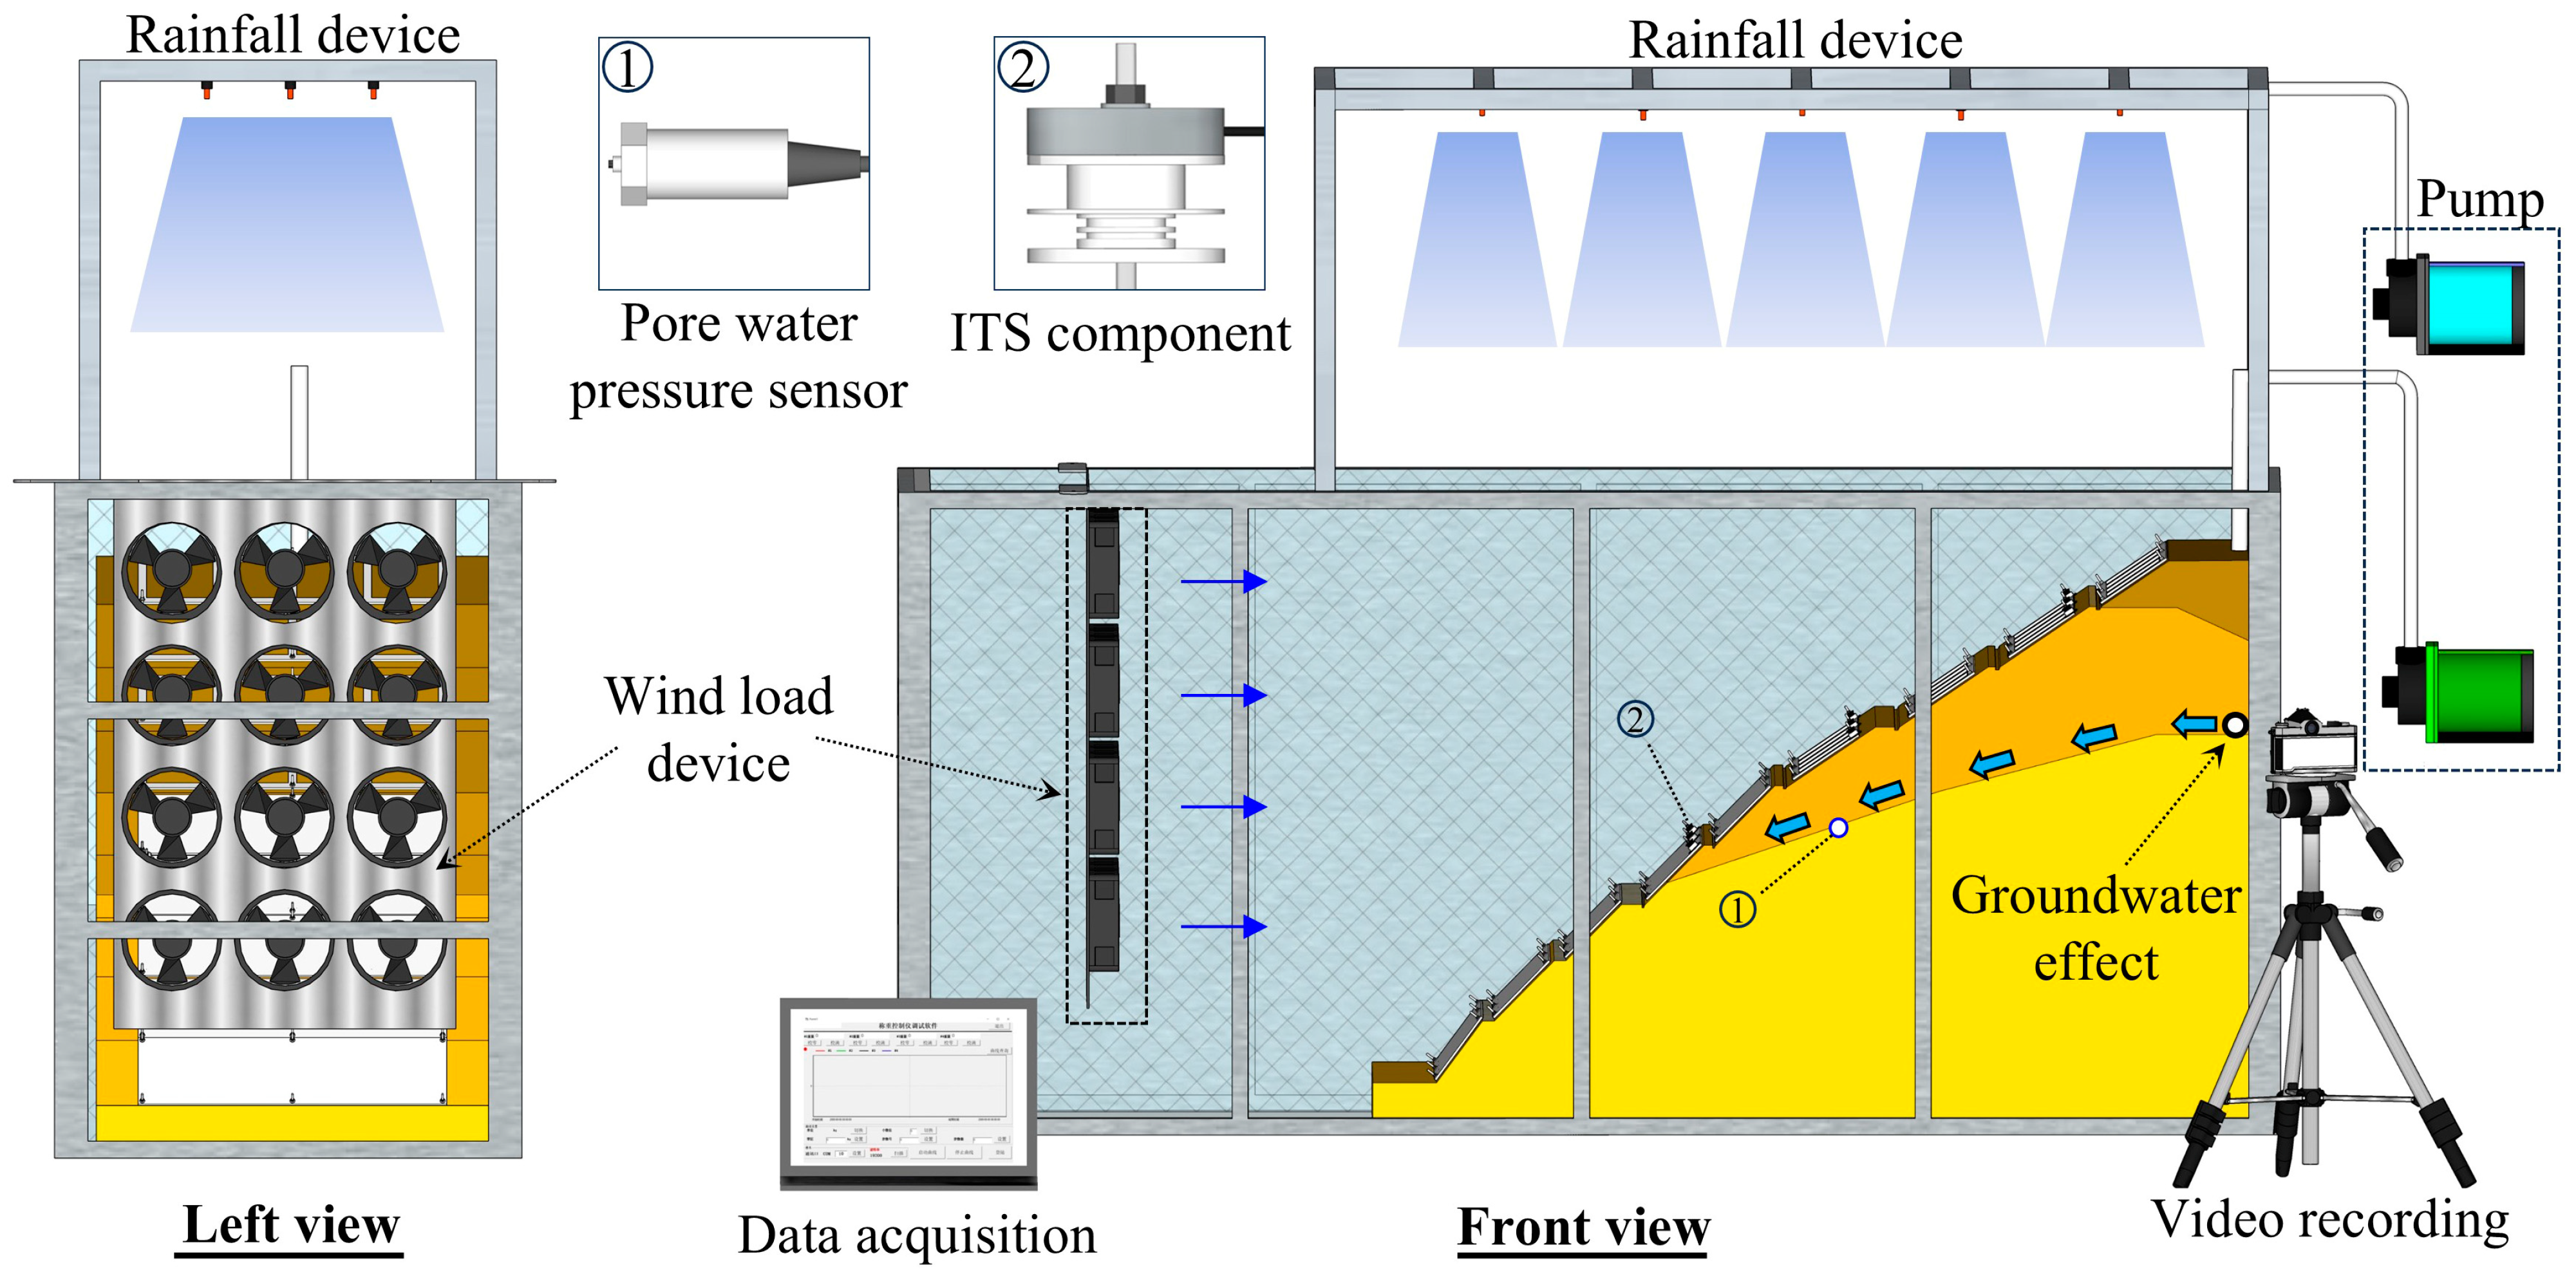
2.4. Model Test Process

(1)
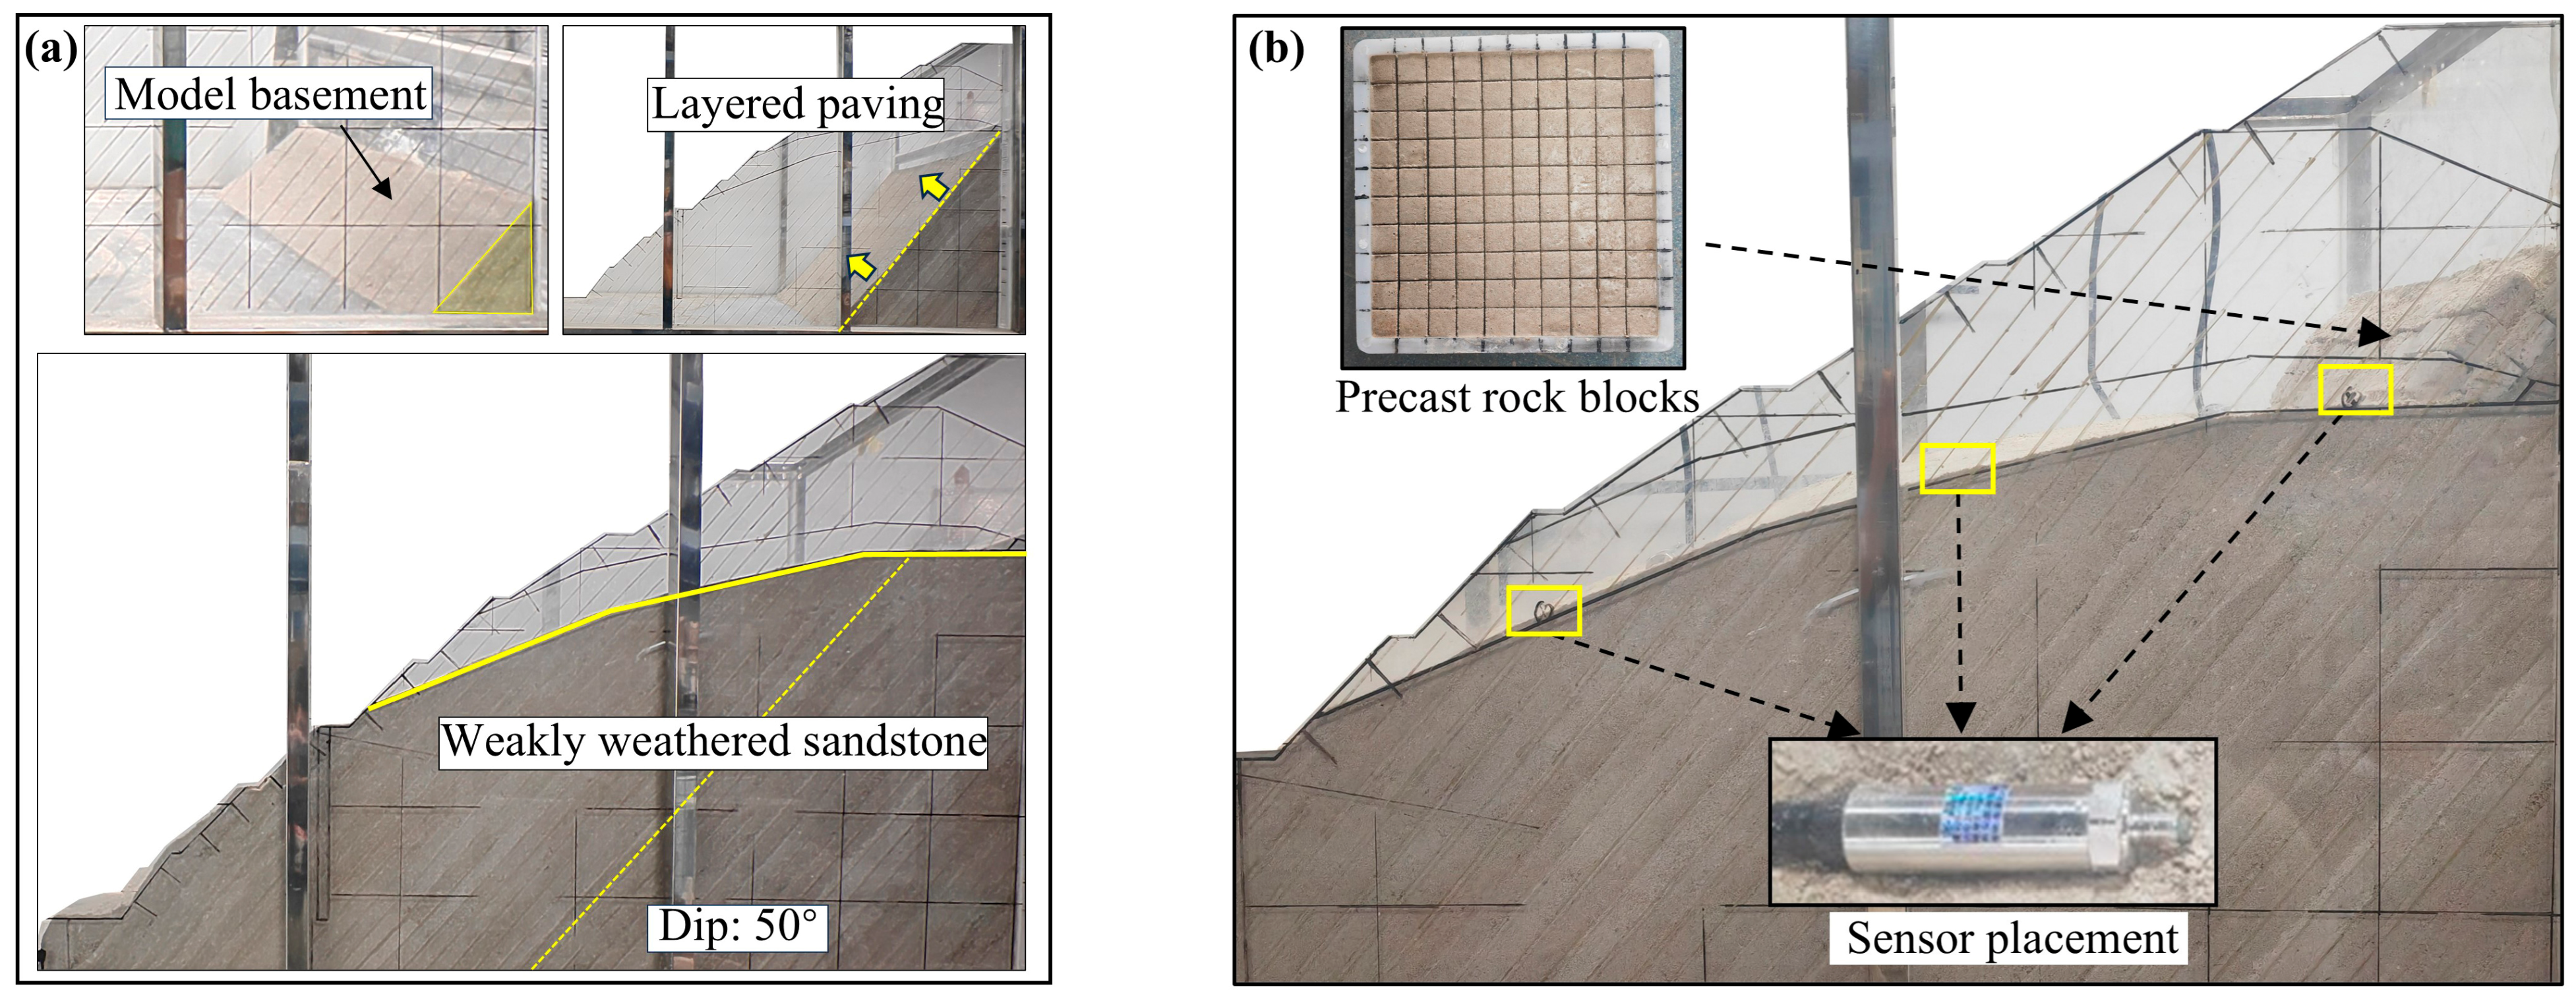
To simulate the natural fracture networks and joint set development in the dam slope, the stratified compaction and prefabricated block stacking method was used to simulate original stratigraphic deposition sequences (Figure 5). The weakly weathering zone and fully weathering zone were constructed by layer-compacting (dip angle: 50°, thickness: 2.0 cm), and the mica sheet was used to simulate interlayer structural planes. Prefabricated rock block (size: 2.5 × 2.5 × 2.0 cm) was used to simulate broken rock blocks in the strongly weathering zone. The similar material of the fully weathering zone was used to bond the rock blocks and fill the slope surface to meet the principle of fracture seepage advantage.
As illustrated in Figure 6, to monitor hydraulic responses under varying thicknesses of the strongly weathering zone, three pore water pressure sensors (P-1, P-2, and P-3) were placed across the interface between the strongly weathering zone and the weakly weathering zone. As shown in Figure 6, the response of the ITS components was used to feedback on the seepage failure and deformation of the slope weathering transition zone. Under cyclonic rainfall, the strongly weathering zone with fracture networks is more prone to instability. Therefore, axial force sensors (ITS-1~ITS-9) and ITS components were installed and anchored on the fourth, sixth, and eighth-grade slopes, which are completely composed of the strongly weathering zone. The anchor bolts were anchored at the end, and a preload force of about 20.0 N was applied to each ITS monitoring anchor bolt.
(2)
In the experiment, the gradient-enhanced wind and rainfall intensity were used to simulate the cyclonic rainfall environment. After reaching maximum wind and rainfall intensities, the groundwater diversion device was used to simulate the groundwater dynamic field. Referring to commonly used rainfall intensity determination methods [19], rainfall intensities of 35, 65, and 105 mm/h were adopted according to the historical rainfall data from the engineering region. Wind loading conditions were designed based on the wind speed similarity ratio. The test loading scheme is shown in Table 4. Four loading stages were used to simulate rainfall generation, rainfall intensification, and hydraulic fluctuation caused by cyclonic rainfall.

3. Results and Discussion

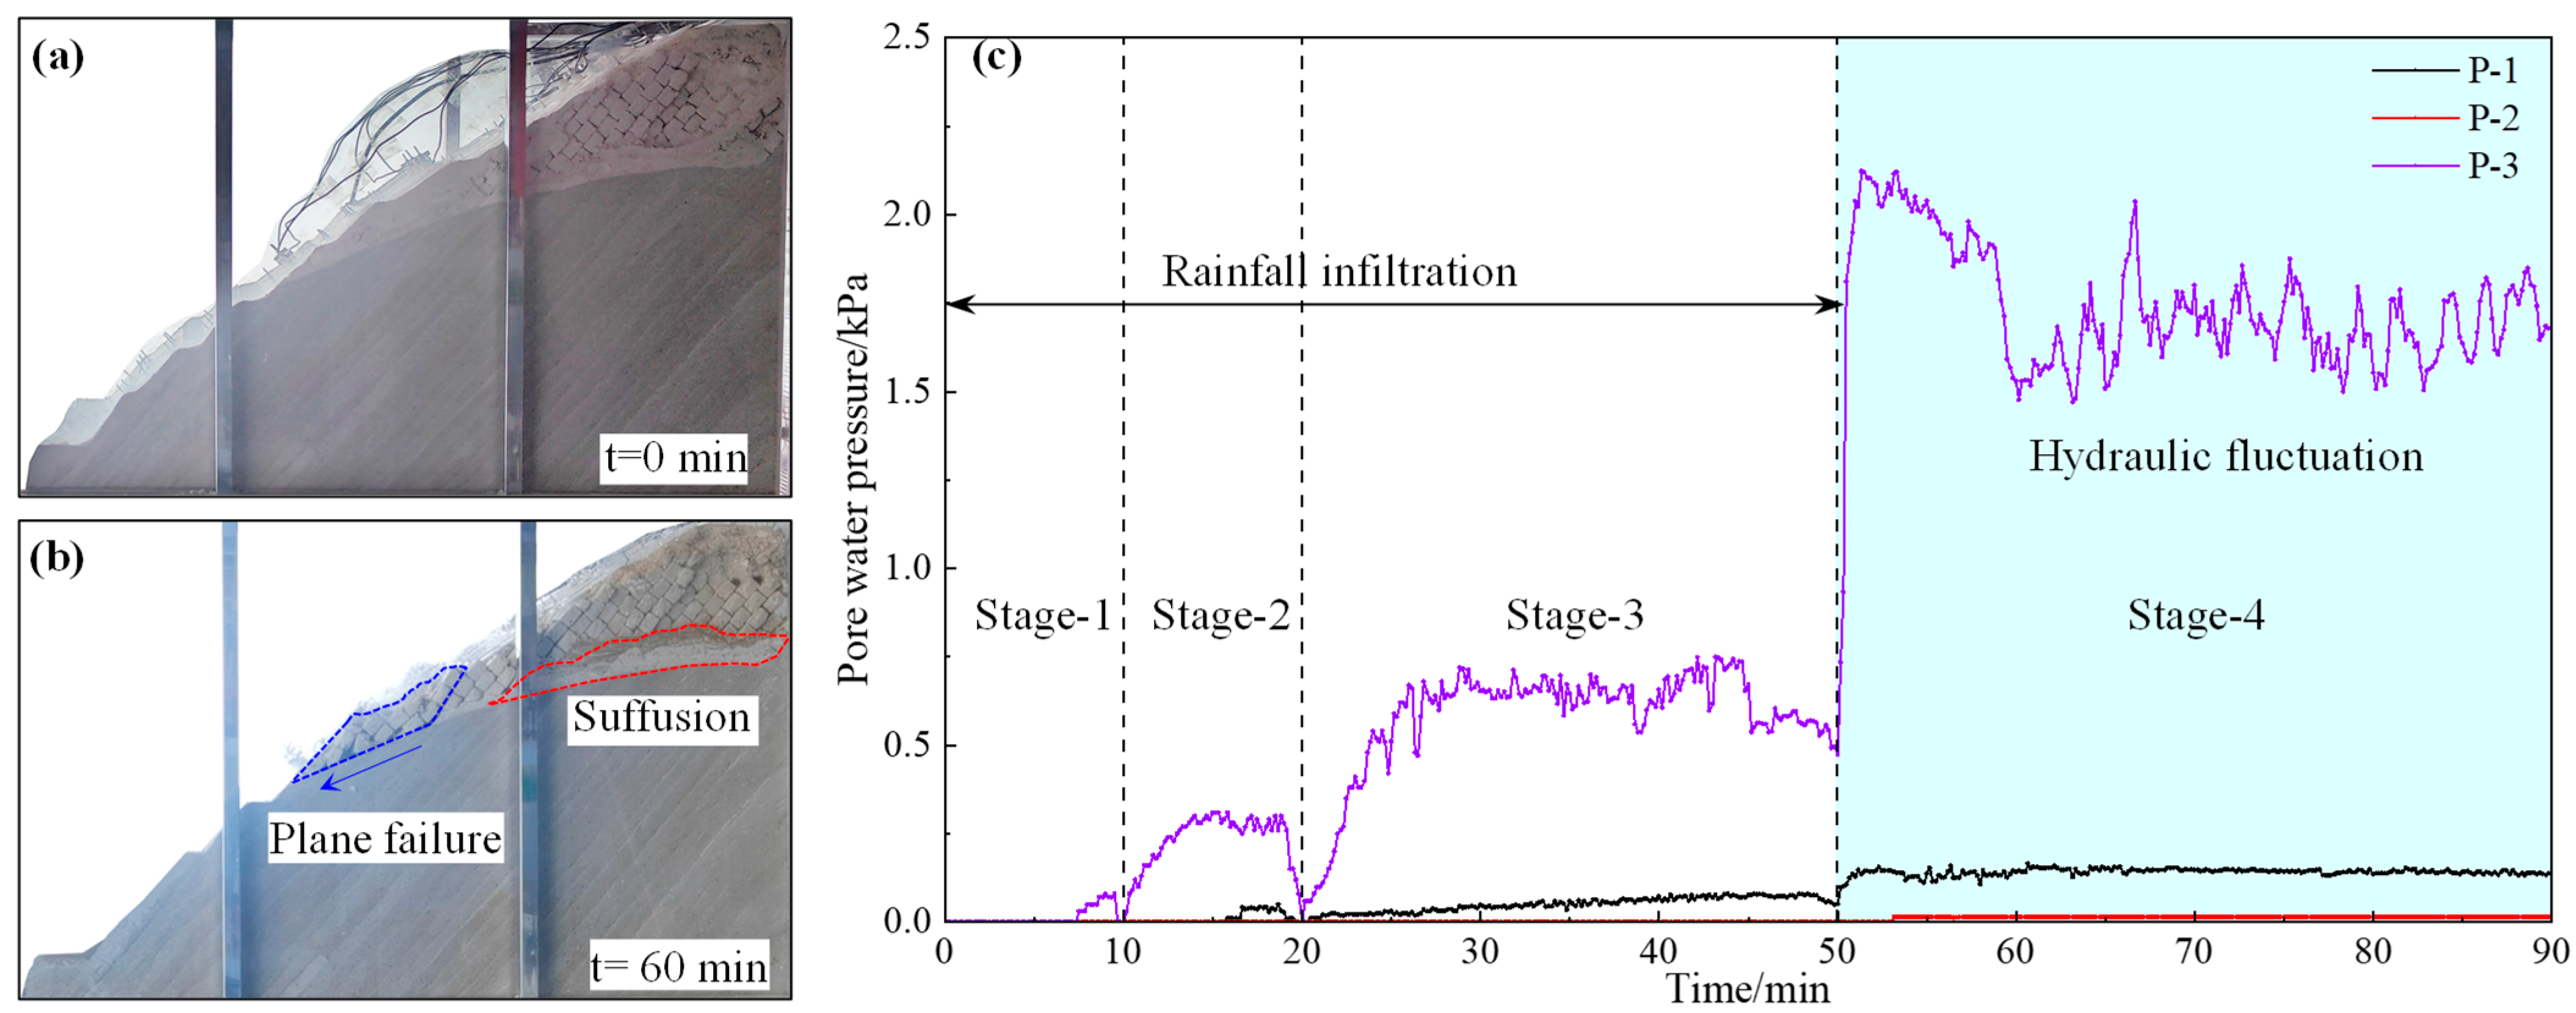
3.1. Pore Water Pressure Evolution of Weathering Transition Zone

The variation of pore water pressure at monitoring points P-1~P-3 during the model test is shown in Figure 7c. Figure 7a shows the initial state of the model. During the rainfall infiltration stage, the pore water pressure exhibited a gradual increase, while significant fluctuations occurred during the hydraulic fluctuation phase. During Stage-1, P-3 showed a noticeable increase. During Stage-2, the maximum values of pore water pressures at monitoring points P-1 and P-3 increased significantly, with the maximum value at P-3 rising by 287.5% compared to Stage-1. During Stage-3, pore water pressures at monitoring points P-1 and P-3 showed a gradual increase, and stabilized at 45 min and 30 min, respectively. Due to the long seepage path at measuring point P-1, it took a long time to achieve seepage stability. After loading for 30 s in Stage-4, the influx of groundwater caused the pore water pressure at monitoring points P-1 and P-3 to increase to 0.16 and 2.1 kPa, respectively. The fracture network of the strong weathering zone continues to expand under hydraulic fluctuation, resulting in enhanced rock mass permeability properties and accelerated dissipation of pore water pressure. Therefore, the pore water pressure at monitoring point P-3 showed a downward trend between 50 and 60 min. During the period of 59–60 min, lateral deformation of the slope caused the expansion of the internal structural plane, which caused a decrease of pore water pressure at P-3. Figure 7b shows the plane failure of the slope, and the profile shows that fine sand was deposited in the weathering transition zone due to suffusion [35]. After 60 min, the rock blocks tended to stabilize, but the flow of groundwater in the penetrating fracture network caused a significant pore water pressure fluctuation effect at P-3. The higher in-situ stress makes the original structural plane stable under hydraulic fluctuation. Consequently, the pore water pressure at P-1 remained stable during 55~90 min.

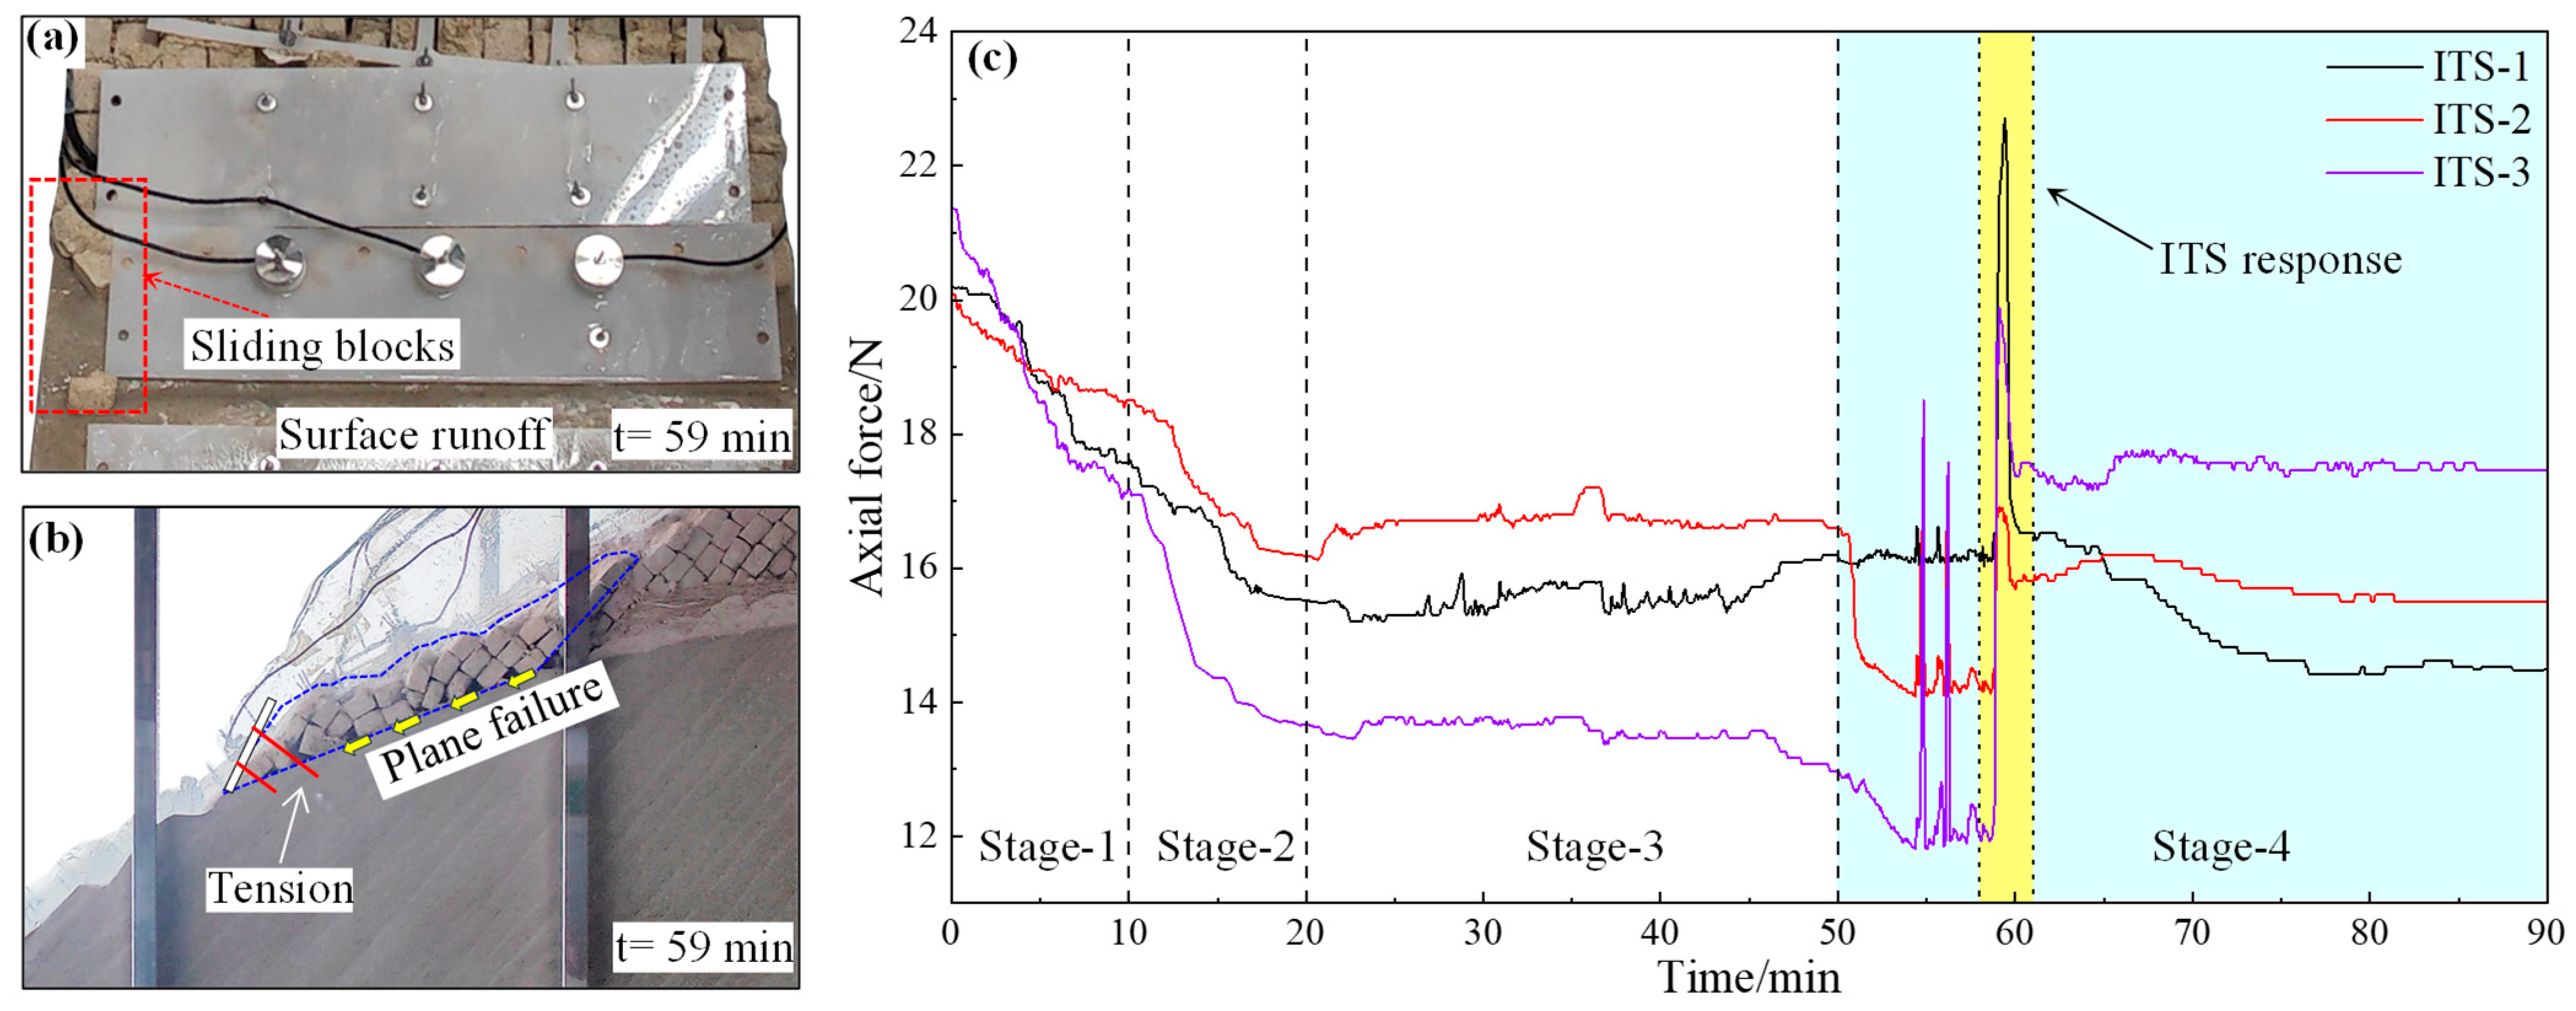
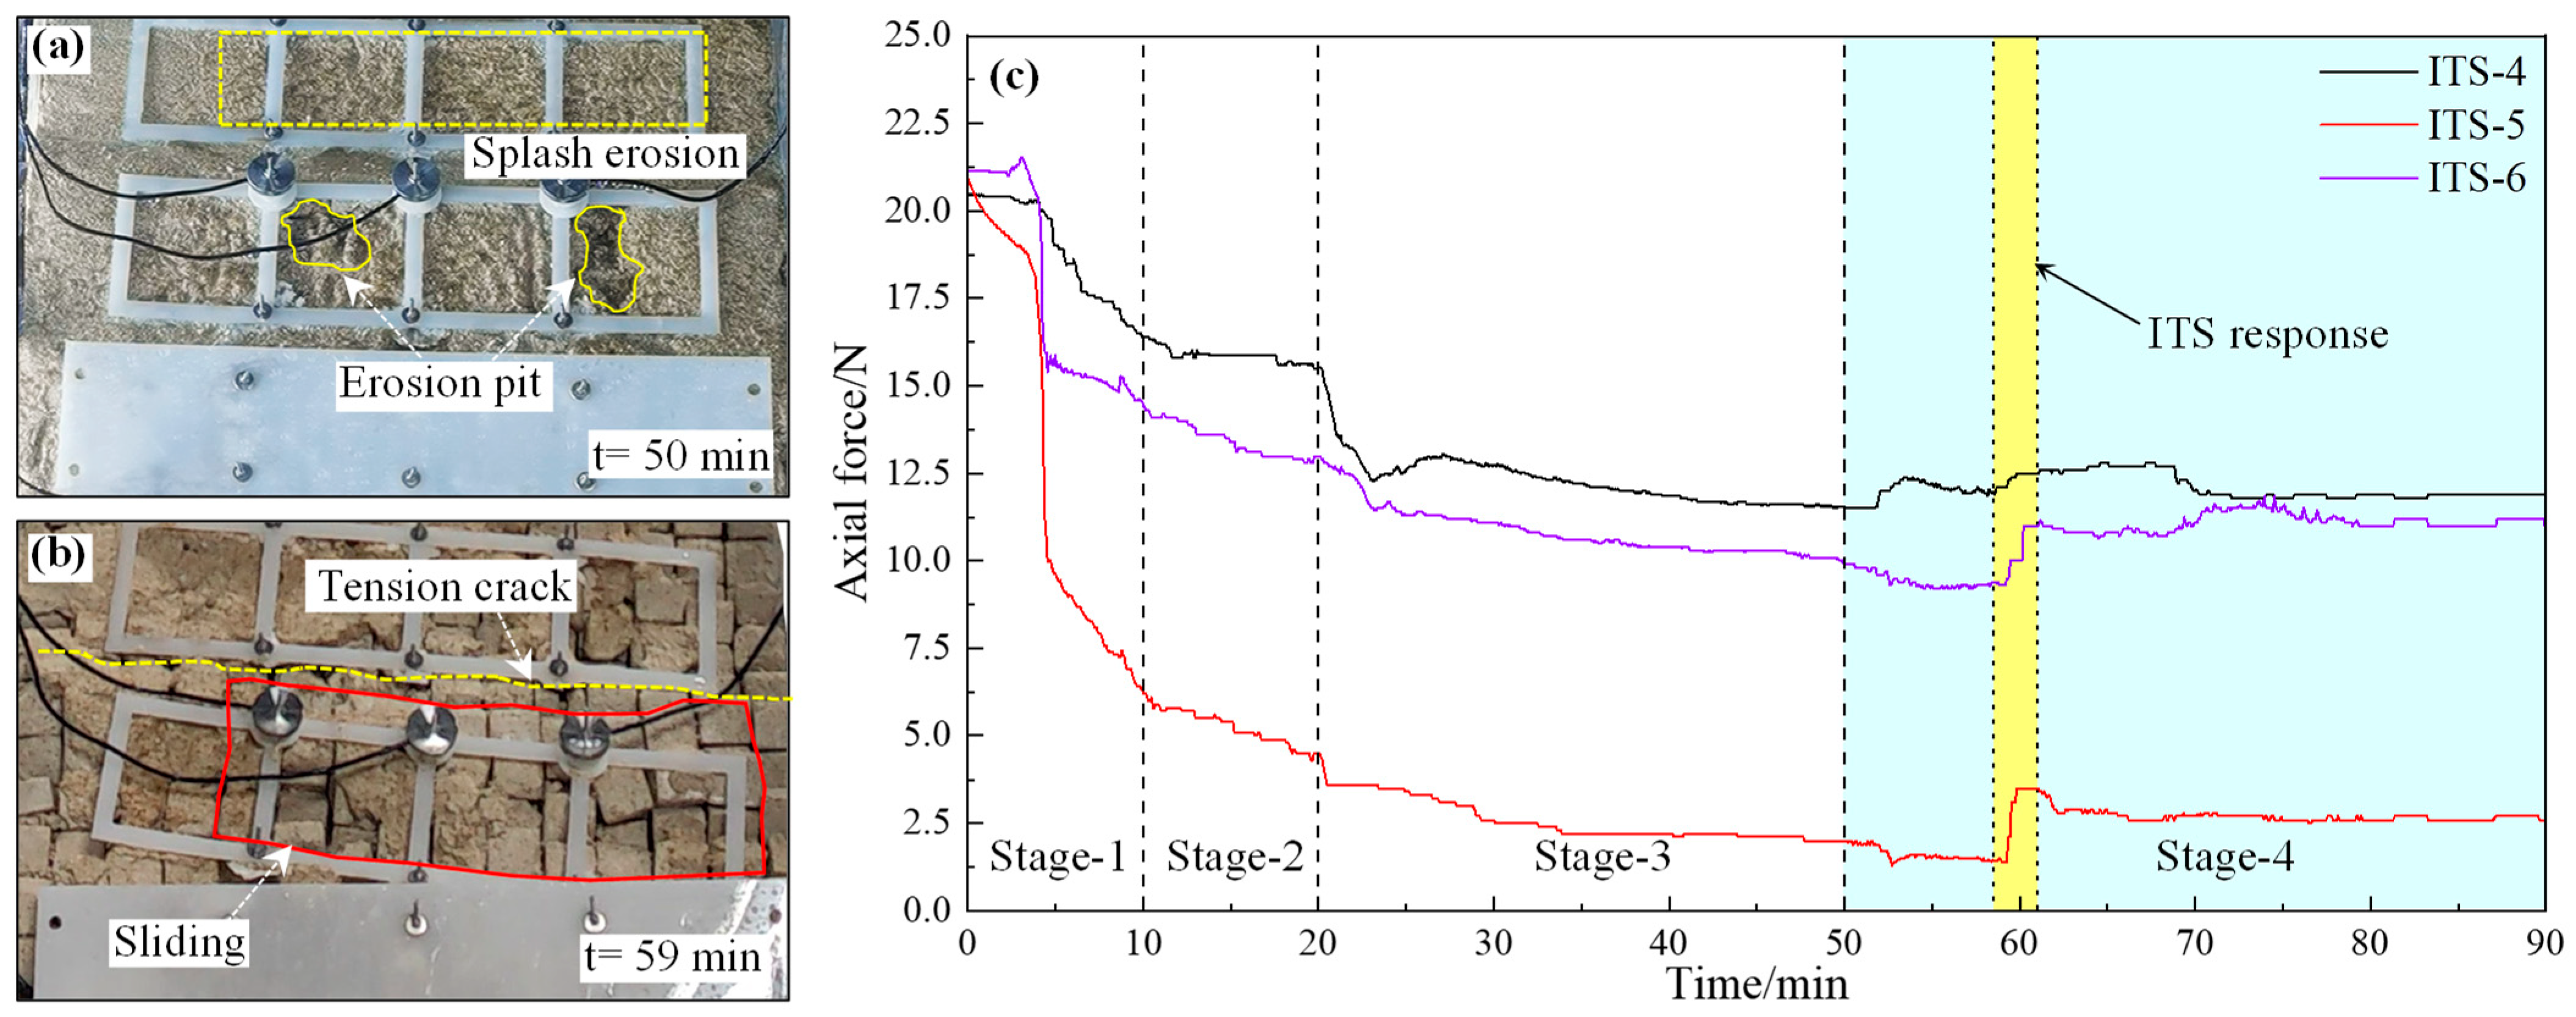
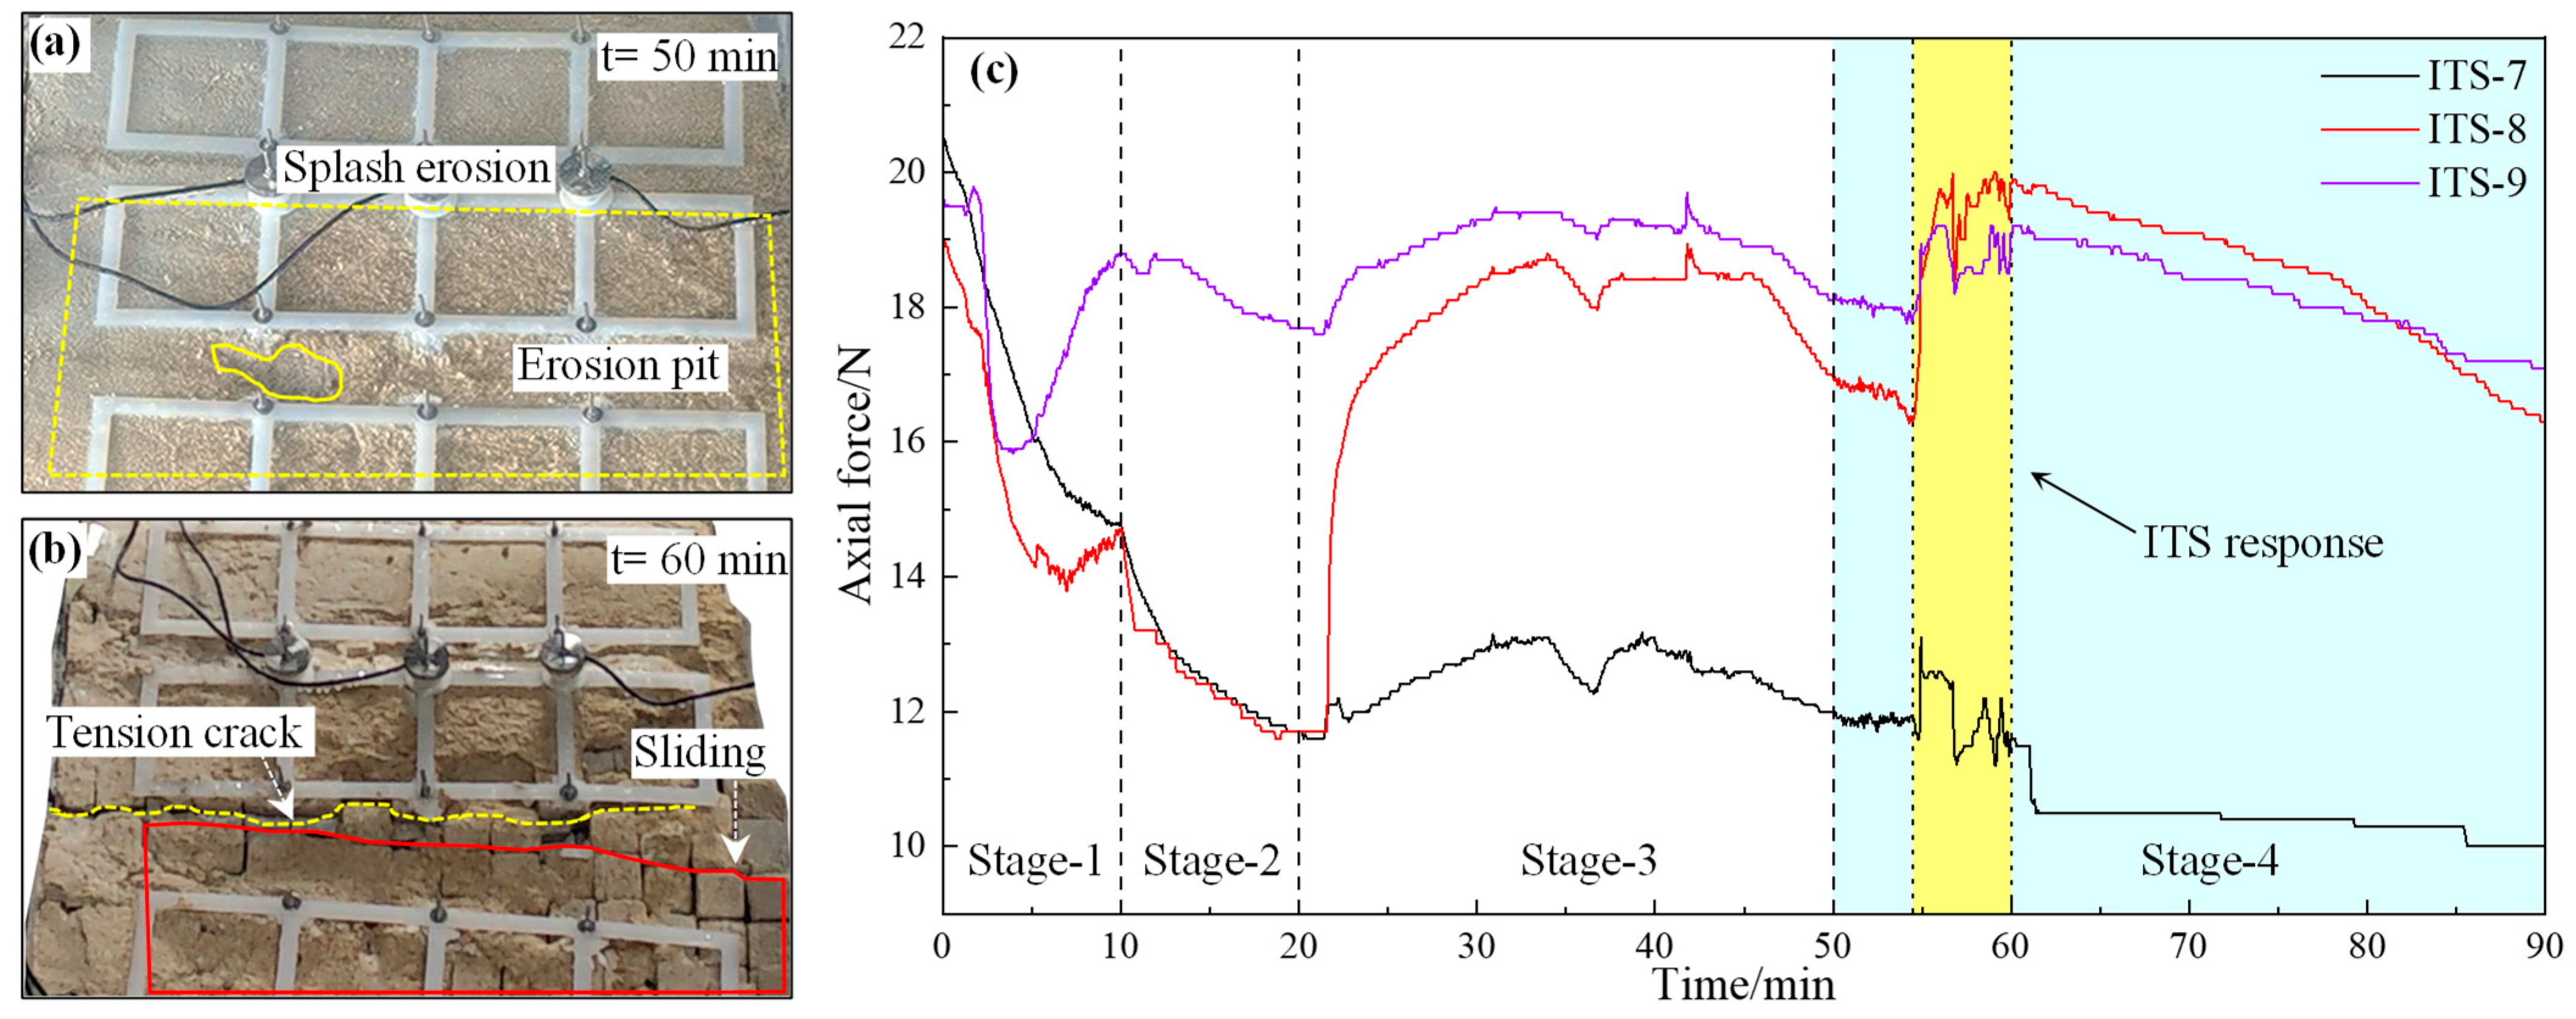
3.2. ITS Response of Slope Anchorage System

The variation of anchor bolt axial force at monitoring points ITS-1~ITS-3 during the model test is shown in Figure 8c. The monitoring points ITS-1~ITS-3 exhibited ITS response. Axial force reduction was observed during Stage-1 and Stage-2. At 20 min, anchor bolt axial forces at monitoring points ITS-1~ITS-3 decreased by 24.7%, 20.4%, and 40.2%, respectively, compared to their initial values. These reductions were caused by runoff-induced erosion at the interface between the retaining structure and slope (Figure 8a), combined with the unevenness of the physical model laying, which amplified force variations at monitoring point ITS-3. By 50 min, the axial force change rates at monitoring points ITS-1~ITS-3 were 4.4%, 2.6%, and −5.1%, respectively, relative to the values at 20 min, indicating that the surface erosion effect is close to the upper limit [36]. Within 5 min of Stage-4 initiation, hydraulic fluctuation caused the expansion of the structural planes, weakening the stability of the rock blocks in the anchoring section of the anchor bolt; therefore, the anchor bolt axial force showed a decreasing trend [9]. Groundwater pressure variations increased sliding forces in heavily weathering rock blocks. When sliding forces exceeded anti-sliding forces, fractured rock blocks began to slide, causing abrupt axial force surges at monitoring points during 59~60 min. The unloading response of ITS components shows that the slope deformation exceeded 2.2 mm. Notably, the peak axial force at ITS-1 aligned with the unloading response observed in the uniaxial tensile test. Figure 8b confirms that torsional deformation of the retaining plate generated ITS-compatible displacement patterns. During 60~90 min, rock sliding rates gradually declined, and axial force fluctuation was caused by surface runoff.
The variation of anchor bolt axial force at monitoring points ITS-4~ITS-6 is shown in Figure 9c. The ITS response characteristics appear at ITS-4 and ITS-5. After 10 min loading of Stage-1, axial forces at monitoring points ITS-4~ITS-6 exhibited reductions of 19.7%, 70.2%, and 31.7%, respectively, compared to the initial state.
As shown in Figure 9a, a local erosion pit was caused by inhomogeneity during the model construction process. During Stage-2 and Stage-3, axial forces at monitoring points ITS-4~ITS-6 exhibited consistent reductions. By 50 min, the axial forces at monitoring points ITS-4~F-6 had decreased by 23.8%, 20.2%, and 21.3%, respectively, compared to their measurements at 10 min. Rainwater softening and runoff scouring were identified as the primary contributors to persistent preload degradation. Figure 9 demonstrates a significant deepening of the seepage-induced damage zone at 50 min. The overall sliding of the anchoring system and the rock block occurred at 59 min. As shown in Figure 9b, the rock blocks slid and formed tension cracks in the weathering transition zone. The axial force at monitoring points ITS-4~ITS-6 did not increase significantly due to the failure of the local anti-sliding effect.
The variation of anchor bolt axial force at monitoring points ITS-7~ITS-9 is shown in Figure 10c. The ITS response characteristics were observed at monitoring points ITS-7~ITS-9. During Stage-1 and Stage-3, axial forces at monitoring points ITS-7~ITS-9 exhibited initial reductions followed by subsequent increases. Rainfall-induced softening of the slope surface induced prestress losses, while prolonged water infiltration intensified seepage-induced damage along structural planes, resulting in rock block loosening and increased slip force. As shown in Figure 10a, splash erosion effects intensified at 50 min, coinciding with the phenomenon of axial force increase. During 50~55 min, axial forces at monitoring points ITS-7~ITS-9 exhibited a decreasing trend. Based on the observed propagation of shallow tensile cracks during the model test, it is hypothesized that prestress losses caused by slope infiltration damage exceeded the axial force increases resulting from improved support resistance. During 55~60 min, the axial force at monitoring points ITS-7~ITS-9 increased due to the overall decline of rock blocks, which caused the anchor bolt to play a supporting role (Figure 10b). During 60~90 min, the fractured rock blocks remained predominantly stable. Axial forces at monitoring points ITS-7~ITS-9 continued to decline under the combined effects of surface erosion and groundwater seepage.

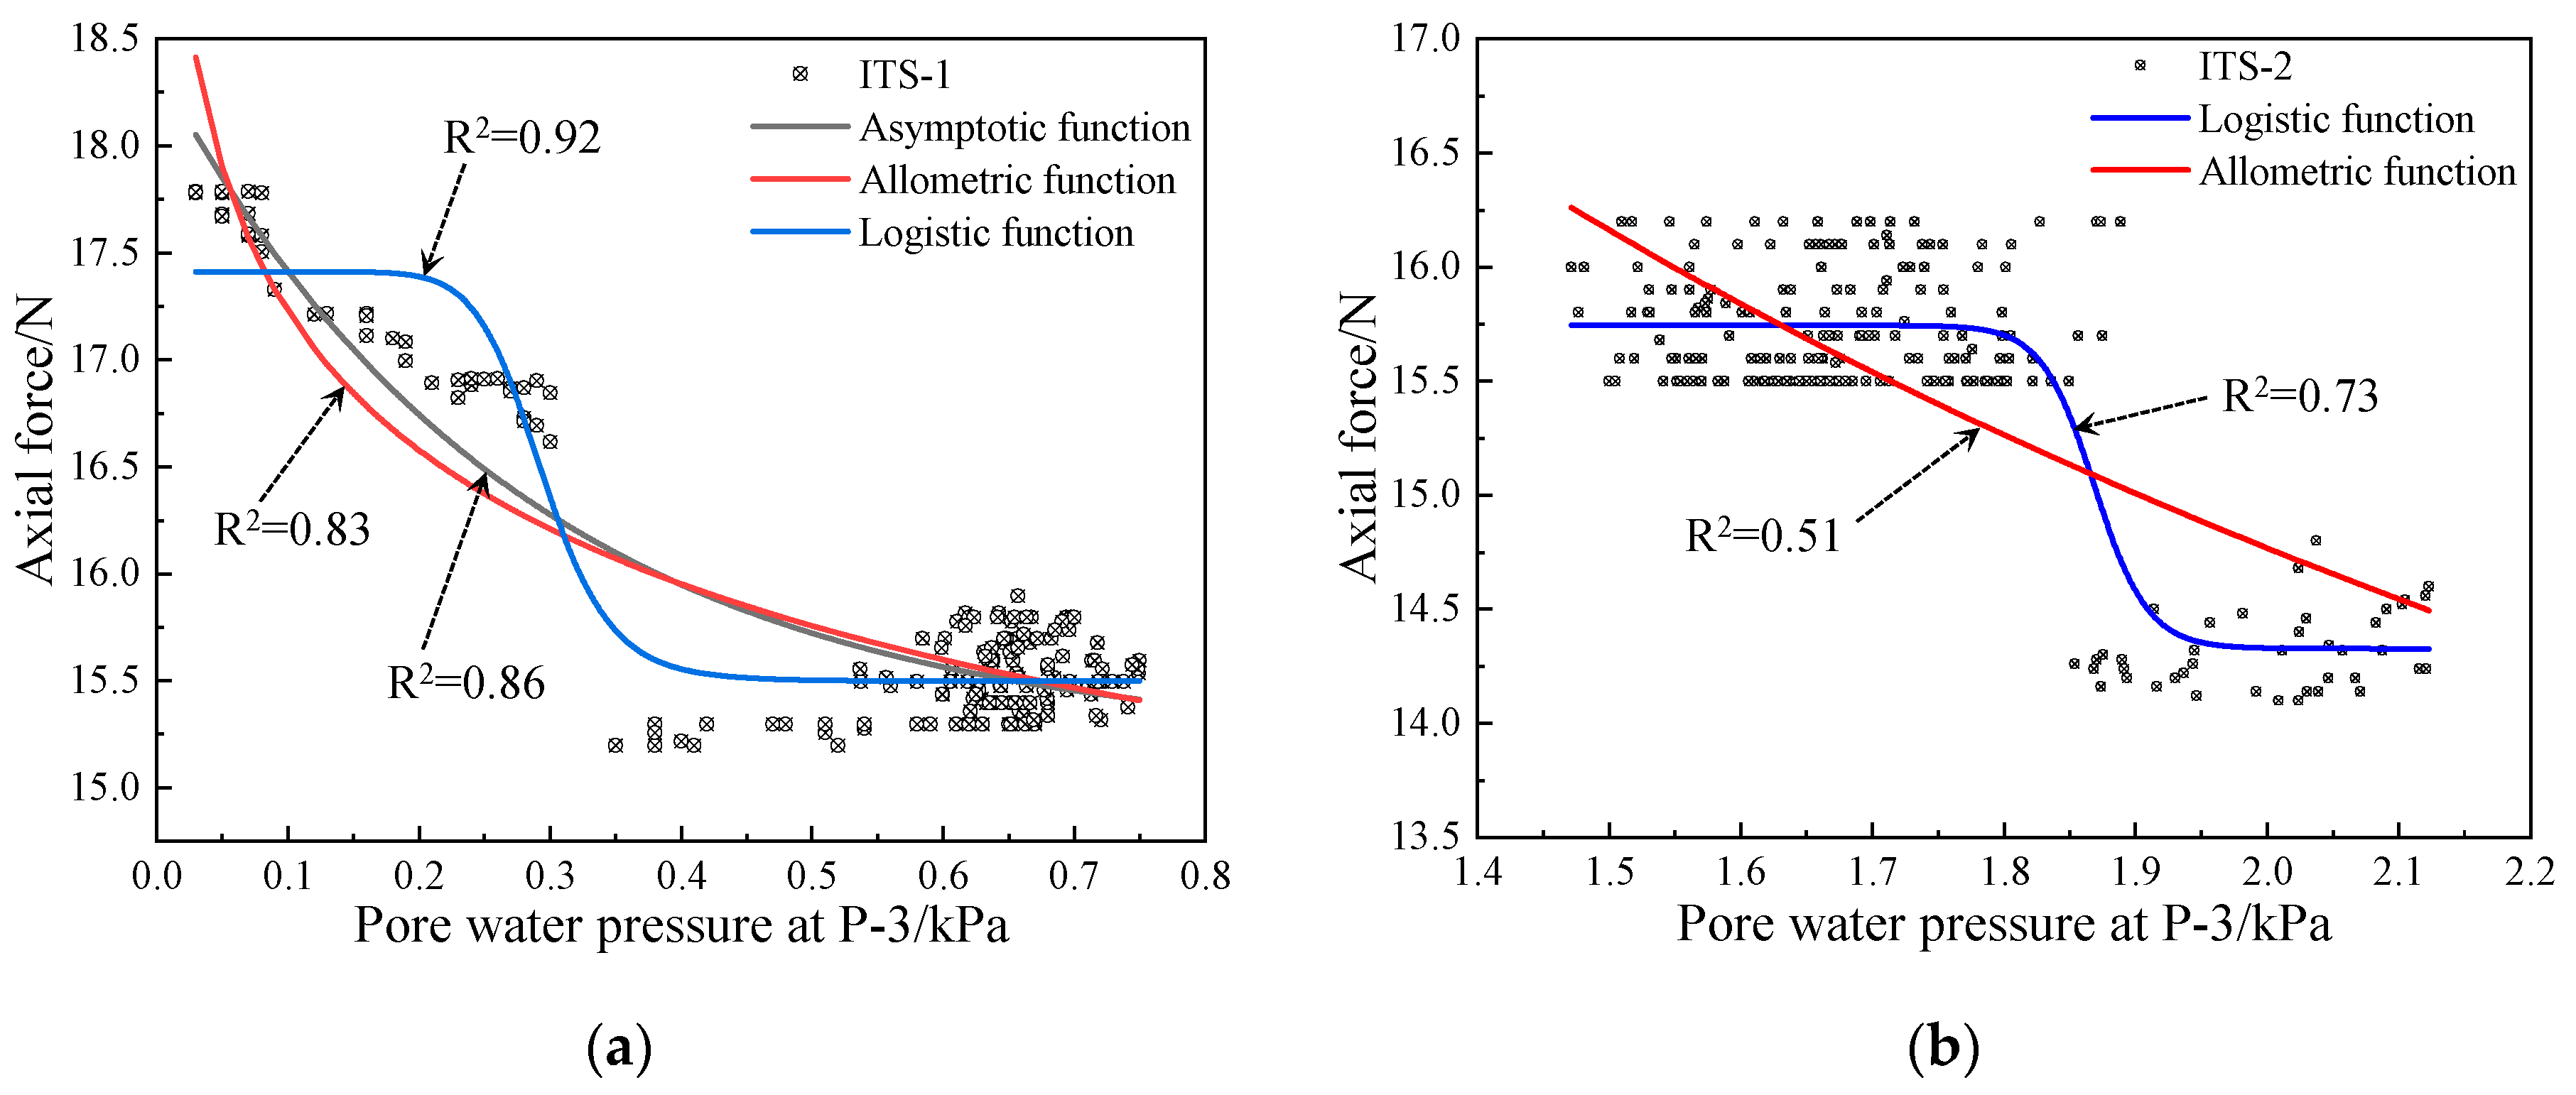
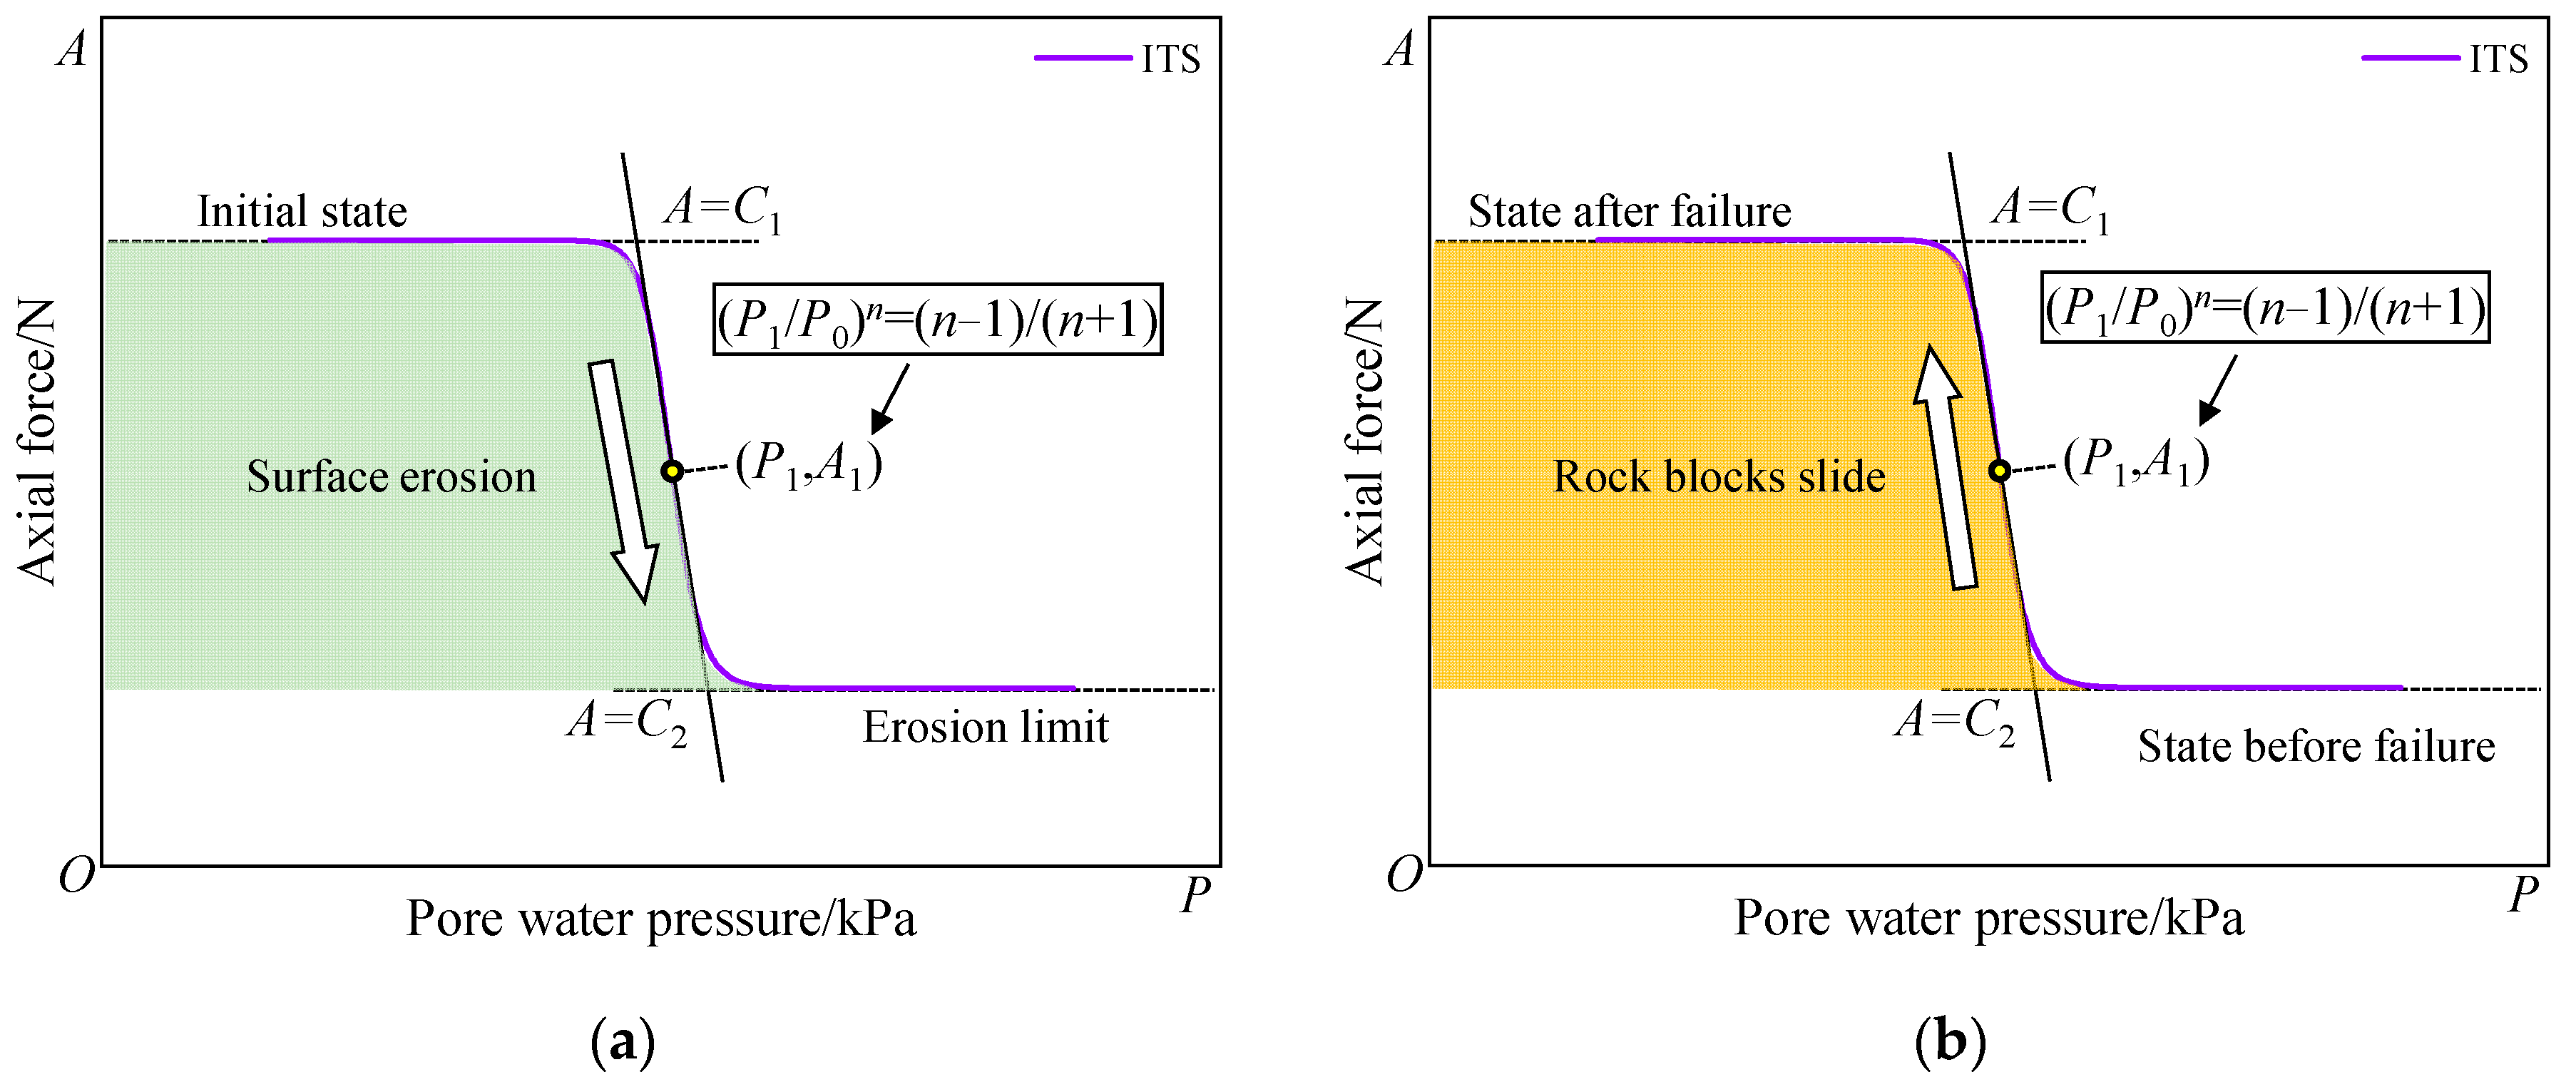
3.3. Weathering Transition Zone Stability Monitoring Criterion

The analysis shows that the axial force and pore water pressure have similar evolution laws. Therefore, based on the data of anchor bolt axial force and pore water pressure during rainfall infiltration and hydraulic fluctuation, the stability monitoring criterion for the weathering transition zone under cyclonic rainfall is established. The moving average method was used to reduce the noise of the data:
y ( n ) = 1 5   × n + 2 i = n 2 x ( i ) ,
where y(n) is the data point after the moving average, and x(i) is the original data set.
The pore water pressure at measuring point P-3, which showed obvious changes, was selected to fit the axial force of the bolt. In the rainfall infiltration stage, the pore water pressure increased in a gradient, and the axial force of the bolt continued to decrease. The scatter diagram was drawn with the pore water pressure as the abscissa. It was found that the axial force of the bolt tended to a lower limit when the pore water pressure was large. The asymptotic function with a similar variation law was selected, and the allometric function was fitted with the Logistic function. Figure 11a shows the scatter plot and fitting curve of the axial force of the bolt at ITS-1 and the pore water pressure at P-3. The Logistic function with gradient characteristics is better, and the fitting parameters of the remaining monitoring points are summarized in Table 5.
The slope stability criterion formula based on the Logistic function is:
A = C 1 C 2 1 + ( P / P 0 ) n + C 2 ,
where A is the anchor bolt axial force; P is the pore water pressure in the weathering transition zone; P 0 is an undetermined parameter related to the extreme point of the first derivative of the axial force of the bolt; C 1 , C 2 , C 3 and n are undetermined coefficients.
In the hydraulic fluctuation stage, the pore water pressure at measuring point P-3 increases rapidly and then fluctuates continuously. The axial force gradient of the bolt increases during the overall slip period of the broken rock block, and the axial force of the bolt at some monitoring points shows the unloading response characteristics of ITS. The scatter diagram drawn by using the pore water pressure as the abscissa is shown in Figure 11b, which is the scatter diagram of the axial force of the bolt at measuring point ITS-2 and the pore water pressure at P-3. It can be seen that the axial force of the bolt shows a gradient change pattern. After using the function fitting, it is found that the Logistic function can better characterize the gradient variation characteristics of the axial force of the bolt in the hydraulic fluctuation stage, and the fitting curve parameters of the remaining monitoring points are summarized in Table 6.
The slope stability criterion is shown in Figure 12. The logistic function can simultaneously characterize the relationship between bolt axial force and pore water pressure in the rainfall infiltration stage and hydraulic fluctuation stage. The parameters C 1 and C 2 have different physical meanings in different loading stages. Figure 12a shows that C 1 represents the preload force of the initial state bolt in the rainfall infiltration stage. The continuous erosion of the slope causes the preload force to decrease. As the erosion failure rate decreases, the axial force tends toward C 2 . Figure 12b shows that the pore water pressure is large at the initial stage of hydraulic fluctuation, and the anchor bolt axial force corresponds to C 2 . The increase of seepage cracks during rock sliding leads to a decrease in pore water pressure, and the lateral displacement of the slope increases the axial force of the bolt. When the position of the rock is stable, the axial force of the bolt tends to stabilize at C 1 .
Due to limitations in experimental conditions, the gravity acceleration similarity ratio Cg in this study was set to 1, and this was used as the basic dimension to calculate the derived dimensions. The influence of 1-g condition on the model test is as follows:
(1)
In this study, artificial porous media materials were used to simulate the real geological body. However, it is impossible to realize that all physical parameters satisfy the similarity laws in the material research, which results in differences between the deformation characteristics of the model slope and the prototype.
(2)
The similarity ratio of rainfall time was not considered, and the hydraulic effect caused by rainfall infiltration and groundwater fluctuation may not reflect the real situation [37]. In addition, the distribution of the effective stress field is different from that of the prototype slope, so the failure process of the real slope cannot be fully simulated.
(3)
A large number of studies have shown that the effective stress level is an important factor affecting the slope failure mode [38,39]. Since the distribution of the effective stress field in the model test is different from that of the real situation, the failure mode of the prototype slope cannot be accurately simulated.
(4)
The slope stability monitoring criterion obtained in the model test essentially uses the slope deformation to feedback on the hydraulic failure of the weathering transition zone. Considering the defects of the 1-g model, the monitoring criterion obtained from the physical model test cannot characterize the evolution laws between all monitoring points.
The centrifuge model test is an important method for studying the mechanisms of slope disaster under rainfall conditions [40,41]. Centrifuge test technology can simulate contractive and dilative behaviors in prototype slopes. When using centrifuge technology to study the disaster mechanism of slope under a rainfall environment, the duration of rainfall can be reduced according to the scaling law to ensure the same hydraulic effect. Therefore, the centrifuge model should be established in future research to obtain a more accurate slope failure mode and the mechanical feedback of anchorage systems.

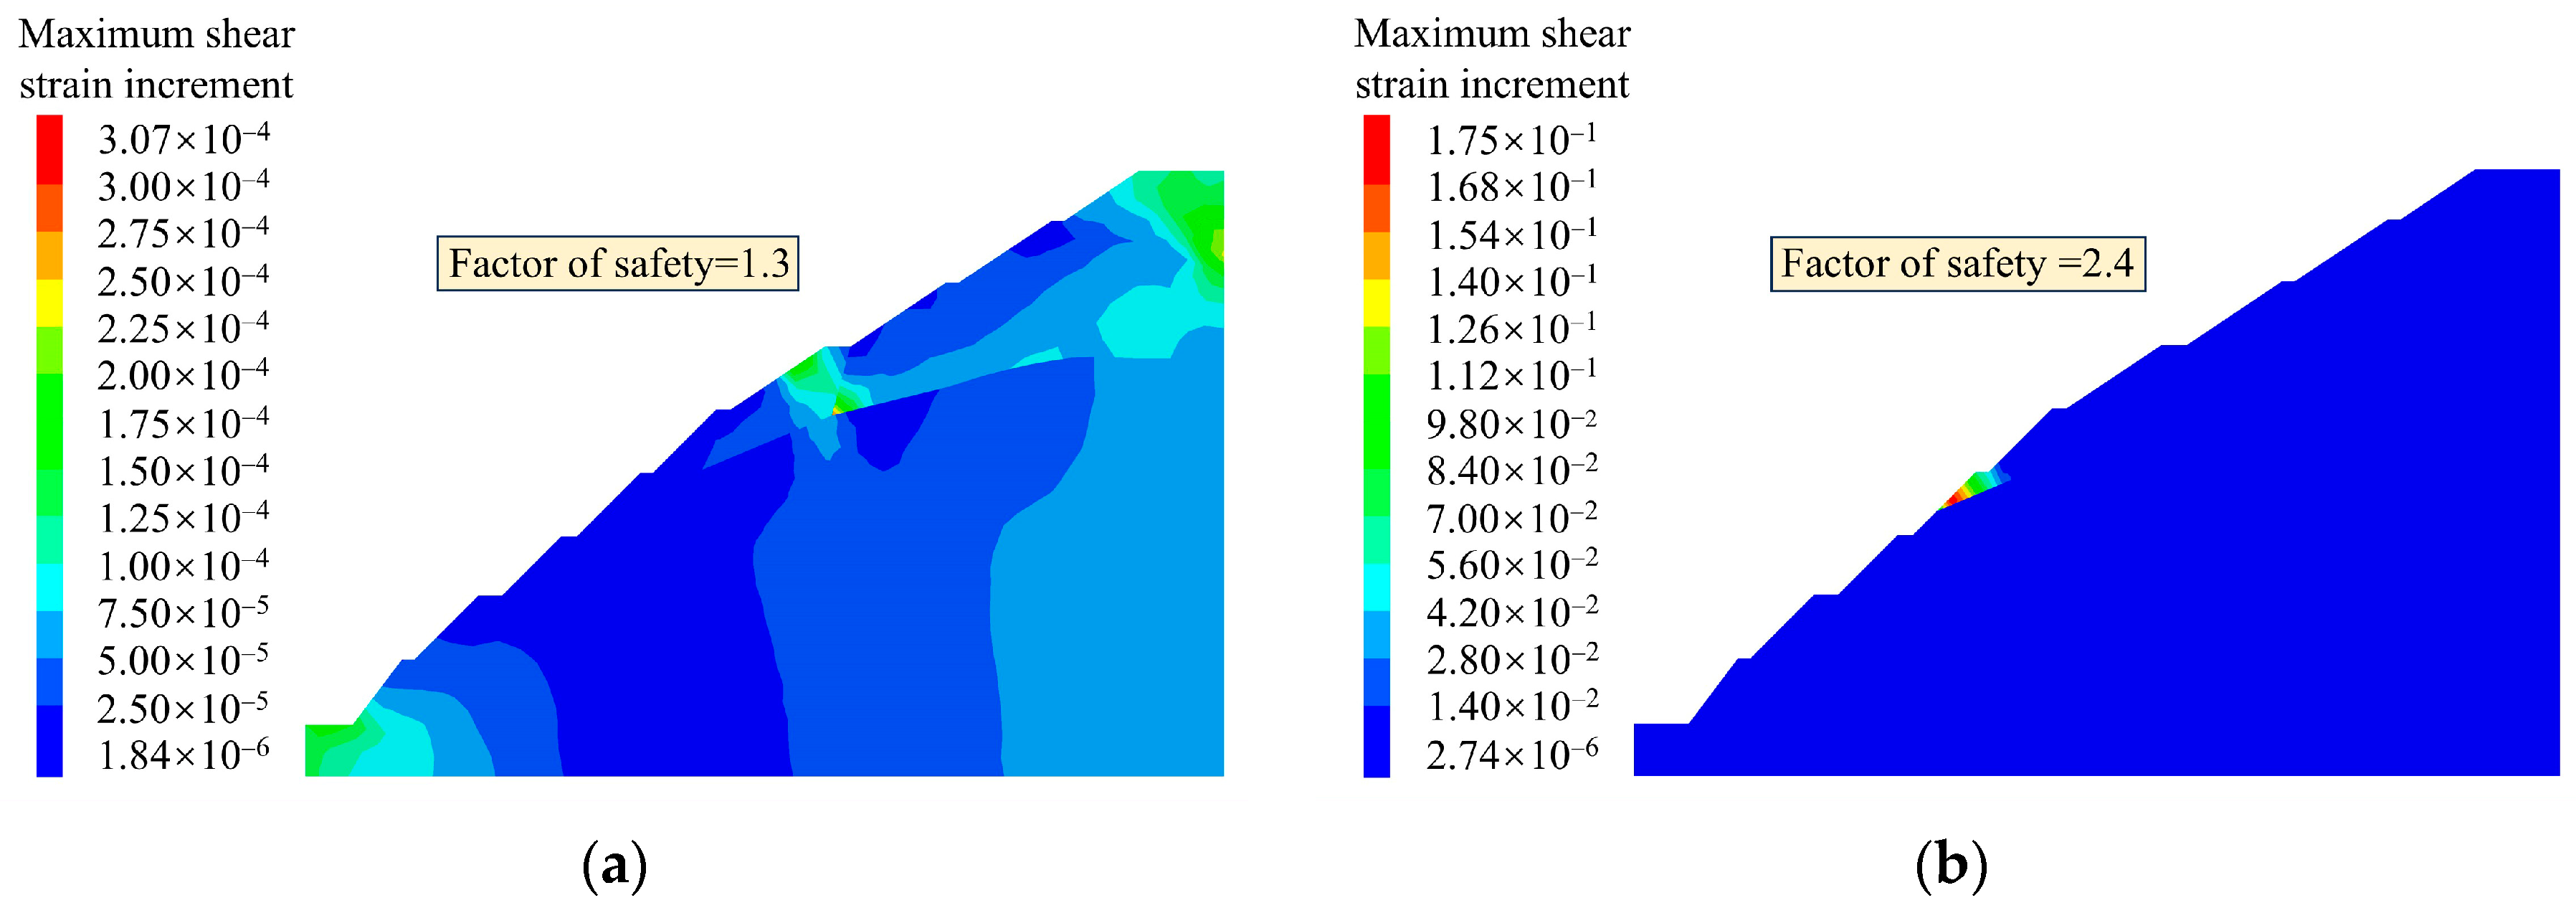
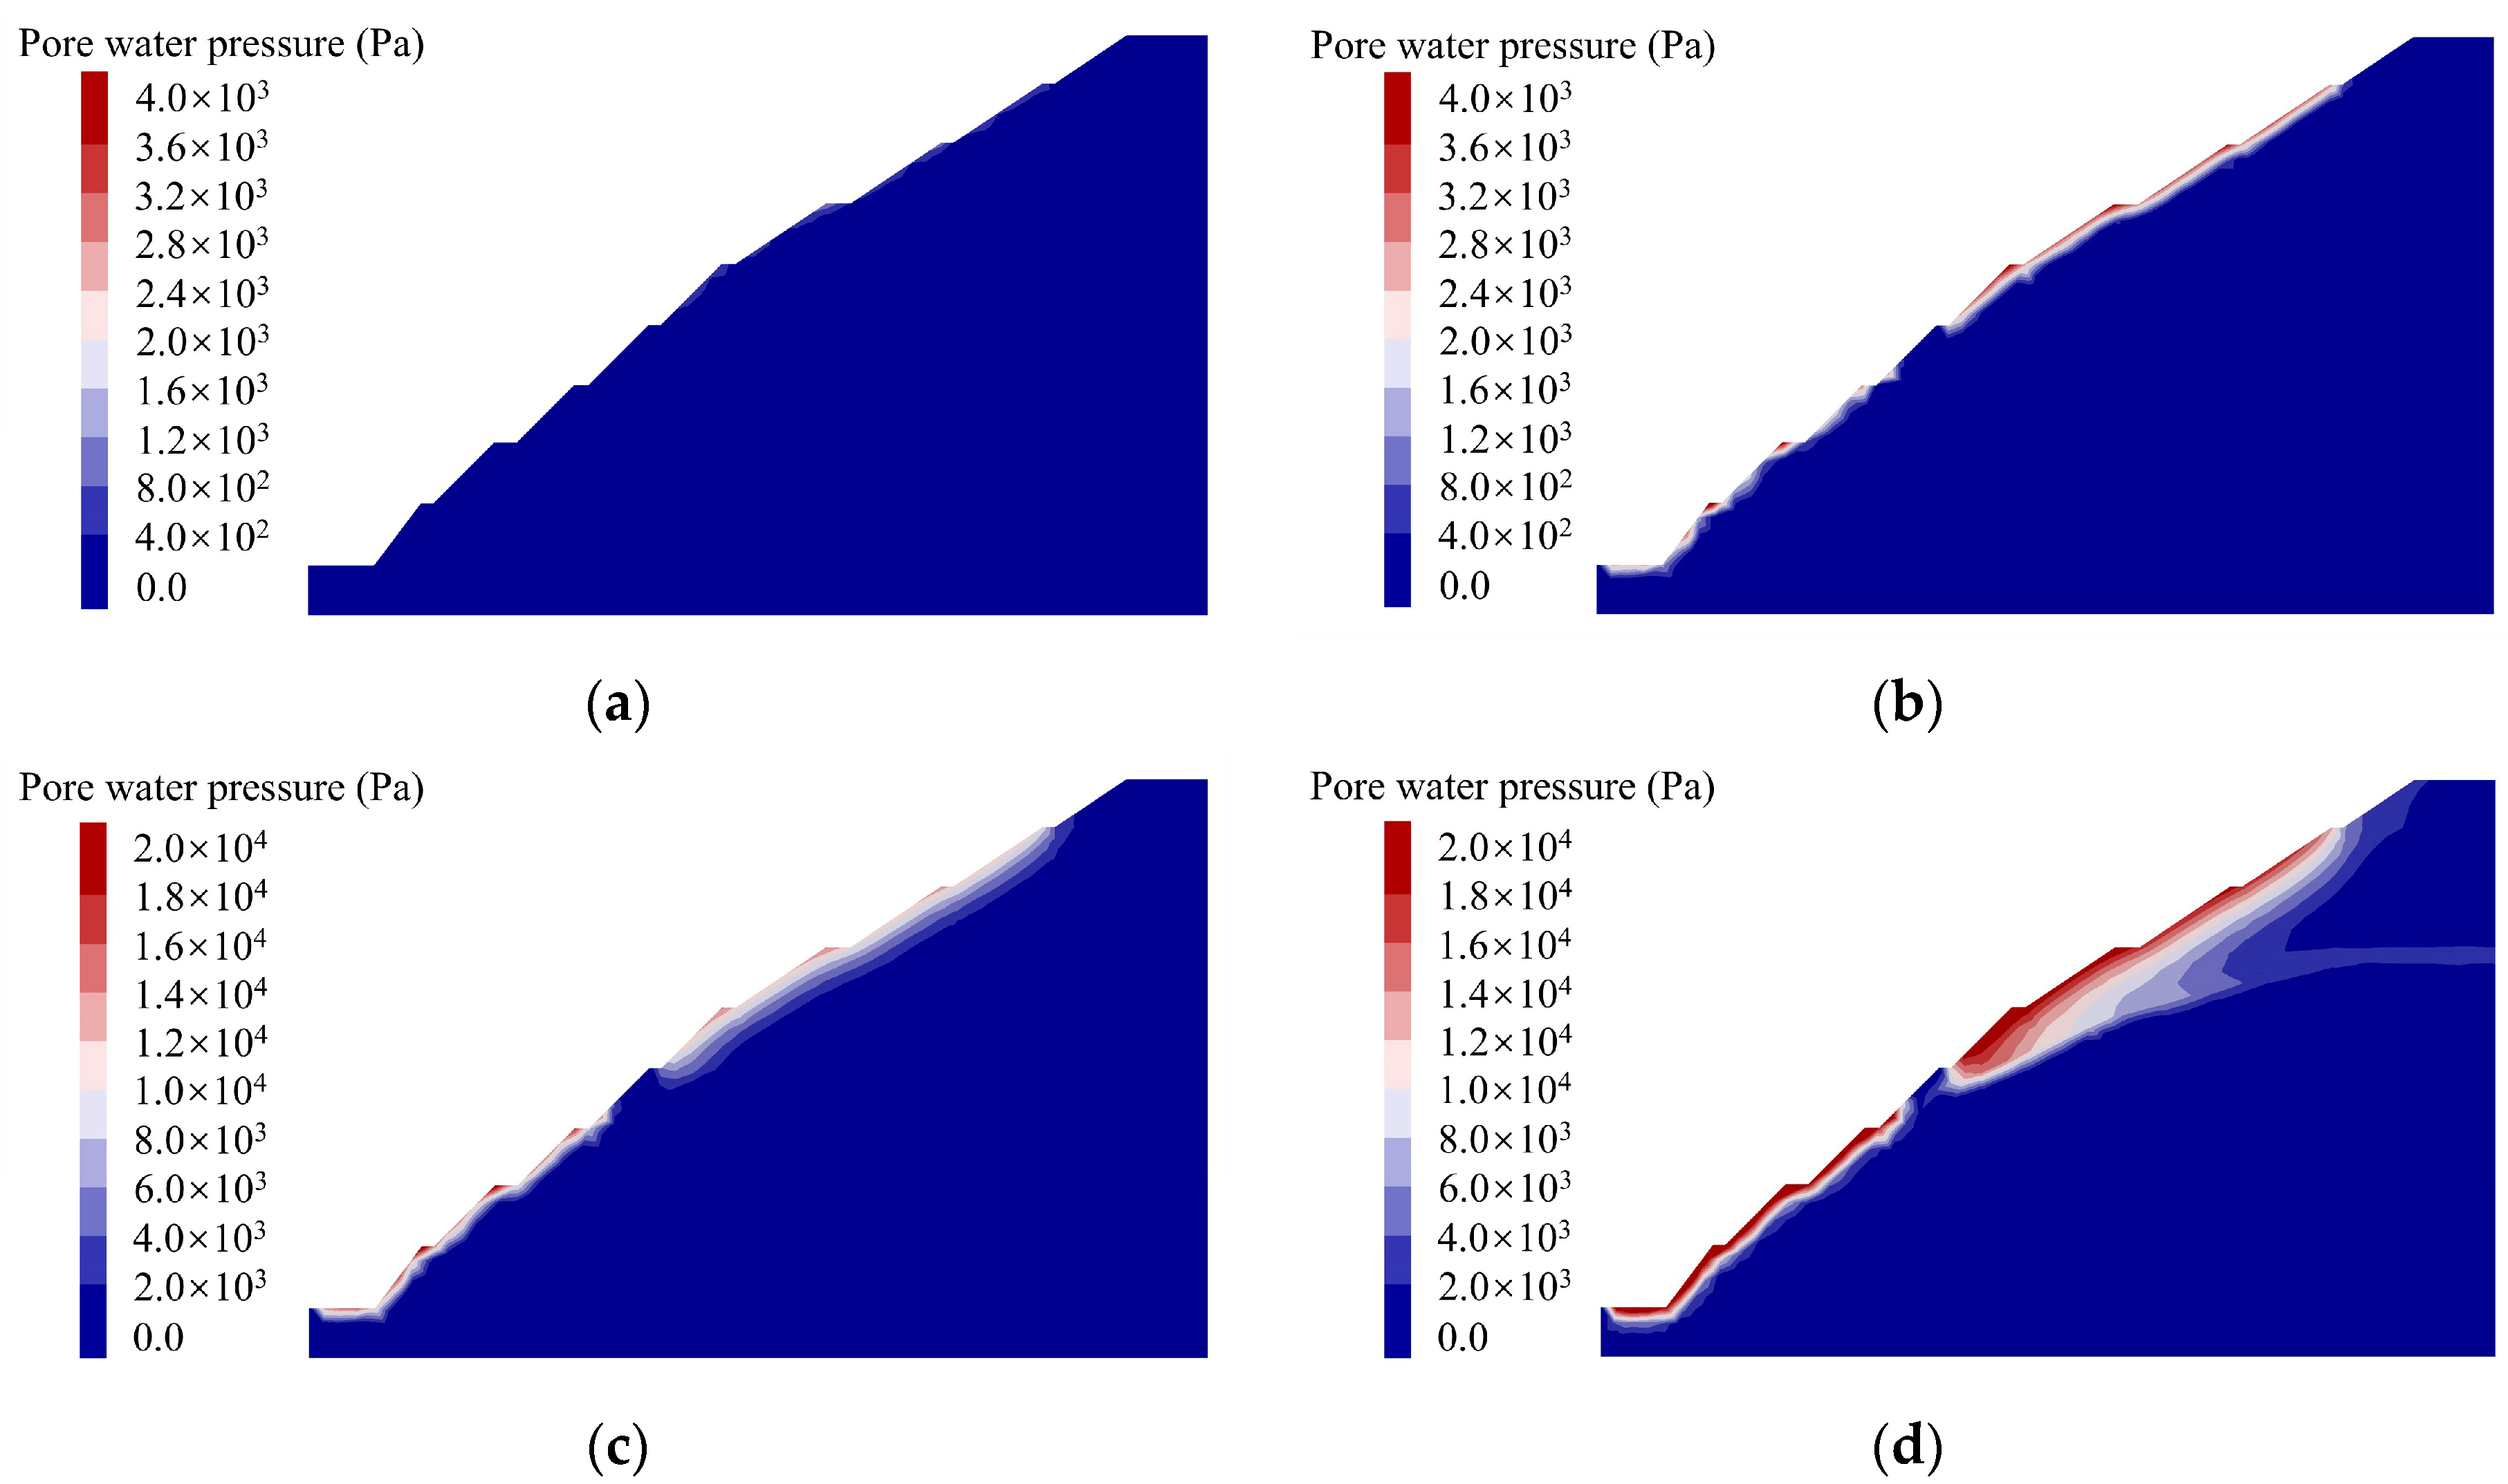
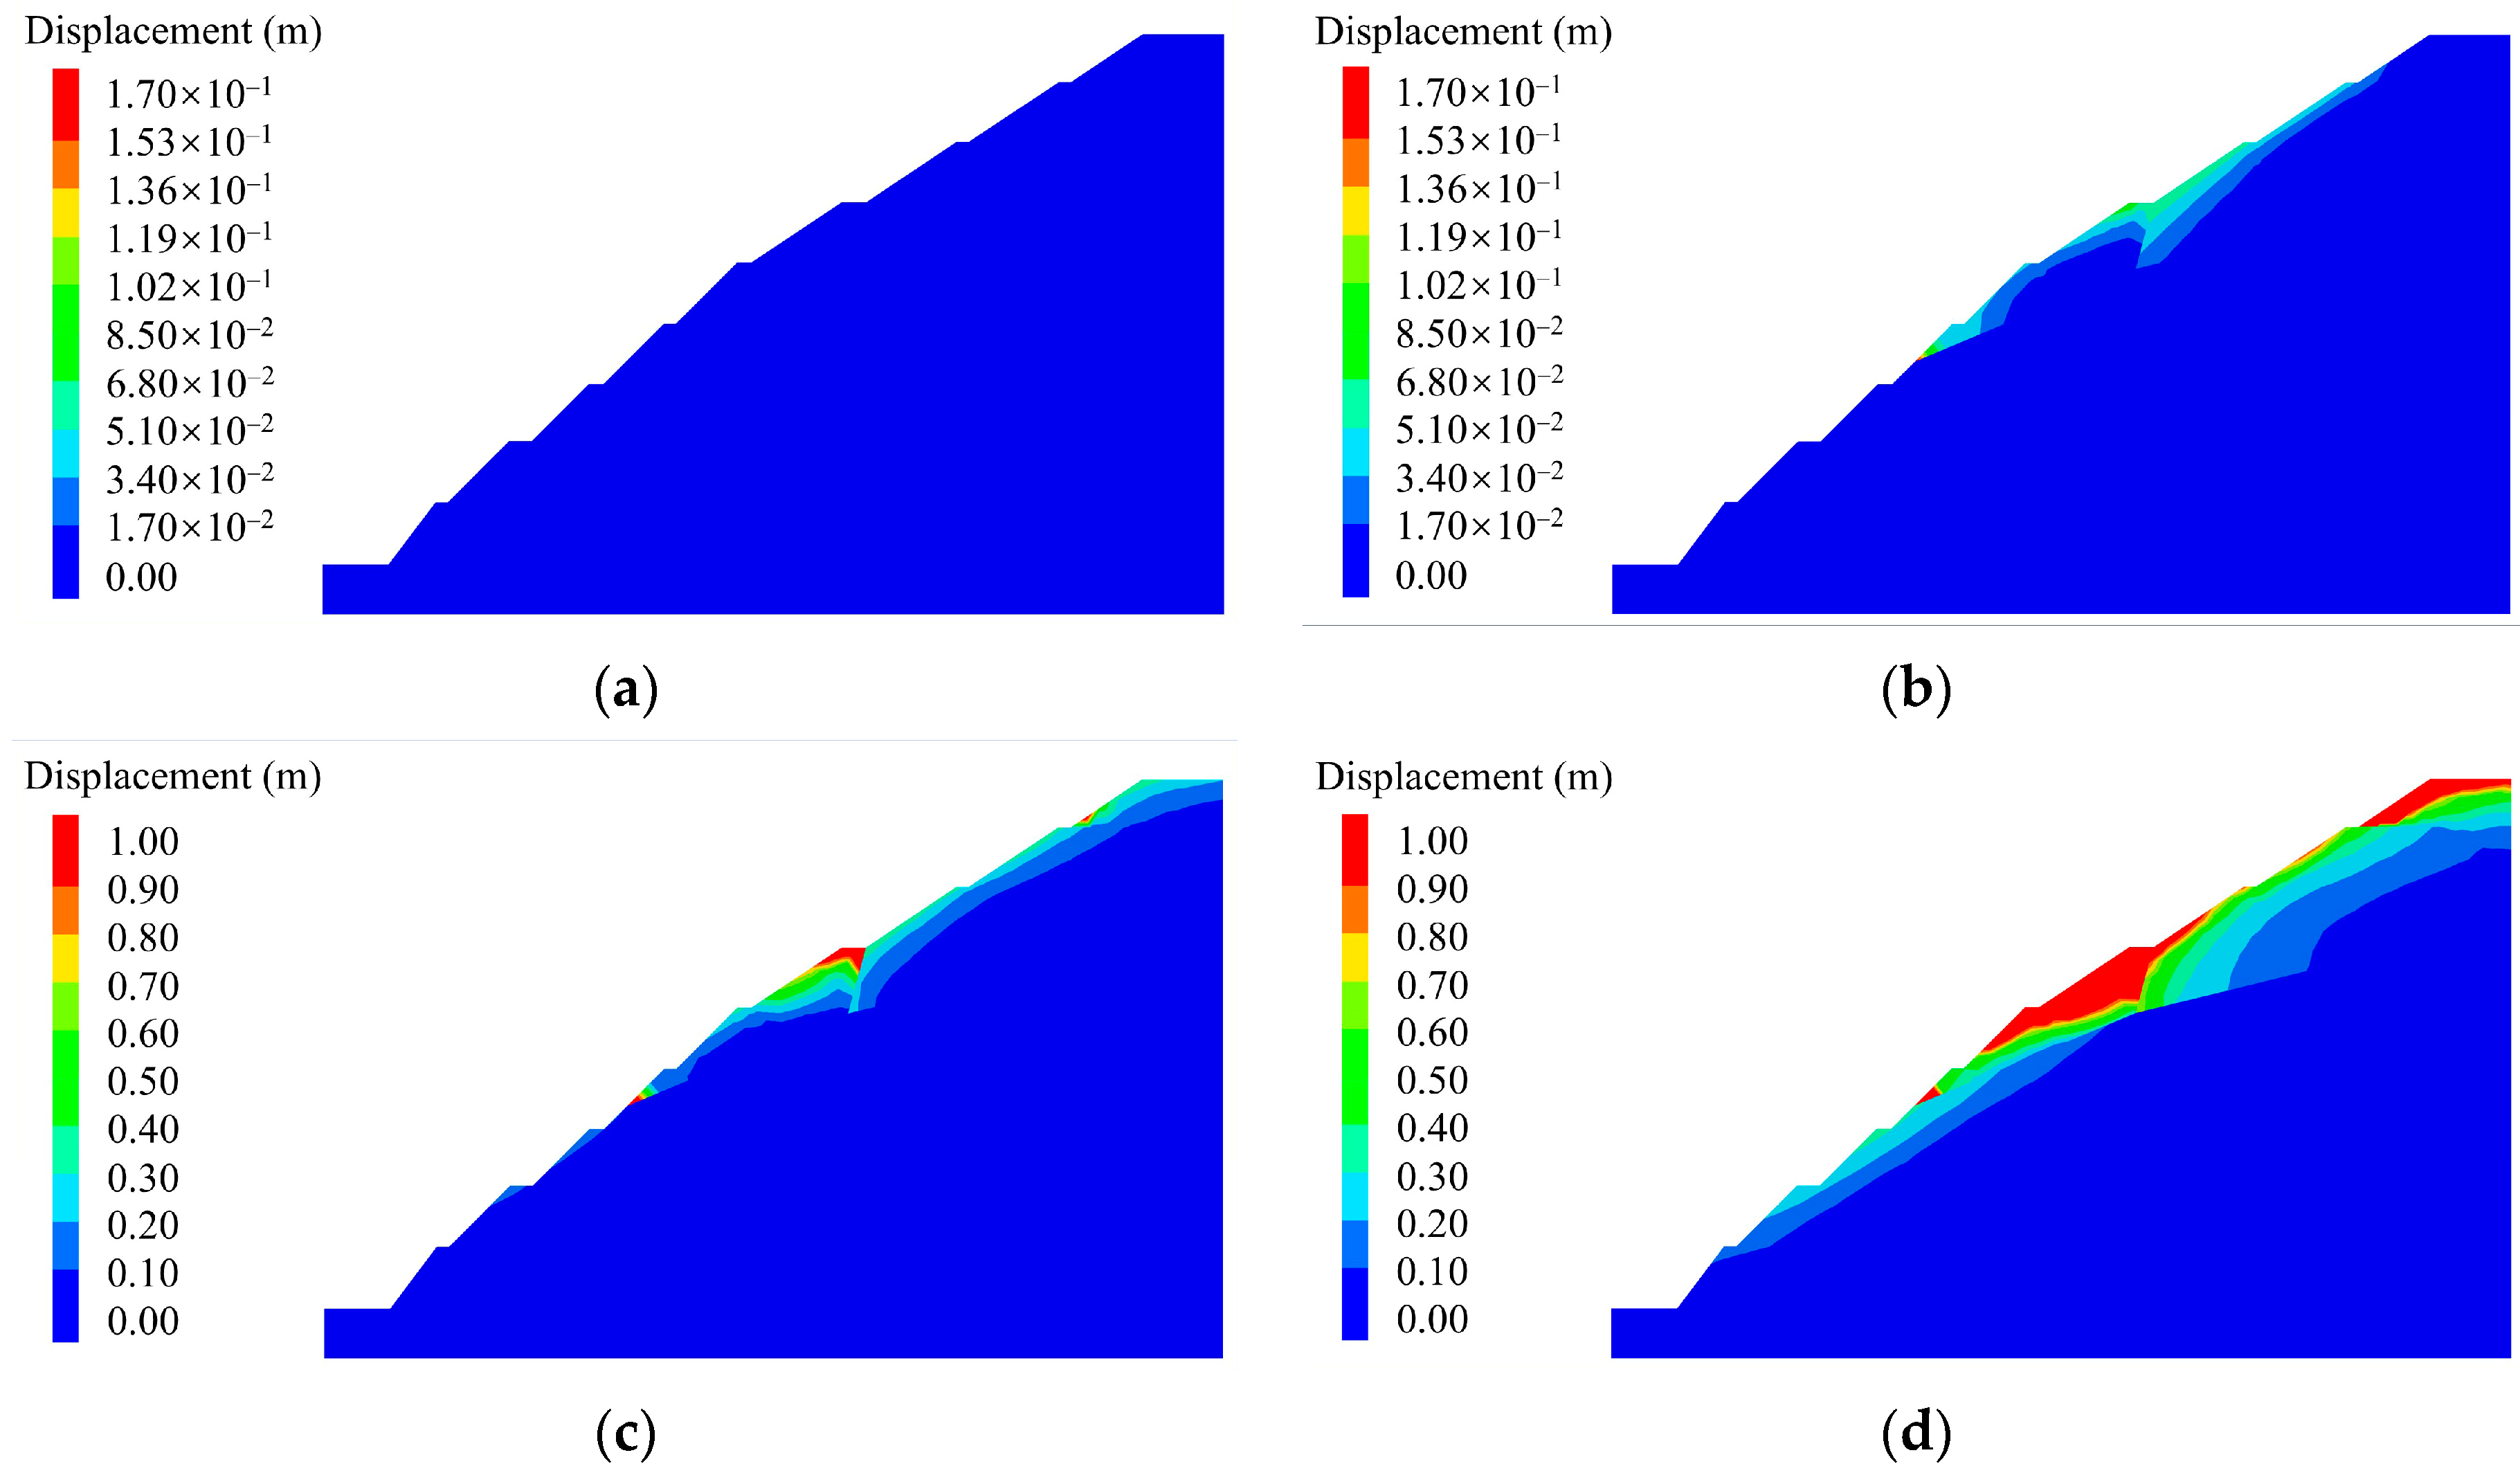
3.4. Numerical Simulation Analysis

3.4.1. Model Construction

Numerical simulation is an important method to verify the rationality of model test results. Finite difference software was used to construct a numerical model with the same size as the prototype. As shown in Figure 13, the slope dimension is 221 × 45 × 142   m (length × width × height). The anchorage system was arranged on the slope surface, using steel bars with a yield strength of 400 MPa and a radius of 16 mm as anchor bolts. A fixed displacement boundary condition was applied at the bottom of the slope. A fixed normal displacement boundary condition was applied at the toe of the slope, the back side of the slope, and the left and right sides. In the mechanical calculation, the Mohr–Coulomb model was used to analyze the elastic–plastic mechanical behavior of the geological body.
Considering the difference in fracture development between strongly weathering and weakly weathering sandstone, a structural plane was established in the numerical model. The internal friction angle dominates the shear behavior of the structural plane. Considering the most unfavorable situation, the internal friction angle = 35 ° was determined according to the parameters of the strongly weathering sandstone. In the fluid calculation, the structural plane can allow the seepage of groundwater, and the exposed position was set as the leakage boundary condition.
The physical parameters of the geological body are summarized in Table 7, including density ρ, elastic modulus E, cohesion c, internal friction angle φ, Poisson ‘s ratio v, permeability coefficient k, and porosity n.
The loading scheme of the numerical simulation is shown in Table 8. During Stage-1 to Stage-3, the process of rainfall enhancement was simulated by gradually increasing rainfall intensity. The fluid influx region was set at the strong–weak weathering interface (Figure 13). During Stage-4, the inflow condition of 5 × 10 4 m3/s was applied to each mesh in the fluid influx region to simulate the hydraulic fluctuation.
Based on the distribution of pore water pressure, slope displacement and bolt axial force were calculated. In the fluid calculation, when the saturation of the geological is less than 1, pore water pressure is regarded as 0. The fluid flow behavior in porous media is described by Darcy’s law [42]:
q i = k i k 0 p ρ f x j g j , l ,
where q i is the seepage velocity vector, p is the pore water pressure, k i is the permeability coefficient tensor of porous media, k 0 is the coefficient related to saturation, ρ f is the fluid density, x j is the head height position, g j is the gravity acceleration vector, and subscript l represents the directional gradient.

3.4.2. Calculation Results

The strength reduction method is commonly used in numerical simulation to analyze slope stability. This method uses factor of safety F to reduce the cohesion and internal friction angle [11]:
c 1 = c 0 F trial ,
φ 1 = φ 0 F t r i a l ,
where c 0 and φ 0 are the initial cohesion and internal friction angle of the geological body, respectively; c 1 and φ 1 are the reduced cohesion and internal friction angle, respectively; F trial is the factor of safety selected for each calculation attempt.
Figure 14a shows that the initial factor of safety is 1.3, and the maximum shear strain increment of the slope is distributed in large quantities throughout the slope. Figure 14b shows that the factor of safety after support is 2.4, and the maximum shear strain increment is concentrated at the front edge of the strong weathering zone. The existence of tensile cracks and structural planes is an important factor in inducing plane failure.
Figure 15 shows the evolution of the pore water pressure contour at the end of each loading stage. Figure 15a shows that the pore water pressure of the slope was small at the end of Stage-1, as the saturated region of the geological body was small at this time. Figure 15b illustrates that at the end of stage 2, the pore water pressure contour of 4.0 kPa was distributed in the shallow layer of the strongly weathering zone, revealing the saturation process of geological bodies under continuous infiltration. Figure 15c shows that the pore water pressure in the shallow layer of the slope increased significantly compared with the first two stages. Figure 15d indicates that the pore water pressure in the strongly weathering zone increased as a whole, and the structural plane evolved into a groundwater seepage channel, which well simulated the physical model test results. Due to the influence of lower porosity or permeability, the pore water pressure in the fully weathering zone and weakly weathering zone were lower than the strong weathering zone.
Figure 16 shows the evolution of the displacement magnitude at the end of each loading stage. As shown in Figure 16a, there was almost no displacement at the end of Stage-1. Combined with Figure 15a, it can be seen that the reduction of the effective stress caused by rainfall was weak. Figure 16b shows that the displacement was concentrated in the strongly weathering zone, and the displacement magnitude of the front block is about 0.1 m. Figure 16c shows that the tensile cracks were the dominant infiltration path of rainfall and led to the increase of pore water pressure at this position. At this time, the 1.0 m displacement magnitude contour was distributed on the sixth-level platform. Figure 16d shows that the 1.0 m displacement magnitude contour expanded significantly, and the displacement of most areas of the front block reached more than 1.0 m, indicating that the strong weathering zone has been unstable. The 1.0 m displacement magnitude contour can be seen in the shallow layer of the fully weathered zone, which illustrated the shallow damage characteristics in the model test.

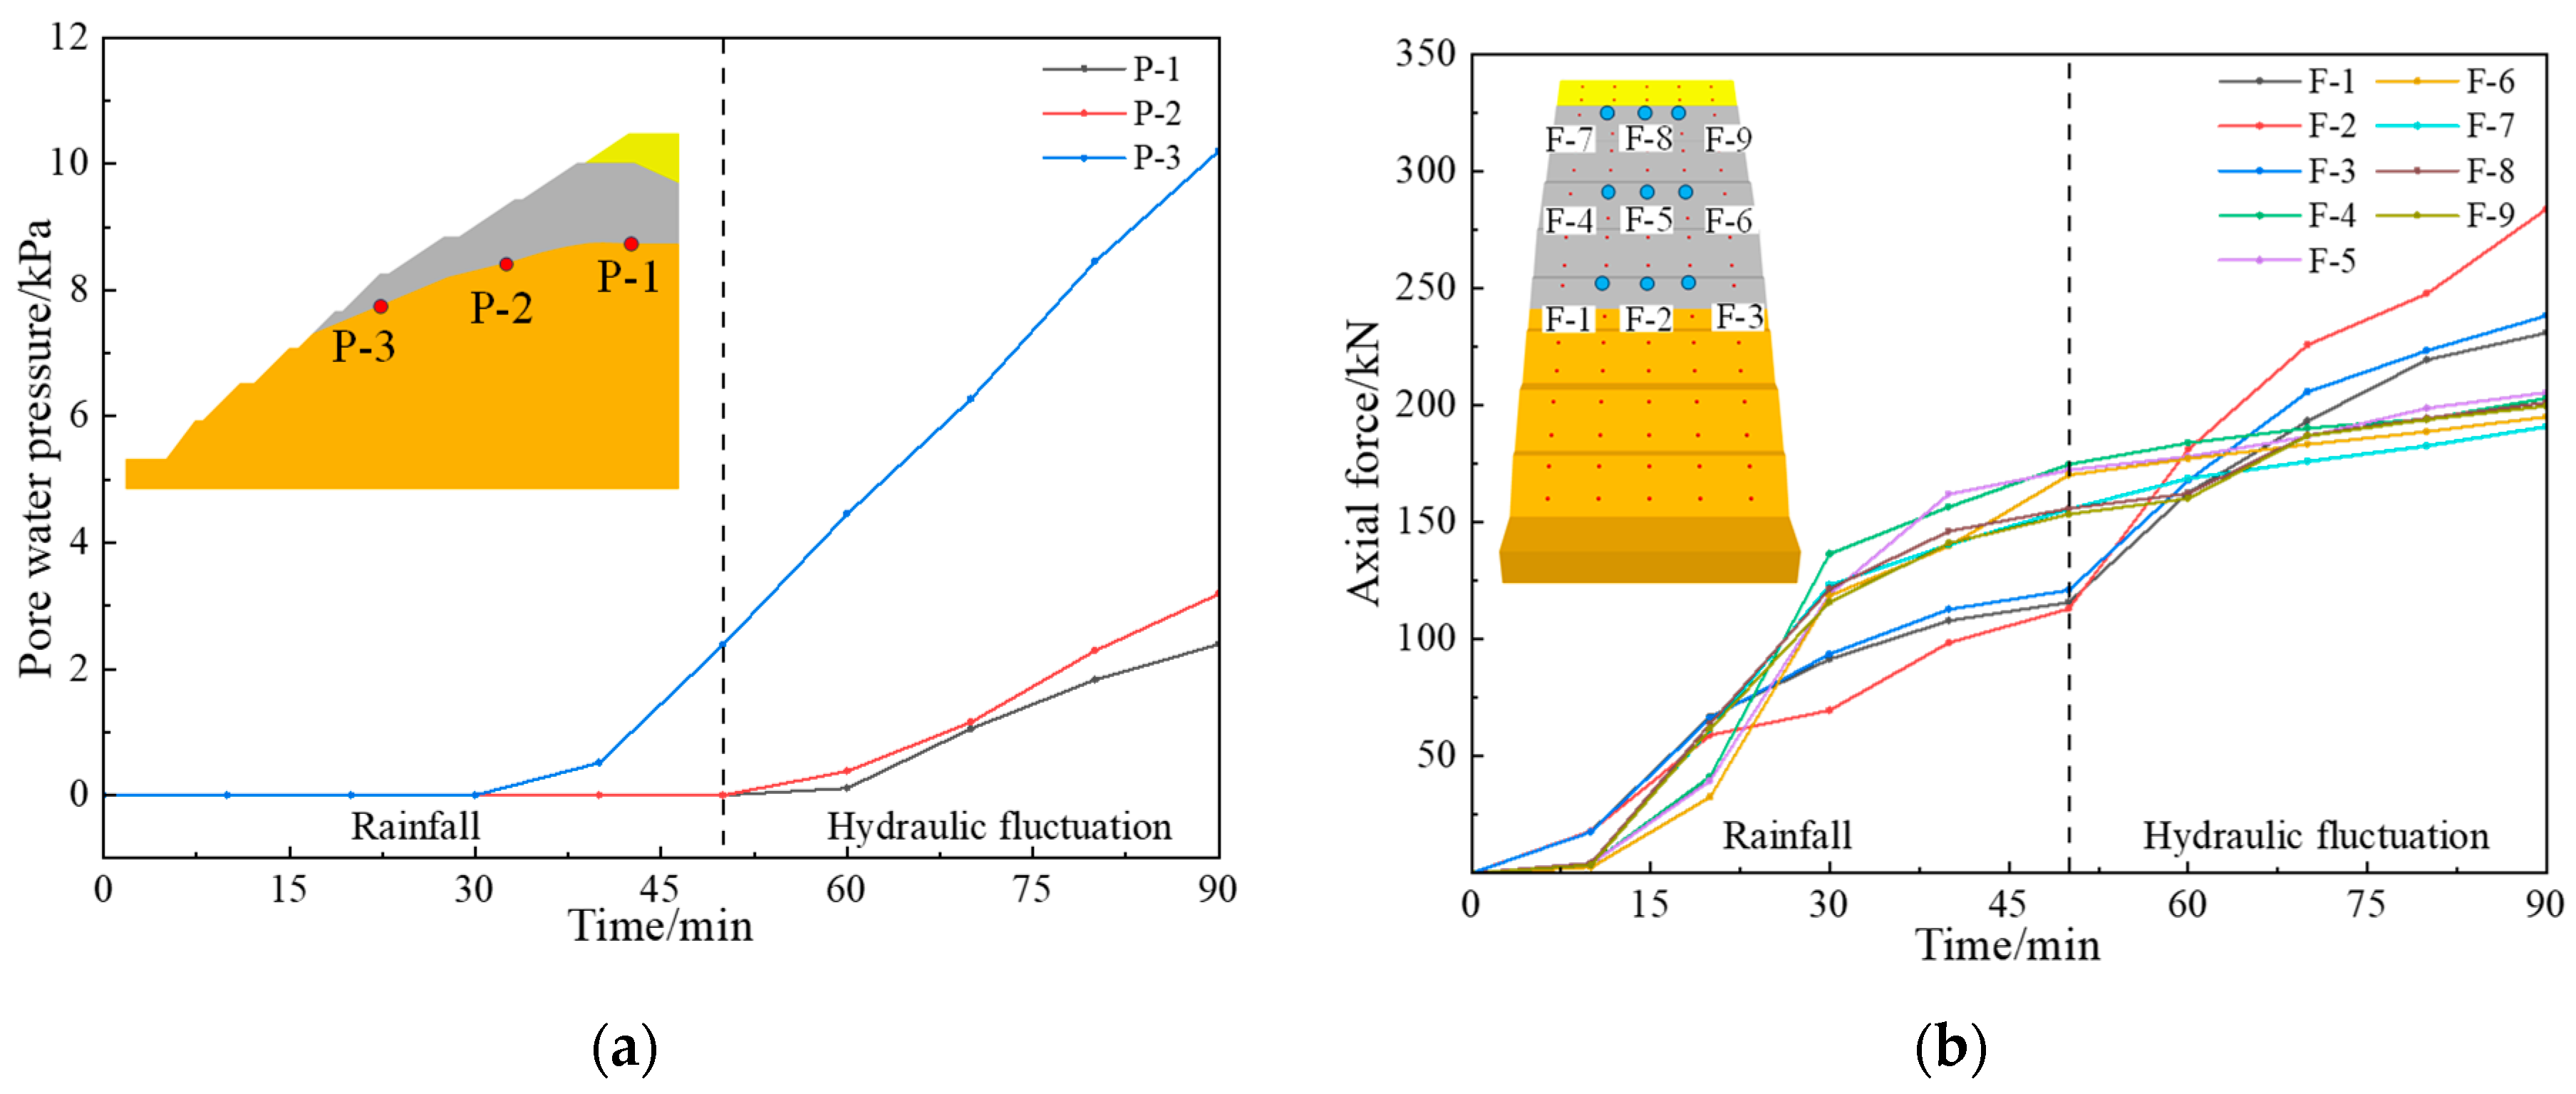
3.4.3. Monitoring Point Data Analysis

In order to compare with the slope stability criterion obtained from the physical model test, the axial force monitoring points (F-1~F-9) were arranged at the end of the anchor bolt in the numerical model, and the pore water pressure monitoring points P-1~P-3 were set in the weathering transition zone. Figure 17a shows the variation of pore water pressure at monitoring points. The geological body of the strongly weathering and weakly weathering interface was not saturated from Stage-1 to Stage-2. The pore water pressure first increased at monitoring point P-3 after 10 min of loading in Stage-3. During Stage-4, the pore water pressure at monitoring points P-2 and P-1 increased. The evolution of pore water pressure shows that the geologic body near the slope surface was saturated earlier, which is consistent with the vertical seepage law of rainfall. Figure 17b shows the variation of the anchor bolt axial force. During 0~10 min, the displacement of the slope was concentrated on the front block in the strongly weathering zone, so the axial force increased the fastest at monitoring points F-1~F-3. During 20~50 min, the axial force at F-4~F-9 monitoring points increased significantly, indicating that the deformation of the upper part of the slope increased. During the stage of hydraulic fluctuation, the increase of displacement of the front block caused a significant increase of anchor axial force at F-1~F-3 monitoring points, which is close to the sudden increase of axial force in the physical model test.
To verify the stability criterion of the slope weathering transition zone proposed in the physical model test, the data fitting analysis was carried out by using the axial force and pore water pressure data of the bolt extracted from the numerical simulation. The results show that the relationship between the pore water pressure at measuring point P-3 and the axial force of some monitoring points can be characterized by the Logistic function. Figure 18a,b show the fitting results of the axial force at monitoring points F-1 and F-2 and the pore water pressure at monitoring point P-3. The fitting parameters of the remaining monitoring points are summarized in Table 9.
Since the nonlinear flow behavior in the broken rock mass was not considered in the numerical simulation, the comparison of the test results shows that there is a significant difference between the monitoring criteria obtained from the numerical simulation and the model test results. In addition, the unloading response characteristics of ITS were not realized in the numerical simulation. In future research, a constitutive model for the corresponding ITS unloading response could be developed to study the application potential of slope stability monitoring in more detail.

4. Conclusions

In this study, a dam slope in Hainan Province was taken as the geological background. Focusing on the theoretical problem of stability monitoring of the slope weathering transition zones under cyclonic rainfall, the evolution law of anchor bolt axial force and pore water pressure was studied by means of a physical model test and numerical simulation. The conclusions are as follows:
(1)
Physical model test results showed that pore water pressure in the weathering transition zone during the rainfall infiltration stage was positively correlated with rainfall intensity, and pore water pressure increased significantly during the hydraulic fluctuation stage. The increase of permeability caused by hydraulic fluctuation and the expansion of the rock fracture network are the main causes for the increase of lateral deformation of the slope. The numerical simulation results showed that rainfall infiltration increased the pore water pressure in the shallow layer, the hydraulic effect of the structural plane increased the deep pore water pressure, and the strain softening caused by the decrease of effective stress is the main reason for the increase of slope displacement.
(2)
The physical model test results showed that during the rainfall infiltration stage, splash erosion and runoff led to rapid loss of anchor bolt preload in the middle and lower parts of the strongly weathering zone. With the increase of self-weight stress, tension cracks occurred at the top of the slope, and the axial force of the anchor bolt near the top of the slope increased. During the stage of hydraulic fluctuation, anchor bolt axial force decreased first, then increased, and finally tended to stabilize. ITS unloading response was observed at some monitoring points. In the numerical simulation, the axial force of the bolt increased continuously with the lateral displacement of the slope.
(3)
Based on the results of the physical model test and numerical simulation, the evolution laws of bolt axial force and pore water pressure in the weathering transition zone were analyzed, and a stability monitoring criterion of the slope weathering transition zone based on the Logistic function was established. In view of the long-term monitoring of bolt axial force as a common technique for slope disaster prevention, the monitoring criterion proposed in this study provides a useful reference for slope disaster prevention under cyclonic rainfall.
(4)
In this study, the physical model test was carried out under 1-g condition, making it very difficult to simulate the effective stress field distribution of the prototype slope. Therefore, the obtained slope failure mode is different from the real situation. Centrifuge model tests should be carried out in the future to obtain more accurate slope failure modes and weathering transition zone stability monitoring criteria.

Author Contributions

Conceptualization, H.S.; methodology, H.S. and Q.F.; software, Q.F. and Z.M.; validation, Z.M. and Y.W.; investigation, Q.F., Z.M. and Y.W; resources, H.S. and Q.F.; data curation, Q.F.; writing—original draft preparation, Q.F.; writing—review and editing, H.S.; visualization, H.S. and Q.F.; supervision, H.S. and Y.W. project administration, H.S.; funding acquisition, H.S. All authors have read and agreed to the published version of the manuscript.

Funding

This research is supported by the National Natural Science Foundation of China (Grant No. 52109120), the Hainan Province Science and Technology Special Fund (Grant Nos. ZDYF2024SHFZ060 and ZDYF2024GXJS307), and the Open Research Fund Program of the State Key Laboratory of Hydroscience and Engineering (Grant No. sklhse-2024-D-01).

Institutional Review Board Statement

Not applicable.

Informed Consent Statement

Not applicable.

Data Availability Statement

The data presented in this study are available on reasonable request from the corresponding author. The data are not publicly available due to privacy restrictions.

Conflicts of Interest

The authors declare no conflicts of interest.

References

  1. Choy, C.-W.; Wu, M.-C.; Lee, T.-C. Assessment of the damages and direct economic loss in Hong Kong due to Super Typhoon Mangkhut in 2018. Trop. Cyclone Res. Rev. 2020, 9, 193–205. [Google Scholar] [CrossRef]
  2. Yun, X.; Zhang, Y.; Liang, D.; Qu, Y.; Chen, H. Granite thermal reservoirs in Lingshui area of Hainan Island and their significance to geothermal resources, China. Energy Geosci. 2023, 4, 100166. [Google Scholar] [CrossRef]
  3. Chen, Z. Petrostratigraphy in Hainan Province; China University of Geosciences Press: Wuhan, China, 1997. (In Chinese) [Google Scholar]
  4. Luo, S.L.; Huang, D.; Peng, J.B.; Tomás, R. Influence of permeability on the stability of dual-structure landslide with different deposit-bedding interface morphology: The case of the three Gorges Reservoir area, China. Eng. Geol. 2022, 296, 106480. [Google Scholar] [CrossRef]
  5. Greco, R.; Comegna, L.; Damiano, E.; Marino, P.; Olivares, L.; Santonastaso, G.F. Recurrent rainfall-induced landslides on the slopes with pyroclastic cover of Partenio Mountains (Campania, Italy): Comparison of 1999 and 2019 events. Eng. Geol. 2021, 288, 106160. [Google Scholar] [CrossRef]
  6. Dou, H.; Xie, S.; Jian, W.; Wang, H.; Guo, C. Characteristics of preferential flow suffosion of soil-rock interface in spherical weathered granite slopes. Rock Soil Mech. 2024, 45, 950–960. (In Chinese) [Google Scholar] [CrossRef]
  7. He, M. Real-time remote monitoring and forecasting system for geological disasters of landslides and its engineering application. Chin. J. Rock Mech. Eng. 2009, 28, 1081–1090. (In Chinese) [Google Scholar]
  8. Zhou, Y.; Wang, X.; Zhu, Y.; Li, J.; Jiang, X. Monitoring and numerical simulation of an interbedding high slope composed of soft and hard strong-weathered rock. Rock Soil Mech. 2018, 39, 2249–2258. (In Chinese) [Google Scholar]
  9. Meng, Z.; Sun, H.; Zhu, Y.; Fu, B.; Ye, Z. Intelligent terminal structure response on anchorage foundation stability of Undersea Data Cabins affected by turbidity flow. Phys. Fluids 2025, 37, 025112. [Google Scholar] [CrossRef]
  10. Zerradi, Y.; Souissi, M.; Larabi, A. Application of the deterministic block theory to the slope stability design of an open-pit mine in Morocco. Min. Miner. Depos. 2023, 17, 53–60. [Google Scholar] [CrossRef]
  11. Sdvyzhkova, O.; Moldabayev, S.; Babets, D.; Bascetin, A.; Asylkhanova, G.; Nurmanova, A.; Prykhodko, V. Numerical modelling of the pit wall stability while optimizing its boundaries to ensure the ore mining completeness. Min. Miner. Depos. 2024, 18, 1–10. [Google Scholar] [CrossRef]
  12. Li, L.; Li, Y.; Xu, Y. Instability evolution of expansive soil slope due to short duration-varying intensities of rainfall. Eng. Fail. Anal. 2024, 161, 108313. [Google Scholar] [CrossRef]
  13. Chen, R.; Dou, H.; Lin, Y.; Liu, Q.; Jian, W. In-situ infiltration-runoff characterization of slopes under the influences of different rainfall patterns and slope gradients. Catena 2024, 247, 108519. [Google Scholar] [CrossRef]
  14. Song, X.; Tan, Y.; Lu, Y.; Liu, J.; Liu, Y. Experimental and numerical studies on the instability of simple homogeneous sandy slopes under different infiltration scenarios. Chin. J. Rock Mech. Eng. 2024, 43, 1204–1218. (In Chinese) [Google Scholar] [CrossRef]
  15. Zhuang, Y.; Xing, A.; Jiang, Y.; Sun, Q.; Yan, J.; Zhang, Y. Typhoon, rainfall and trees jointly cause landslides in coastal regions. Eng. Geol. 2022, 298, 106561. [Google Scholar] [CrossRef]
  16. Lin, B.; Zhang, D.; Jian, W.; Dou, H.; Wang, H.; Fan, X. Response of vegetated slope stability under wind-driven rain conditions. Rock Soil Mech. 2024, 45, 2765–2774. [Google Scholar] [CrossRef]
  17. Guo, Z.; Huang, Q.; Liu, Y.; Wang, Q.; Chen, Y. Model experimental study on the failure mechanisms of a loess-bedrock fill slope induced by rainfall. Eng. Geol. 2023, 313, 106979. [Google Scholar] [CrossRef]
  18. Li, X.; Li, Q.; Wang, Y.; Liu, W.; Hou, D.; Zhu, C. Effect of slope angle on fractured rock masses under combined influence of variable rainfall infiltration and excavation unloading. J. Rock Mech. Geotech. Eng. 2024, 16, 4154–4176. [Google Scholar] [CrossRef]
  19. Tao, Z.; Xu, C.; Liu, S.; Li, Y.; Xiu, K. Physical modelling of damage mechanism of slopes containing near horizontal weak layers under rainfall conditions. J. China Coal Soc. 2024, 49, 4671–4686. (In Chinese) [Google Scholar] [CrossRef]
  20. Li, K.; Sun, P.; Wang, H.; Ren, J. Insight into failure mechanisms of rainfall induced mudstone landslide controlled by structural planes: From laboratory experiments. Eng. Geol. 2024, 343, 107774. [Google Scholar] [CrossRef]
  21. Yu, D.; Huang, Q.; Kang, X.; Liu, Y.; Chen, X.; Xie, Q.; Guo, Z. The unsaturated seepage process and mechanism of internal interfaces in loess-filled slopes during intermittent rainfall. J. Hydrol. 2023, 619, 129317. [Google Scholar] [CrossRef]
  22. Zhu, Y.; Zhang, Y.; Lan, H.; Peng, J.; Zheng, H.; Zhao, D.; Yin, Y. Effect of crack depth on the initiation and propagation of crack-induced sliding in a paleosol area on a loess slope: Three-dimensional investigation based on model testing and laser scanning. Eng. Geol. 2024, 342, 107745. [Google Scholar] [CrossRef]
  23. Hu, H.; Huang, Y.; Xiong, M.; Zhao, L. Investigation of seismic behavior of slope reinforced by anchored pile structures using shaking table tests. Soil Dyn. Earthq. Eng. 2021, 150, 106900. [Google Scholar] [CrossRef]
  24. Zhao, D.-J.; Xu, H.-X.; Yu, Y.-B.; Chen, L.-S. Identification of synoptic patterns for extreme rainfall events associated with landfalling typhoons in China during 1960–2020. Adv. Clim. Change Res. 2022, 13, 651–665. [Google Scholar] [CrossRef]
  25. Sun, Q.; Zhang, T.; Wu, J.; Han, S.; Zhao, Y. Promoting effect of vegetation on the landslide induced by typhoon rainstorm. Geol. Surv. China 2022, 9, 66–73. (In Chinese) [Google Scholar] [CrossRef]
  26. Xu, B.; Liu, X.; Liang, Y.; Zhou, X.; Zhong, Z. Stability of bedded rock slopes subjected to hydro-fluctuation and associated strength deterioration. J. Rock Mech. Geotech. Eng. 2024, 16, 3233–3257. [Google Scholar] [CrossRef]
  27. Li, X. (Ed.) Experimental Simulation Technology of Rock Mechanics; Science Press: Beijing, China, 2007; pp. 16–24. [Google Scholar]
  28. Tao, Z.; Zhu, C.; He, M.; Karakus, M. A physical modeling-based study on the control mechanisms of Negative Poisson’s ratio anchor cable on the stratified toppling deformation of anti-inclined slopes. Int. J. Rock Mech. Min. Sci. 2021, 138, 104632. [Google Scholar] [CrossRef]
  29. Nian, G.Q.; Chen, Z.H.; Zhu, T.Y.; Zhang, L.F.; Zhou, Z.H. Experimental study on the failure of fractured rock slopes with anti-dip and strong weathering characteristics under rainfall conditions. Landslides 2024, 21, 165–182. [Google Scholar] [CrossRef]
  30. Tao, Z.; Ren, S.; Hao, Y.; Li, Q.; Fu, Q.; He, M. Physical model experiment on failure mechanism and NPR anchor cable control effect of layered counter-tilt slope. Rock Soil Mech. 2021, 42, 976–990. (In Chinese) [Google Scholar] [CrossRef]
  31. Zhu, Y.; Wang, A.; Huang, A.; Wu, L.; Cheng, D. Study on failure mechanism of loess slope reinforced by frame prestressed anchors under the action of rainfall. Met. Mine 2024, in press. Available online: https://kns.cnki.net/kcms/detail/34.1055.TD.20240605.1322.002.html (accessed on 15 April 2025). (In Chinese).
  32. Sun, H.; Liu, H.; Liu, X.L.; Ye, Z.N. Mechanical testing and numerical simulation of intelligent terminal structure of rockbolt used as a deformable support and for safety monitoring in rock engineering. Tunn. Undergr. Space Technol. 2024, 148, 105769. [Google Scholar] [CrossRef]
  33. Sun, H.; Liu, H.; You, C.; Ye, Z.; Long, Q. Yielding performance of an intelligent terminal structure for cable bolts. J. Intell. Constr. 2024, 2, 9180034. [Google Scholar] [CrossRef]
  34. Yuan, Z.; Yan, C.; Tao, Y.; Jia, Z.; Yang, W.; Xu, W.; Gao, S. Erosion model test of loess slope with framework protection. J. Eng. Geol. 2023, 31, 1989–1998. (In Chinese) [Google Scholar] [CrossRef]
  35. Takahashi, A.; Inoue, T.; Yamagata, S.; Horikoshi, K. Centrifuge model tests on suffusion-induced deterioration and its consequences in seismic response of levees. Soils Found. 2025, 65, 101592. [Google Scholar] [CrossRef]
  36. Zhao, X.; Song, X.; Wang, D.; Li, L.; Meng, P.; Fu, C.; Wang, L.; Wei, W.; Liu, Y.; Li, H. Mechanisms of hydraulic erosion control in different microrelief patterns of loess sloped farmland under continuous rainfall. Catena 2025, 249, 108630. [Google Scholar] [CrossRef]
  37. Garnier, J.; Gaudin, C.; Springman, S.M.; Culligan, P.J.; Goodings, D.; Konig, D.; Kutter, B.; Phillips, R.; Randolph, M.F.; Thorel, L. Catalogue of scaling laws and similitude questions in geotechnical centrifuge modelling. Int. J. Phys. Model. Geotech. 2007, 7, 1–23. [Google Scholar] [CrossRef]
  38. Xu, J.; Fang, K. Deformation characteristics of unsaturated slope during post-rainfall earthquake: Insights from centrifuge and numerical modeling. J. Rock Mech. Geotech. Eng. 2025, in press. [Google Scholar] [CrossRef]
  39. Xin, P.; Kang, X.; Wu, W.; Scaringi, G.; Wang, X.; Wu, Q. Centrifuge modelling of a roto-translational landslide in stiff clay formation. Eng. Geol. 2025, 349, 107964. [Google Scholar] [CrossRef]
  40. Fang, K.; Tang, H.; Li, C.; Su, X.; An, P.; Sun, S. Centrifuge modelling of landslides and landslide hazard mitigation: A review. Geosci. Front. 2023, 14, 101493. [Google Scholar] [CrossRef]
  41. Ng, C.W.W. The state-of-the-art centrifuge modelling of geotechnical problems at HKUST. J. Zhejiang Univ. Sci. A 2014, 15, 1–21. [Google Scholar] [CrossRef]
  42. Wang, Y.; Aryana, S.A.; Allen, M.B. An extension of Darcy’s law incorporating dynamic length scales. Adv. Water Resour. 2019, 129, 70–79. [Google Scholar] [CrossRef]
Figure 1. The location of the water conservancy project and profile of the prototype slope: (a) Study area; (b) Geological profile of the bank dam slope.
Applsci 15 04499 g001
Figure 2. Similar materials test and support structure design: (a) Preparation and mechanical properties test of similarity materials; (b) Supporting structure in model test.
Applsci 15 04499 g002
Figure 3. The composition of ITS component and uniaxial tension response characteristic curve of ITS component: (a) ITS component composition and profile dimensions; (b) Response characteristic curve of ITS component.
Applsci 15 04499 g003
Figure 4. Experimental system design.
Applsci 15 04499 g004
Figure 5. Model construction process: (a) Construction process of weakly weathering zone; (b) Construction process of strongly weathering zone.
Applsci 15 04499 g005
Figure 6. The sensor layout scheme and the size of the physical model.
Applsci 15 04499 g006
Figure 7. Variation of pore water pressure and slope failure characteristics: (a) Initial state; (b) Plane failure of slope; (c) Variation of pore water pressure.
Applsci 15 04499 g007
Figure 8. Variation of axial force at monitoring points ITS-1, ITS-2, and ITS-3 and slope failure characteristics: (a) Slope surface characteristics during block sliding; (b) Plane failure caused anchor bolt tension; (c) variation of axial force.
Applsci 15 04499 g008
Figure 9. Variation of axial force at monitoring points ITS-4, ITS-5, and ITS-6 and slope failure characteristics: (a) Slope surface erosion characteristic; (b) Tension crack caused by block slide; (c) Variation of axial force.
Applsci 15 04499 g009
Figure 10. Variation of axial force at monitoring points ITS-7, ITS-8, and ITS-9 and slope failure characteristics: (a) Slope surface erosion characteristic; (b) Tension crack caused by block slide; (c) Variation of axial force.
Applsci 15 04499 g010
Figure 11. Different function model fitting results: (a) Fitting analysis of rainfall infiltration stage; (b) Fitting analysis of hydraulic fluctuation stage.
Applsci 15 04499 g011
Figure 12. The physical meaning of the fitting model: (a) Rainfall infiltration stage; (b) Hydraulic fluctuation stage.
Applsci 15 04499 g012
Figure 13. Modeling construction.
Applsci 15 04499 g013
Figure 14. Factor of safety before and after supporting: (a) Before arranging the supporting structure; (b) After arranging the supporting structure.
Applsci 15 04499 g014
Figure 15. Evolution of pore water pressure contour: (a) End of Stage-1; (b) End of Stage-2; (c) End of Stage-3; (d) End of Stage-4.
Applsci 15 04499 g015
Figure 16. Evolution of displacement magnitude contour: (a) End of Stage-1; (b) End of Stage-2; (c) End of Stage-3; (d) End of Stage-4.
Applsci 15 04499 g016
Figure 17. Monitoring data variation at monitoring points: (a) Variation of pore water pressure; (b) Variation of anchor bolt axial force.
Applsci 15 04499 g017
Figure 18. Fitting results: (a) Fitting curve of axial force at monitoring point F-1 and pore water pressure at monitoring point P-3; (b) Fitting curve of axial force at monitoring point F-2 and pore water pressure at monitoring point P-3.
Applsci 15 04499 g018
Table 1. Similar constants of derived physical quantities.
Similarity ConstantCalculation FormulaValue
Stress σ C σ = C ρ C g C L 260
Cohesion c C c = C ρ C g C L 260
Elastic module E C E = C ρ C g C L 260
Friction angle φ C ρ = 1 1
Time t C t = C L 0.5 C g 0.5 14.1
Permeability coefficient k C k = ( C L C g ) 0.5 14.1
Table 2. Physical and mechanical properties of in-situ rock and similar materials.
LithologyUniaxial Compressive Strength (MPa)E (MPa)c (kPa) φ (°) ρ ( g · c m 3 ) k   ( cm · s 1 )
Weakly weathering rock90.004.00 × 1042.5 × 103452.501.00 × 10−7
Strongly weathering rock45.001.00 × 1049.0 × 103352.402.00 × 10−6
Fully weathering rockN/AN/A500.0352.105.00 × 10−3
Similarity material-10.37143.61121.5461.932.53 × 10−8
Similarity material-20.1935.0130.5321.793.11 × 10−7
Similarity material-3N/AN/A6.6341.668.13 × 10−4
In the table, N/A indicates that the geologic body or similar material has not been tested for this mechanical property.
Table 3. Composition and proportion of similarity materials.
Material NameBarite Powder (%)Fine Sand (%)Coarse Sand (%)Gypsum (%)Water (%)
Similarity material-130.943.68.77.19.7
Similarity material-229.845.37.84.113.0
Similarity material-320.157.78.10.713.4
Table 4. Model test loading scheme.
Loading StageRainfall Intensity ( m m · h 1 ) Wind Velocity ( m · s 1 )Groundwater DeviceTime (min)
Rainfall infiltrationStage-1351off10
Stage-2653off10
Stage-31055off30
Hydraulic fluctuationStage-41055on40
Table 5. Fitting parameter during rainfall infiltration period.
VariableConstant R 2
A Data Set FromP Data Set From C 1 C 2 P 0 n
ITS-1P-317.4115.500.2911.340.92
ITS-2P-318.5116.720.247.810.95
ITS-3P-317.3413.560.224.400.99
ITS-4P-316.4312.270.3217.380.93
ITS-5P-37.180.330.421.820.94
ITS-6P-314.7210.370.343.760.94
Table 6. Fitting parameter during hydraulic fluctuation period.
VariableConstant R 2
A Data Set fromP Data Set from C 1 C 2 P 0 n
ITS-2P-315.7414.331.8792.350.73
ITS-3P-317.5112.181.87115.410.89
ITS-5P-32.741.591.86115.940.76
ITS-6P-311.099.431.87148.250.78
Table 7. Geological body parameters.
Name ρ ( kg · m 3 )E (MPa)c (kPa) φ (°)v k   ( c m · s 1 ) n
Fully weathering rock2100800500.0350.30 5 × 10 3 0.25
Strongly weathering rock2400 1 × 10 4 9.0   × 10 3 350.26 2 × 10 6 0.1
Weakly weathering rock2500 4 × 10 4 2.5 × 10 4 450.23 1 × 10 7 0.05
Table 8. Loading scheme of numerical simulation.
Loading StageRainfall Intensity ( mm · h 1 )Groundwater Discharge per Mesh ( m 3 · s 1 )Duration (min)
RainfallStage-135010
Stage-265010
Stage-3105030
Hydraulic fluctuationStage-4105 5 × 10 4 40
Table 9. Numerical results fitting parameters.
VariableConstant R 2
A Data Set FromP Data Set From C 1 C 2 P 0 n
F-3P-3102.85255.554.942.710.98
F-4P-3136.321035.876018.940.400.99
F-6P-3118.38216.522.420.790.99
F-8P-3124.57 5.71 × 10 5 6.080.570.92
Disclaimer/Publisher’s Note: The statements, opinions and data contained in all publications are solely those of the individual author(s) and contributor(s) and not of MDPI and/or the editor(s). MDPI and/or the editor(s) disclaim responsibility for any injury to people or property resulting from any ideas, methods, instructions or products referred to in the content.

