Article

Detection of Undeclared Meat Species and Fatty Acid Variations in Industrial and Traditional Beef Sausages

by
Dafina Mehmetukaj
1,2,
Armend Cana
1,3,
Vlora Gashi-Zogëjani
1,
Malbora Shandro-Zeqiri
1,
Drita Bajraktari
1,
Dean Jankuloski
2,
Zehra Hajrulai-Musliu
2 and
Xhavit Bytyçi
3,*
1
Kosovo Food and Veterinary Laboratory, Food and Veterinary Agency, Str. Lidhja e Pejes. No 241, 10000 Pristina, Kosovo
2
Faculty of Veterinary Medicine, Ss. Cyril and Methodius University, Lazar Pop-Trajkov 5–7, 1000 Skopje, North Macedonia
3
Food Science and Technology Program, University for Business and Technology (UBT), Kalabria, 10000 Pristina, Kosovo
*
Author to whom correspondence should be addressed.
Appl. Sci. 2025, 15(8), 4440; https://doi.org/10.3390/app15084440
Submission received: 11 March 2025 / Revised: 31 March 2025 / Accepted: 10 April 2025 / Published: 17 April 2025

Abstract

:
This study investigates the presence of undeclared meat species in beef sausages and analyzes the impact of poultry meat addition on fatty acid composition. A total of 68 beef sausage samples produced and obtained from markets in Kosovo were analyzed, comprising 43 industrial and 25 traditional (homemade) sausages. Using the Liquid Chip Display (LCD) Array System, Meat 5.0, we detected that 52.94% of the samples contained meat from other species, with poultry being the most frequently added (45.55%), followed by mutton (4.41%) and turkey (2.9%). Notably, 46.42% of industrial sausages with added meat and 100% of homemade sausages with mixed meat were undeclared, highlighting significant mislabeling concerns. Fatty acid analysis with Gas Chromatography Flame Ionization Detection (GC-FID) revealed that sausages with poultry meat exhibited lower levels of saturated fatty acids (SFAs) and higher polyunsaturated fatty acids (PUFAs), particularly linoleic (C18:2) and alfa-linolenic (C18:3) acids. The inclusion of poultry meat significantly reduced the proportion of palmitic (C16:0) and stearic (C18:0) acids while increasing unsaturated fatty acids. As the percentage of poultry meat increased, SFAs decreased from 54.08% (at 10% poultry meat) to 29.55% (at 90%), while PUFAs rose from 4.09% to 26.64%. These findings indicate that poultry addition enhances the nutritional profile of sausages by improving the fatty acid balance. This study highlights the need for stricter labeling regulations to ensure consumer transparency. Future research should explore these modified products’ sensory and quality attributes to assess their market acceptance.

1. Introduction

Meat is highly nutritious and contributes several essential nutrients that are difficult to obtain in the right amounts from other food sources, like bioavailable protein and several essential micronutrients often lacking in the diet, including iron, zinc, and vitamin B12 [1]. Animal proteins are generally highly digestible and nutritionally superior to plant proteins, with higher amino acid bioavailability [2]. Among many meat products, sausages are privileged foods due to their diversity, nutritional value, deep roots in culture, and economic importance [3]. There has been tremendous improvement in almost all aspects of sausage production, such as the shape of the product, species of animals used, casings, ingredients, equipment, machines, etc. Further advances will still be made in sausage production due to technological progress, both in areas that have been addressed and those that are yet to be researched [4].
Meat from other species, like poultry or pork, is added to beef sausage for economic reasons related to the fraudulent substitution of cheaper meats for more expensive types [5]. This can have severe economic and ethical repercussions because, in some countries, the addition of poultry and other meats to products made from 100% beef is prohibited, or the use of pork meat is a matter of concern for religious reasons [6]. Adding chicken to beef sausages can also change the fatty acid composition of the sausage because the fatty acid profile is strongly influenced by the type of meats, as well as other ingredients such as vegetable oil and lard, used in its formulation [7]. So, in homemade beef sausages, saturated fatty acids accounted for 59.10% of total fatty acids, followed by monounsaturated (38.63%) and polyunsaturated fatty acids (2.27%). The fatty acid profile was dominated by oleic (C18:1, 34.37%) and palmitic (C16:0, 30.24%) acids, and short-chain fatty acids were also present [8]. On the other hand, chicken meat had a lower proportion of saturated fatty acids (36.4%) than beef (53.3%) and a higher proportion of polyunsaturated fatty acids (21.3%) than beef (3.0%) [9]. The most common fatty acids in chicken meat were linoleic, oleic, and palmitic [10].
Even though substitution with species, protein content, fat content, or plant ingredients are major forms of food substitution, adulterated food products are responsible for mild to severe potential risks to public health and the environment [11]. Diarrhea, nausea, allergic reaction, diabetes, cardiovascular disease, etc., are frequently observed illnesses upon consumption of adulterated food [12]. For the reasons stated above, meat production companies must declare the addition of other species and various grain flours to sausage. This is because a potential disagreement is observed between consumers’ expectations regarding meat product labeling and the level of transparency that can be achieved with current regulations. In particular, using “and/or” in meat products warrants further attention, notably regarding consumer education and industry guidance [13]. It should also emphasize the importance of increasing transparency and accountability within the food industry through improved communication and enforcement of regulatory standards and the need for ongoing education and training initiatives to raise awareness of food safety regulations [14]. Undeclared additions can erode trust in food labeling and regulatory systems, so the declaration of additions in sausages distinguishes between trust in food labeling itself and the trust that consumers develop in the food supply system through food labeling [15].
Meanwhile, the labeling of products is the responsibility of every company that pro-duces food, and labeling is sanctioned by the Kosovo national regulation on labeling, presentation, and advertising of food products—Administrative Instruction No. 09/2013 [16], as well as European Union regulation No. 1169/2011 on the provision of food in-formation to consumers. This regulation mandates that food business operators provide clear and accurate information about the contents of their products to ensure consumer transparency. According to Annex VII, Part B of this regulation, the species from which the meat originates must be declared [17]. However, despite this fact, meat products are targets for species substitution and adulteration due to their market value.
Determining fast and efficient meat adulteration detection methods is critical for the development of the food industry and the safety of consumers. Based on the classification of target substances, adulteration detection technologies are classified as protein, metabolite, or nucleic acid-based [18]. However, their inherent limitations have been replaced; several methods based on polymerase chain reaction have been proposed as useful means for identifying the species origin in meat and meat products due to their high specificity and sensitivity, as well as rapid processing time and low cost [19]. One of the most convenient methods for the identification of animal species in processed meat products is the examination of DNA sequences. Real-time polymerase chain reaction (qPCR) techniques are particularly suitable because even small fragments of DNA formed during heat processing of the meat can be amplified and identified. A real-time PCR method has been developed and evaluated for the identification of processed meat products [20]. Species-specific real-time polymerase chain reaction (PCR) assays using TaqMan probes have been developed for verifying the labeling of meat and commercial meat products from game birds, including quail, pheasant, partridge, guinea fowl, pigeon, Eurasian woodcock, and song thrush, and have demonstrated the suitability of the assay for the detection of the target DNAs [21]. On the other hand, two duplex PCR (cattle–buffalo and chicken–pig) were applied with species-specific mitochondrial Cyt b gene primers and determined to be accurate for species identification in meat and milk [22]. The results suggest that both ELISA and PCR are specific and reliable tools for the detection of Grouper mislabeling/adulteration and the accurate implementation of traceability for successful regulatory food controls [23].

2. Materials and Methods

2.1. The Sampling

A total of 68 samples of beef sausage were collected in Kosovo markets, including 43 industrial sausages and 25 traditional sausages. The collection was carried out without considering whether the meat from different species was declared on the label. Each 250 g sample was divided into two parts for molecular and chemical testing. Samples were kept at 4 °C until further testing.

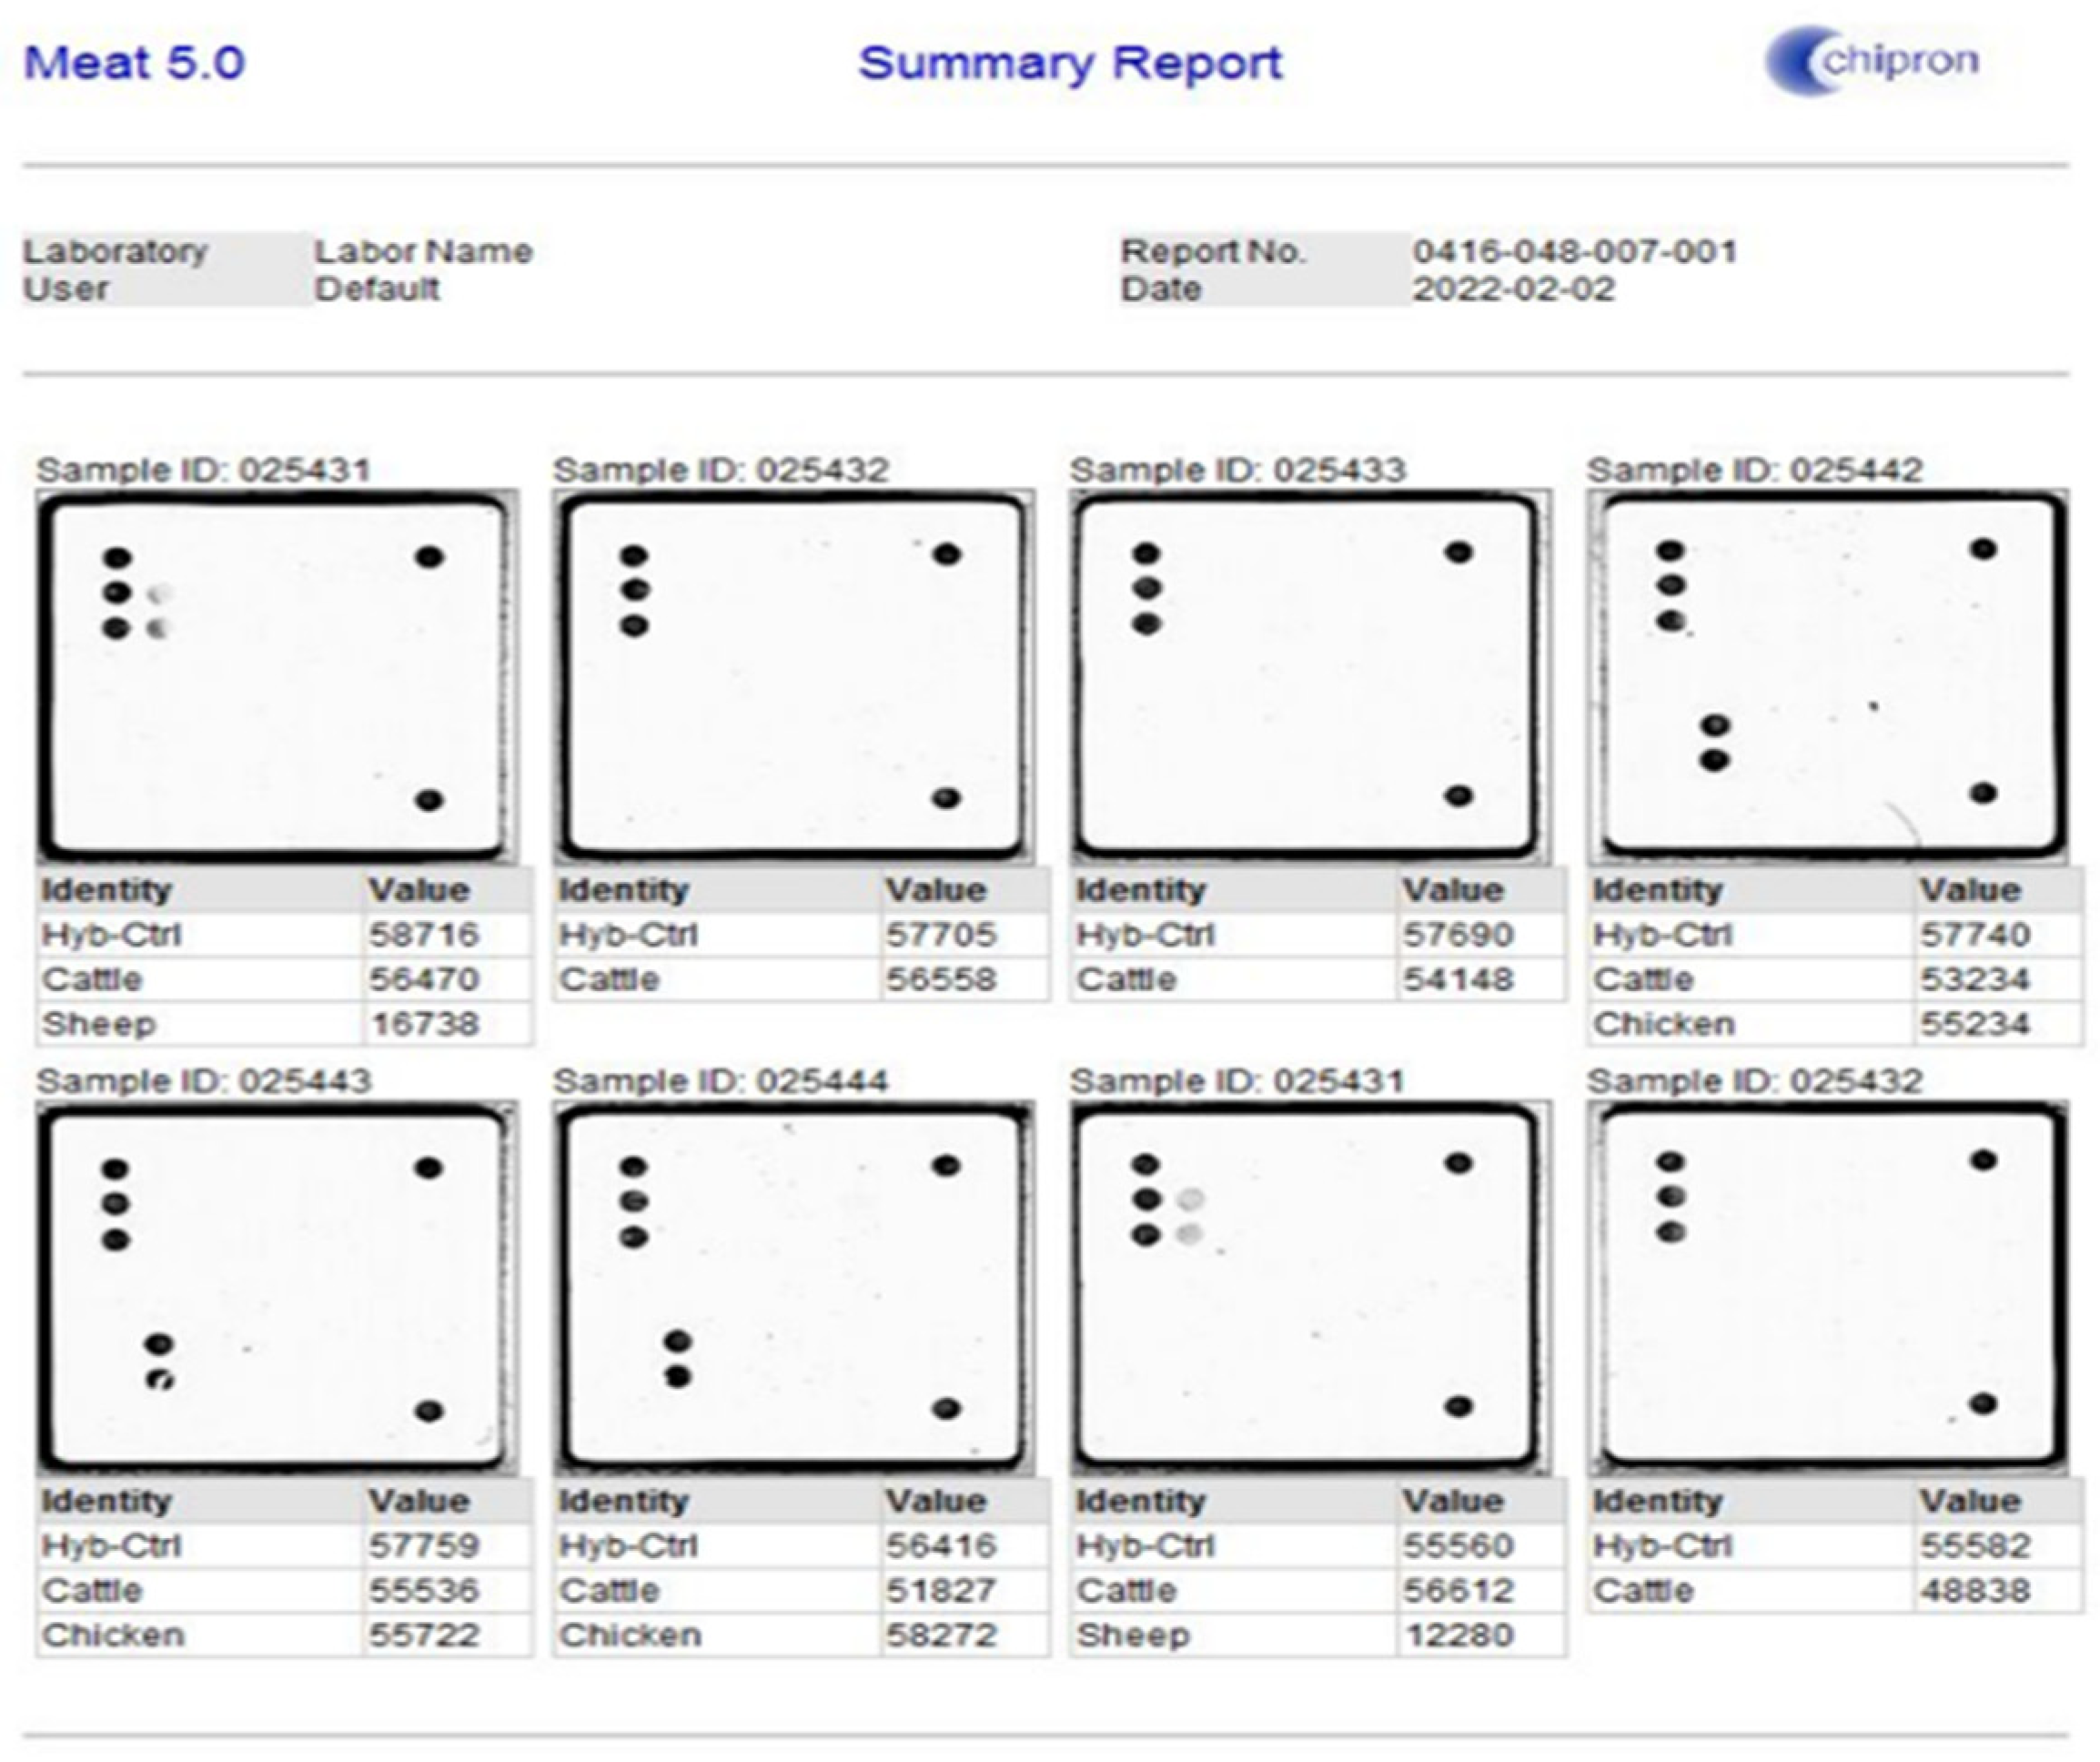
2.2. Chipron LCD Array Analysis System, Meat 5.0—A DNA-Based Identification of 24 Animal Species in Meat Products

The MEAT 5.0 LCD-Array Kit (Chipron, Berlin, Germany) is designed for food authenticity and quality assurance, offering high specificity and detection thresholds below 1%, even in processed samples (Fc-values > 24). The assay targets a 125–165 bp fragment of the mitochondrial 16S rRNA gene via single-tube PCR. Due to the high copy number of mitochondrial genomes, the method reliably detects as little as 0.5–1 nuclear genome equivalent per species, with detection sensitivity as low as 0.1% in multi-species mixtures (wet or dry weight).

2.2.1. Extraction of Sample

DNA was extracted using the DNeasy Mericon Food Kit (Qiagen®), based on a modified CTAB protocol. A 200 mg sample (in duplicate) was homogenized with one steel bead and 1 mL tissue lysis buffer using TissuLyser II (30 Hz, 30 s). After lysis with proteinase K (2.5 µL), samples were incubated at 60 °C for 30 min, cooled, and centrifuged (5 min, 2000× g). Supernatants (700 µL) were combined with 500 µL chloroform, vortexed, and centrifuged (15 min, 14,000× g). Aqueous phases (350 µL) were purified using QIAquick spin columns, washed with Buffer AW2, and eluted with 150 µL Buffer EB. All steps followed the manufacturer’s instructions, with standard precautions to prevent contamination (e.g., filter tips, gloves).

2.2.2. LCD-Array

Each MEAT 5.0 LCD-Array chip includes 25 species-specific probes in duplicate, allowing simultaneous detection of 17 mammalian and 7 avian species in food products. PCR was performed using the Topical Gradient 96 thermocycler (Biometra) with a 25 µL reaction mix containing 12.5 µL 2× Master Mix, 1.5 µL MEAT primer mix, 6 µL PCR-grade water, and 5 µL DNA. The thermal profile included initial denaturation (95 °C, 5 min), 35 cycles of denaturation (94 °C, 30 s), annealing (57 °C, 45 s), and extension (72 °C, 45 s), with a final extension at 72 °C for 2 min.
PCR products were verified via 2% agarose gel electrophoresis. Hybridization (35 °C, 30 min) was conducted per the manufacturer’s protocol. Labeled amplicons bound to immobilized probes and were visualized as precipitates using the PF3650u LCD-array scanner (Pacific Image Electronics) and analyzed with Slide Reader V12 software. Each reaction was performed in duplicate. A pixel intensity of 2000 was used as the detection threshold, as specified by the MEAT 5.0 Manual (v1-1-2014), shown in Figure 1.

2.3. Gas Chromatography–Flame Ionization Detector (GC/FID)

Analytical determination was achieved using the MIX FAME-s fatty acid standard.
The procedure is based on base-catalyzed transesterification of fatty acids, forming methyl esters (FAME-s), and modified from Haifeng Sun and Suli Zhao, 2014 [20]. The following chemicals were used: hexane 99.9% from Honeywell Riedel-de-Haën™ (Honeywell, Charlotte, NC, USA), methanol 99.9% CHROMASOLV™ from Honeywell Riedel-de-Haën™ (Honeywell, Charlotte, NC, USA), ethyl acetate 99.7% CHROMASOLV™ from Honeywell Riedel-de-Haën™ (Honeywell, Charlotte, NC, USA), and sodium methylate from Merk and Supelco® 37 Component FAME Mix Sigma-Aldrich®, Burlington, MA, USA, as a certified reference material (CRM) Extraction Procedure and Derivatization of Fatty Acids.
Samples were homogenized with a Velp Scientifica™ OV5 homogenizer (Usmate Velate (MB), Italy). After homogenization, 500 mg of the sample was placed into 15 mL conical tubes and mixed with 5 mL of hexane (99.9%). After vortexing for 1 min, 1 mL of sodium methoxide (5.4 M) in methanol was added and mixed for 1 min by vortexing. Esterification was performed at room temperature. After strong vortexing for 1 min and centrifuging for 5 min at 5000 rpm, the supernatant was transferred to a 2 mL glass vial, and 2 uL was injected into the GC/FID analysis. Samples were analyzed within an hour after esterification. The determination of FAMEs was conducted using an Agilent 8890 GC System, which features a split/splitless inlet and an FID detector, along with an Agilent 7693 automatic liquid sampler (ALS). The operational setup of GC-FID is shown in Table 1.
Otherwise, validation of the GC-FID method was carried out based on ICH guidance entitled “Text on Validation of Analytical Procedures (ICH Q2A)”, which presents a discussion of the characteristics that should be considered during the validation of analytical procedures. Its purpose is to provide some guidance and recommendations on how to consider the various validation characteristics for each analytical procedure [24].
The calibration curve of the GC-FID method for fatty acids was established by mixing beef ground meat with 2, 7, 10, 20, 30, 40, 50, 60, 70, 80, and 90% of chicken mechanically deboned meat (MDM). Eleven samples of traditional sausages from small family businesses tested negative for chicken matter using an LCD Array. Each MEAT 5.0 was used as a beef matrix for mixing with chicken MDM in different proportions for the validation of methods, as shown in Table 2.

2.4. Statistical Analysis

A one-way ANOVA test was used to assess differences in mean values among groups. The correlation between Ct values obtained from the LCD Array for different species’ DNA and the fatty acid content was determined using the correlation analysis tool in Analysis ToolPak (Microsoft Excel, 2016).

3. Results and Discussion

3.1. Detection of DNA of Species in Beef Sausages

After analyzing the samples for the detection of DNA and other species in local industrial and traditional sausage, it was found that 32 (47.05%) samples contained only beef DNA, 31 (45.55%) contained chicken DNA, 3 (4.41%) samples contained mutton, and 2 (2.9%) samples contained turkey DNA. None of the 68 samples contained the DNA of other mammalian species like horse, goat, camel, buffalo, pig, kangaroo, hare, rabbit, reindeer, roe deer, red deer, fallow deer, springbok, dog, or cat, or bird species like goose, ostrich, mallard duck, Muscovy duck, or pheasant (Table 3).
Regarding industrial sausages (n = 43), it turns out that 15 of them (34.8%) contained only beef DNA, while 28 (65.2%) contained DNA of other species. Of the 28 samples that contained other species DNA, chicken DNA was detected in 23 (82.14%). In comparison, mutton DNA was detected in three samples (10.71%) (two samples contained beef and one sample also contained chicken DNA), and two samples (7.14%) tested positive for turkey DNA (both samples in beef sausages which also contained chicken DNA). Regarding the homemade beef sausages (n = 25), it turns out that 17 (68%) contained beef DNA, while 8 (32%) contained DNA from other species. Of the eight samples, seven of them (87.5%) contained chicken DNA, while one sample (13.5%) contained mutton DNA.
Of all the beef sausage samples that tested positive for the presence of DNA from other species (n = 36), 28 of them belonged to industrial sausages, and of these, 15, or 41.66%, were declared, compared to 13 samples, or 46.42%, which were not declared. On the other hand, although 8 samples of traditional beef sausage tested positive for the presence of DNA from other species, none of those samples contained any detectable amount of those species.
The results of sausage analysis, using the Chipron LCD Array Analysis System, show that 36 out of 68 samples, or 52.94%, tested positive for the DNA of other species, indicating the potential intentional addition of meat from other species. The presence of poultry DNA (45.55%) is a reference to deliberate addition since, from an economic point of view, it is more profitable to add meat of cheaper species. When it comes to the presence of mutton DNA (4.41%), which has a higher price than beef itself, this does not surprise us since, in some parts of Kosovo, mutton meat is added to beef sausage to improve its sensory properties. The high presence of poultry DNA in beef sausage, for economic reasons, will be the ongoing focus of our work.
Compared to works by other authors, these values are somewhat lower than a study focusing on the substitution of meat species in Poland, which found that 60% of the foods analyzed contained an undeclared ingredient or the substitution of an expensive ingredient with a cheaper option [25], and that 17 (60%) of 28 beef sausages contained added poultry. Their results showed that 112 (78.3%) samples were mislabeled, attributed to the false declaration of species and/or presence of undeclared meat species [26]. On the other hand, our results are higher than those of other authors, such as beef sausages containing 33% chicken meat [27], where the results indicate that 15 (14.7%) of the total samples were found to contain undeclared species, with poultry meat detected in 7 (21.8%) and 2 (6.06%) of 32 salami and 33 sausage samples, respectively [28]. In another study, undeclared animal species were detected in 27% of the meat products tested [29].
The sampling strategy was designed to provide a preliminary overview of meat species usage and potential adulteration in sausages available in the Kosovar market. Although the sample size is relatively modest, it reflects the local availability and accessibility of sausage products. The higher proportion of industrial sausages in the sample (43 vs. 25) corresponds to their wider market presence and availability across the region rather than an intentional sampling bias.
We acknowledge that this imbalance, along with the limited geographic scope confined to Kosovo, may reduce the statistical power for generalizing findings to broader regional or global contexts. Additionally, the lower number of traditional sausages may under-represent the variability inherent in artisanal production practices. Therefore, the study should be interpreted as an exploratory assessment of local practices rather than a comprehensive evaluation of international meat adulteration trends. Future studies with larger and more geographically diverse samples are recommended to validate and expand upon these findings.
It is worth noting that the addition of meat from other species to industrial sausages was perhaps expected, but such findings in 32% of homemade sausages are somewhat of a surprise, considering that traditional recipes for homemade sausage-making in Kosovo consist of 100% beef only. Consumer acceptance is crucial, as the inclusion of other meat species in beef sausages, despite economic benefits, may face resistance without sensory studies on the impact of added poultry. In addition, traditional food authenticity is highly valued in Kosovo, making undisclosed additions potentially controversial.
The LCD Array has proven to be a reliable and sensitive method for detecting species’ DNA, with this study confirming its high accuracy in food testing. Other authors also found that PCR was associated with a commercial DNA macro-array on pure meat samples, spiked samples, proficiency test samples, and processed samples, and showed high specificity on the targeted species, with sensitivity down to 1% (w/w) [30]. In addition, the Meat 5.0 LCD-Array kit is highly specific and allows easy identification of animal species, is sufficiently sensitive, and provides repeatable results.These methods of analysis are recommended for comprehensively monitoring the presence of animal species in food samples, regardless of the degree of heat treatment or mechanical processing, as an effective tool for detecting food adulteration [31]. However, the high sensitivity of the LCD Array may result in the detection of trace DNA from cross-contamination sources, such as animal-derived casings, processing equipment, or environmental exposure. This introduces a limitation, as the assay cannot definitively differentiate between low-level incidental contamination and deliberate adulteration. Therefore, when species are detected at or near the threshold of detection, caution is warranted in interpreting the results, especially in the absence of quantitative DNA measurement.

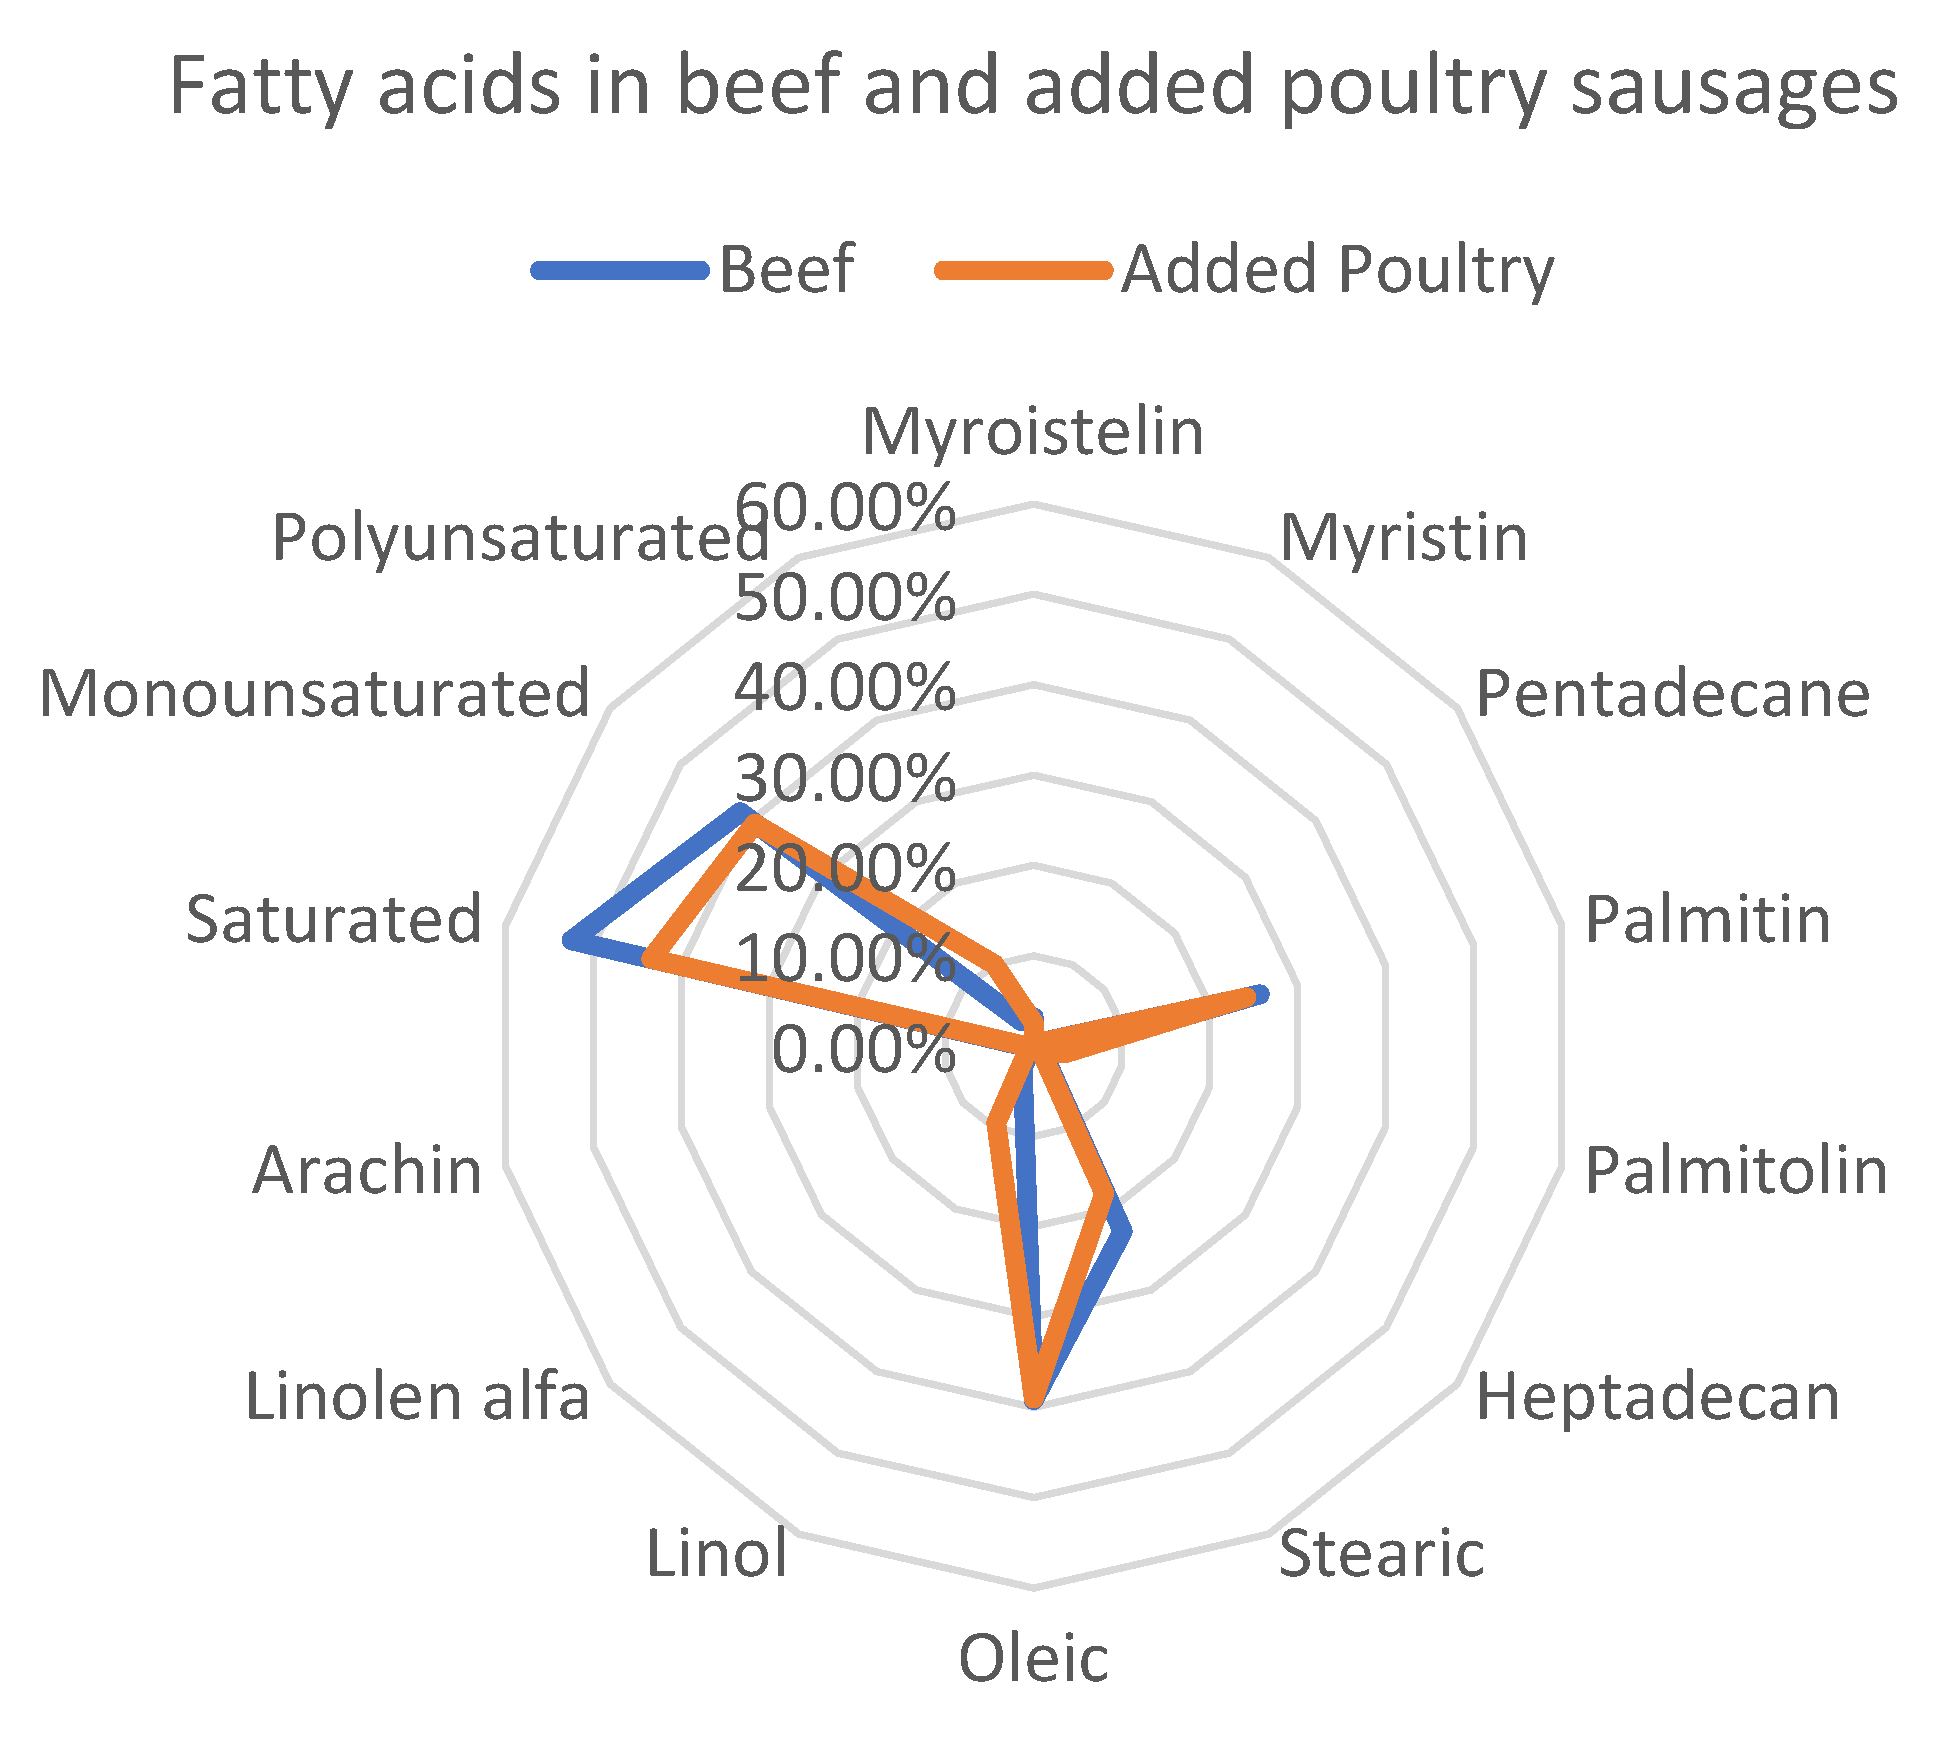
3.2. Prevalence of the Fatty Acid in Sausages Made with 100% Beef and Added Poultry Meat

From the literature and numerous papers, it is emphasized that the fatty acid profile is different in beef and poultry meat. Raising the hypothesis that the high % presence of poultry DNA cannot be just accidental cross-contamination, we took the next step to analyze the fatty acid profile through GC-FID analysis of the differences in the fatty acid profile of sausages containing 100% beef and sausages with the presence of poultry DNA and revealed several key findings (see Figure 2).
The provided radar chart compares the levels of various fatty acids between 100% beef sausages and sausages with added poultry meat. The results show that beef sausages have higher levels of saturated fatty acids compared to sausages with added poultry. This is typical as beef fat generally contains more saturated fats. Sausages with added poultry have higher levels of polyunsaturated fatty acids. This aligns with the leaner profile of poultry, which typically contains more unsaturated fats. Monounsaturated fats seem slightly higher in beef sausages compared to the poultry-added ones. Specific fatty acids like Myristin, Palmitin, and stearic acids (components of saturated fats) are more prevalent in beef sausages. Linolenic acid and other polyunsaturated fats (like oleic) are elevated in sausages with added poultry meat, a fact that is also supported by the works of other authors who emphasize that sausages with chicken meat had lower stearic (C18:0) and higher linoleic (C18:3) fatty acid contents than those made with beef [32]. Similar results emphasize that turkey and chicken sausages presented a higher content of polyunsaturated fatty acids than the Chester and common sausages, which presented a low saturated fatty acids content [33]. It is important to note that the fatty acid profile of sausages can be influenced not only by the animal fat content but also by the possible addition of unmeasured ingredients such as vegetable oil. In relation to raw beef sausage, frying with oil substantially increased the amount of MUFA, PUFA, n-6, and PUFA/SFA [34], and the substitution of animal fat with canola oil in sausage resulted in nutritional improvements due to an increase in mono- and polyunsaturated fatty acids in the lipid fraction that specifically decreased lipid oxidation [35]. In addition to vegetable oils, in our previous study, we demonstrated that the fatty acid composition of sausages is also influenced by the amount of added soy [36]. These components were not quantitatively assessed in this study and may act as confounding variables when interpreting differences in fatty acid composition between industrial and traditional sausages. Future research incorporating direct analysis of added fats would improve the accuracy of fatty acid profiling.
The above results verify the general differences in fatty acids in 100% beef and added poultry sausages. The results are also consistent with the research of other authors. However, we analyzed and verified through the ANOVA statistical program whether the differences expressed above between fatty acids are statistically significant (Table 4).
Fatty acids that showed statistically significant differences in levels between the two groups and were higher in sausages in 100% beef meat include C14:0 Myristolein, C15:0 Pentadecane, C16:0 Palmitin, C17:0 Heptadecan, C18:0 stearic, and saturated acids. On the other hand, fatty acids that showed statistically significant differences in levels between the two groups and were higher in sausages with added poultry meat include C18:2 Linoleic, C18:3 alfa-linolenic, and Polysaturated Acid. These differences highlight the compositional shifts caused by adding poultry meat, particularly in increasing the levels of polyunsaturated fatty acids while decreasing saturated fatty acids. Fatty acids that did not show statistically significant differences include C14:1 Myristin, C16:1 Palmitolin, C18:1 oleic, C20:0 Arachin, and monounsaturated acids. This indicates that the inclusion of poultry meat has a minimal impact on these specific fatty acids, suggesting a level of consistency in these profiles regardless of the meat source.
As a summary of the above results, we can emphasize that the inclusion of poultry meat in beef sausages results in significant compositional shifts, particularly reducing saturated fatty acids and increasing polyunsaturated fatty acids, which may improve the nutritional profile of the sausages. However, some fatty acid levels (e.g., C14:1 Myristin, C18:1 oleic, and monounsaturated acids) remain stable across formulations, suggesting that these components are less sensitive to the addition of poultry meat.

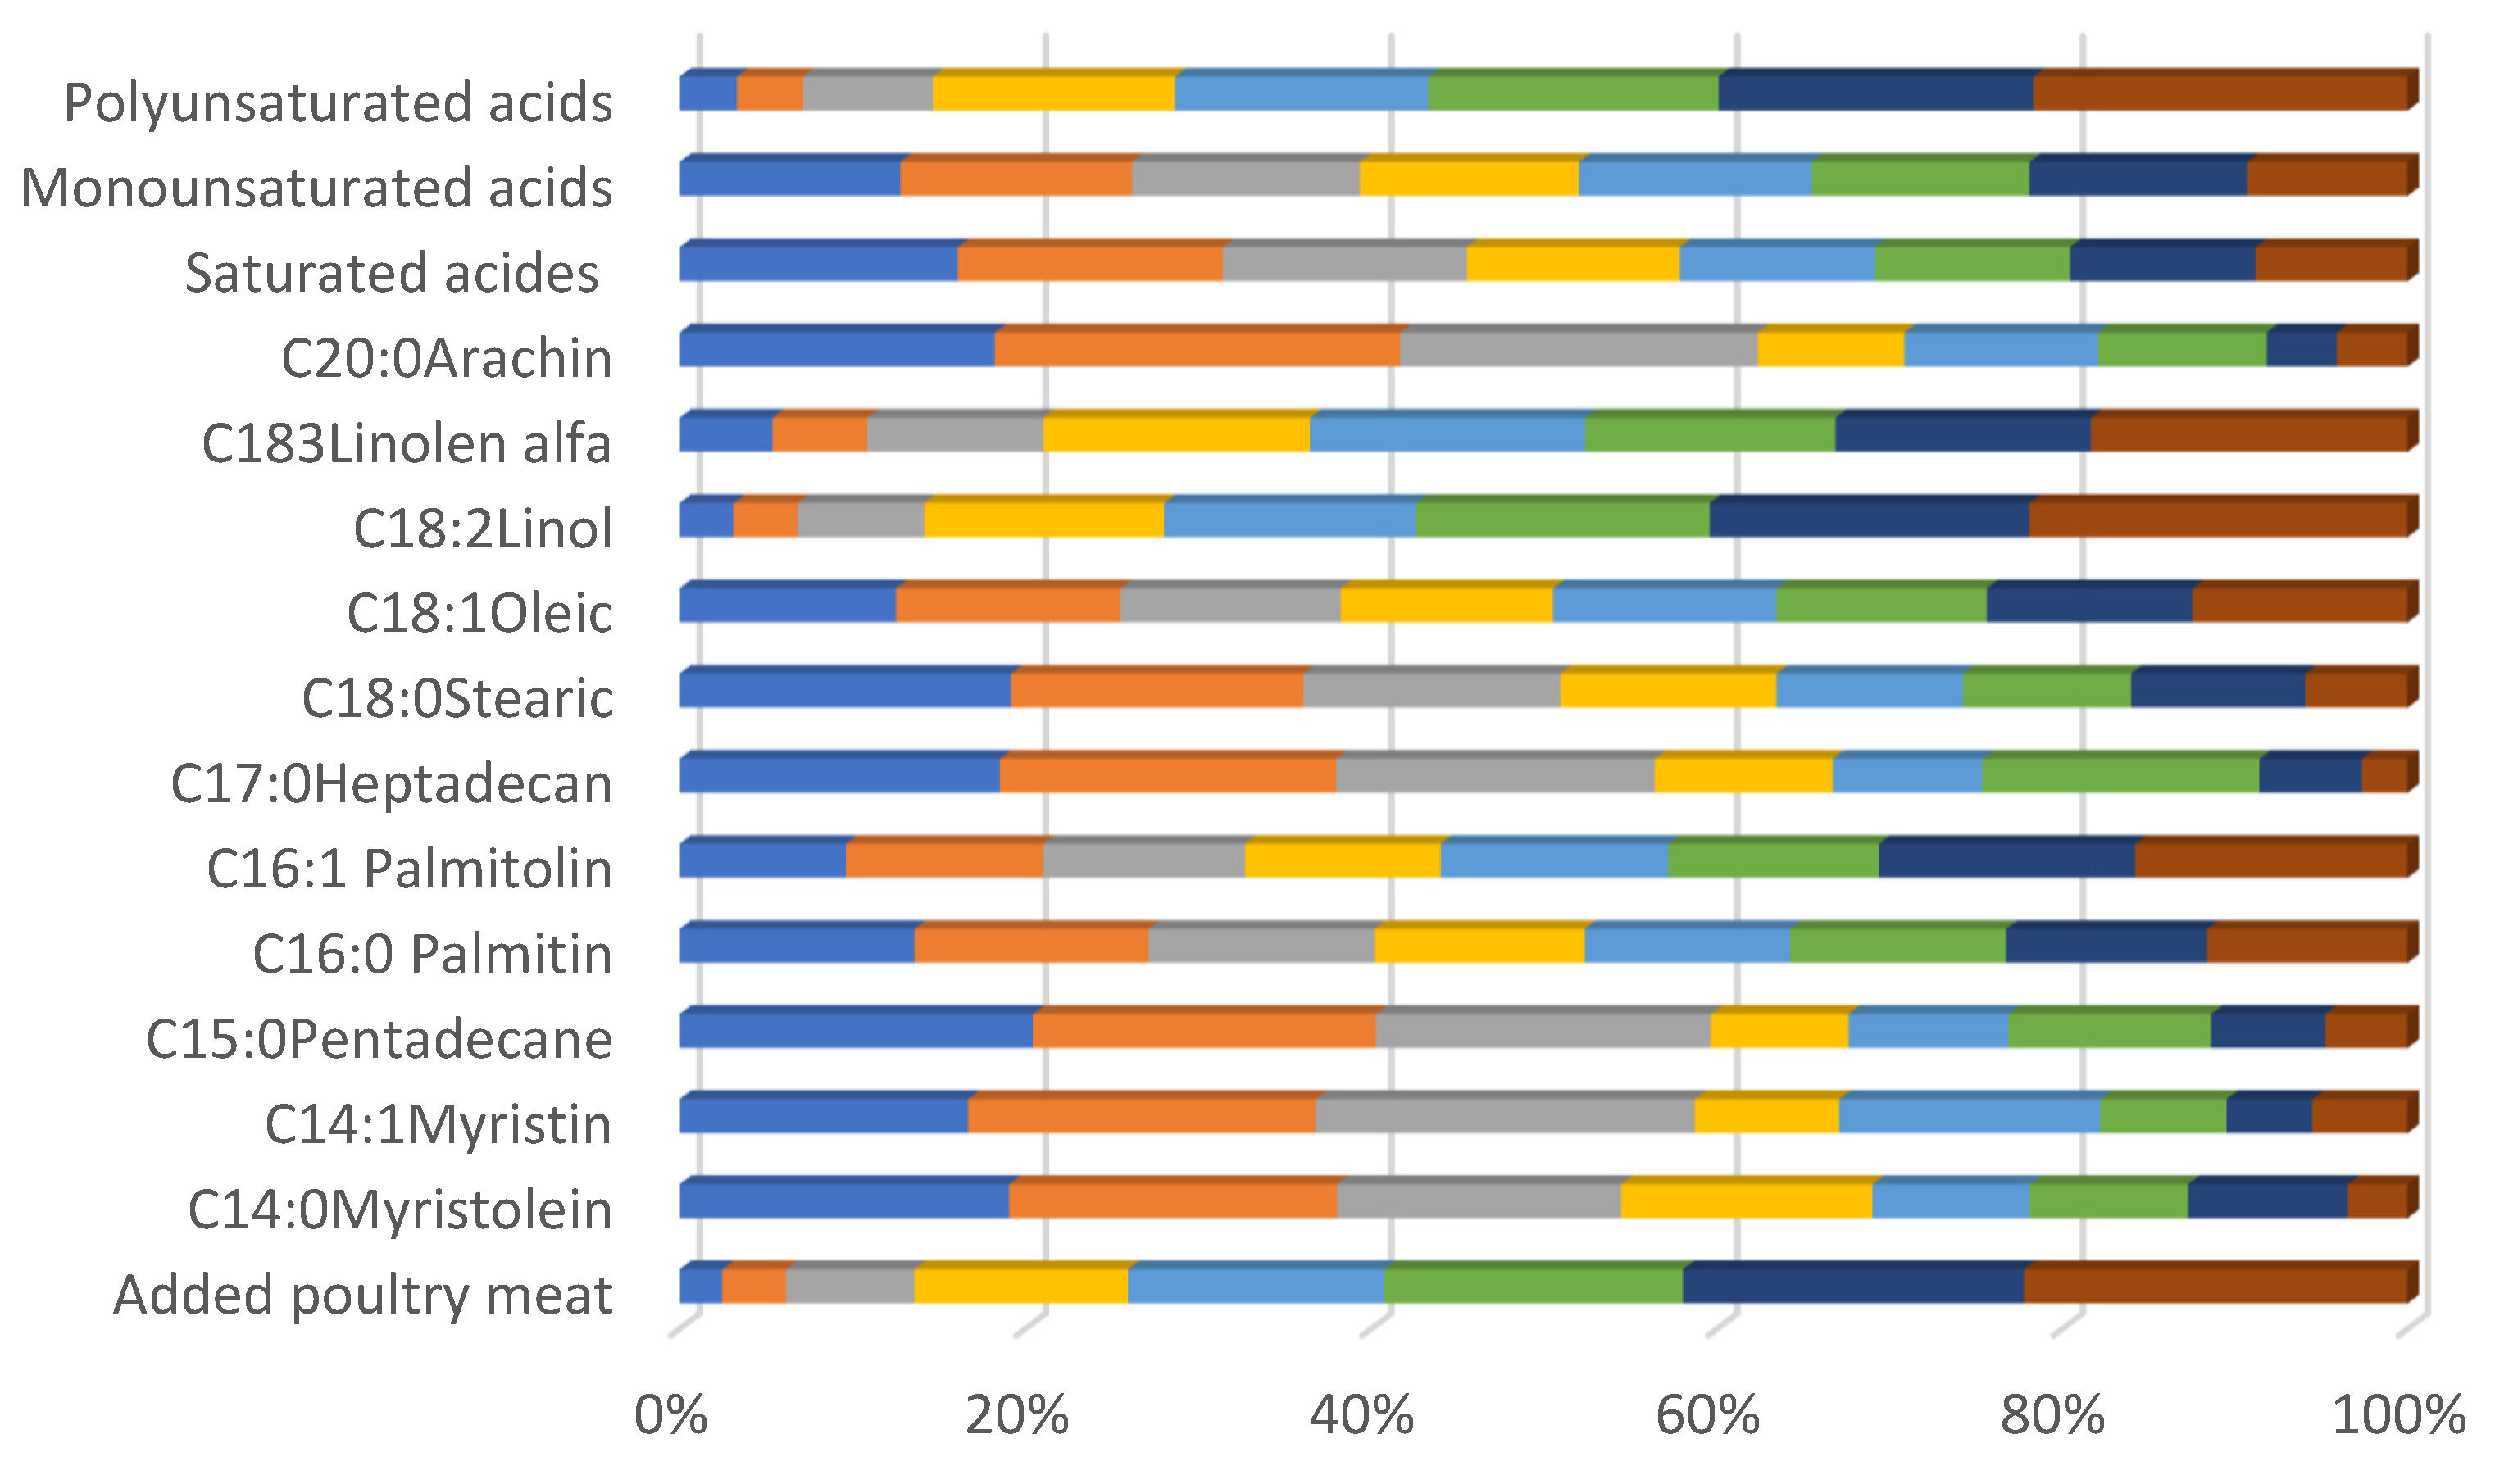
3.3. The Fatty Acid Profile Depends on the % of Chicken Meat Addition

By observing the fatty acid profile and statistically significant variations in some specific fatty acids, we performed an analysis for the detection of the amount of poultry meat in 33 samples of beef sausage. This resulted in detecting the presence of poultry DNA (31 chicken and 2 turkey) through the GC-FID validation method, allowing us to observe the impact of the increased amount of poultry meat on the values and profile of fatty acids. Based on the GC-FID validation method, the results from the 33 samples analyzed show that 8 samples (24.24%) had poultry meat added to the amount of 10%, 10 samples (30.30%) to the amount of about 20%, 5 samples (15.15%) to the amount of 30%, 1 sample (3.03%) to the amount of 50%, 2 samples (6.06%) to the amount of 60%, 2 samples (6.06%) to the amount of 60%, 2 samples (6.06%) to the amount of 70%, 2 samples (6.06%) to the amount of 60%, 2 samples (6.06%) to the amount of 80%, and 3 samples (9.09%) to the amount of 90%. Using the GC-FID validation method, we found that about 70% of the analyzed samples had up to 30% poultry meat added to the beef sausage, while the other 30% of the samples had additions of 50–90%.
Comparing the % of poultry addition in industrial and traditional beef sausage results, out of a total of 33 samples of sausages with added poultry meat, 25 samples (75.7%) belong to industrial sausages, and 8 samples (24.4%) belong to traditional sausages. Of the samples of sausages with the presence of poultry meat of 10%, it turns out that five of them are industrial and five of them are traditional. Of the sausages with the addition of 10–20% chicken meat, six belonged to industrial sausages while three belonged to traditional sausages. The sausages with more than 20% of added poultry meat belong only to industrial sausages, including five samples with 30%, one sample with 50%, two samples with 60%, 70%, and 80%, and three samples with 90%. From the above results, it is observed that industrial sausages, in addition to having a higher frequency of added poultry meat (75.7%), also have amounts of added meat reaching up to 90%. While traditional sausages have a lower frequency of added poultry (24.4%), at the same time they include smaller amounts of poultry meat, not exceeding 20%.
Although it is evident that, based on the average fatty acids, in sausages with added chicken meat, the values of saturated fatty acids decrease and the values of unsaturated and semi-saturated fatty acids increase. However, we have analyzed the profile of these fluctuations according to the added amount in % of chicken meat in beef sausage (Table 5).
From the results, we can notice a clear decrease in the total percentage of saturated fatty acids as the percentage of added poultry meat increases. For instance, it drops from 54.15% at 10% poultry meat to 29.55% at 90% poultry meat. Specifically, components like C16:0 Palmitin and C18:0 stearic acid show significant reductions, reflecting that poultry meat has fewer saturated fats than other sausage mixture components. Monounsaturated acids remain relatively stable between 10% and 70% of added poultry meat, ranging between 41 and 44%. However, there is a notable drop to 30.36% when the poultry meat content reaches 90%. C18:1 oleic acid is the most prominent MUFA and shows a slight fluctuation but no dramatic trend until the 90% level. Meanwhile, polyunsaturated fatty acids increase substantially as the percentage of added poultry meat rises. At 10% poultry meat, PUFAs are at 3.98%, while at 90%, they increase to 26.64%.
The most significant contributor is C18:2 linoleic acid, which grows consistently from 3.50% at 10% to 25.04% at 90%. This indicates poultry meat’s high content of essential fatty acids. Focusing on individual fatty acid trends, it is noted that C16:1 Palmitolin and C18:2 linoleic acid increase with higher poultry meat content, suggesting poultry meat is richer in these unsaturated fatty acids. C18:0 stearic acid and C16:0 Palmitin, as major SFAs, decline, emphasizing the lower saturated fat profile of poultry meat compared to other fats used in the sausages.
A horizontal 100% stacked bar chart illustrating the averages of various fatty acids depending on the percentages of added meat and poultry in beef sausage (Figure 3). A visible trend suggests that samples with higher percentages of added poultry meat show noticeable variation in the composition of fatty acids. Saturated fatty acids (SFAs) such as Palmitic (C16:0) and stearic (C18:0) acids tend to remain consistently high across all samples but show slight increases in formulations with a lower percentage of added meat. Monounsaturated fatty acids (MUFAs), including oleic acid (C18:1), appear more prevalent in samples with moderate added meat content, indicating a potential optimization point for healthier fat profiles. Polyunsaturated fatty acids (PUFAs) such as Linolenic (C18:3) and linoleic (C18:2) acids increase in samples with higher added meat percentages, which may be attributed to a higher proportion of poultry meat, known for its richer PUFA content. Added Meat/Poultry % increases in the lower section of the bars, correlating inversely with certain saturated fatty acid components. Overall, the graph suggests that increasing the percentage of added poultry or meat significantly influences the fatty acid composition of the final sausage product. Higher poultry content appears to be associated with a more favorable fatty acid profile (i.e., higher PUFA and lower SFA levels), which could have positive nutritional implications.
Based on the results of this study, it is argued that there is a difference in the fatty acid composition of beef meat and fat compared to poultry meat and fat. Undoubtedly, this difference in fatty acid composition is also reflected in meat products, such as sausages. The fatty acid content of beef is also argued by other authors who report that meat fat comprises mostly monounsaturated and saturated fatty acids, with oleic (C18:1), palmitic (C16:0), and stearic acid (C18:0) being the most ubiquitous [37], and that beef sausage has the dominant fatty acids of palmitic acid (42.31%), oleic acid (20.19%), stearic acid (10.92%), and myristic acid (7.66%) [38]. Regarding poultry meat, it is reported that fat in broiler breast contained 29% saturated FAs (SFAs), 36% monosaturated FAs (MFAs), and 35% polyunsaturated FAs (PUFAs). Meanwhile, legs and thigh meat had 28% SFAs, 38% MFAs, and 33% PUFAs [39]. In addition, poultry products showed a high content of linoleic (19.54%) and low content of stearic (8.22%) acids [40].
This study highlights the technical, nutritional, cultural, and economic impacts of adding poultry to beef sausages in Kosovo. While cost-effective, unclear labeling and deviations from traditional recipes may hinder consumer acceptance, as unfamiliarity can lead to negative perceptions.

4. Conclusions

This study identified a high incidence of meat adulteration in beef sausages, with 52.94% of samples containing undeclared meat, most commonly poultry. Adulteration was more frequent in industrial products (65.2%) but was also present in homemade sausages (32%), despite expectations of traditional authenticity. The addition of poultry improved the fatty acid profile by reducing saturated fats and increasing polyunsaturated fats, particularly linoleic (C18:2) and alpha-linolenic acid (C18:3).
However, undeclared meat, especially in 46.42% of industrial and 100% of mixed homemade sausages, raises regulatory, ethical, and religious concerns. Such mislabeling may mislead consumers and violate dietary laws, especially for those with religious restrictions.
Although adding chicken meat to beef sausage should be declared, it increases healthier fatty acids. Further research should examine the economic drivers, sensory implications, and consumer acceptance, while improved labeling and monitoring are essential to ensure transparency and consumer protection.

Author Contributions

Conceptualization, X.B. and D.M.; methodology, D.M. and A.C.; formal analysis, D.M., V.G.-Z. and M.S.-Z.; investigation, D.M. and A.C.; writing—original draft preparation, D.M. and X.B.; review and editing, D.B., X.B. and Z.H.-M.; supervision, D.J. All authors have read and agreed to the published version of the manuscript.

Funding

This research received no external funding.

Institutional Review Board Statement

Not applicable.

Informed Consent Statement

Not applicable.

Data Availability Statement

The data presented in this study are available in the article.

Acknowledgments

The authors would like to thank the staff of the chemistry and molecular biology laboratory of the Kosovo Food and Veterinary Laboratory.

Conflicts of Interest

The authors declare no conflicts of interest.

References

  1. Kavanaugh, M.; Rodgers, D.; Rodriguez, N.; Leroy, F. Considering the nutritional benefits and health implications of red meat in the era of meatless initiatives. Front. Nutr. 2025, 12, 1525011. [Google Scholar] [CrossRef] [PubMed]
  2. Ajomiwe, N.; Boland, M.; Phongthai, S.; Bagiyal, M.; Singh, J.; Kaur, L. Protein Nutrition: Understanding Structure, Digestibility, and Bioavailability for Optimal Health. Foods 2024, 13, 1771. [Google Scholar] [CrossRef] [PubMed]
  3. Carballo, J. Sausages Nutrition, Safety, Processing and Quality Improvement. Foods 2021, 10, 890. [Google Scholar] [CrossRef] [PubMed]
  4. Akpan, I.P. Trends in Sausage Production. Afr. J. Food Sci. Technol. 2017, 8, 5. [Google Scholar]
  5. Dooley, J.; Paine, K.; Garrett, S.; Brown, H. Detection of meat species using TaqMan real-time PCR assays. Meat Sci. 2024, 68, 431–438. [Google Scholar] [CrossRef]
  6. Özlü, H.; Çevik, B.; Atasever, M.; Sarıalioğlu, M. Investigation of meat species adulteration in beef-based meat products via real-time PCR in Türkiye. Qual. Assur. Saf. Crops Foods 2023, 15, 42–48. [Google Scholar] [CrossRef]
  7. Amaral, J.S.; Soares, S.; Mafra, I.; Oliveira, B. Assessing the variability of the fatty acid profile and cholesterol content of meat sausages. Riv. Ital. Delle Sostanze Grasse 2014, 91, 261–272. [Google Scholar]
  8. Berisha, K.; Gashi, A.; Mednyánszky, Z.; Bytyqi, H.; Sarkadi, S. Nutritional characterization of homemade beef sausage based on amino acid, biogenic amines, and fatty acid composition. Acta Aliment. 2023, 52, 439–448. [Google Scholar] [CrossRef]
  9. Almeida, C.; Perassolo, M.; Camargo, J.; Bragagnolo, N.; Gross, J. Fatty acid composition and cholesterol content of beef and chicken meat in Southern Brazil. Rev. Bras. Cienc. Farm. 2006, 42, 109–117. [Google Scholar] [CrossRef]
  10. Belichovska, D.; Pejkovski, Z.; Silovska-Nikolova, A.; Belichovski, K. Chemical and fatty acid composition of poultry meat and pork fatback as a raw material for the production of frankfurters. J. Anim. Sci. 2020, 10, 23–28. [Google Scholar] [CrossRef]
  11. Hassoun, A.; Måge, I.; Schmidt, W.; Temiz, H.; Li, L.; Kim, H.Y.; Nilsen, H.; Biancolillo, A.; Aït-Kaddour, A.; Sikorski, M.; et al. Fraud in Animal Origin Food Products: Advances in Emerging Spectroscopic Detection Methods over the past Five Years. Foods 2020, 9, 1069. [Google Scholar] [CrossRef] [PubMed]
  12. Momtaz, M.; Bubli, S.; Khan, M. Mechanisms and Health Aspects of Food Adulteration: A Comprehensive Review. Foods 2023, 12, 199. [Google Scholar] [CrossRef] [PubMed]
  13. Vatin, G.; Théolier, J.; Dominguez, S.; Godefroy, S. Quantification of beef in products sold in Canada declaring multiple meat species—Regulatory and consumer implications related to accurate labeling. Food Humanit. 2024, 3, 100375. [Google Scholar] [CrossRef]
  14. Adams, R. Food Safety Regulations and Consumer Confidence. Int. J. Livest. Policy 2024, 2, 15–25. [Google Scholar] [CrossRef]
  15. Tonkin, E.; Wilson, A.; Coveney, J.; Webb, T. Trust in and through labelling—A systematic review and critique. Br. Food J. 2015, 117, 318–338. [Google Scholar] [CrossRef]
  16. Regulation No. 09/2013 on Labelling, Presentation and Advertising and Food Products; Ministry of Trade and Industry, Government: Prishtina, Republic of Korea, 2013.
  17. European Union. Regulation (EU) No 1169/2011 of the European Parliament and of the Council of 25 October 2011 on the Provision of Food Information to Consumers. Official Journal of the European Union, L 304, 22. 2011, 18–63. Available online: https://eur-lex.europa.eu/legal-content/EN/TXT/?uri=CELEX%3A32011R1169 (accessed on 30 March 2025).
  18. Du, J.; Gan, M.; Xie, Z.; Li, C.; Wang, M.; Dai, H.; Huang, Z.; Chen, L.; Zhao, Y.; Niu, L. Corrigendum to “Current progress on meat food authenticity detection methods” [Food Control 152 (2023) 109842]. Food Control 2024, 155, 110055. [Google Scholar] [CrossRef]
  19. Kumar, A.; Kumar, R.R.; Sharma, B.D.; Gokulakrishnan, P.; Mendiratta, S.K.; Sharma, D. Identification of species origin of meat and meat products on the DNA basis: A review. Crit. Rev. Food Sci. Nutr. 2015, 55, 1340–1351. [Google Scholar] [CrossRef]
  20. Jonker, K.J.; Tilburg, J.I.H.C.; Hagele, G.H.H.; de Boer, E. Species identification in meat products using real-time PCR. Food Addit. Contam. Part A Chem. Anal. Control Expo Risk Assess. 2008, 25, 527–533. [Google Scholar] [CrossRef]
  21. Rojas, M.; González, I.; Pavón, M.G.; Pegels, N.; Lago, A.; Hernández, P.E.; García, T.; Martín, R. Novel TaqMan real-time polymerase chain reaction assay for verifying the authenticity of meat and commercial meat products from game birds. Food Addit. Contam. Part A Chem. Anal. Control Expo Risk Assess. 2010, 27, 749–763. [Google Scholar] [CrossRef]
  22. Hossain, A.; Hossain, M.S.; Munshi, M.K.; Huque, R. Detection of species adulteration in meat products and Mozzarella-type cheeses using duplex PCR of mitochondrial cyt b gene: A food safety concern in Bangladesh. Food Chem. Mol. Sci. 2021, 2, 100017. [Google Scholar]
  23. Asensio, L.; González, I.; Pavón, M.A.; García, T.; Martín, R. An indirect ELISA and a PCR technique for the detection of Grouper (Epinephelus marginatus) mislabeling. Food Addit. Contam. Part A Chem. Anal. Control Expo Risk Assess. 2008, 25, 677–683. [Google Scholar] [CrossRef]
  24. U.S. Department of Health and Human Services, Food and Drug Administration; Center for Drug Evaluation and Research (CDER); Center for Biologics Evaluation and Research (CBER). Guidance for Industry, Q2B Validation of Analytical Procedures: Methodology; ICH: Rockville, MD, USA, 1996. [Google Scholar]
  25. Szyłak, A.; Kostrzewa, W.; Bania, J.; Tabiś, A. Do You Know What You Eat? Kebab Adulteration in Poland. Foods 2023, 12, 3380. [Google Scholar] [CrossRef] [PubMed]
  26. Chuah, L.O.; He, B.X.; Effarizah, M.S.; Syahariza, Z.A.; Shamila-Syuhada, K.; Rusul, G. Mislabelling of beef and poultry products sold in Malaysia. Food Control 2016, 62, 157–164. [Google Scholar] [CrossRef]
  27. Tembe, D.; Mukaratirwa, S.; Zishiri, O. Undeclared Meat Species in Processed Meat Products from Retail Franchises in the Durban Metropole, KwaZulu-Natal Province, South Africa, Using Species-specific DNA Primers. Food Prot. Trends 2018, 38, 440–449. [Google Scholar]
  28. Keyvan, E.; Çil, G.I.; Kul, B.Ç.; Bilgen, N.; Şireli, U.Ş. Identification of meat species in different types of meat products by PCR. Ank. Üniv. Vet. Fak. Derg. 2017, 64, 261–266. [Google Scholar]
  29. Sreenivasan, S.; Viljoen, C.D. Determining the presence of undeclared animal species using Real-time PCR in canned and ready-to-eat meat products in South Africa. J. Food Sci. Technol. 2020, 58, 2699–2704. [Google Scholar] [CrossRef]
  30. Beltramo, C.; Riina, M.V.; Colussi, S.; Campia, V.; Maniaci, M.G.; Biolatti, C.; Trisorio, S.; Modesto, P.; Peletto, S.; Acutis, P.L. Validation of a DNA biochip for species identification in food forensic science. Food Control 2017, 78, 366–373. [Google Scholar] [CrossRef]
  31. Golian, J.; Drdolová, Z.; Martišová, P.; Semjon, B.; Benešová, L. Molecular diagnostic test systems for meat identification: A comparison study of the MEAT 5.0 LCD-Array and innuDETECT Assay detection methods. Acta Vet. Brno 2020, 89, 89–96. [Google Scholar] [CrossRef]
  32. Simsek, Y.O.; Isıklı, M. Fatty acid composition and quality characteristics of low-fat cooked sausages made with beef and chicken meat, tomato juice, and sunflower oil. Meat Sci. 2002, 62, 253–258. [Google Scholar]
  33. Pereira, N.R.; Tarley, C.; Matsushita, M.; de Souza, N. Proximate Composition and Fatty Acid Profile in Brazilian Poultry Sausages. J. Food Compos. Anal. 2000, 13, 915–920. [Google Scholar] [CrossRef]
  34. Alao, B.O.; Falowo, A.B.; Aladejana, E.B. Effect of Cooking Oil on the Fatty Acid Profile of Beef Sausage Fortified with Edible Deboned Meat Waste. Int. J. Food Sci. 2021, 2021, 5592554. [Google Scholar] [CrossRef] [PubMed]
  35. Lacerda, L.A.; de Souza, X.R.; dos Santos Garcia, V.A.; Rodrigues, E.C.; Faria, P.B.; de Faria, R.A.P.G. Quality and fatty acid profile of chicken sausage added canola oil as partial replacement for animal fat. Braz. J. Dev. 2022, 8, 26161–26181. [Google Scholar] [CrossRef]
  36. Mehmetukaj, D.; Bytyçi, X.; Cana, A.; Gashi-Zogejani, V.; Shandro-Zeqiri, M.; Bajraktari, D.; Jankuloski, D.; Hajrulai-Musliu, Z. Presence of Soya in Industrial and Homemade Sausage Production in Kosovo and Its Reflection on Fatty Acid Profile. Separations 2024, 11, 457. [Google Scholar] [CrossRef]
  37. Valsta, L.M.; Tapanainen, H.; Männistö, S. Meat fats in nutrition. Meat Sci. 2005, 70, 525–530. [Google Scholar] [CrossRef] [PubMed]
  38. Guntarti, A.; Ahda, M.; Kusbandari, A. Determining fatty acids and halal authentication of sausage. Food Res. 2020, 4, 495–499. [Google Scholar] [CrossRef]
  39. Morales-Barrera, J.E.; Gonzalez-Alcorta, M.J.; Castillo-Dominguez, R.M.; Prado-Rebolledo, O.F.; Hernandez-Velasco, X.; Anita Menconi, A.; Tellez, G.; Hargis, B.M.; Carrillo-Dominguez, S. Fatty Acid Deposition on Broiler Meat in Chickens Supplemented with Tuna Oil. Food Nutr. Sci. 2013, 4, 16–20. [Google Scholar] [CrossRef]
  40. Araujo de Vizcarrondo, C.; Carrillo de Padilla, F.; Martín, E. Fatty acid composition of beef, pork, and poultry fresh cuts, and some of their processed products. Agricultural and Food Sciences. Arch. Latinoam. Nutr. 1998, 48, 354–358. [Google Scholar]
Figure 1. LCD chip during analysis with LCD Array.
Applsci 15 04440 g001
Figure 2. The comparison of the levels of fatty acids in 100% beef and added poultry meat.
Applsci 15 04440 g002
Figure 3. Averages of fatty acids depended on different % of added poultry meat.
Applsci 15 04440 g003
Table 1. The operational setup of GC-FID (GC System 8890 GC).
GC System8890 GC
S/SL inlet 250 °C, split ration 50:1
Liner Split, ultra inert, glass wool, low-pressure drops (p/n 5190-295)
Oven ramp program50 °C (0.5 min)
30 °C/min to 194 °C (3.5 min)
5 °C/min to 240 °C (3 min)
Carrier gas Nitrogen, 13 psi, constant pressure mode
Column DB-Fast FAME 30 m × 0.250 mm × 0.25 µm 40 °C to 250/260 °C
Detector-fid260 °C,
H2: 40 mL/min
Air: 400 mL/min
Makeup gas: 25 mL/min
Injection volume 1 µL
Table 2. Fatty acids profile (C *) in different proportions of beef and poultry for validation of GC-FID method.
Chicken Meat (%) Beef Sausage (%) C14:0C14:1C15:0C16:0 C16:1 C17:0C18:0C18:1C18:2C18:3C20:0SFAMUFA PUFA Total
10000.080.330.0618.283.440.136.5729.1837.594.280.0525.1732.9541.8799.99
01003.580.440.5529.052.981.8824.8433.342.760.350.1460.0436.763.1199.91
9910.460.160.0819.43.370.178.3129.3735.333.290.0628.4832.938.62100
90100.660.170.1120.23.320.299.8416.532.183.140.0731.1719.9935.3286.48
80201.230.270.1922.233.020.5814.1831.2624.642.290.0838.4934.5526.9399.97
70301.570.320.2623.912.960.8515.4631.8520.722.040.0442.0935.1322.7699.98
60402.050.430.3125.33.030.9517.532.1216.661.59046.1135.5818.2599.94
50502.120.420.3225.732.931.0919.3932.4614.031.330.148.7535.8115.3699.92
40602.280.430.3426.433.061.1118.3732.7613.841.37048.5336.2515.2199.99
30702.840.550.4428.352.851.4121.6533.247.7700.0754.7636.647.7799.17
20802.770.370.4428.852.791.622.7834.255.50.560.0756.5137.416.0699.98
10903.220.610.4928.642.811.5824.2434.273.530.370.1258.2937.693.999.88
7933.040.270.4629.552.681.5923.8534.93.110.320.1158.637.853.4399.88
2983.570.660.5631.062.91.8723.733.152.050.270.1160.8736.712.3299.9
* C14:0 Myristolein, C14:1 Myristin, C15:0 Pentadecane, C16:0 Palmitin, C16:1 Palmitolin, C17:0 Heptadecan, C18:0 stearic, C18:1 oleic, C18:2 Linol, C18:3 Linolen alfa, C20:0 Arachin, SFA- Saturated fatty acids, MUFA- Monounsaturated fatty acids, PUFA-polyunsaturated fatty acids.
Table 3. DNA detection and declaration status in declared beef sausage samples (n = 68).
CategoryIndustrial Traditional Total
n%n%n%
Sample distribution4363.23%2536.76%68100%
Samples with only beef DNA1534.88%1768.00%3247.05%
Samples with DNA of other species2865.12%832.00%3652.94%
Containing chicken DNA2382.14% *787.50% *3145.55%
Containing mutton DNA310.71% *112.50% *34.41%
Containing turkey DNA27.14% *00.00%22.94%
Containing DNA of other species **00.00%00.00%00.00%
Declared the added species meat1541.60%0100.00%1541.46%
Did not declare the added species meat1346.42%8100.00%2158.33%
* Percentages in rows for chicken, mutton, and turkey DNA are calculated within the subgroup of samples with other species DNA; ** No DNA from other mammalian (e.g., pig, horse, goat) or bird species (e.g., duck, goose, pheasant) was detected in any sample.
Table 4. Statistical differences in fatty acids (%) in beef and added poultry sausages.
Fatty AcidsBeef SausageBeef Sausage with Poultry DNAp-Value
Myroistelin3.17 ± 12.282.56 ± 35.820.000893 *
Myristin0.39 ± 58.870.30 ± 87.460.156974
Pentadecane0.57 ± 24.950.43 ± 42.260.000555 *
Palmitin25.66 ± 5.4524.14 ± 7.330.000238
Palmitolin3.17 ± 26.053.55 ± 23.260.066677
Heptadecan1.34 ± 17.901.09 ± 38.450.003113 *
Stearic22.76 ± 16.7318.11 ± 32.460.000305 *
Oleic39.18 ± 9.7939.00 ± 7.240.828574
Linol2.72 ± 23.969.46 ± 80.193.28 × 10−6 *
Linolen alfa0.41 ± 43.260.81 ± 56.591.15 × 10−5 *
Arachin0.58 ± 35.280.51 ± 59.360.250436
Saturated54.12 ± 7.5346.59 ± 18.580.002973 *
Monosaturated42.75 ± 10.3841.70 ± 17.430.425882
Polyunsaturated3.13 ± 25.2610.27 ± 77.807.64 × 10−6 *
* Statistically significant differences.
Table 5. Profile of fatty acids in different % of added poultry meat in beef sausage.
Added Meat Poultry %Samples (No)C14:0C14:1C15:0C16:0C16:1C17:0C18:0C18:1C18:2C18:3C20:0SFAMUFAPUFA
12.950.210.4323.771.941.2428.6336.733.290.340.4757.4938.883.63
22.910.810.4724.973.321.082438.33.10.390.6754.1042.433.49
33.350.410.7126.562.371.5228.2531.753.940.610.5360.9234.534.55
10%43.080.240.5926.143.31.2621.6539.293.470.480.5153.2342.833.95
53.960.230.727.683.461.4121.2137.423.130.350.4355.3941.113.48
63.170.320.5824.42.691.3822.62403.60.570.6752.8243.014.17
73.020.280.4924.192.951.2422.6540.013.730.710.7352.3243.244.44
82.720.240.524.273.671.2617.5844.993.740.390.6346.9648.94.13
MEAN ±
SD *
3.15 ± 11.250.34 ± 54.500.56 ± 17.5525.25 ± 5.142.96 ± 18.721.30 ± 9.6523.32 ± 14.7038.56 ± 9.043.50 ± 8.180.48 ± 26.620.57 ± 18.1254.16 ±
7.52
41.79 ± 9.784.05 ±
9.02
13.241.190.5624.325.051.2415.3343.733.610.51.2345.9249.974.11
23.060.640.5126.263.941.1519.7340.033.680.470.5251.2344.614.15
32.720.40.4327.062.71.3924.2537.762.60.370.3356.1840.862.97
42.920.470.5625.42.561.6524.3437.973.220.450.4755.34413.67
20%53.040.350.5325.53.731.2819.8138.595.780.680.7150.8742.676.46
62.880.220.623.992.971.3123.7238.124.790.550.8653.3641.315.34
73.390.20.5726.012.431.3624.5235.74.880.430.5156.3638.335.31
84.0900.4824.074.221.2915.2943.45.90.530.745.9247.626.43
93.190.260.523.243.131.2221.1441.374.120.411.4350.7244.764.53
103.020.120.525.523.871.5617.1343.623.820.40.4548.1847.614.22
MEAN ±
SD
3.15 ± 11.420.39 ± 82.840.52 ± 9.0825.14 ± 4.503.46 ± 23.081.34 ± 10.8920.53 ± 17.0240.03 ± 6.784.24 ± 24.130.48 ± 18.040.72 ± 47.1551.41 ±
7.23
43.87 ± 7.984.72 ±
23.05
13.341.030.5325.534.691.0213.2741.187.660.950.7744.4646.98.61
22.620.280.523.93.921.1616.3540.848.611.10.7145.2445.049.71
30%32.360.20.4624.432.721.2422.734.819.670.980.4351.6237.3310.65
42.770.370.5925.192.661.6123.0335.657.070.520.5553.7438.687.59
52.570.220.4822.383.711.3414.7744.248.680.890.7242.2648.179.57
MEAN ±
SD
2.73 ± 12.120.42 ± 73.970.51 ± 8.8624.29 ± 4.573.54 ± 21.671.27 ± 15.5418.02 ± 22.5939.34 ± 9.088.34 ± 10.770.89 ± 22.110.64 ± 19.9347.46 ±
9.31
43.22 ± 10.179.23 ±
11.30
50%12.420.160.2122.573.430.7115.1637.8715.861.350.2641.3341.4617.21
11.520.470.2621.033.780.6311.440.8317.991.580.5135.3545.0819.57
60%21.510.110.2323.094.130.5714.8438.8515.281.20.1840.4243.0916.48
MEAN ±
SD
1.52 ±
0.33
0.29 ± 62.070.25 ± 6.1222.06 ± 4.673.96 ± 4.420.60 ± 5.0013.12 ± 13.1139.84 ± 2.4816.64 ± 8.151.39 ± 13.670.35 ± 47.8337.89 ±
6.69
44.09 ± 2.2618.03 ±
8.57
11.370023.324.131.4110.1638.5219.741.35036.2642.6521.09
70%21.680.140.3123.23.260.8113.4336.6219.071.180.339.7340.0220.25
AV1.53 ± 10.160.07 ± 100.000.16 ± 100.0023.26 ± 0.263.70 ± 11.771.11 ± 27.0311.80 ± 13.8637.57 ± 2.5319.41 ± 1.731.27 ± 6.720.15 ± 100.0038.00 ±
4.57
41.34 ± 3.1820.67 ±
2.03
11.160.150.1820.934.240.4213.3536.6421.810.990.1436.1841.0322.8
80%21.930.040.1722.394.770.411.1636.9520.511.570.1136.1641.7622.08
MEAN ±
SD
1.55 ± 24.920.10 ± 57.890.18 ± 2.8621.66 ± 3.374.51 ± 5.880.41 ± 2.4412.26 ±
8.94
36.80 ± 0.4221.16 ± 3.071.28 ± 22.660.13 ± 12.0036.17 ±
0.03
41.40 ± 0.8822.44 ±
1.60
10.670.150.2122.044.530.267.7737.1224.491.60.1631.1141.826.09
90%20.510.010.0920.464.610.167.2539.0126.451.020.128.574.6327.47
30.540.160.0821.545.220.136.5739.2624.192.190.1228.9844.6426.38
MEAN ±
SD
0.57 ± 12.110.11 ± 64.200.13 ± 46.6321.35 ± 3.094.79 ± 6.440.18 ± 30.327.20 ±
6.83
38.46 ± 2.4825.04 ± 4.001.60 ± 29.790.13 ± 19.6929.55 ±
3.77
30.36 ± 60.0526.65 ±
2.23
SD *—Standard deviation.
Disclaimer/Publisher’s Note: The statements, opinions and data contained in all publications are solely those of the individual author(s) and contributor(s) and not of MDPI and/or the editor(s). MDPI and/or the editor(s) disclaim responsibility for any injury to people or property resulting from any ideas, methods, instructions or products referred to in the content.

