Article

Numerical Study of the Mechanical Properties and Failure Mechanisms of Shale Under Different Loading Conditions

1
School of Energy Science and Engineering, Henan Polytechnic University, Jiaozuo 454000, China
2
Department of Civil and Environmental Engineering, Brunel University of London, London UB8 3PH, UK
*
Author to whom correspondence should be addressed.
Appl. Sci. 2025, 15(8), 4405; https://doi.org/10.3390/app15084405
Submission received: 15 February 2025 / Revised: 29 March 2025 / Accepted: 1 April 2025 / Published: 16 April 2025
(This article belongs to the Section Civil Engineering)

Abstract

:
The fracturing performance of shale directly influences the effectiveness of shale gas development. To investigate the impact of bedding on the anisotropic mechanical properties and failure modes of shale under different stress paths, a shale model with randomly generated bedding planes was established using RFPA3D. Uniaxial compression, direct tension, and triaxial compression numerical simulations were conducted. The results reveal the following key findings: (1) With an increase in the bedding angle, the uniaxial compressive strength of shale shows a U-shaped change trend, while the tensile strength gradually decreases. Under the two loading conditions, the failure mechanism of the samples is significantly different, and the influence of the bedding distribution position on the direct tensile failure mode is more significant. (2) The confining pressure reduces the brittleness and anisotropy of shale by altering the internal stress distribution and inhibiting the propagation of microcracks. When the confining pressure increases from 0 MPa to 22.5 MPa, the strength increases by about 41% when the bedding angle is 30°, while the strength of 0° bedding only increases by 29%. (3) The frictional constraint effect plays a significant role in shale strength. Frictional stresses influence the strength near the interface between the bedding and the matrix, while the regions outside this interface maintain the original stress state. In shale with inclined bedding, shear stress promotes slip along the bedding planes, which further reduces the overall strength. The research findings hold significant guiding value for optimizing fracturing designs and enhancing the efficiency of shale gas development.

1. Introduction

Shale, a widely distributed sedimentary rock, contains abundant oil and gas resources and is a key source of clean energy [1,2,3,4,5,6]. Currently, hydraulic fracturing technology is commonly employed in shale gas development, where fracturing fluid is injected to create a continuous fracture network within the shale, allowing shale gas to escape from the reservoir and flow into the wellbore. The extent of the fracture network’s development directly impacts the efficiency of shale gas extraction, making it crucial to understand the formation and evolution of fractures in shale under stress [7,8]. However, natural fractures, pores, and other defects are prevalent within shale, with these structural weaknesses often exhibiting high levels of damage [9,10,11]. Additionally, the layered structure formed during sedimentation imparts high brittleness and notable anisotropy to shale. The angle differences in weak bedding, in particular, significantly affect its mechanical properties, crack initiation and propagation, and failure modes. These characteristics complicate shale’s stability and fracture behavior in engineering applications, making it more challenging than isotropic rocks. Therefore, in-depth research on the formation mechanisms of complex fracture networks during fracturing and the anisotropic effects of bedding on mechanical behavior and failure modes is of great practical significance for optimizing fracturing operations and improving shale gas extraction efficiency.
When stored underground, shale is subjected to a complex stress state, prompting extensive research on its anisotropic fracture characteristics. Cao et al. [12] investigated the anisotropic failure modes of Xiangxi shale through uniaxial compression tests, while Lyu et al. [13] examined the uniaxial compression behavior of shale soaked in fracturing fluids with different pH values, analyzing its mechanical properties and failure characteristics. Yang et al. [14] and Zhao et al. [15] studied the effects of bedding inclination and confining pressure on the brittleness of Longmaxi outcrop shale through conventional triaxial tests. They proposed a new brittleness index for assessing the relationship between shale brittleness and failure modes. Additionally, research on shale tensile properties has gained significant attention. Kramarov et al. [16] combined the semi-circular disk test with digital image processing to quantify the fracture process zone of shale and evaluate its fracture toughness. Li et al. [17] proposed four distinct tensile failure modes for shale and established corresponding criteria for evaluating tensile strength. Guo et al. [18] conducted Brazilian disc and uniaxial triaxial tests to investigate the failure modes of shale under varying stress states. Further studies have performed direct shear and creep tests [19,20] and uniaxial compression tests considering strain rate effects [21], providing deeper insights into shale’s anisotropic characteristics under different conditions. In addition to conventional rock materials, Yang et al. [22] examined the anisotropy of cast-like layered rock materials, finding that under triaxial loading, the crack morphology of these materials closely resembled that of shale. With emerging technologies, 3D printing has also been applied in rock mechanics. Shao et al. [23] and He et al. [24] conducted uniaxial compression tests on 3D-printed layered gypsum rock, revealing a similar strength change pattern to natural rock. These findings suggest that the anisotropy of shale primarily arises from its bedding structure.
The experimental results demonstrate that the weak bedding defects formed during sedimentation induce significant mechanical differences in shale in various directions. However, most existing studies focus on macroscopic destruction phenomena. Although microscopic damage in shale has been observed using techniques such as X-ray diffraction (XRD) [14], scanning electron microscopy (SEM) [13], and digital imaging correlation (DIC) [16], these methods have limitations; for example, it is difficult to observe the internal progressive damage and destruction processes. Furthermore, their high operational costs make them less suitable for large-scale applications. Additionally, controlling the bedding characteristics of natural rocks remains challenging. While rock-like materials allow bedding density and strength adjustments, the processes are complex, and the material costs are high.
In contrast to laboratory experiments, numerical methods have gained popularity in recent years in geotechnical engineering due to their ability to simulate rock failure processes and visualize internal crack evolution. Liao et al. [25] performed numerical simulations of three standard rock tensile strength tests (direct tensile test, Brazilian disc test, and three-point bending test) using three-dimensional (3D) rock failure process analysis (RFPA3D), revealing significant differences in the tensile strength results and emphasizing the strong influence of the size effect. Fan et al. [26] conducted direct shear tests on shales with different bedding orientations using PFC3D and found that the bedding orientation significantly affected the shear strength and crack morphology. Song et al. [27] studied the impact of the bedding inclination and confining pressure on shale failure behavior using PFC3D, while Zhai et al. [28] explored the effects of the bedding inclination, bedding density, and confining pressure on shale’s mechanical properties and brittleness based on RFPA3D. These studies highlight the effectiveness of numerical methods, yet most research on shale has focused on uniform bedding structures, often assuming constant bedding spacing in numerical models. However, the bedding structure of natural sedimentary shales is typically more complex, and its anisotropic effects are significant. Therefore, the distribution of bedding in numerical models, as a crucial property of the bedding structure, must be fully considered in such studies.
A deep understanding of the shale fracturing mechanism and the optimization of fracturing techniques are crucial for achieving the large-scale, efficient development of deep shale gas reservoirs. To gain a deeper understanding of the influence of the bedding distribution on the mechanical properties of shale under different stress states and uncover the underlying failure mechanisms, this study employed the RFPA3D method to conduct compression and tension tests under uniaxial stress on shales with three different bedding distributions and four bedding angles, as well as compression tests under triaxial stress states on shale with a specific bedding distribution. The study obtained the mechanical characteristics, such as the strength, elastic modulus, and peak strain, of randomly distributed bedding shale under different stress paths and analyzed the anisotropic failure modes and crack propagation paths. Additionally, the research explored the effect of the bedding distribution on the anisotropic behavior under uniaxial stress and fitted shear strength parameters based on the triaxial compression test results. These findings provide a necessary theoretical basis for understanding the failure behavior of layered rock masses under various stress paths and the formation mechanisms of fracture networks.

2. Numerical Simulation Method
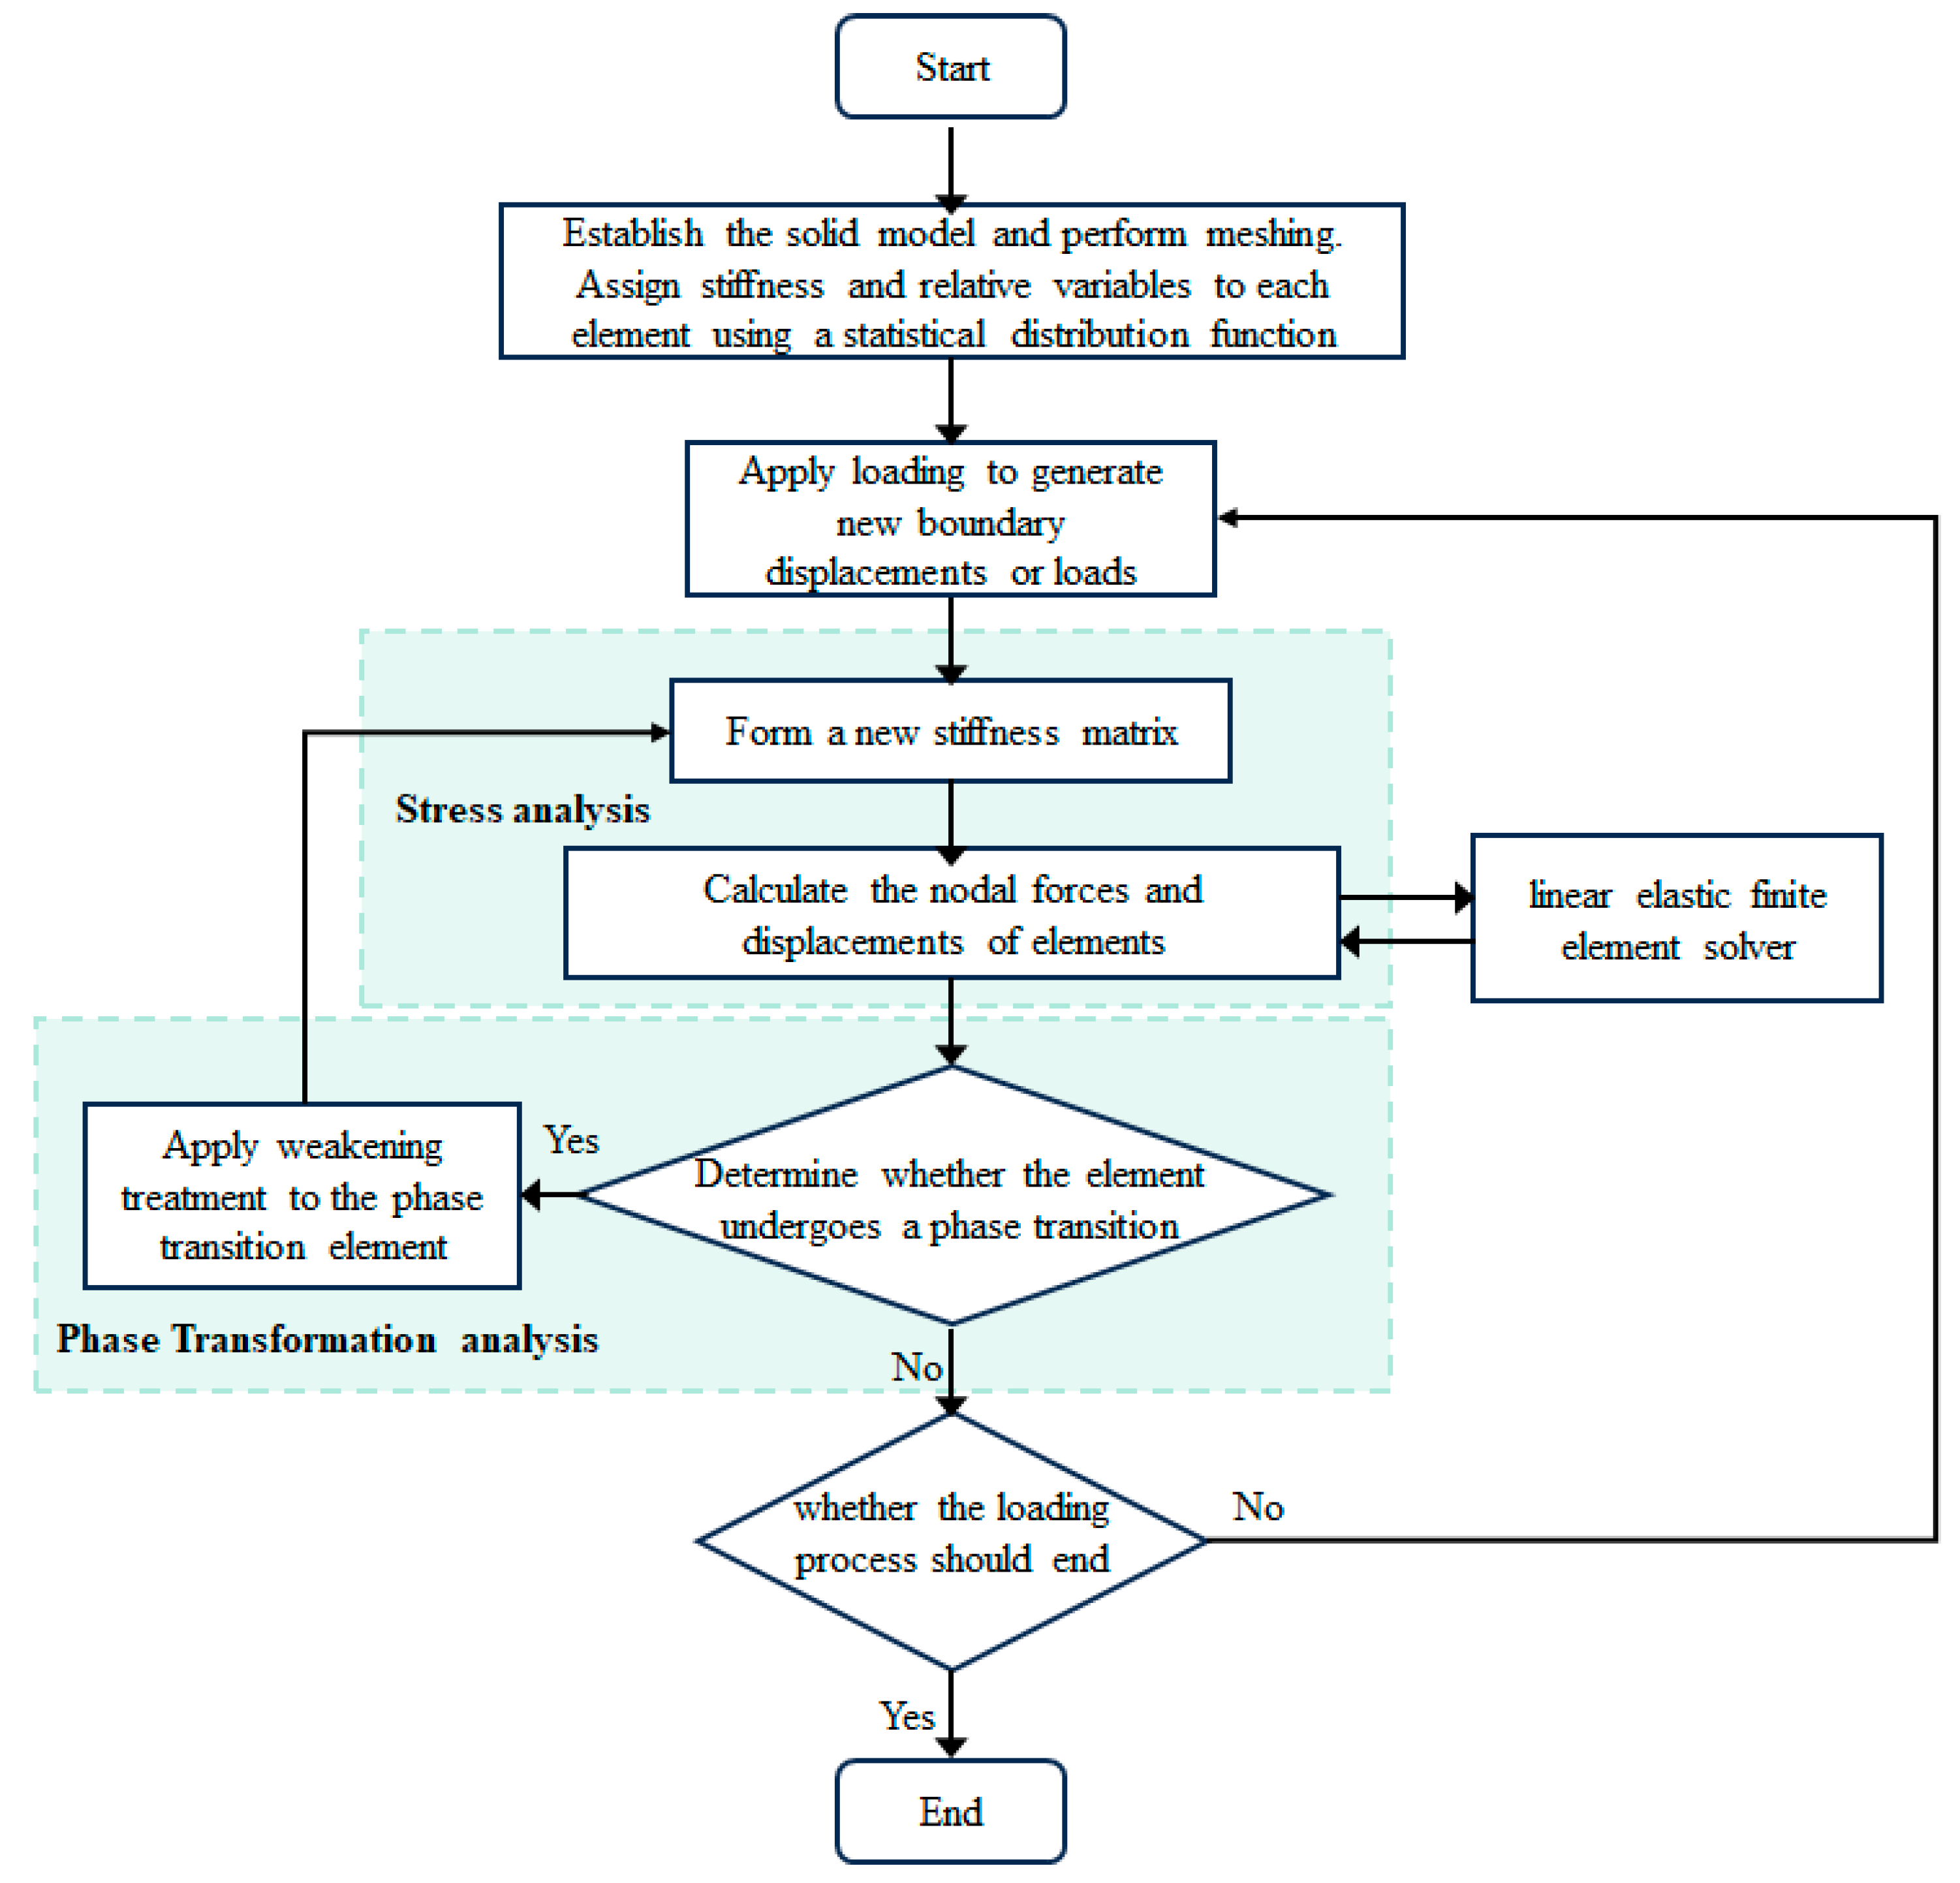
2.1. RFPA

RFPA3D is a widely used numerical simulation software in rock mechanics and geotechnical engineering. It is capable of effectively simulating the fracture mechanism, stress–strain behavior, and failure evolution of rock materials, with its computational process shown in Figure 1. Built on the elastic damage theory and the modified Coulomb failure criterion, RFPA3D constructs a deformation and failure analysis module for rock media. With its robust computational and visualization capabilities, the software enables the dynamic simulation of the entire rock fracture process, including crack initiation, propagation, coalescence, and penetration. Moreover, RFPA3D supports various loading conditions, such as uniaxial compression, triaxial compression, tension, and shear, making it applicable to large-scale engineering challenges, including slope instability prediction, tunnel failure analysis, mining-induced ground pressure disasters, and hydraulic fracturing in complex geological environments.
During the simulation, RFPA3D can also capture acoustic emission signals under stress, effectively reproducing the acoustic emission characteristics observed in laboratory experiments. This allows for the inference of crack propagation paths and rock damage evolution. Furthermore, the software provides an intuitive visualization of the spatial distribution, propagation direction, and interaction of internal cracks, offering valuable insights into the fracture mechanisms of rock materials.
Rock is a highly heterogeneous material, and its inherent defects lead to a non-uniform distribution of internal strength, making its failure process somewhat random [29,30]. Therefore, it is essential to account for the microscopic composition of the rock, the reduction in heterogeneity, and the determination of the failure criterion in numerical methods [31,32,33]. RFPA3D introduces the representative volume element (RVE) as the fundamental unit to address this. The size and mechanical properties of the microscopic unit RVE are spatially homogeneous [34,35]. To capture the randomness of defects and the mineral composition, the Weibull distribution function is employed to define the distribution characteristics of RVE strength parameters, simulating the heterogeneity of rock materials [35]:
φ ( α ) = m α 0 ( α α 0 ) m 1 e ( α α 0 ) m
where α represents the strength or elastic modulus of the unit, α₀ is the average value, and m is the homogeneity coefficient, which reflects the uniformity of the material properties. The larger the value of m, the less discrete the material parameters, leading to a more uniform distribution.
RFPA3D treats the nonlinear deformation of rock materials as a process where the mechanical properties degrade after RVE damage until being completely destroyed. When the RVE experiences stress that satisfies the relevant failure criteria, it evolves according to tensile and shear constitutive equations. The primitive damage variable D can be defined as follows [35]:
D = 1 E E 0
where E0 is the initial elastic modulus, and E is the elastic modulus after damage. The damage variable D ranges from 0 to 1: when D = 1, the RVE is intact; when D = 0, the RVE is fully damaged; and when D is between 0 and 1, the RVE is weakening.
In RFPA3D, the damage is categorized into tensile and shear damage. When the uniaxial tensile stress reaches the RVE tensile strength (σ−ft0), the maximum tensile strain criterion is applied to initiate damage evolution [35]:
D =               0   ,                               ε > ε t 0 1 λ ε t 0 ε   ,                   ε t u ε ε t 0               1   ,                               ε ε t u
where ε epsilonϵ is the longitudinal strain, εt0 is the tensile strain at the elastic limit, beyond which irreversible damage occurs; εₜᵤ is the ultimate tensile strain, at which tensile fracture occurs (D = 1); and λ is the residual strength coefficient.
Compressive stress and compressive strain are considered positive in RFPA3D, while tensile and tensile strain are negative. Under triaxial stress conditions, if the equivalent tensile strain ε ¯ is defined as (ε1, ε2, ε3 are the principal strains, and <> denotes x = x         x 0 0         x < 0 ) [35]:
ε ¯ = - ε 1 2 + - ε 2 2 - ε 3 2
When ε ¯ reaches the tensile damage strain threshold εt0, ε ¯ is substituted for strain ε, and the tensile damage constitutive relation of RVE under three-dimensional stress is expressed as follows [35]:
D =             0   ,                                 ε ¯ > ε t 0 1 λ ε t 0 ε ,                   ε t u ε ¯ ε t 0             1   ,                                 ε ¯ ε t u
RFPA3D uses the Mohr–Coulomb criterion to describe the shear damage during RVE compression behavior [35]:
σ 1 σ 3 1 + sin ϕ 1 cos ϕ f c
where σ1 is the maximum principal stress, σ3 is the minimum principal stress, and fc is the uniaxial compressive strength. Under uniaxial compressive stress, RVE damage can be described as follows [35]:
D =             0   ,                                 ε < ε c 0 1 λ ε c 0 ε ,                     ε c 0 ε
Extending the uniaxial compressive shear damage to three dimensions, the maximum compressive principal strain εc0 is expressed as follows [35]:
ε c 0 = 1 E f c 0 + 1 + sin φ 1 sin φ σ 3 μ ( σ 1 + σ 2 )
where μ is Poisson’s ratio, and when replacing the strain in Equation (7) with the maximum compressive principal strain εc0, the shear damage constitutive relation of RVE under three-dimensional compressive stress can be generalized as follows [35]:
D =             0   ,                                       ε 1 < ε c 0 1 λ ε c 0 ε 1   ,                       ε c 0 ε 1

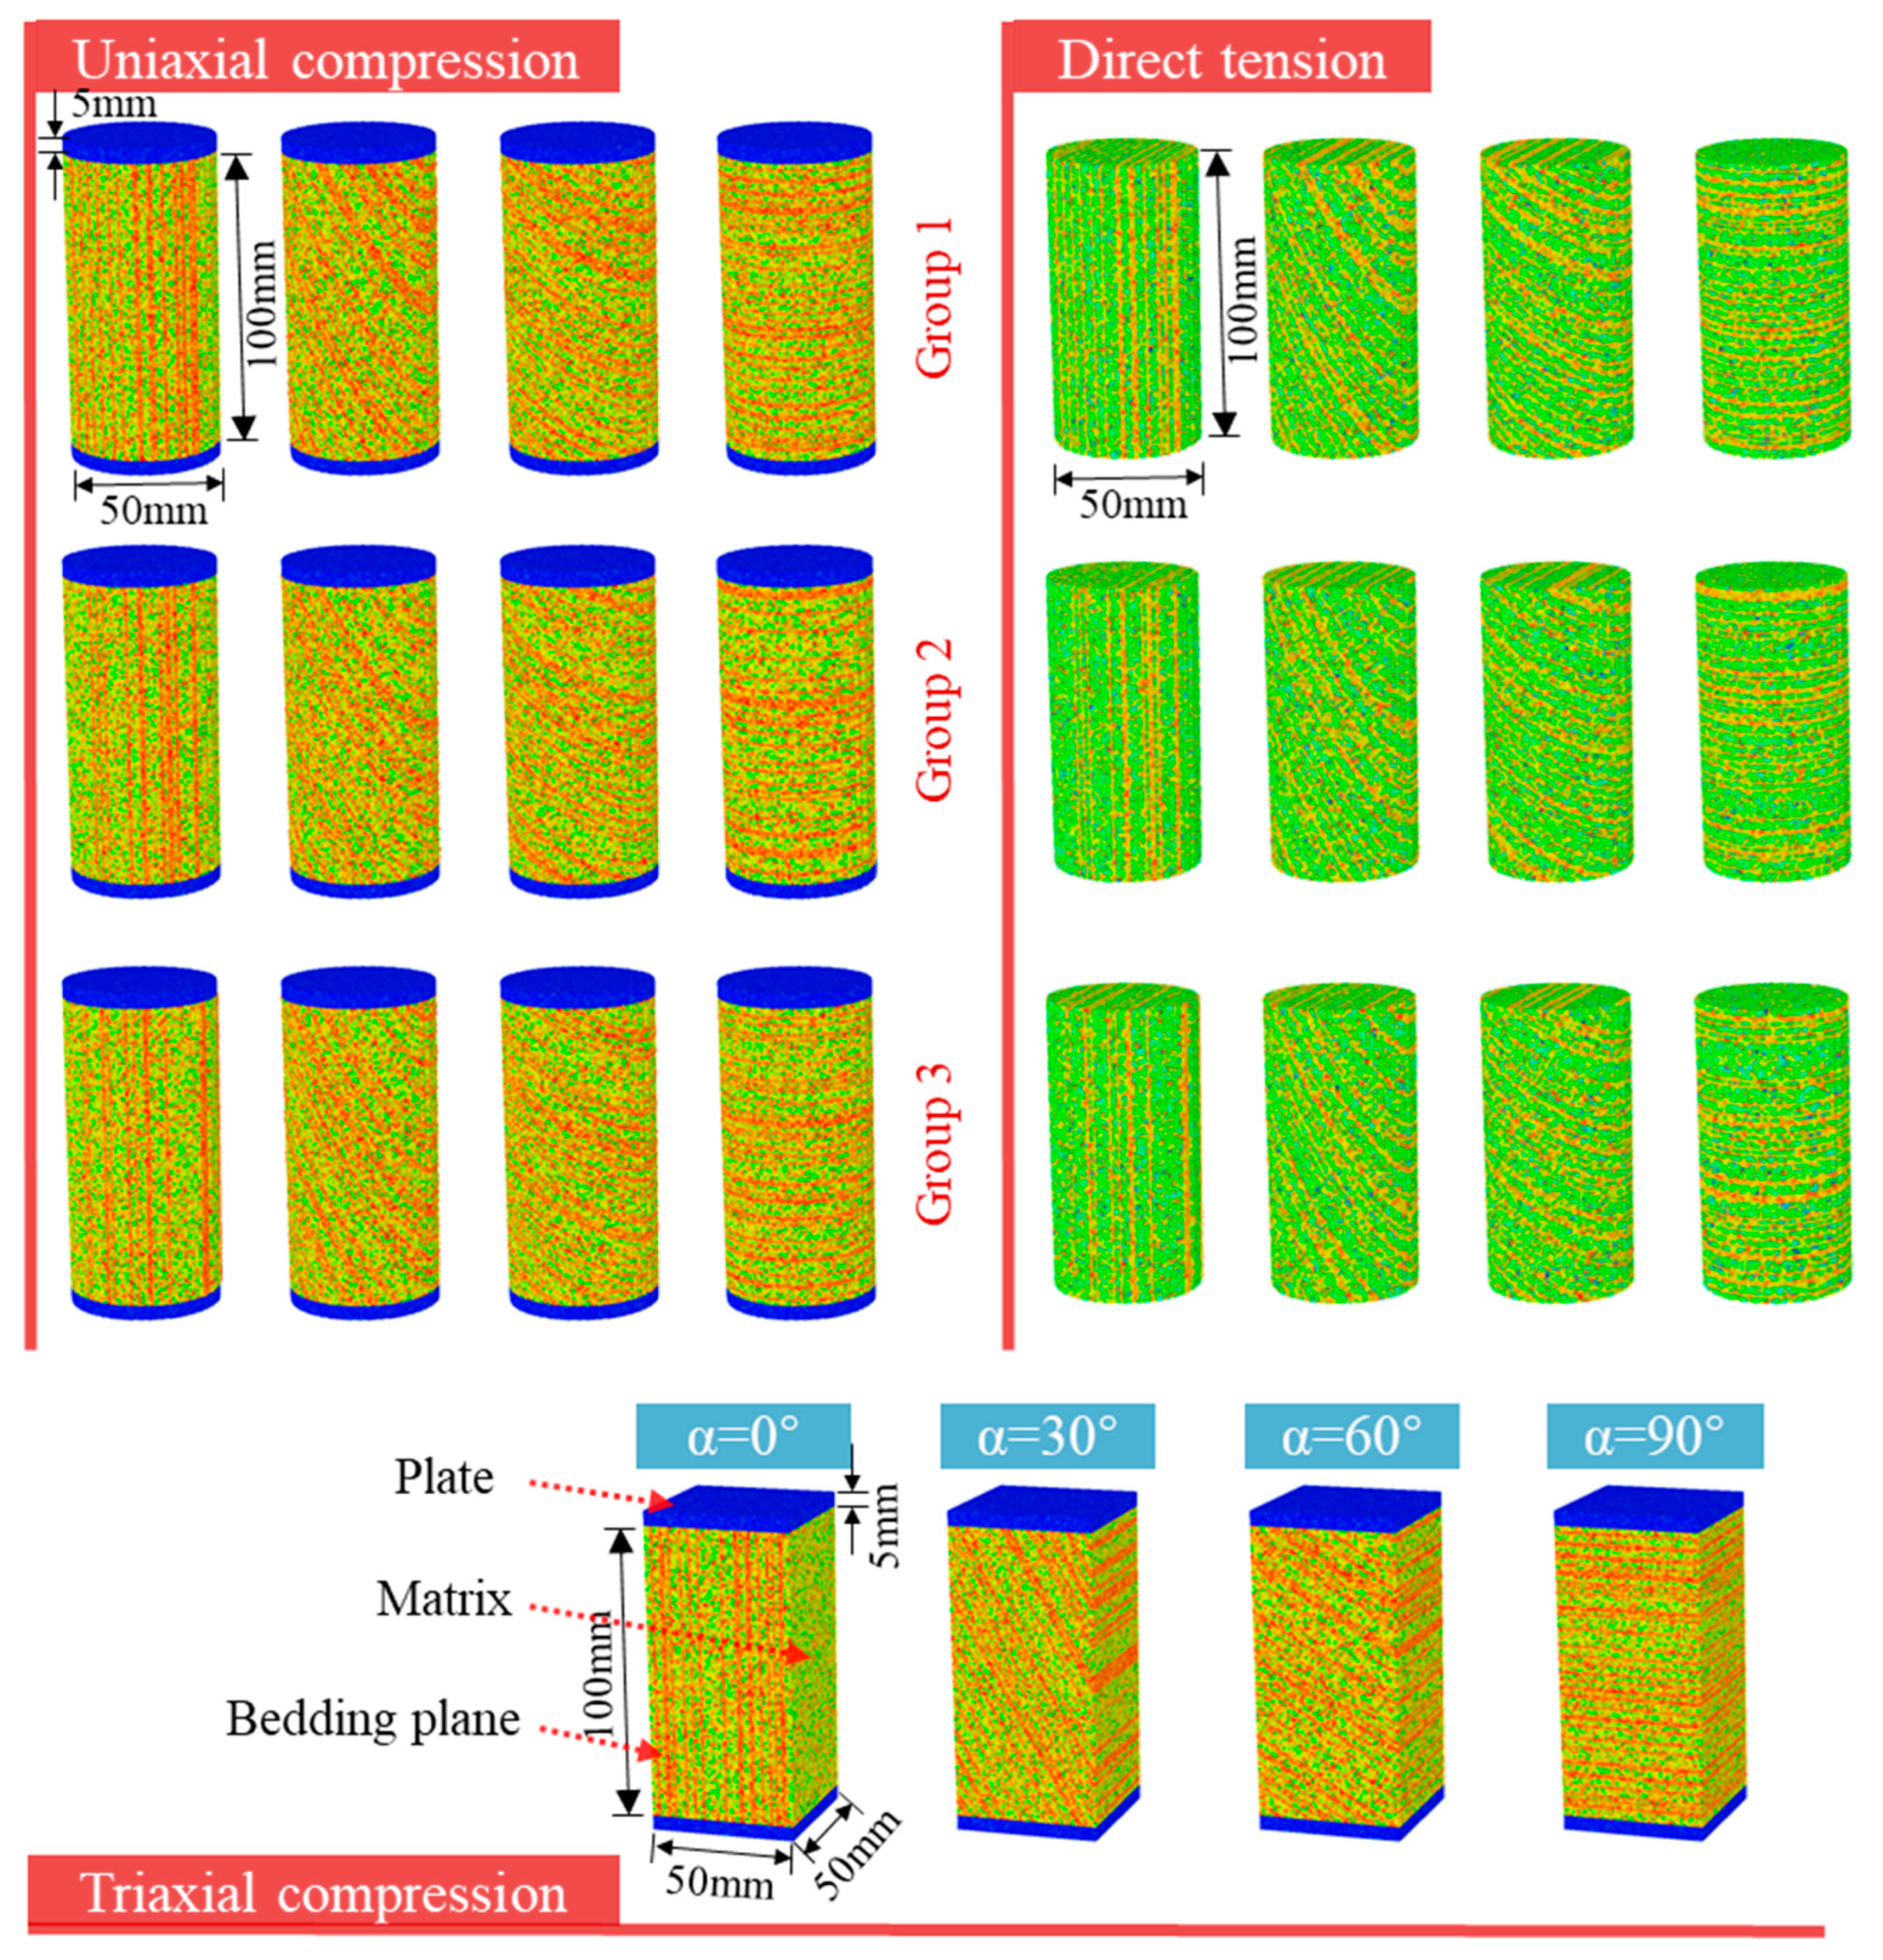
2.2. Numerical Model

The layered structure of shale imparts significant anisotropic characteristics, and the development position, thickness, and strength of the bedding are highly variable. Therefore, accurately reproducing the bedding structure of shale in numerical simulations is crucial. A layered rock block was generated using a MATLAB (R2023a) program to simulate the random distribution of shale bedding. Shale was sampled at different angles within the rock block, simulating the coring process of actual rock samples. This resulted in a shale model with varying sampling angles, as shown in the figure. This process reproduces the bedding distribution within the rock and allows for the simulation of rock sample characteristics under different experimental conditions by adjusting the sampling angle.
Based on the constructed rock block, the model identified different regions using threshold segmentation, and the matrix and bedding characteristics were assigned accordingly. Using numerical simulation software, the partitioning of the matrix and bedding in the shale model was implemented, enabling a more accurate representation of the layered structure and anisotropic behavior of shale. Shale, a sedimentary rock with high heterogeneity, consists of clay minerals, quartz, organic matter, and other components exhibiting distinct mechanical responses. Figure 2 presents the layered structure model after meshing with the RFPA3D. The color variation in the RVE within the model reflects the distribution of the intensity heterogeneity. As mentioned in the previous section, the intensity parameters in RFPA3D follow a Weibull distribution function, effectively simulating the heterogeneous nature of rocks.
Shale is subjected to various stress states during underground storage and related engineering processes. To investigate the anisotropic fracture characteristics of shale under different stress conditions, this study constructs uniaxial compression, uniaxial tension, and triaxial compression models of randomly layered shale:
(1) Uniaxial compression:
According to the method in Figure 2, we extracted four cylindrical models with typical bedding angles (0°, 30°, 60°, 90°) from the complete model as one group. We extracted a total of three groups with different bedding distributions to ensure the universality of the results. The models are heterogeneous cylinders with a bottom radius of 25 mm and a height of 100 mm, with circular homogeneous plates of 5 mm thickness at both ends, consisting of approximately 370,000 elements. The loading is applied as a downward compressive axial load, with a stepwise loading rate of 0.02 mm per step. The specific model is shown in Figure 3.
(2) Direct tension:
The same model as the uniaxial compression test was used, but the upper and lower plates were removed. The model consists of approximately 340,000 elements. The loading is applied as an upward tensile axial load.
(3) Triaxial compression:
Considering the extended simulation time under confining pressure, a set of rectangular prism models was selected for triaxial compression simulations at four bedding angles (0°, 30°, 60°, and 90°). Each model, with a base edge length measuring 50 mm and a height measuring 100 mm, with square caps at both ends, consists of approximately 480,000 elements. The confining pressures were set at 7.5 MPa, 15 MPa, and 22.5 MPa, while the axial loading conditions remained consistent with those in the uniaxial compression models. Notably, the bedding distribution of the rectangular models used for triaxial compression was identical to that of the first group in the uniaxial compression test.

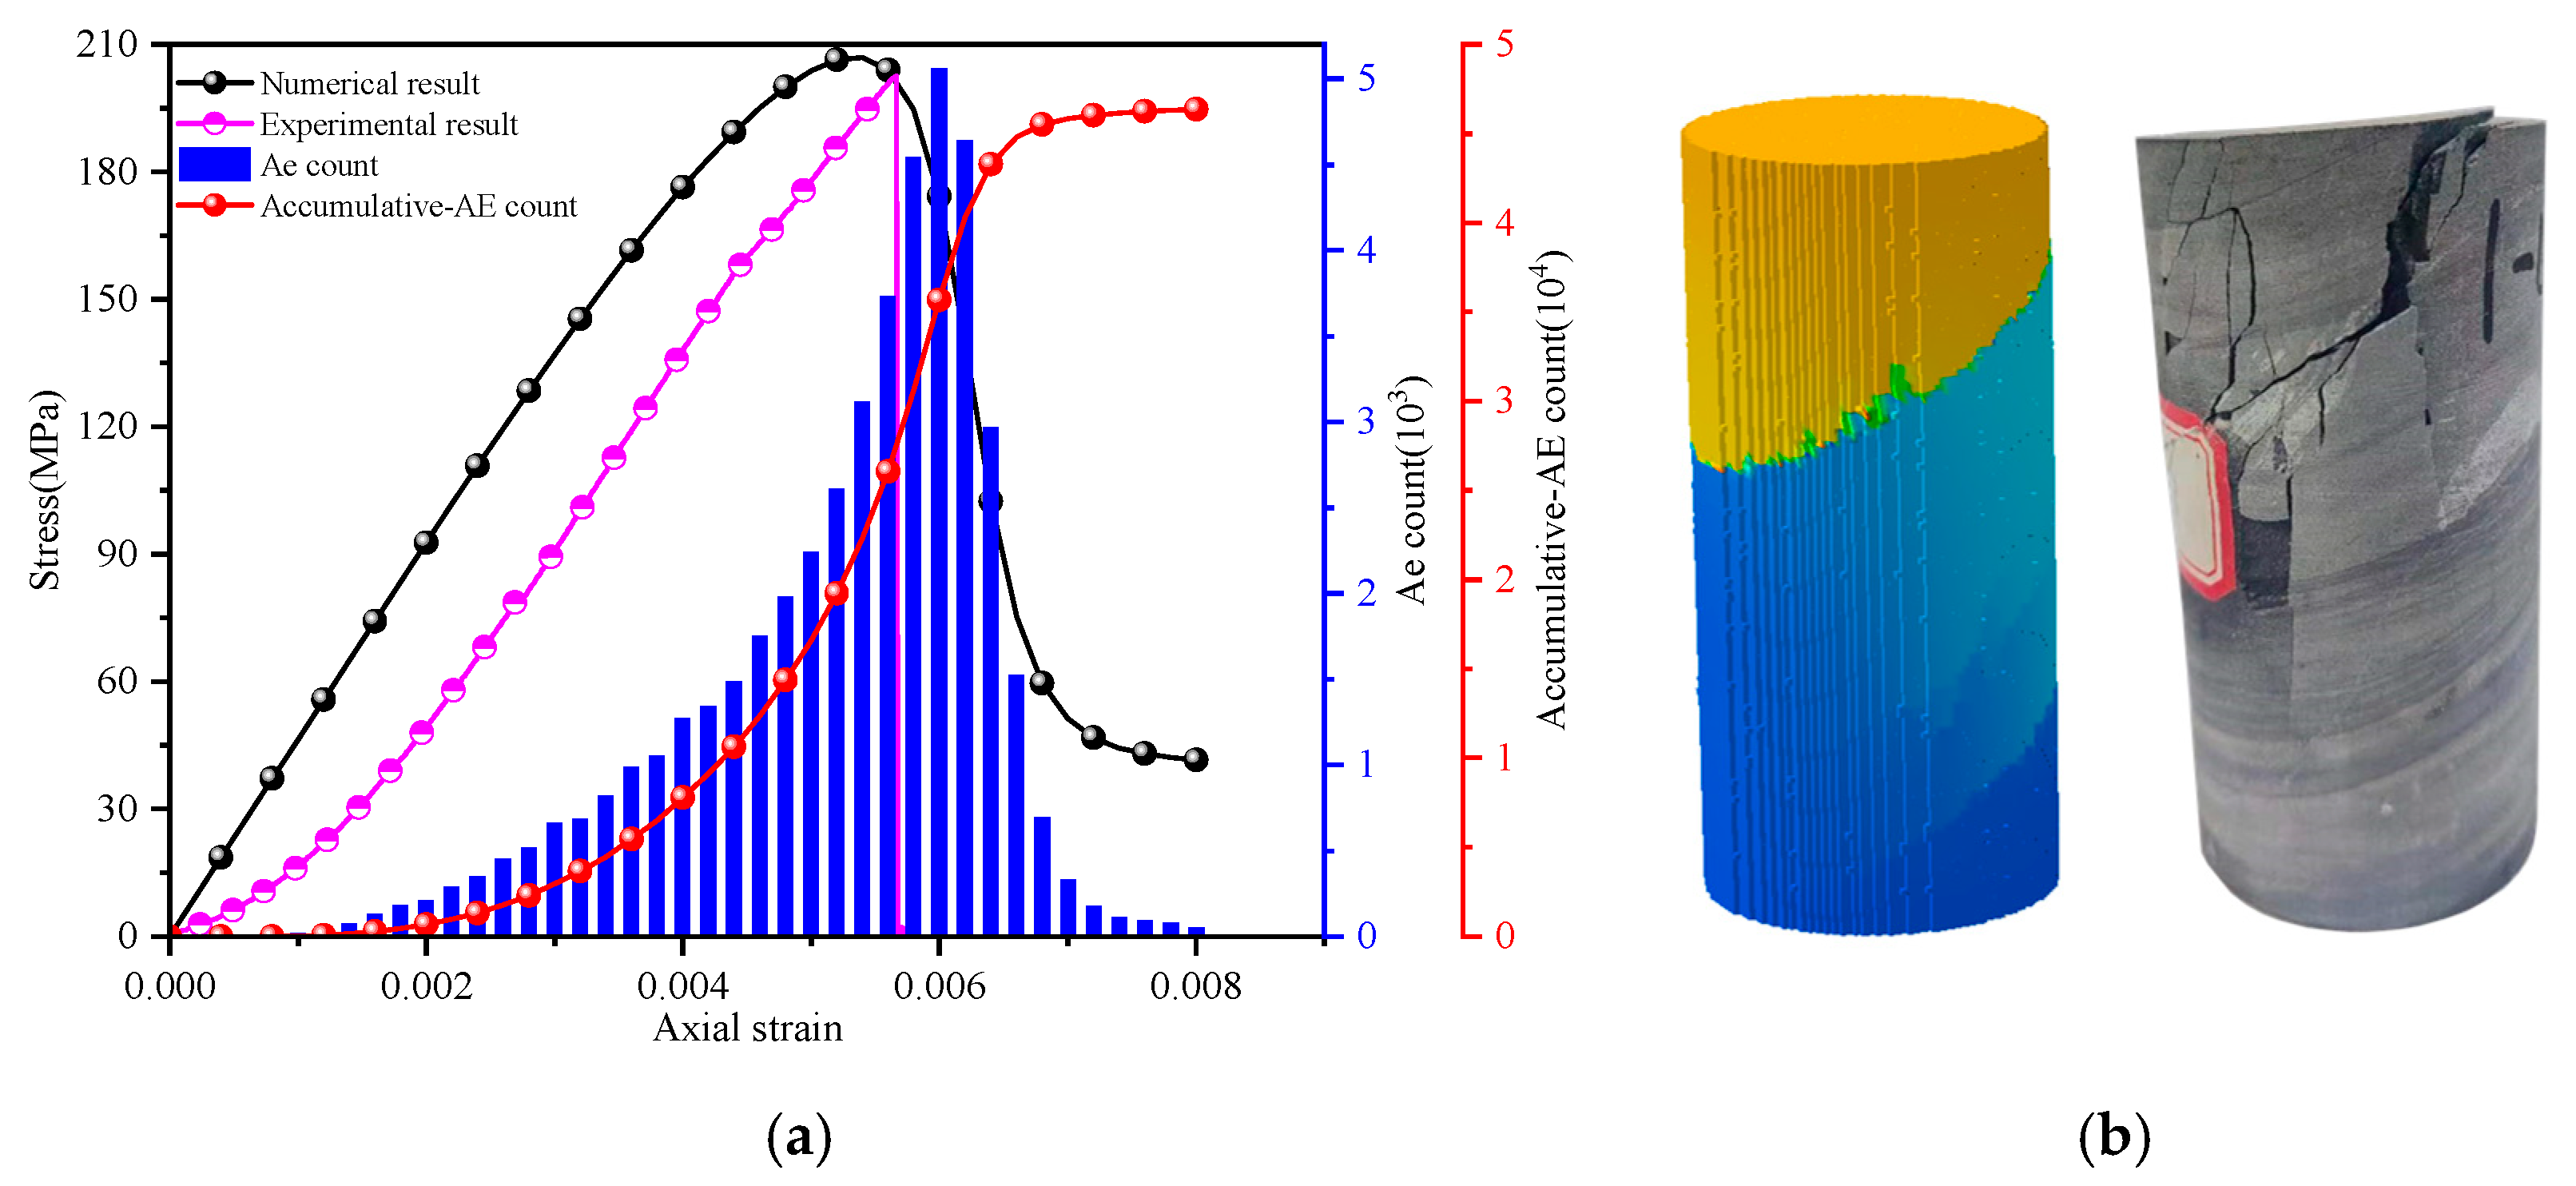
2.3. Model Validation

The matrix and bedding micro-parameters obtained through parameter calibration are presented in Table 1. Figure 4 illustrates the numerical simulation and experimental stress–strain curves for uniaxial compression when the bedding angle is 60°. As shown in Figure 4a, the elastic modulus and compressive strength of the numerical and experimental results are in close agreement, and the trend of the acoustic emission (AE) count aligns well with the stress curve. Since the model lacks defect structures such as pores and microcracks, the experimental curve does not display the typical concave compaction section during the deformation stage. However, the pre-peak loading section and the post-peak brittle failure process are consistent with the experimental observations. Figure 4b presents the failure modes of the experimental and simulated specimens, showing shear failure along the bedding plane, with the macroscopic crack morphology being identical. In summary, while there are minor differences in specific details between the numerical simulation and the experimental curves, the overall agreement is good, demonstrating that RFPA3D is highly applicable for studying the failure of brittle rocks.

3. Simulation Results and Analysis

3.1. Uniaxial Loading Conditions

Shale has an extremely complex internal structure as a highly heterogeneous rock mass. Clay minerals and organic matter introduce many microcracks and delicate pores. Additionally, the layered structure formed during sedimentation imparts significant anisotropy to its deformation, failure mode, and strength characteristics. These complex fracture networks and through-pores significantly impact the hydraulic fracturing process, and the varying mechanical properties of the bedding planes affect the stability of the tunnel surrounding rocks and shaft walls. Therefore, in this study, three shale models with random bedding distributions were established for different bedding angles (0°, 30°, 60°, 90°), and uniaxial compression and direct tension tests were conducted to investigate the influence of the bedding distribution on the failure mode and mechanical properties of shale.

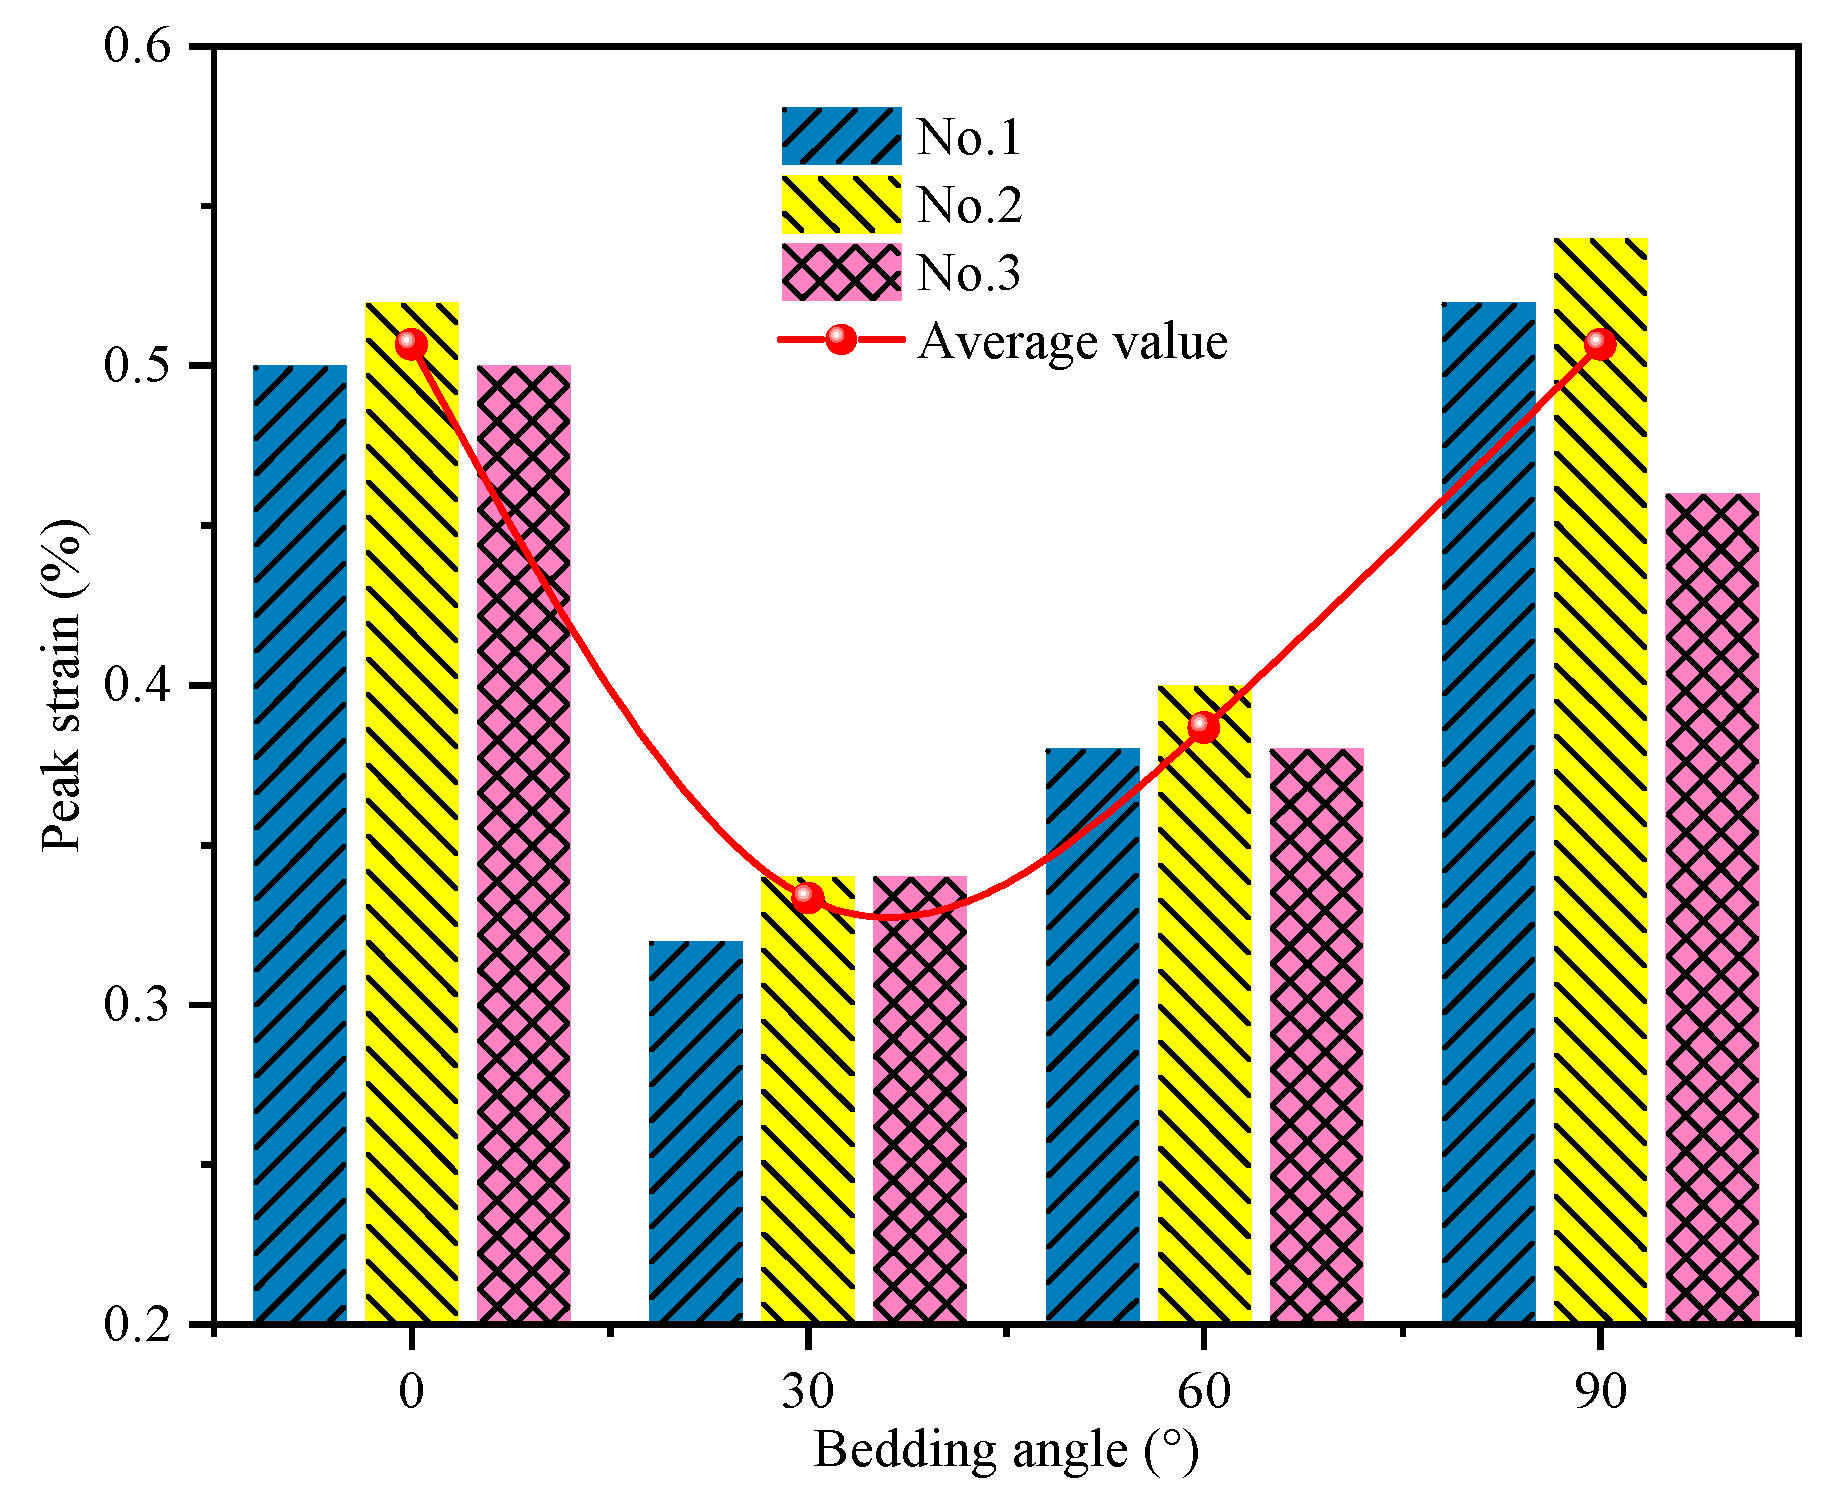
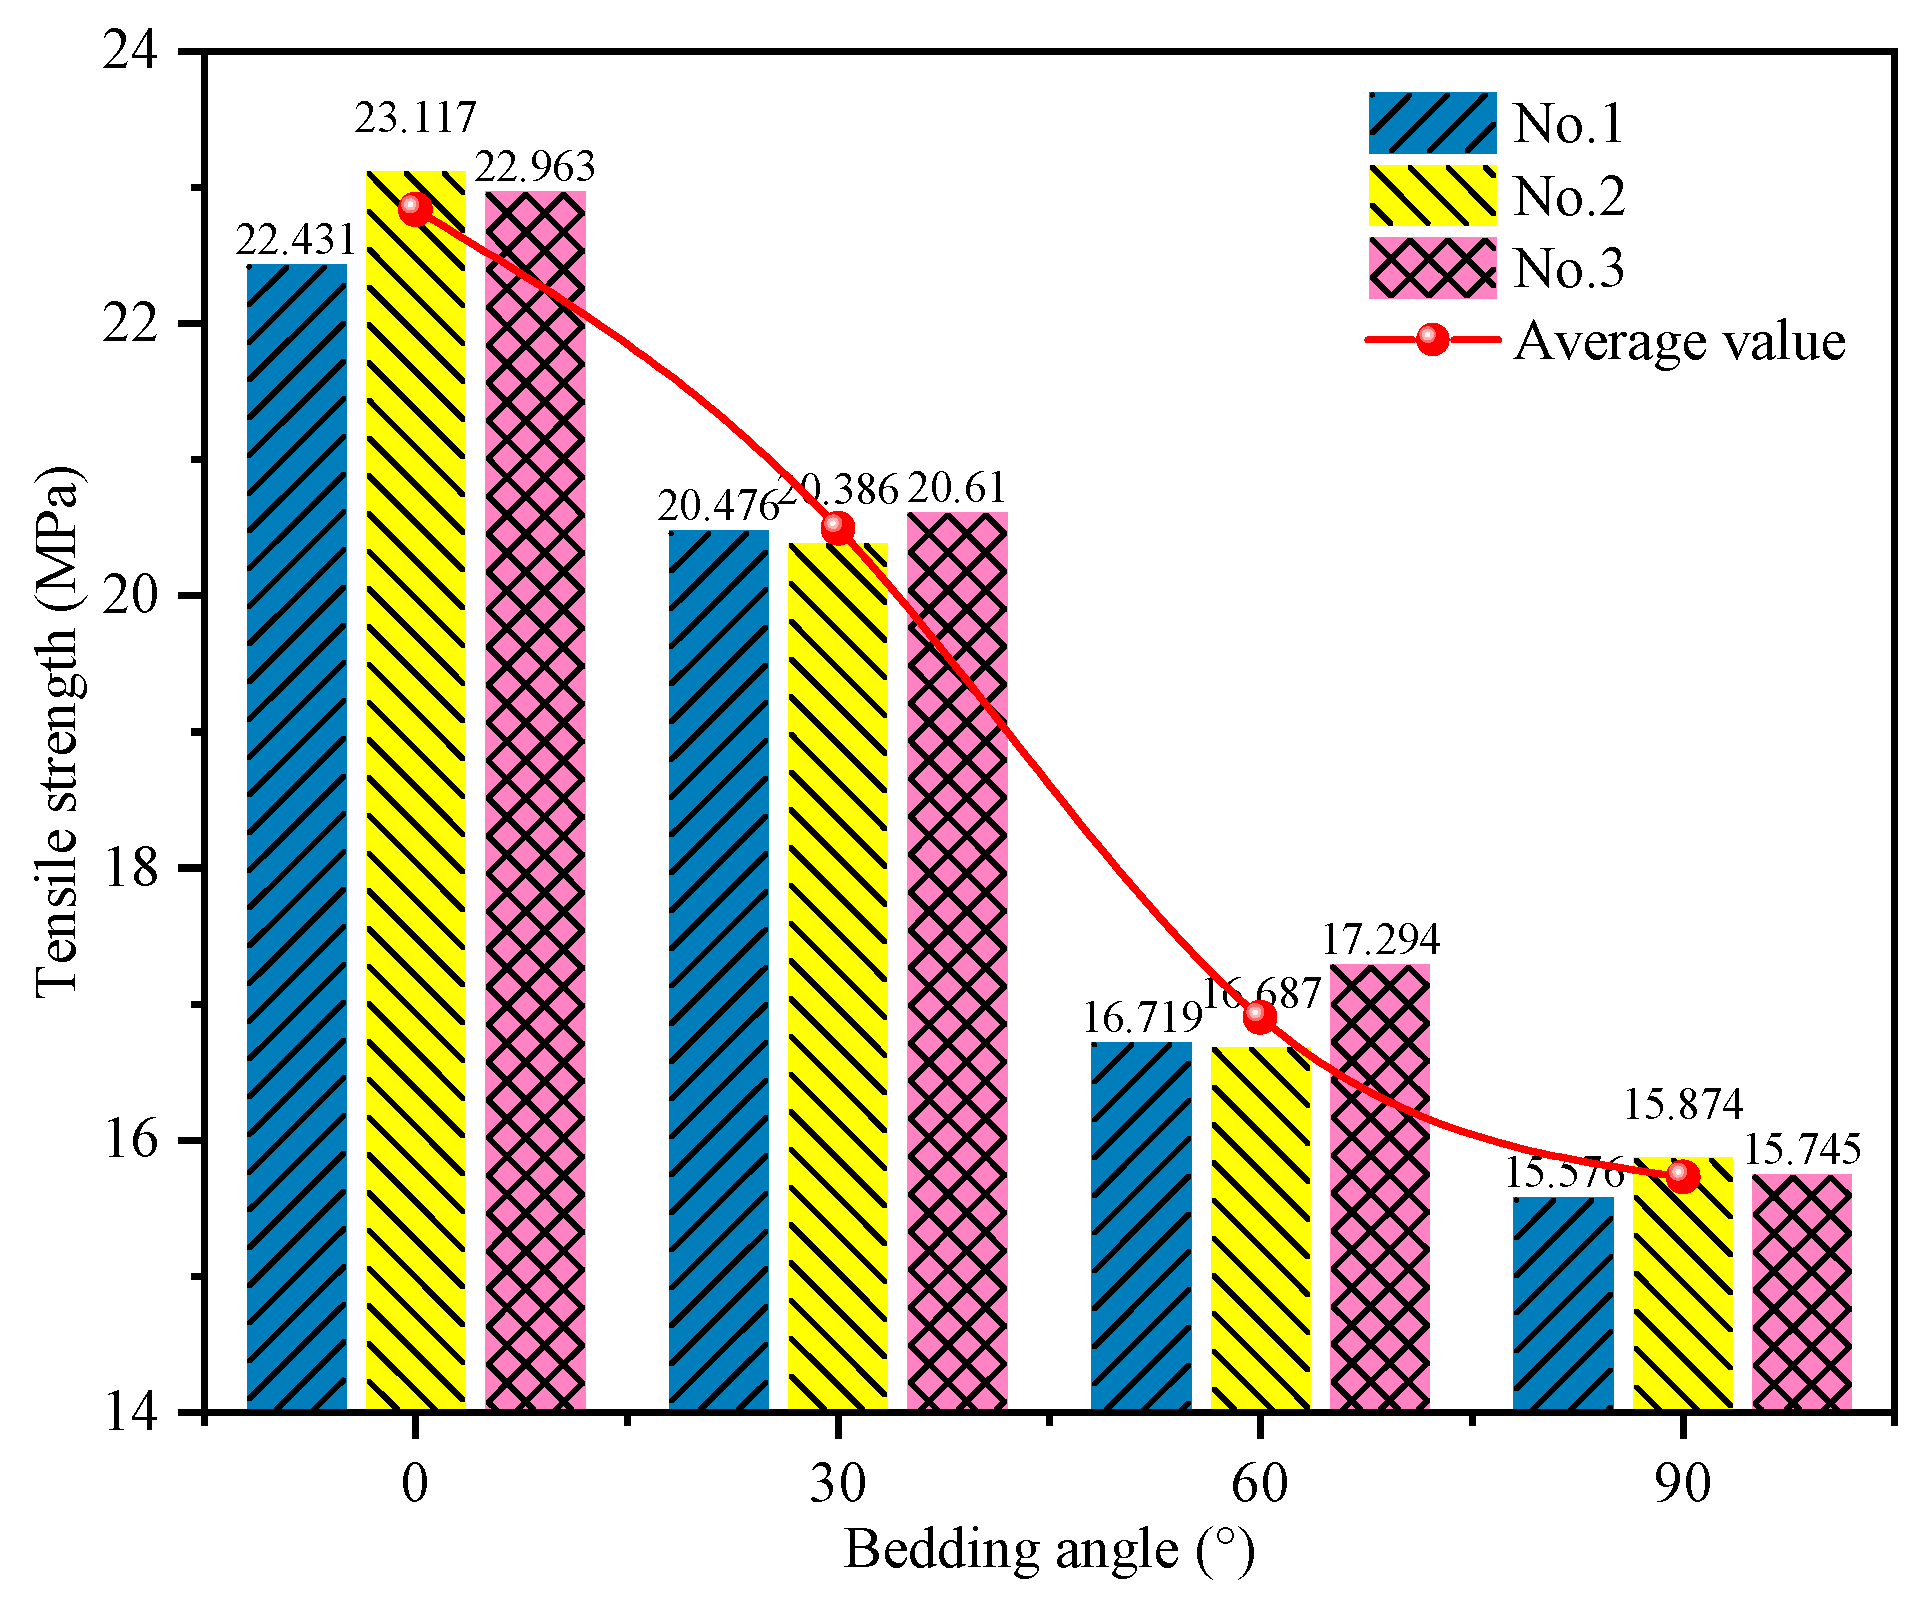
3.1.1. Mechanical Properties

Figure 5 illustrates the effect of bedding characteristics on the uniaxial compressive strength of shale. The results show that the compressive strength is significantly lower when the bedding is inclined compared to the 0° and 90° bedding orientations. With an increase in the bedding angle, the shale strength exhibits a concave trend, first decreasing and then increasing. The compressive strength for 0° and 90° bedding orientations is similar for the four bedding angles, while the strength for inclined bedding is relatively consistent. The average compressive strength is highest for the 0° bedding orientation (217.24 MPa) and lowest for the 30° bedding orientation (152.96 MPa). The bedding angle significantly affects the strength, primarily due to the varying angles between the weak bedding and the axial force during uniaxial compression, which leads to differences in the role of the bedding plane under compression. Consequently, shale exhibits apparent anisotropy at different bedding angles. The maximum to minimum compressive strength ratio is defined as the anisotropy index. The results show that the anisotropy index for shale under compression is 1.420, indicating a typical anisotropic rock.
At the same bedding angle, the strength change behavior for the three bedding distributions is consistent, with the No. 2 model being higher than No. 3 and No. 1 showing the lowest strength. This is due to the varying number of layers in shale under different bedding distributions, with the strength of the weak bedding being lower than that of the shale matrix. Therefore, the compressive strength decreases as the number of bedding planes increases. Furthermore, the impact of the bedding distribution on different bedding angles varies. When the bedding angle is 0° or inclined, the maximum and minimum strengths are similar (around 10 MPa). However, at 90° bedding, the strength difference is the largest, reaching 20.05 MPa. This is because when the bedding is 90°, the axial force is entirely applied to the weak bedding plane, making the strength highly sensitive to the number and spatial distribution of bedding, which causes more significant strength fluctuations. This phenomenon demonstrates that the content of weak bedding and its uneven distribution inside shale are key factors contributing to strength variability.
Figure 6 shows the changes in the elastic modulus of shale at different bedding angles, exhibiting evident bedding characteristics. The elastic modulus decreases slightly as the bedding angle increases. During compression, the weak bedding in shale is more prone to deformation than the matrix. Thus, as the bedding angle increases, the effective area of the bedding increases, leading to a gradual decrease in the shale’s resistance to deformation. When the bedding angle is 0°, the bedding plane is perpendicular to the axial force, resulting in minimal compression deformation and the highest elastic modulus. At a 90° bedding angle, the interaction between the bedding plane and the axial force is maximized, leading to the lowest elastic modulus. The figure shows a negative correlation between the bedding angle and elastic modulus, with an average decrease of 2.96% and an overall decrease of 8.62%. This is primarily because the deformation resistance of the bedding plane decreases less relative to the matrix, leading to a more minor reduction in the elastic modulus. Additionally, the variation in bedding distribution at the same bedding angle causes more minor fluctuations in the elastic modulus of shale. Overall, the presence of bedding planes results in noticeable anisotropy in the elastic modulus of shale.
Figure 7 displays the changes in the peak strain for shale at different bedding angles and distributions. Like the compressive strength variation, the peak strain follows a concave trend: low in the middle and high at both ends. When the bedding angle is 0° or 90°, the peak strain is nearly the same, while for inclined bedding, failure occurs more rapidly, and the peak strain is lower. Unlike isotropic rock masses, the failure mechanism in anisotropic rock masses is distinct. For shale, the presence of weak bedding planes means that changes in the bedding orientation alter the interaction of bedding planes, leading to different instability failure modes and significantly affecting the peak strain.
Figure 8 shows the direct tensile test results for shale with three different bedding distributions. The results reveal that the tensile strength is negatively correlated with the bedding angle. The tensile strength is highest at a 0° bedding angle (approximately 22.84 MPa) and lowest at a 90° bedding angle (15.73 MPa). The anisotropy index for tensile strength is 1.452, with the tensile strength being significantly lower than the compressive strength. The variability in the tensile strength across different bedding distributions is notably smaller than that for compressive strength. The difference in the tensile strength primarily arises from the bonding between the bedding and matrix. When the bedding angle is 0°, the tensile strength is closer to the matrix strength, while at 90°, it is closer to the bedding strength. As the bedding angle increases, bedding gradually dominates the failure process. Due to the weak bonding between bedding layers, the tensile strength decreases somewhat.

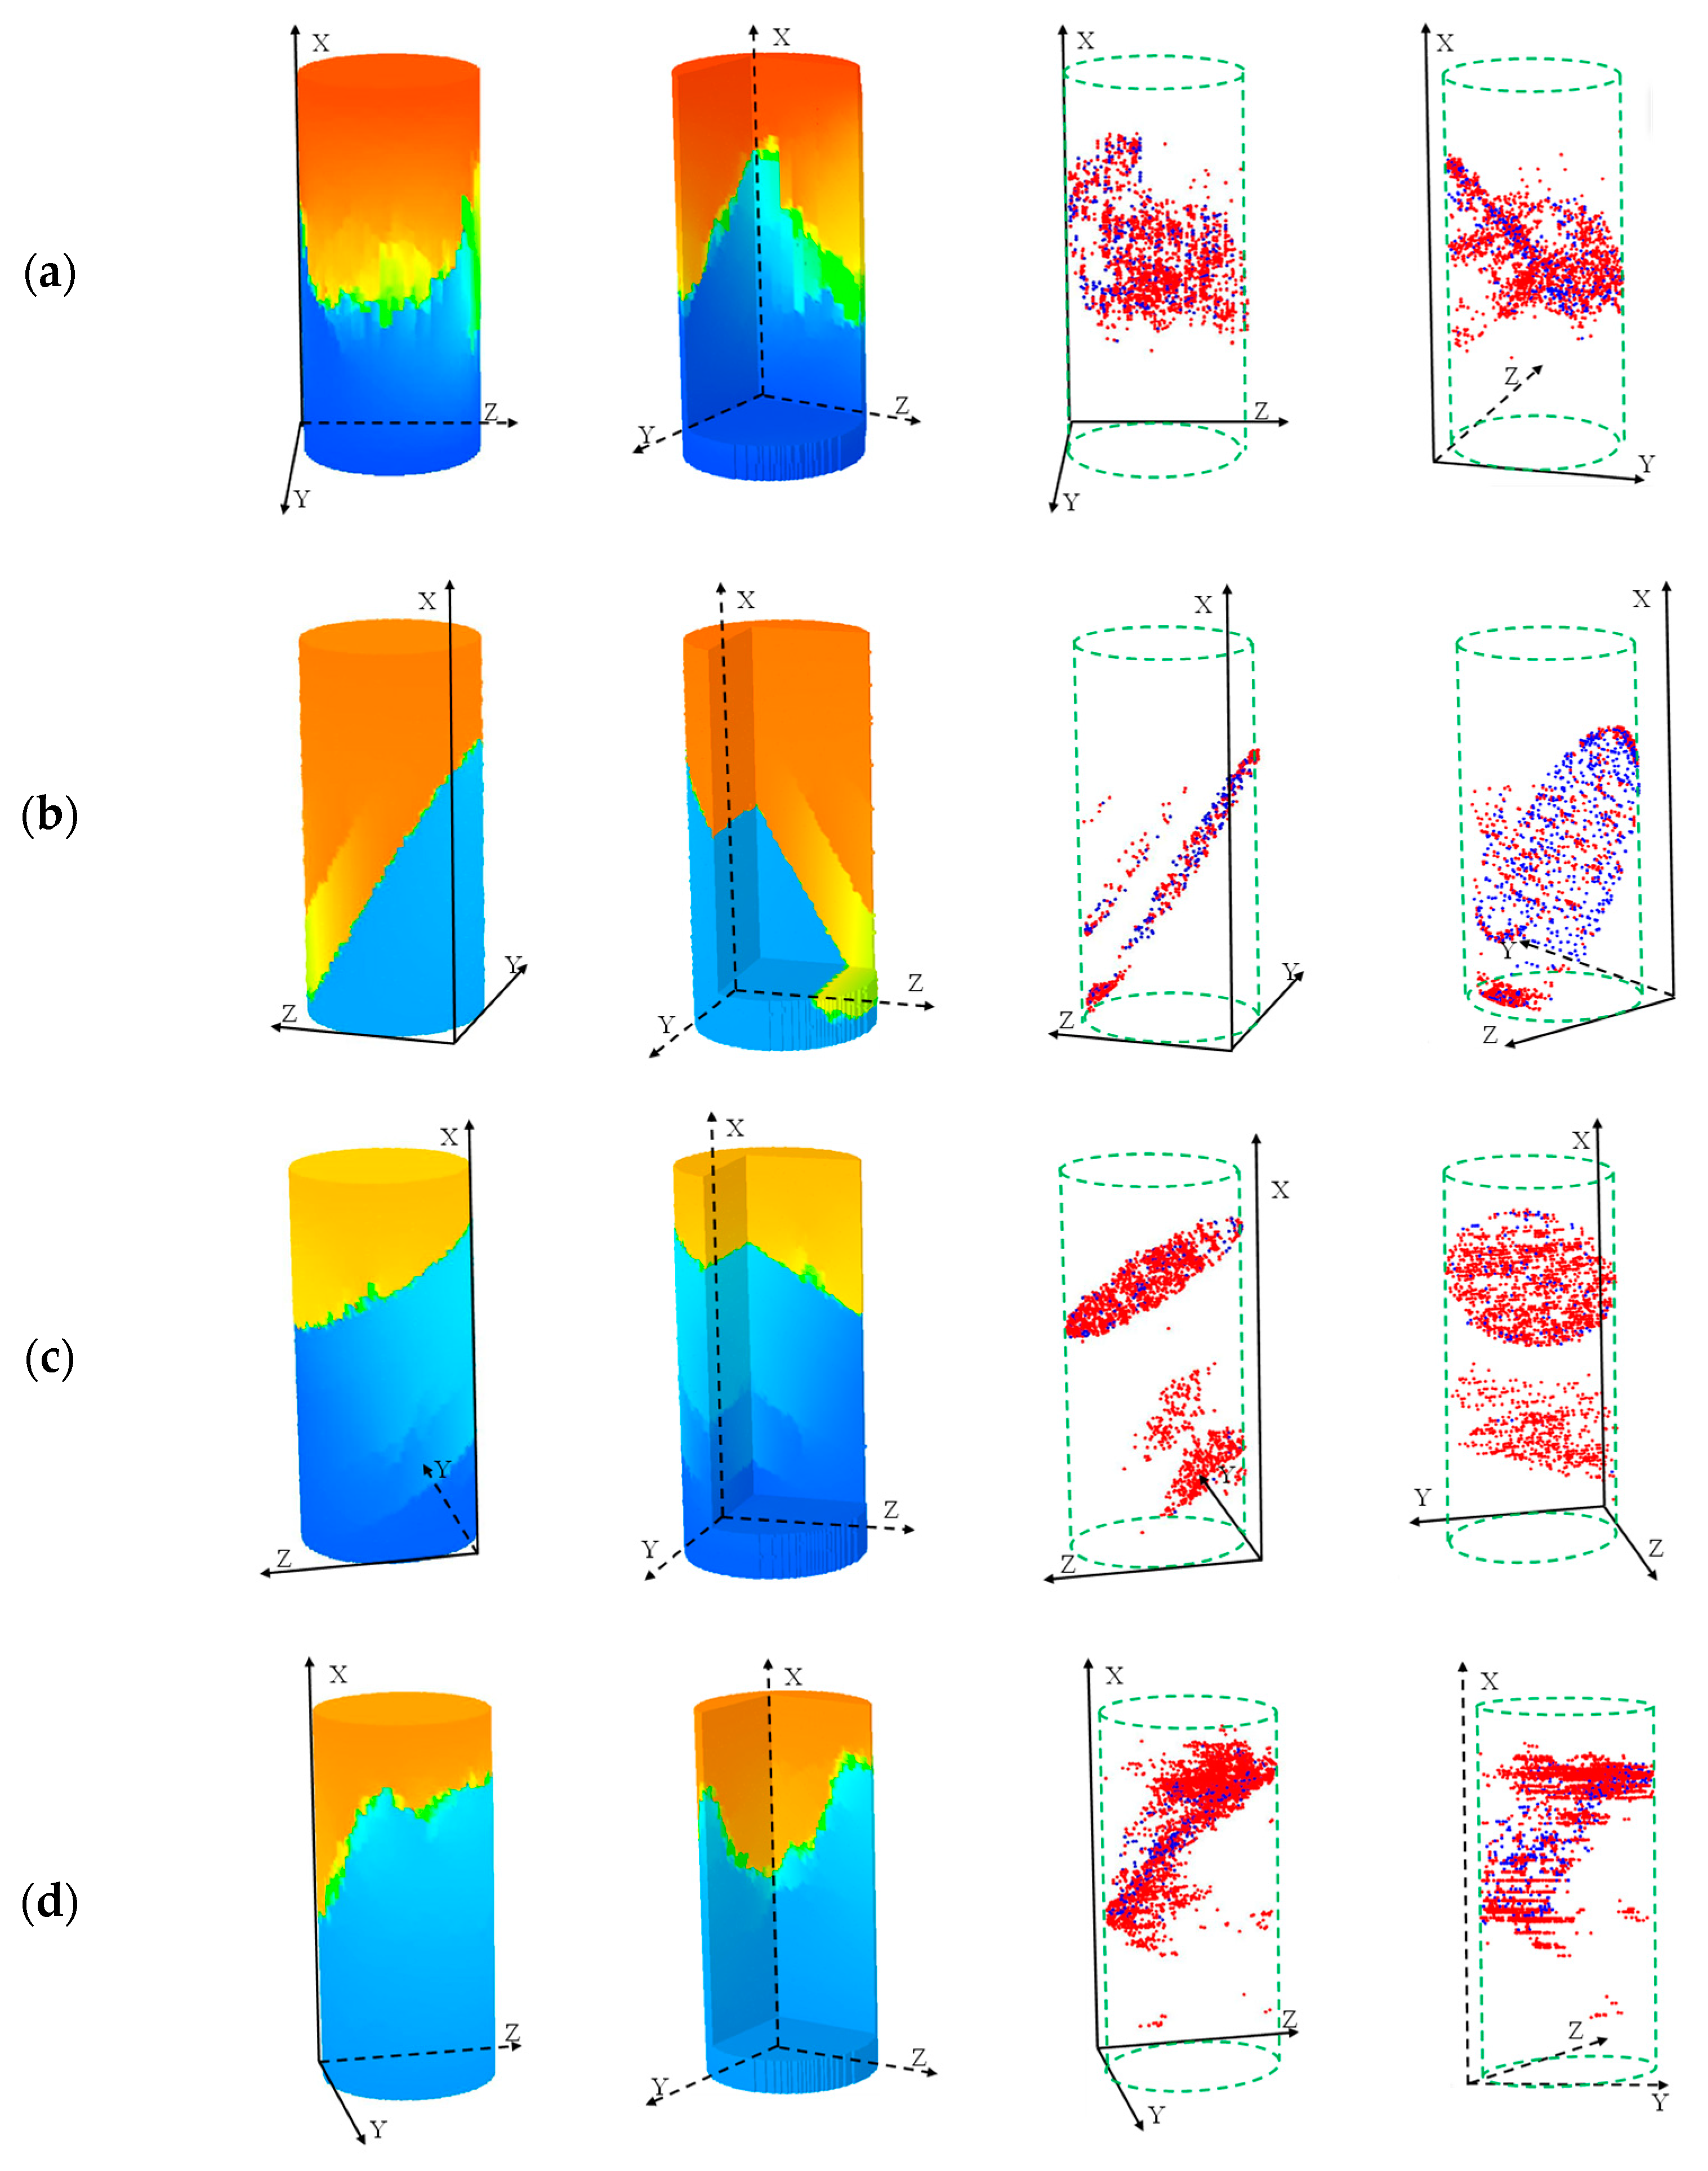
3.1.2. Anisotropic Characteristics of Failure Modes

Figure 9 illustrates the failure modes of shale under uniaxial compression at different bedding angles. Generally, the failure behavior of anisotropic rocks under compression is more complex than that of homogeneous rocks, with the crack initiation and propagation differing significantly from those in homogeneous rocks. For the three bedding orientations, the failure modes exhibit distinct anisotropic characteristics:
(1) Bedding Parallel to the Axial Force Direction: Shale experiences tensile splitting failure with a complex cross-sectional morphology in this configuration. The short cracks that form along the bedding planes intersect and develop into a more intricate crack network, leading to the specimen’s splitting failure. The primary crack direction aligns with the axial force. The AE data reveal a pronounced strip-like pattern, with signals concentrated in the middle of the specimen, showing both long and short signals along the bedding. This behavior occurs because, under axial compression, the vertical bedding breaks first, producing numerous microcracks. As stress increases, these microcracks interconnect, forming a crack network that causes specimen instability.
(2) Bedding at an Angle to the Principal Stress Direction: Under this condition, shear slip failure occurs along the bedding plane, causing the specimen to fracture into two larger pieces. The weak bonding of the bedding planes facilitates slip when the bedding and axial force form an angle, making it easy for cracks to propagate along the bedding plane under the applied forces. The crack initiation and growth occur along the bedding planes, resulting in a relatively simple crack morphology. At a 30° bedding angle, the failure path extends entirely along the bedding plane; at 60°, the failure path also follows the bedding, but a peak-shaped protrusion appears at a certain point. Acoustic emission signals during failure are distributed in an elliptical pattern, concentrated on the bedding plane, with the primary damage represented by a crack that penetrates the bedding.
(3) Bedding Perpendicular to the Axial Force Direction: In this case, a tension–shear composite failure mode develops, with cracks propagating along the bedding plane and the direction of axial force. Initially, cracks preferentially form along the weak bedding plane. As the stress increases, crack propagation gradually shifts toward the axial direction, eventually forming a serrated primary crack with high tortuosity. Acoustic emission data show that cracks parallel to the bedding direction primarily exhibit tensile failure, whereas cracks inclined to the bedding direction show increasing shear signals.
In summary, when the bedding angle is 0° or 90°, the destruction process is characterized by the competition between the bedding planes and the matrix under axial force, leading to progressive failure and a complex crack network. When the bedding angle is 30° or 60°, the bedding plane becomes the dominant failure plane under axial pressure, with destruction primarily occurring along the bedding plane, resulting in a more straightforward failure mode and lower strength.
Tensile failure is a significant failure mode for deep reservoir rocks. Figure 10 illustrates the failure mode of shale under tensile stress, along with the corresponding spatial distribution of AE signals. The results indicate that the weak bedding planes significantly influence the tensile failure behavior of shale. Layered shale exhibits more diverse failure modes than isotropic rock masses due to the presence of these weak bedding planes. These modes can be categorized as follows: (I) Z-shaped vertical splitting failure, (II) tensile fracture along the bedding plane, and (III) serrated progressive failure through the bedding.
Shale exhibits two failure modes: types I and III for bedding angles of 0°, 30°, and 90°. The failure section morphology is relatively complex, with a serrated structure observed, and the tensile strength is relatively high. In contrast, at a bedding angle of 60°, the bedding plane significantly influences the tensile failure process, predominantly resulting in type II failure. In this case, the fracture position depends on the location of the weaker bedding plane, making the exact position of the failure section more random. Figure 10c shows distinct cross-sections and AE signals from the sample’s upper, middle, and lower parts. Moreover, the different bedding angles lead to two distinct fracture forms. At low bedding angles, the crack cross-section exhibits a serrated failure form. As the bedding angle increases, the failure mode shifts toward the bedding plane, resulting in a smoother crack cross-section parallel to the bedding. This phenomenon reflects a change in the failure mechanism, driven by alterations in the bedding plane angle under tensile stress. This change is responsible for the pronounced strength and failure anisotropy observed in shale under tension loading conditions.
The spatial distribution characteristics of AE signals under different bedding angles reveal that damage predominantly occurs along the bedding planes. This is because the bond between bedding planes is weak, and under tensile stress, the cracks typically initiate and propagate along the bedding planes. At a 0° bedding angle, tensile cracks develop along both the bedding and the matrix. As a result, the difference in the crack and AE signal morphology shown in Figure 10a is more pronounced compared to the other three angles. In conclusion, weak bedding planes in shale lead to significant anisotropy during tensile failure.

3.2. Triaxial Loading Conditions

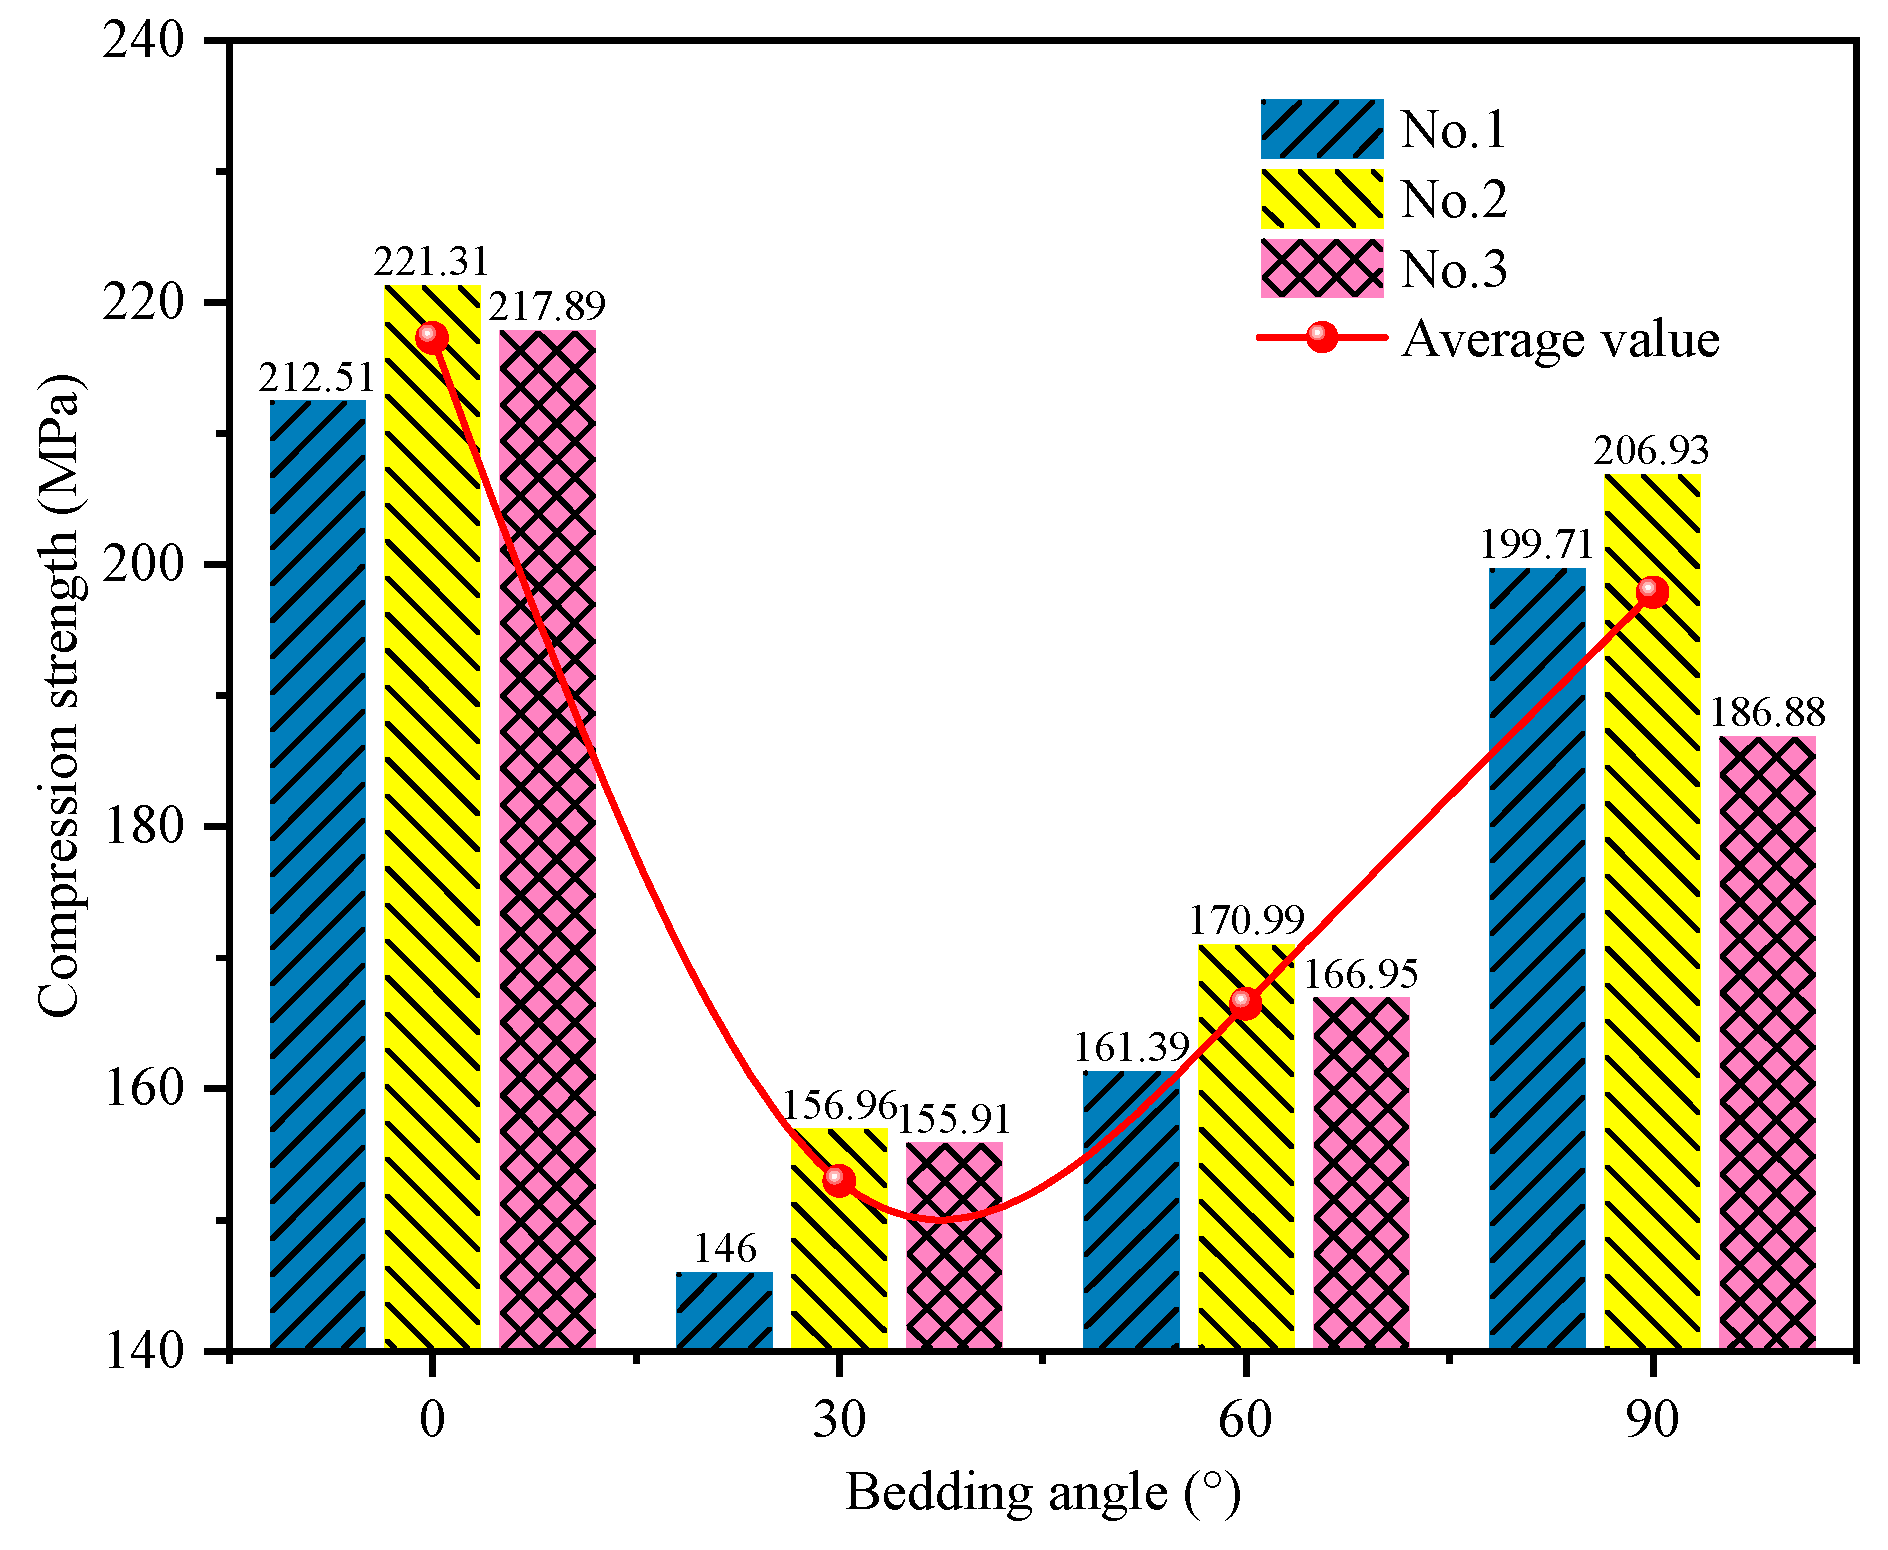
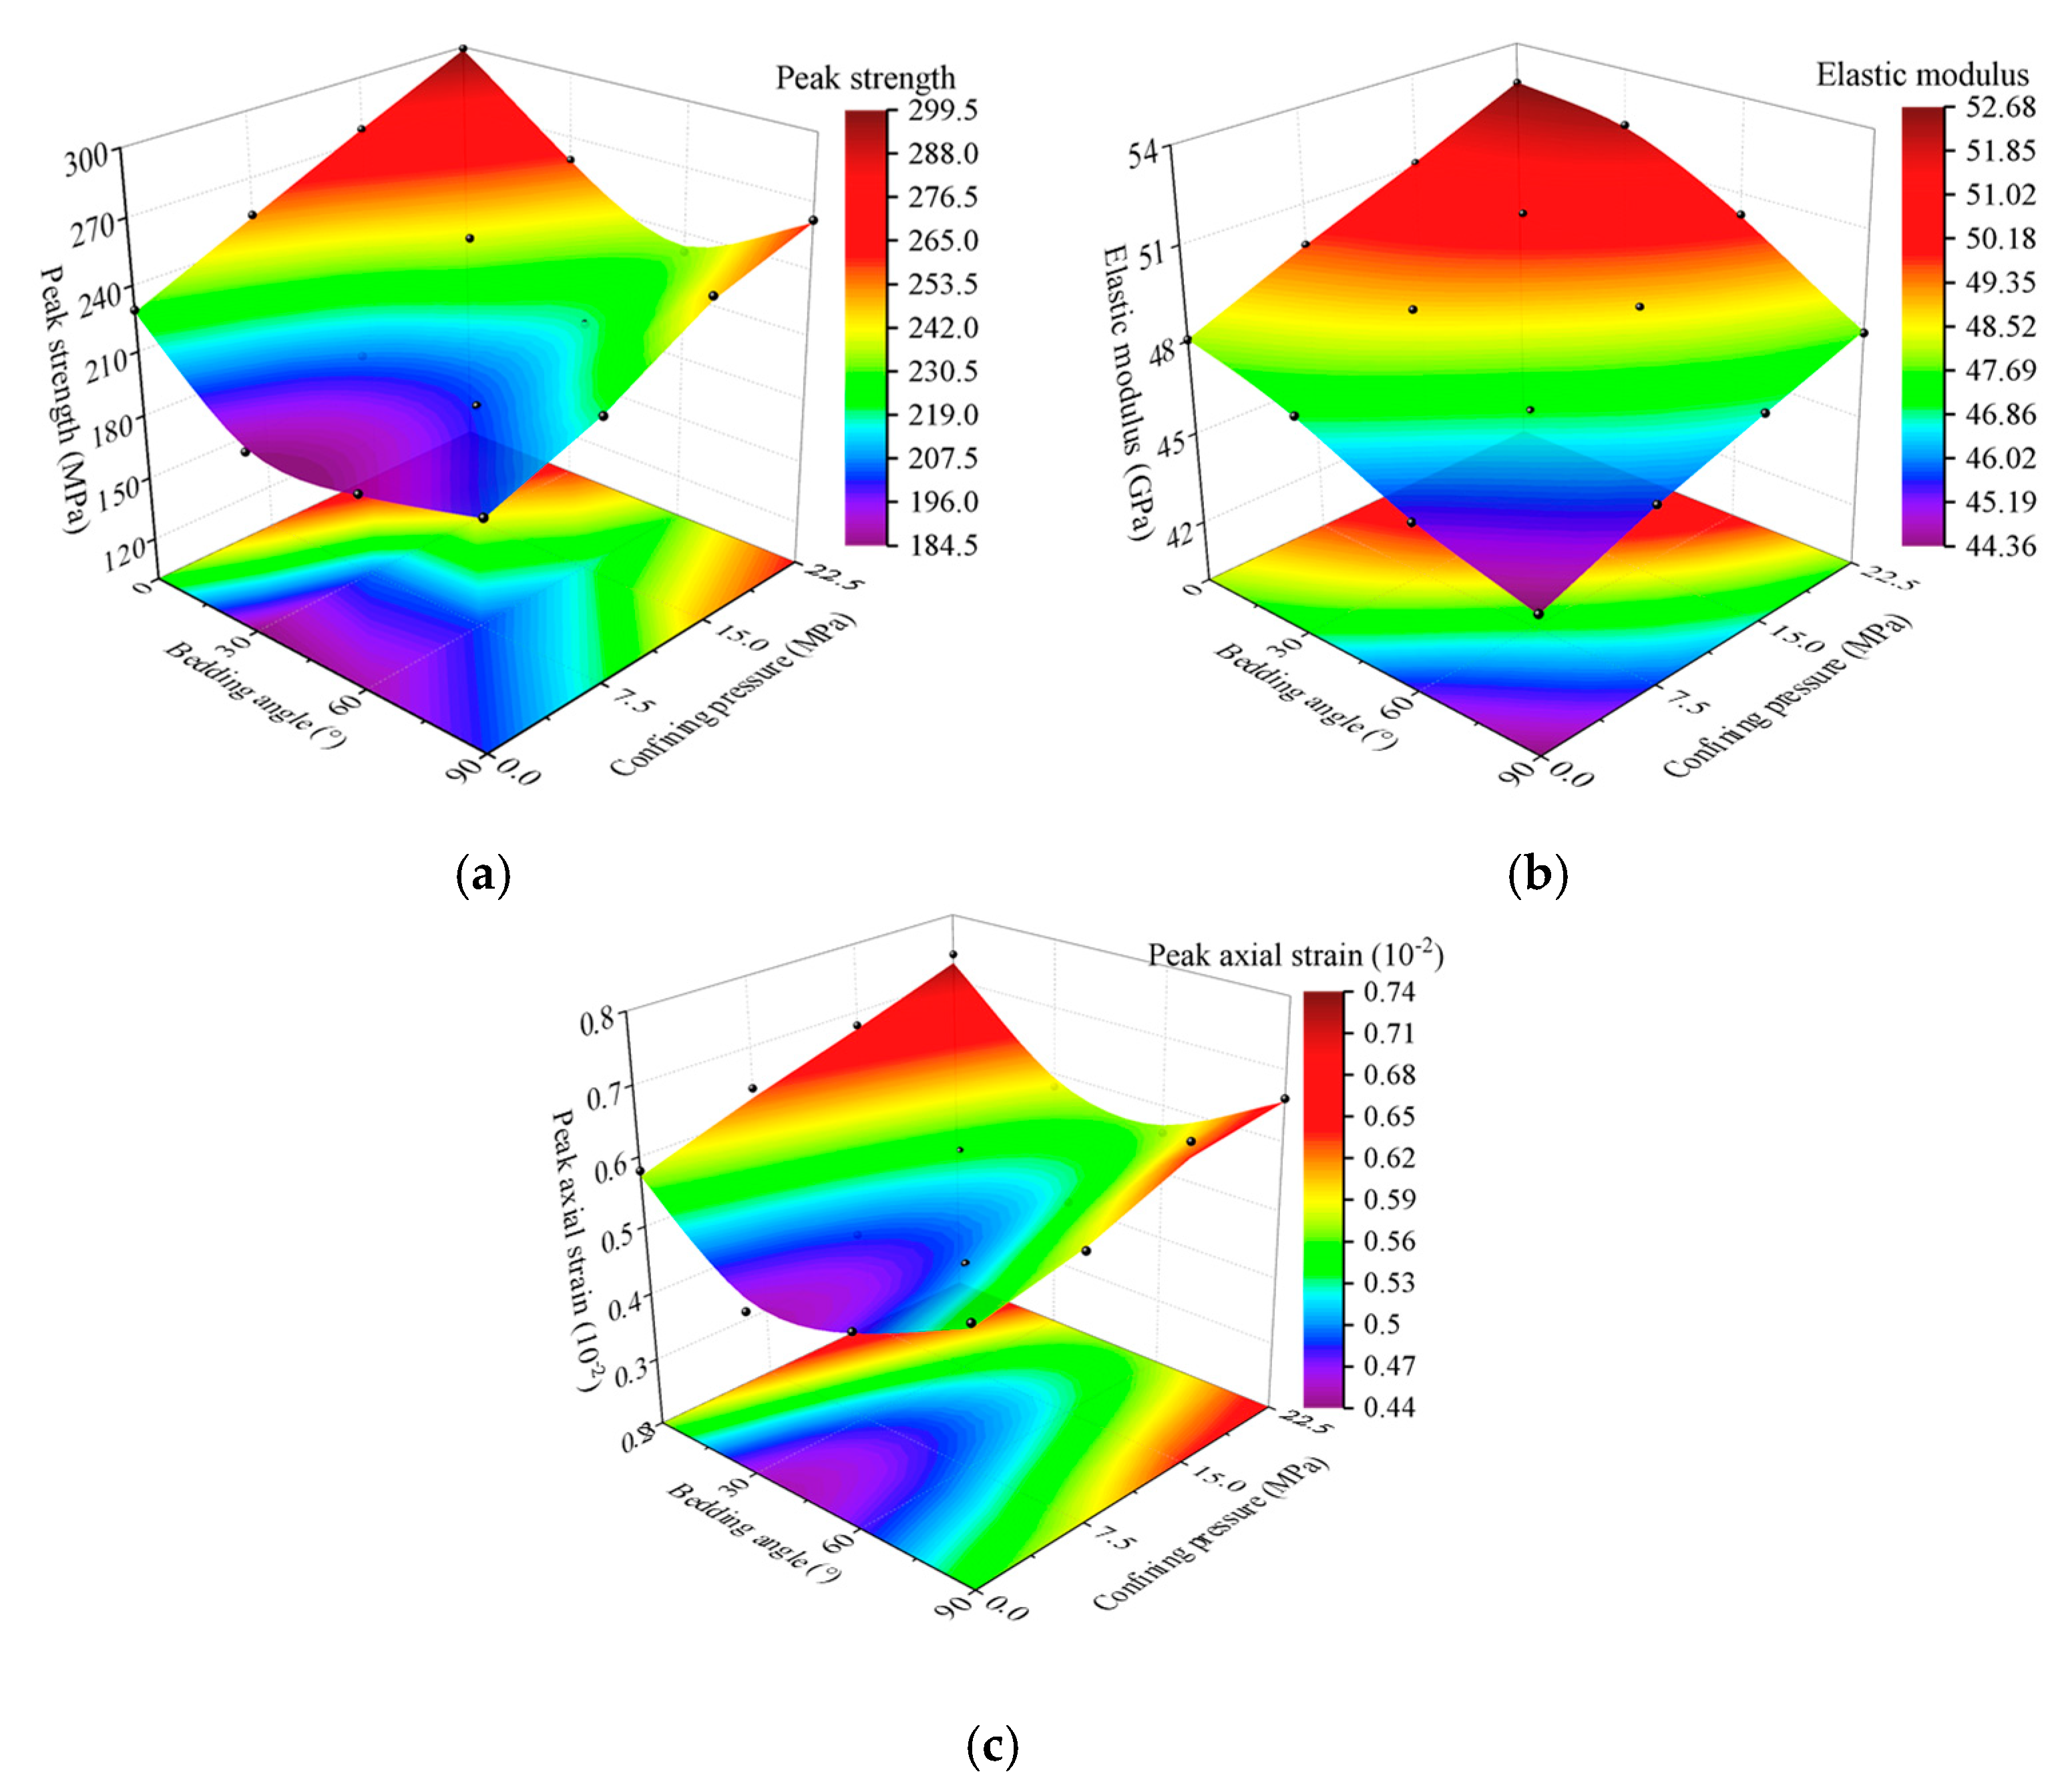
3.2.1. Mechanical Properties

Figure 11a illustrates the influence of different confining pressures and bedding angles on the compressive strength of shale. Across varying confining pressures, the trend in compressive strength is consistent with that observed in uniaxial compression tests. Regardless of the confining pressure, the compressive strength is highest when the bedding is parallel to the loading axis and lowest when the bedding is inclined. As the bedding angle increases, the compressive strength exhibits a “U”-shaped trend, first decreasing and then increasing, demonstrating significant bedding effects and anisotropy. Furthermore, as the confining pressure increases, the compressive strength shows a noticeable increase. At a confining pressure of 22.5 MPa, the growth rates of shale strength for bedding angles of 0°, 30°, 60°, and 90° are 30.75%, 40.20%, 22.52%, and 29.47%, respectively. Among these, the growth rate is significantly higher at a 30° bedding angle and lowest at 60°. This phenomenon can be attributed to the complex stress states of shale under triaxial conditions compared to uniaxial stress. During loading, the force components acting on the bedding planes vary in direction and magnitude, explaining why inclined bedding exhibits lower strength than parallel and perpendicular orientations.
Figure 11b presents the variation in the elastic modulus of shale with the bedding angle and confining pressure under triaxial conditions. Both the confining pressure and bedding angle significantly influence the elastic modulus. With an increasing confining pressure, the elastic modulus at various bedding angles rises, although the rate of increase gradually slows. As the bedding angle increases, the increase in the elastic modulus diminishes. This is because, compared to the shale matrix, the deformation of bedding planes under pressure is more pronounced. When parallel to the bedding plane, the confining pressure imposes the most significant constraint, whereas perpendicular bedding experiences minimal influence from confining pressure, resulting in relatively more minor changes in the elastic modulus.
Figure 11c shows the peak strain of shale, which exhibits pronounced anisotropy at different bedding angles. The effect of the confining pressure on the peak strain is most significant at a bedding angle of 0° and gradually diminishes as the bedding angle increases. At a bedding angle of 90°, the peak strain changes minimally across different confining pressures. This behavior arises because the bedding has a greater capacity for deformation, and high confining pressures can somewhat suppress bedding deformation. When the bedding angle is 90°, the confining pressure acts perpendicular to the bedding plane, resulting in a higher peak strain. As the bedding angle increases, the suppressive effect of the confining pressure diminishes. When the bedding is vertical (0°), the confining pressure’s impact on the bedding plane is minimal, leading to a more pronounced anisotropy in the peak strain.
The relationship between the maximum principal stress σ1 and the minimum principal stress σ3 can be expressed using the Mohr–Coulomb criterion as follows:
σ 1 = 1 + sin φ 1 sin φ σ 3 + 2 c cos φ 1 sin φ
where φ represents the angle of internal friction, and c denotes the cohesion.
The cohesion c and internal friction angle φ of shale can be calculated using the linear fitting curve of compressive strength based on Equation (10) to evaluate the material’s shear performance. Figure 12a depicts the linear fitting curves of compressive strength for different bedding angles under triaxial conditions. The correlation coefficients exceed 0.98 for all cases, indicating a strong linear fit. The shear strength parameters of shale at various bedding angles are obtained by substituting the slope and intercept of the linear expressions into Equation (10). Figure 12b presents the cohesion and internal friction angle calculated using the Mohr–Coulomb criterion. The results reveal significant differences in the shear strength parameters across bedding angles, primarily due to variations in the orientation of the weak bedding plane relative to the axial force. These differences result in anisotropic mechanical properties and distinct failure mechanisms. Notably, at a bedding angle of 30°, the cohesion is only 50.94 MPa, significantly lower than at other angles. This behavior is attributed to the weak bonding within the bedding plane, which has a reduced capacity to resist shear stress and is prone to shear slip failure during loading.

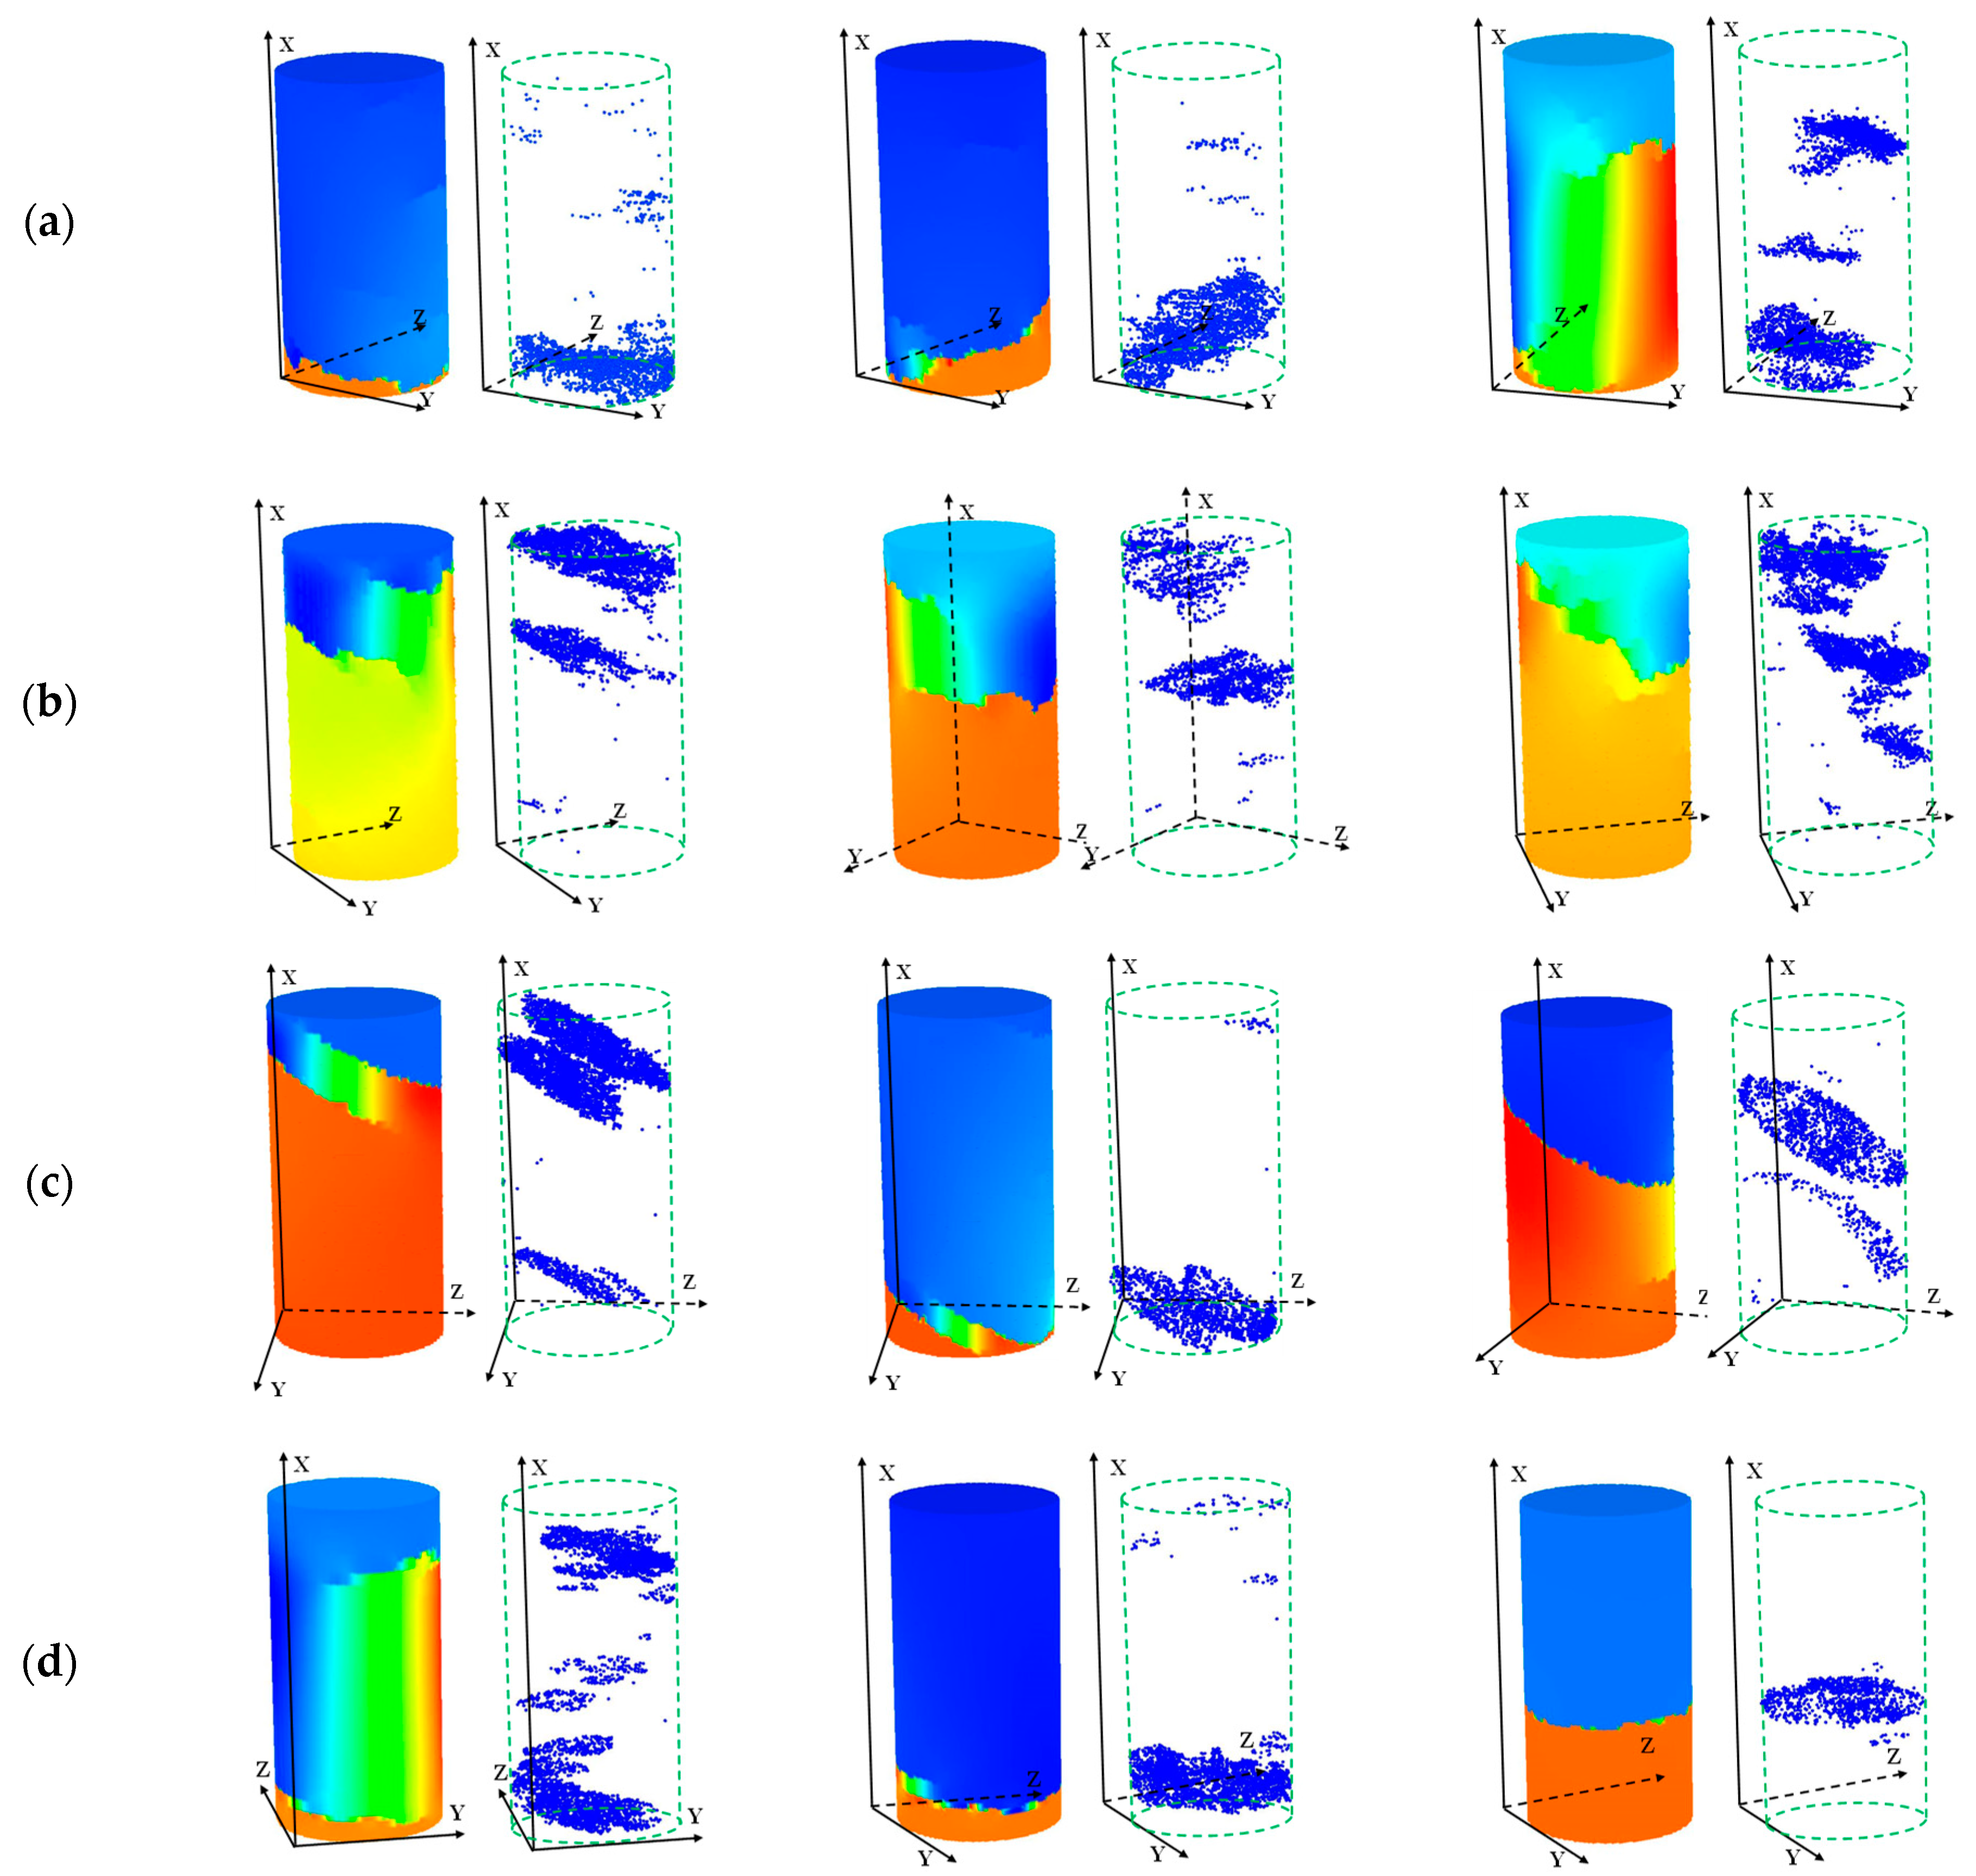
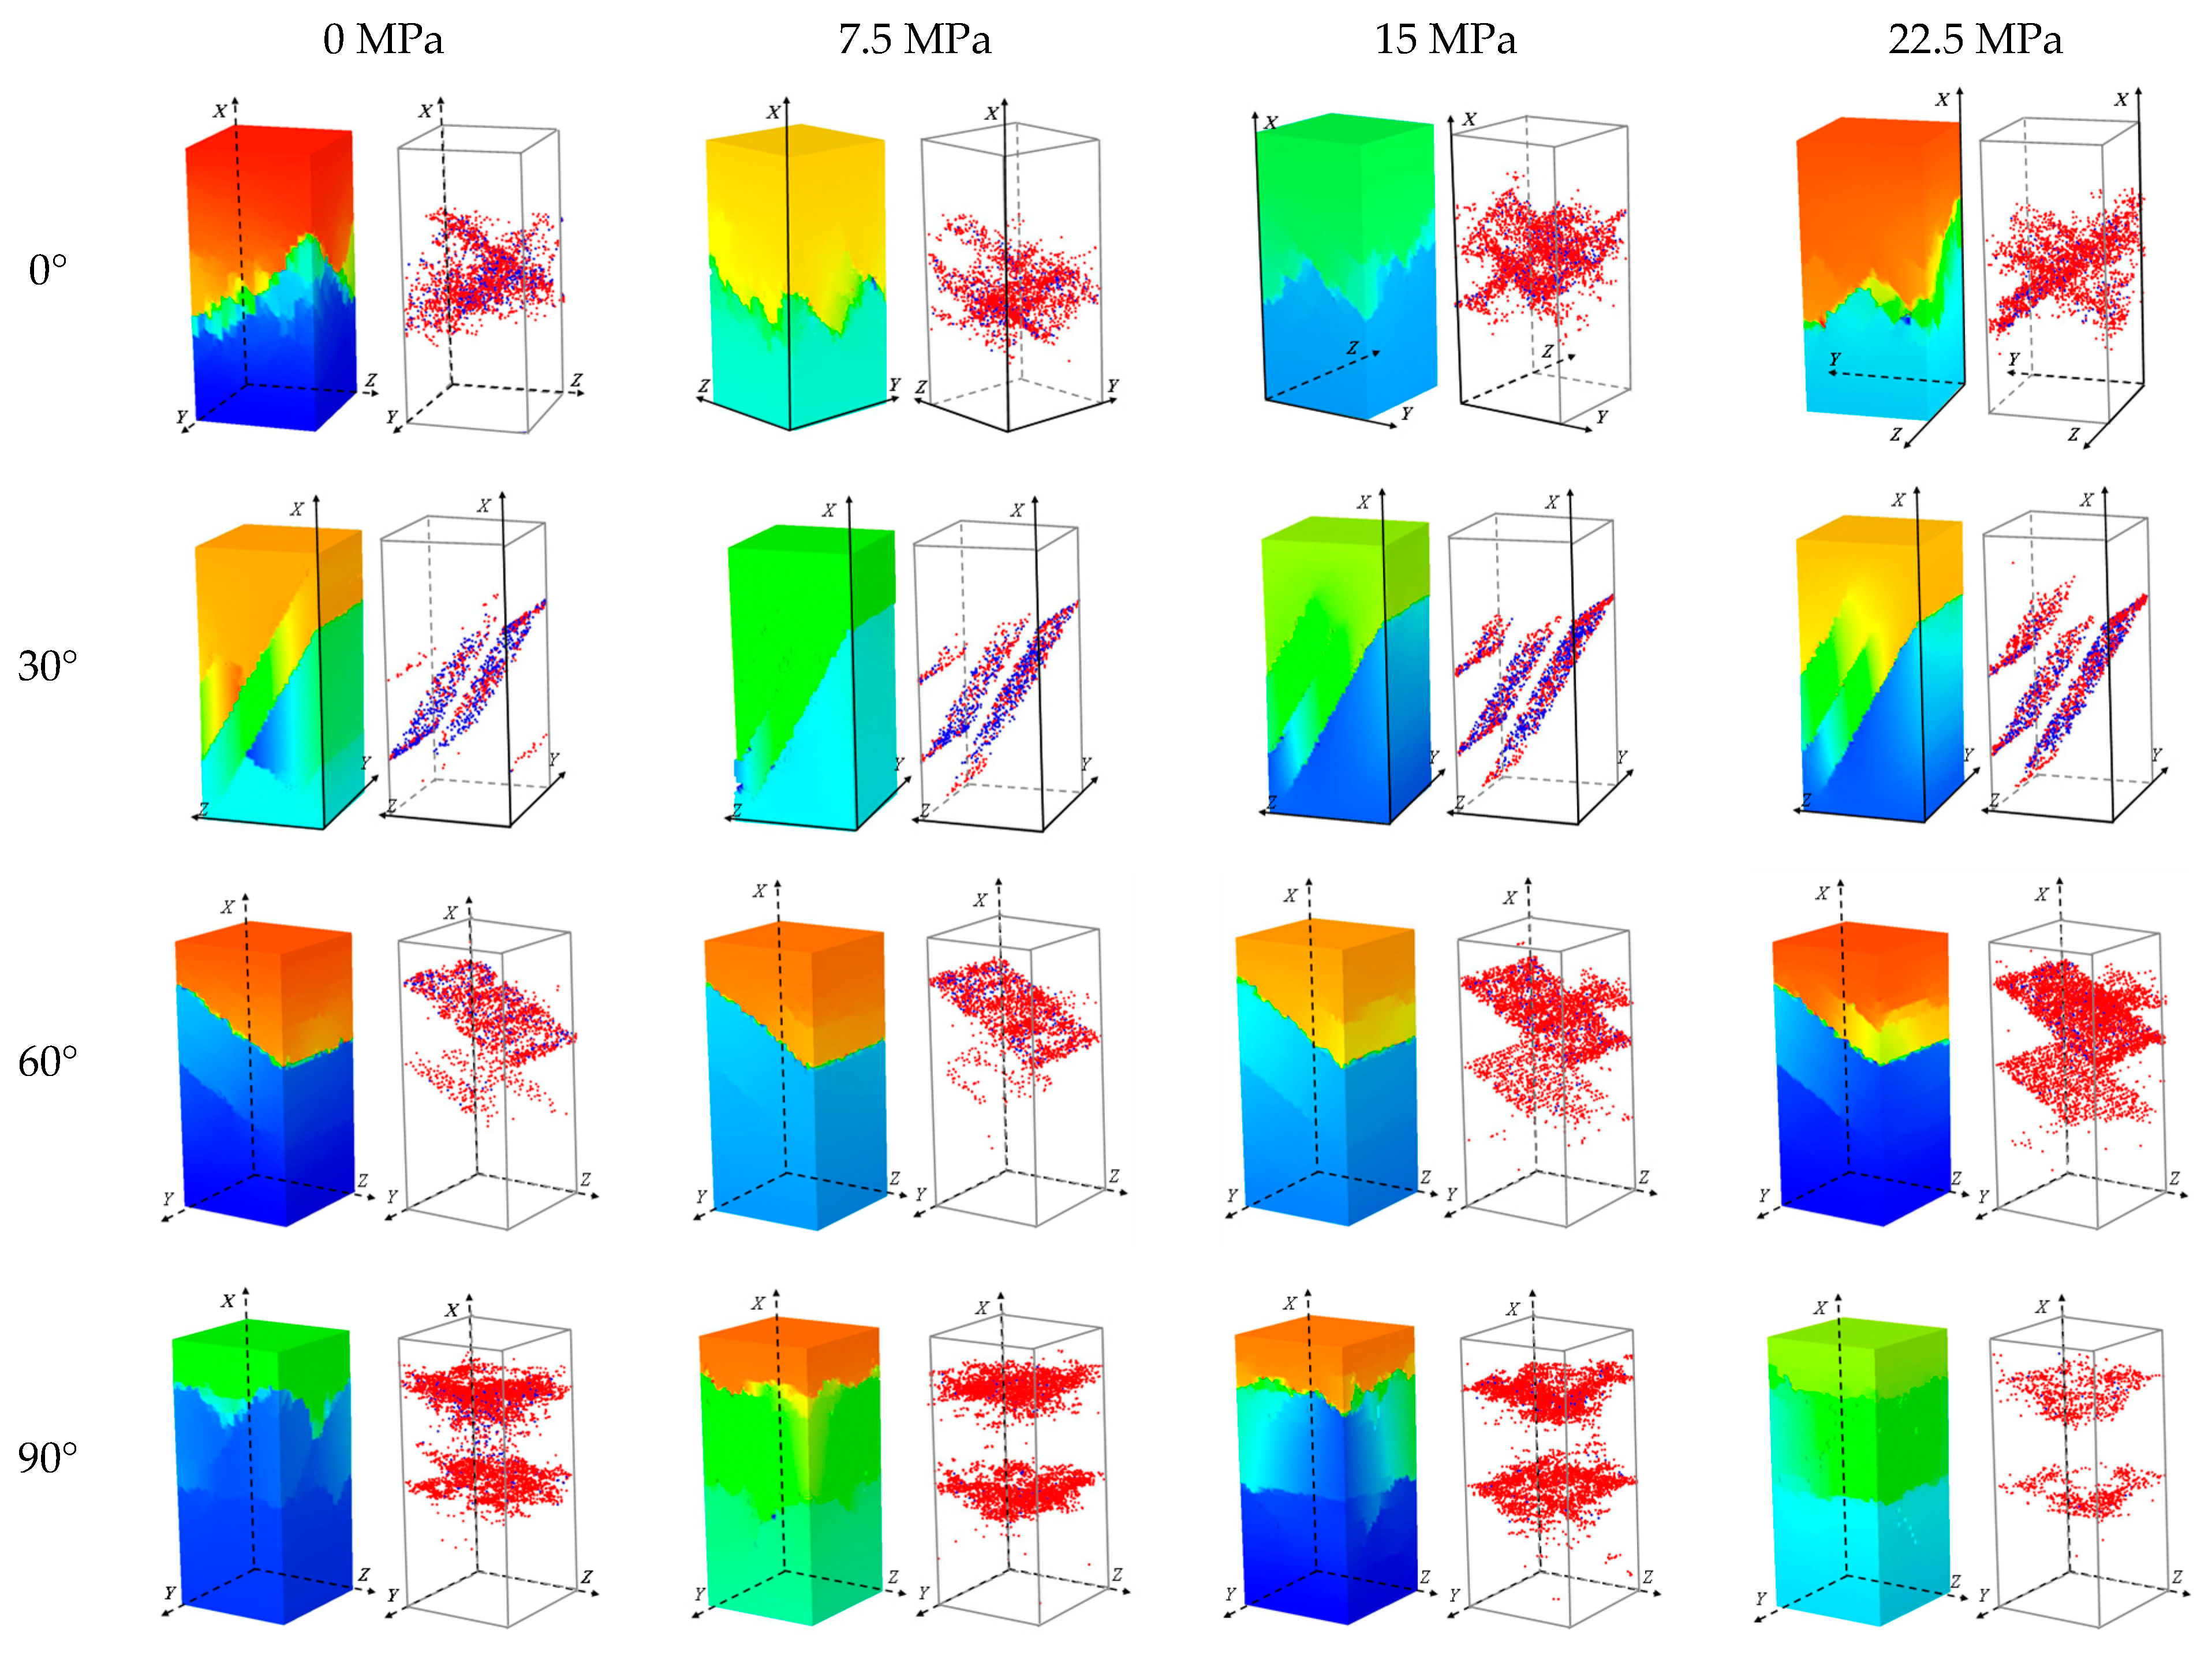
3.2.2. Failure Modes

Figure 13 illustrates the failure modes of shale under triaxial compression at different bedding angles. As the confining pressure increases, the failure mode transitions from brittle to ductile, predominantly characterized by shear failure. At a bedding angle of 0°, where the bedding plane is parallel to the axial force, the failure manifests as conjugate shear failure controlled by the matrix. With an increase in the confining pressure, the failure mode evolves into shear cracking. The acoustic emission signal distributions indicate that, under uniaxial compression, numerous microcracks form a complex crack network. As the confining pressure rises, the shear crack morphology becomes more defined. At a confining pressure of 22.5 MPa, a well-defined three-dimensional X-shaped conjugate shear crack emerges. At bedding angles of 30° and 60°, the failure is predominantly characterized by shear slip along the bedding plane, resulting in relatively simple crack morphologies, typically a single shear plane. Due to the weak strength of the bedding plane, the compressive strength is lowest in this failure mode. For specimens with a 90° bedding angle, failure involves a combination of cracking along the bedding and shear cracks penetrating the specimen, forming macro-cracks typical of vertical-bedding shale; under high confining pressures, suppressing crack initiation and propagation at 90° bedding results in flatter crack morphologies.
In summary, under triaxial loading conditions, the shale strength improves significantly while its degree of anisotropy decreases. As the confining pressure increases, the failure modes transition toward single-shear failure, and the crack propagation pattern shifts from disordered to more organized single-shear cracks. Overall, higher confining pressures suppress the formation and propagation of internal microcracks, thereby reducing the anisotropy of shale failure behavior.

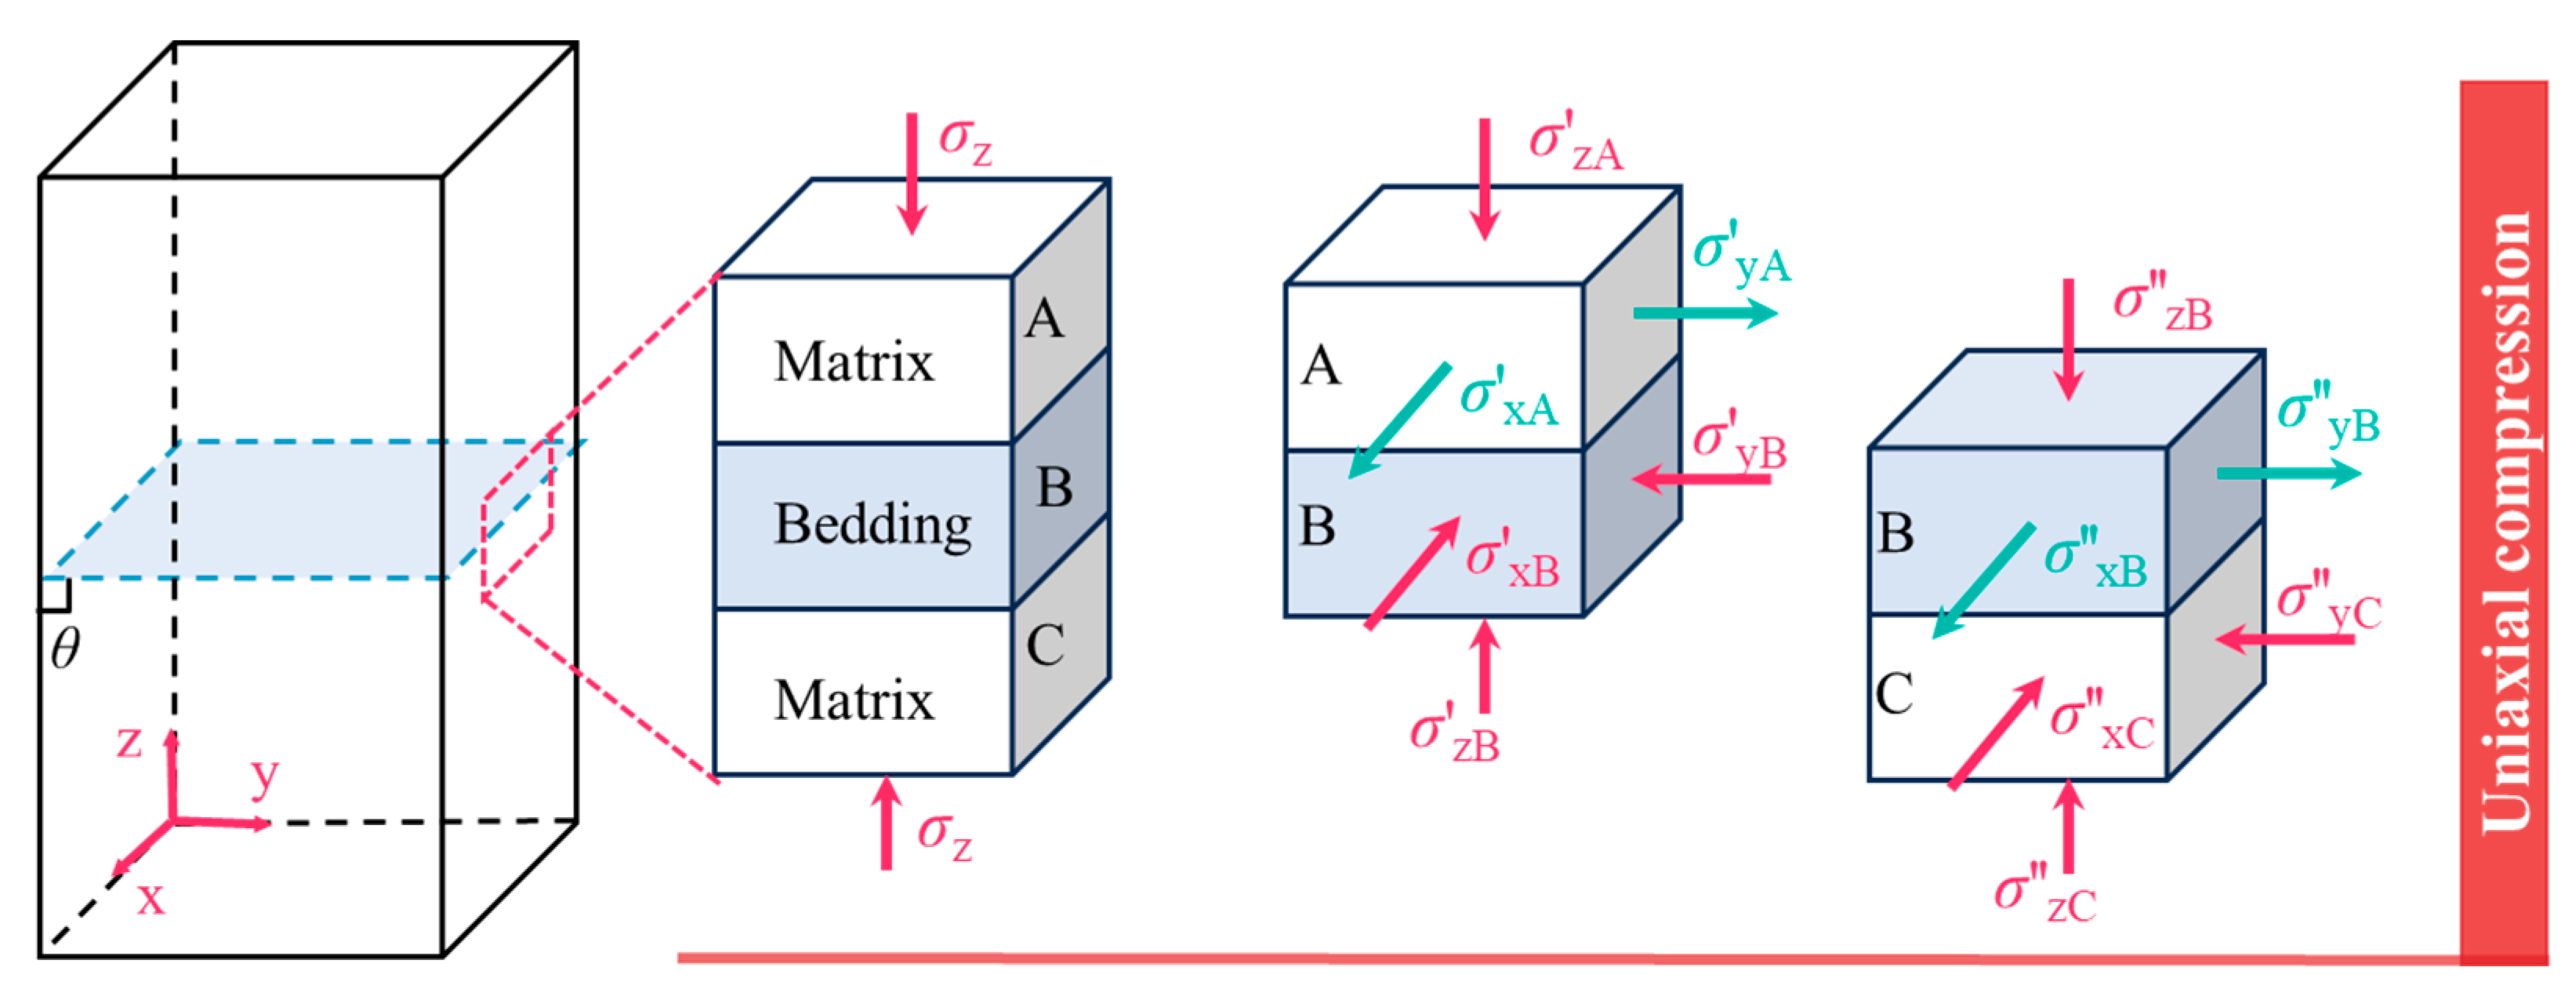
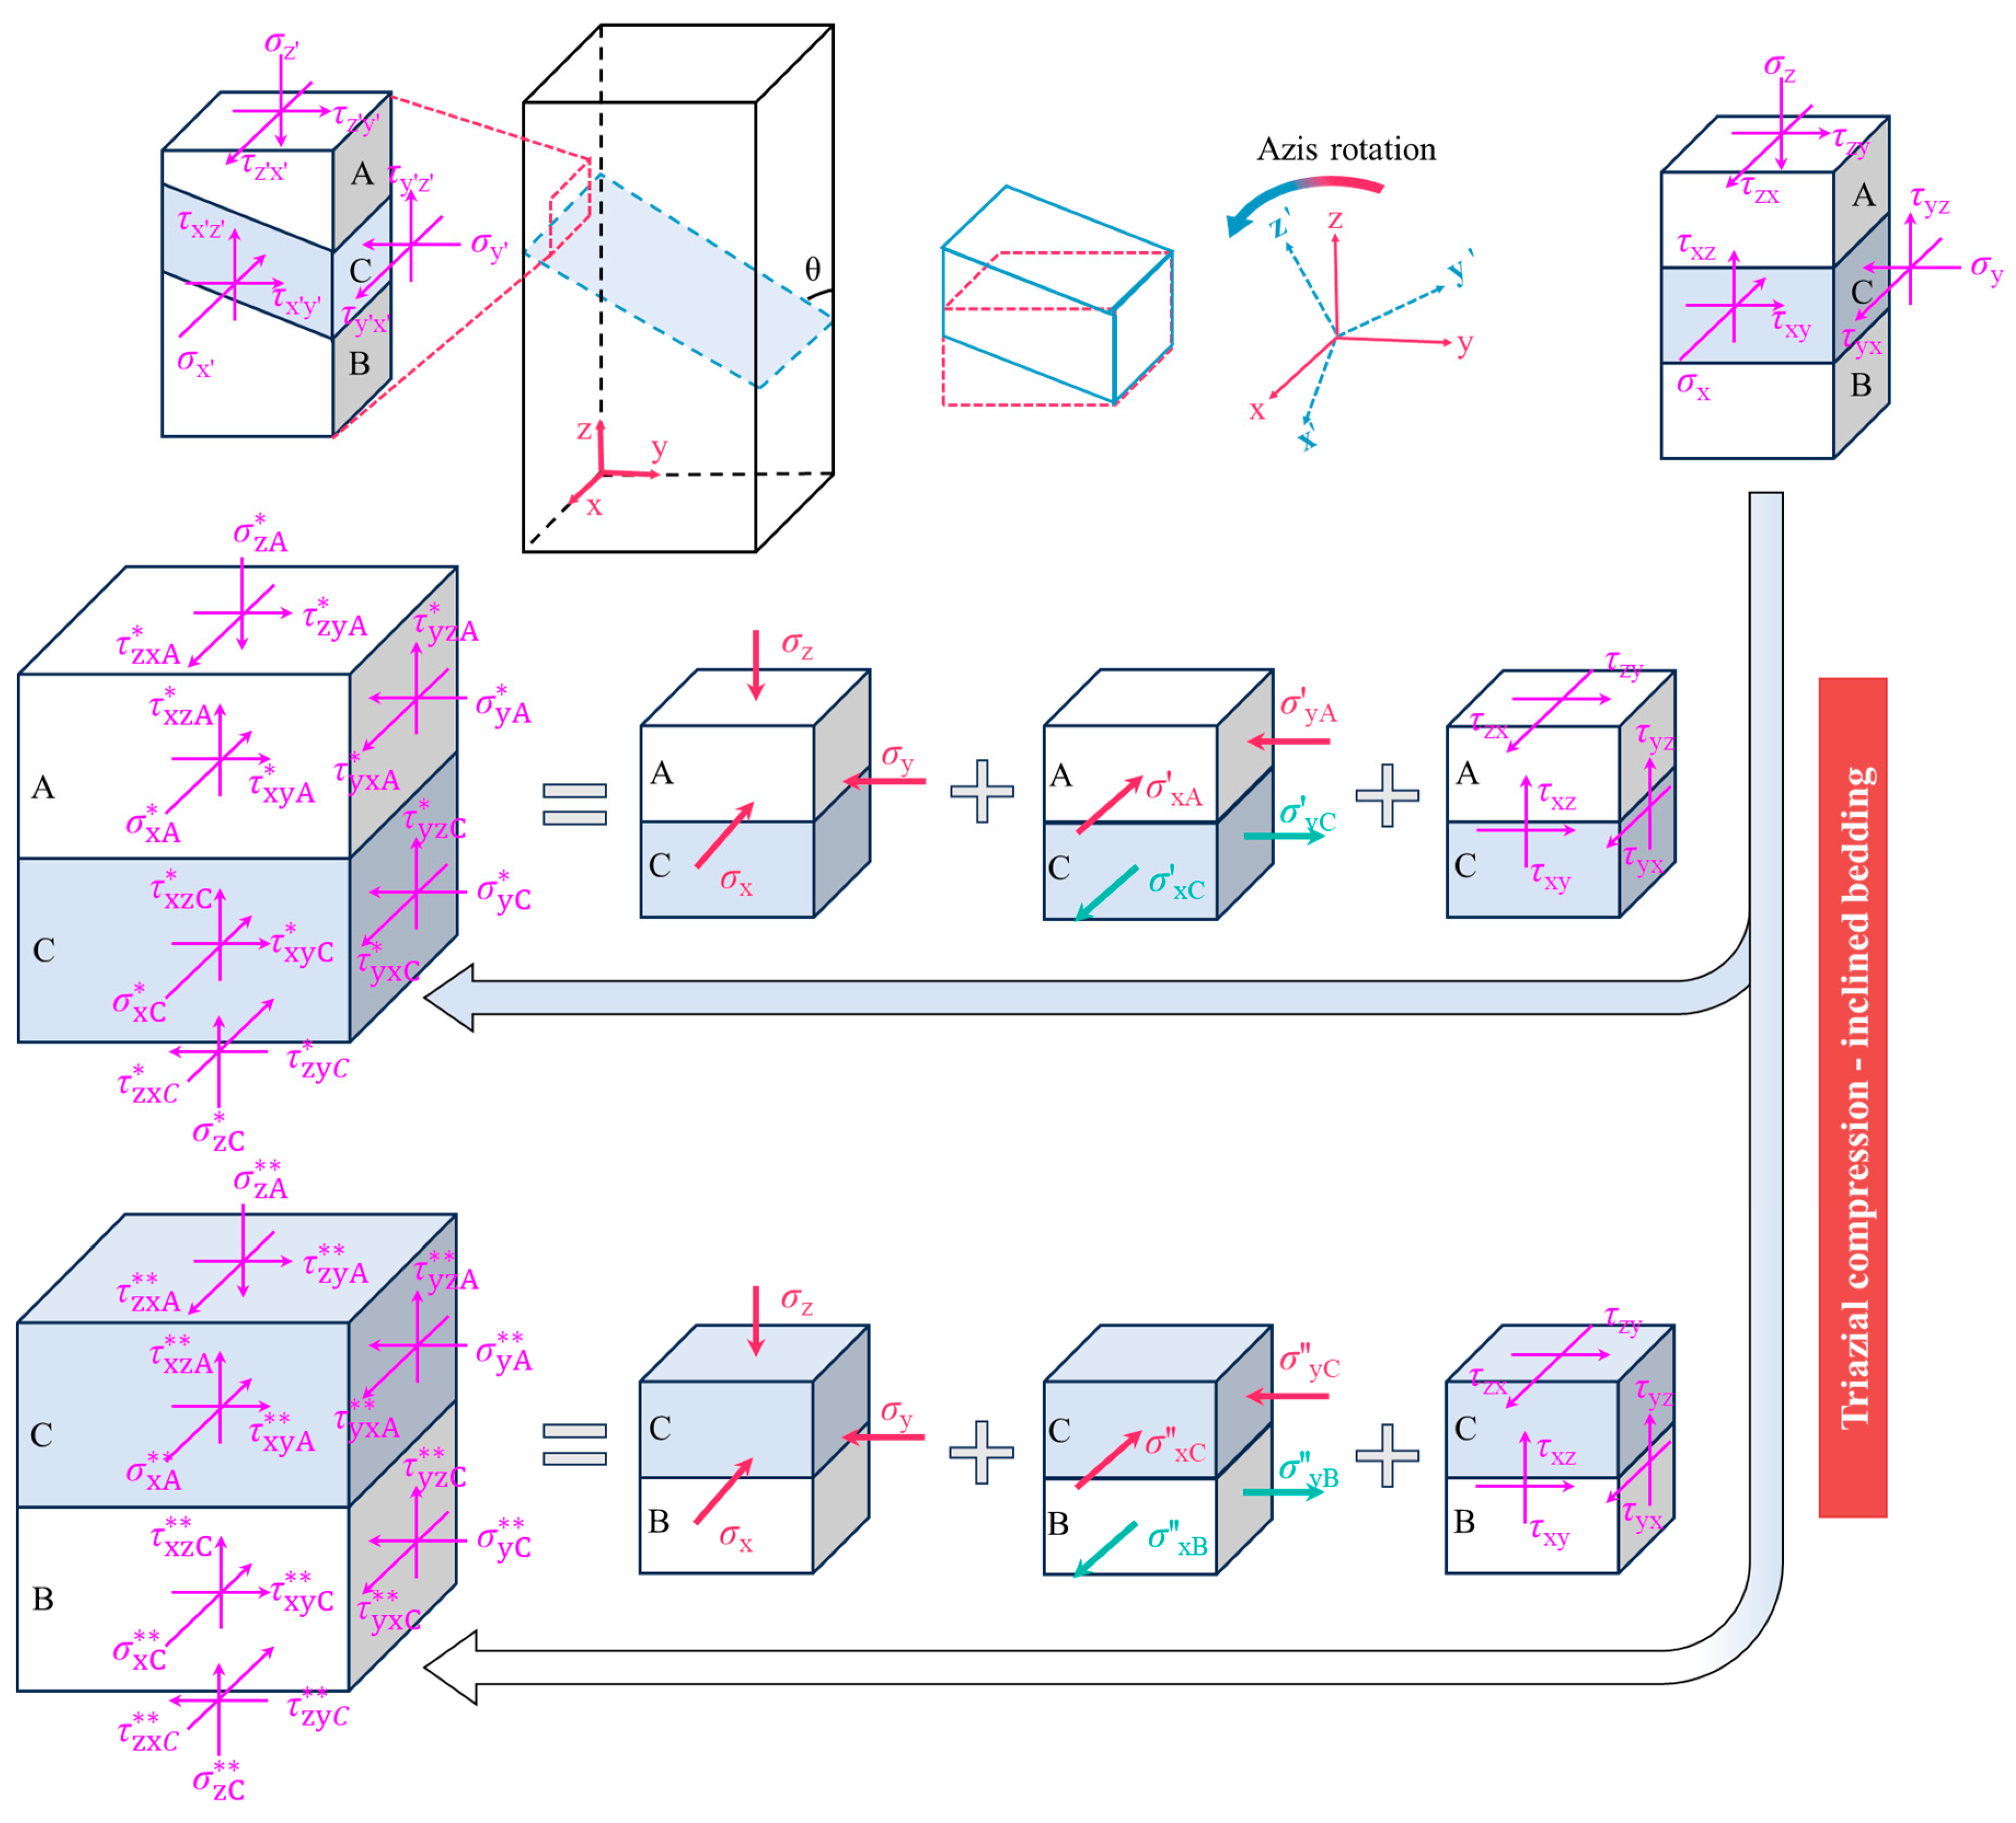
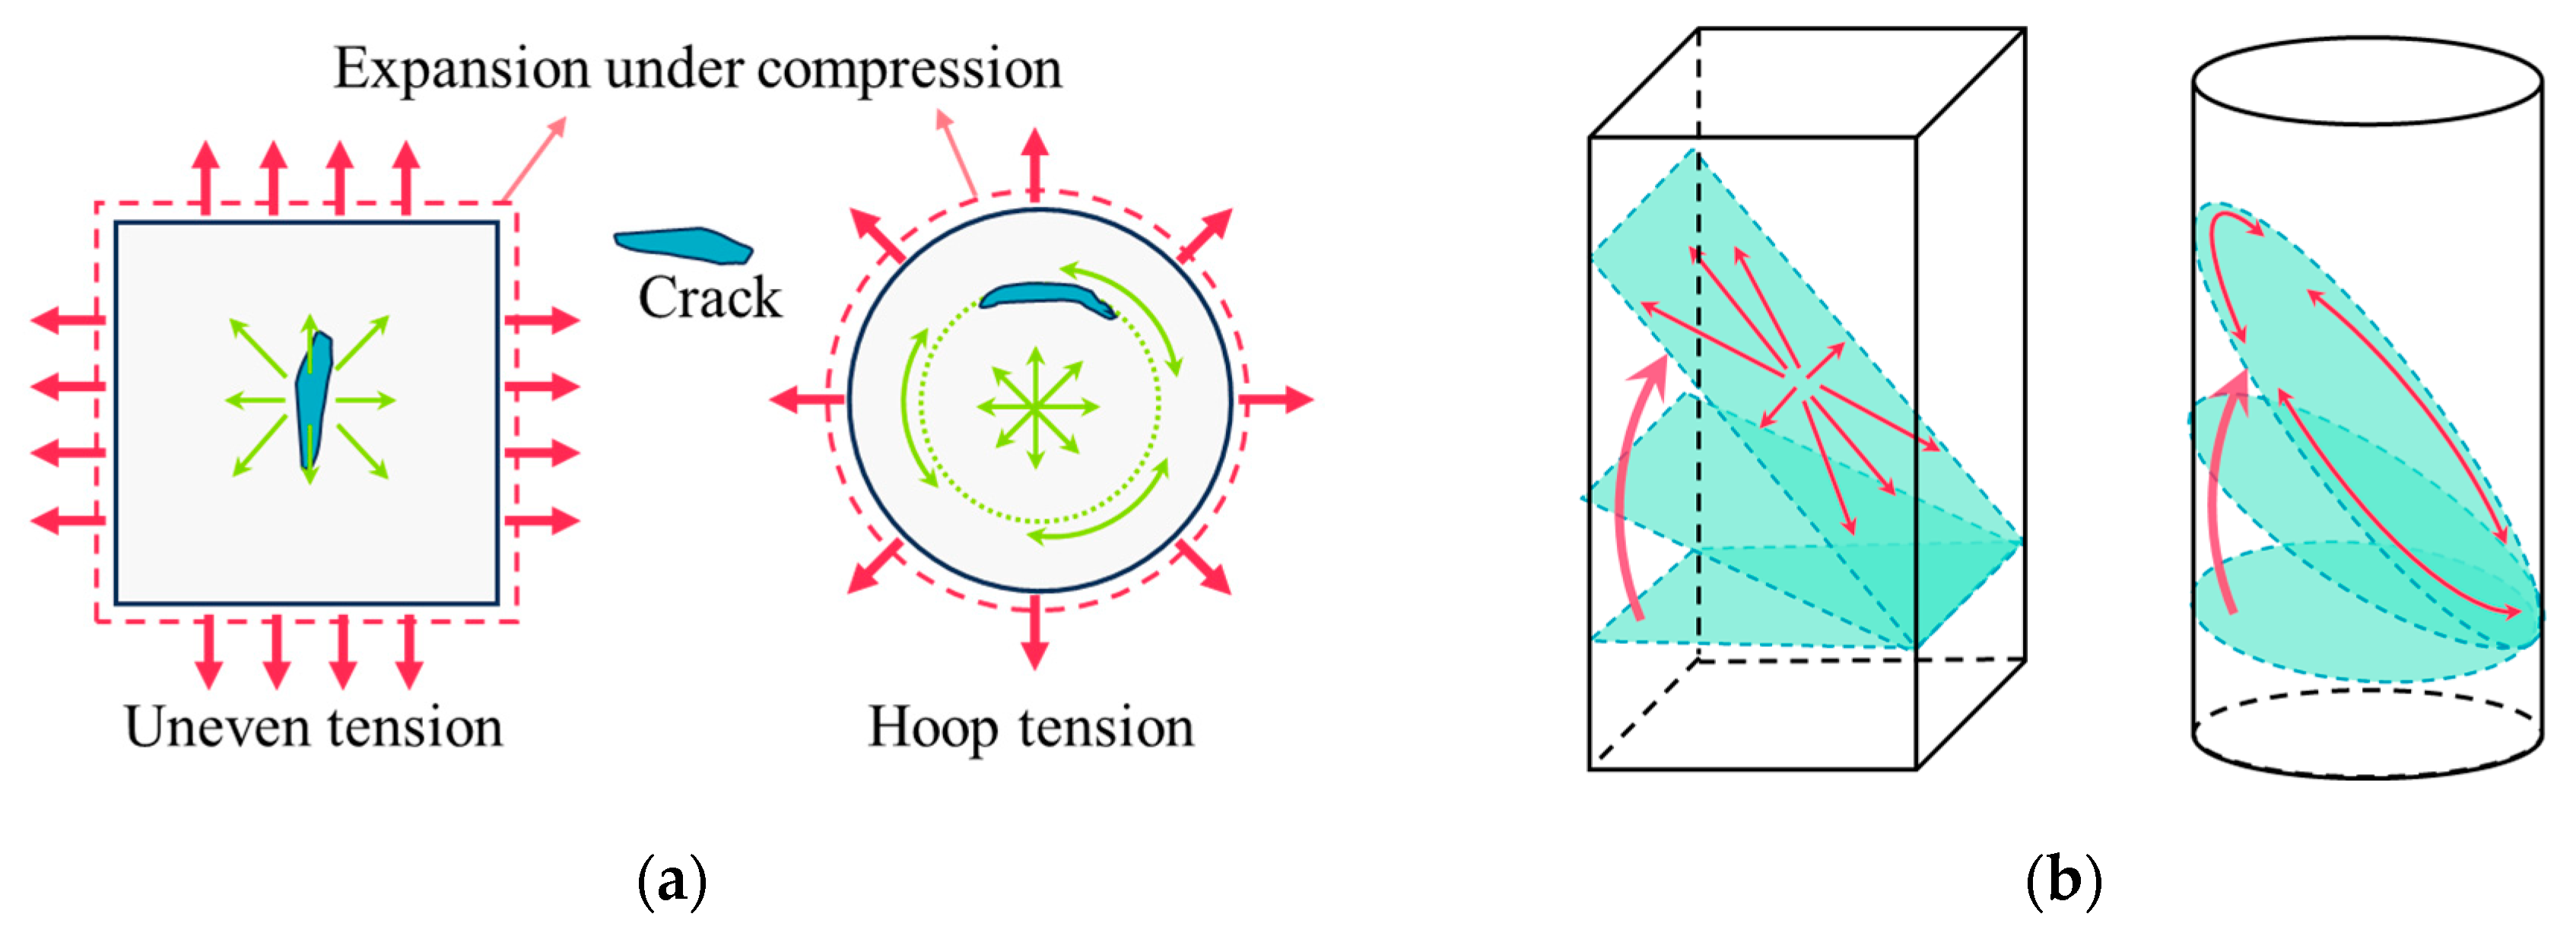
3.3. Mechanical Analysis Under Compression Conditions

The anisotropic behavior of shale under different loading conditions fundamentally originates from the mechanical property differences between bedding planes and the matrix in layered rock. As inherent weak structural surfaces within shale, bedding planes exhibit significant differences in stiffness, strength, and deformation characteristics compared to the matrix. These disparities directly influence stress transmission and distribution, ultimately governing the overall mechanical response of the rock. Due to this heterogeneity in mechanical properties, the failure modes of shale under varying stress states become more complex, exhibiting multiple mechanisms such as shear failure, tensile failure, or composite failure, as previously discussed. Therefore, a systematic analysis of the internal stress state of layered rocks under different loading conditions is essential for a comprehensive understanding of their failure mechanisms.
Figure 14 illustrates the schematic representation of shale under uniaxial stress, with a matrix–bedding–matrix cross-layered structure extracted within the shale. When subjected to axial force, strain differences in the horizontal direction induce frictional constraint stresses of equal magnitude but opposite directions at the contact surface. If assuming the following relationships for the elastic modulus and Poisson’s ratio, A (matric) = C (bedding plane) > B (matric) for the elastic modulus and A = C < B for the Poisson’s ratio, the horizontal strain relationship becomes C = A < B. As a result, for parts A and B, under the action of axial compressive stress σz, the frictional constraints on the matrix induce tensile stress states ( σ x A and σ y A ), while frictional constraints on the bedding plane induce compressive stress states ( σ x B and σ y B ).
Due to the strain differences, parts A and B transition from a unidirectional compressive stress state to a three-dimensional stress state: matrix A experiences a combined compressive–tensile state, while the bedding plane is purely compressive. For regions outside the contact surface, the unidirectional compressive stress caused by σz is maintained, unaffected by frictional constraints. Similarly, frictional constraints arise for parts B and C due to strain differences between the two regions. The frictional constraints on bedding B result in tensile stress states ( σ x B and σ y B ), while those on the matrix induce compressive stress ( σ x C and σ y C ). Consequently, the bedding plane changes from a unidirectional compressive state to a three-dimensional compressive–tensile stress state, and the matrix transitions from a unidirectional compressive state to a three-dimensional compressive stress state. Parts B and C remain in the unidirectional compressive stress outside the contact surface. If the friction coefficients on the upper and lower sides of bedding B are the same, then the stress states at the contact surfaces between parts A and B and between parts B and C will be identical—both exhibit three-dimensional stress states. These states significantly differ from the unidirectional compressive stress state outside the contact surfaces.
The stress state at the contact surfaces between the bedding and the matrix undergoes significant changes: a complex compressive–tensile stress state forms at the contact surface, influenced by frictional constraints. In regions outside the contact surface, the rock maintains a uniaxial compressive stress state unaffected by frictional constraints. Therefore, the failure mode of horizontally bedded shale under uniaxial compressive stress is closely linked to the bedding structure, with the presence of bedding planes substantially reducing the overall strength of the rock mass. When the axial compressive stress σz exceeds the minimum strength threshold within the shale, shear failure occurs. This manifests macroscopically as shear cracks propagating along the bedding plane in the direction of axial stress (Figure 9d).
Figure 15 illustrates the stress state of horizontally layered shale under triaxial compression, where the horizontal strain relationships are consistent with those observed under uniaxial compression. From the schematic of the layered structure, it is evident that, in addition to the axial compressive stress σz, triaxial compression is also influenced by the combined effects of horizontal compressive stresses σx and σy. For clarity, the structure is divided into parts A (matric) and C (bedding plane) and parts B (matric) and C. Due to differences in horizontal strain, frictional constraint stresses are generated at the contact surfaces between parts A and C. Specifically, the matrix is subjected to compressive stress states ( σ x A and σ y A ), while the bedding plane experiences tensile stress states ( σ x C and σ y C ). Consequently, the actual stress state is the superposition of the original stress and the frictional constraint stresses. As depicted, the frictional constraint stress increases the horizontal stress states ( σ x A * and σ y A * ) in the matrix beyond the original horizontal stresses σx and σy, with increments of σ x A and σ y A , respectively. Conversely, the horizontal stresses σ x C * and σ y C * in the bedding plane are reduced compared to the original stresses, with reductions of σ x C and σ y C , respectively.
Thus, at the contact surface between parts A and C, the stress state is influenced by the frictional constraint stress. In contrast, the area outside the contact surface remains unaffected by these constraints, with the triaxial stresses remaining at σx, σy, and σz. Similarly, at the contact surface between parts B and C, the frictional stresses on the matrix are compressive stress states ( σ x B and σ y B ), while those on the bedding plane are tensile stress states ( σ x C and σ y C ). As a result, the horizontal stress in the matrix increases from σx and σy to σ x B * * and σ y B * * , with increments of σ x B and σ y B , respectively. The horizontal stress in the bedding plane decreases from σx and σy to σ x C * * and σ y C * * , with reductions of σ x C and σ y C , respectively. Therefore, the frictional constraint stress causes the stress state at the contact surface between B and C to differ from that outside the contact surface.
From this analysis, it is found that the confining pressure greatly complicates the stress state of shale under triaxial compression. However, a comparative study of the uniaxial and triaxial stress states reveals certain similarities: the failure characteristics of horizontally bedded shale are closely linked to its layered structure, particularly at the contact areas between the bedding and the matrix. For horizontally bedded shale, frictional constraint stress alters the stress distribution at the contact surface between the bedding and the matrix while the confining pressure further complicates the stress state. The confining pressure enhances the shale’s strength and inhibits crack propagation, thereby limiting the formation of shear cracks and altering the macroscopic crack morphology (Figure 13).
The inclined layered structure extracted from the shale consists of three parts: A (matric), B (bedding plane), and C (matric). As shown in Figure 16, under the action of stress components σx’, σy’, σz’, τx’y’, τy’z’, and τz’x’, the stress state on each part of the contact surface differs significantly from the stress state outside the contact surface. The stress state analysis of inclined bedding is more complex. To simplify the analysis, the inclined layered structure can be rotated to convert it into a horizontally layered structure. The rotated structure is then subjected to compressive stresses σx’, σy’ and σz’, and shear stresses τx’y’, τy’z’ and τz’x’, where the compressive stresses generate frictional constraint stresses at the contact surfaces, and the shear stresses induce shear strain.
The analysis process for inclined bedding is analogous to that for horizontal bedding. Due to the differing mechanical properties of the bedding and the matrix, strain differences are induced, resulting in frictional constraint stresses. For parts A and C, the area outside the contact surface is influenced by σx, σy, σz, τxy, τyz, and τzx. In contrast, at the contact surface, the matrix experiences compressive stress states ( σ x A and σ y A ) due to frictional constraints, and the bedding plane experiences tensile stress states ( σ x c and σ y c ) due to the same effect. Consequently, in the case of inclined bedding, the stress state at the contact surface between the rocks exhibits significant three-dimensional stress characteristics. The actual normal stresses σ x A * and σ y A * in the matrix are more significant than the normal stresses σxA and σyA outside the contact surface, while the actual normal stresses σ x C * and σ y C * in the bedding plane are lower than the normal stresses σxC and σyC outside the contact surface. Similarly, the actual stress combines normal, shear, and frictional constraint stress at the contact surface between parts B and C. The normal stress in matrix B is reduced by σ x B and σ y B , while the normal stress in bedding plane increases by σ x C and σ y C . Outside the contact surfaces of parts B and C, the stress conditions remain as they are outside the contact surfaces of parts A and C.
In summary, frictional constraint stress significantly alters the stress distribution at the contact surface between the bedding and matrix for inclined bedding shale, complicating the overall stress state. Moreover, the failure behavior of inclined bedding shale is not only dependent on the strength of the bedding and matrix themselves. Still, it is also closely related to the effects of shear stress. The presence of shear stress leads to a failure mechanism distinct from that of horizontally bedded rock masses. Compared to horizontally bedded shale, inclined bedding shale is more prone to shear slip along the bedding planes during failure, macroscopically manifested as slip failure along the bedding planes (Figure 9 and Figure 13).

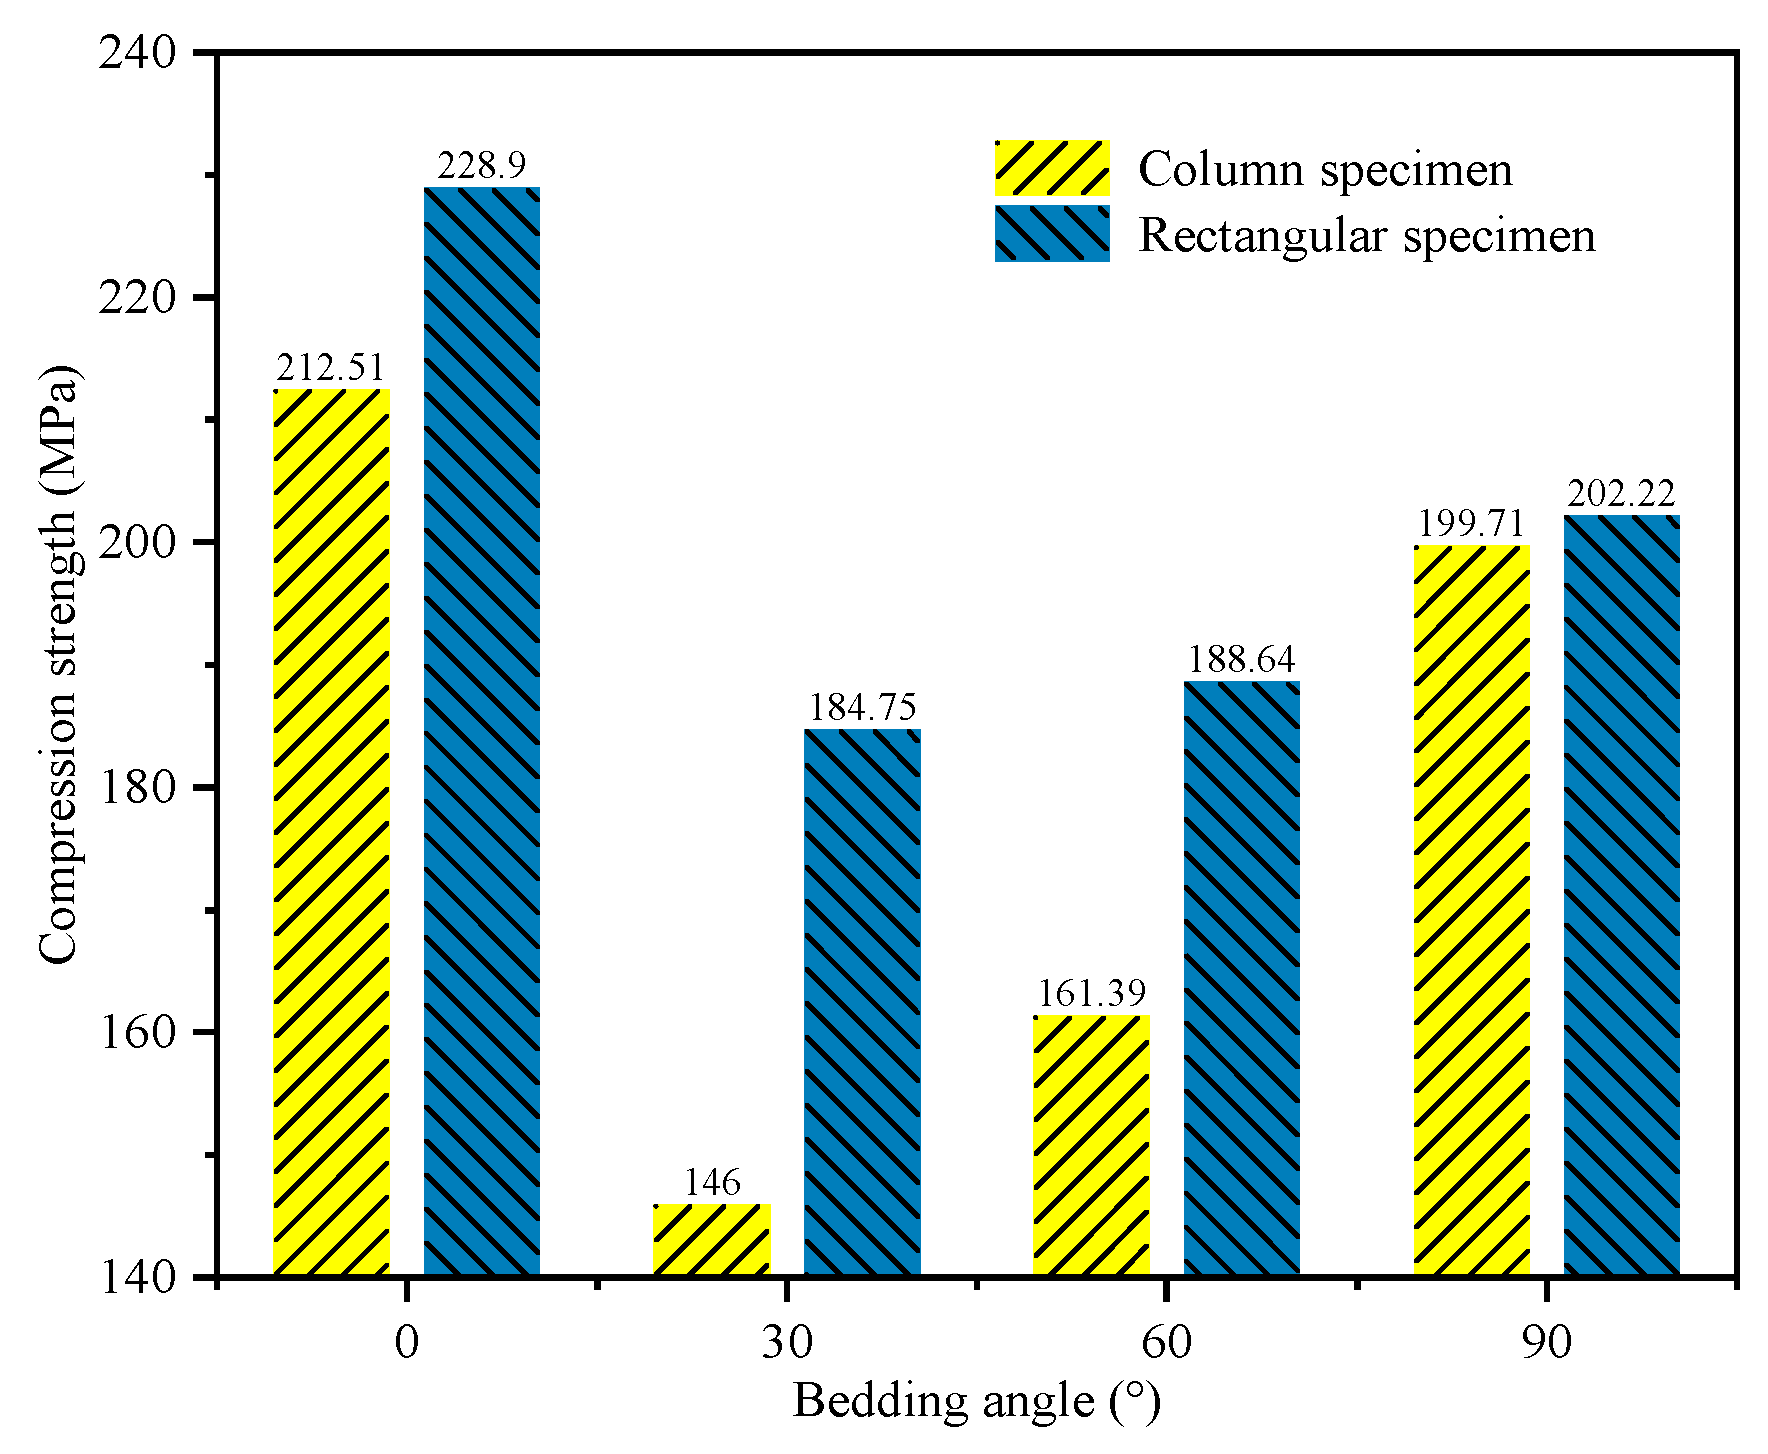
4. Shape Effects of Shale

The International Society of Rock Mechanics (ISRM) recommends that uniaxial compression tests utilize cylindrical specimens with a diameter exceeding 50 mm and a height-to-diameter ratio between 2 and 3. The identical cylindrical specimens used in uniaxial compression are suitable for conventional triaxial tests, while true triaxial tests require cubic specimens. In this study, cylindrical specimens with a diameter of 50 mm and a height of 100 mm were employed for uniaxial compression tests. In contrast, rectangular specimens with a base of 50 mm and a height of 100 mm were utilized for triaxial compression tests to simulate uniaxial stress conditions. Considering that the specimen shape influences the stress transfer paths and the stress distribution states, the effect of the cross-sectional shape on the uniaxial test results warrants further discussion.
Table 2 compares the anisotropy of mechanical parameters between cylindrical and prismatic specimens. The data reveal notable differences in the anisotropy of compressive strength and peak strain between the two specimen types, although their elastic modulus remains nearly identical. Figure 17 illustrates the uniaxial strength of cylindrical and prismatic shale specimens tested in this study. The figure highlights that the uniaxial strength of shale varies based on the cross-sectional shape, classifying the specimens into two distinct types. The strength difference between cylindrical and prismatic specimens is minimal when the bedding angles are 0° and 90°. This is especially true at a bedding angle of 90°, where the strengths are nearly equivalent. Regarding isotropic rocks, previous studies have examined the influence of cross-sectional shapes on mechanical properties [36,37,38]. For instance, Zhang et al. [39] conducted uniaxial compression tests on rock-like materials with various cross-sectional shapes (cylinders, triangular prisms, quadrangular prisms, etc.) and found that while the cross-sectional shape affects failure modes, it does not significantly impact the uniaxial strength. Zhao et al. [40], through adjacent sampling methods used to minimize rock heterogeneity, reported that granite’s cross-sectional shape had little effect on the uniaxial compressive strength, with parameters such as crack initiation stress, crack damage stress, and crack closure stress showing minimal variation. Xu et al. [41] suggested that strength differences between prismatic and cylindrical specimens might arise from the larger cross-sectional area of prismatic specimens. However, these differences disappeared when the prismatic specimen’s dimensions were converted to an equivalent diameter. These findings collectively suggest that, for isotropic rocks, a cross-sectional shape has a negligible impact on strength, provided that heterogeneity is controlled. This explains the minimal strength differences observed at bedding angles of 0° and 90° in the present study.
However, at inclined bedding angles, the strength of cylindrical specimens is significantly lower than that of prismatic specimens. This phenomenon may be attributed to the influence of the bedding weak plane and the uneven stress distribution caused by differences in the cross-sectional shape. During crack propagation, circumferential stress emerges, as shown in Figure 18a. While Xu et al. [41] posited that circumferential tension has minimal impact on the strength of cylindrical and prismatic specimens, this conclusion primarily applies to isotropic rocks and does not account for bedding effects. For specimens with bedding angles of 0° and 90°, circumferential tension does not cause significant strength differences since bedding surfaces at these angles have a limited influence on stress transfer. Conversely, shear slip along the bedding planes alters the stress transfer characteristics for inclined bedding shale. As the bedding angle changes, stress transfer on the bedding plane forms rectangular or elliptical sections of varying sizes, as illustrated in Figure 18b. The resultant changes in circumferential stress transfer contribute to the strength differences observed between elliptical and rectangular cross-sections.
The stress surface evolves dynamically during shear slip failure in inclined bedding specimens [42]. The schematic diagrams in Figure 19 illustrate the sliding surfaces: Figure 19a shows the rectangular stress surface of prismatic specimens, while Figure 19b depicts the approximately elliptical stress surface of cylindrical specimens. During failure, the stress area of the sliding surface is a function of slip distance. The stress area of prismatic specimens remains consistently more significant than that of cylindrical specimens. Furthermore, as the rectangular stress surface of prismatic specimens elongates, the stress concentration effects shift. In contrast, the elliptical cross-section of cylindrical specimens undergoes continuous changes, with circumferential stress inducing a localized stress concentration along the long axis. These differences in stress states during failure lead to more substantial variations between cylindrical and prismatic specimens with inclined bedding. The fracture mechanisms of layered rocks are more complex than those of isotropic rocks, with specimen shapes profoundly influencing the stress distribution and failure behavior. However, research on the effect of a cross-sectional shape on the mechanical behavior of layered rocks remains insufficient, and further exploration is needed to elucidate the underlying mechanisms.

5. Conclusions

This study investigates shale’s mechanical properties and failure modes under different stress conditions by generating random bedding structures and employing numerical modeling techniques. It provides a deeper understanding of the shale fracturing mechanism, offering guidance for optimizing fracturing techniques. The key conclusions are as follows:
(1) The compression, tension and shear properties of shale show obvious anisotropy. The properties of the bedding plane have a significant influence on mechanical properties such as the compressive strength, elastic modulus, peak strain, and tensile strength. With the increase in the bedding angle, the uniaxial compressive strength of shale shows a U-shaped change trend, while the tensile strength gradually decreases. Both failure analysis and the spatial distribution of acoustic emission signals show that under the two loading conditions, the failure mechanism of the samples is significantly different, and the influence of the bedding distribution position on the direct tensile failure mode is more significant.
(2) Confining pressure enhances the compressive strength of shale by modifying the internal stress distribution and reducing both brittleness and anisotropy. By suppressing the initiation and propagation of microcracks, the strength of shale is effectively improved. When the confining pressure increases from 0 MPa to 22.5 MPa at a bedding angle of 30°, the strength increases by about 41%, while at 0° bedding, it increases by only 29%. With an increasing confining pressure, the failure mode gradually shifts to shear failure across different bedding angles. The variation in the shear strength parameters obtained through principal stress fitting further explains the universality of shear slip failure in inclined bedding.
(3) Frictional constraints between bedding planes and the matrix significantly influence the rock mass strength. Under uniaxial and triaxial compression, strength near the contact surface is affected by frictional stress, while the stress state outside the contact surface remains unchanged. In inclined bedding shale, shear stress promotes bedding plane slip, often leading to shear failure along the bedding planes and reducing the overall strength.
Despite the valuable insights from this study, several limitations should be acknowledged. First, the numerical modeling approach relies on the assumption of idealized random bedding structures, which may not fully capture the complex heterogeneity of natural shale. Second, the study primarily focuses on the mechanical response under monotonic loading conditions, while the cyclic or dynamic loading behavior remains unexplored. Future research should address these limitations by incorporating more realistic bedding structures and conducting experimental validation to further enhance the accuracy and applicability of the findings.
We are particularly interested in the effect of the specimen shape and plan to conduct further experimental and numerical studies, focusing on the mechanical behavior and failure mechanisms under inclined bedding conditions. As demonstrated in this study, specimen shape has minimal influence on the failure mode when the bedding is horizontal or vertical, which aligns with existing findings in the literature on other rock types. Therefore, we aim to further investigate how sliding surface failure governs and influences layered rock masses’ strength and failure characteristics under inclined bedding conditions.

Author Contributions

T.L.: Investigation, Validation, Visualization, Data curation, Writing—original draft; Z.D.: Investigation, Methodology, Funding acquisition, Writing—review and editing; B.G.: Methodology, Conceptualization, Supervision, Software, Writing—review and editing. All authors have read and agreed to the published version of the manuscript.

Funding

This research was funded by the National Natural Science Foundation for Young Scientists of China (Grant No. 52104084), the Science and Technology Tackling Project of Henan Province (Grant No. 252102321155), the China Postdoctoral Science Foundation (Grant No. 2024M760807), the Postdoctoral Program of Henan Polytechnic University (Grant No. 712108/429) and the Doctoral Funding Project of Henan Polytechnic University (Grant No. B2021-45).

Institutional Review Board Statement

Not applicable.

Informed Consent Statement

Not applicable.

Data Availability Statement

The data underpinning this publication can be accessed from Brunel University of London’s data repository (Brunelfigshare) under a CCBY license with the DOI of https://doi.org/10.17633/rd.brunel.25291315.v3.

Conflicts of Interest

The authors declare no conflict of interest.

References

  1. Shang, X.; Long, S.; Duan, T. Fracture system in shale gas reservoir: Prospect of characterization and modeling techniques. J. Nat. Gas Geosci. 2021, 6, 157–172. [Google Scholar] [CrossRef]
  2. Memon, A.; Li, A.; Jacqueline, N.; Kashif, M.; Ma, M. Study of gas sorption, stress effects and analysis of effective porosity and permeability for shale gas reservoirs. J. Pet. Sci. Eng. 2020, 193, 107370. [Google Scholar] [CrossRef]
  3. Tao, J. Analysis of co2 effects on porosity and permeability of shale reservoirs under different water content conditions. Geoenergy Sci. Eng. 2023, 226, 211744. [Google Scholar] [CrossRef]
  4. Wu, M.; Chang, X.; Guo, Y.; Liu, J.; Yang, C.; Suo, Y. Advances, challenges, and opportunities for hydraulicfracturing of deep shale gas reservoirs. Adv. Geo-Energy Res. 2025, 15, 1–4. [Google Scholar] [CrossRef]
  5. Xie, W.; Wang, M.; Chen, S.; Vandeginste, V.; Yu, Z.; Wang, H. Effects of gas components, reservoir property and pore structure of shale gas reservoir on the competitive adsorption behavior of co2 and ch4. Energy 2022, 254, 124242. [Google Scholar] [CrossRef]
  6. Xie, W.; Chen, S.; Vandeginste, V.; Yu, Z.; Wang, H.; Wang, M. Review of the effect of diagenetic evolution of shale reservoir on the pore structure and adsorption capacity of clay minerals. Energy Fuels 2022, 36, 4728–4745. [Google Scholar] [CrossRef]
  7. Hu, L. A review of mechanical mechanism and prediction of natural fracture in shale. Arab. J. Geosci. 2022, 15, 474. [Google Scholar] [CrossRef]
  8. Wopara, O.F. Geochemical properties of shale gas reservoirs and their impacts on gas development: A review. Int. J. Multidiscip. Curr. Educ. Res. 2021, 3, 154–165. [Google Scholar]
  9. Wang, H.; Hu, J.; Xia, Z.; Liu, C.; Yang, B.; Chen, B.; Zhang, L.; Wang, X. Mechanical properties and damage evolution characteristics of composite rock mass with prefabricated fractures. Comput. Part. Mech. 2024, 11, 1937–1957. [Google Scholar] [CrossRef]
  10. Lin, Q. Strength and failure characteristics of jointed rock mass with double circular holes under uniaxial compression: Insights from discrete element method modelling. Theor. Appl. Fract. Mech. 2020, 109, 102692. [Google Scholar] [CrossRef]
  11. El-Aal, A.K.A.; Radwan, A.E.; Hussain, J.; Ali, M.A.M. Experimental study on the impact of perpendicular and parallel bedding planes on the physical and geomechanical characteristics of carbonate rocks. J. Pet. Explor. Prod. Technol. 2025, 15, 28. [Google Scholar] [CrossRef]
  12. Cao, H.; Gao, Q.; Ye, G.; Zhu, H.; Sun, P. Experimental investigation on anisotropic characteristics of marine shale in northwestern Hunan, China. J. Nat. Gas Sci. Eng. 2020, 81, 103421. [Google Scholar] [CrossRef]
  13. Lyu, Q.; Wang, K.; Hu, C.; Dick, J.M.; Shi, J.; Tan, J. Experimental study on the mechanical properties of shale after long-term of immersion in fracturing fluids with different ph. Rock Mech. Rock Eng. 2022, 55, 5047–5061. [Google Scholar] [CrossRef]
  14. Yang, S.-Q.; Yin, P.-F.; Ranjith, P.G. Experimental study on mechanical behavior and brittleness characteristics of longmaxi formation shale in Changning, Sichuan basin, China. Rock Mech. Rock Eng. 2020, 53, 2461–2483. [Google Scholar] [CrossRef]
  15. Zhao, C.; Liu, J.; Xu, D.; Zhang, L.; Lyu, C.; Ren, Y. Investigation on mechanical properties, ae characteristics, and failure modes of longmaxi formation shale in Changning, Sichuan basin, China. Rock Mech. Rock Eng. 2023, 56, 1239–1272. [Google Scholar] [CrossRef]
  16. Kramarov, V.; Parrikar, P.N.; Mokhtari, M. Evaluation of fracture toughness of sandstone and shale using digital image correlation. Rock Mech. Rock Eng. 2020, 53, 4231–4250. [Google Scholar] [CrossRef]
  17. Li, C.; Zou, B.; Zhou, H.; Wang, J. Experimental investigation on failure behaviors and mechanism of an anisotropic shale in direct tension. Geomech. Geophys. Geo-Energy Geo-Resour. 2021, 7, 98. [Google Scholar] [CrossRef]
  18. Guo, W.; Guo, Y.; Yang, H.; Wang, L.; Liu, B.; Yang, C. Tensile mechanical properties and ae characteristics of shale in triaxial Brazilian splitting tests. J. Pet. Sci. Eng. 2022, 219, 111080. [Google Scholar] [CrossRef]
  19. Heng, S.; Li, X.; Liu, X.; Chen, Y. Experimental study on the mechanical properties of bedding planes in shale. J. Nat. Gas Sci. Eng. 2020, 76, 103161. [Google Scholar] [CrossRef]
  20. Xie, Y.; Hou, M.Z.; Liu, H.; Li, C. Anisotropic time-dependent behaviors of shale under direct shearing and associated empirical creep models. J. Rock Mech. Geotech. Eng. 2023, 16, 1262–1279. [Google Scholar] [CrossRef]
  21. He, J.; Afolagboye, L.O.; Zheng, B.; Mao, T.; Wu, Y.; Li, G.; Li, S.; Li, X. Effect of strain rate on anisotropic mechanical behavior of the shale under uniaxial compression conditions. Rock Mech. Rock Eng. 2022, 55, 5297–5305. [Google Scholar] [CrossRef]
  22. Yang, S.-Q. Strength, deformability and x-ray micro-ct observations of transversely isotropic composite rock under different confining pressures. Eng. Fract. Mech. 2019, 214, 1–20. [Google Scholar] [CrossRef]
  23. Shao, Y.; Yang, J.; Kim, J.; Song, J.-J.; Moon, J.; Han, J. A comprehensive experimental study on mechanical anisotropy and failure mode of 3d printed gypsum rocks: From composition and microstructure to macroscopic mechanical properties response. Rock Mech. Rock Eng. 2023, 56, 6503–6528. [Google Scholar] [CrossRef]
  24. He, F.; Liu, Q.; Deng, P. Investigation of the anisotropic characteristics of layered rocks under uniaxial compression based on the 3d printing technology and the combined finite-discrete element method. Adv. Mater. Sci. Eng. 2020, 2020, 1–10. [Google Scholar] [CrossRef]
  25. Liao, Z.Y.; Zhu, J.B.; Tang, C.A. Numerical investigation of rock tensile strength determined by direct tension, Brazilian and three-point bending tests. Int. J. Rock Mech. Min. Sci. 2019, 115, 21–32. [Google Scholar] [CrossRef]
  26. Fan, Z.; Zhou, Q.; Nie, X.; Yao, Z.; Li, C.; Wang, J.; He, L.; Wang, M.; Ren, L. 3D anisotropic microcracking mechanisms of shale subjected to direct shear loading: A numerical insight. Eng. Fract. Mech. 2024, 298, 109950. [Google Scholar] [CrossRef]
  27. Song, Y.; Yang, S.-Q.; Li, K.-S.; Yin, P.-F.; Pan, P.-Z. Mechanical behavior and fracture evolution mechanism of composite rock under triaxial compression: Insights from three-dimensional dem modeling. Rock Mech. Rock Eng. 2023, 56, 7673–7699. [Google Scholar] [CrossRef]
  28. Zhai, M.; Li, L.; Chen, B.; Zhang, Q.; Zhang, Z.; Zhang, L. Investigation on the anisotropy of mechanical properties and brittleness characteristics of deep laminated sandstones. Eng. Fract. Mech. 2023, 289, 109386. [Google Scholar] [CrossRef]
  29. Feng, X.H.; Gong, B.; Liang, Z.Z.; Wang, S.Y.; Tang, C.A.; Li, H.; Ma, T.H. Study of the dynamic failure characteristics of anisotropic shales under impact Brazilian splitting. Rock Mech. Rock Eng. 2024, 57, 2213–2230. [Google Scholar] [CrossRef]
  30. Gong, B.; Zhao, T.; Thusyanthan, I.; Tang, C.A.; Zhou, G.G.D. Integrating RFPA and DEM in adaptive RDFA modeling of rock fracturing process. Rock Mech. Rock Eng. 2025, 58, 2569–2587. [Google Scholar] [CrossRef]
  31. Gong, B.; Zhao, T.; Thusyanthan, I.; Tang, C.A.; Zhou, G.G.D. The random RFPA method for modelling rock failure. Rock Mech. Rock Eng. 2025. [Google Scholar] [CrossRef]
  32. Chen, B.; Gong, B.; Wang, S.; Tang, C. Research on zonal disintegration characteristics and failure mechanisms of deep tunnel in jointed rock mass with strength reduction method. Mathematics 2022, 10, 922. [Google Scholar] [CrossRef]
  33. Gong, B.; Zhao, T.; Thusyanthan, I.; Tang, C.A. Modelling rock fracturing by a novel implicit continuous to discontinuous method. Comput. Geotech. 2024, 166, 106035. [Google Scholar] [CrossRef]
  34. Gong, B.; Wang, Y.; Chen, X.; Song, W.; Wang, K.; Yu, J. Analysis of sensitivity factors on CJB mechanical behavior from specimen scale to engineering scale. Eng. Fract. Mech. 2025, 314, 110673. [Google Scholar] [CrossRef]
  35. Liang, Z.Z. Three-Dimensional Failure Process Analysis of Rock and Associated Numerical Tests. Ph.D. Thesis, Northeastern University, Shenyang, China, 2005. [Google Scholar]
  36. Al-Bukhaiti, K.; Yanhui, L.; Shichun, Z.; Daguang, H.; Abas, H. Effect of cross-section shape on RC specimen’s behavior under asymmetrical impact loading. In Proceedings of the 9th International Conference on Civil Engineering; Feng, G., Ed.; Springer Nature: Singapore, 2023; Volume 327, pp. 497–511. [Google Scholar]
  37. Štambuk Cvitanović, N.; Nikolić, M.; Ibrahimbegović, A. Influence of specimen shape deviations on uniaxial compressive strength of limestone and similar rocks. Int. J. Rock Mech. Min. Sci. 2015, 80, 357–372. [Google Scholar] [CrossRef]
  38. Du, K.; Su, R.; Tao, M.; Yang, C.; Momeni, A.; Wang, S. Specimen shape and cross-section effects on the mechanical properties of rocks under uniaxial compressive stress. Bull. Eng. Geol. Environ. 2019, 78, 6061–6074. [Google Scholar] [CrossRef]
  39. Zhang, C.; Lin, H.; Qiu, C.; Jiang, T.; Zhang, J. The effect of cross-section shape on deformation, damage and failure of rock-like materials under uniaxial compression from both a macro and micro viewpoint. Int. J. Damage Mech. 2020, 29, 1076–1099. [Google Scholar] [CrossRef]
  40. Zhao, X.G.; Cai, M.; Wang, J.; Li, P.F. Strength comparison between cylindrical and prism specimens of Beishan granite under uniaxial compression. Int. J. Rock Mech. Min. Sci. 2015, 76, 10–17. [Google Scholar] [CrossRef]
  41. Xu, Y.; Cai, M. Numerical study on the influence of cross-sectional shape on strength and deformation behaviors of rocks under uniaxial compression. Comput. Geotech. 2017, 84, 129–137. [Google Scholar] [CrossRef]
  42. Liu, Q.Q.; Sun, S.R.; Shi, W.; Liu, G. Influence of sample shape on mechanical properties of composite rock mass with inclined weak interlayer. Geotech. Investig. Surv. 2024, 52, 1–8. (In Chinese) [Google Scholar]
Figure 1. RFPA3D calculation process diagram.
Applsci 15 04405 g001
Figure 2. Three-dimensional shale numerical models.
Applsci 15 04405 g002
Figure 3. Schematic representation of shale numerical model.
Applsci 15 04405 g003
Figure 4. Uniaxial compression test and numerical simulation results. (a) Stress–strain curves; (b) Failure modes.
Applsci 15 04405 g004
Figure 5. Compressive strength under different bedding angles and distribution.
Applsci 15 04405 g005
Figure 6. Elastic modulus under different bedding angles and distribution.
Applsci 15 04405 g006
Figure 7. Peak strain under different bedding angles and distribution.
Applsci 15 04405 g007
Figure 8. Tensile strength under different bedding angles and bedding distributions.
Applsci 15 04405 g008
Figure 9. Uniaxial compression failure modes under different bedding angles. (a) Bedding 0°; (b) Bedding 30°; (c) Bedding 60°; (d) Bedding 90°. The red AE signal represents shear failure, and the blue AE signal represents tensile failure.
Applsci 15 04405 g009
Figure 10. Tensile failure results and AE distribution under different bedding angles and distributions. (a) Bedding 0°; (b) Bedding 30°; (c) Bedding 60°; (d) Bedding 90°.
Applsci 15 04405 g010
Figure 11. Mechanical parameters under different bedding angles and confining pressure. (a) Compressive strength; (b) Elastic modulus; (c) Peak strain.
Applsci 15 04405 g011
Figure 12. Shear strength parameters. (a) Shear strength parameter fitting curve; (b) Internal friction angle and cohesion.
Applsci 15 04405 g012
Figure 13. Triaxial failure modes and AE distribution under different bedding angles, with colors indicating varying stress levels.
Applsci 15 04405 g013
Figure 14. Horizontal bedding plane shale specimens under uniaxial loading conditions.
Applsci 15 04405 g014
Figure 15. Horizontal bedding plane shale specimens under triaxial loading conditions.
Applsci 15 04405 g015
Figure 16. Inclined bedding shale specimens.
Applsci 15 04405 g016
Figure 17. Uniaxial strength of cylinder and cuboid shale specimens under different bedding inclination angles.
Applsci 15 04405 g017
Figure 18. Effect of bedding plane on hoop stress. (a) Hoop stress; (b) Cross-section changes with angle.
Applsci 15 04405 g018
Figure 19. Effect of bedding plane on hoop stress. (a) Rectangular cross-section; (b) Elliptical cross-section.
Applsci 15 04405 g019
Table 1. Mesoscopic parameters of shale numerical model.
MaterialHomogeneityElastic Modulus/GPaCompressive Strength/MPaPoisson’s RatioFriction Angle/°
Matrix368.756710.560.2536
bedding434.378340.280.224
Table 2. Anisotropy index of mechanical parameters of cylindrical and cuboid specimens.
Anisotropy IndexCompressive StrengthElastic ModulusPeak Strain
Column specimen1.4201.0941.523
Rectangular1.2391.0831.318
Disclaimer/Publisher’s Note: The statements, opinions and data contained in all publications are solely those of the individual author(s) and contributor(s) and not of MDPI and/or the editor(s). MDPI and/or the editor(s) disclaim responsibility for any injury to people or property resulting from any ideas, methods, instructions or products referred to in the content.

