Article

Research on Path and Sequence Planning for Multi-Cabin Onboard Transportation of Large Cruise Ships

1
School of Mechanical Engineering, Shanghai Jiao Tong University, Shanghai 201109, China
2
Shanghai Waigaoqiao Shipbuilding Co., Ltd., Shanghai 200137, China
3
School of Naval Architecture and Ocean Engineering, Jiangsu University of Science and Technology, Zhenjiang 212100, China
*
Author to whom correspondence should be addressed.
Appl. Sci. 2025, 15(8), 4406; https://doi.org/10.3390/app15084406
Submission received: 10 March 2025 / Revised: 6 April 2025 / Accepted: 11 April 2025 / Published: 16 April 2025
(This article belongs to the Section Civil Engineering)

Abstract

:
The utilization of PMCUs (Prefabricated Modular Cabin Units) is a key strategy for enhancing the efficiency and reducing the costs of large cruise ship construction. Effective transportation planning for multiple PMCU cabins, including the paths and sequence, is vital to ensure smooth and timely installation. However, traditional A-Star algorithms for path planning face limitations when it comes to accounting for boundary obstacles, and existing routine sequence planning methods can hardly tackle multi-cabin coupled blocking effects. To address these challenges, an enhanced A-Star algorithm is introduced and designed to handle both grid-based and boundary obstacles in the path planning process for cabin transportation onboard. Additionally, a novel reverse planning strategy is further proposed that addresses the coupling effects arising from inter-cabin mutual blocking by determining the optimal collision-free installation sequence. Integrated with the enhanced A-Star algorithm, this reverse planning strategy effectively eliminates interference between cabin transportation sequences and transportation paths, significantly improving operational efficiency. A comparative analysis across various scenarios further substantiates the practicality and effectiveness of the proposed method, highlighting its potential for real-world application in large-scale cruise ship construction.

1. Introduction

With the rapid growth of the cruise tourism industry, the design, construction, and related industries of large cruise ships are experiencing significant expansion. As one of the most complex products in modern shipbuilding, cruise ships differ significantly from traditional merchant vessels in structural complexity and outfitting logistics. Large cruise ships typically contain hundreds of passenger cabins distributed across multiple decks, interconnected by densely arranged structural reinforcements, HVAC ductwork, firefighting systems, and extensive cable networks. These intricate and highly integrated structural features impose considerable spatial constraints during modular unit transportation and installation, resulting in substantial logistical challenges [1,2]. Among the various critical aspects, the design and manufacturing of passenger cabins play a particularly pivotal role. Typically, passenger cabins on large cruise ships are subject to specific standards and classifications, ensuring that cabins of the same standard share consistent structural layouts, floor areas, and interior designs. This uniformity has paved the way for the adoption of Prefabricated Modular Cabin Units (PMCUs) [3], a concept that streamlines the construction process while maintaining high quality and efficiency.
PMCU technology has become a critical technology in the design and construction of large cruise ships [4]. Shipyards commonly adopt third-party prefabricated modular units based on the scalability and standardization of cabin layouts. These units are pre-assembled on production lines in workshops, constructed simultaneously with the ship’s hull. Once the modular units are assembled, they are transported to the shipyard construction site. Using lifting devices or cranes [5], the units are hoisted to the designated openings in the ship’s hull, marking the starting point for the cabin transportation process. Using transport carts and other specialized equipment, the units are then moved to their designated locations for final assembly, as shown in Figure 1. The PMCU technology significantly reduces the onboard construction workload, increases work efficiency, and shortens the shipbuilding cycle [6]. Currently, this technology has been widely applied in the large cruise ship manufacturing industry [7,8].
In recent years, digital and intelligent technologies have significantly advanced cruise ship outfitting and logistics management. Artificial intelligence (AI)-assisted production scheduling systems enable more efficient resource allocation, accurate prediction of potential bottlenecks, and adaptive optimization of complex shipbuilding tasks [9]. Integrating Building Information Modeling (BIM) with outfitting simulations allows detailed virtual validation of assembly and transportation processes, effectively reducing on-site conflicts and operational errors [10]. Furthermore, emerging technologies, such as augmented reality (AR)-based onboard logistics navigation and autonomous internal transportation robots, offer substantial potential for improving accuracy, efficiency, and safety in cabin transportation tasks [11,12], thereby strongly supporting the practical implementation of PMCU installations.
However, due to the large number of cabins to be transported, the factors that need to be considered during the transportation process have become increasingly complex. Each cabin not only requires a reasonable transportation path to be planned, but also, due to the complex internal structure of the ship and the dense layout of the cabins, the entry of one cabin may block the transportation of subsequent cabins, thus affecting the overall optimal transportation path. Therefore, when determining the optimal transportation path for each cabin, it is necessary to consider the specific transportation characteristics of the cabin and rationally plan the optimal transportation sequence. This optimization process is crucial for enhancing shipbuilding quality, reducing construction time, and lowering costs.
The cabin transportation problem can be classified as a type of path planning problem. Path planning refers to the process of selecting the optimal path to achieve a specific goal or maximize certain benefits under given constraints [13,14]. The core challenge lies in how to plan the shortest path for moving cabins from the hull opening to their designated installation locations, with the goal of minimizing transportation time as much as possible. Common algorithms used to solve path planning problems include Dijkstra’s algorithm [15], the A-Star algorithm [16], and Floyd’s algorithm [17], as well as various heuristic and intelligent optimization algorithms, such as Ant Colony Optimization (ACO) [18], Genetic Algorithm (GA) [19], Particle Swarm Optimization (PSO) [20], and Simulated Annealing (SA) [21]. These algorithms have helped researchers to effectively address path planning problems in various fields.
Although these methods have proven highly effective in specific applications, such as waste transportation, 3D printing path optimization, and robot navigation, they may have limitations when applied to path planning for the multi-cabin transportation of large cruise ships. Due to the complexity of the ship’s internal structure, path planning must address two types of obstacles: grid obstacles (such as non-prefabricated cabins on the cruise ship) and boundary obstacles (such as the horizontal and vertical bulkheads within the ship). Moreover, path blockages may occur during the actual cabin transportation process, further increasing the complexity of the problem. Once a blockage occurs, it not only disrupts the original cabin transportation plan, but also significantly increases the difficulty of transporting subsequent cabins.

2. Mathematical Model of Multi-Cabin Transportation Path Planning

The development of a mathematical model is a key step in optimizing the cabin transportation path, as it directly relates to the determination of the optimal transportation path for each cabin module. This model must accurately represent the path constraints, environmental factors, obstacle locations, transportation sequence, and physical characteristics of the cabin modules during the transportation process.

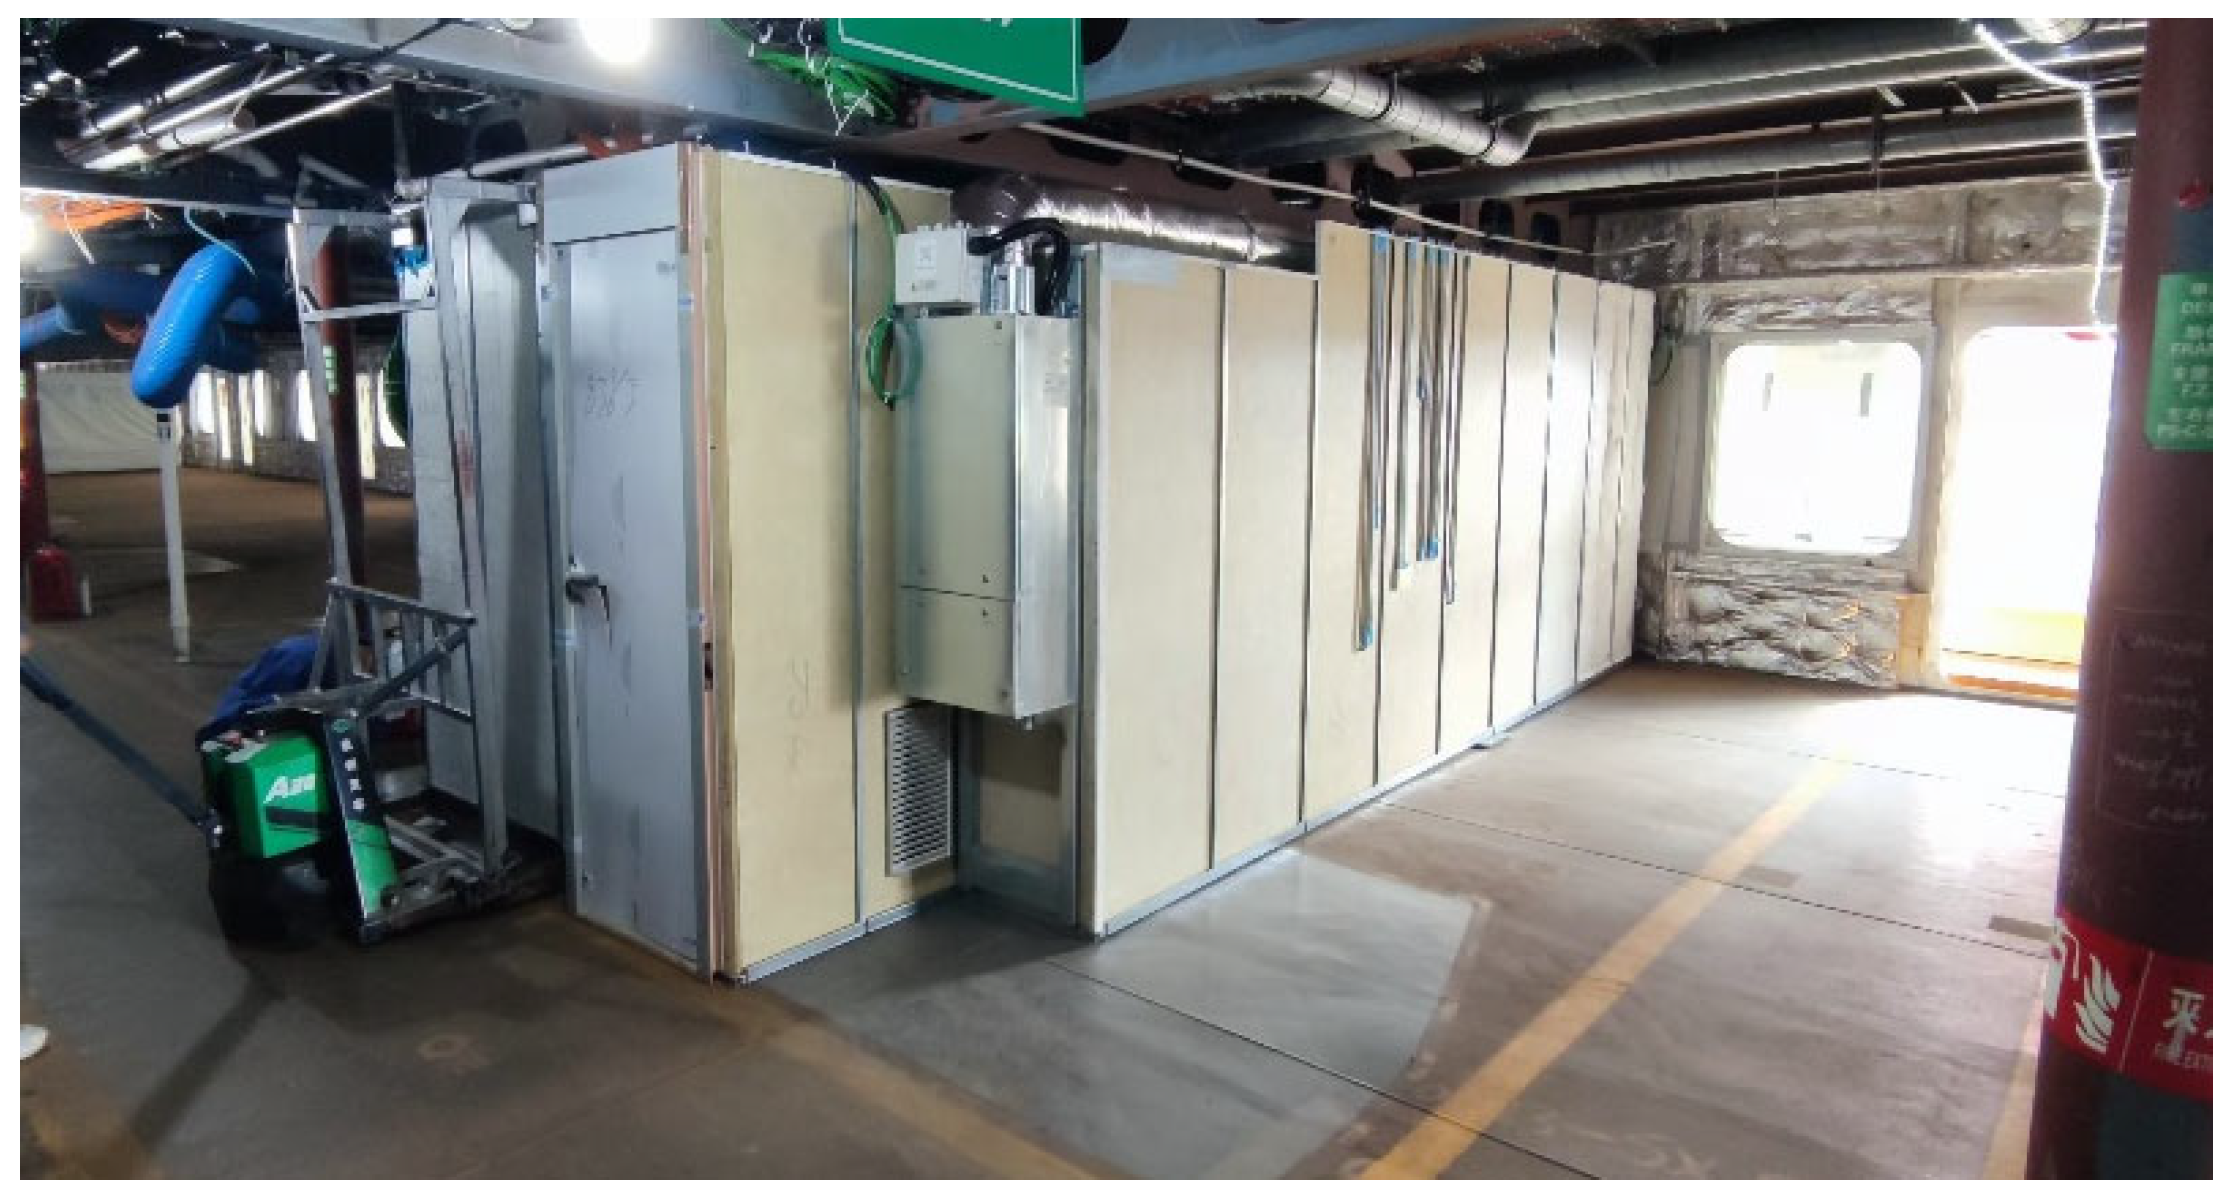
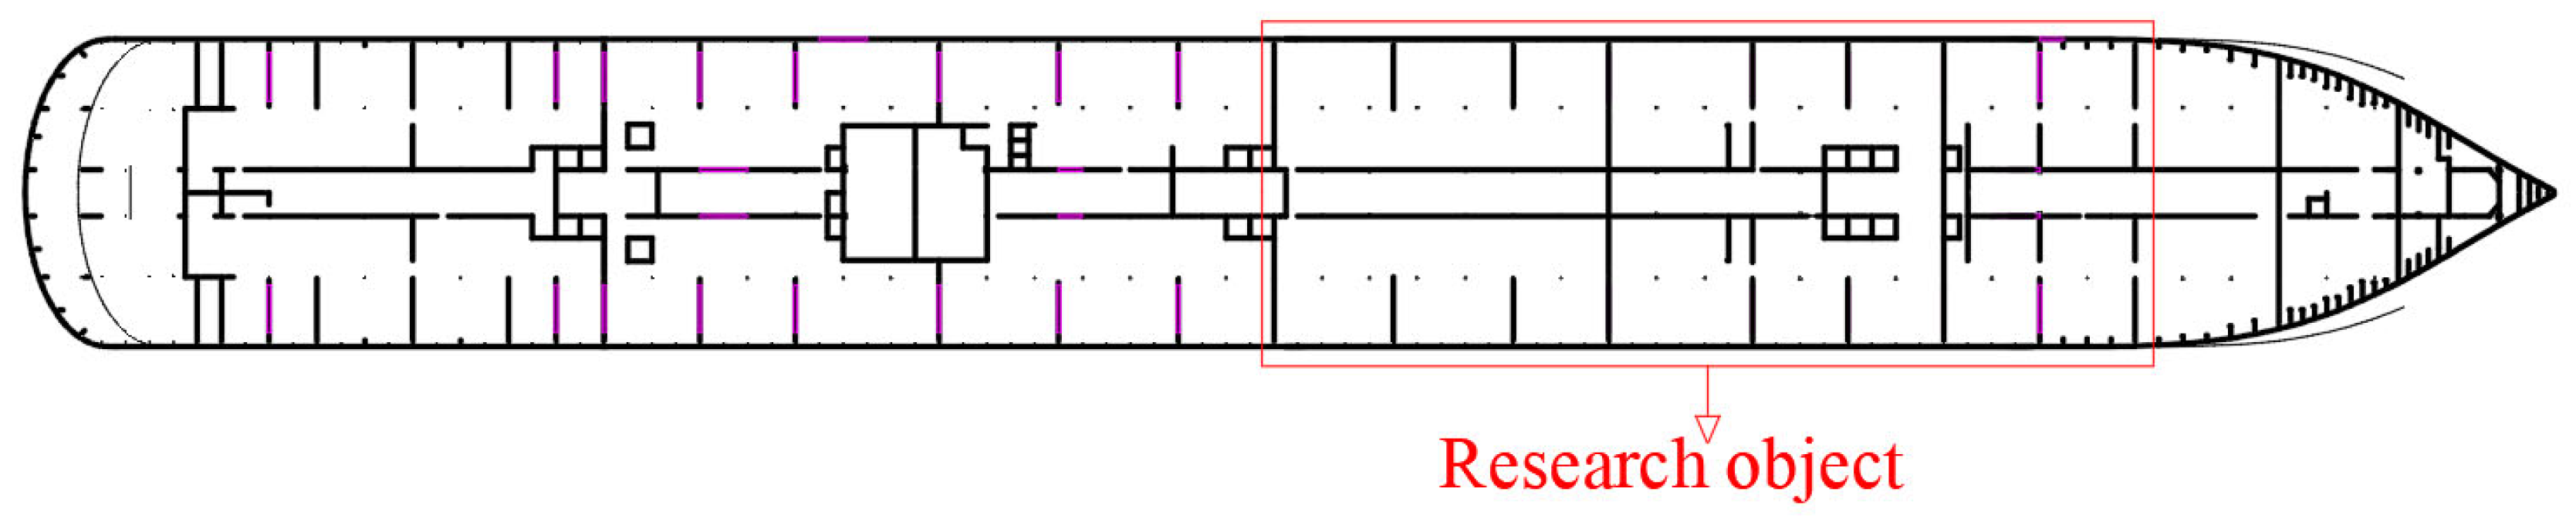
2.1. Problem Description

The planning of the transportation path for PMCUs refers to determining the optimal transportation path for each unit based on the constraints of obstacles on the transportation route, given the known on-site environmental information. By integrating the characteristics of the units, the optimal transportation sequence is established to satisfy these constraints, ultimately resulting in an overall transportation plan.
To address this challenge, it is essential to analyze the primary constraint relationships involved in transportation, define the optimization objective function for unit transportation, and establish a mathematical model for the transportation path planning. On this basis, according to the characteristics of prefabricated transportation, an algorithm is introduced to solve the model. Given the potential “roadblock” problem during the transportation phase, it is necessary to focus on the design and update of the algorithm, study the maximum pushing capacity of units under the limited hull structure and construction space, and finally consider the limitations to the number of pushes and the number of installations on this basis, to obtain the optimal pushing PMCU plan under the allocation of human resources.

2.2. Design of Model Variables and Constraints

Cabin module transportation path planning can be divided into two primary components: the optimization of the cabin transportation sequence and the optimization of the transportation path for each cabin. The optimization of the cabin transportation sequence is a Project Scheduling Problem (PSP), where the design variable is an ordered sequence that includes all the cabins to be transported. The optimization of the transportation path for each cabin is a Traveling Salesman Problem (TSP), typically modeled using a grid method to describe the environment. Obstacles are represented as obstacle grids, and the starting point, target point, and constraint points are defined by their Cartesian coordinates. The design variable in this case is the turning direction of the cabins at each grid. Figure 2 illustrates the grid division of the cabin module transportation environment. A two-dimensional Cartesian coordinate system is established within the area, with the origin, x-axis, and y-axis defined, and the positive directions of the axes determined. Each grid is sequentially numbered from the origin along the positive directions of the x-axis and y-axis. The gbegin indicates the starting grid. Each cabin module’s starting point and destination can be defined on the grid. Obstacles include non-prefabricated cabin obstacles and cabin wall obstacles; non-prefabricated cabin obstacles are represented by single grid points, while cabin wall obstacles are represented by the grid boundaries. The goal is to determine an optimal path from the starting point (A9) to the target point (J5), ensuring that the cabin module can safely navigate through all obstacles and reach its target position in the shortest possible time, without any collisions.
During the cabin module transportation process, there are numerous constraints, such as the maximum allowable number of cabins to be transported, the maximum allowable number of cabins to be installed, and the specified installation time for each cabin. Therefore, before planning the transportation paths, these constraints should be accurately defined by the shipyard’s construction personnel to ensure the path planning aligns with the actual production requirements.
Additionally, the transportation area where the cabin modules are located contains many non-prefabricated cabins and bulkheads, which must be considered in the grid map. In this study, non-prefabricated cabins are treated as grid obstacles, while bulkheads are treated as line obstacles. It is important to note that, compared to the cabin modules, the thickness of bulkheads is relatively thin, so the time spent passing through line obstacles is negligible during the transportation of the cabin modules.

2.3. Objective Function

The objective function for cabin module transportation primarily aims to minimize the overall loading time for all cabins, which is the sum of the transportation time and installation time for each cabin. In the optimization of the transportation paths for each cabin, a grid map is used, allowing the transportation time for each cabin to be equated to the length of the transportation path. Therefore, the objective function for the transportation of cabin modules can be expressed as follows:
min T a l l = i = 1 n T i
min T p = L j ,       j = 1 , 2 , , n
where Tall represents the total duration of the loading process for all cabin modules; Ti = Tpi + Tfi is the loading time of the i-th cabin module, which is the sum of the transportation time Tp and the installation time Tf; n is the number of cabin modules; Tf is a constant determined by the shipyard’s modular installation process for the cruise ship; and Lj represents the transportation path length of the j-th cabin.

3. Improved A-Star Algorithm Designing

The A-Star algorithm is a heuristic search algorithm commonly used to solve pathfinding problems. Based on the characteristics of cruise transportation, a transportation path optimization method based on the improved A-Star algorithm is proposed.

3.1. A-Star Algorithm Principle

The core idea of the A-Star algorithm is to simultaneously consider both the actual cost from the current node to the starting point, and the estimated cost from the current node to the destination. The sum of these two costs is used to evaluate the priority of the node. During the search, nodes are expanded sequentially according to their priority, until the destination is found or it is determined that the destination is unreachable.
In the A-Star algorithm, the estimated cost is typically calculated using a heuristic function, such as the Manhattan distance or Euclidean distance. The algorithm uses an open list and a closed list to track the nodes that have been discovered, and records the parent node of each node to trace the found path. The evaluation function is used to assess the priority of each node during the search process. It evaluates based on the distance from the node to the target node and the actual distance from the node to the starting node, in order to determine the next node to expand [22]. The choice of the evaluation function depends on the nature of the specific problem and the practical application scenario. A good evaluation function should have the following properties:
The estimate should be accurate, meaning it should be as close as possible to the actual distance.
The computational cost should be minimized, as the evaluation function needs to be computed multiple times during the search.
The evaluation function should be reliable, meaning it should remain consistent throughout the search process, without fluctuating.
The selected evaluation function is the Euclidean distance, which calculates the straight-line distance between two nodes, as shown in the following formula:
h ( n ) = ( x n x g o a l ) 2 + ( y n y g o a l ) 2
g ( n ) = ( x n x s t a r t ) 2 + ( y n y s t a r t ) 2
f ( n ) = h ( n ) + g ( n )
where h(n) represents the actual distance from the current node n to the target node; g(n) represents the actual distance from the current node n to the starting node; and f(n) is used to evaluate the total cost. By comparing the costs of each neighboring node, the algorithm selects the node with the smallest f(n), or if multiple nodes have the same f(n), the node with the smaller g(n), as the next node to expand for further search. This process continues until the target node is found, after which the algorithm backtracks through the recorded nodes to identify the optimal path.
The flow chart of the A-Star algorithm is shown in Figure 3, and includes the following steps:
  • Build the grid map, input the coordinates of the start and end points, and initialize the open list and the closed list.
  • Expand from the start point and search for neighboring nodes, while updating the open and closed lists.
  • If a neighboring node is an obstacle, remove it; otherwise, calculate the cost of the neighboring node.
  • Select the node with the smallest cost as the next node to expand for further search.
  • If the target node is found, backtrack through the recorded nodes and output the optimal path; otherwise, repeat steps (2)–(4).
The A-Star algorithm can find the optimal path in most cases, but the traditional A-Star algorithm struggles with handling some complex problems. In such cases, if the implementation of the A-Star algorithm is incorrect, it may lead to failure in finding the optimal path or result in an infinite loop.
For the large cruise ship cabin transportation path optimization problem, the main difficulty with the traditional A-Star algorithm lies in its inability to accurately identify line obstacles such as bulkheads. As a result, the standard A-Star algorithm is insufficient for this application, necessitating improvements to better account for these types of obstacles.

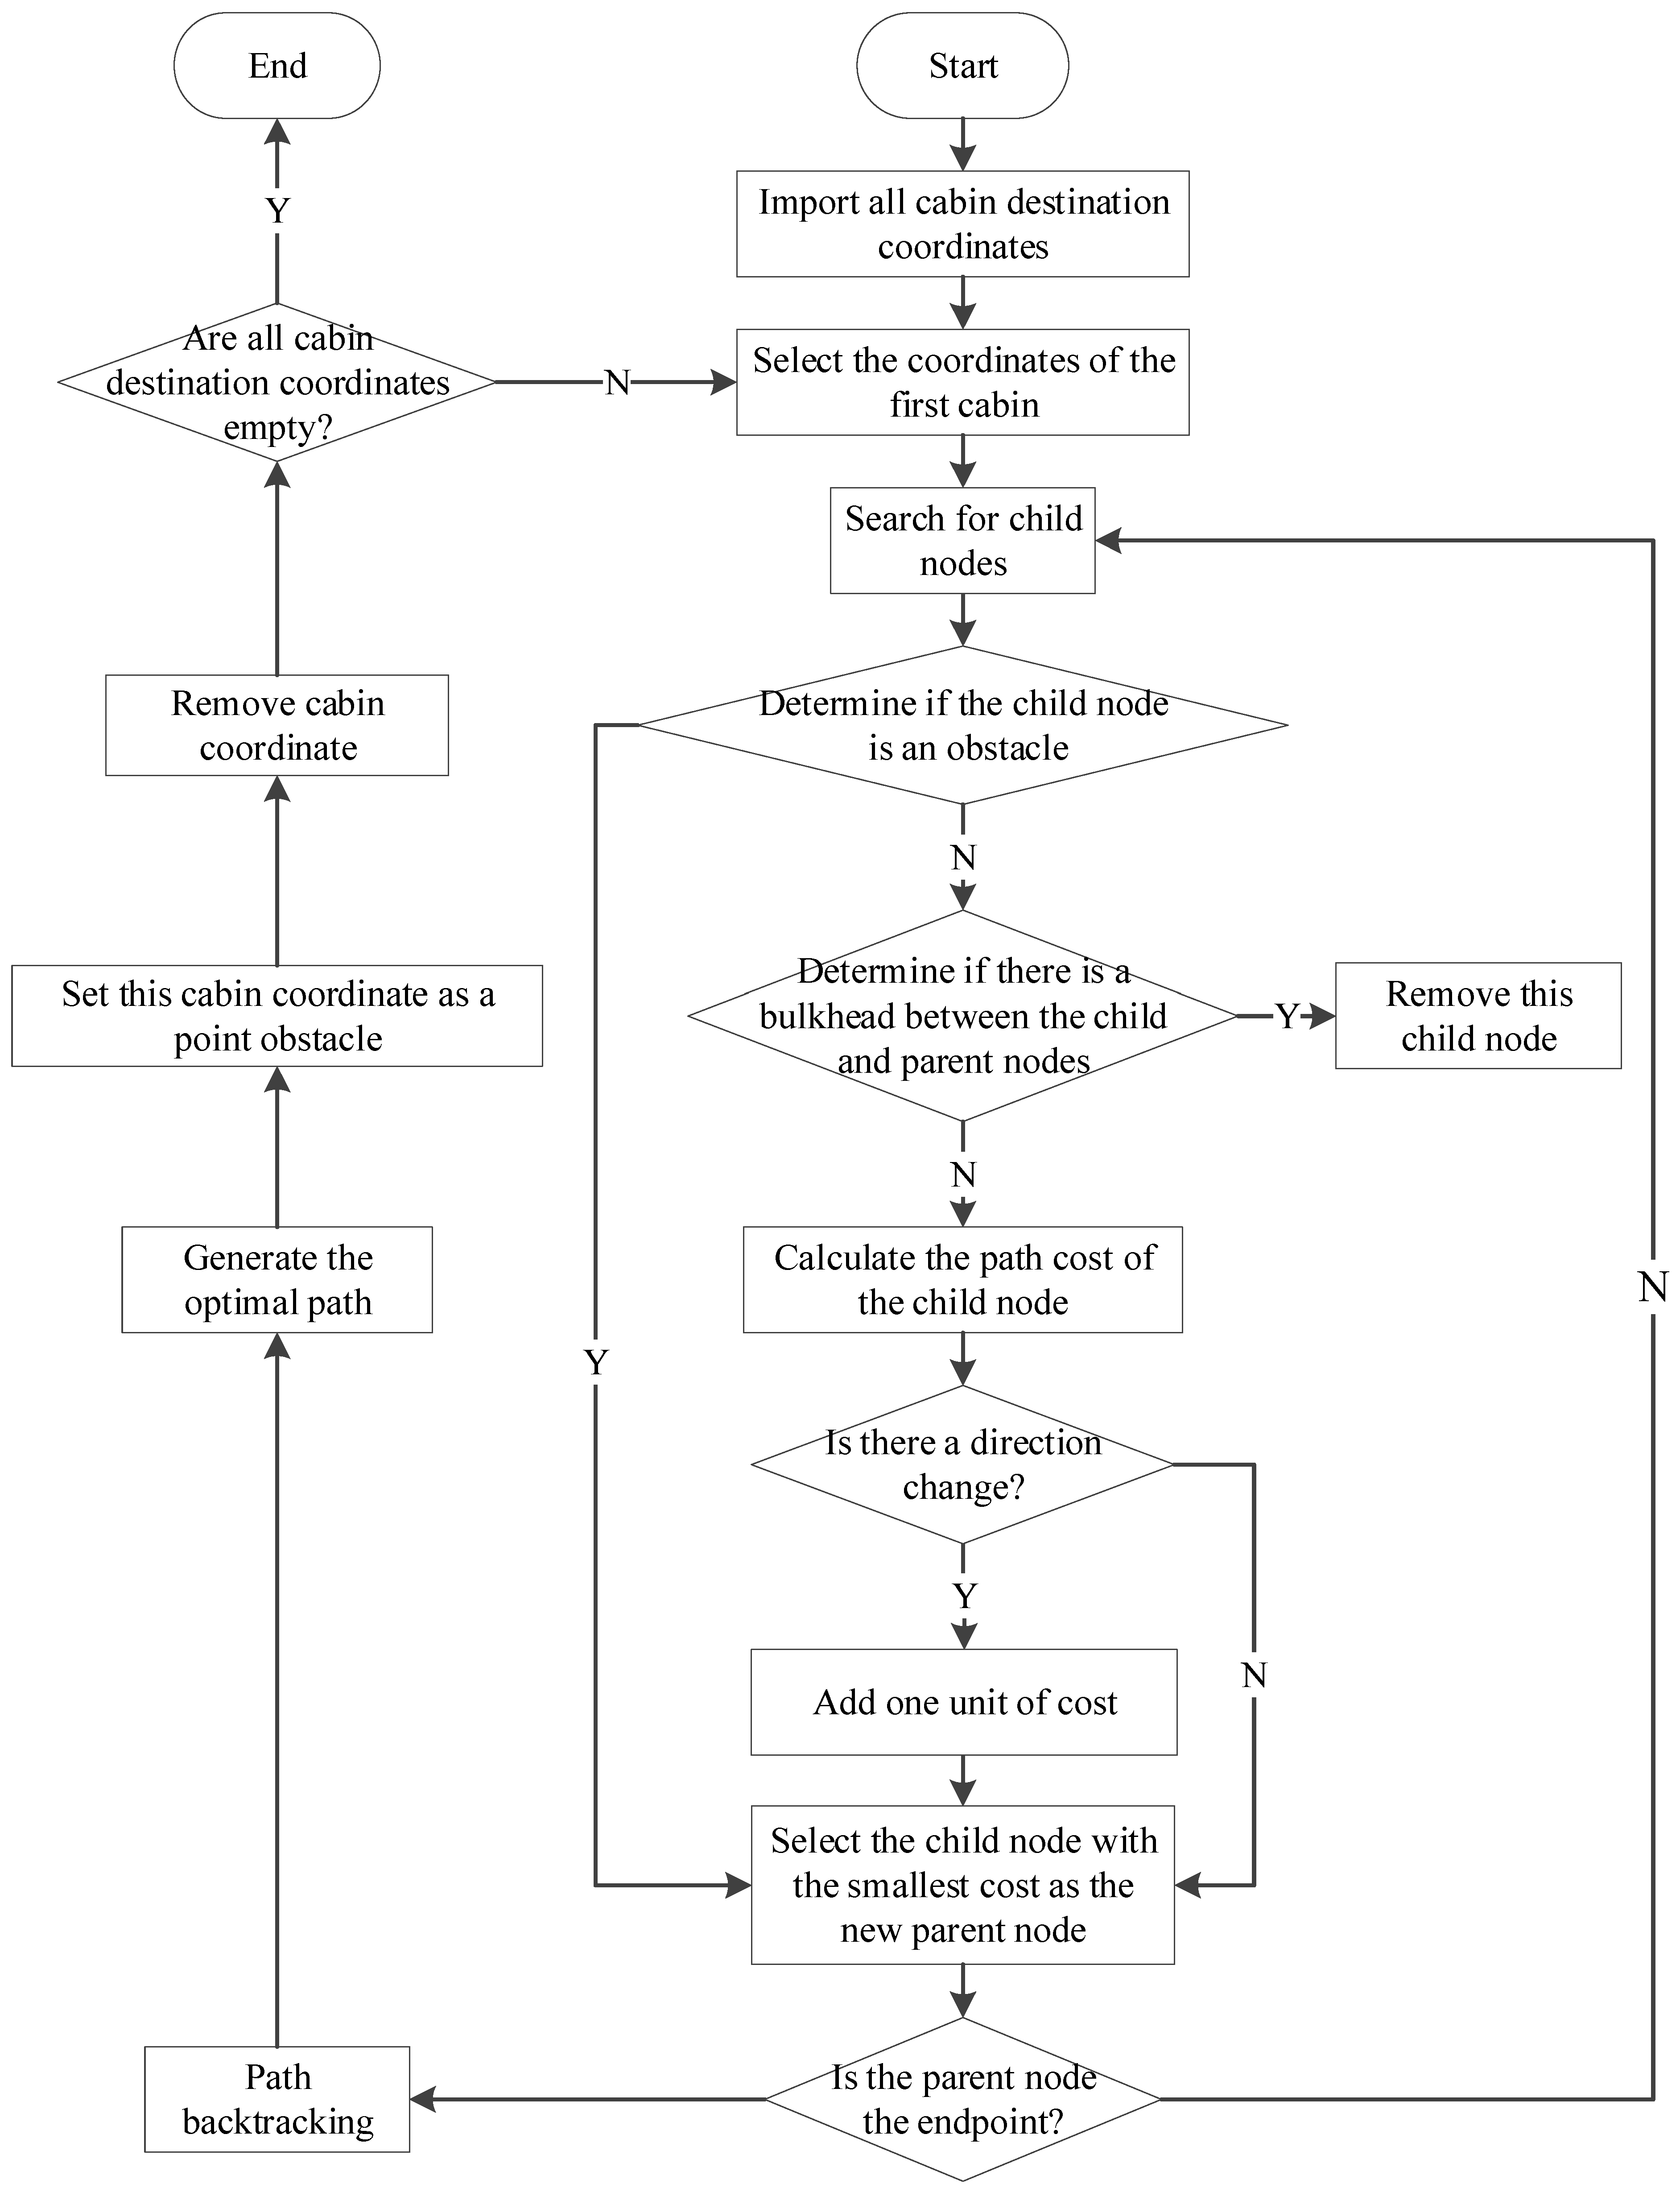
3.2. Improved A-Star Algorithm

The flow chart of an improved A-Star algorithm is shown in Figure 4.
In the improved A-Star algorithm presented in this paper, obstacles are categorized into two types: grid obstacles and line obstacles. Grid obstacles are primarily used to describe obstacles at grid points, such as the non-prefabricated cabins commonly found in cruise ships. Line obstacles, on the other hand, are used to describe obstacles whose thickness can be ignored, but whose length cannot, such as the longitudinal and transverse bulkheads in a cruise ship.
In traditional A-Star algorithms, grid points can directly be defined as grid obstacles at the early stage of the algorithm. When handling grid obstacles, they are treated as impassable nodes, and their cost is set to infinity to avoid selecting obstacles as part of the path during the search process. In the improved A-Star algorithm in this paper, line obstacles are treated similarly; they can be seen as boundaries between two grid points, A and B. The prefabricated cabin can only pass through point A or point B, but cannot pass between the two points, A and B.
Therefore, when handling obstacles, the constraint expression in this paper can be written as follows:
D = A , P o i n t   A   i s   i m p a s s a b l e B , P o i n t   B   i s   i m p a s s a b l e ( A x + B x ) / 2 , I m p a s s a b l e   b e t w e e n   p o i n t s   A   a n d   B   i n   t h e   x d i r e c t i o n ( A y + B y ) / 2 , I m p a s s a b l e   b e t w e e n   p o i n t s   A   a n d   B   i n   t h e   y d i r e c t i o n
where D represents the obstacle, and A and B represent two adjacent grid points on the grid map.
In addition, in the large cruise ship multi-cabin transportation problem, it is necessary to consider that when a cabin is moved to its destination, it is treated as an obstacle in the grid. This newly introduced obstacle can affect the transportation paths of subsequent cabins; as the number of obstacles increases, the number of required turns for transporting the remaining cabins also rises, further complicating the process. Research shows that incorporating a turn penalty mechanism into the A-Star algorithm can significantly reduce the number of turns required—by approximately 36.6% in environments with 20% obstacles, and about 27.7% in environments with 30% obstacles [23]. Therefore, this paper further integrates the number of turns in cabin transportation as an optimization objective. Specifically, when calculating the cost of adjacent nodes, an additional unit of path cost is added if the direction of cabin movement changes.

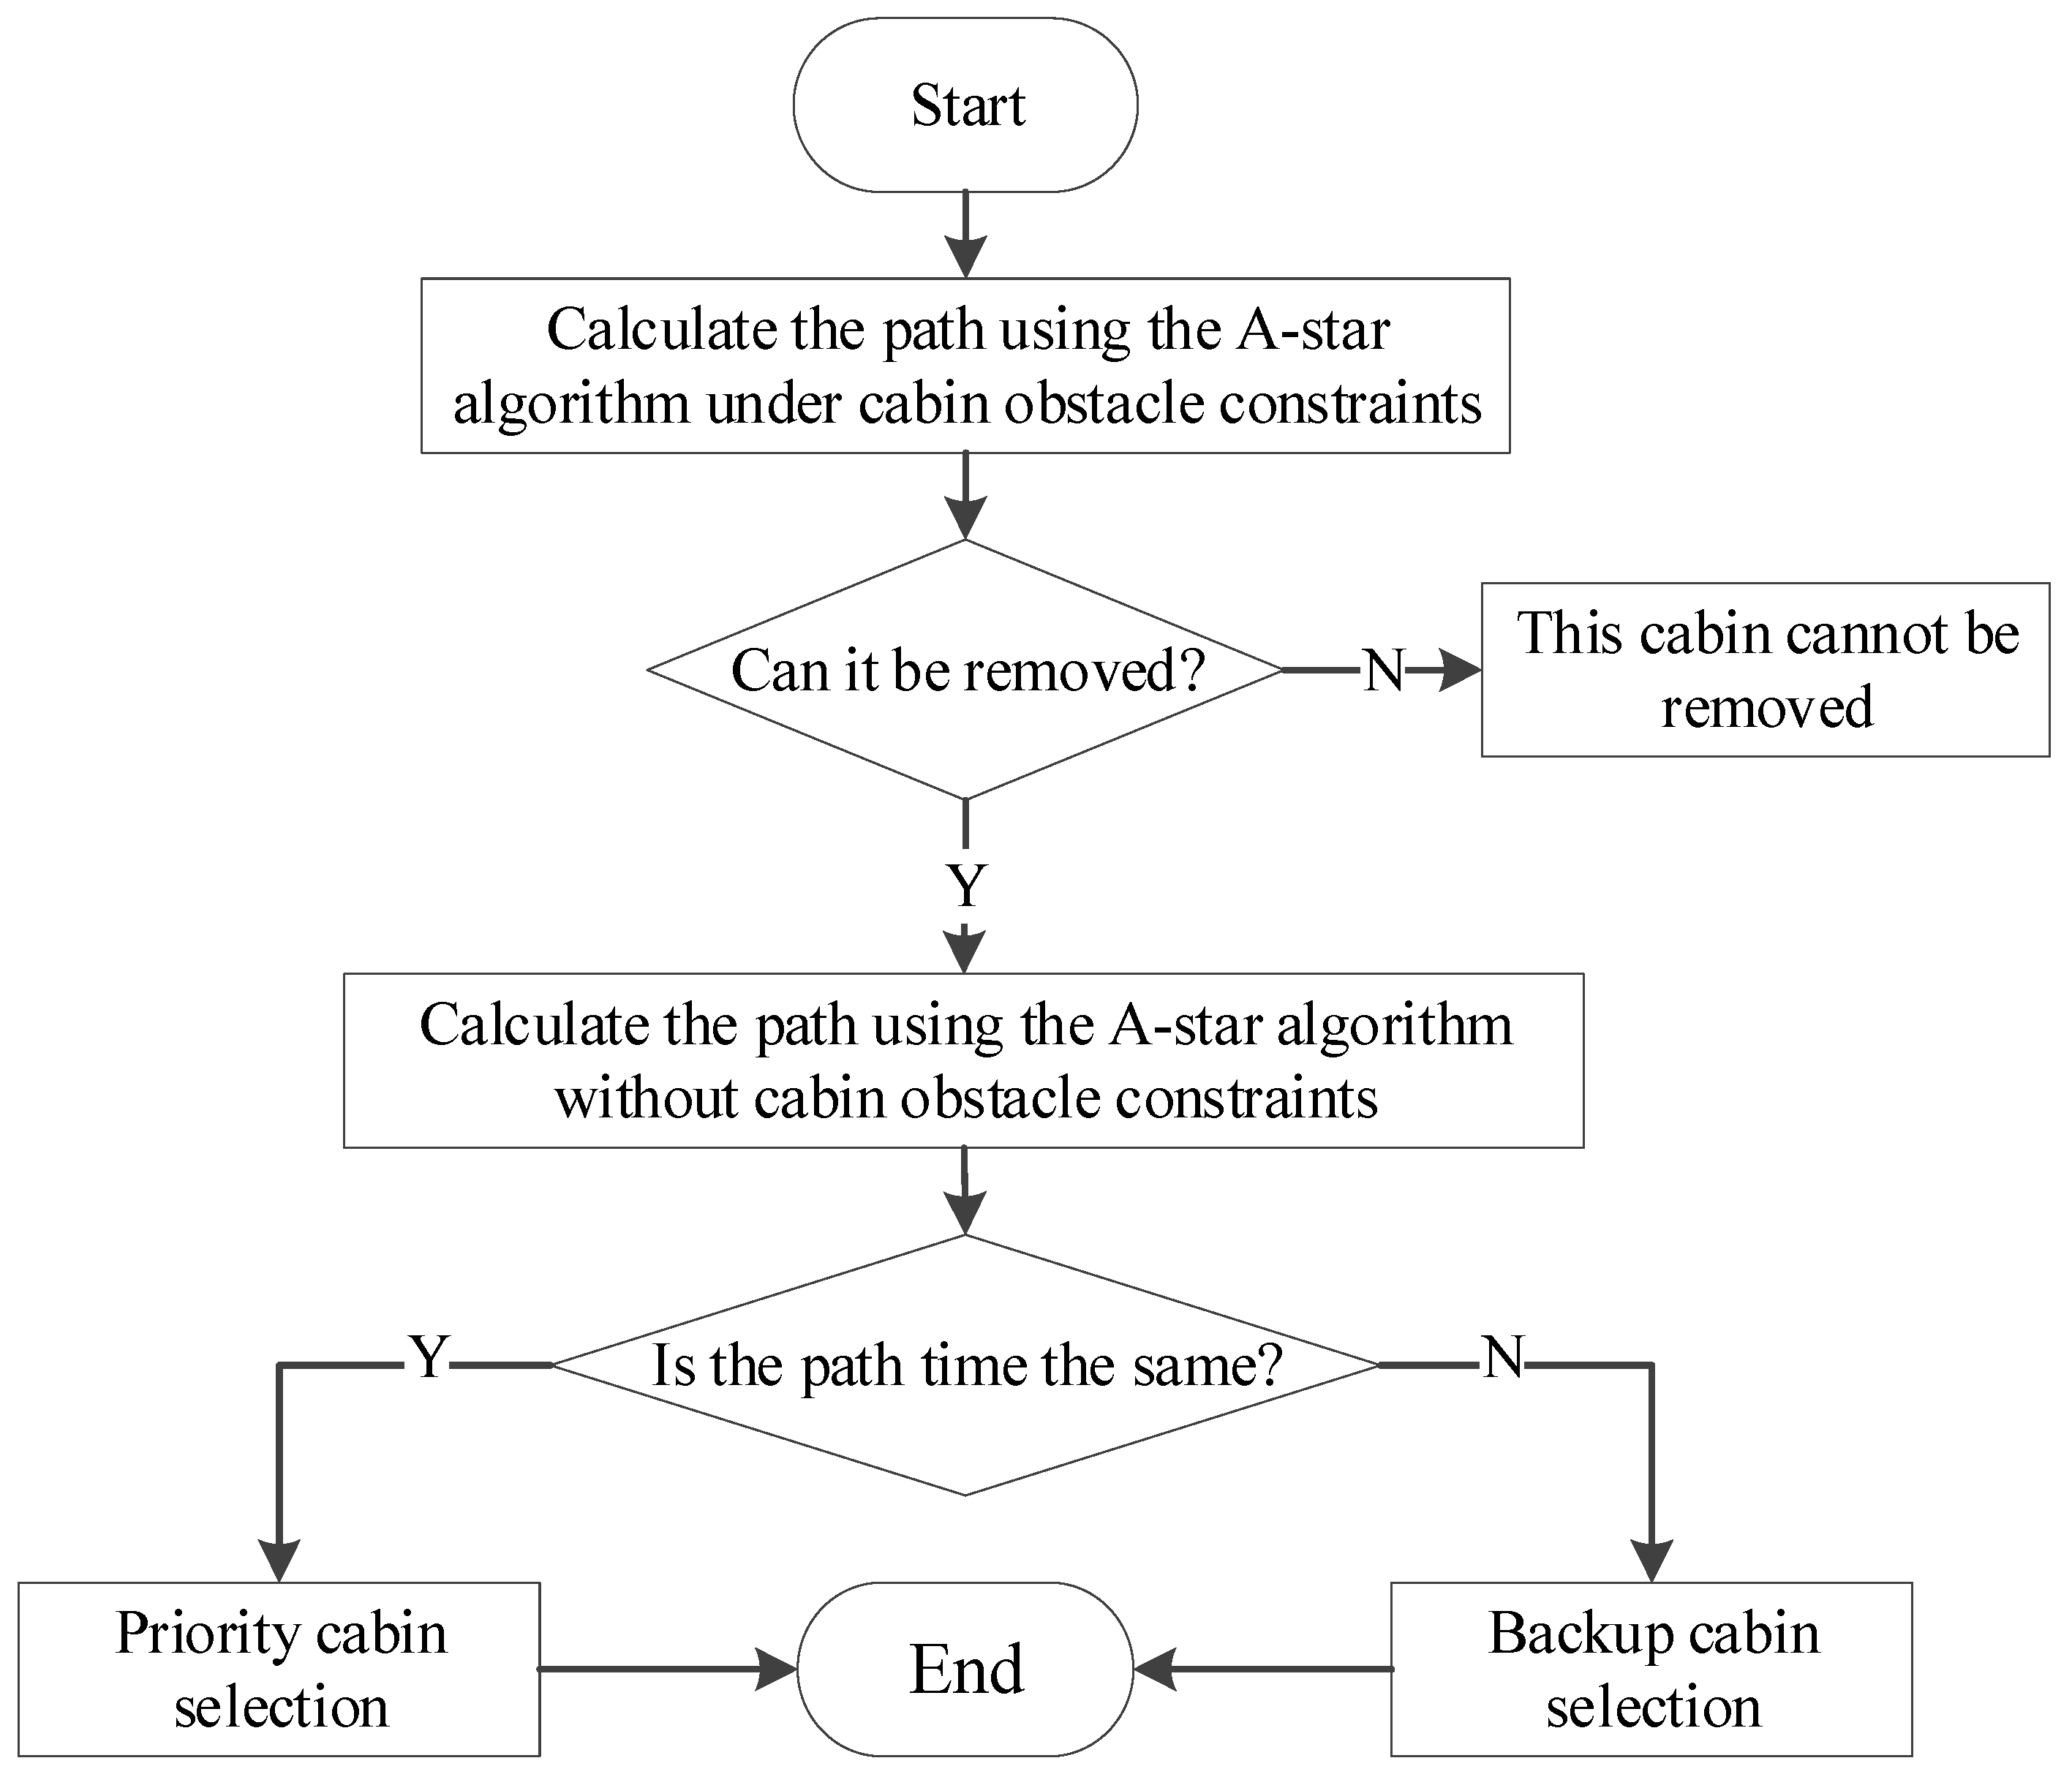
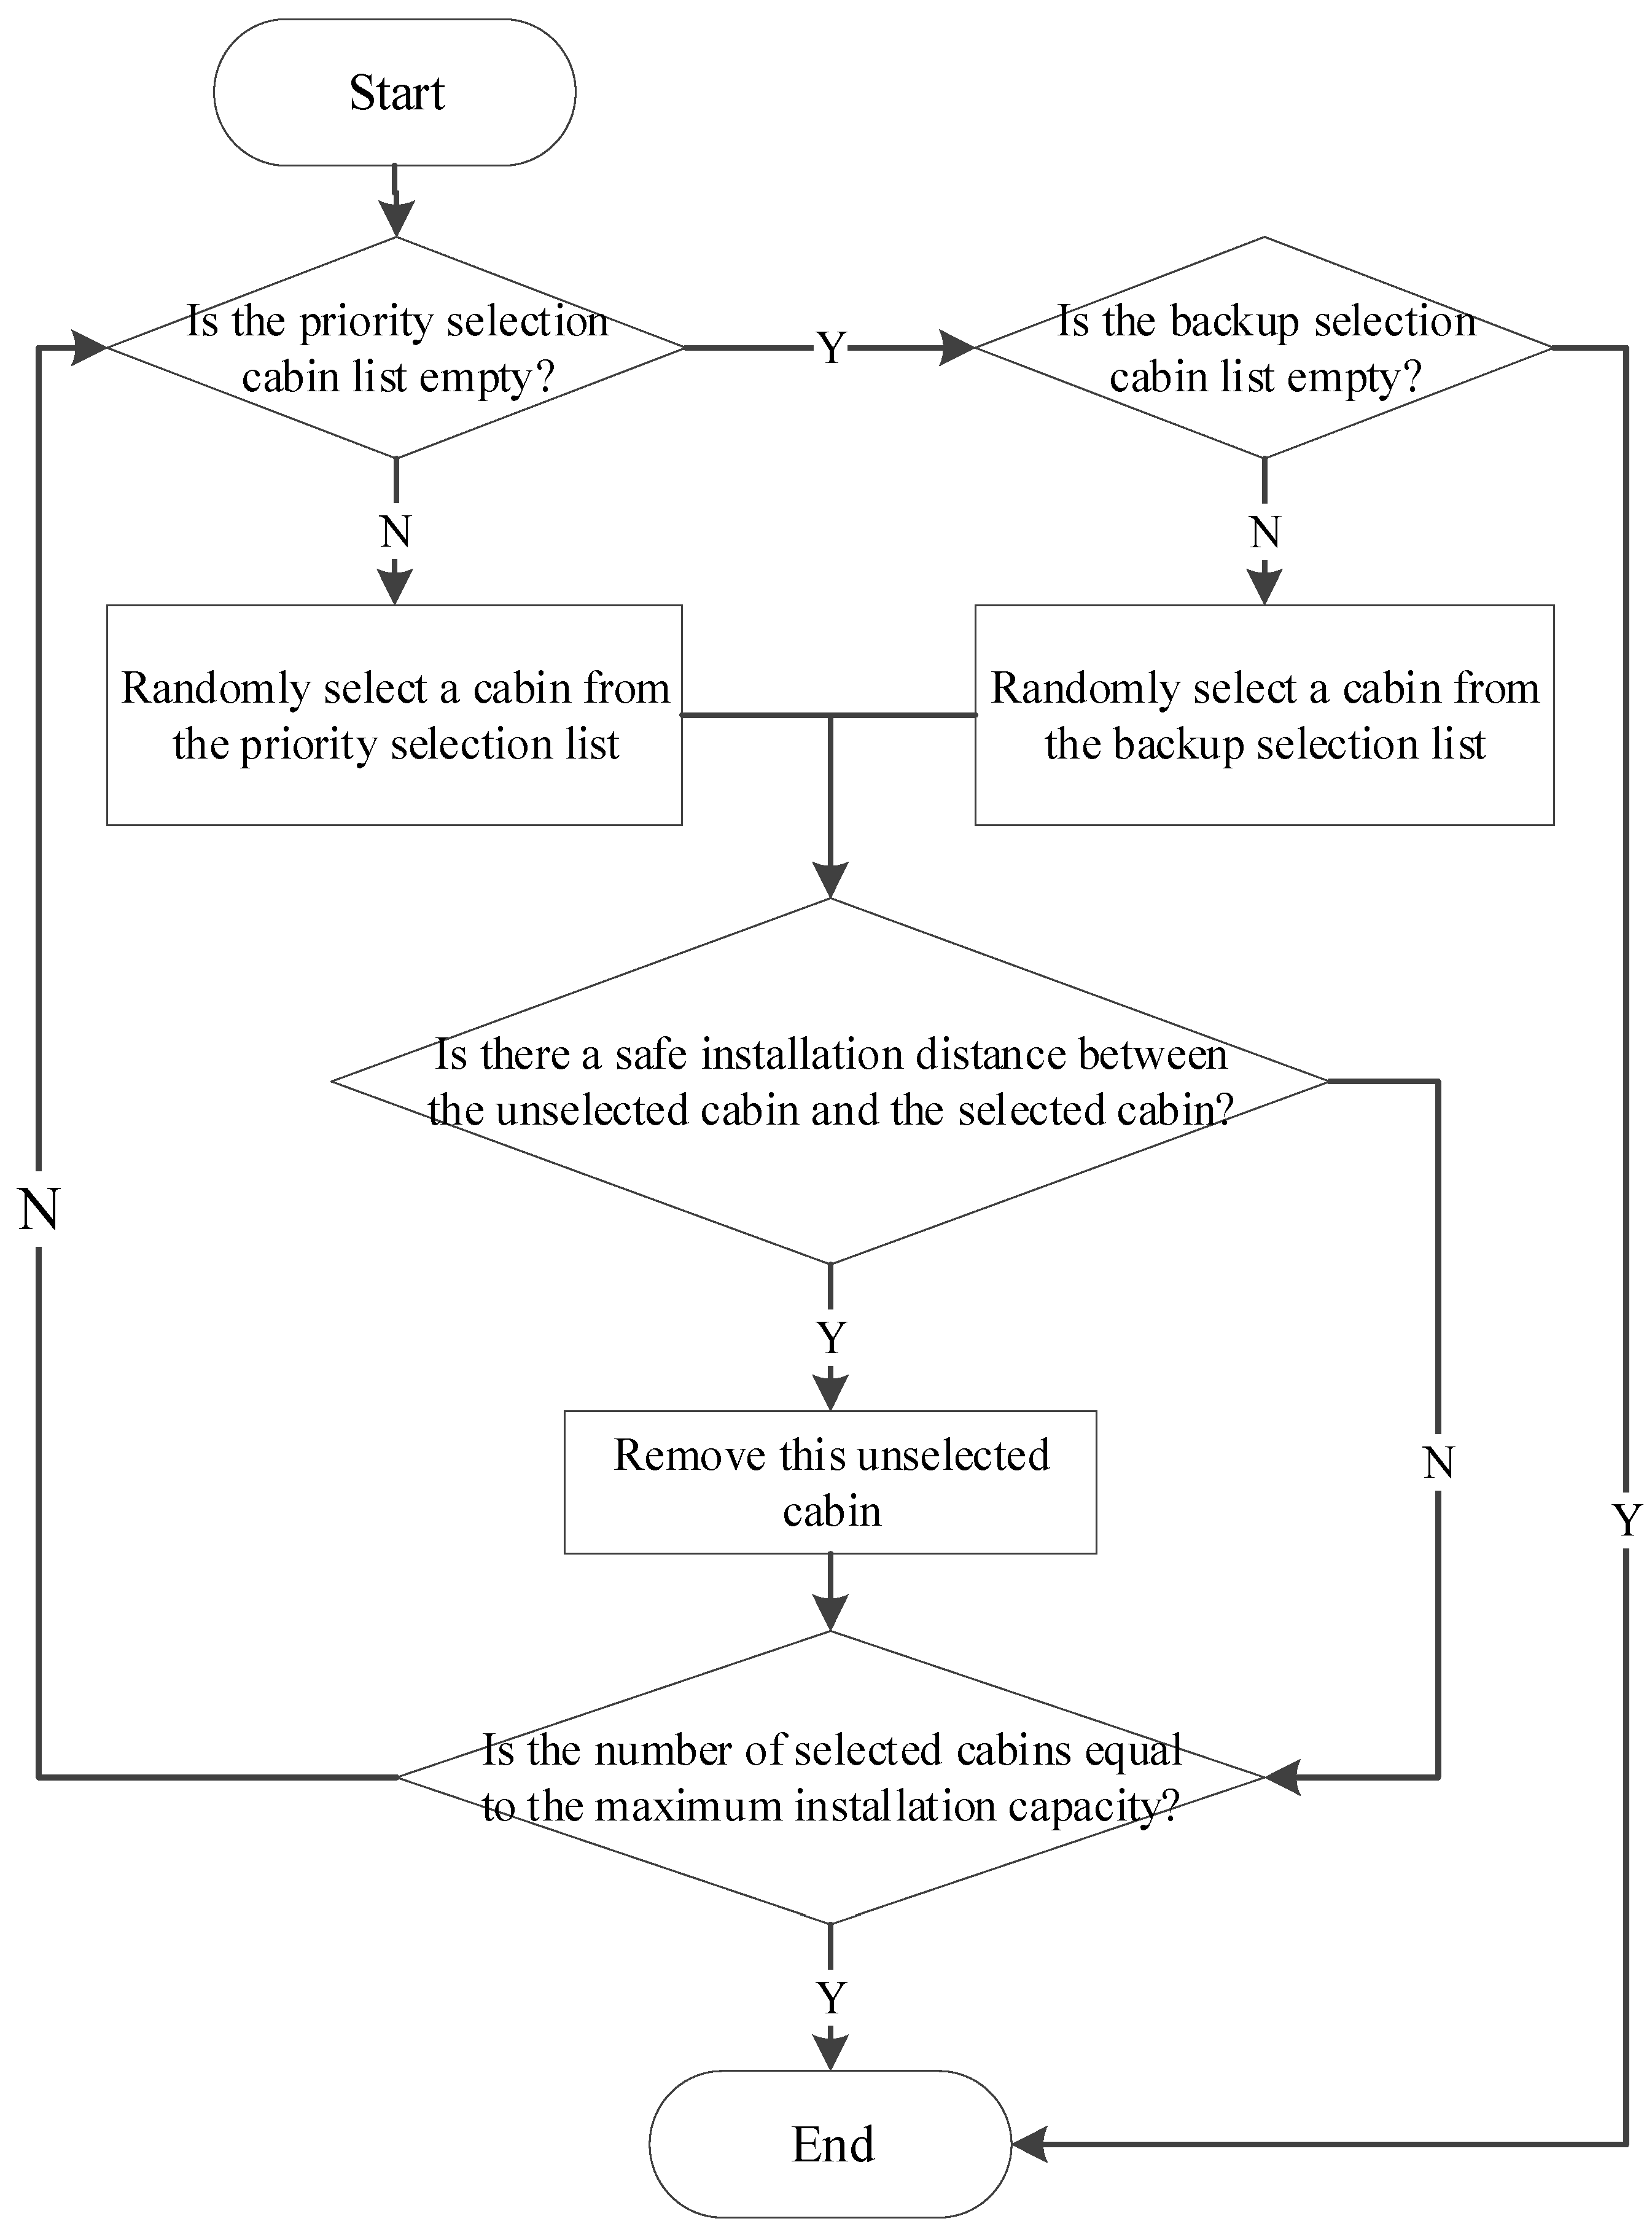
3.3. Reverse Planning Strategy for Cabin Transport Sequence Optimization

Due to the complexity of the ship’s internal structure and the density of the cabins, cabin blockage is a common issue. As a result, the determination of the optimal transport sequence is significantly influenced by the ship’s spatial layout. Given that in a multi-cabin transport process, earlier cabins are likely to obstruct later ones, thus affecting the optimal transport paths of all subsequent cabins, the reverse planning strategy is proposed as a suitable method for determining the transport sequence of large cruise ship cabins.
The core idea of the reverse planning strategy is to reverse the entire cabin transport timeline. This means assuming that all cabins have already been placed inside the ship, and then transporting them from their respective end points back to their starting points, according to a principle whereby no two cabins interfere with each other’s movement. When selecting cabins, priority is given to those that will not cause blockages during the transportation process, and further selection is made to identify those that can be installed in parallel, enabling fast follow-up transport. Once a batch of cabins has been fully transported, the next batch is selected and moved, continuing until all cabins have been transported. Thus, the reverse planning strategy not only determines the transport sequence of all cabins without affecting the optimal transport path, but also shortens the time gap between preceding and subsequent tasks, which ultimately helps to reduce the overall construction time.
In the reverse planning strategy, the principle for selecting cabins is crucial. Based on the selection types, it can be divided into three parts: the selection principle for removable cabins, the selection principle for installable cabins, and the selection principle for transportable cabins.
(1)
Selection Principle for Removable Cabins
Since the reverse planning strategy involves treating all cabins that have not yet been removed as grid obstacles in the grid map, the first step is to select the cabins that can currently be removed. Using the improved A-Star algorithm, the shortest transport path for each cabin is optimized. From these, cabins that will not cause blockage during transport are selected as the removable cabins. Once the removable cabins are determined, the shortest transport time for these cabins is calculated. If there are cabins whose transport time remains unchanged, these are prioritized as installable cabins.
The specific process for selecting removable cabins is shown in Figure 5.
(2)
Selection Principle for Installation
To ensure the safe installation of the cabins, a certain safety distance must be maintained around each one during installation. This means that while installing the current cabin, no other cabins can be moved into the surrounding area. Therefore, when selecting cabins for installation, it is essential not only to consider whether the shortest transport time of the current cabin remains unchanged, but also to verify that a sufficient safety distance exists between the current cabin and other cabins that are ready for transport. It is also important to note that there is a maximum limit to the number of cabins that can be installed simultaneously within the entire transport area. The selected cabins for installation cannot exceed this maximum limit. This ensures that the installation process remains within the available space and adheres to the operational constraints, thus avoiding potential conflicts and optimizing the overall workflow.
The specific process for selecting cabins for installation is shown in Figure 6.
(3)
Selection Principle for Transportation
Once all the selected cabins for installation have been installed, the next step is to select cabins from the installed ones for transportation. It is important to note that there is a maximum limit to the number of cabins that can be transported at the same time within the entire transportation area. Therefore, the number of cabins being transported simultaneously cannot exceed this limit.
The specific process for selecting cabins for transportation is shown in Figure 7. This process continues iteratively until all the cabins have been successfully transported to their designated locations.
Since the reverse planning strategy reverses the pushing timeline of the cabins, it is necessary to perform a reversal of time once all cabins have been transported. By calculating the entry time for each cabin, the actual entry order of the cabins can be determined.
The formula for calculating the entry time of each cabin is as follows:
t az , i = t max a × T az , i
t tc , i = t max t az , i T tc , i 1 i k t max t az , i T tc , i t az , i , max t az , i , i > k t max t az , i , max T tc , i t az , i , max > t az , i , i > k
where taz,i represents the installation start time, ttc,i denotes the entry time, i is the sequence number, k is the maximum number of cabins to be pushed, tmax is the total time for path planning, Ttc,i is the transportation time, α is the installation time, and Taz,i represents the number of iterations of the reverse planning strategy.
Below is a simple numerical example to illustrate the application of the reverse planning strategy. Suppose the total planning time is tmax = 1000, the installation time coefficient is α = 5, and the maximum number of simultaneous cabin pushes is k = 3. For three cabins (i = 1, 2, 3), let the values of Taz,i be 10, 12, and 15, and the values of Ttc,i be 30, 35, and 40, respectively. According to Equation (7), the installation start times in the reverse planning process, taz,i, are calculated as 950, 940, and 925. Furthermore, using Equation (8), the entry times in the forward construction process are determined to be 20, 25, and 35, respectively. It can be observed that although the installation start times in the reverse planning process decrease (950, 940, 925), the corresponding entry times in the forward construction process increase sequentially (20, 25, 35). This outcome demonstrates that the reverse planning strategy effectively back-calculates the timing of operations, thereby ensuring the optimal overall construction path, while meeting the constraints of parallel operations.

4. Multi-Transportation Path Planning Based on the Improved A-Star Algorithm

In this study, taking the typical structure of a cruise ship as an example, aside from the cabins that need to be installed on-site, there are total of 70 modular cabins. The layout of this deck of the cruise ship is shown in Figure 8. In this layout, the designated installation positions of the modular cabins are shown in Figure 9. The purple positions marked in bold represent the locations where the push-in openings are designed to be.

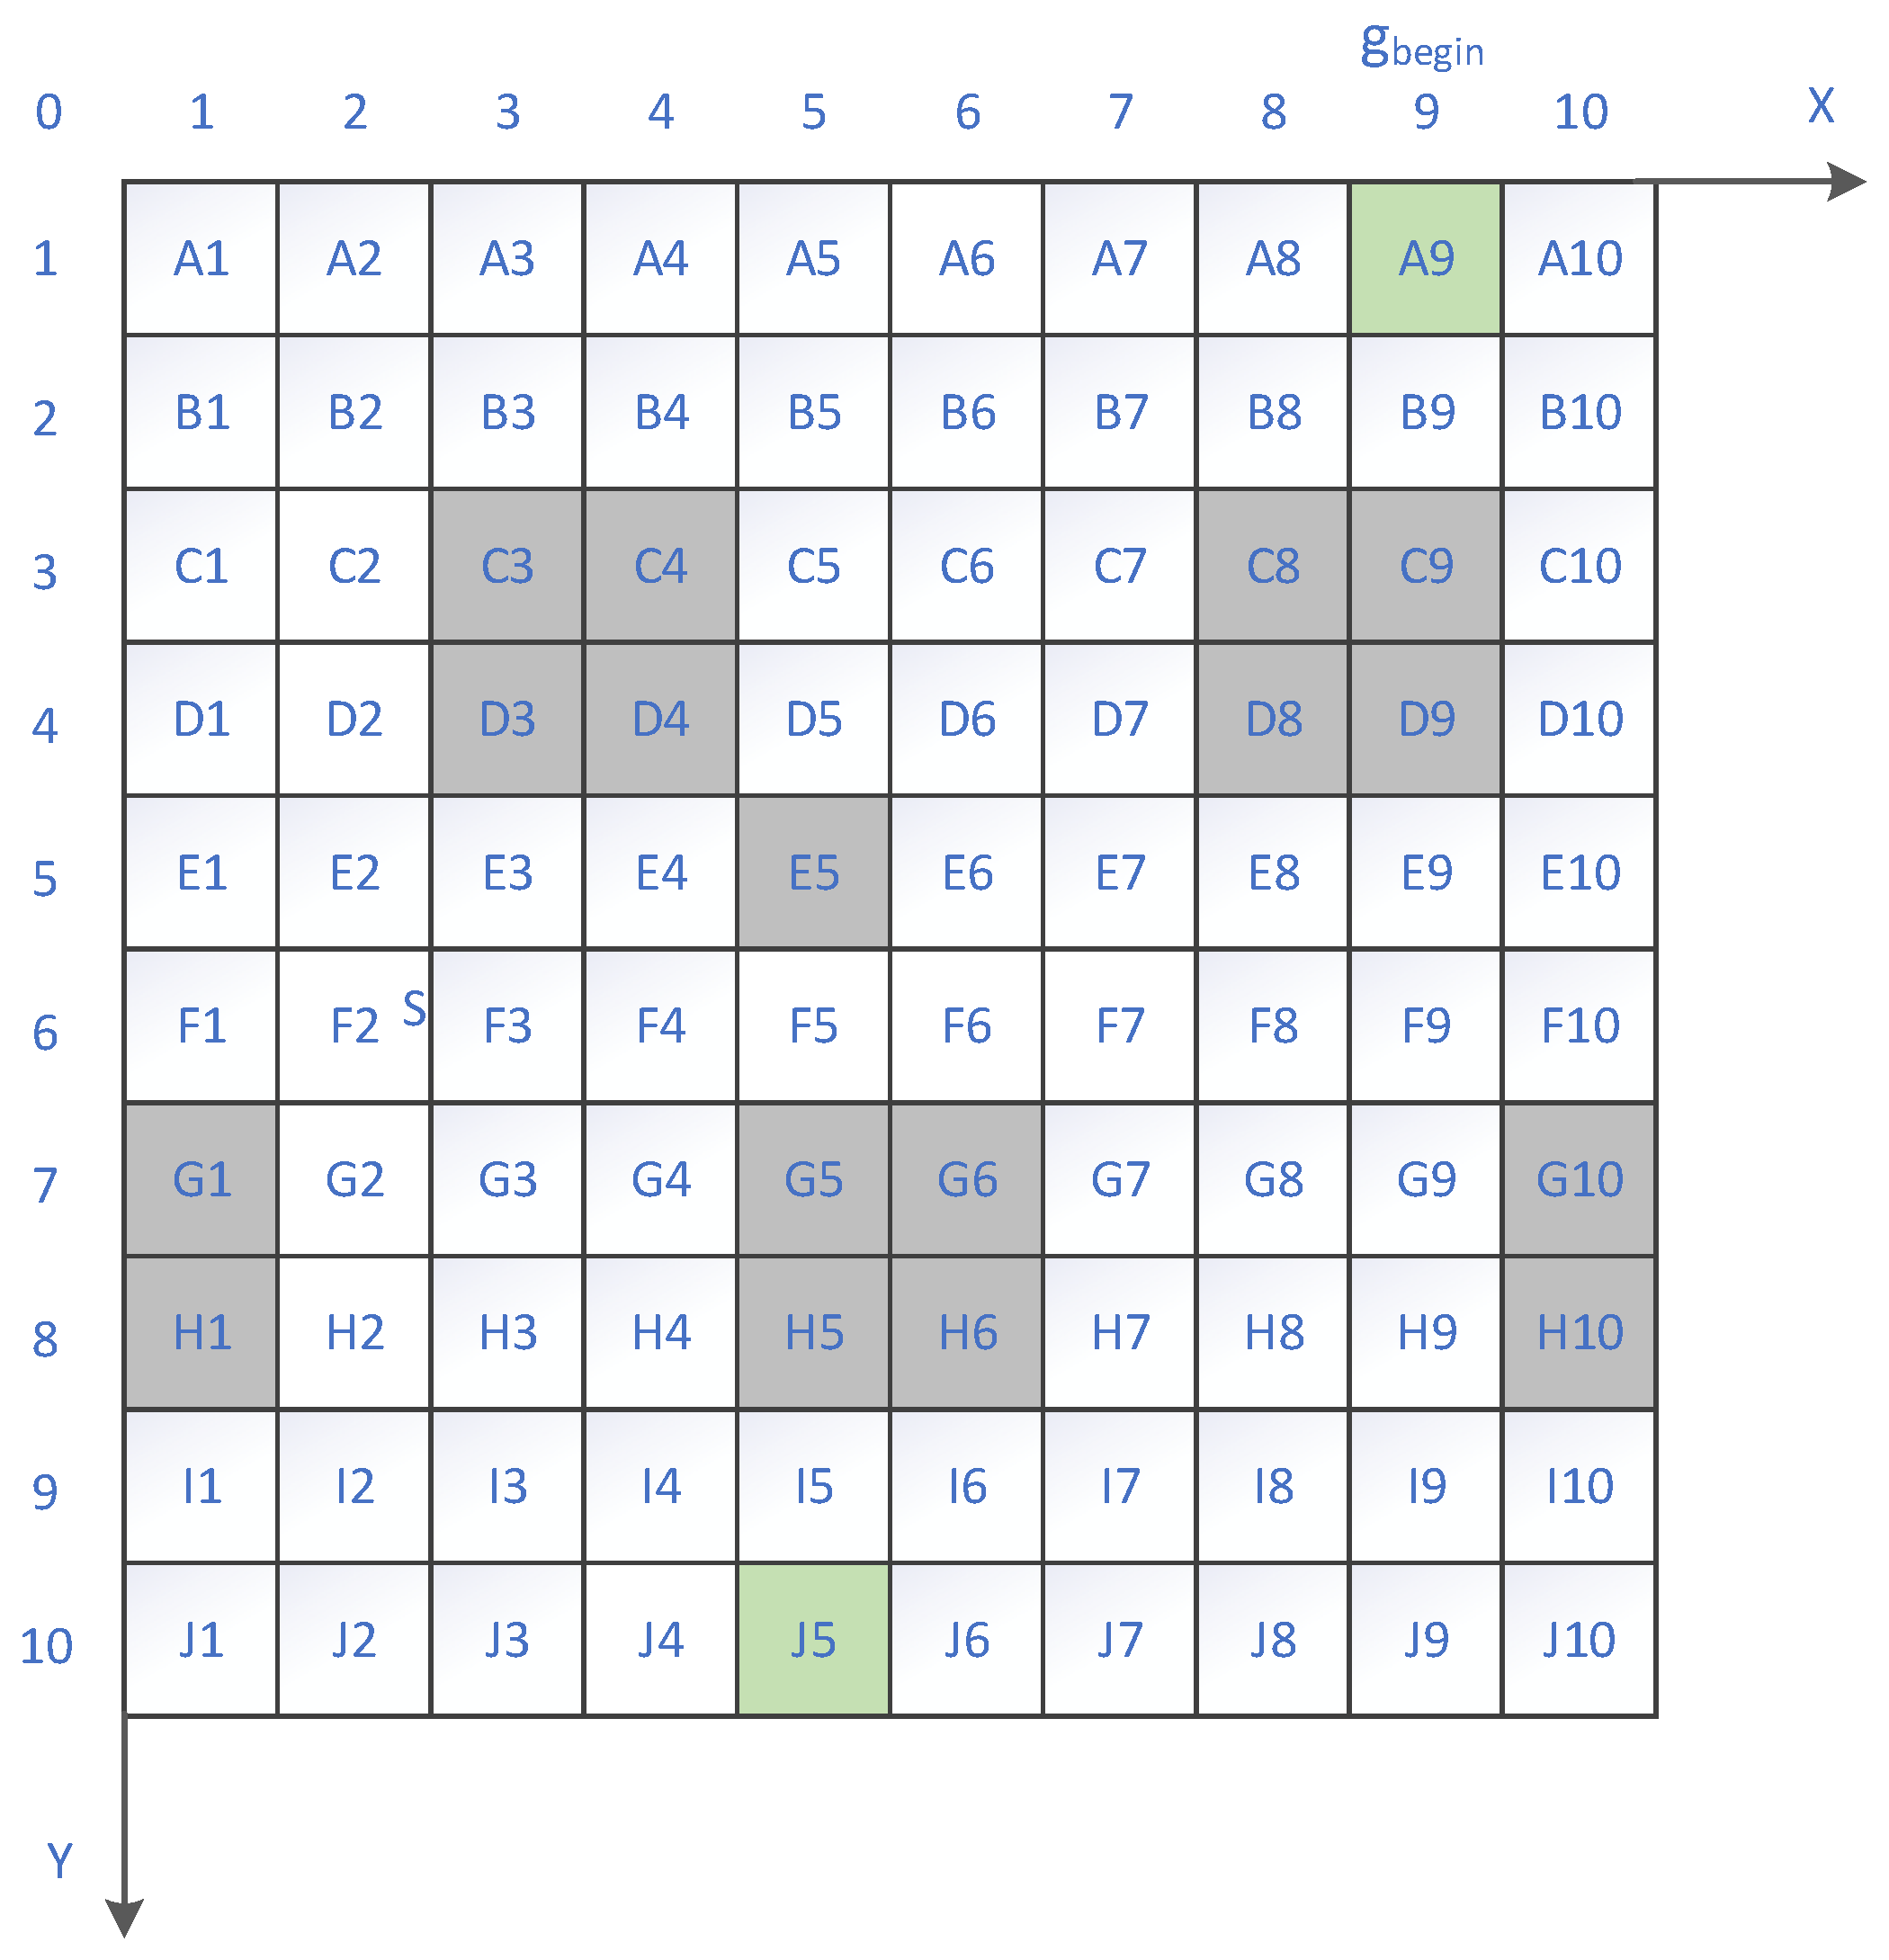
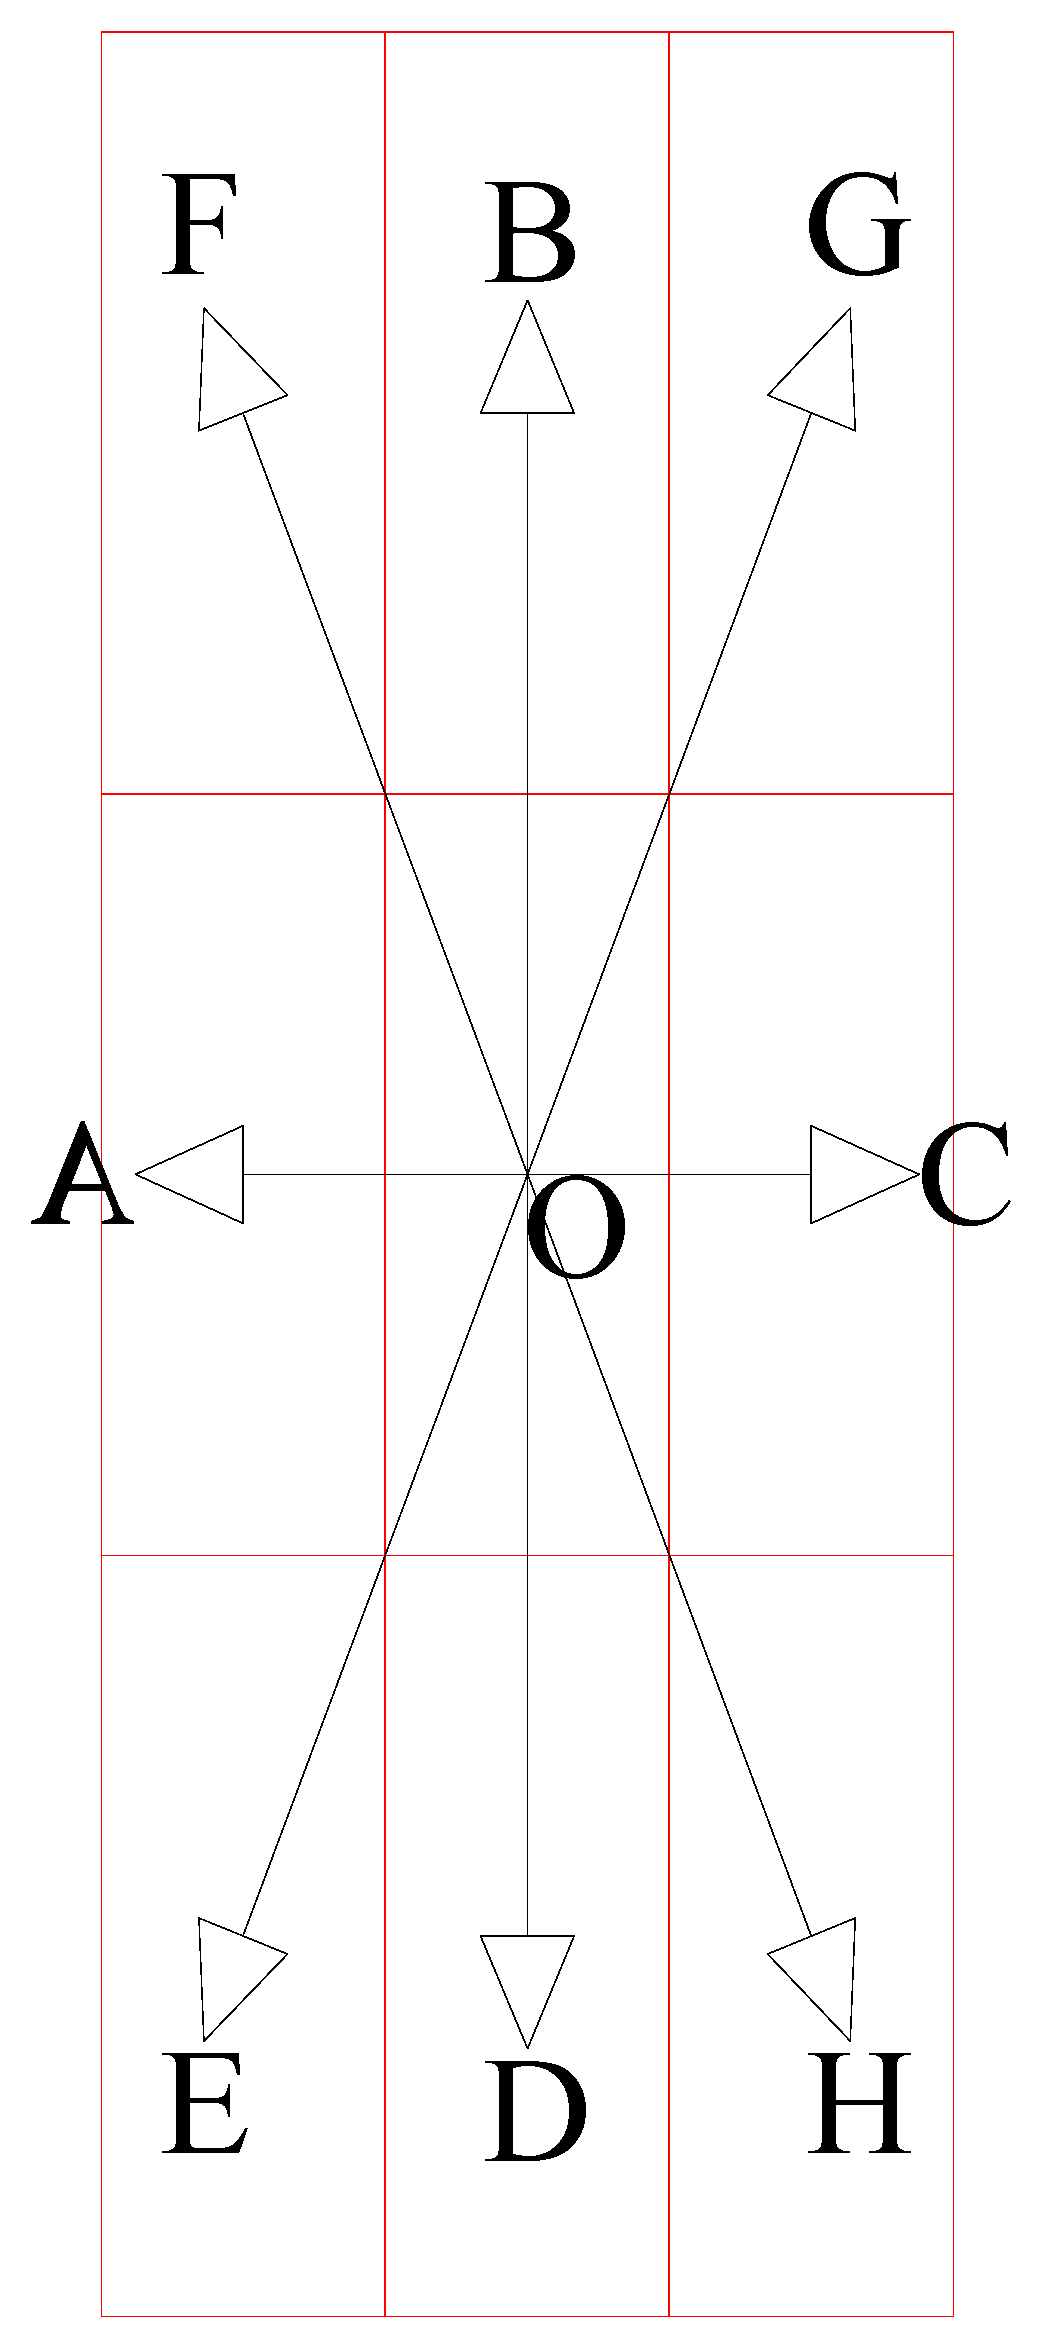
4.1. Definition of the Grid Map

Due to the specific requirements of the large cruise ship push-in operation, modular cabins must be transported within the ship’s interior. To limit the scope of path search, the outer plate position of the cruise ship is set as the boundary of the map. Given the large number of cabins and the complex internal structure of the cruise ship, an inappropriate grid division may lead to an inaccurate representation of each module and obstacle, thus affecting the efficiency and accuracy of the path planning. Therefore, simplifying the map model by selecting an appropriate grid size is a crucial step to improve both the efficiency and accuracy of the cruise ship push-in path planning.
When performing the grid mapping, the following factors need to be considered:
(1)
The grid size should be uniform to facilitate accurate calculation of push-in path distances and time.
(2)
The grid should evenly cover each deck of the ship’s structure to ensure comprehensive path search.
(3)
Multiple modules should not occupy the same grid cell, to avoid interference and conflicts between the cabins.
(4)
Existing cabins and other obstacles should be represented by one or more grids to accurately reflect their position and shape.
(5)
A grid cell should not simultaneously contain both obstacles and modular cabins, to avoid interference and misjudgment during the path search.
(6)
Bulkheads and outer plates, as boundary constraints, must lie on the grid lines to limit the scope of the path search.
(7)
The grid should be as simple as possible to facilitate computation and reduce calculation time.
Based on the above analysis, this study divides the decks into rectangular grids, each measuring 7440 mm along the ship’s width and 2900 mm along the ship’s length. Under this grid division, the research object can be fully partitioned, ensuring that each modular cabin corresponds to a unique grid point, and the bulkheads align with the grid lines. The origin of the grid map is set at the starboard side near the aft of the ship, with the x-axis extending along the ship’s length from the stern to the bow, and the y-axis extending along the ship’s width from starboard to port. The grid at coordinates (32, 4) represents the push-in entry point for all modular cabins.
The simplified grid map of the foredeck push-in section of the large cruise ship’s first deck is shown in Figure 10. In this map, the horizontal axis of the coordinate axis represents the length direction of the ship, the vertical axis represents the width direction of the ship, the thick solid lines represent bulkheads (line obstacles), the diagonal-filled grids represent non-prefabricated cabins (grid obstacles), and the grid cells filled with square lines represent the target locations for the transportation of all modular cabins.

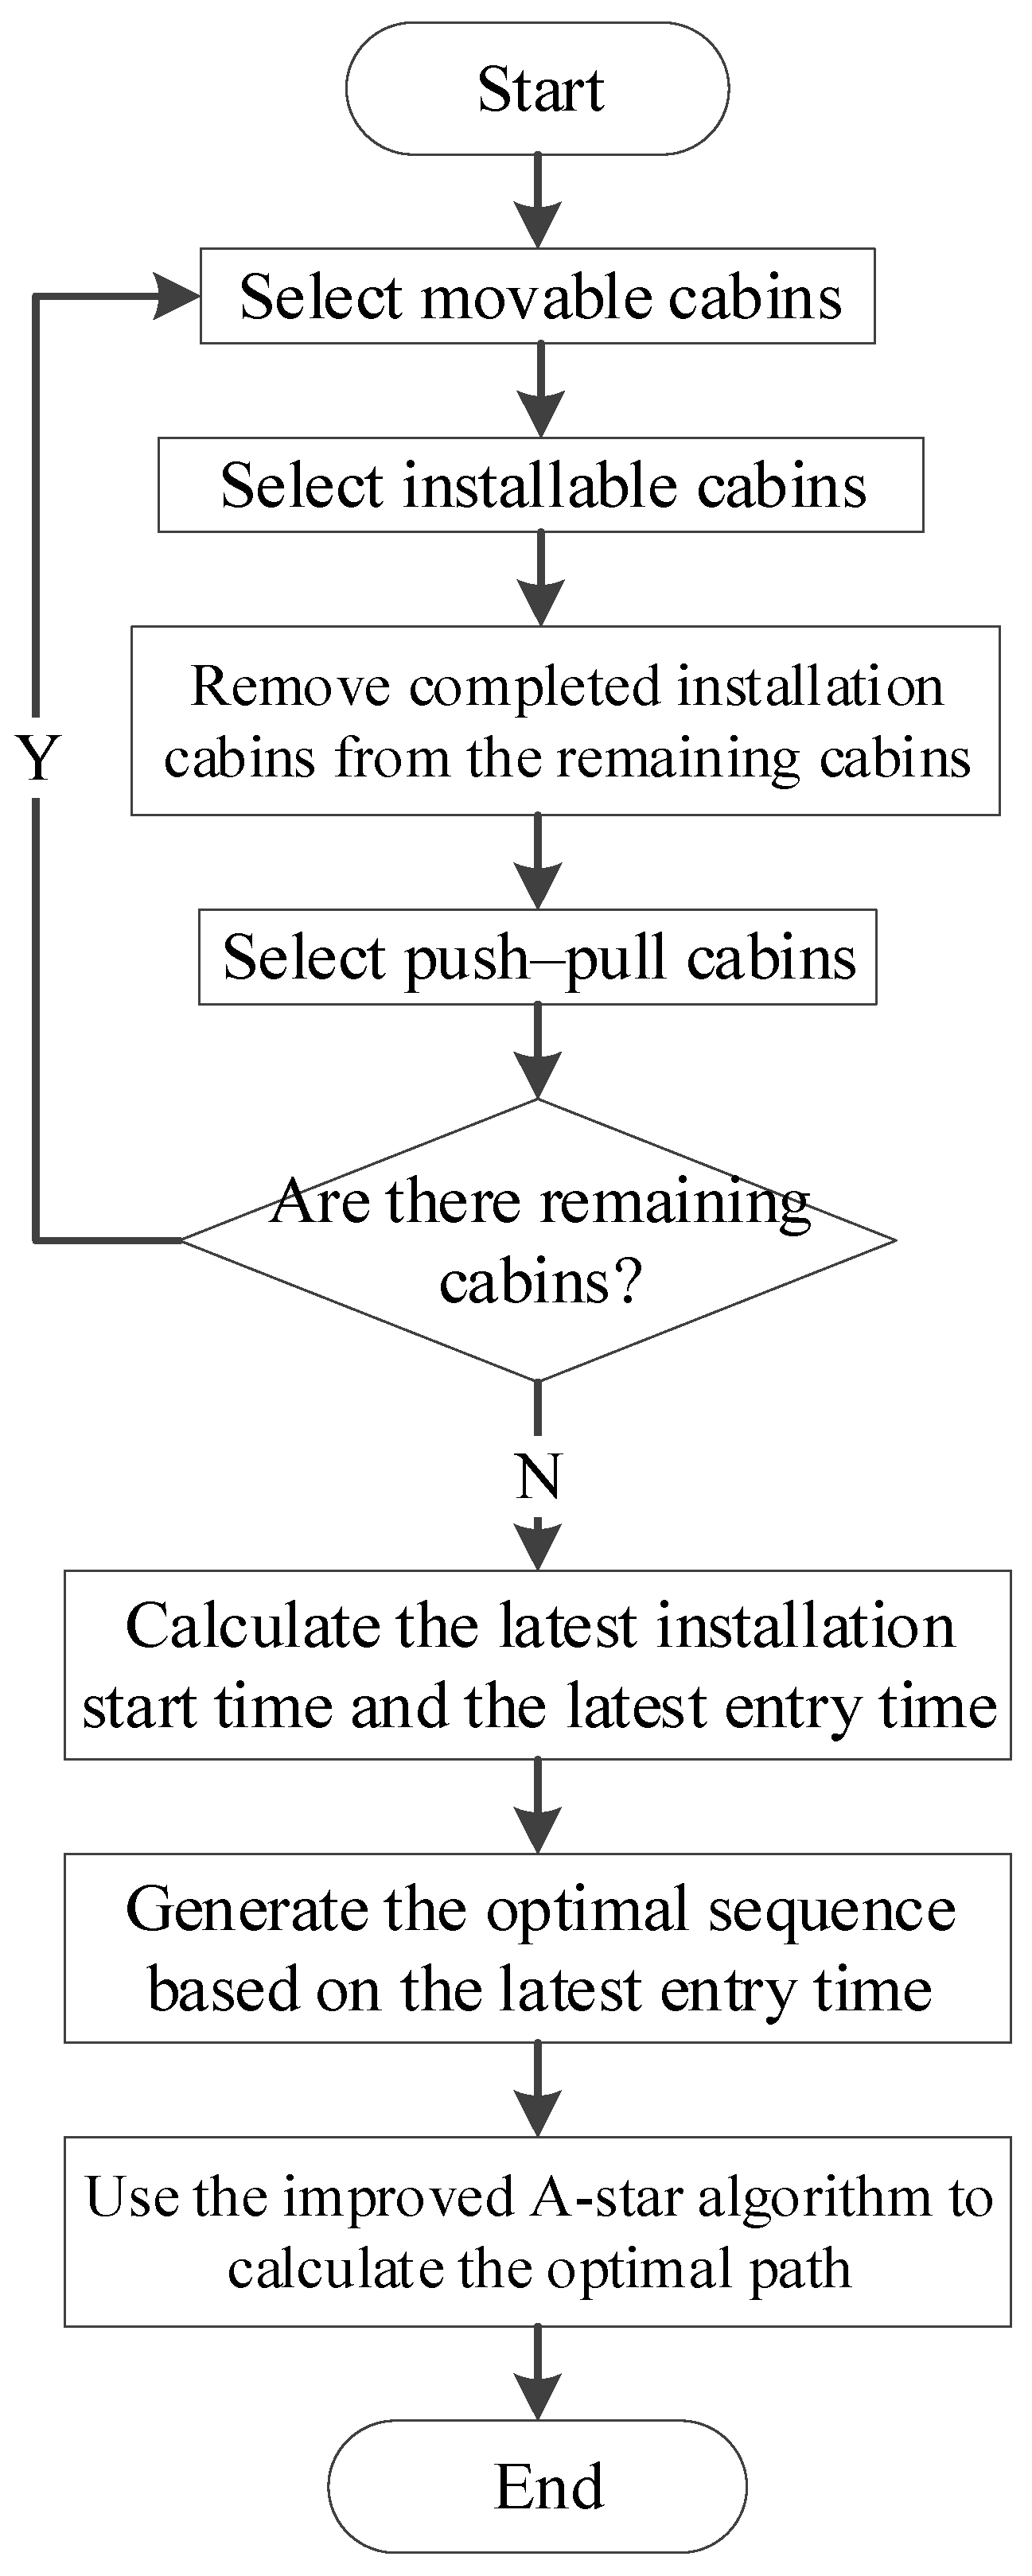
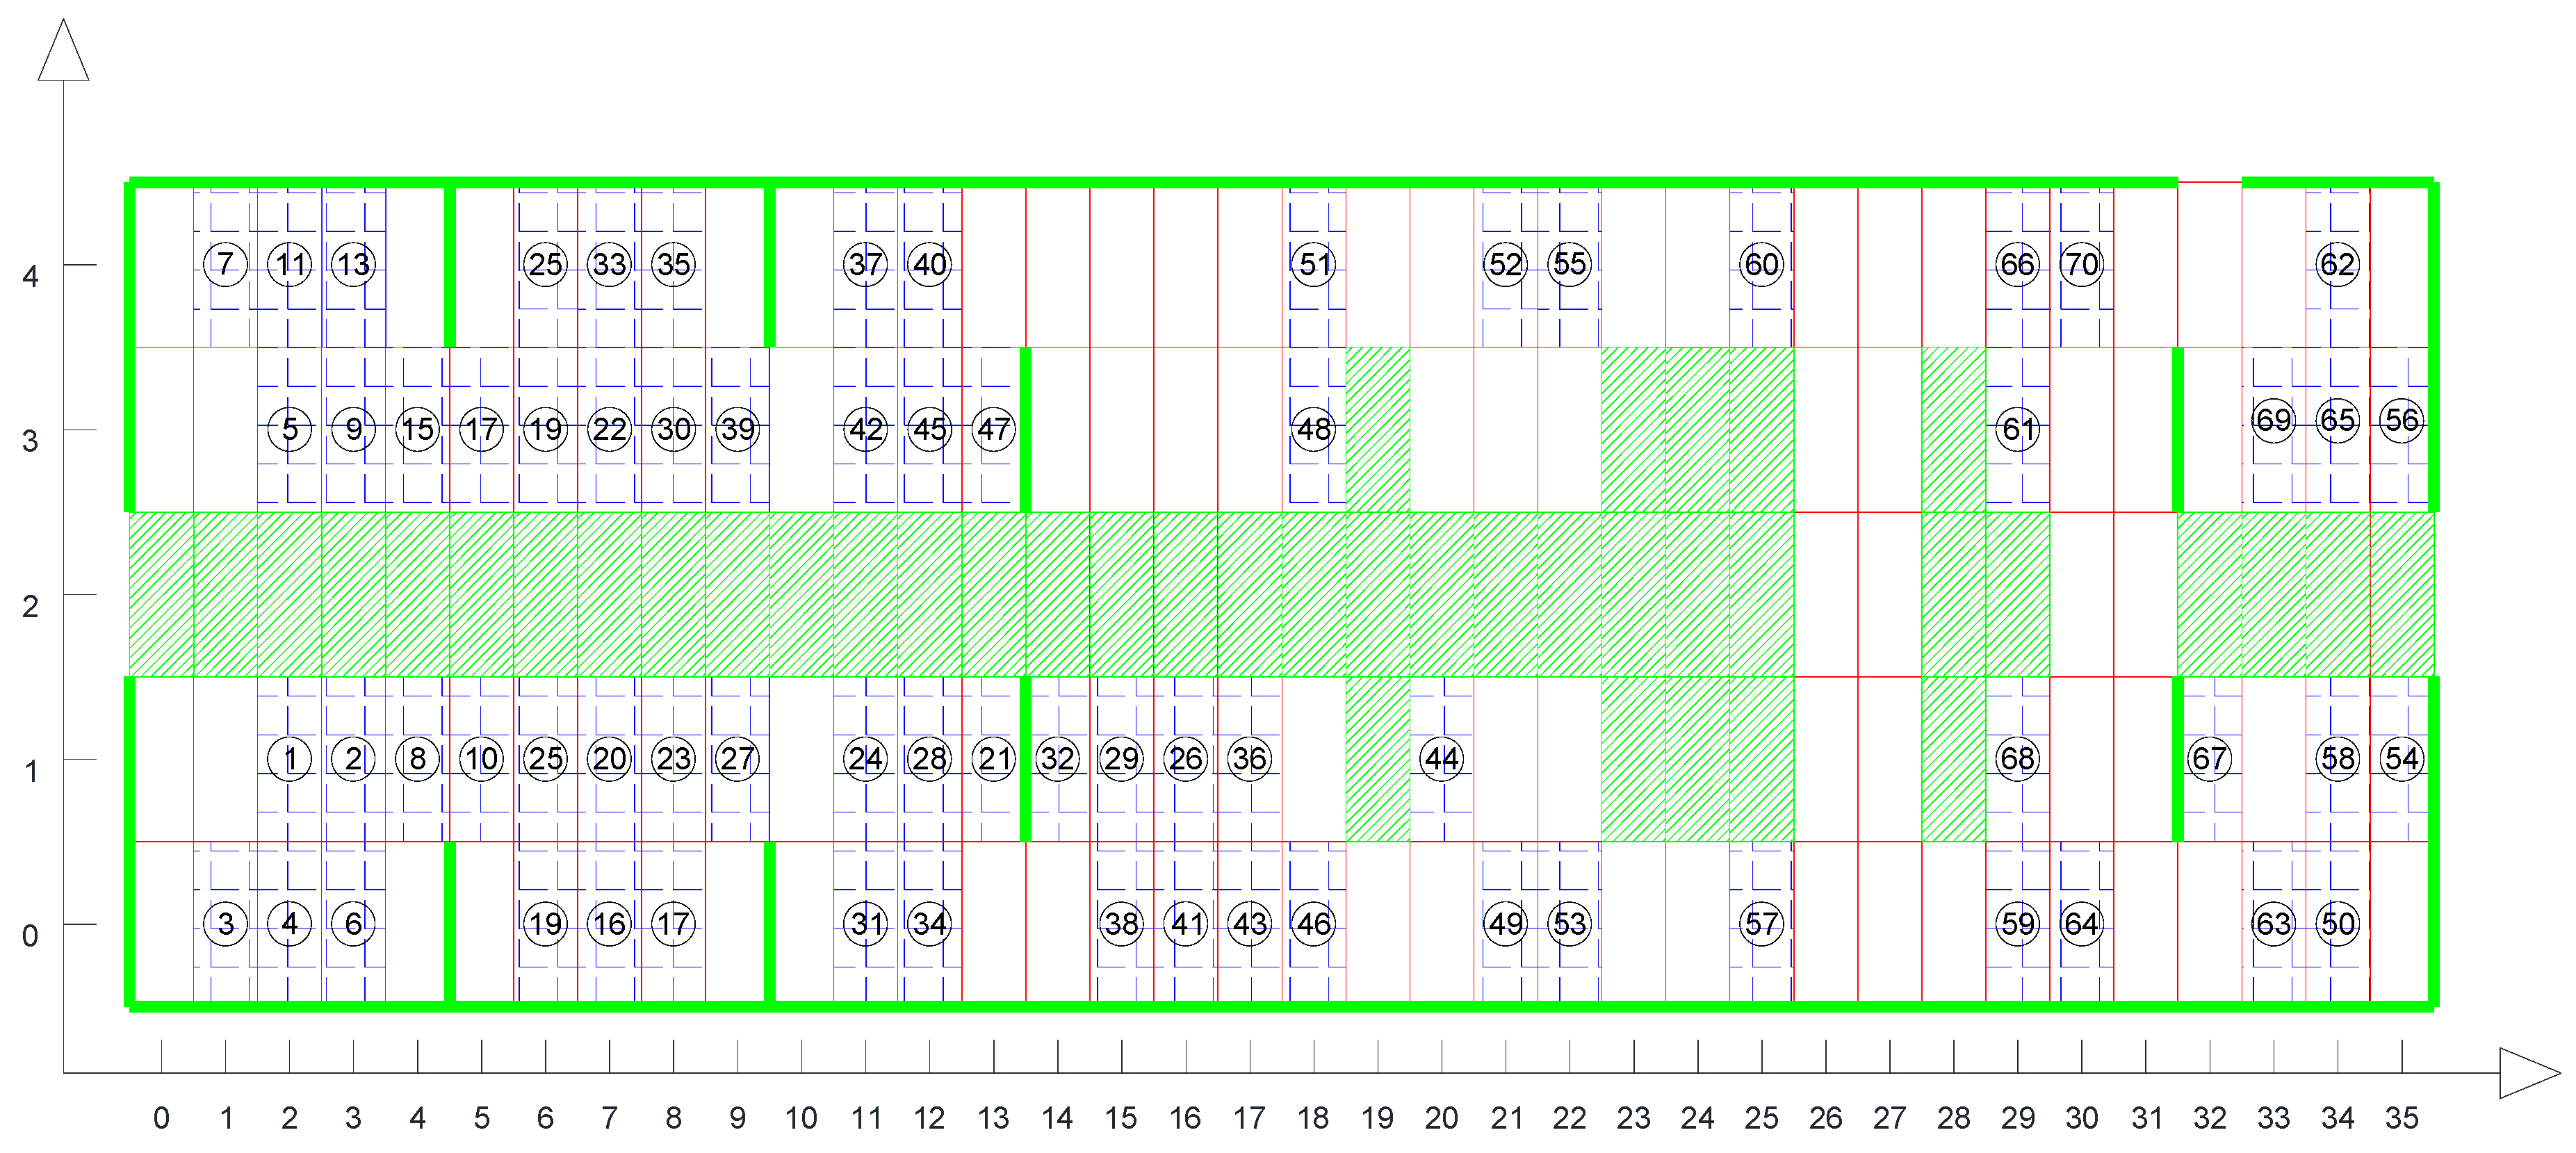
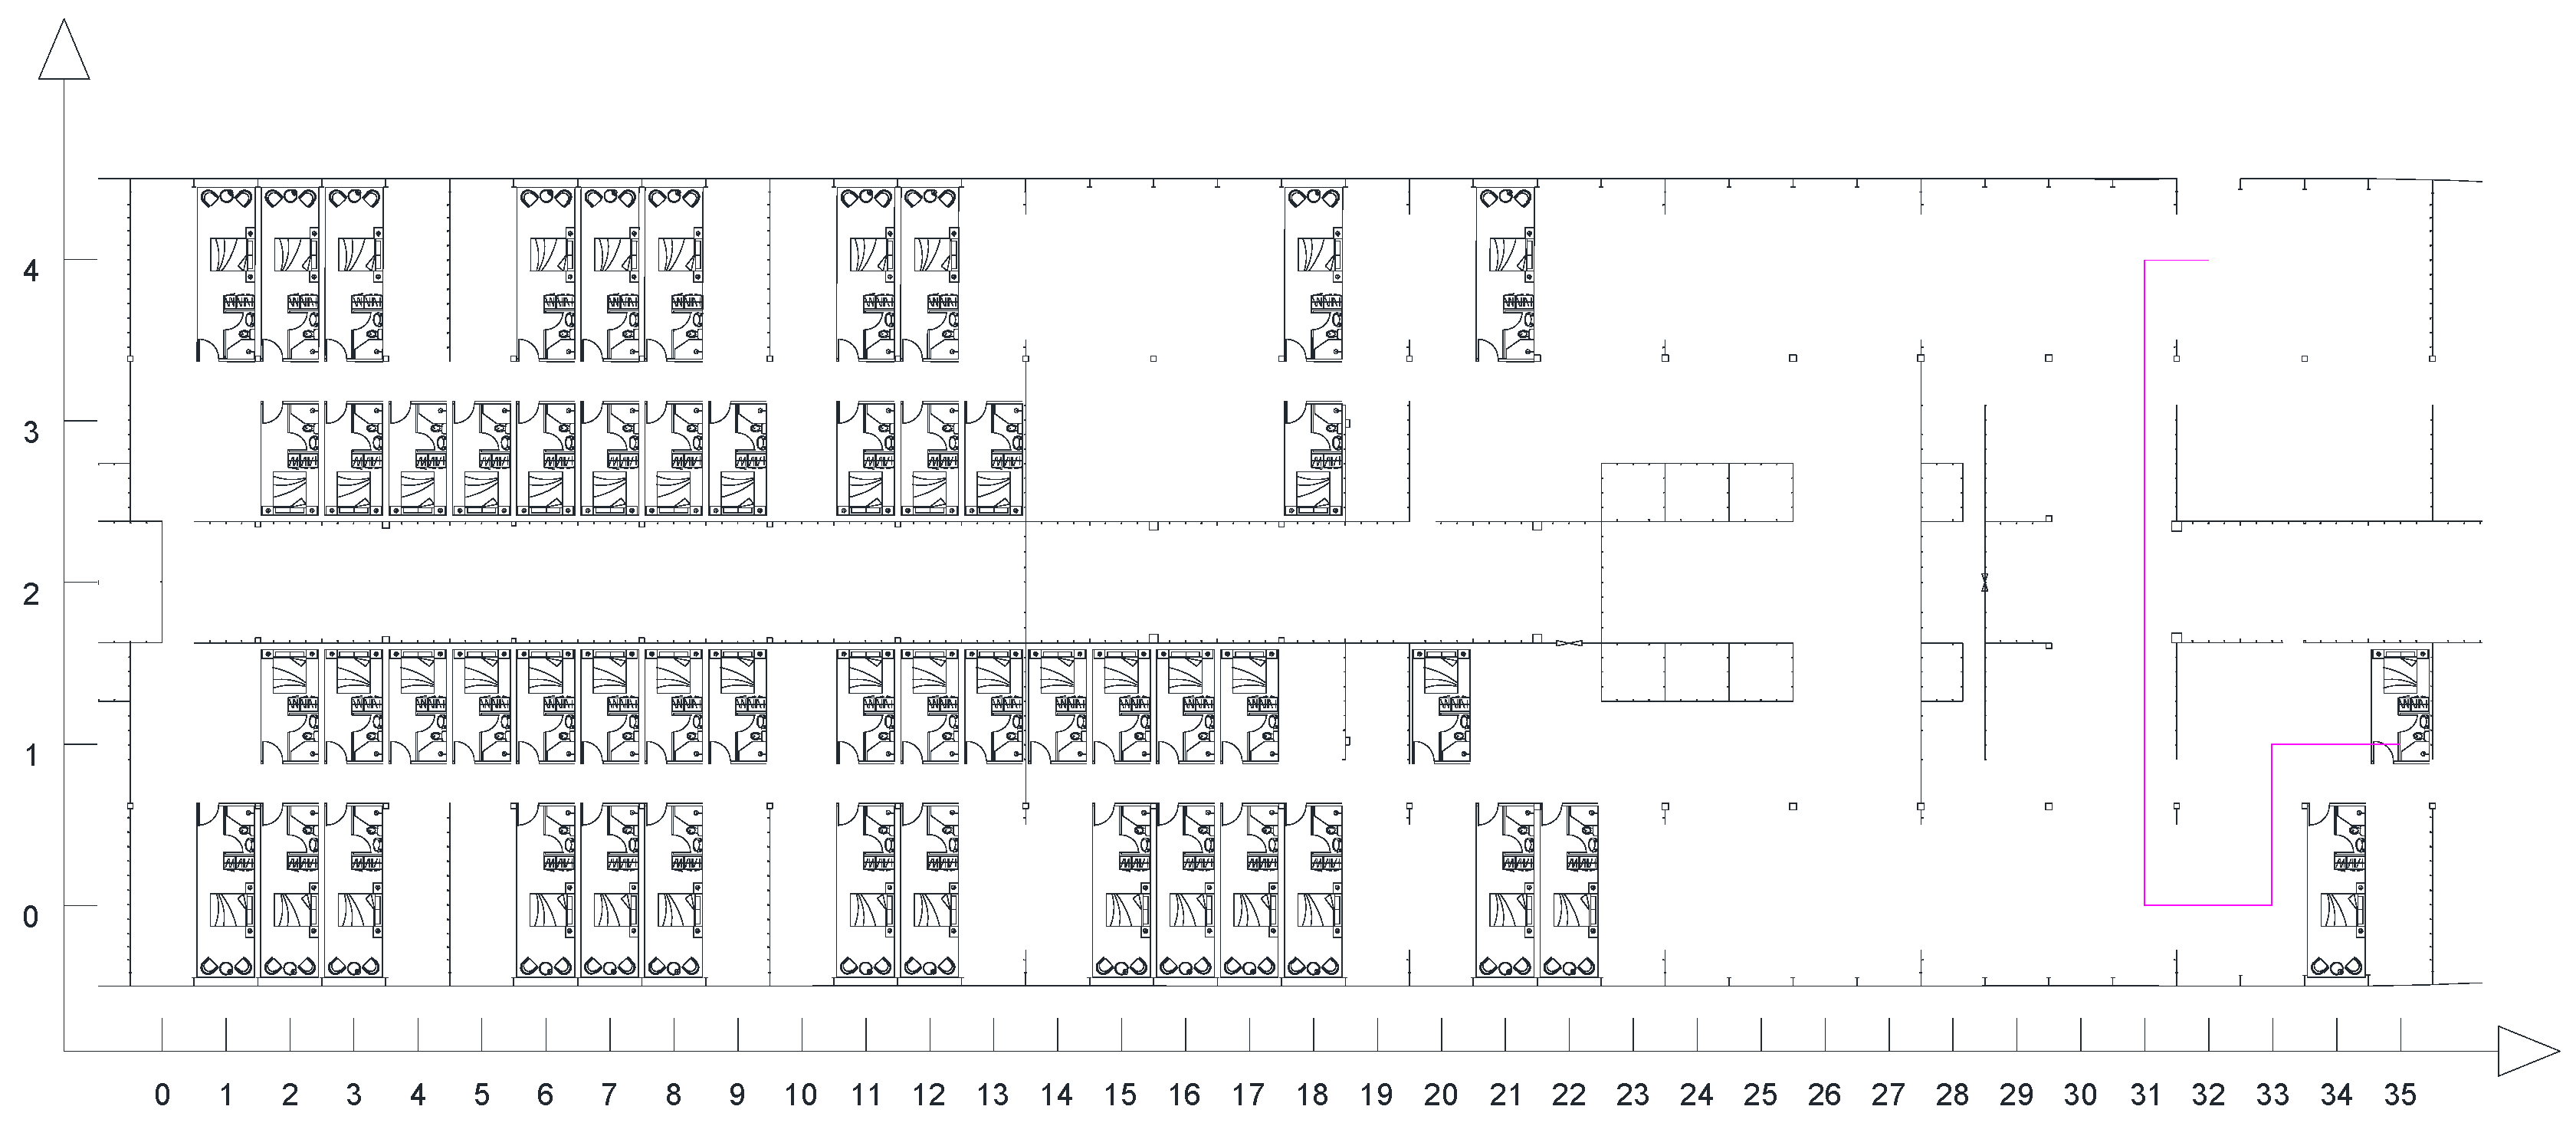
4.2. Transport Path Planning

This study combines the improved A-Star algorithm with the reverse sequence planning strategy, using the grid map from the previous section, to design a planning scheme for the transport sequence and path of the cabins on the cruise ship.
In the grid, the transport direction of modular cabins typically offers eight possible directions, as shown in Figure 11, namely OA, OB, OC, OD, OE, OF, OG, and OH. However, in practical working environments, due to the large volume of modular cabins and the numerous pillars within the ship’s cabins, cabins are prone to collisions with bulkheads and other obstacles during transport. Moreover, diagonal transport is not supported within the ship’s aisles. Therefore, this study only considers movement in the four cardinal directions: OA, OB, OC, and OD. Even though this may result in a slight increase in the planned path length, this approach is more consistent with the practical conditions of the construction environment, and is therefore both reasonable and necessary.
In the optimization of the transport path for each cabin, the grid map allows the transport time of each cabin to be equated to the path length of the movement. However, due to the rectangular shape of the cabins, the transport times along the length and width directions are not exactly the same. For the problem discussed in this study, let the time required to move the cabin by one meter be denoted as the unit time t. Thus, the transport time in the OA and OC directions is denoted as, and the transport time in the OB and OD directions is denoted as.
The specific process for large cruise ship push path planning based on the reverse sequencing strategy integrated with the improved A-Star algorithm is shown in Figure 12. The main steps are as follows:
(1)
Establish the Grid Map: Input the coordinates of the start and end points, and place all cabins inside the ship.
(2)
Select Movable Cabins: Identify all currently movable cabins, and use the A-Star algorithm to compute the shortest transport time for these cabins.
(3)
Select Installable Cabins: Based on the installation capacity requirements, select the cabins that can be installed. Once all installations are complete, sequentially select cabins from these to perform the transportation.
(4)
Check for Completion of All Cabin Transportation: Determine whether all cabins have been transported. If any cabins remain, repeat steps (2)–(3). If all cabins have been transported, proceed to the next step.
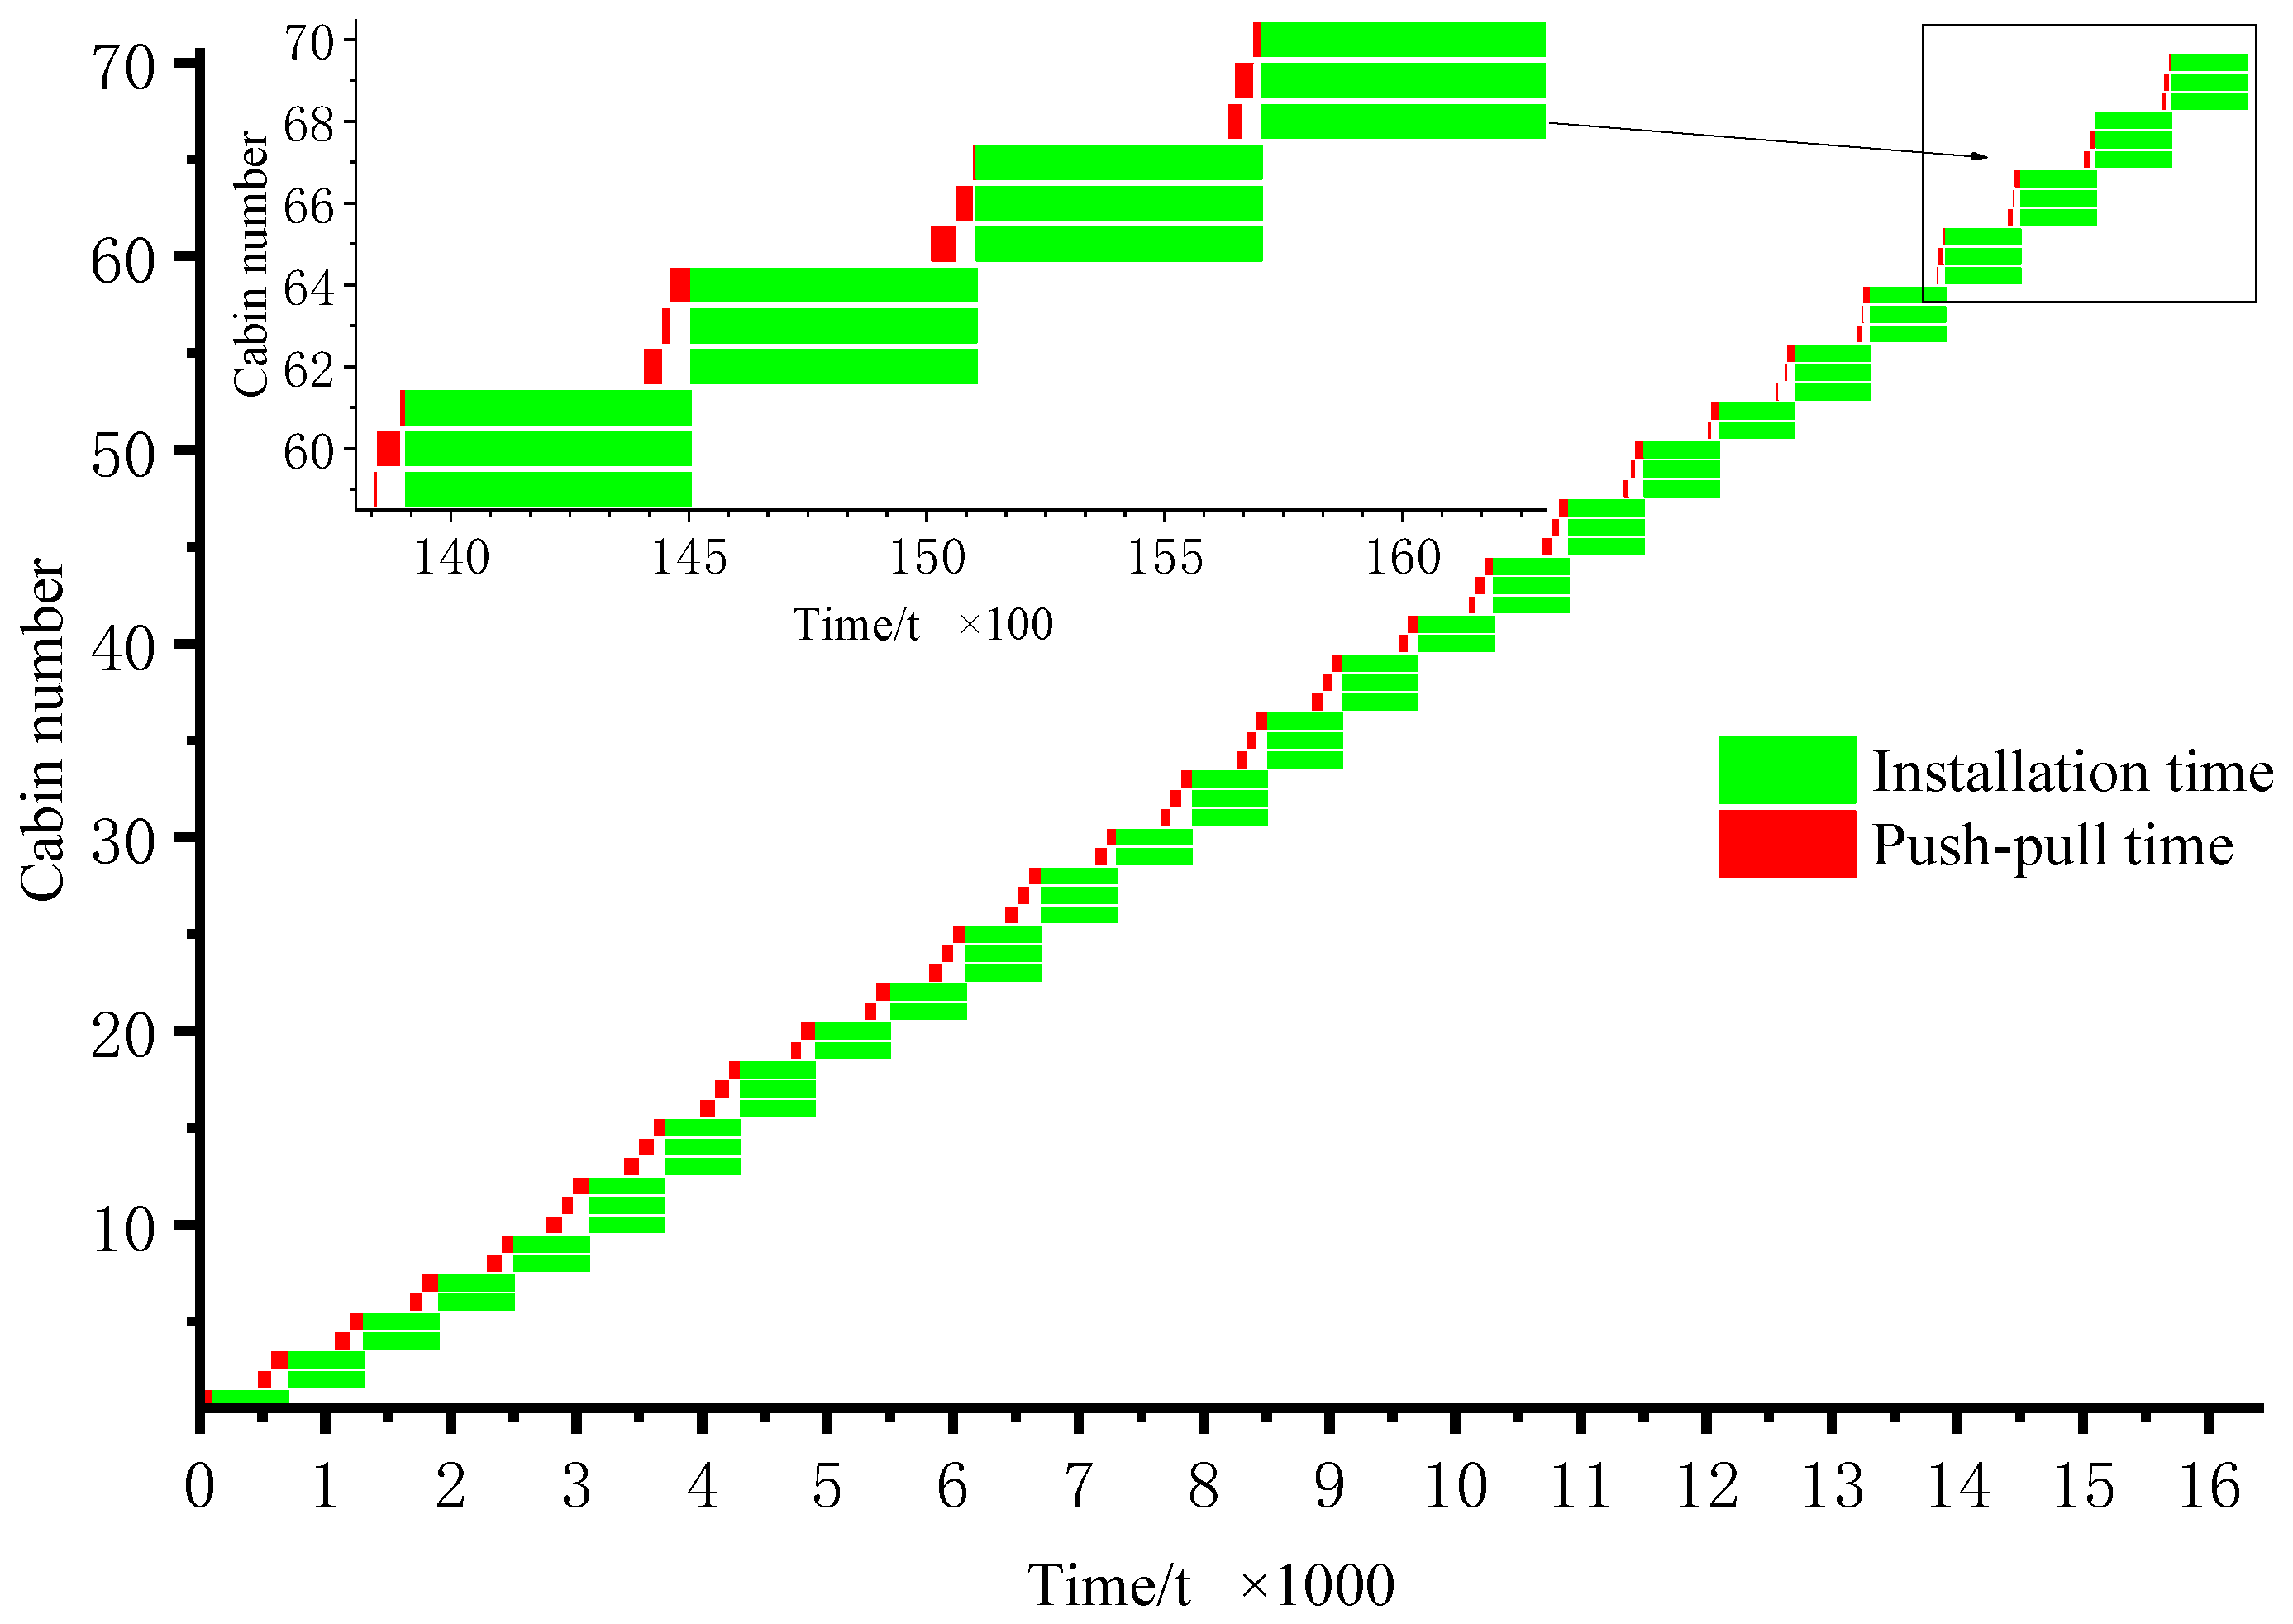
(5)
Calculate Entry Times: Compute the entry time for each cabin, and determine the actual sequence of entries.
(6)
Output the Optimal Path: Using the improved A-Star algorithm, output the optimal path for each cabin based on the actual entry sequence.

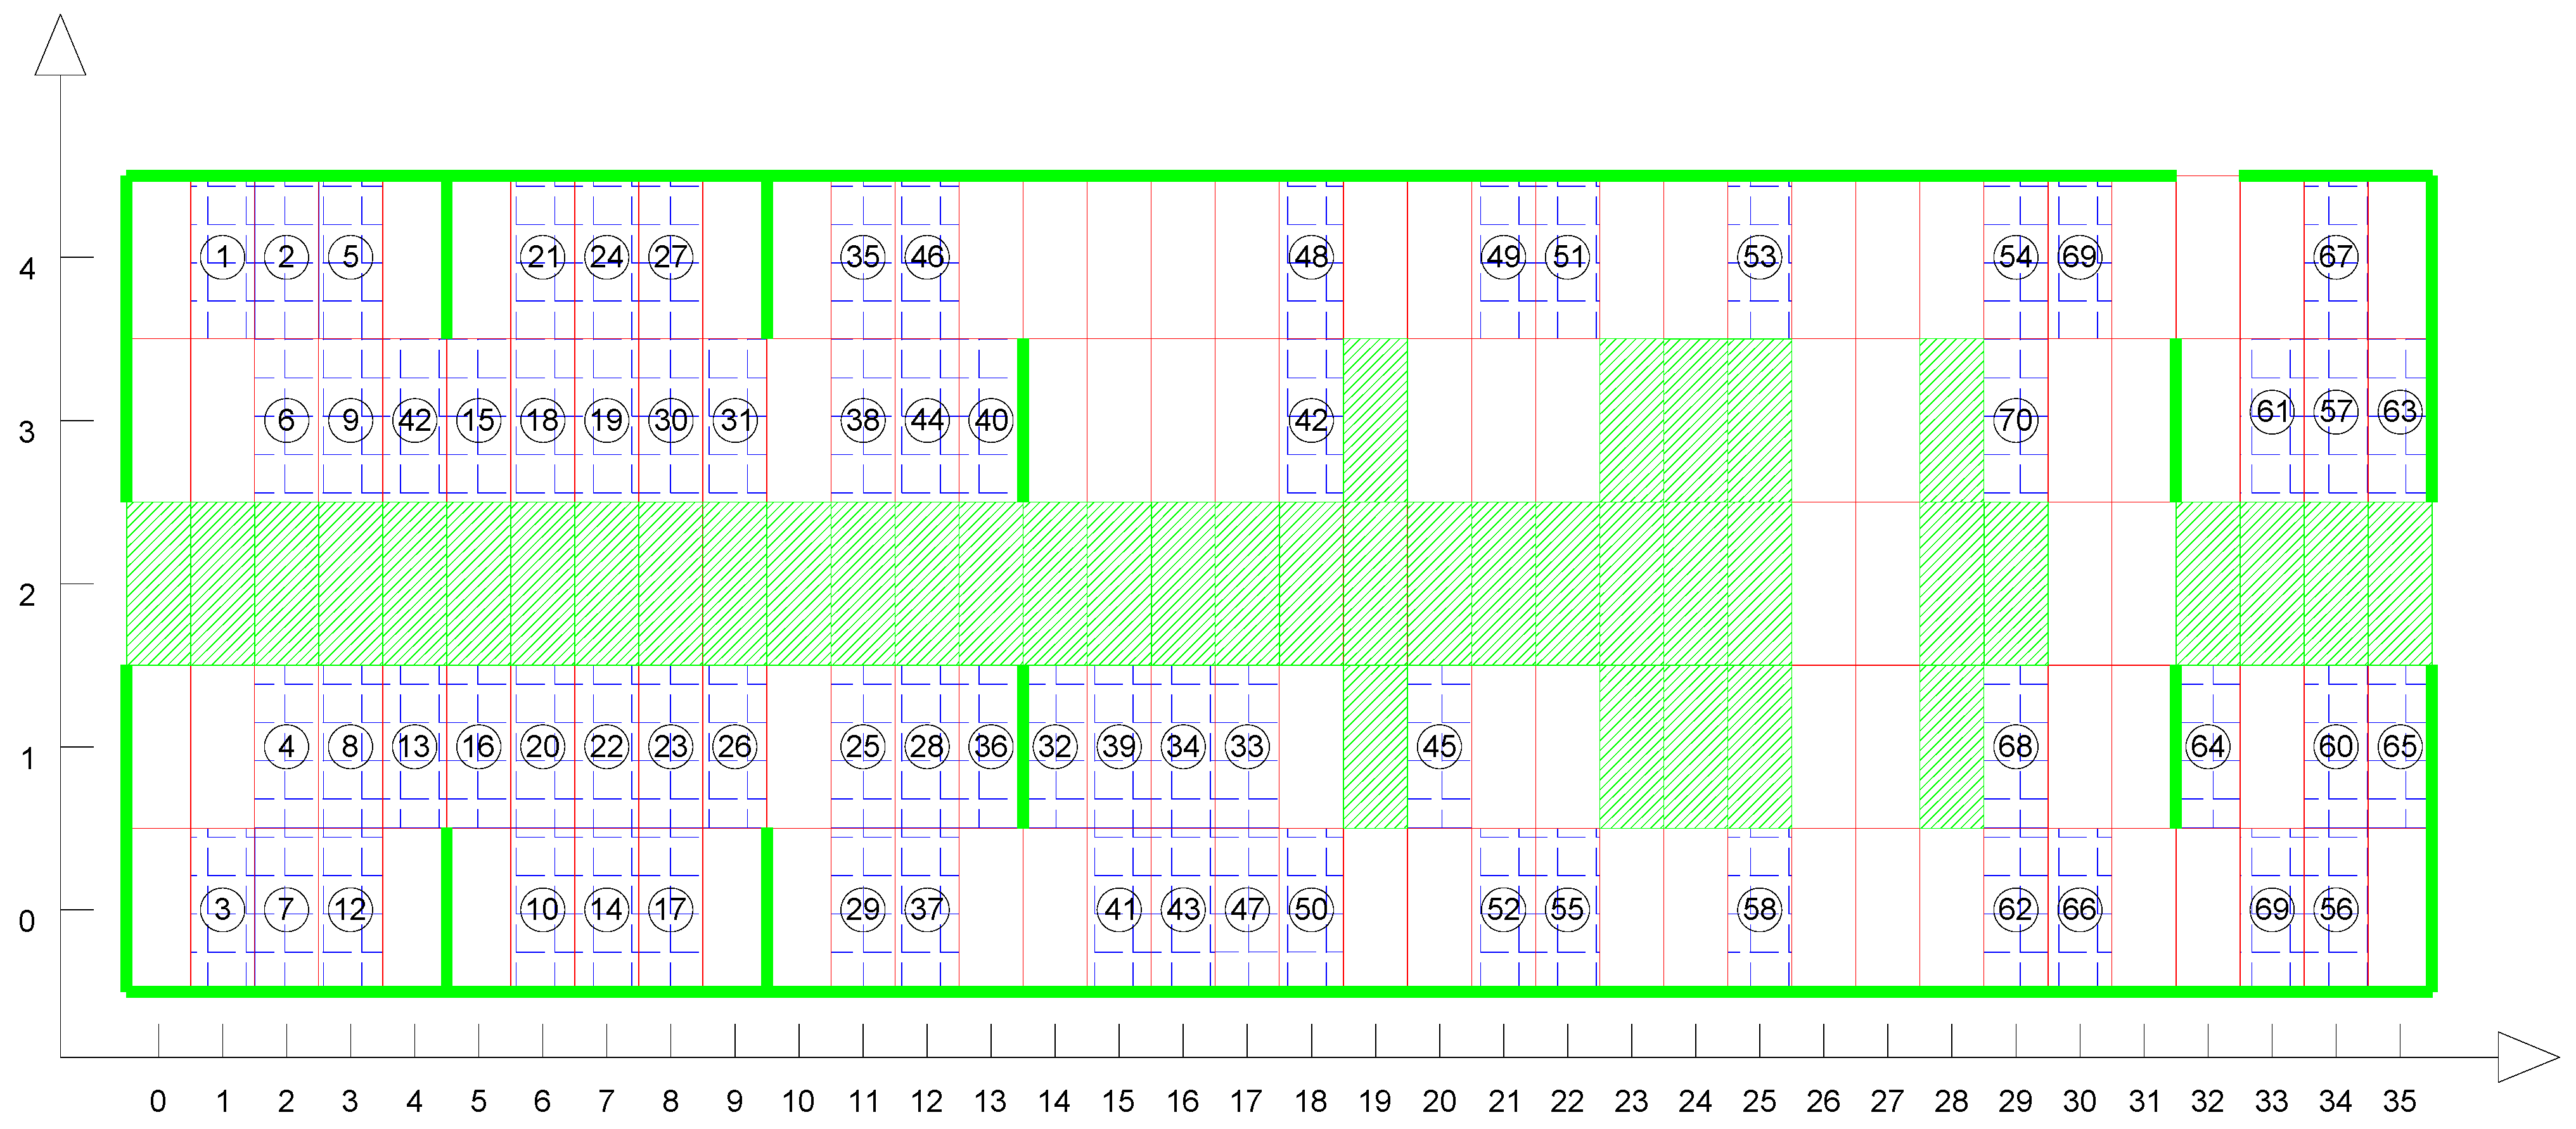
5. Comparative Analysis of Optimization Results Under Different Conditions

Based on the optimization methods discussed earlier, we take the structural space of the first deck of a large cruise ship as the research subject. First, we examine the maximum push–pull capacity of the ship without constraints on the number of tugs and installations (i.e., only limiting the ship’s structural and construction space). Next, the constraints on the number of tugs and installations are considered.
(1)
No Limitation on Number of personnel
Firstly, the optimal transportation scheme and the corresponding optimal transportation time for the modular cabins are studied, assuming no restrictions on the number of push–pull personnel and installation personnel.
Let the time required to move the modular cabin by one meter per unit time be denoted as t, and assume there are no restrictions on the maximum number of installations or tugs. The installation time for each cabin is set as 600 t. Based on the optimization methods described earlier, the optimized push–pull order for the cabins is shown in Figure 12, where the numbers 1 to 70 represent the entry sequence. The calculated push–pull times, installation times, and push–pull sequence are then plotted on a construction Gantt chart, as shown in Figure 13. In the chart, the red segments represent the push–pull times, while the green segments represent the installation times. Using the algorithm designed previously, the total minimum transportation time for the modular cabins is calculated to be 15,124.20 t.
Based on the Gantt chart in Figure 14, it can be observed that due to constraints imposed by the ship’s internal space and the modular cabin installation area, only one instance allows for the simultaneous installation of six cabins, and seven instances allow for the simultaneous installation of four cabins. In most cases, the number of cabins installed simultaneously is less than or equal to three. Additionally, based on the calculated push–pull times, it is evident that the push–pull time is relatively short compared to the installation time. However, due to the influence of the installation speed, after each push–pull operation, there is a prolonged stagnation in construction, during which no further push–pull operations can take place until the installation of the next batch of cabins is completed. This leads to a waste of human resources and time.
From the path planning results, it can be observed that the difference in the horizontal coordinates of the cabins installed simultaneously is greater than 1, and the difference in the vertical coordinates is greater than 2, meeting the requirement of a two-width interval between the installed cabins. Based on the push–pull sequence analysis, each cabin has a corresponding optimal path, and there is no obstruction caused by previously entered cabins. The push–pull sequence thus meets the design requirements.
The coordinate (35,1) represents a cabin location in Figure 15, as a typical example randomly selected for path analysis. Based on the calculated results, it can be seen that there are no obstacles, bulkheads, or other items on the push–pull path. This indicates that the path planning algorithm automatically helps to bypass obstacles and bulkheads when encountered. Moreover, this path is also the shortest, with no detours, confirming that the expected outcome is achieved and the push–pull path satisfies the design requirements.
(2)
Limited Number of Push–Pull and Installation Personnel
The maximum number of push–pull personnel is set to one, and the maximum number of installation personnel is set to three. The new push–pull sequence is optimized using the path planning algorithm, as shown in Figure 16, where the numbers 1 to 70 represent the entry sequence of the cabins. Based on the push–pull time, installation time, and push–pull sequence, the construction timeline is plotted as a Gantt chart, as shown in Figure 17. In this chart, the red segments represent push–pull time, while the green segments represent installation time. Based on the calculation results, the optimal path for the cabin (16,1) is plotted in Figure 18. The path planning algorithm calculates the shortest total transport time for the cabin as 16,304.78 t.
From the path planning result in Figure 18, it can be observed that the optimized path successfully avoids all obstacles, such as other cabins and bulkheads, and completes the push–pull operation via the shortest path. Additionally, there are no instances where a cabin is blocked by another due to sequencing issues. The Gantt chart in Figure 17 indicates that at any given time, the maximum number of push–pull operations is one, and the maximum number of installations is three. All cabins are processed in the prescribed sequence, with no overlap between where a subsequent cabin begins installation and where a previous one is completed. The distance between concurrently installed cabins meets the requirement of being at least two cabin widths apart, thus fulfilling the design requirements.
It can be seen that in most cases, three cabins are installed concurrently, with two cabins installed simultaneously in some instances. Only at the beginning is there a single cabin being installed alone. This indicates that human resources are being utilized efficiently, and the idle time caused by the installation speed of the cabins during the push–pull operation is significantly reduced. With a reduction in workforce, the shortest total transport time of cabins increased from 14,524.20 t to 16,304.78 t. However, the increase in time was relatively small, while the number of workgroups decreased from seven to four, indicating a substantial reduction in workforce. This suggests that the design scheme is more efficient and rational.
In this experimental section, various human resource allocation scenarios were considered, and two typical cases, unrestricted and restricted resource availability, were analyzed in detail. By examining the transportation path length and obstacle-avoidance efficiency of a single modular cabin as a case study, the path optimization capability of the proposed algorithm was validated. Furthermore, comparative analyses of the algorithm’s performance under different experimental conditions revealed that although transportation time increased slightly with a reduction in human resources, the overall efficiency did not significantly deteriorate, indicating good adaptability and robustness of the algorithm under resource-limited conditions.
It should be noted, however, that while the improved A-Star algorithm proposed in this paper effectively addresses the current optimization challenges for cabin transportation paths, certain limitations remain. In practical implementation scenarios, dynamic variations in the construction environment, such as the emergence of temporary obstacles and fluctuations in the performance of pushing equipment, could hinder the direct application of the proposed solution. Consequently, future research should investigate more flexible, real-time optimization approaches, such as integrating dynamic heuristic algorithms with multi-agent collaboration, to enable real-time adjustment of transportation paths and thus enhance practical applicability.

6. Conclusions

Addressing the issues of push–pull sequence and path planning for large cruise ships, an improved A-Star algorithm has been proposed. Based on this algorithm, one deck of a large cruise ship was taken as an example to study the maximum push–pull capacity under the constraints of the ship’s structure and construction space. Furthermore, considering the limits on the number of pushers and installers, the optimal push–pull plan under human resource allocation was obtained. The main conclusions are as follows:
The improved A-Star algorithm can handle the path planning problem for the transport of multiple cabins simultaneously. When a cabin reaches its destination, the algorithm updates the map in real time by adding the cabin as an obstacle, thus achieving multi-target destination path planning. The improved A-Star algorithm not only recognizes grid obstacles, but also identifies line obstacles.
The reverse sequencing strategy method used to compile the project schedule addresses the problem of optimizing the transport sequence. This approach considers the inter-relation between transport sequences and their respective paths, avoiding congestion at entry points. It prioritizes cabins that can be transported using optimal paths, allowing for more efficient transport.

Author Contributions

Conceptualization, L.J. and X.W.; methodology, L.J.; validation, K.L. and L.J.; formal analysis; investigation, K.L.; resources, Y.Z.; data curation; writing—original draft preparation, L.J.; writing—review and editing, L.J. and X.W.; supervision, X.W. and Y.Z.; project administration, J.L.; funding acquisition, J.L. All authors have read and agreed to the published version of the manuscript.

Funding

This research received no external funding.

Institutional Review Board Statement

Not applicable.

Informed Consent Statement

Not applicable.

Data Availability Statement

Data is unavailable due to privacy.

Conflicts of Interest

Authors Liyang Ju, Xiaoyuan Wu and Jianfeng Liu were employed by the company Shanghai Waigaoqiao Shipbuilding Co., Ltd. The remaining authors declare that the research was conducted in the absence of any commercial or financial relationships that could be construed as a potential conflict of interest.

References

  1. Arrichiello, V.; Gualeni, P. Systems engineering and digital twin: A vision for the future of cruise ships design, production and operations. Int. J. Interact. Des. Manuf. (IJIDeM) 2020, 14, 115–122. [Google Scholar] [CrossRef]
  2. Romano, P.; Formentini, M.; Bandera, C.; Tomasella, M. Value analysis as a decision support tool in cruise ship design. Int. J. Prod. Res. 2010, 48, 6939–6958. [Google Scholar] [CrossRef]
  3. Kawser, Z.A. A Modular Design Methodology for OSV Accommodation Areas. Master’s Thesis, Institutt for Marin Teknikk, Trondheim, Norway, 2012. [Google Scholar]
  4. Bednarek, M.; Parkes, A. Legacy of fordism and product life cycle management in the modern economy. Manag. Prod. Eng. Rev. 2021, 12, 61–71. [Google Scholar]
  5. Jiang, H.; Zeng, J.; Huang, C.; Yang, M. Design of the Hoisting Device for the Module in the Living of Medium-Sized Cruise Ship. Int. Core J. Eng. 2021, 7, 167–174. [Google Scholar]
  6. Vaz-Serra, P.; Wasim, M.; Egglestone, S. Design for manufacture and assembly: A case study for a prefabricated bathroom wet wall panel. J. Build. Eng. 2021, 44, 102849. [Google Scholar] [CrossRef]
  7. Xu, J.H.; Pan, C.X.; Jiang, J.; Huang, L. Research on modular building system for accommodation s of large luxury cruise. In Maritime Technology and Engineering 5; CRC Press: Boca Raton, FL, USA, 2017; Volume 1, pp. 793–799. [Google Scholar]
  8. Krause, D.; Gebhardt, N.; Greve, E.; Oltmann, J.; Schwenke, J.; Spallek, J. New trends in the design methodology of modularization. In Proceedings of the 11th IDE Workshop, Valencia, Spain, 5–7 April 2017; Volume 5. [Google Scholar]
  9. Yi, Z.; Mi, S.; Tong, T.; Li, H.; Lin, Y.; Wang, W.; Li, J. Intelligent initial model and case design analysis of smart factory for shipyard in China. Eng. Appl. Artif. Intell. 2023, 123, 106426. [Google Scholar] [CrossRef]
  10. Kunkera, Z.; Željković, I.; Mimica, R.; Ljubenkov, B.; Opetuk, T. Development of augmented reality technology implementation in a shipbuilding project realization process. J. Mar. Sci. Eng. 2024, 12, 550. [Google Scholar] [CrossRef]
  11. Ujkani, A.; Hohnrath, P.; Grundmann, R.; Burmeister, H.C. Enhancing Maritime Navigation with Mixed Reality: Assessing Remote Pilotage Concepts and Technologies by In Situ Testing. J. Mar. Sci. Eng. 2024, 12, 1084. [Google Scholar] [CrossRef]
  12. Wiśnicki, B.; Wagner, N.; Wołejsza, P. Critical areas for successful adoption of technological innovations in sea shipping–the autonomous ship case study. Innov. Eur. J. Soc. Sci. Res. 2024, 37, 582–608. [Google Scholar] [CrossRef]
  13. Ma, C.; He, R.; Zhang, W. Path optimization of taxi carpooling. PLoS ONE 2018, 13, e0203221. [Google Scholar] [CrossRef] [PubMed]
  14. Shi, X.H.; Liang, Y.C.; Lee, H.P.; Lu, C.; Wang, Q.X. Particle swarm optimization-based algorithms for TSP and generalized TSP. Inf. Process. Lett. 2007, 103, 169–176. [Google Scholar] [CrossRef]
  15. Deng, Y.; Chen, Y.; Zhang, Y.; Mahadevan, S. Fuzzy Dijkstra algorithm for shortest path problem under uncertain environment. Appl. Soft Comput. 2012, 12, 1231–1237. [Google Scholar] [CrossRef]
  16. Seet, B.C.; Liu, G.; Lee, B.S.; Foh, C.H.; Wong, K.J.; Lee, K.K. A-STAR: A mobile ad hoc routing strategy for metropolis vehicular communications. In Networking 2004: Networking Technologies, Services, and Protocols; Performance of Computer and Communication Networks; Mobile and Wireless Communications Third International IFIP-TC6 Networking Conference Athens, Greece, 9–14 May 2004; Proceedings 3; Springer: Berlin/Heidelberg, Germany, 2004; pp. 989–999. [Google Scholar]
  17. Yang, J. Application of Floyd algorithm in the design of a coastal tourism route optimization system. J. Coast. Res. 2020, 106, 668–671. [Google Scholar] [CrossRef]
  18. Al Salami, N.M. Ant colony optimization algorithm. UbiCC J. 2009, 4, 823–826. [Google Scholar]
  19. Mirjalili, S.; Mirjalili, S. Evolutionary algorithms and neural networks: Theory and applications. In Genetic Algorithm; Springer: Berlin/Heidelberg, Germany, 2018; pp. 43–55. [Google Scholar]
  20. Marini, F.; Walczak, B. Particle swarm optimization (PSO)-A tutorial. Chemom. Intell. Lab. Syst. 2015, 149, 153–165. [Google Scholar] [CrossRef]
  21. Van Laarhoven, P.J.; Aarts, E.H.; van Laarhoven, P.J.; Aarts, E.H. Simulated Annealing; Springer: Dordrecht, The Netherlands, 1987; pp. 7–15. [Google Scholar]
  22. Arai, H.; Maung, C.; Schweitzer, H. Optimal column subset selection by A-Star search. In Proceedings of the AAAI Conference on Artificial Intelligence, Austin, TX, USA, 25–30 January 2015; Volume 29. [Google Scholar]
  23. Yang, G.; Li, M.; Gao, Q. Multi-Automated Guided Vehicles Conflict-Free Path Planning for Packaging Workshop Based on Grid Time Windows. Appl. Sci. 2024, 14, 3341. [Google Scholar] [CrossRef]
Figure 1. PMCU transferred to fixed location.
Applsci 15 04406 g001
Figure 2. Grid division diagram.
Applsci 15 04406 g002
Figure 3. A-Star algorithm flow chart.
Applsci 15 04406 g003
Figure 4. Improved A-Star algorithm flow chart.
Applsci 15 04406 g004
Figure 5. Selecting the cabins that can be removed.
Applsci 15 04406 g005
Figure 6. Selection of the installation cabin.
Applsci 15 04406 g006
Figure 7. Selecting the cabins for transportation.
Applsci 15 04406 g007
Figure 8. Large cruise ship deck plan.
Applsci 15 04406 g008
Figure 9. Scheduled installation positions of modular cabins.
Applsci 15 04406 g009
Figure 10. Simplified raster map.
Applsci 15 04406 g010
Figure 11. Transport direction diagram.
Applsci 15 04406 g011
Figure 12. Path planning flow chart.
Applsci 15 04406 g012
Figure 13. Sequence diagram of pushing without limitation personnel number.
Applsci 15 04406 g013
Figure 14. Passage chart of cruise path planning time.
Applsci 15 04406 g014
Figure 15. Single cabin (35,1) push–pull path diagram.
Applsci 15 04406 g015
Figure 16. Pushing sequence diagram.
Applsci 15 04406 g016
Figure 17. Passage chart of cruise path planning time with limited push–pull and installation personnel number.
Applsci 15 04406 g017
Figure 18. Single cabin (16,1) pushing path diagram.
Applsci 15 04406 g018
Disclaimer/Publisher’s Note: The statements, opinions and data contained in all publications are solely those of the individual author(s) and contributor(s) and not of MDPI and/or the editor(s). MDPI and/or the editor(s) disclaim responsibility for any injury to people or property resulting from any ideas, methods, instructions or products referred to in the content.

