1. Introduction
With the rapid development of technologies such as the industrial Internet [
1], 5G communication [
2], and sensor network [
3], the intelligent heading workface has significantly enhanced its perception capabilities for all elements, including the equipment operation status, personnel spatiotemporal information, geological information, and the roadway environment [
4]. At the same time, the volume and dimensions of real-time state data have also increased substantially. In fact, due to the limitations of data computing capabilities, the increase in a large amount of high-dimensional data during the operation process of the intelligent cantilever roadheader cannot be directly applied to the equipment control decision, resulting in a significant waste of real-time state data [
5].
Digital twin technology represents a groundbreaking paradigm that creates dynamic, bidirectional linkages between physical entities and their virtual models [
6]. The key advantage of digital twin technology is its interactivity and collaborative capability, where the virtual model is able to monitor the physical entity in real time using sensor data, realize dynamic mapping, and validate the control strategy in the virtual environment, and then control the physical entity [
7]. This process involves communication and cooperation between physical devices, information exchange between virtual models, and synchronization and dynamic adjustment between virtual and physical models [
8].
In the domain of digital twins and virtual–physical interaction modeling, Tao Fei proposed a comprehensive theoretical framework for digital twin connectivity and interaction encompassing the following five core components: perception, communication, physical–virtual mapping, data–model coupling, and fusion. They established the “accurate, real-time, consistent, safe, and reliable” criteria for connectivity and interaction, which not only provides an in-depth analysis of each element along the temporal dimension but also constructs theoretical relationships between cross-dimensional elements. This work fundamentally strengthens the scientific rigor and practical applicability of digital twin connectivity and interaction [
9,
10].
In intelligent mining systems, digital twin technology drives digital transformation and intelligent advancement across mine construction, extraction operations, monitoring systems, and maintenance processes. By establishing multidimensional equipment models that enable virtual–physical mapping and real-time interaction, this technology enhances mining safety, operational efficiency, and intelligent performance [
11]. For remote intelligent excavation applications, digital twin solutions effectively address excavation challenges while boosting productivity and fostering intelligent development. Through state evolution dynamic modeling, the technology achieves real-time equipment monitoring and operational optimization, facilitating the critical transition from automated to fully intelligent excavation operations [
12,
13].
The fundamental prerequisite for achieving effective virtual–physical interaction lies in maintaining temporal synchronization between the control decision states of physical entities and their digital counterparts. However, the inherent latency across system layers in tunneling systems, arising from sensor data acquisition, network transmission, and computational processing, creates fundamental synchronization challenges between virtual–physical spaces. This cumulative latency disrupts the alignment of decision-making states across virtual and physical systems, significantly diminishing the operational relevance of digital twin-derived decisions, particularly in the intelligent tunneling scenarios demanding rapid response coordination. In addition, the characteristic of physical control decision making is based on simple logical judgment and behavior execution through the collection of physical sensor data. The characteristic of virtual control decision making is based on the in-depth calculation of collected sensor data, thereby extracting the deep information of sensor data and making more precise control decisions in response to changes in the external environment. The key to virtual–physical interaction control is the alignment and unification of the starting points of the states of physical control decision making and virtual control decision making.
Discretization of the running state is an effective method which can establish a state alignment baseline for virtual and physical control decisions. Amanda et al. proposed a state space discretization method incorporating pseudo-random networks for episodic unsupervised learning in Q-learning. This method is particularly suitable for the closed-loop control of deformed or highly reconfigurable systems, and can be used as an effective learning agent [
14]. To address the computational challenges of continuous state spaces in epidemic control Markov decision processes, Zhang and Suen developed a state discretization algorithm that outperformed uniform discretization in both synthetic tests and COVID-19 case studies [
15]. Leland proposed a discretization filter method for the efficient estimation of nonlinear non-Gaussian state space models, which provides strongly consistent and asymptotically efficient maximum likelihood estimation while being orders of magnitude faster than existing nonlinear methods in low-dimensional settings [
16]. Dadashi proposed a reinforcement learning framework that learns state-dependent action space discretization from human demonstrations to enable effective continuous control. The method automatically extracts demonstrator priors and multimodal behavior by identifying plausible action sets for each state [
17]. Shi et al. proposed a discrete-time recurrent neural network model that pioneers direct discretization for time-variant problems, departing from conventional continuous system discretization approaches. The model employs second-order Taylor expansion to handle discrete time-variant nonlinear systems originating from robot manipulator modeling, with the theoretical analysis demonstrating its convergence and precision [
18].
The event-driven control strategy is a periodic dynamic approach that uses carefully designed trigger states to optimize the control process. Only when these conditions are satisfied does the system update the control instructions. The event-driven control strategy significantly reduces the communication frequency and eases the burden on the bus bandwidth, thus improving the efficiency and responsiveness of the whole system [
19]. Santos et al. demonstrated how Discrete Event Simulation serves as an effective digital twin for non-automated processes in Industry 4.0, offering automated data collection, real-time analysis, and continuous decision support. Their systematic approach covers the full DES lifecycle from model construction to real-time integration, showing superior advantages over traditional simulation through case studies that highlight enhanced process adaptability, user-friendly interfaces, and multi-level autonomy capabilities [
20]. Karakra et al. presented an approach that builds a digital twin platform using a Discrete Event Simulation system connected to Internet of Things devices. The purpose of this platform is to construct pathways for hospital patients, enabling near-real-time monitoring and predictive simulation [
21]. Cubukcuoglu et al. introduced a Discrete Event Simulation tool to aid decision making in hospital space planning and demonstrate the application capabilities of this tool through a specific real-world example [
22]. Wang et al. developed a data-driven event-triggered control framework for unknown discrete-time networked systems, proposing a novel distributed event-triggering strategy based on periodic sampling with model-based stability guarantees using discrete-time looped functionals, with numerical validation showing effective transmission reduction in networked control systems [
23]. Ge et al. presented a comprehensive review of dynamic event-triggered mechanisms for networked control systems, establishing a unified framework that systematically addresses event-triggered mechanism design and implementation challenges [
24].
While continuous state discretization and event-driven mechanisms provide valuable theoretical foundations for virtual–physical synchronization, current research remains insufficient in addressing dynamic state alignment during virtual–physical space interactions, particularly in leveraging virtual control decisions to enhance the system performance. Aimed at the problem of the unification of virtual–physical interaction states caused by frequent changes in control benchmarks under complex working conditions, a discrete state evolution dynamic analysis method for the cantilever roadheader is proposed by introducing the discretization of the operating status and the event-driven mechanism. The logic of the discretization of tunneling operation states is analyzed, the static and dynamic state evolution graph of the cantilever roadheader is constructed, and the state evolution mechanism of the cantilever roadheader driven by real-time data is studied. An application example of the dynamic analysis for the operating state evolution of the intelligent roadheader is designed in the simulation environment.
2. Dynamics Model of the State Evolution of Cantilever Roadheader
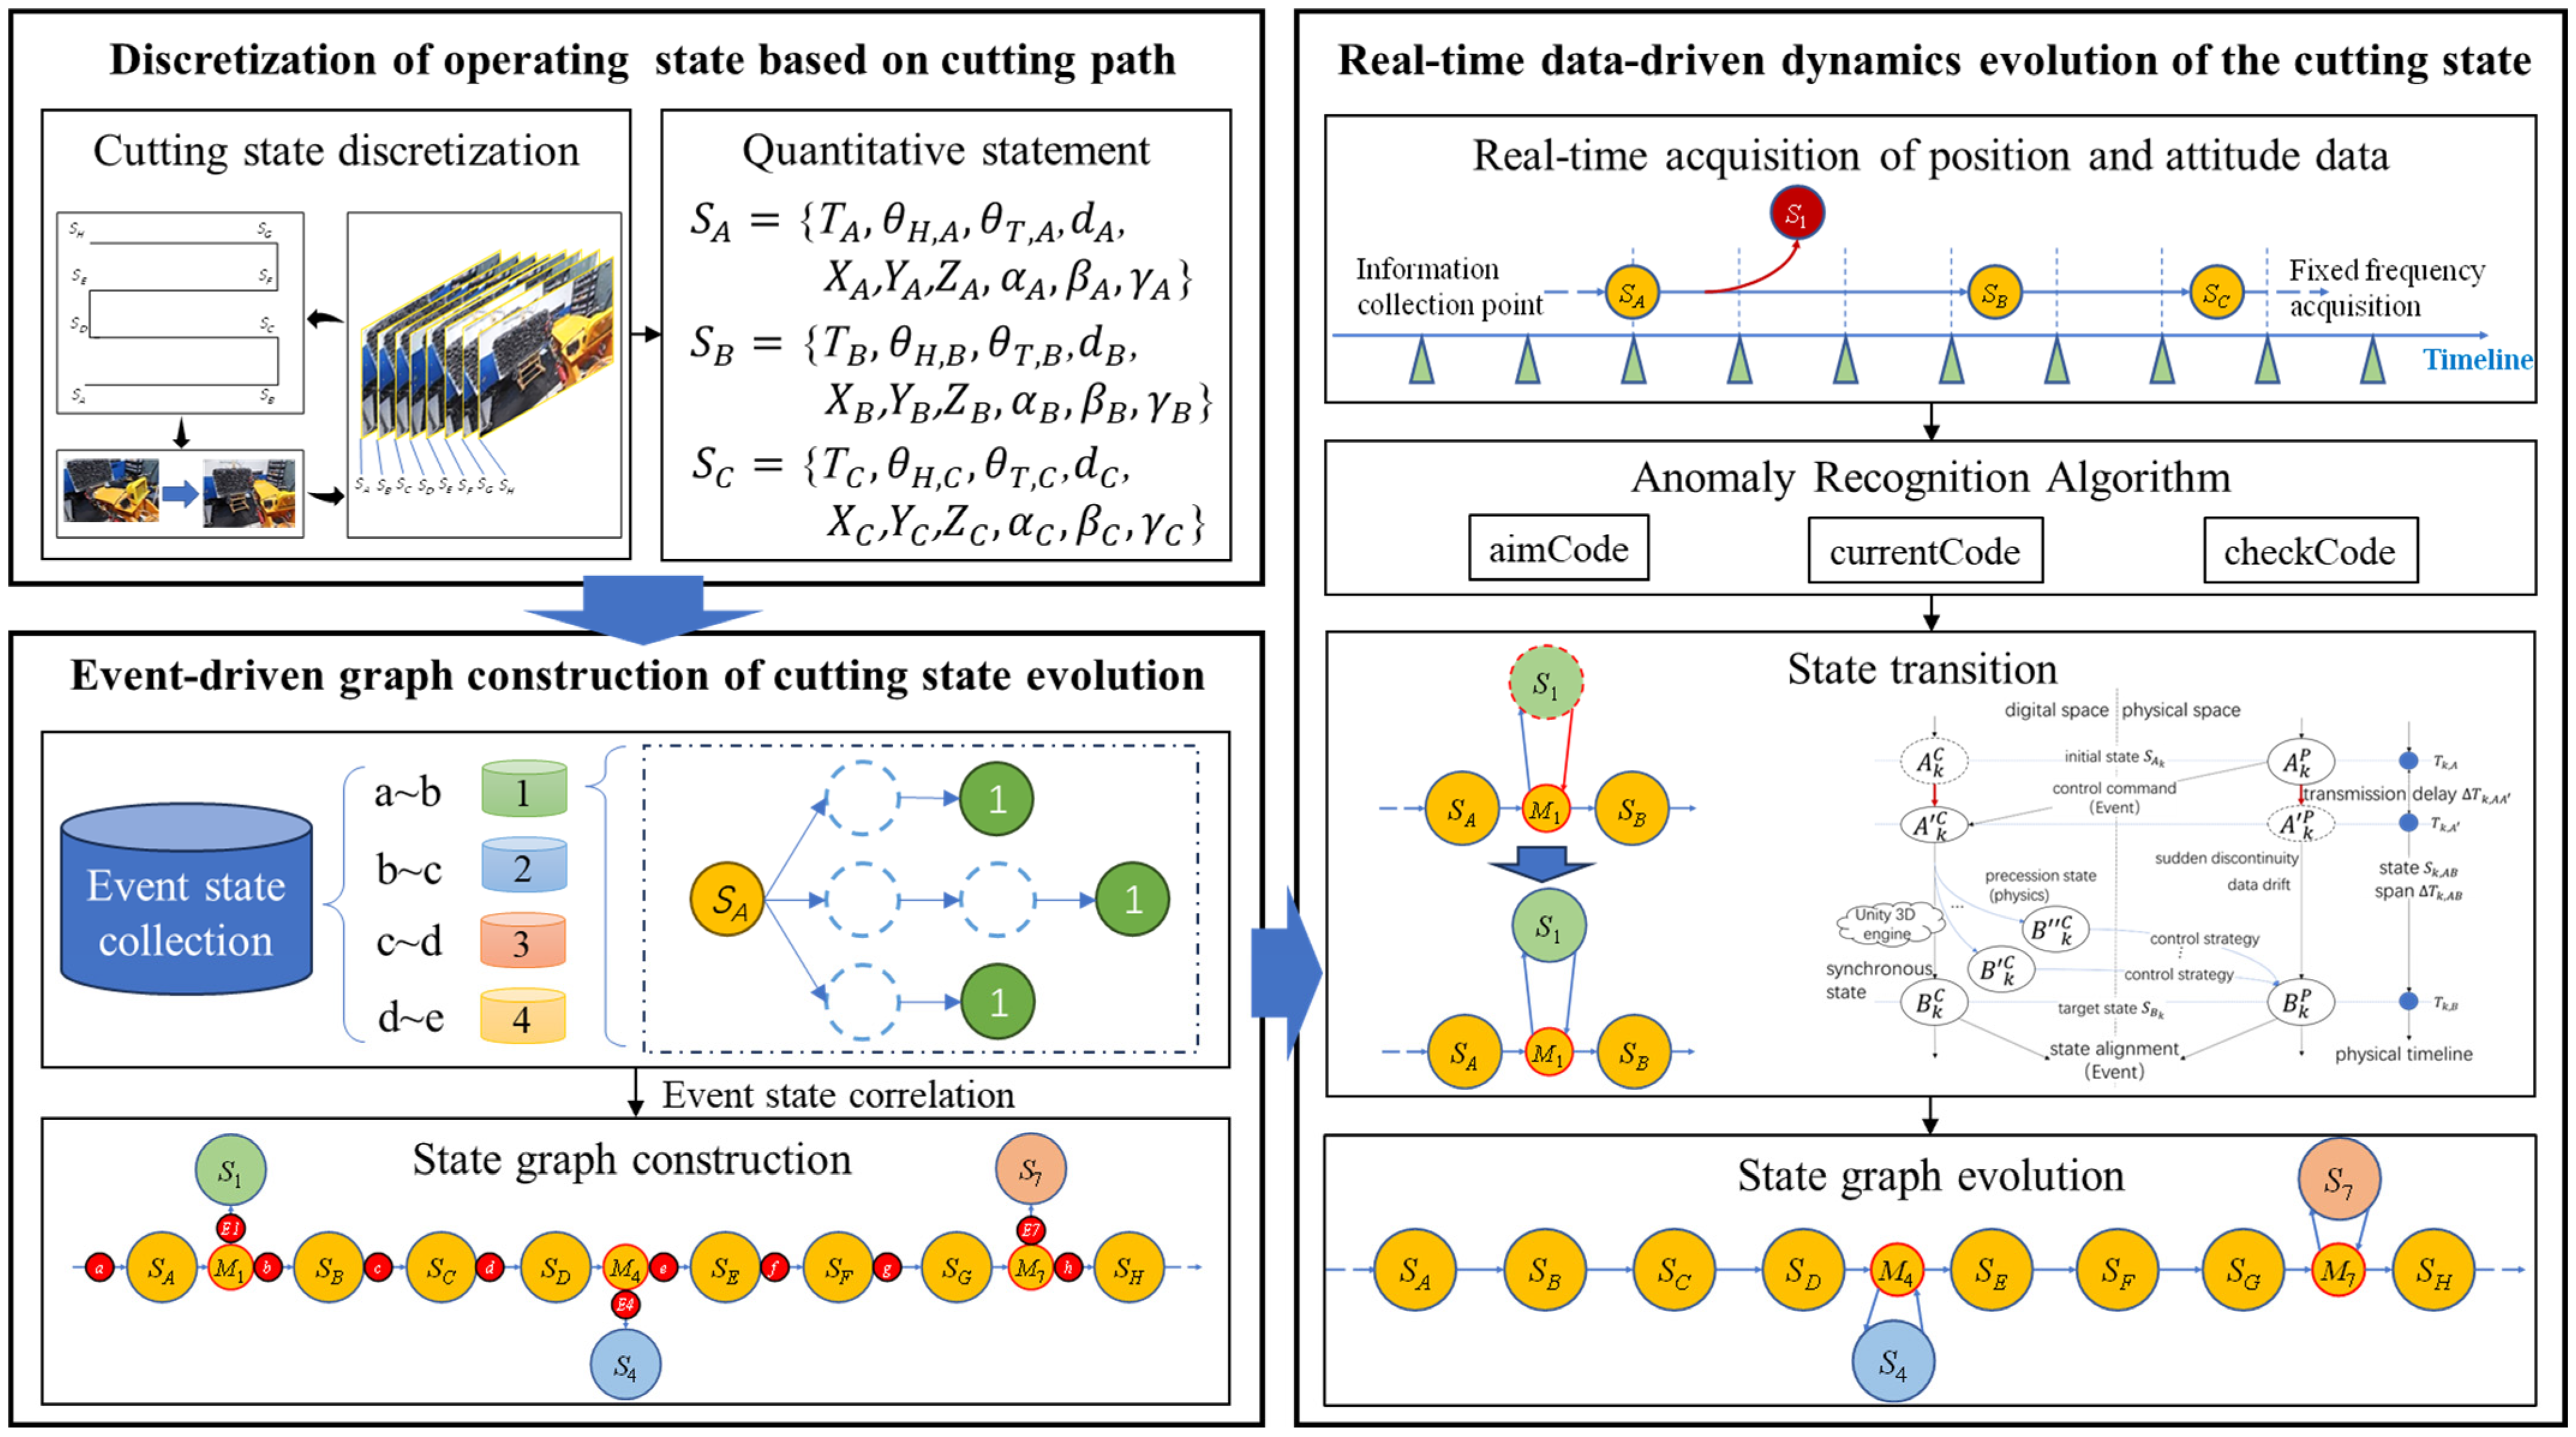
Figure 1 shows the architecture of the state evolution dynamics model construction method for the cantilever roadheader, which mainly consists of the following three parts: the discretization of the operating state based on the planned cutting path, the event-driven graph construction of the cutting state evolution, and the real-time data-driven dynamics evolution of the cutting operation state of the cantilever roadheader.
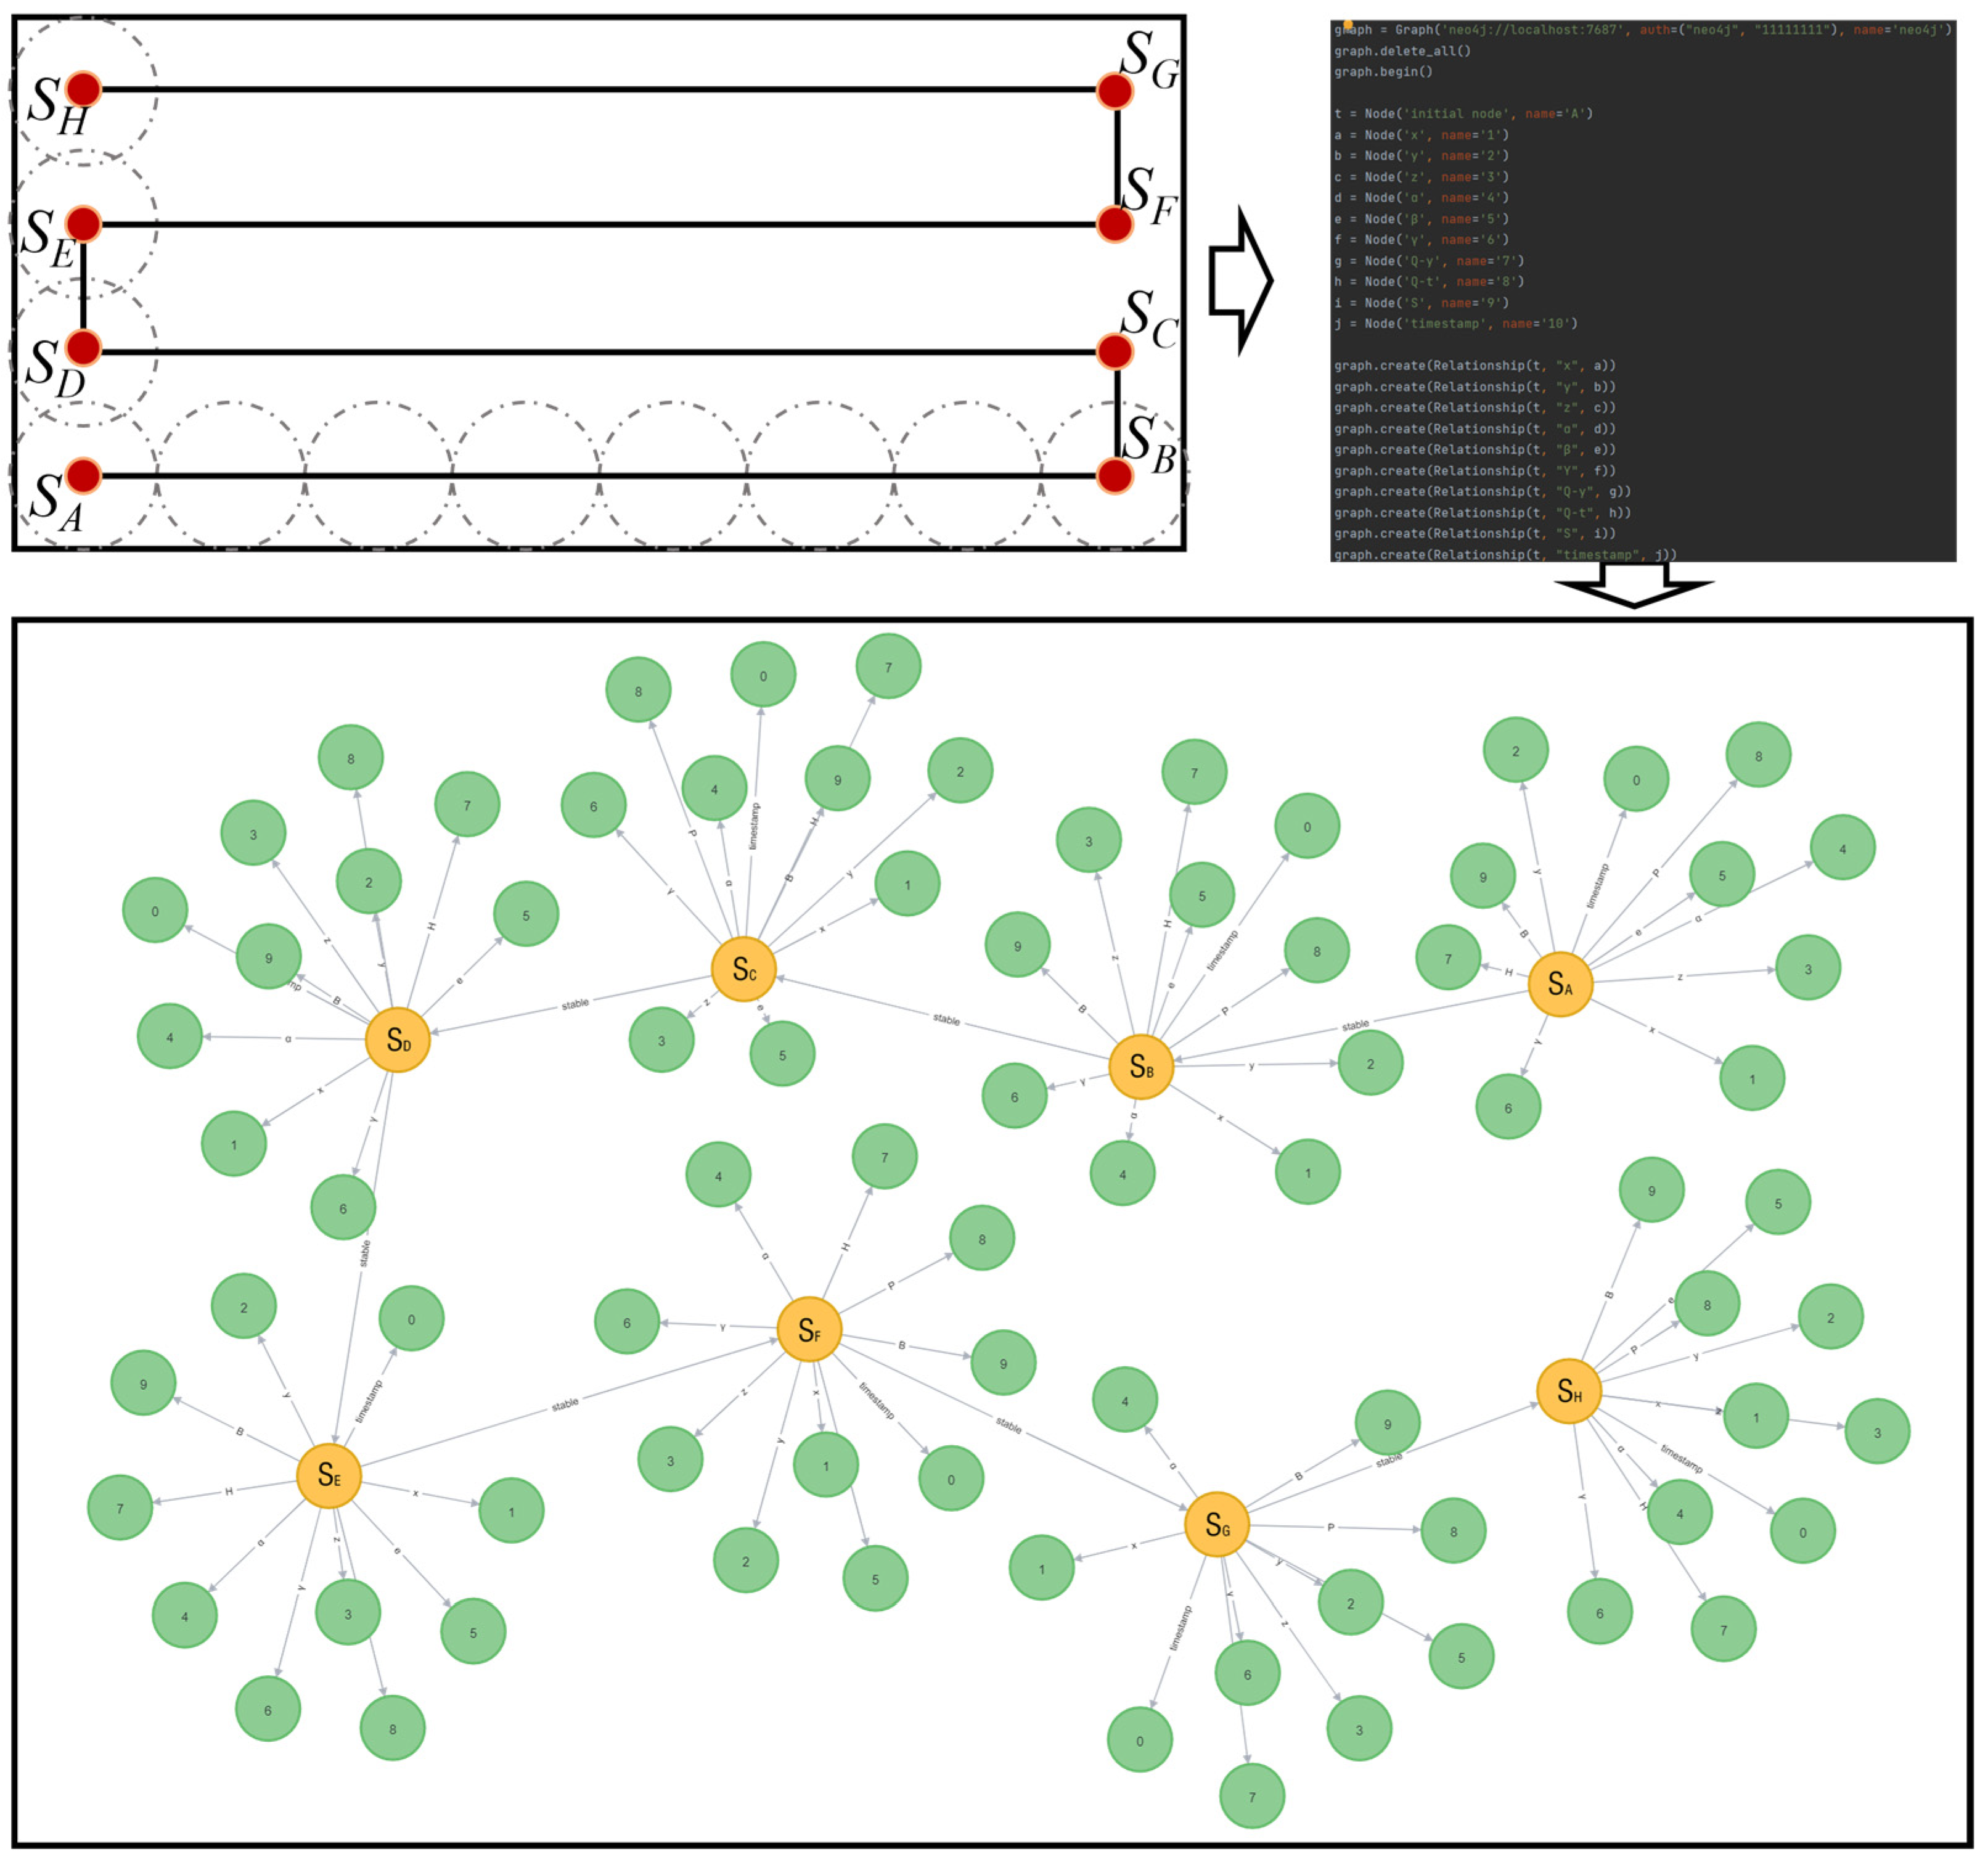
Based on the planned cutting trajectory, the deterministic state nodes are discretized uniformly, and each deterministic state node is quantitatively described by the fuselage positional state parameters and timestamp. The relationships between the deterministic state nodes are established based on the temporal sequence of node activations. Descriptions of the deterministic state are used as node attributes to construct a state evolution graph using Neo4j.
During the cutting operation of the heading section, the key position parameters of the roadheader are collected in real time to monitor the operating state of the equipment, and the positional state parameters are screened by the disturbance recognition algorithm. The stochastic state nodes caused by the events are updated in the constructed state evolution graph. To ensure the real-time feedback of the digital twin model to the physical machine, a state transition mechanism is employed to synchronize the benchmark between the virtual control state and the physical control state.
2.1. Discretization of Operating State Based on Cutting Path Planning
Discrete state processing transforms complex physical tunneling behavior into digitally replicable and controllable units through state space discretization, enabling the precise tracking of the state evolution path.
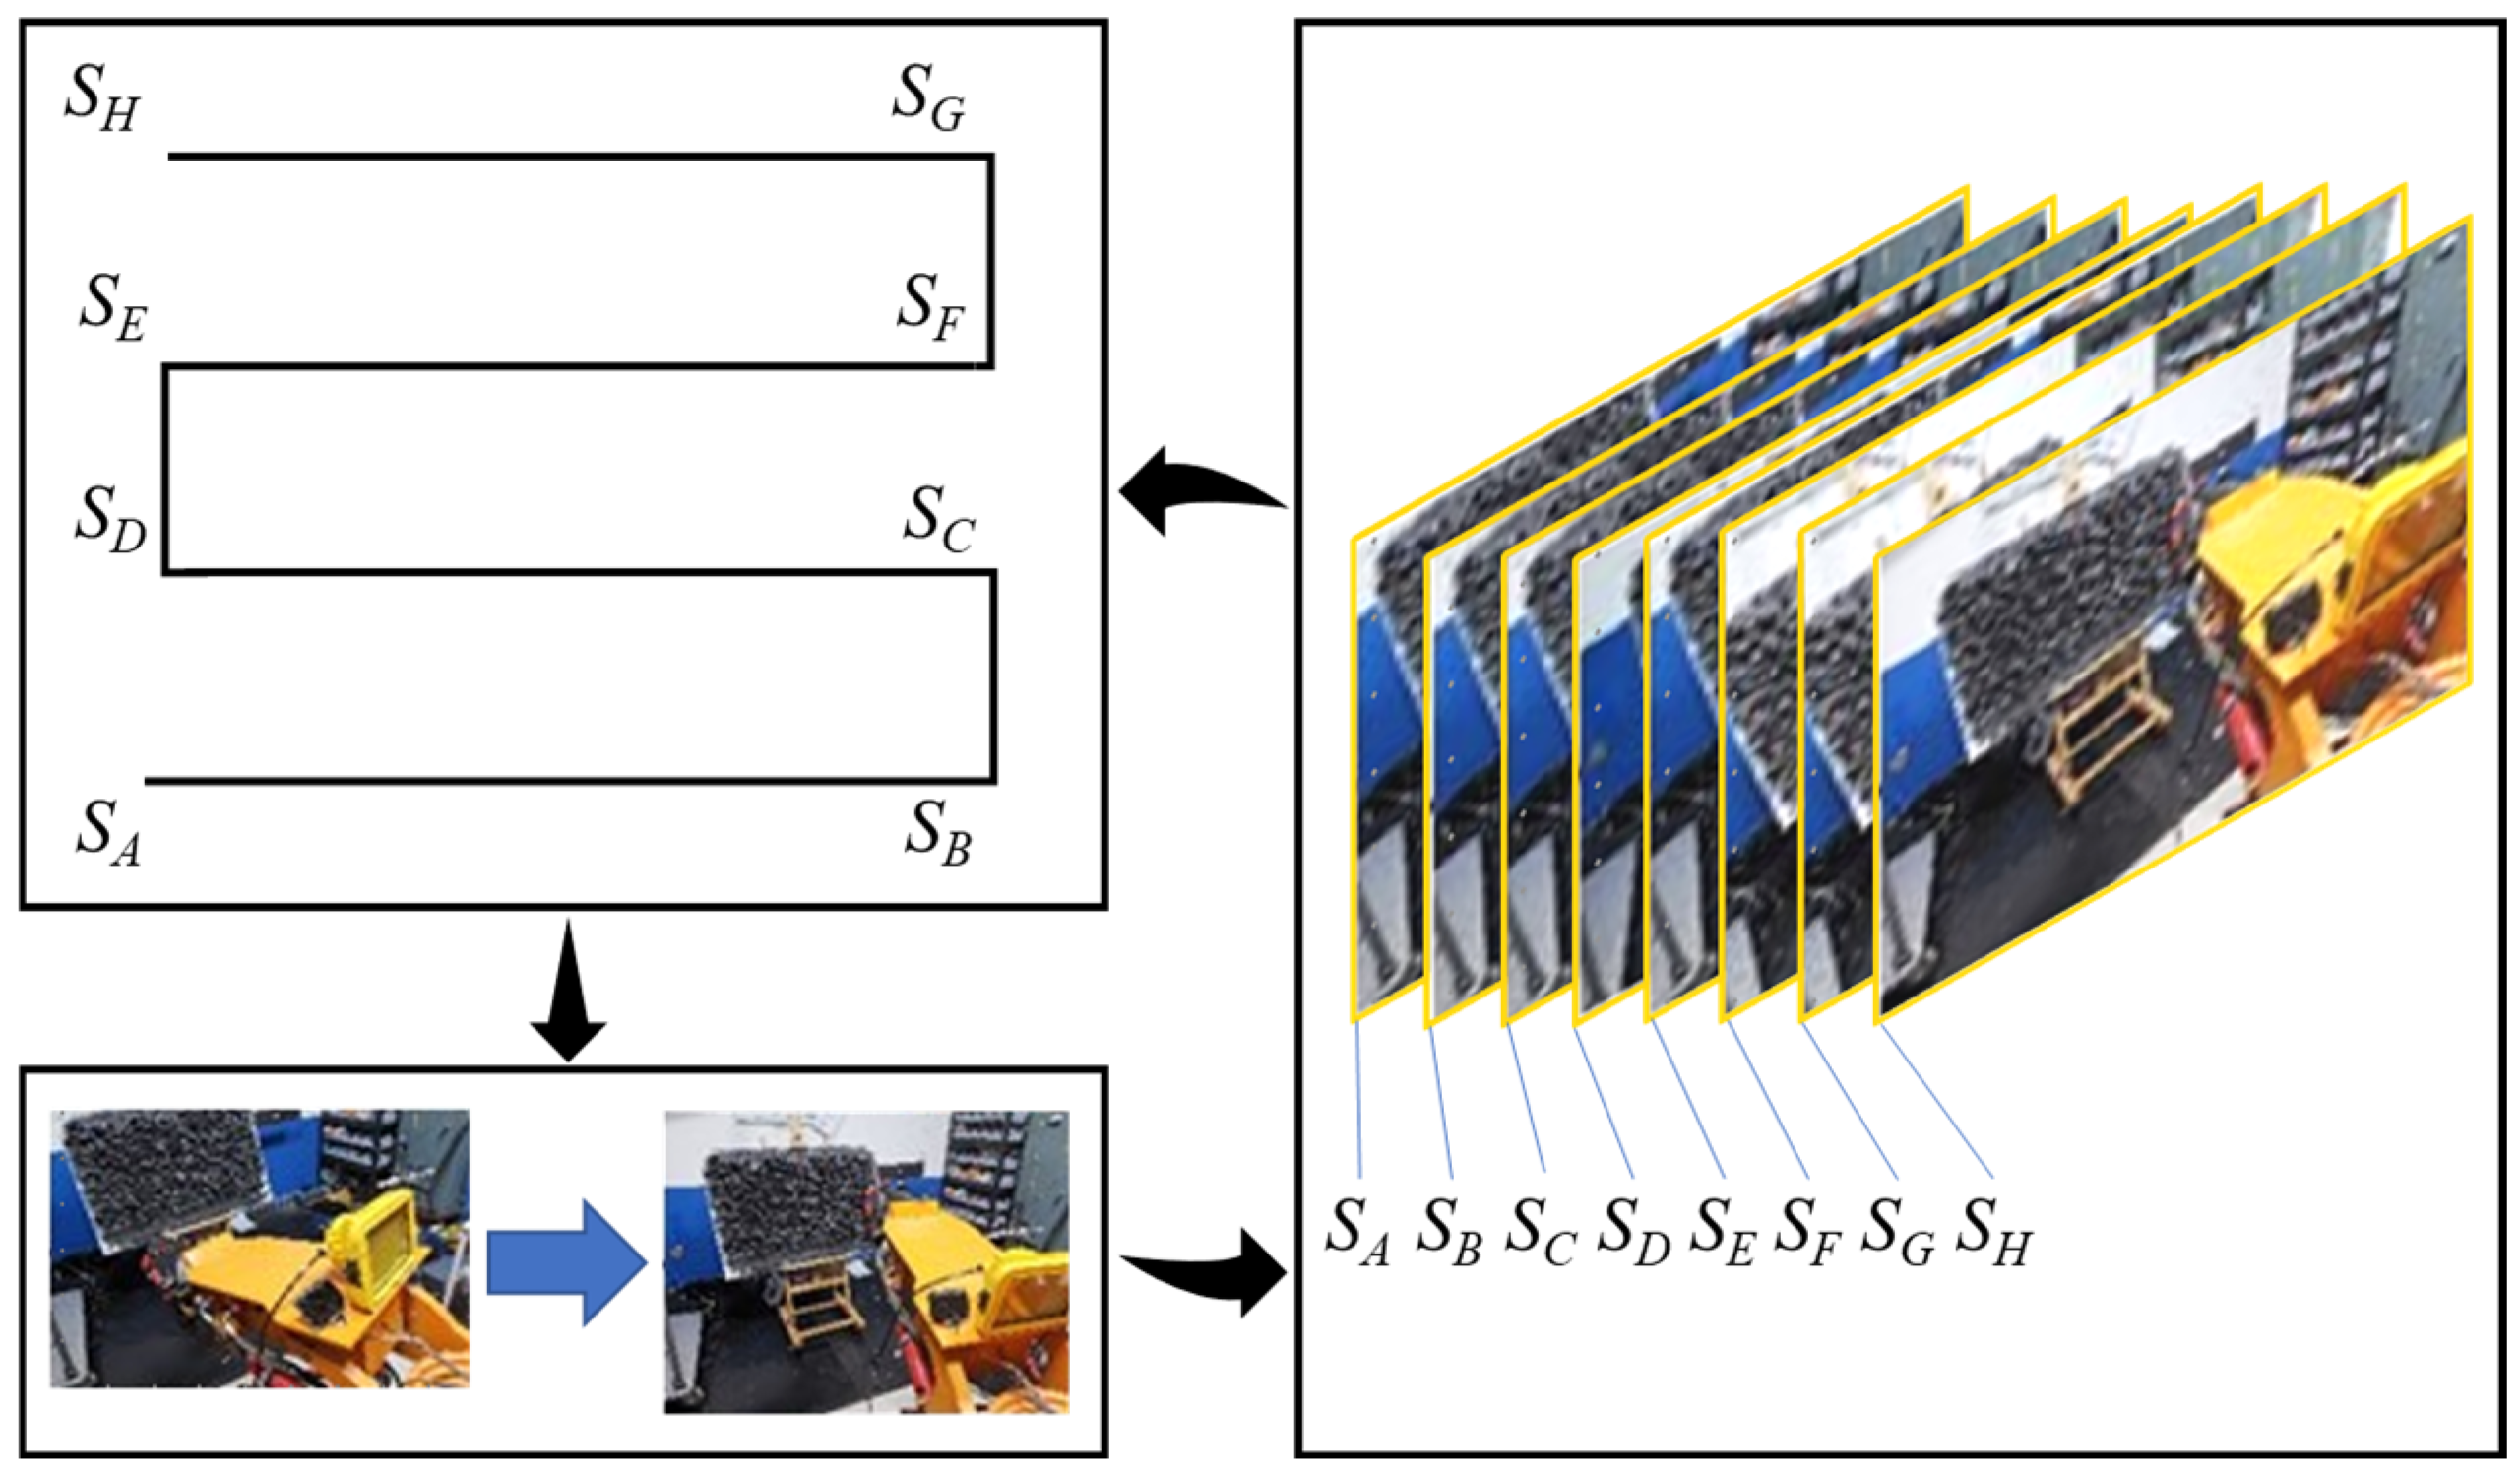
Based on cutting operation requirements, an S-shaped cutting path is planned for the implementation in the heading section, as shown in
Figure 2. The cutting head moves from coordinate point
SA to point
SH within the heading section to complete the cutting work. During this process, the cutting head’s motion alternates between the vertical and horizontal directions, and each transition point between operation modes is defined as a key state node. According to this path, the cutting state is discretized into eight key state nodes (
SA to
SH). Each state node is quantitatively described by the 10 operating state parameters listed in
Table 1, which are categorized into the following four groups:
(1) Fuselage position coordinates: comprising X, Y, and Z coordinate values. X represents the position along the roadway’s forward direction; Y represents the lateral position perpendicular to the roadway; Z represents the vertical height. These parameters define the 3D spatial location of the roadheader.
(2) Fuselage attitude angles: comprising , , , and three angle parameters. (Yaw) represents the steering angle around the Z-axis; (Pitch) represents the tilting angle around the Y-axis; (Roll) represents the tilting angle around the X-axis.
(3) Cutting arm attitude parameters: comprising three kinematic parameters, , , and . represents the rotary platform’s rotating angle; represents the cutting arm’s lifting angle; represents the cutting arm’s extension length. These parameters are used for the precise motion control and pose characterization of the cutting arm of the roadheader.
(4) Timestamp: a UTC-synchronized timestamp marking the data acquisition moment, providing temporal indexing for the virtual–physical state synchronization. The pose vector defines the fuselage state of the roadheader, while the kinematic vector parameterizes the cutting arm motion.
2.2. Event-Driven Graph Construction of Operating State Evolution
2.2.1. Operating State Evolution Relationship and Graph Construction
(1) Static Graph Construction
Based on the cutting state discretization results shown in
Figure 3, the equipment position will sequentially transition from state
to
under ideal working conditions. The inter-node relationships in the graph can be characterized by the following variations in the specific attitude parameters: when transitioning from
to
, the cutter arm’s rotating angle changes unidirectionally by
; when transitioning from
to
, the lifting angle changes by
. Correspondingly, the transition between nodes
and
can be expressed as
, and between
and
as
.
(2) Dynamic State Evolutionary Logic
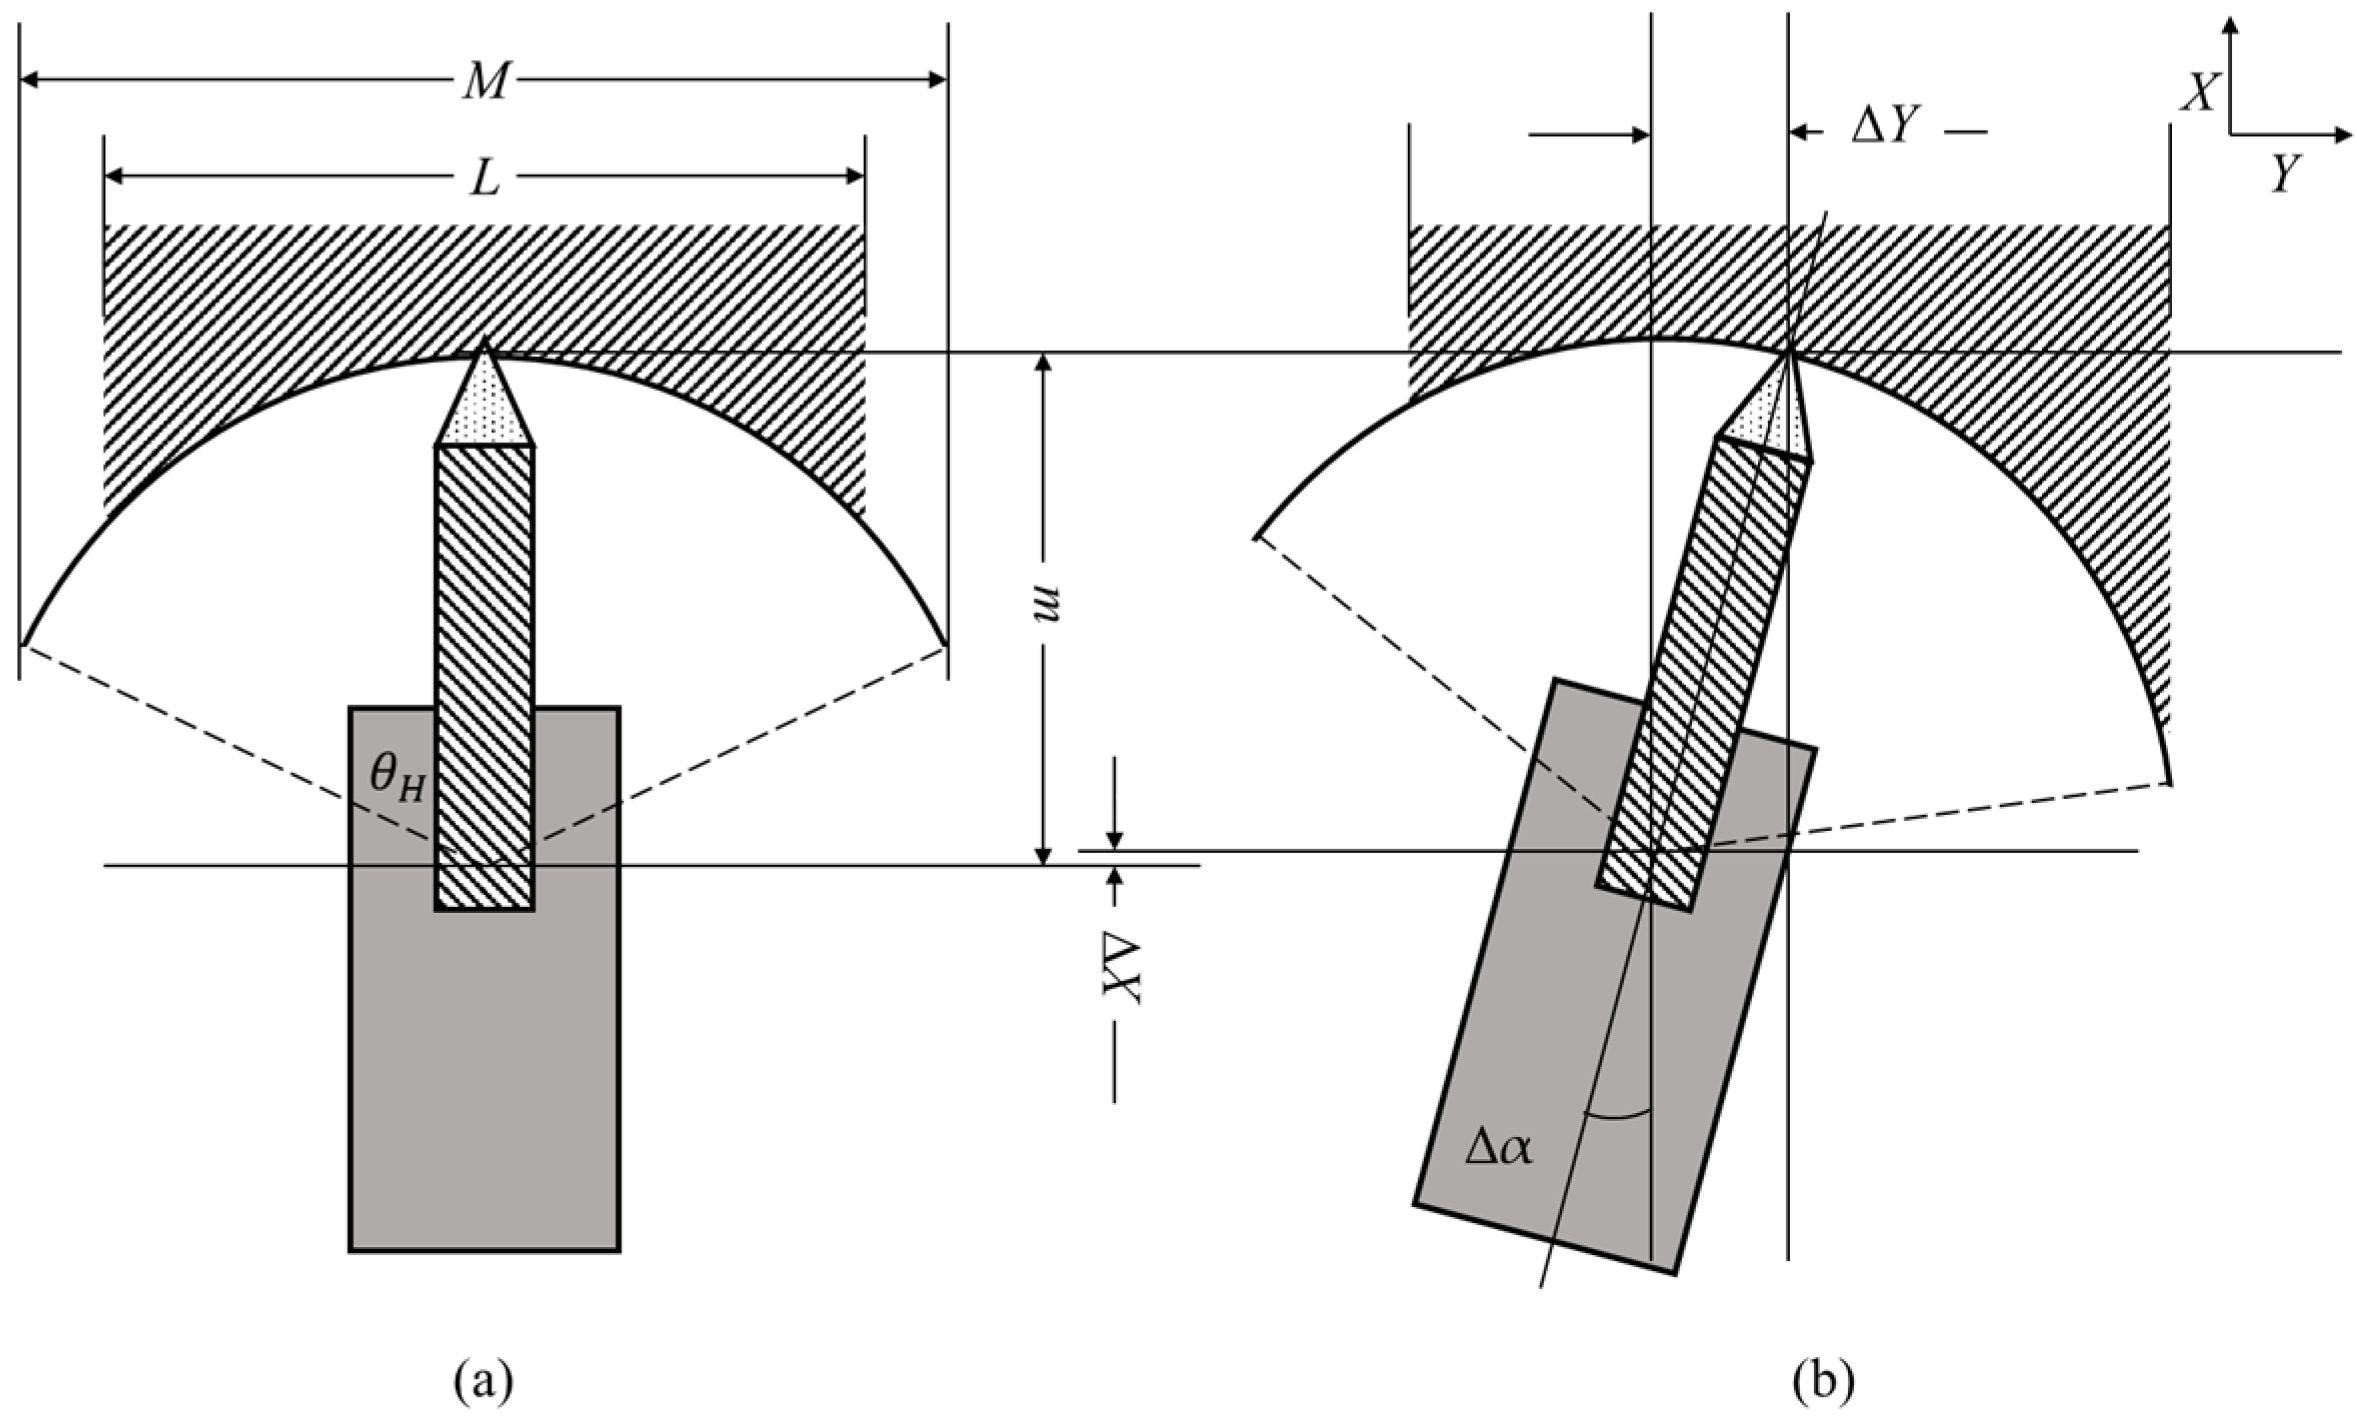
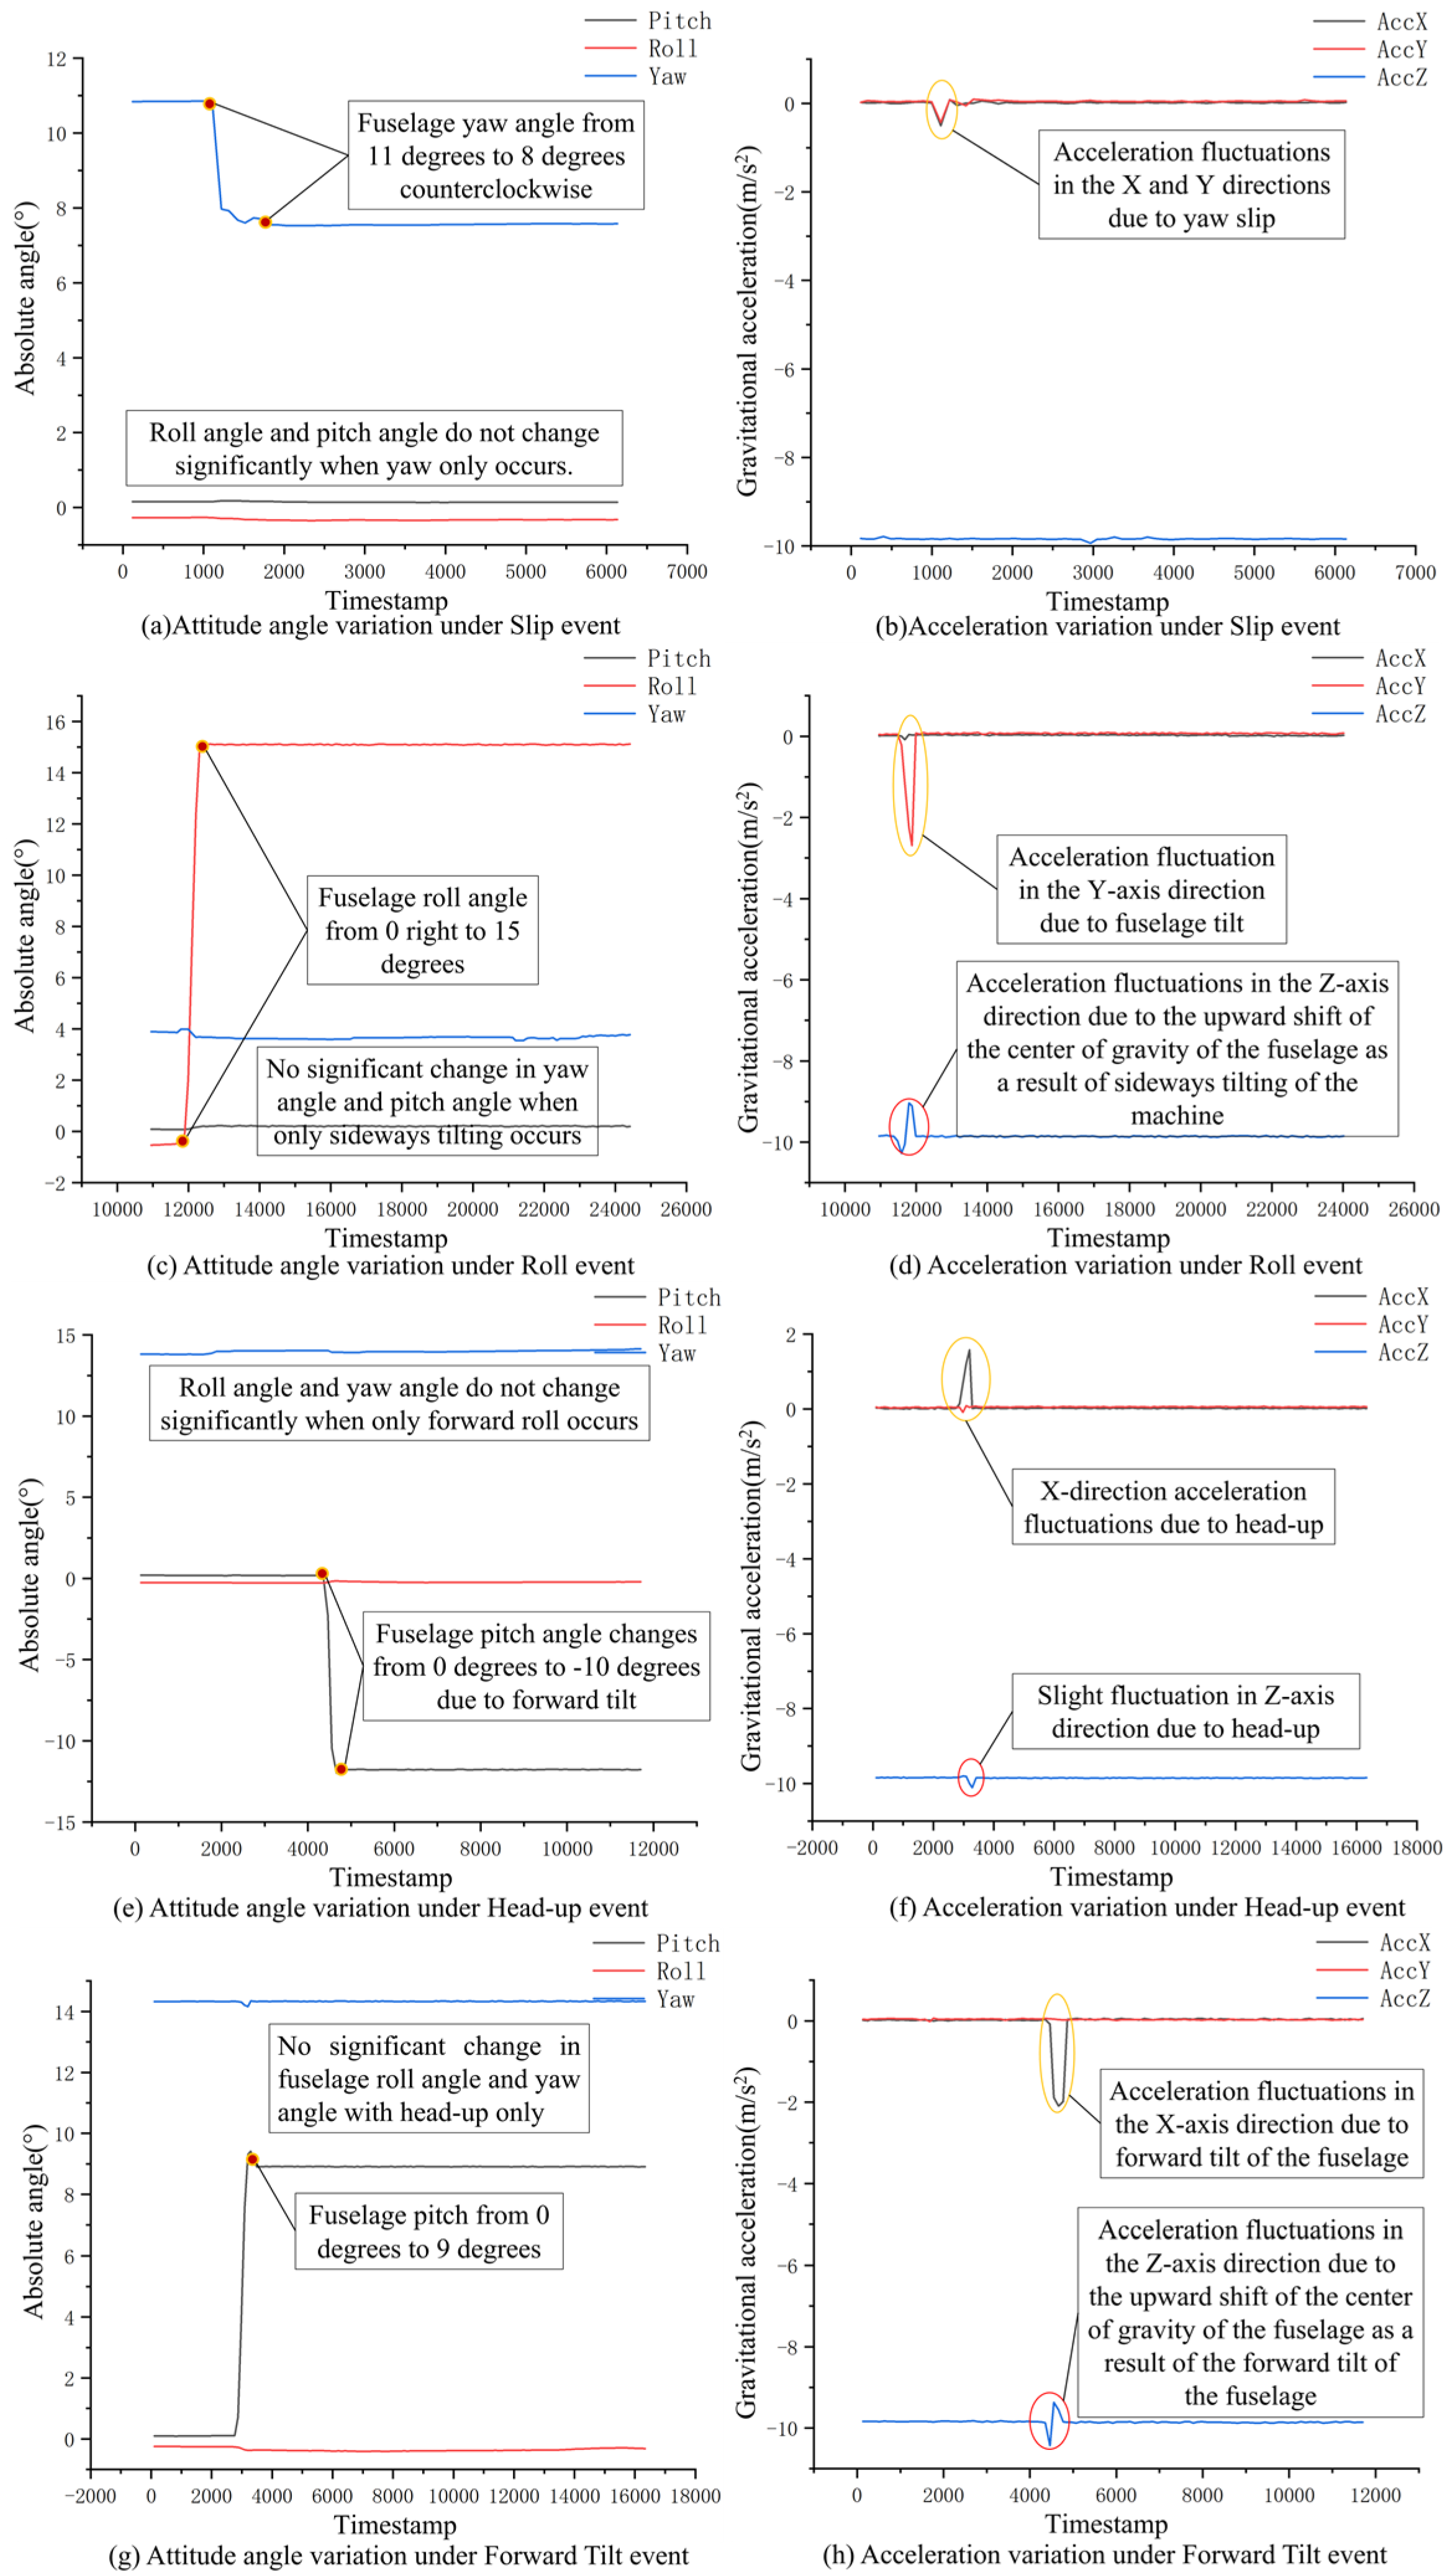
In the cutting process of the heading section, due to the complexity of the underground operating environment, the cutting process will inevitably encounter various disturbance events, which will have a certain impact on the cutting state, resulting in cutting abnormalities. For example,
Figure 4a shows the schematic diagram of the normal fuselage posture, and
Figure 4b shows the schematic diagram of the fuselage posture after sliding. In the cutting process from
to
, the reaction force of the cutting head may cause the fuselage to slide sideways, and the changed fuselage position and attitude state of the cantilever roadheader cannot ensure optimal cutting quality according to the planned cutting trajectory.
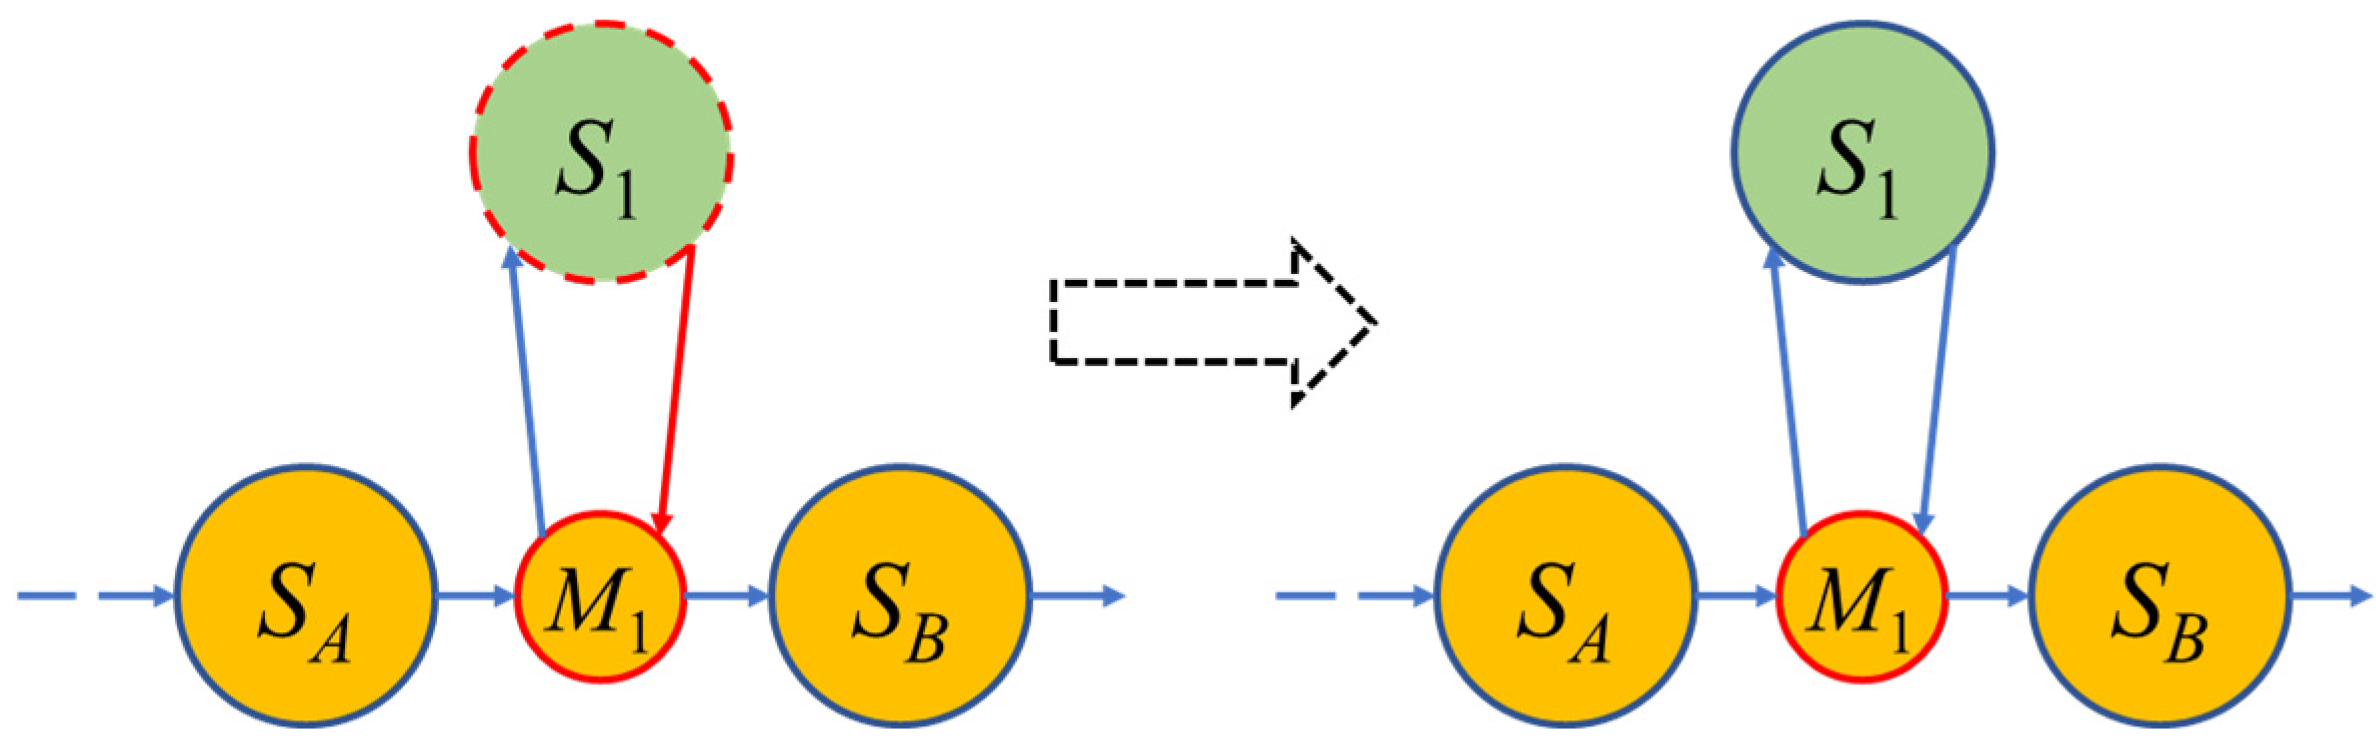
If the current fuselage slip event is regarded as an abnormal perturbation event, then the original fuselage attitude state evolution graph must be dynamically changed to ensure the feedback reliability of the graph. The abnormal perturbation occurs during the transition from state
to
, so the relationship between
and
will be changed, and a new abnormal state node will be added between
and
due to the perturbation event. As shown in
Figure 5, the planned state node at the moment before the anomalous state is generated will be recorded as the
intermediate state node, and, at the same time,
will be used as the target node for the correction of this anomalous state in order to ensure that the evolution of the state node returns to normal.
During the intelligent cutting operations, abnormal disturbance events can cause the original cutting path to be disrupted at any time. In order to ensure the cutting quality of the heading section, adjustments must be made to restore the roadheader state to the intended route when the operation state is disturbed. In this context, the state evolution network of the heading workface needs to realize closed-loop control when abnormal state branches appear, i.e., it automatically corrects the abnormal changes in the tunneling state caused by disturbances and returns to the planned operation path.
As shown in
Figure 6,
and
are both intermediate state nodes of the same type as
within the established state evolution path. In addition, the downtime mechanism at the time of perturbation enhances the executability of the state regression, and the anomalous state nodes return to the planned state evolution graph with the intermediate state nodes as the evolution target.
2.2.2. Event State Model
The automated mapping change relies on event triggering, which requires a predefined anomaly judgment scheme. Monitoring the acceleration variation in key cutting actions is essential to detect operational event changes. During normal operation, key cutting actions maintain uniform speed, and acceleration fluctuations indicate state abnormalities. For example, the platform’s rotary speed
and acceleration
are calculated by the following formula based on current time
and the specific rotation angle
:
where
,
,
denote the respective parameters at time step
.
By monitoring these parameters, the operating state normality can be determined, enabling timely measures to ensure safety and operational continuity. Abnormal acceleration fluctuations may signal operational anomalies, necessitating corrective actions for inspection.
The operational state of the equipment is characterized by the following four key parameters: the timestamp, rotation angle, lifting angle, and extension length. Variations in the acceleration of critical movements stem from the following two distinct sources: controlled adjustments following operational commands and kinematic deformations caused by external disturbances. During command-driven movements, the system maintains stable states before and after adjustments with near-zero acceleration, where the magnitude and duration of acceleration changes strictly correspond to control instructions, enabling precise action range determination. In contrast, the disturbance generates irregular acceleration patterns, whose abnormality can be identified through non-zero acceleration residuals combined with deviations from the expected command execution timelines, providing a robust mechanism for operational anomaly detection.
When acceleration deviations diverge from control commands or maintain non-zero values beyond the prescribed operation period, this indicates potential disturbance impacts on the operational behavior. Immediate corrective measures are then required to ensure the operational quality and safety. This approach enables the effective monitoring of intelligent cutting processes, allowing for timely responses to various disturbance events. The definition and characterization of events directly determine the effectiveness of the detection algorithms. Event definitions must encompass both command-triggered behaviors specified in the planned cutting trajectory and unplanned disturbances caused by complex geological conditions.
The core of event analysis lies in state monitoring and control. Therefore, event description methods should be derived from the state definition model. The cutting state is defined through temporal nodes and spatial coordinates, with discretization based on operational plans. Each state transition reflects significant changes in equipment parameters, representing the triggering of planned events. Based on state discretization and key state node definitions, events can be characterized through variations in the key kinematic parameters of the cutting arm of the roadheader.
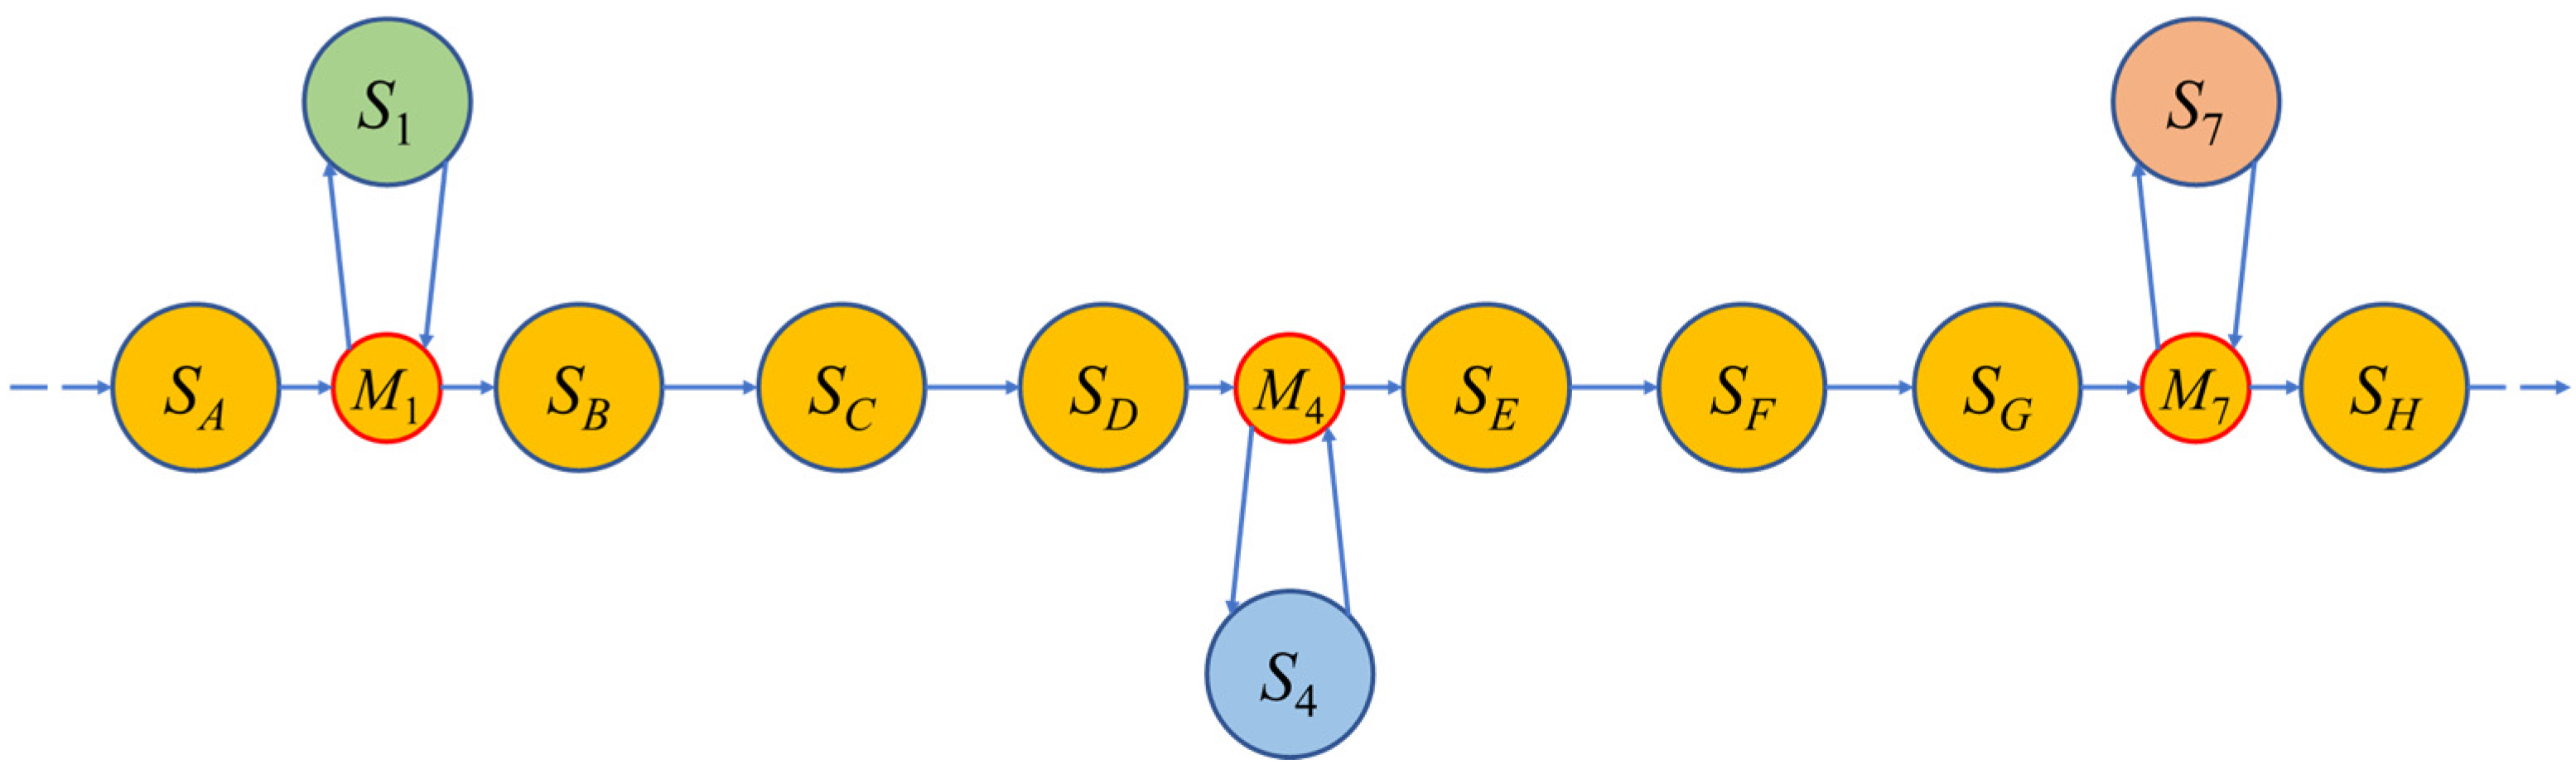
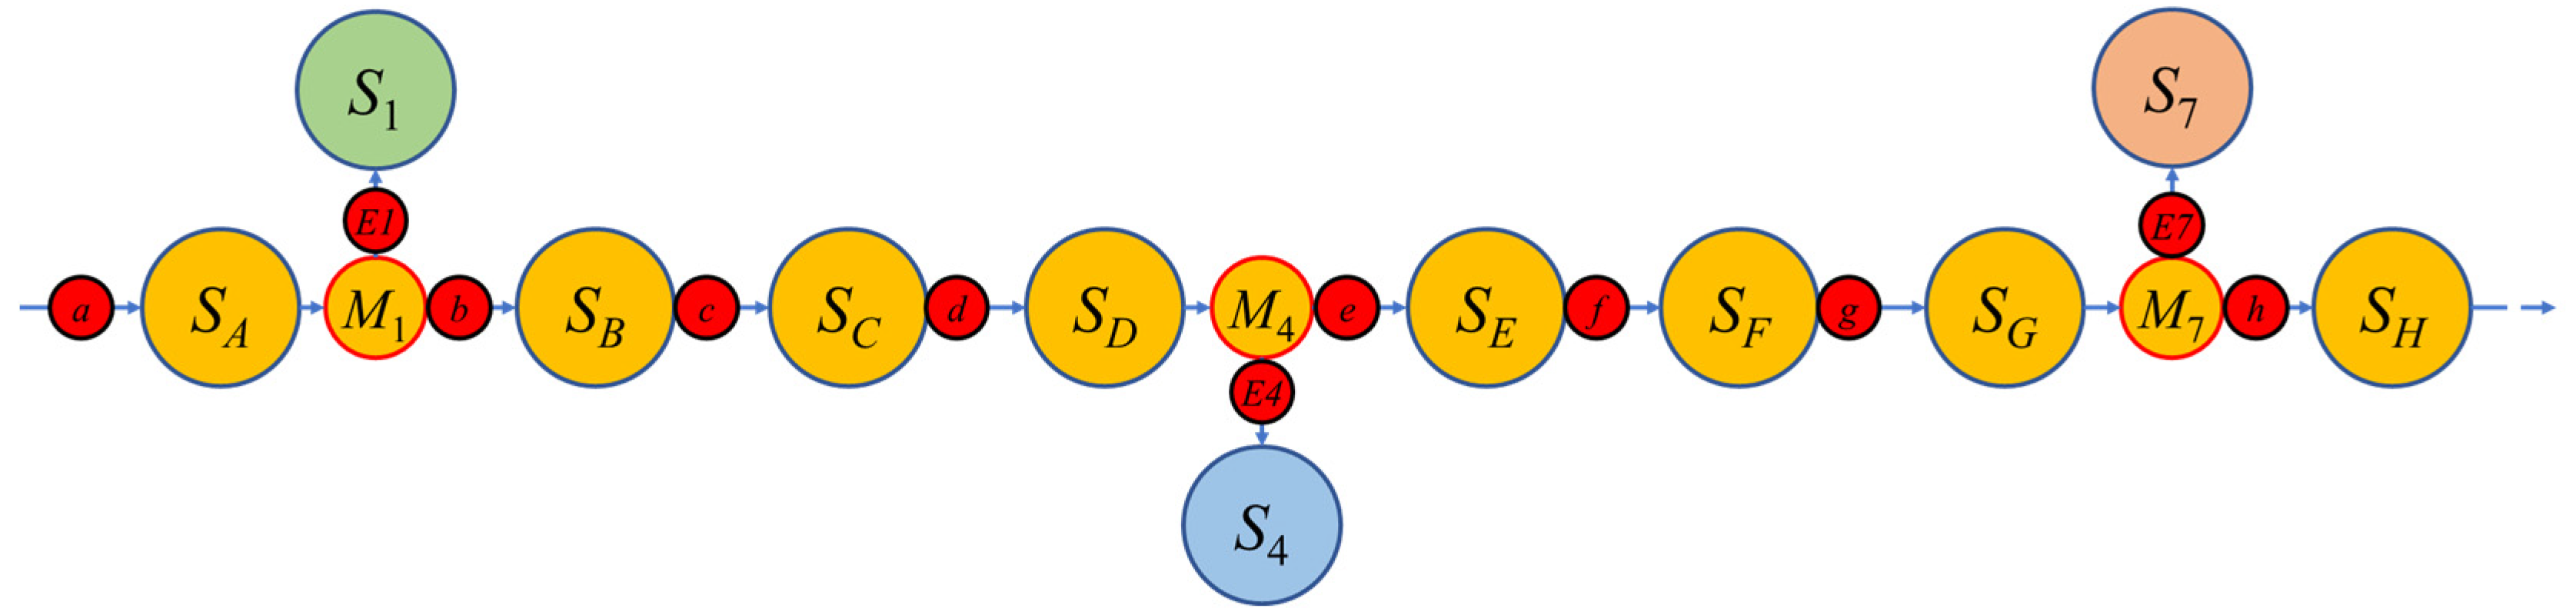
As shown in
Figure 7, each state node is preceded by a corresponding event node. Events A to H are triggered by the planned operation instructions, which cause the state of the cutting operation to change in an orderly manner according to the planned cutting trajectory. Events
,
, and
are caused by parameter shifts due to unexpected situations, and the occurrence of such disturbing events leads to the shift of the operation state beyond the planned threshold, thus failing to guarantee the heading section quality. Based on the correspondence between events and states, events can be defined vectorially,
. This definition method helps to clarify the relationship between events and state changes, and provides a basis for event detection and processing. Through this method, the events in the cutting process can be accurately captured and described, and then effective state control can be realized.
2.2.3. Event and State Storage Model
Building a state evolution graph requires storing and retrieving historical states, and event state models require a database to record historical events. Anomalous states from prior excavation cycles are integrated into the state set to initialize new cycles. With the accumulation of data from multiple intercepts, the state evolution graph will be more comprehensive in covering the perturbation event states, thus improving the accuracy of the state evolution graph-based roadheader position recognition and control.
The stored deterministic event states are based on the key features of previous states, including threshold descriptions. To reduce the computational burden in the evolution process, the established event states and perturbed event states should be stored in a unified mode. However, the perturbation event states do not require threshold delineation, so the threshold descriptions of the key feature values are not included when storing such states. Therefore, a unified storage model should be designed for these two different categories of events. The event states are categorized and stored hierarchically according to the division of the state thresholds and the different stages of the truncation operation, using the threshold division results as the criteria for determining the state intervals, and the state descriptions are based on the current spatial and temporal attitude parameters, and the state points within different state intervals are defined as different types.
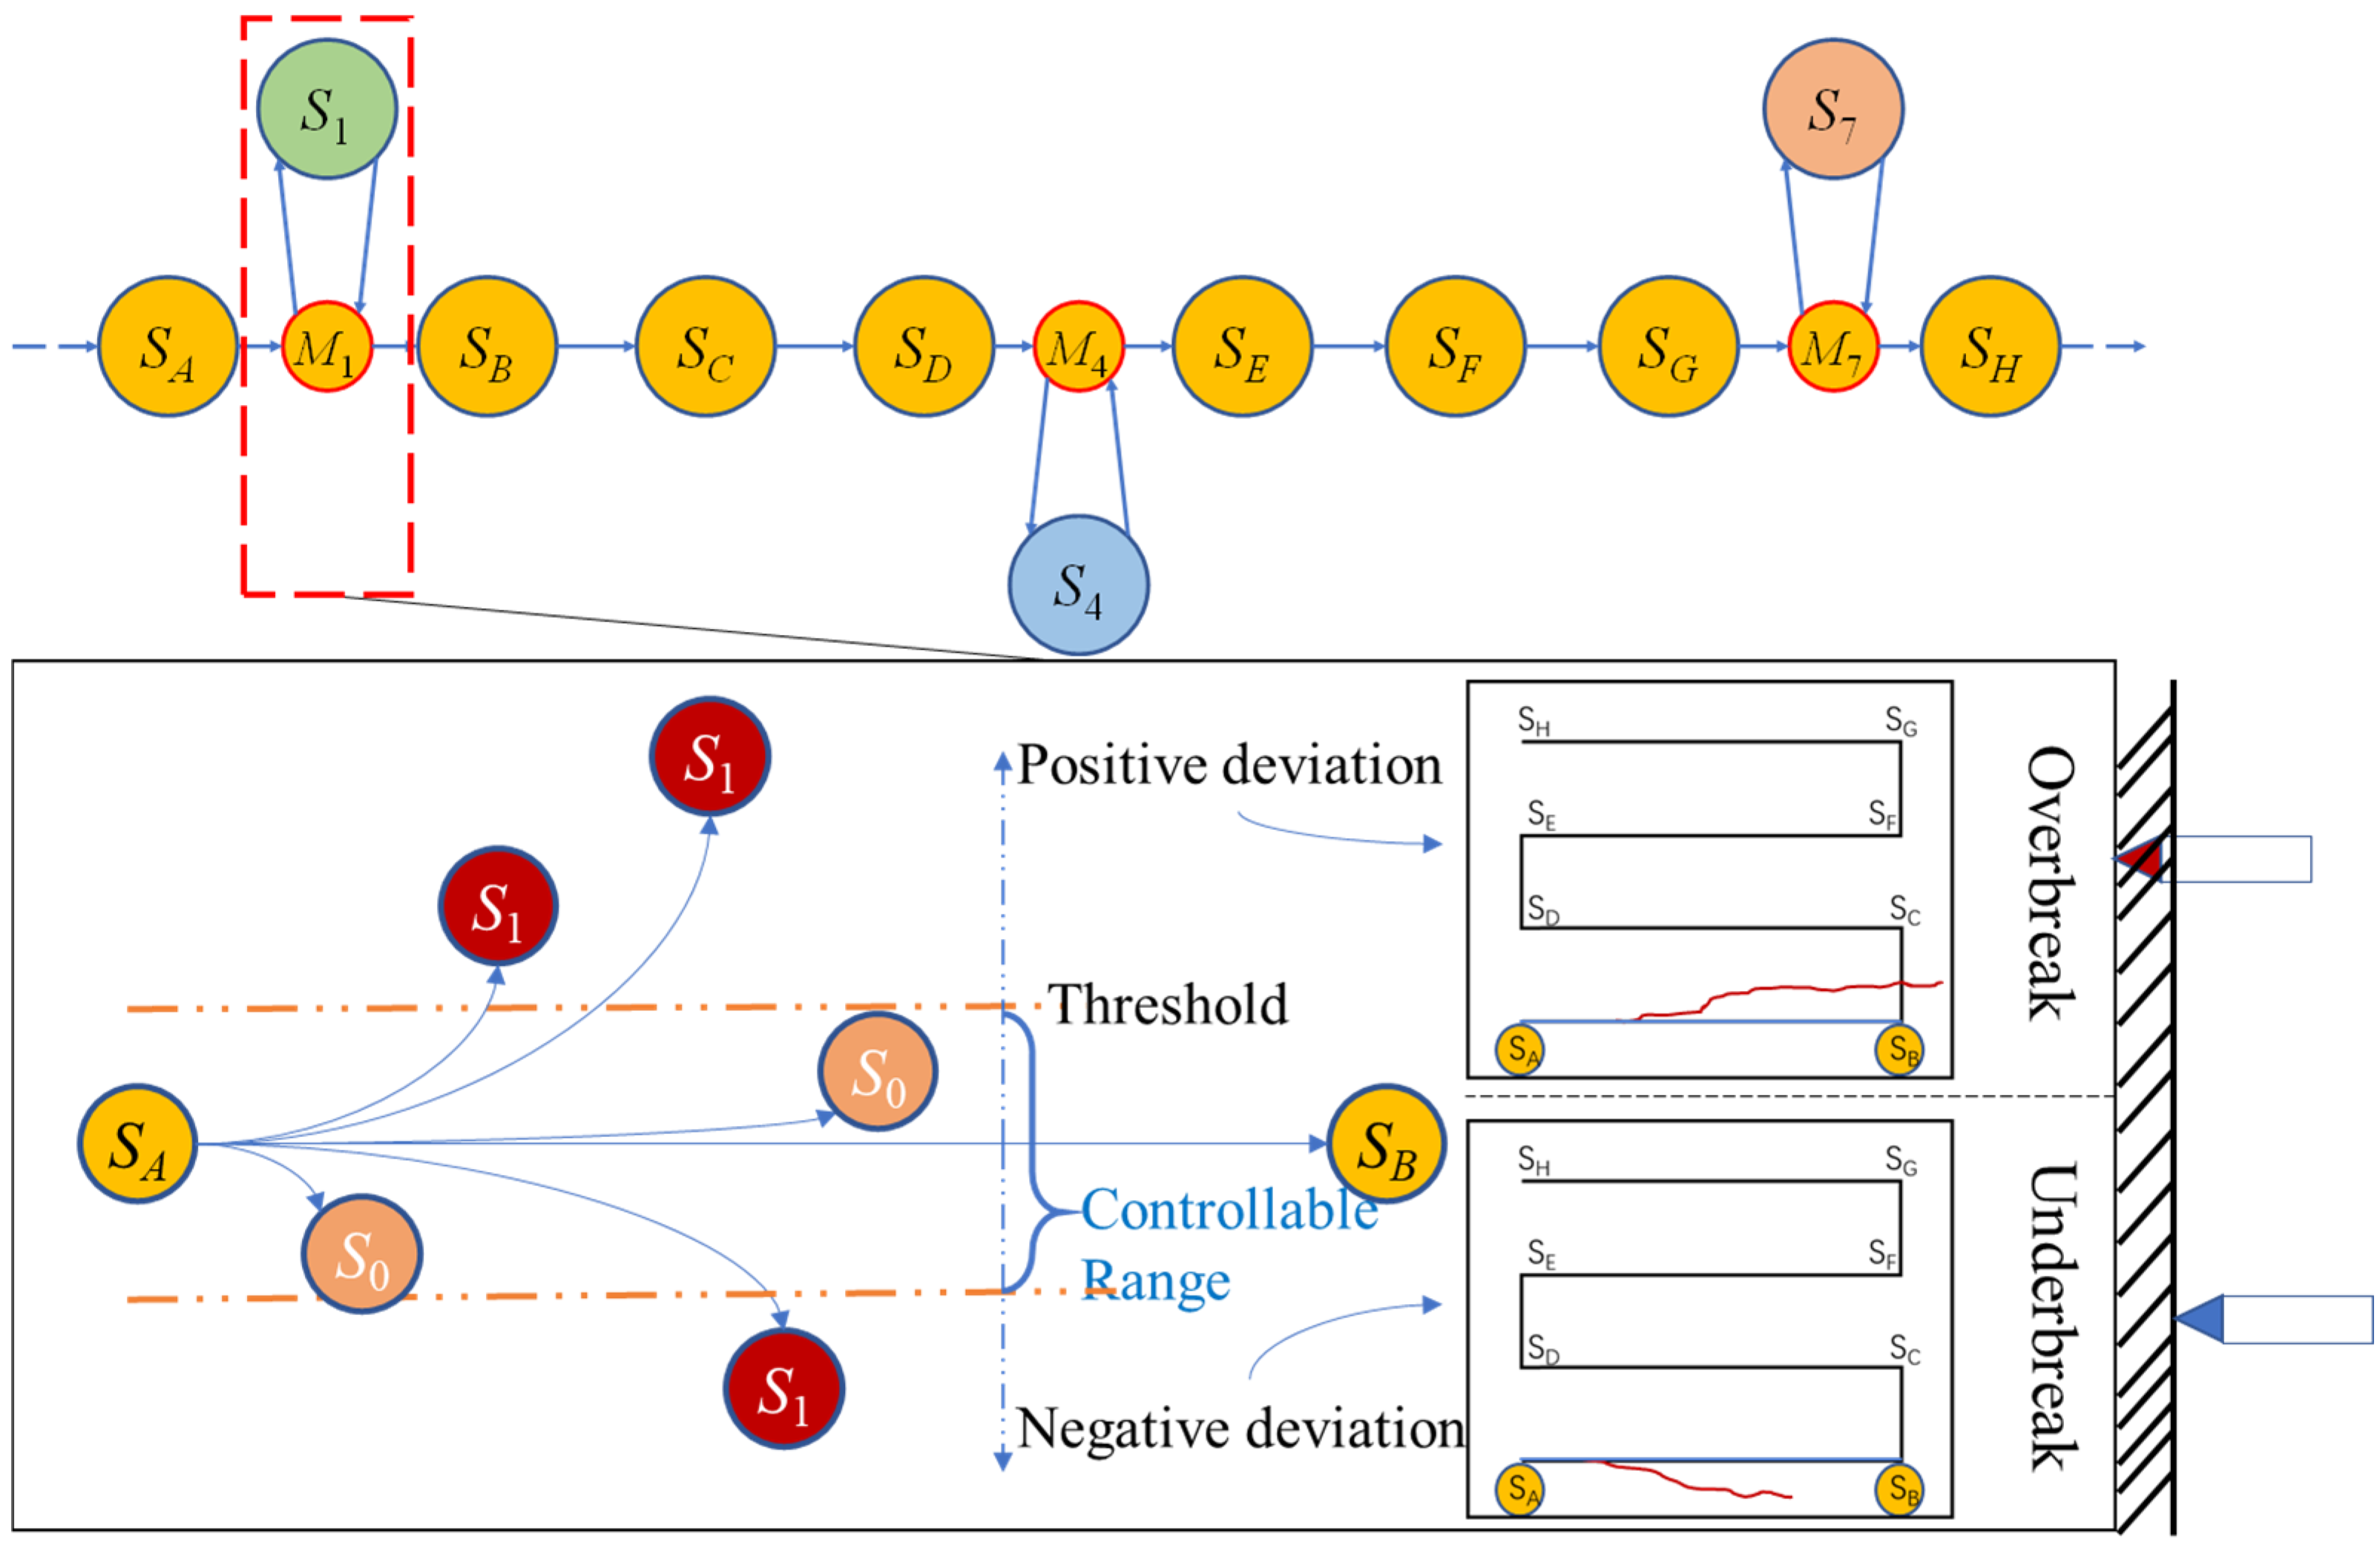
In the same cutting trajectory, different perturbation states are categorized as the same type. For example, in
Figure 8, the three potential perturbation event states derived during the transition from state
to
are all considered to be of type 1. Despite the fact that these events belong to the same type, there are significant differences between them. These differences arise because multiple error accumulations are experienced as the state deviates from the normal path, and the type and degree of error is influenced by the specific scenario, resulting in anomalies of the same type that may end up being very different. Therefore, the hierarchical classification storage scheme adopted is actually an organization of the irregular state evolution process. As shown in
Figure 8, the upward protruding state node
and the opposite direction
are of the same type of abnormal event because they both occurred during the same truncation stage. As for
, it represents a normal truncation state that does not exceed the constraint threshold.
2.3. Real-Time Data-Driven Dynamics Evolution of the Cutting State
2.3.1. Disturbance Recognition Algorithm
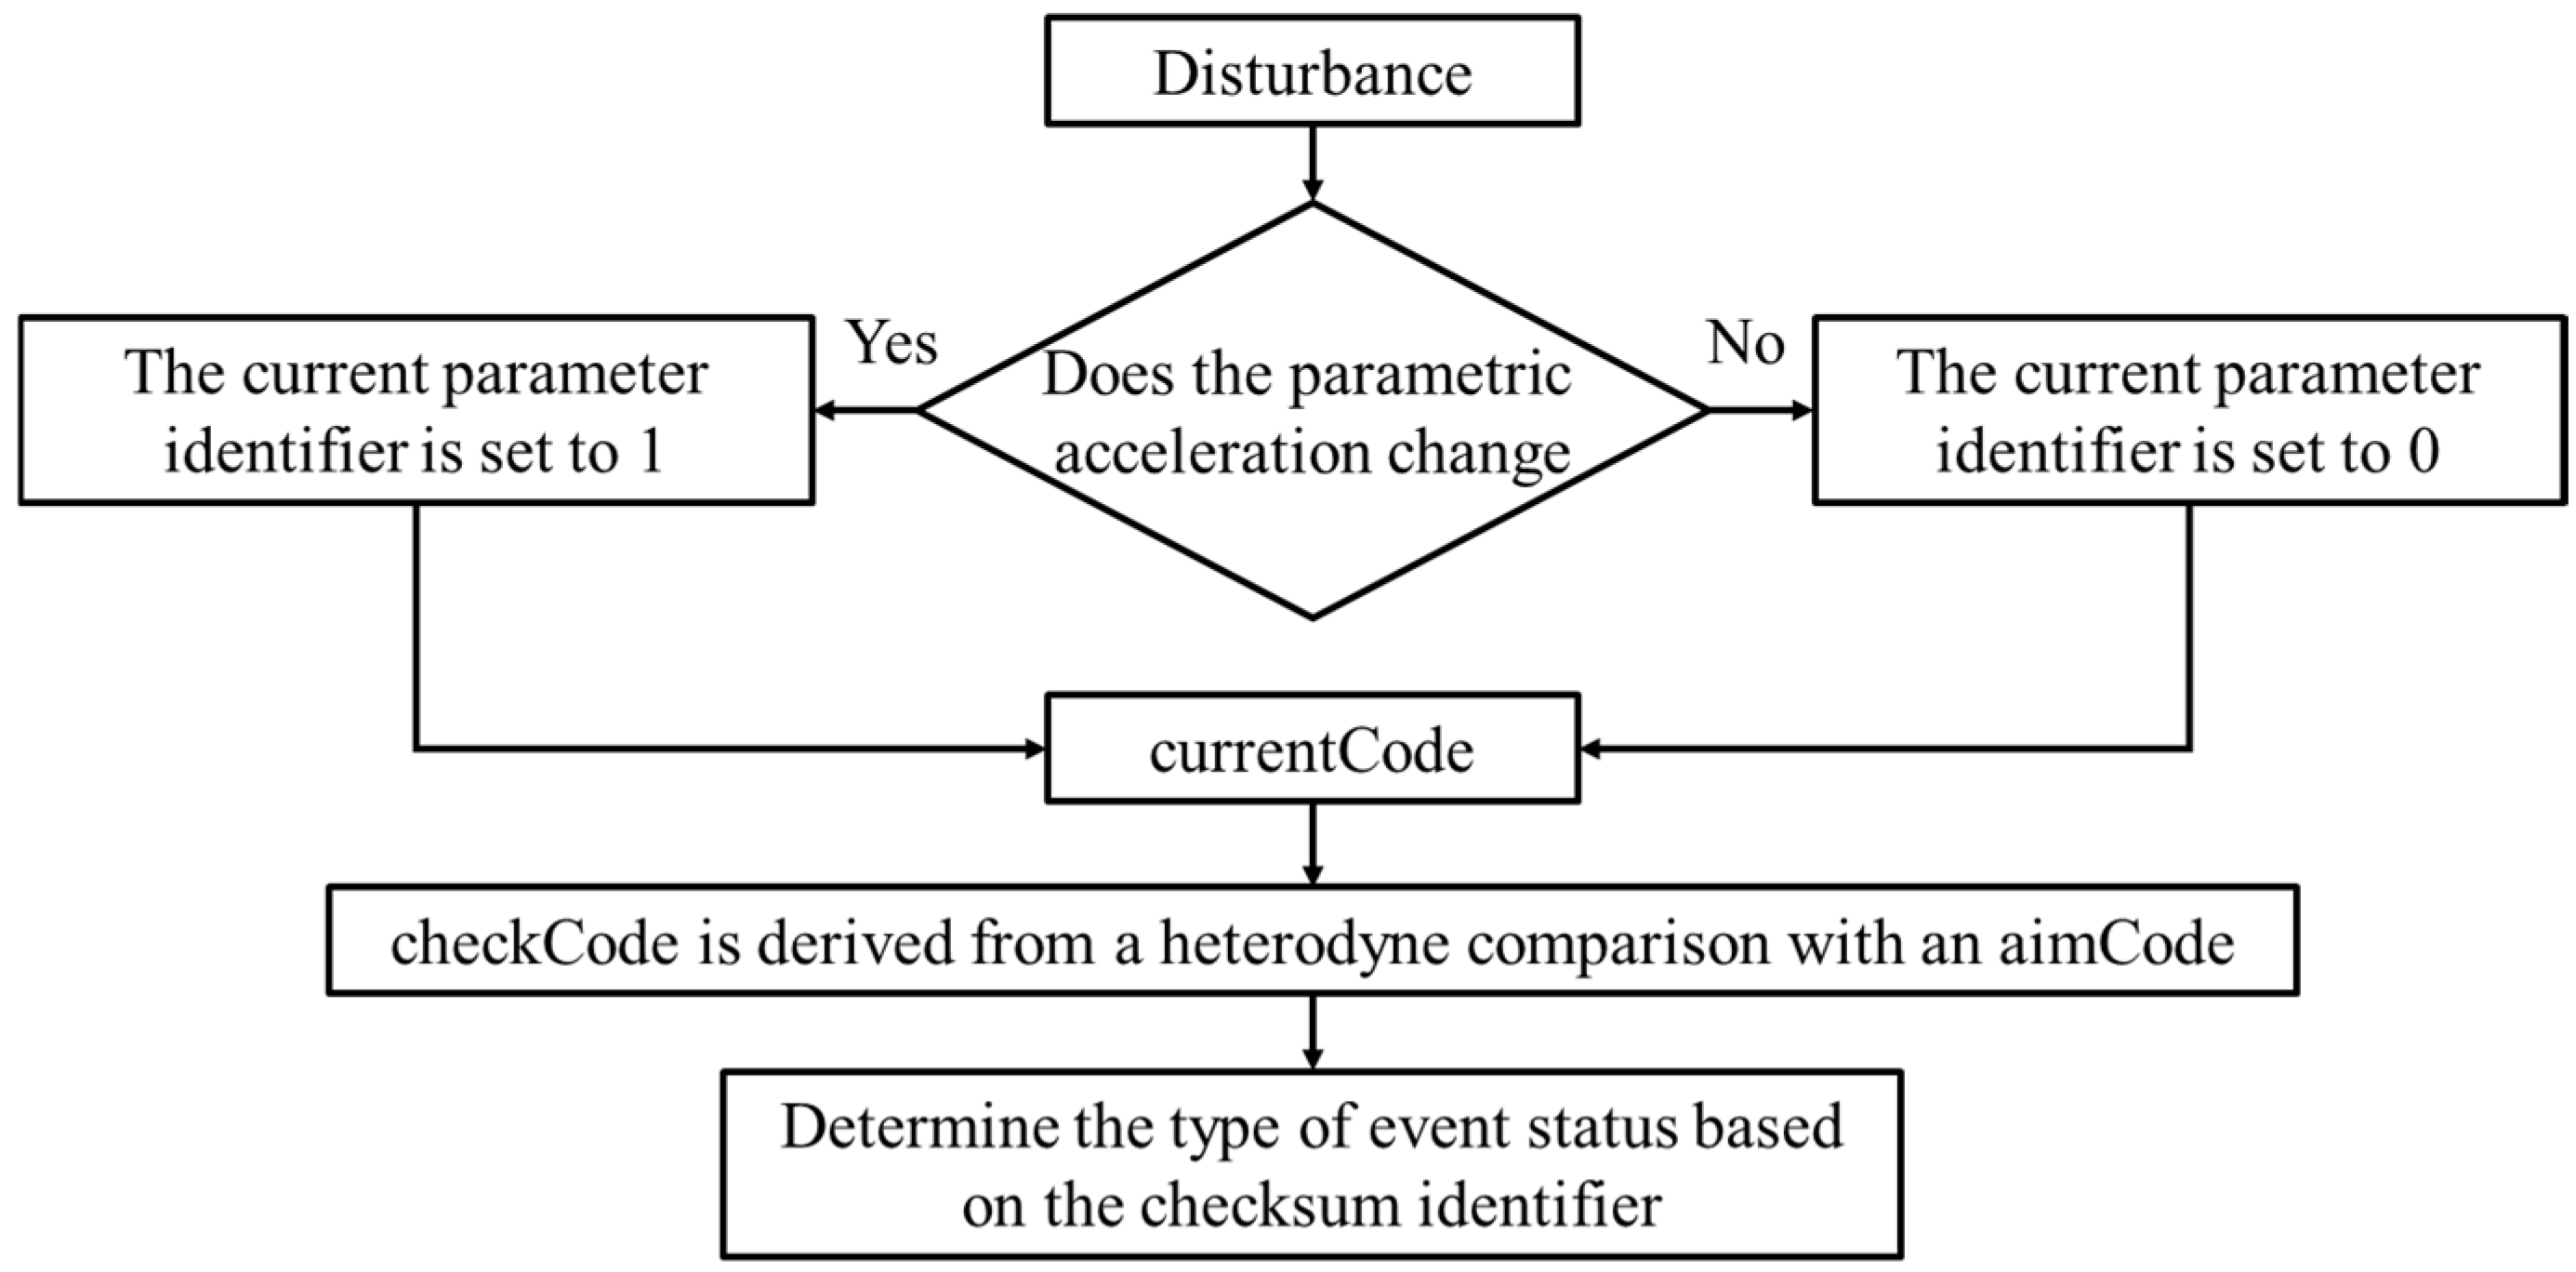
The basis of the model operation lies in the ability to identify anomalous states. The method of identifying event state types is critical to the endogenous evolution of the model’s dynamics. As shown in
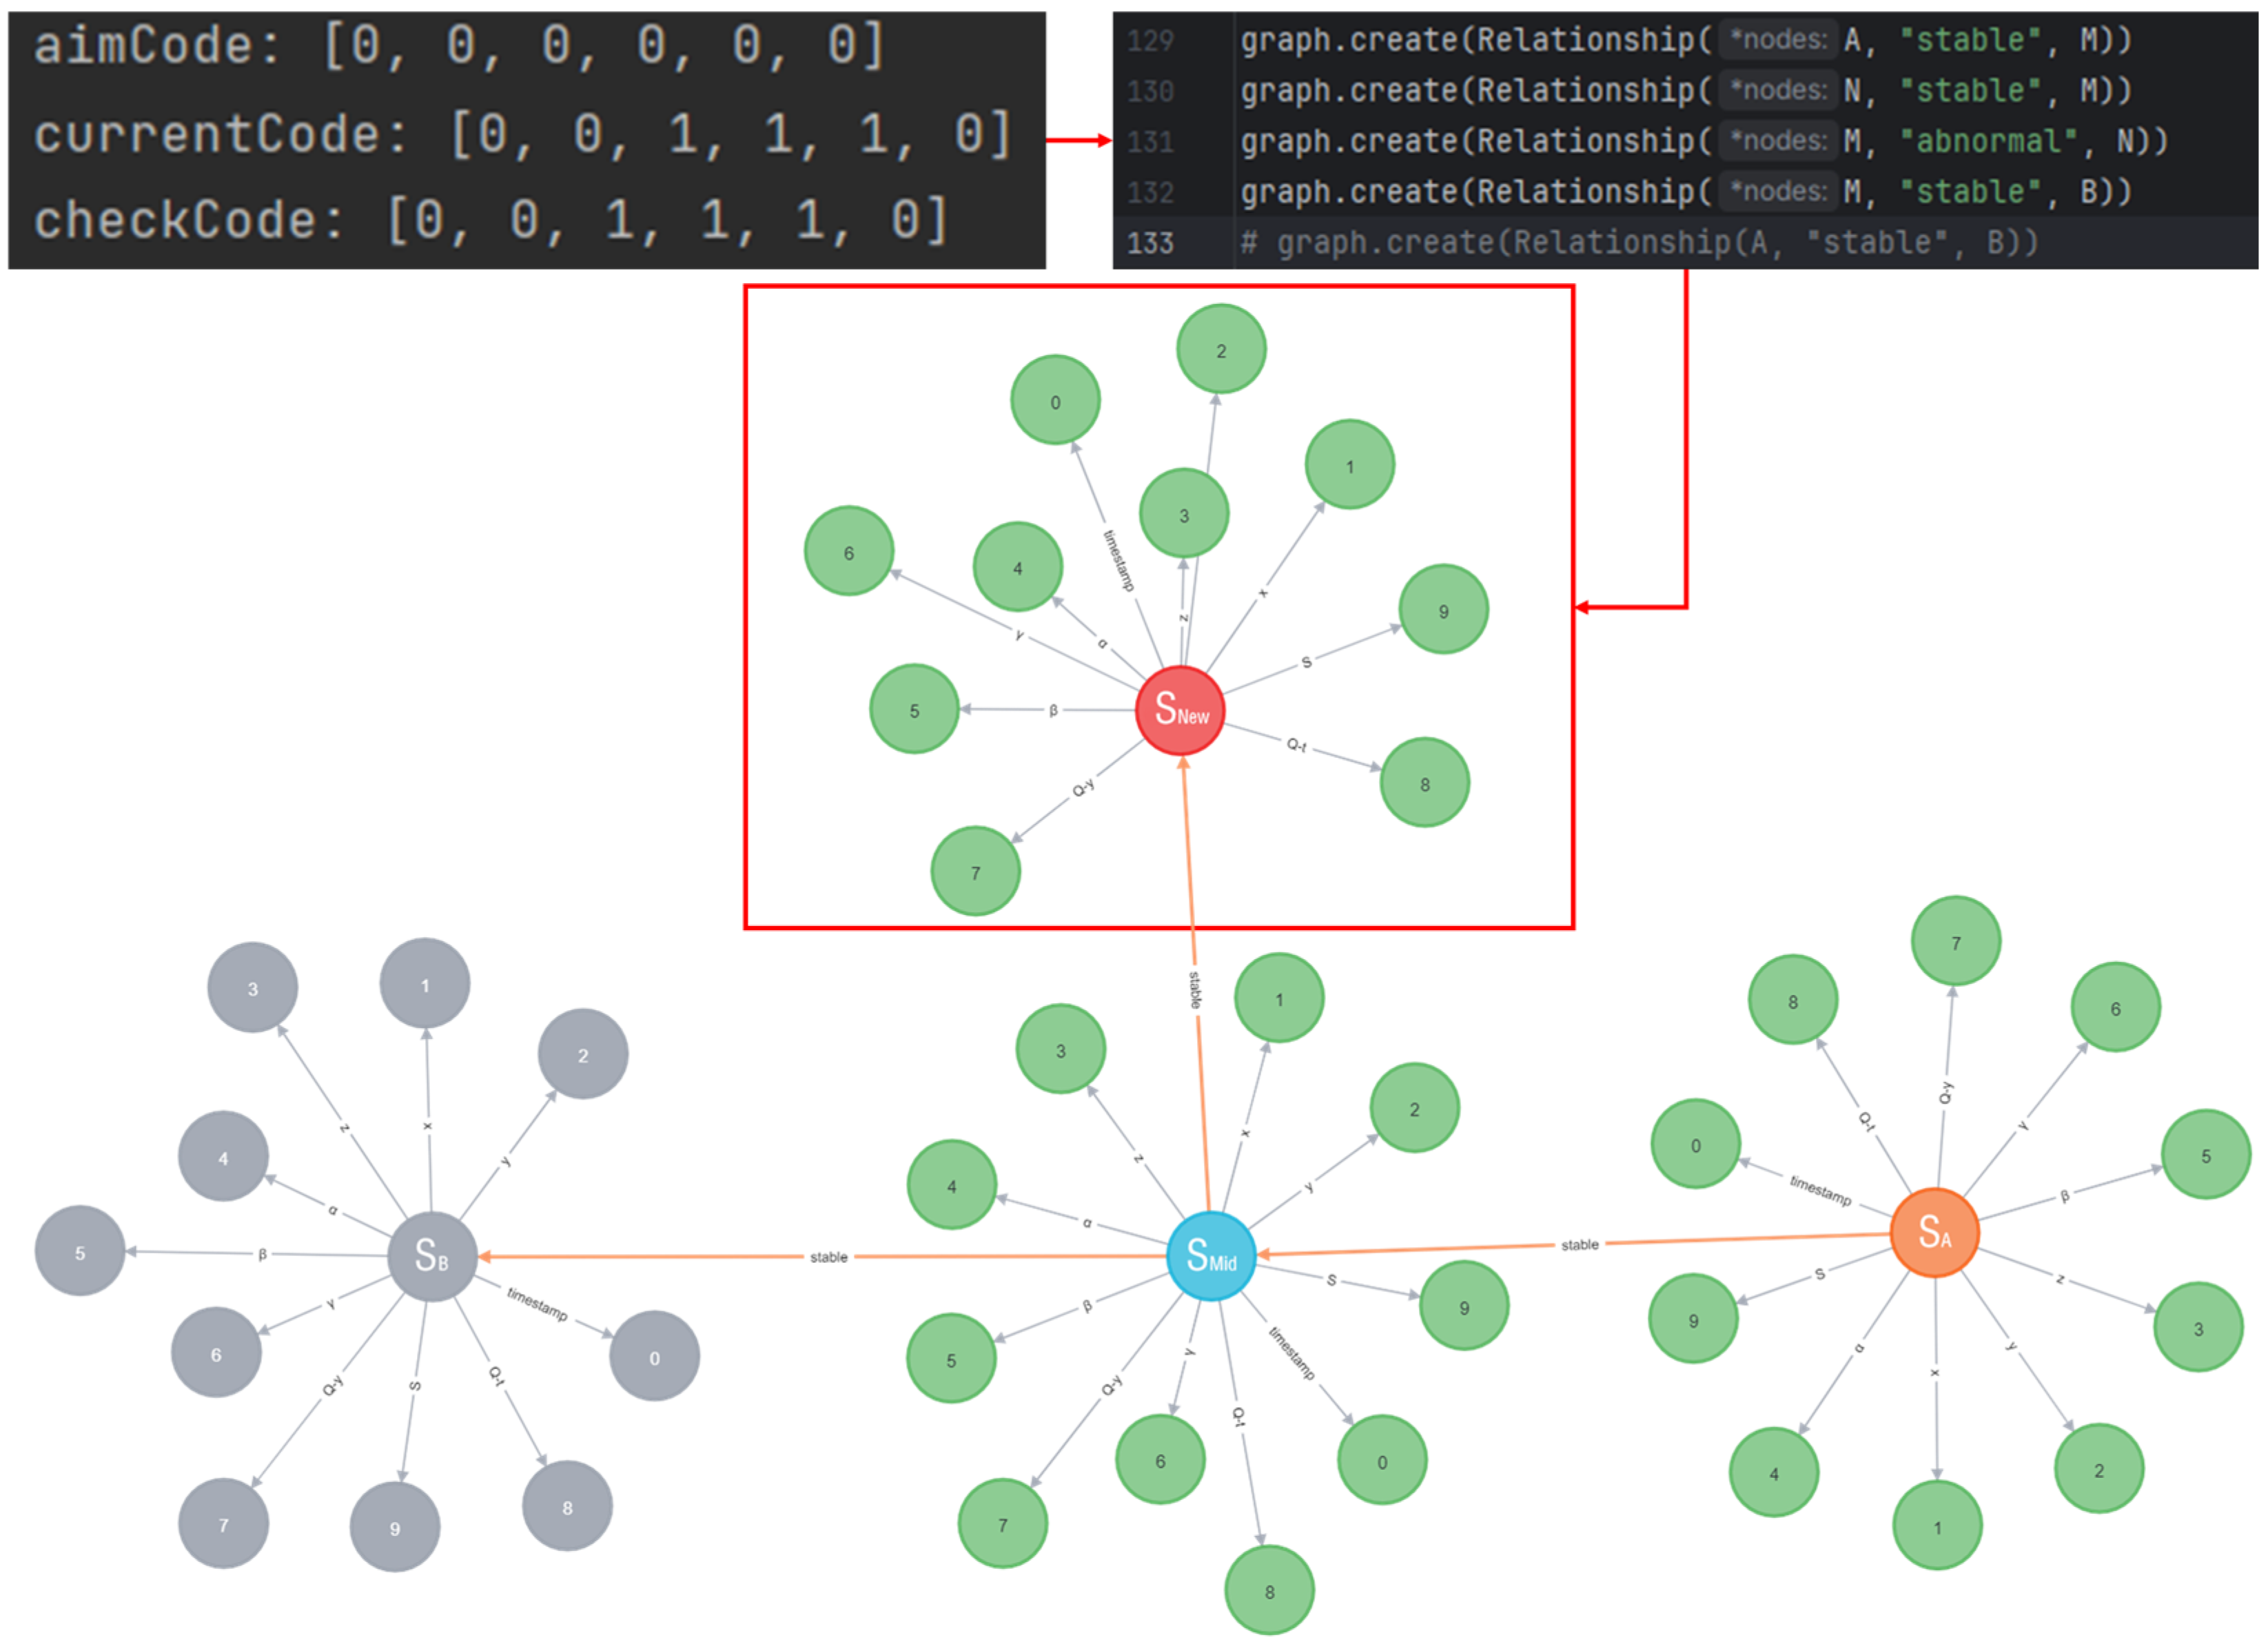
Figure 9, the disturbance recognition algorithm consists of the following three state identifiers: aimCode, currentCode, and checkCode, which are consistently judged through a different-or-other (XOR) relationship. The 0 or 1 in these identifiers represents a change in the acceleration of a parameter at the current timestamp, with a change being 1 and no change being 0.
The aimCode represents a control command event at the current timestamp. For example, during the cutting process from state to , the system needs to adjust the motion mode, stop rotating, and start lifting the cutting arm, and the overall fuselage position remains unchanged. Taking the case of not considering the cutting arm extension as an example, the system command event identifier at should be T110000000, where T stands for the timestamp of the system command, and the numbers from the left to the right represent the platform rotating acceleration, the cutting arm lifting angle acceleration, the cutting arm extension, the spatial coordinates of X, Y, and Z, the fuselage yaw angle α acceleration, the fuselage pitch angle β acceleration, and the fuselage roll angle acceleration. The other parameters are 0 if they are unchanged, the rotating angle acceleration of rotation platform becomes negative when the rotating stops, and the cutter arm lifting angle acceleration increases suddenly when the lifting starts.
As shown in
Figure 8, abnormal perturbations usually occur in non-system command bits. Under these conditions, when branch state node
is generated, the cutting state should maintain the original operation state, i.e., the aimCode should be 000000000. If the current state is the lifting angle abnormality, the corresponding acceleration of the lifting angle will change, i.e., the current state identification code currentCode is 010000000. Comparing aimCode and currentCode, we can obtain the specific variable of the unplanned change, i.e., checkCode is 010000000. According to checkCode, we can determine the type of current event.
Before constructing the event-triggering mechanism, it is crucial to clarify its role and the significance of its construction. The core objective of the mechanism is to ensure the synchronization of the virtual and physical in the intelligent cutting process. In the current synchronization scheme, the virtual control platform and the physical cutting process synchronize their operations according to the instructions of the planned operation. If the cutting process encounters disturbances that lead to unplanned changes in the operation, the virtual–real synchronization that was originally maintained by synchronizing the operation instructions will be destroyed. The virtual cutting scene needs to be adjusted according to the real data feedback from the physical cutting, but this process generates a time delay. If the virtual cutting state is adjusted in real time according to sensor data, the virtual cutting state will always lag behind the physical cutting state, which cannot accurately reflect the current cutting state, affecting the corrective decision making of the intelligent tunneling system on cutting anomalies. The event-triggering mechanism identifies the disturbance event when it occurs and adjusts the virtual synchronization strategy.
When a change in the cutting state is detected by an acceleration comparison, the value of the specific parameter change is calculated and compared with the last two control instruction change nodes. If the established operation control instructions do not contain the current change, it means that the state change is caused by a disturbance event.
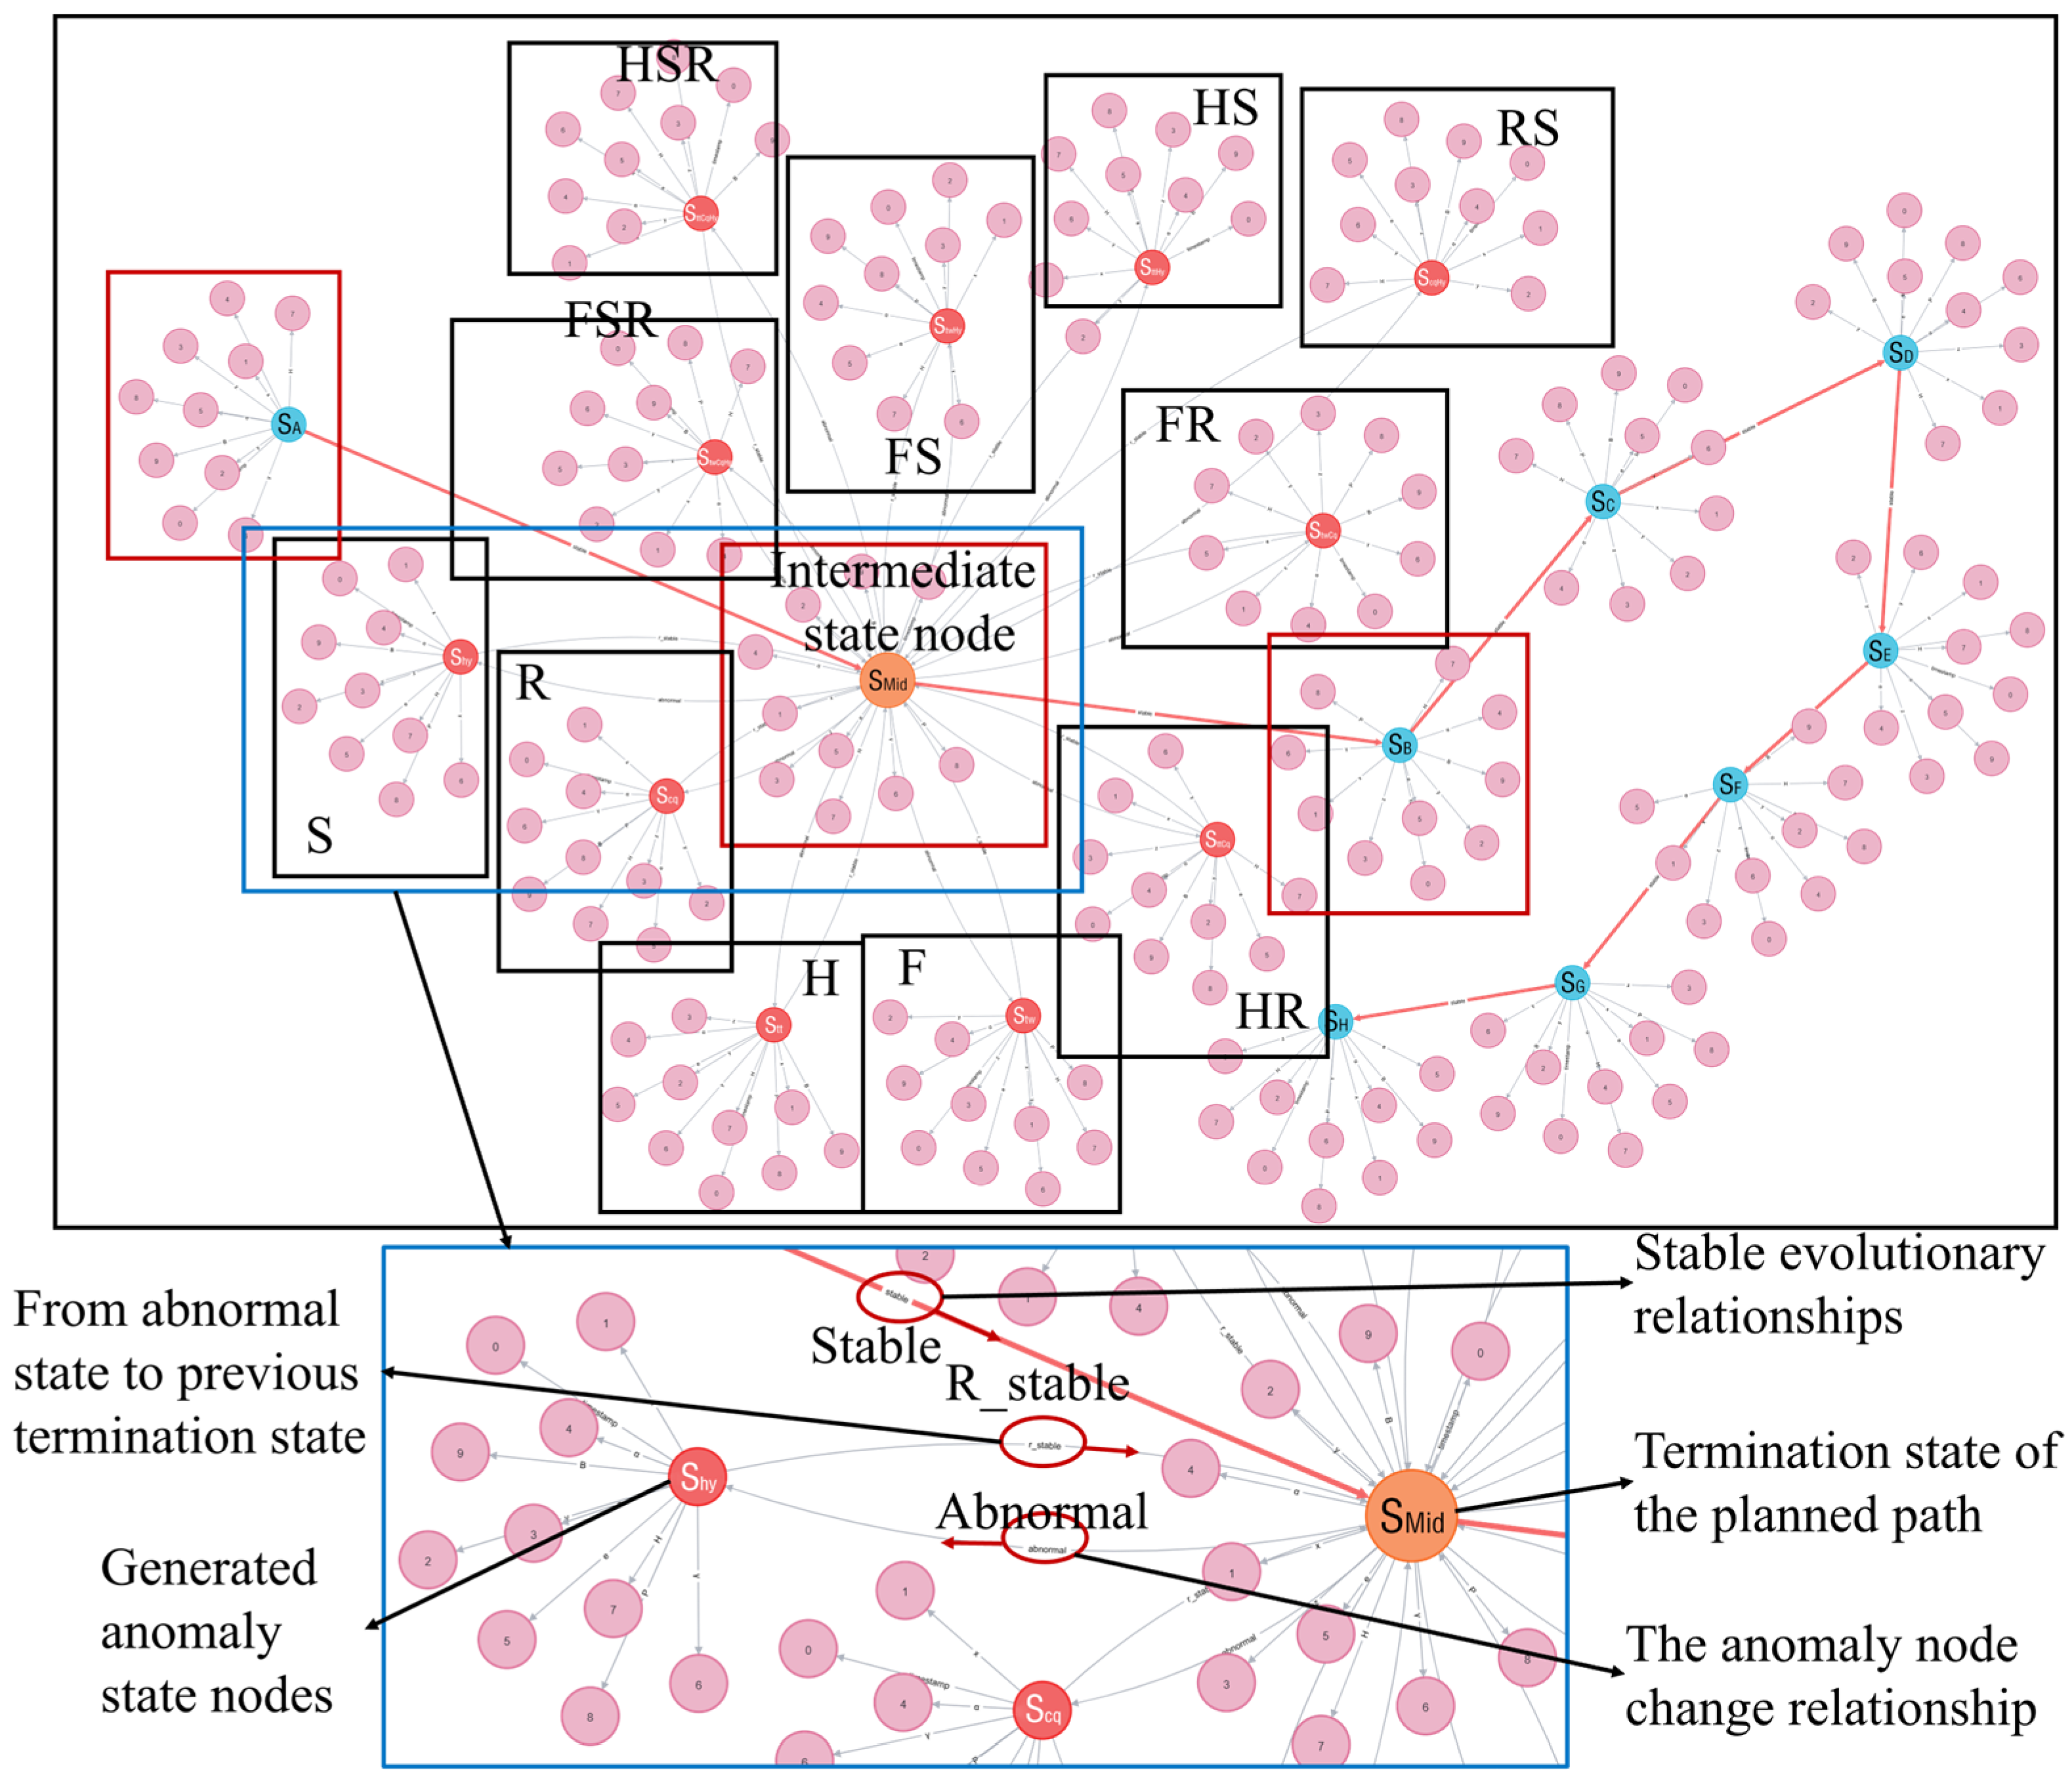
Determining the class of disturbance events is crucial to change the virtual–physical alignment strategy. The state evolution graph contains various event trees, as shown in
Figure 10. Based on the event tree structure after the current state change, according to the categorized hierarchical storage model, starting from the type of stage at which the event occurs, one by one, a downward comparison with the event trees already existing in the network is filtered. If the same event tree exists in the formed state evolution graph, the strategy to correct the current perturbation is determined based on the historical processing scheme of the corresponding event. If the search and comparison results show that it does not exist, a new strategy needs to be formulated based on the current specific situation, and the new event tree is bound to the current processing strategy and stored into the existing state evolution graph.
2.3.2. Real-Time Data-Driven
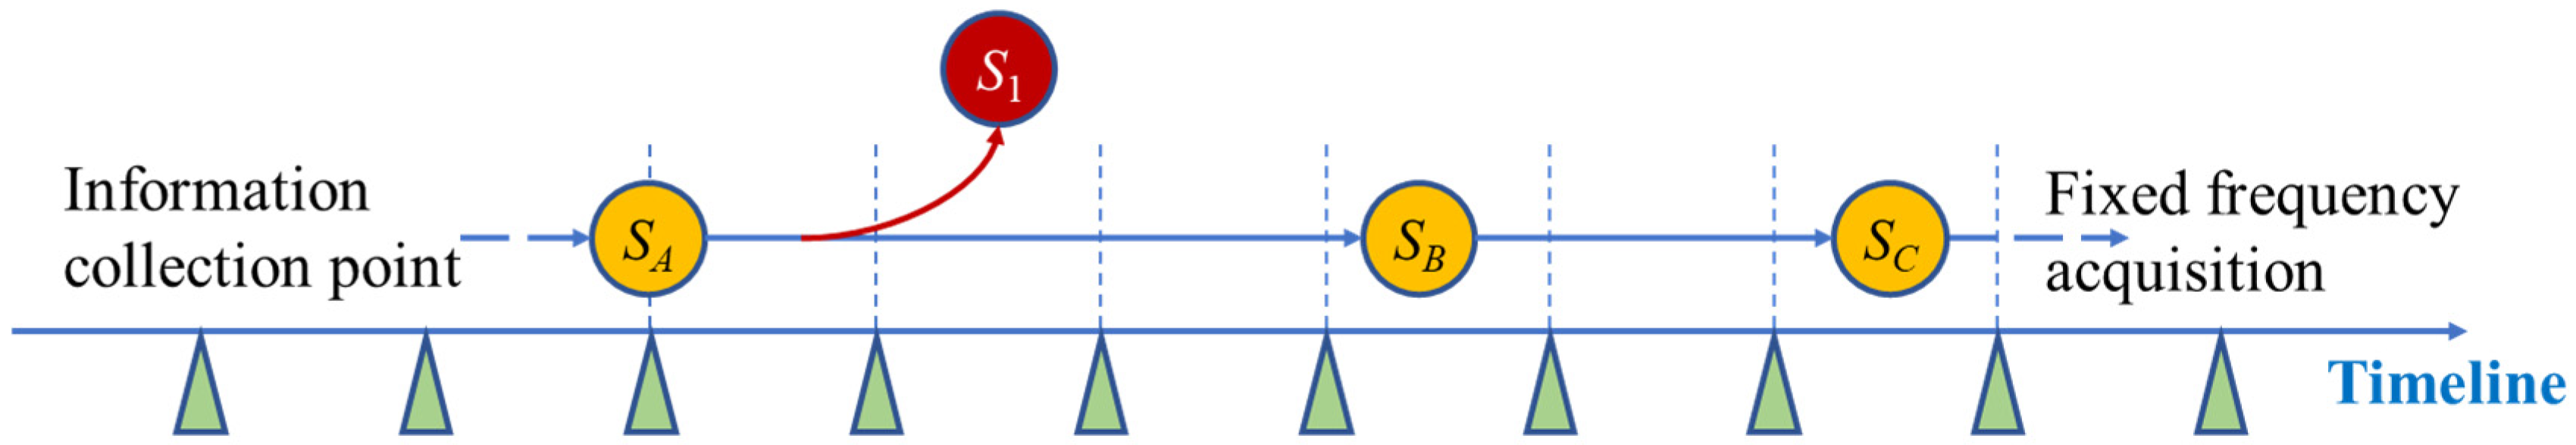
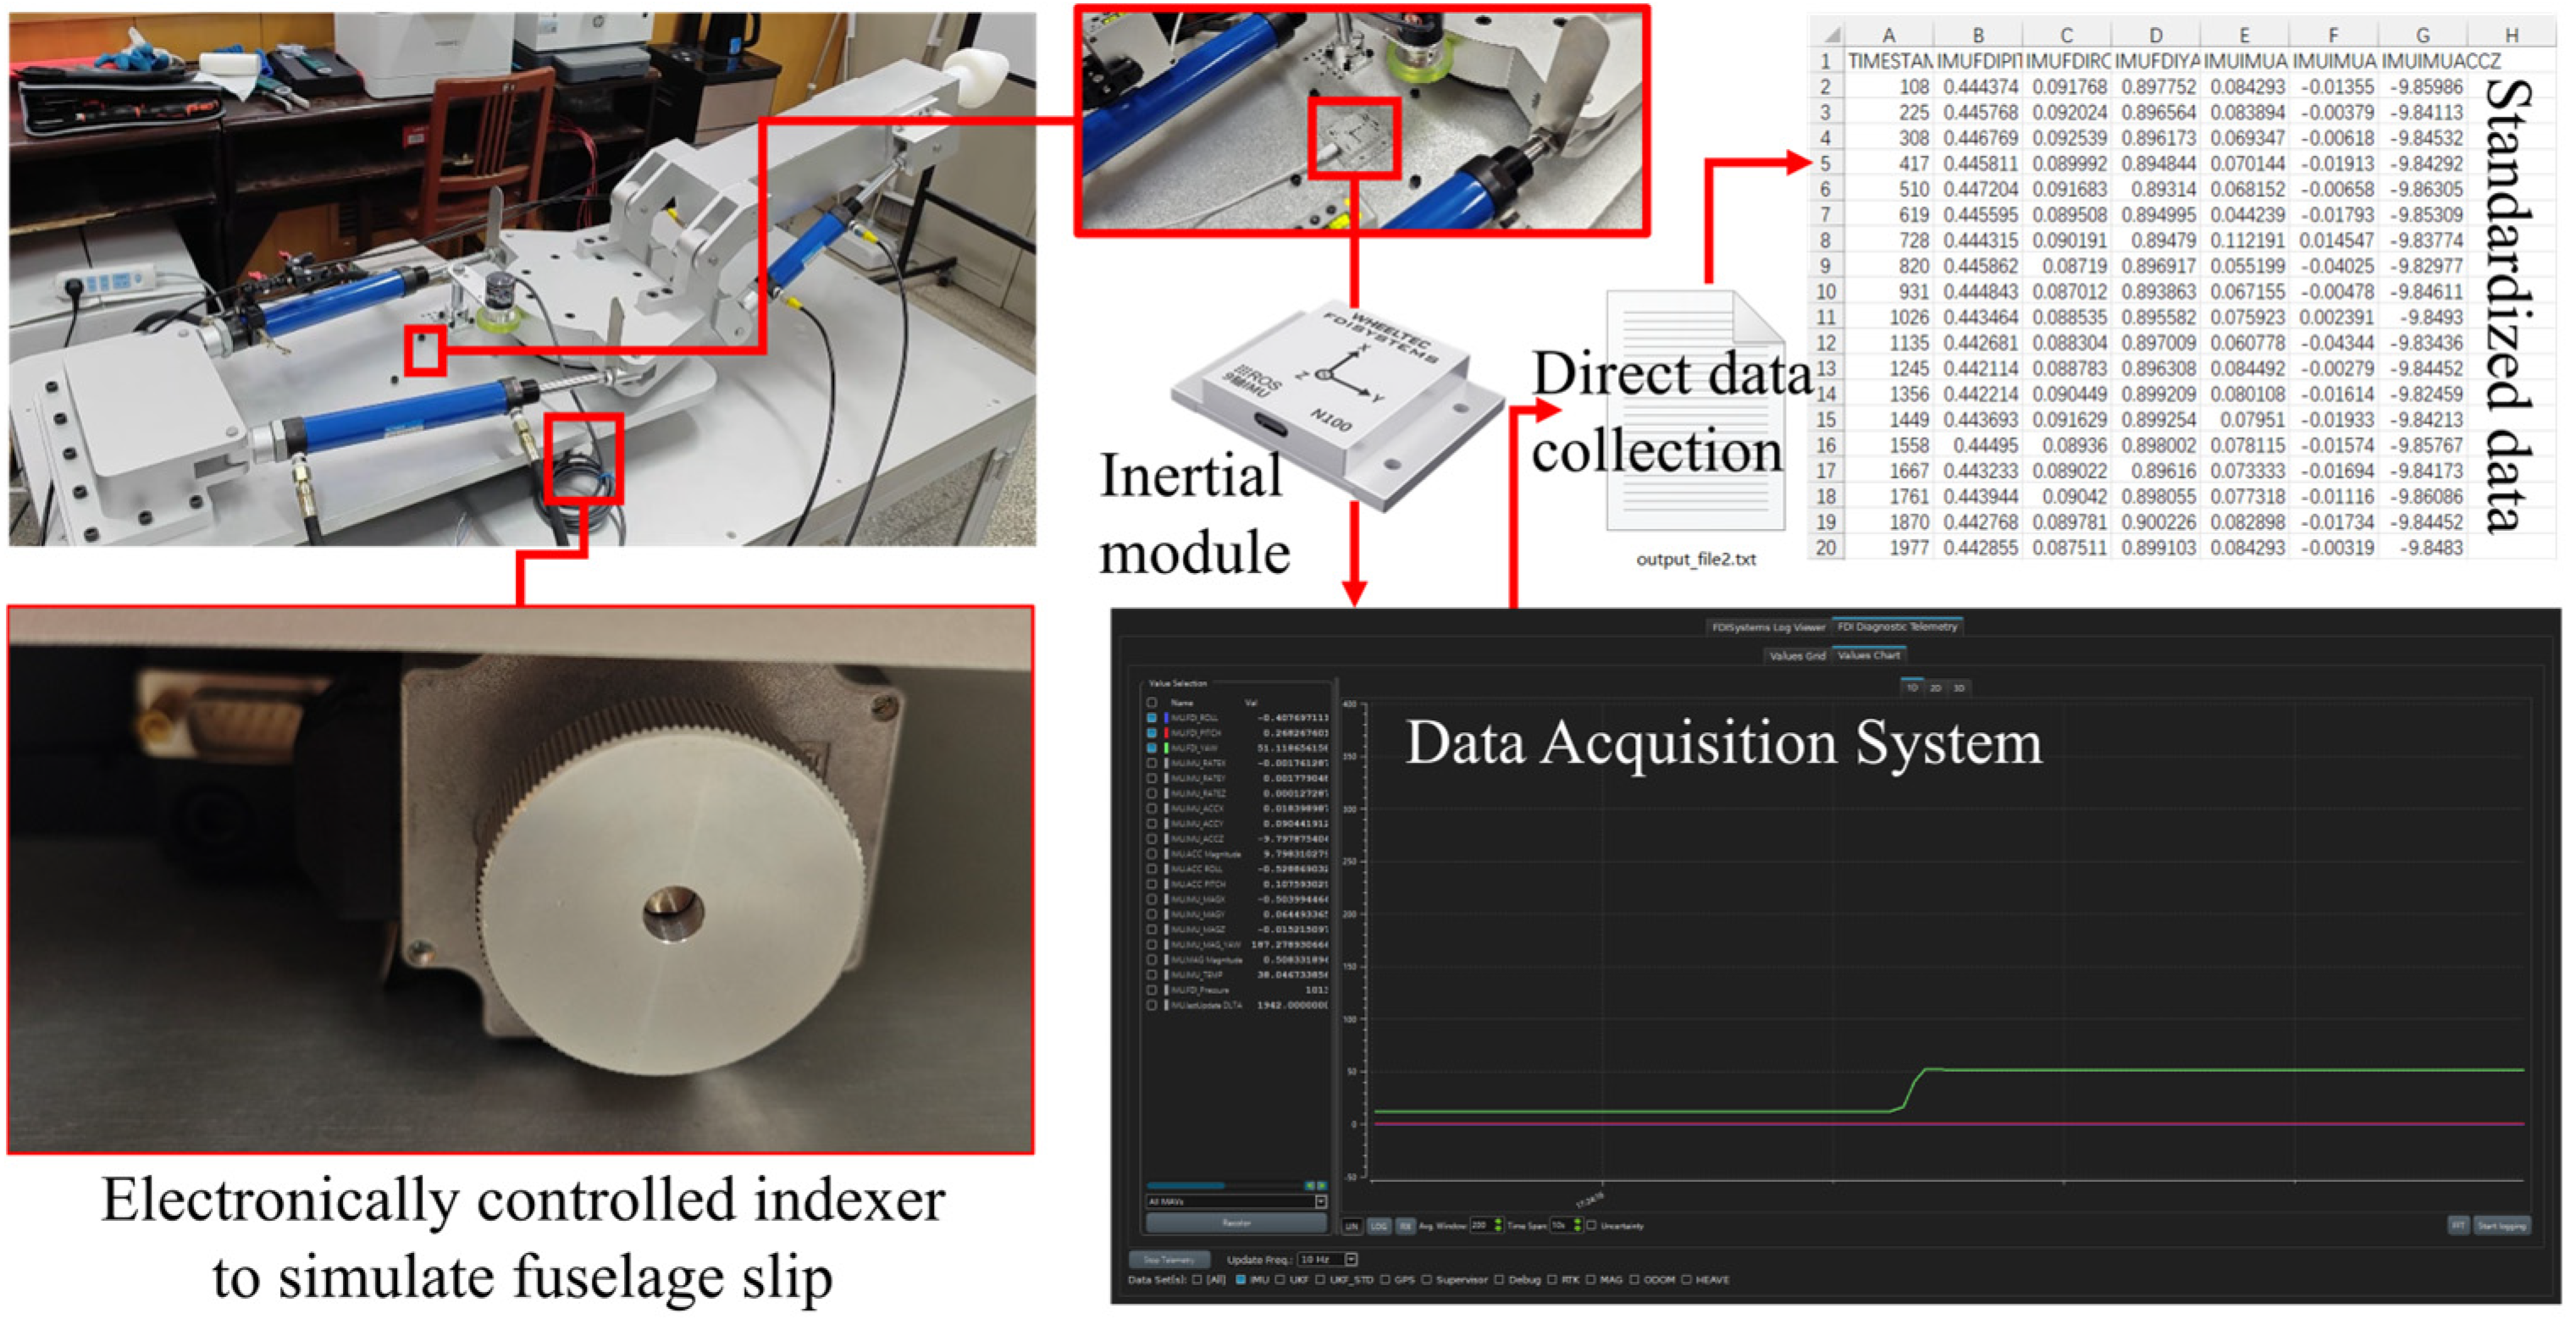
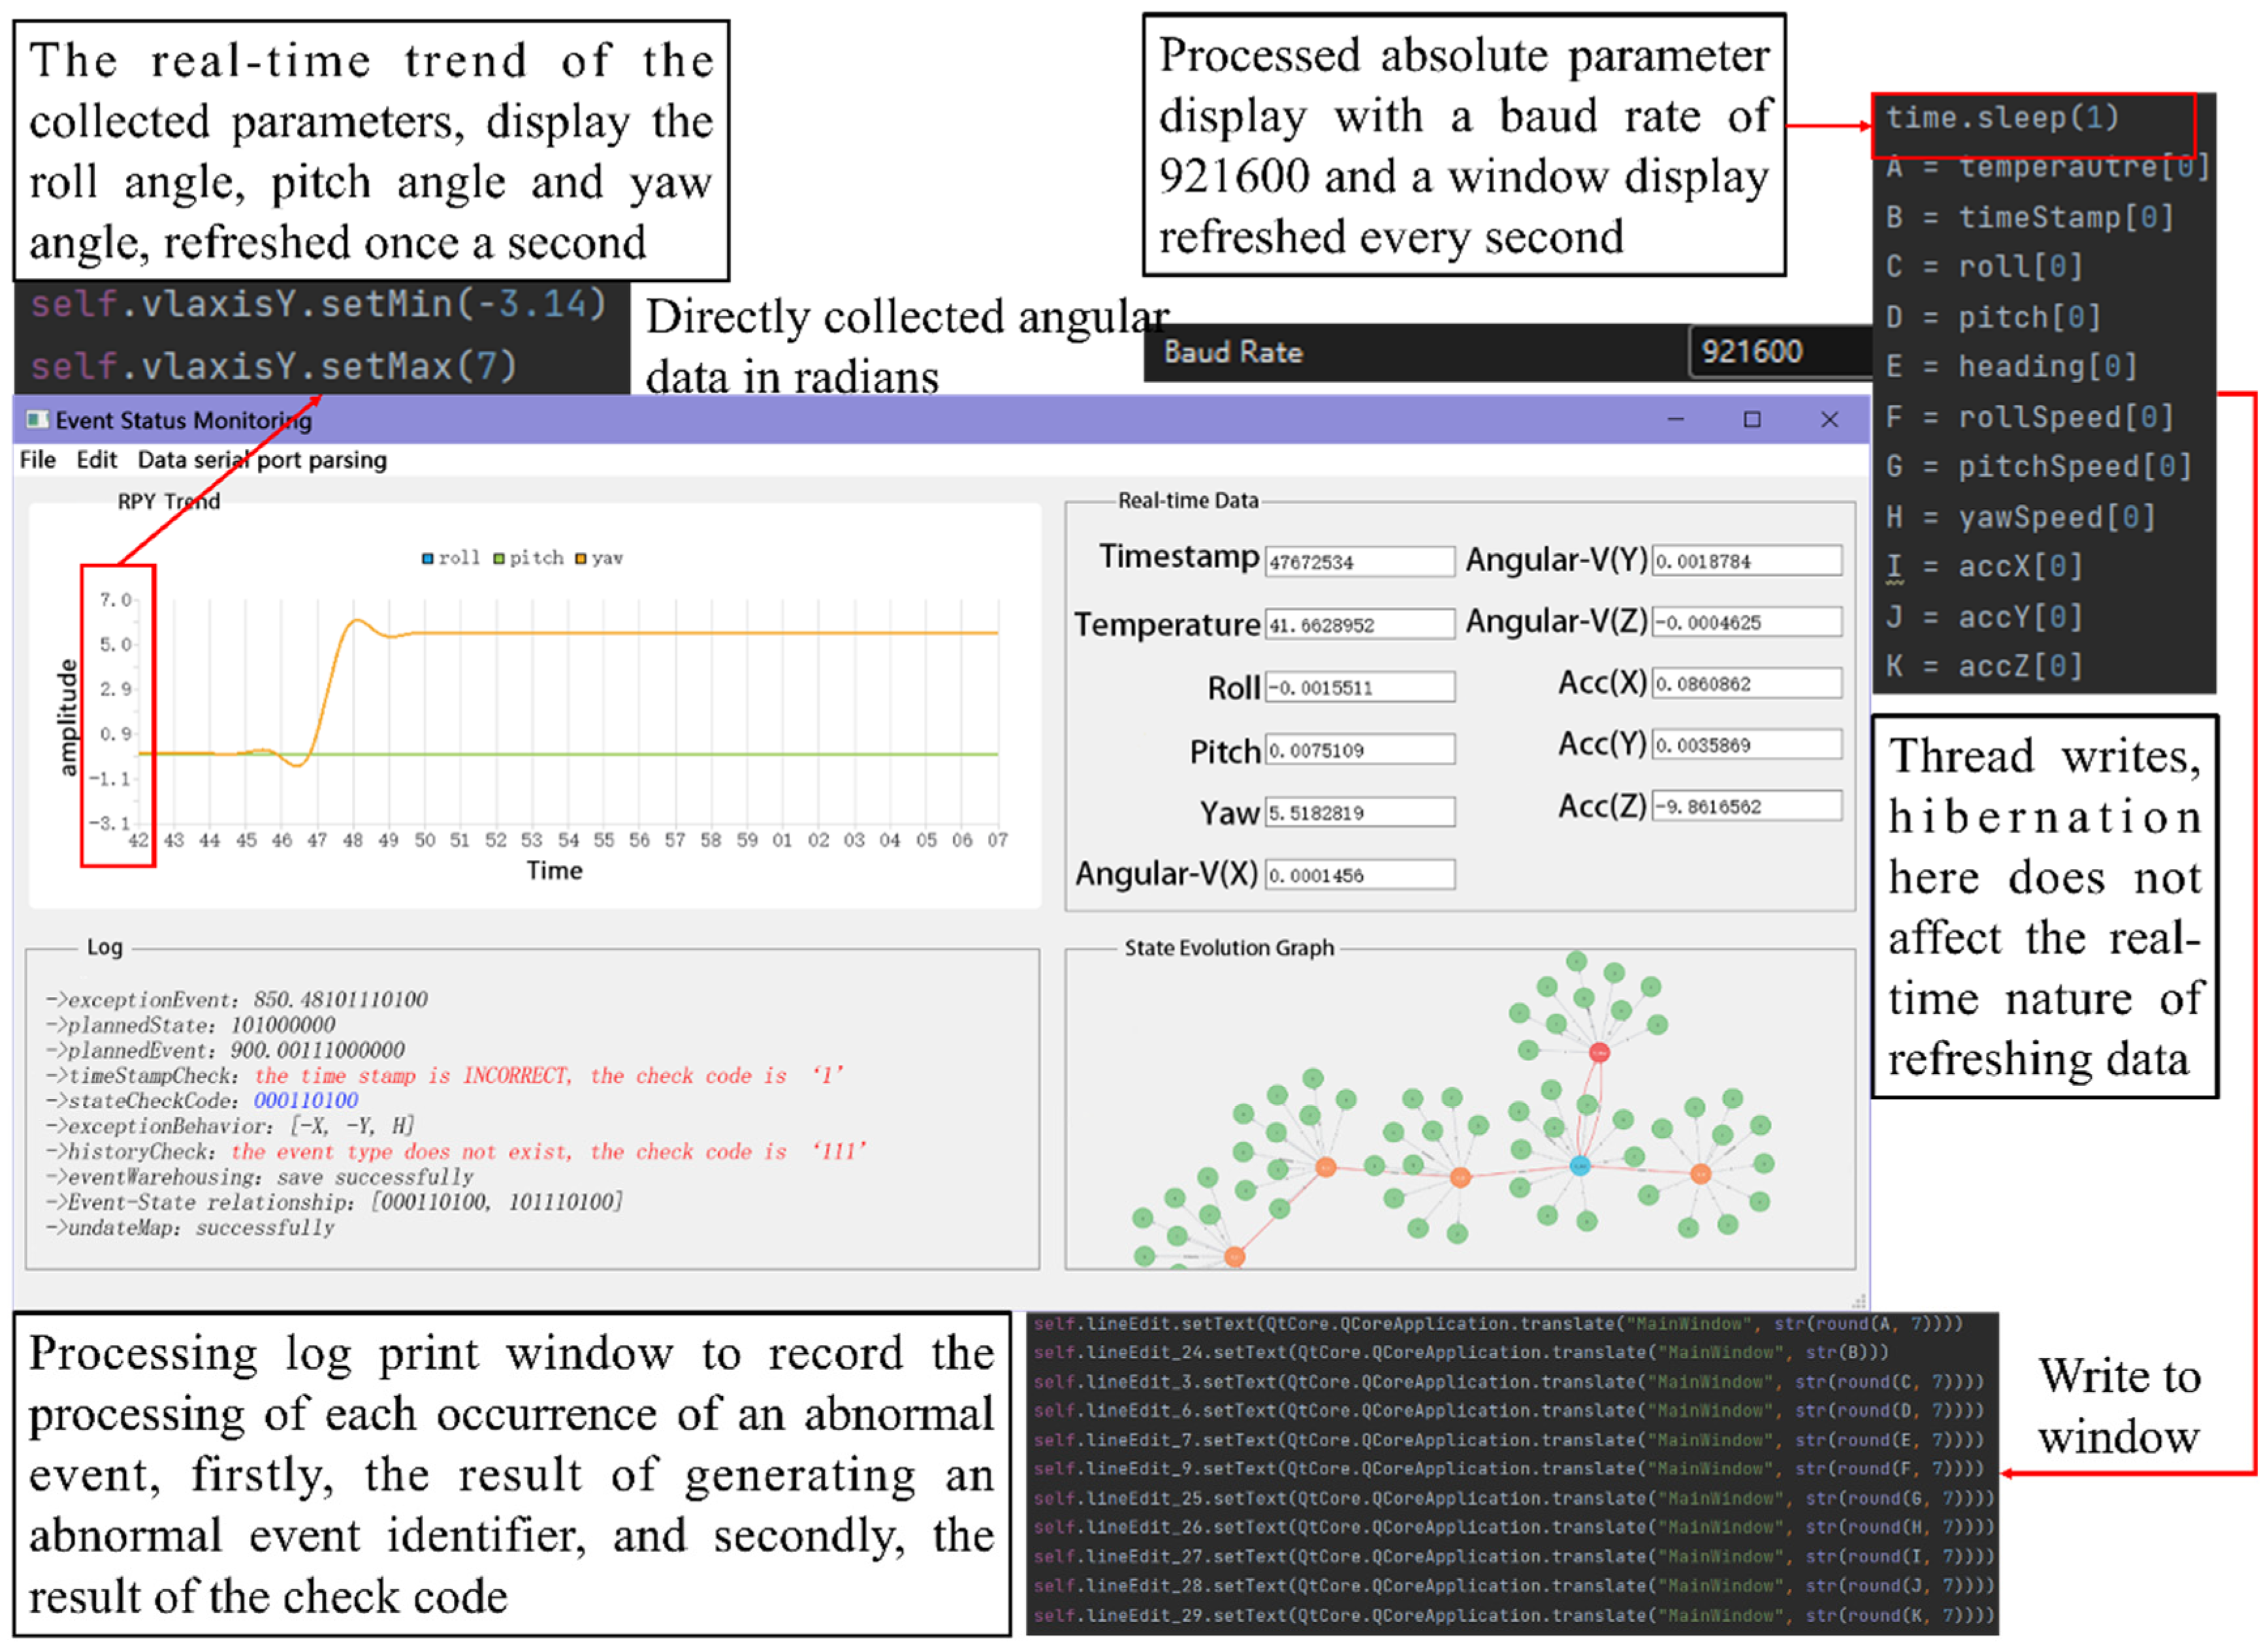
First, data are collected at a fixed frequency to monitor changes in the equipment position parameters. The key parameters of the roadheader, such as the position, attitude, and velocity, can be accurately tracked mainly by periodically collecting them. A schematic diagram of real-time data acquisition is shown in
Figure 11. The data acquisition system operates at a preset fixed frequency, e.g., once per second or multiple times per second, depending on the operating characteristics of the equipment and the required monitoring accuracy. Each time data are collected, they are instantly processed and analyzed to determine if the equipment is in a normal operating condition. If an abnormal change in a monitored parameter is detected, the system immediately triggers a subsequent processing program. This process is automated, ensuring a rapid response to abnormal conditions.
Abnormality detection relies on parameter threshold monitoring. As soon as a parameter falls outside of these preset ranges, the system recognizes the abnormality and initiates the appropriate processing. This involves not only automatically adjusting the equipment settings or performing operations such as emergency shutdown, but also issuing alarms to notify the operators to prevent potential equipment damage or production accidents.
In addition, the mechanism can record the exact time the disturbance occurred and the stage of operation the equipment was in. This is critical for subsequent troubleshooting and system optimization, as it provides a detailed timeline and contextual information to help engineers analyze why the anomaly occurred and take targeted measures for improvement.
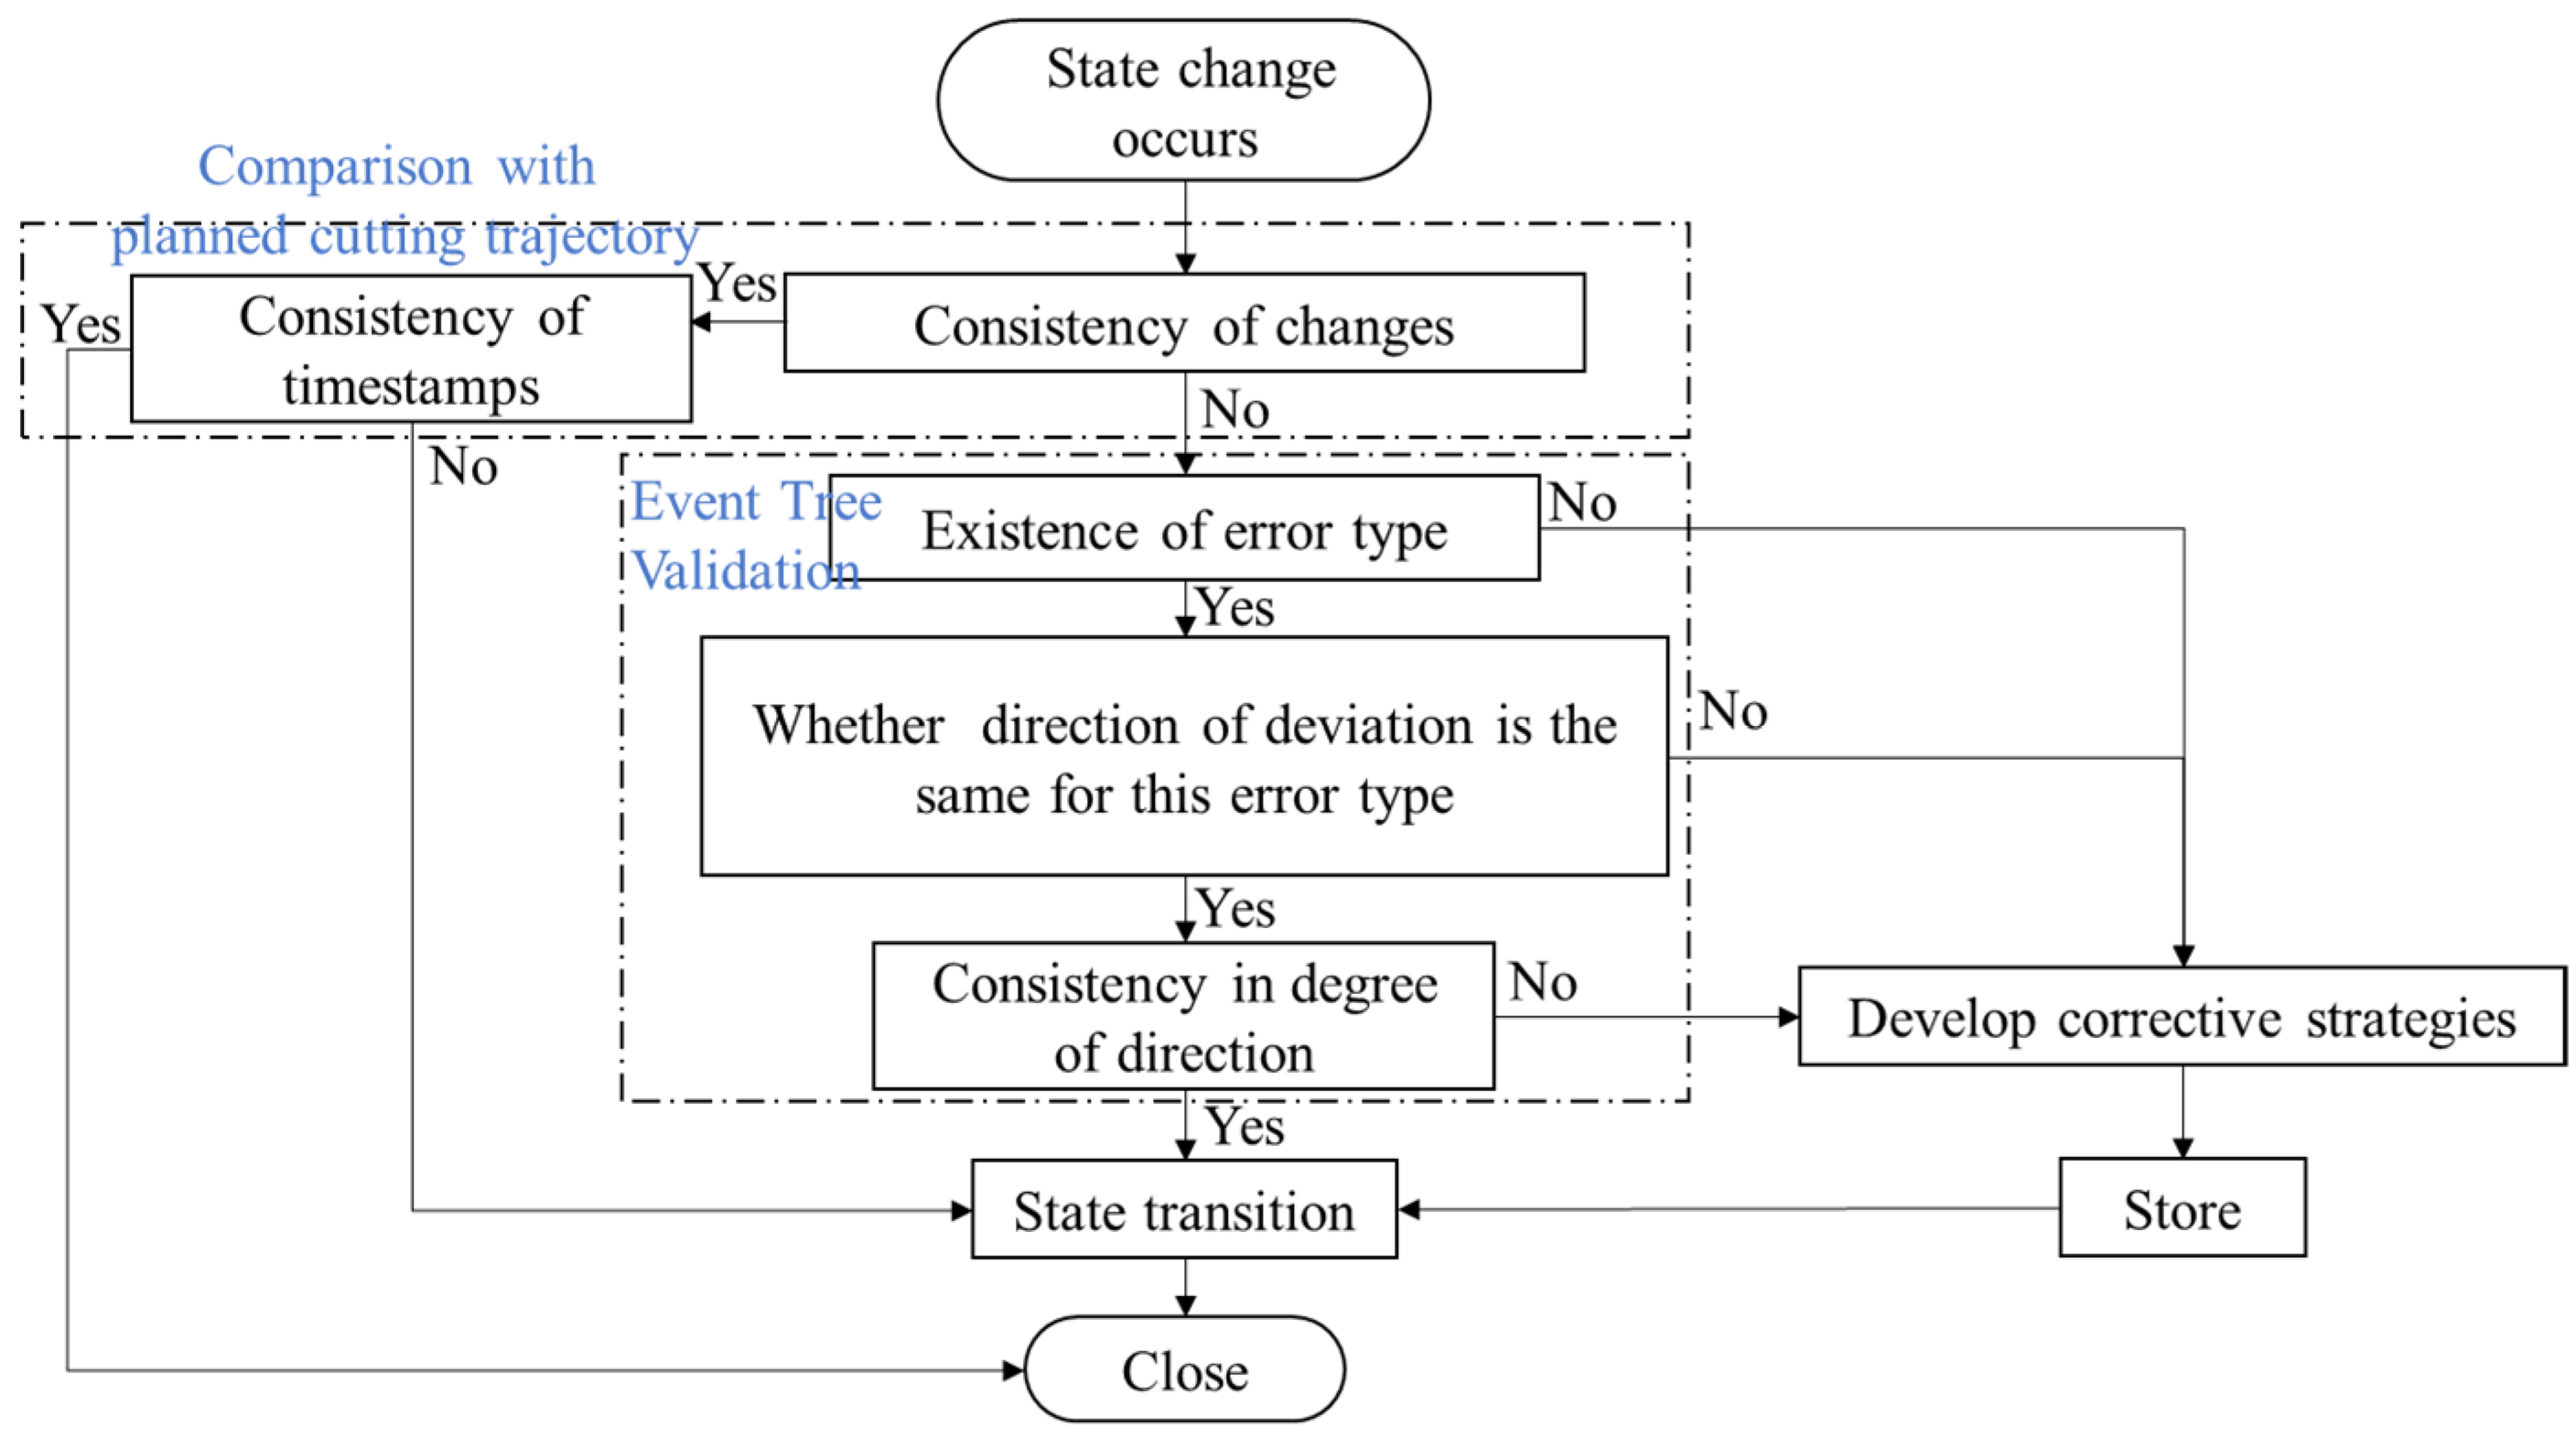
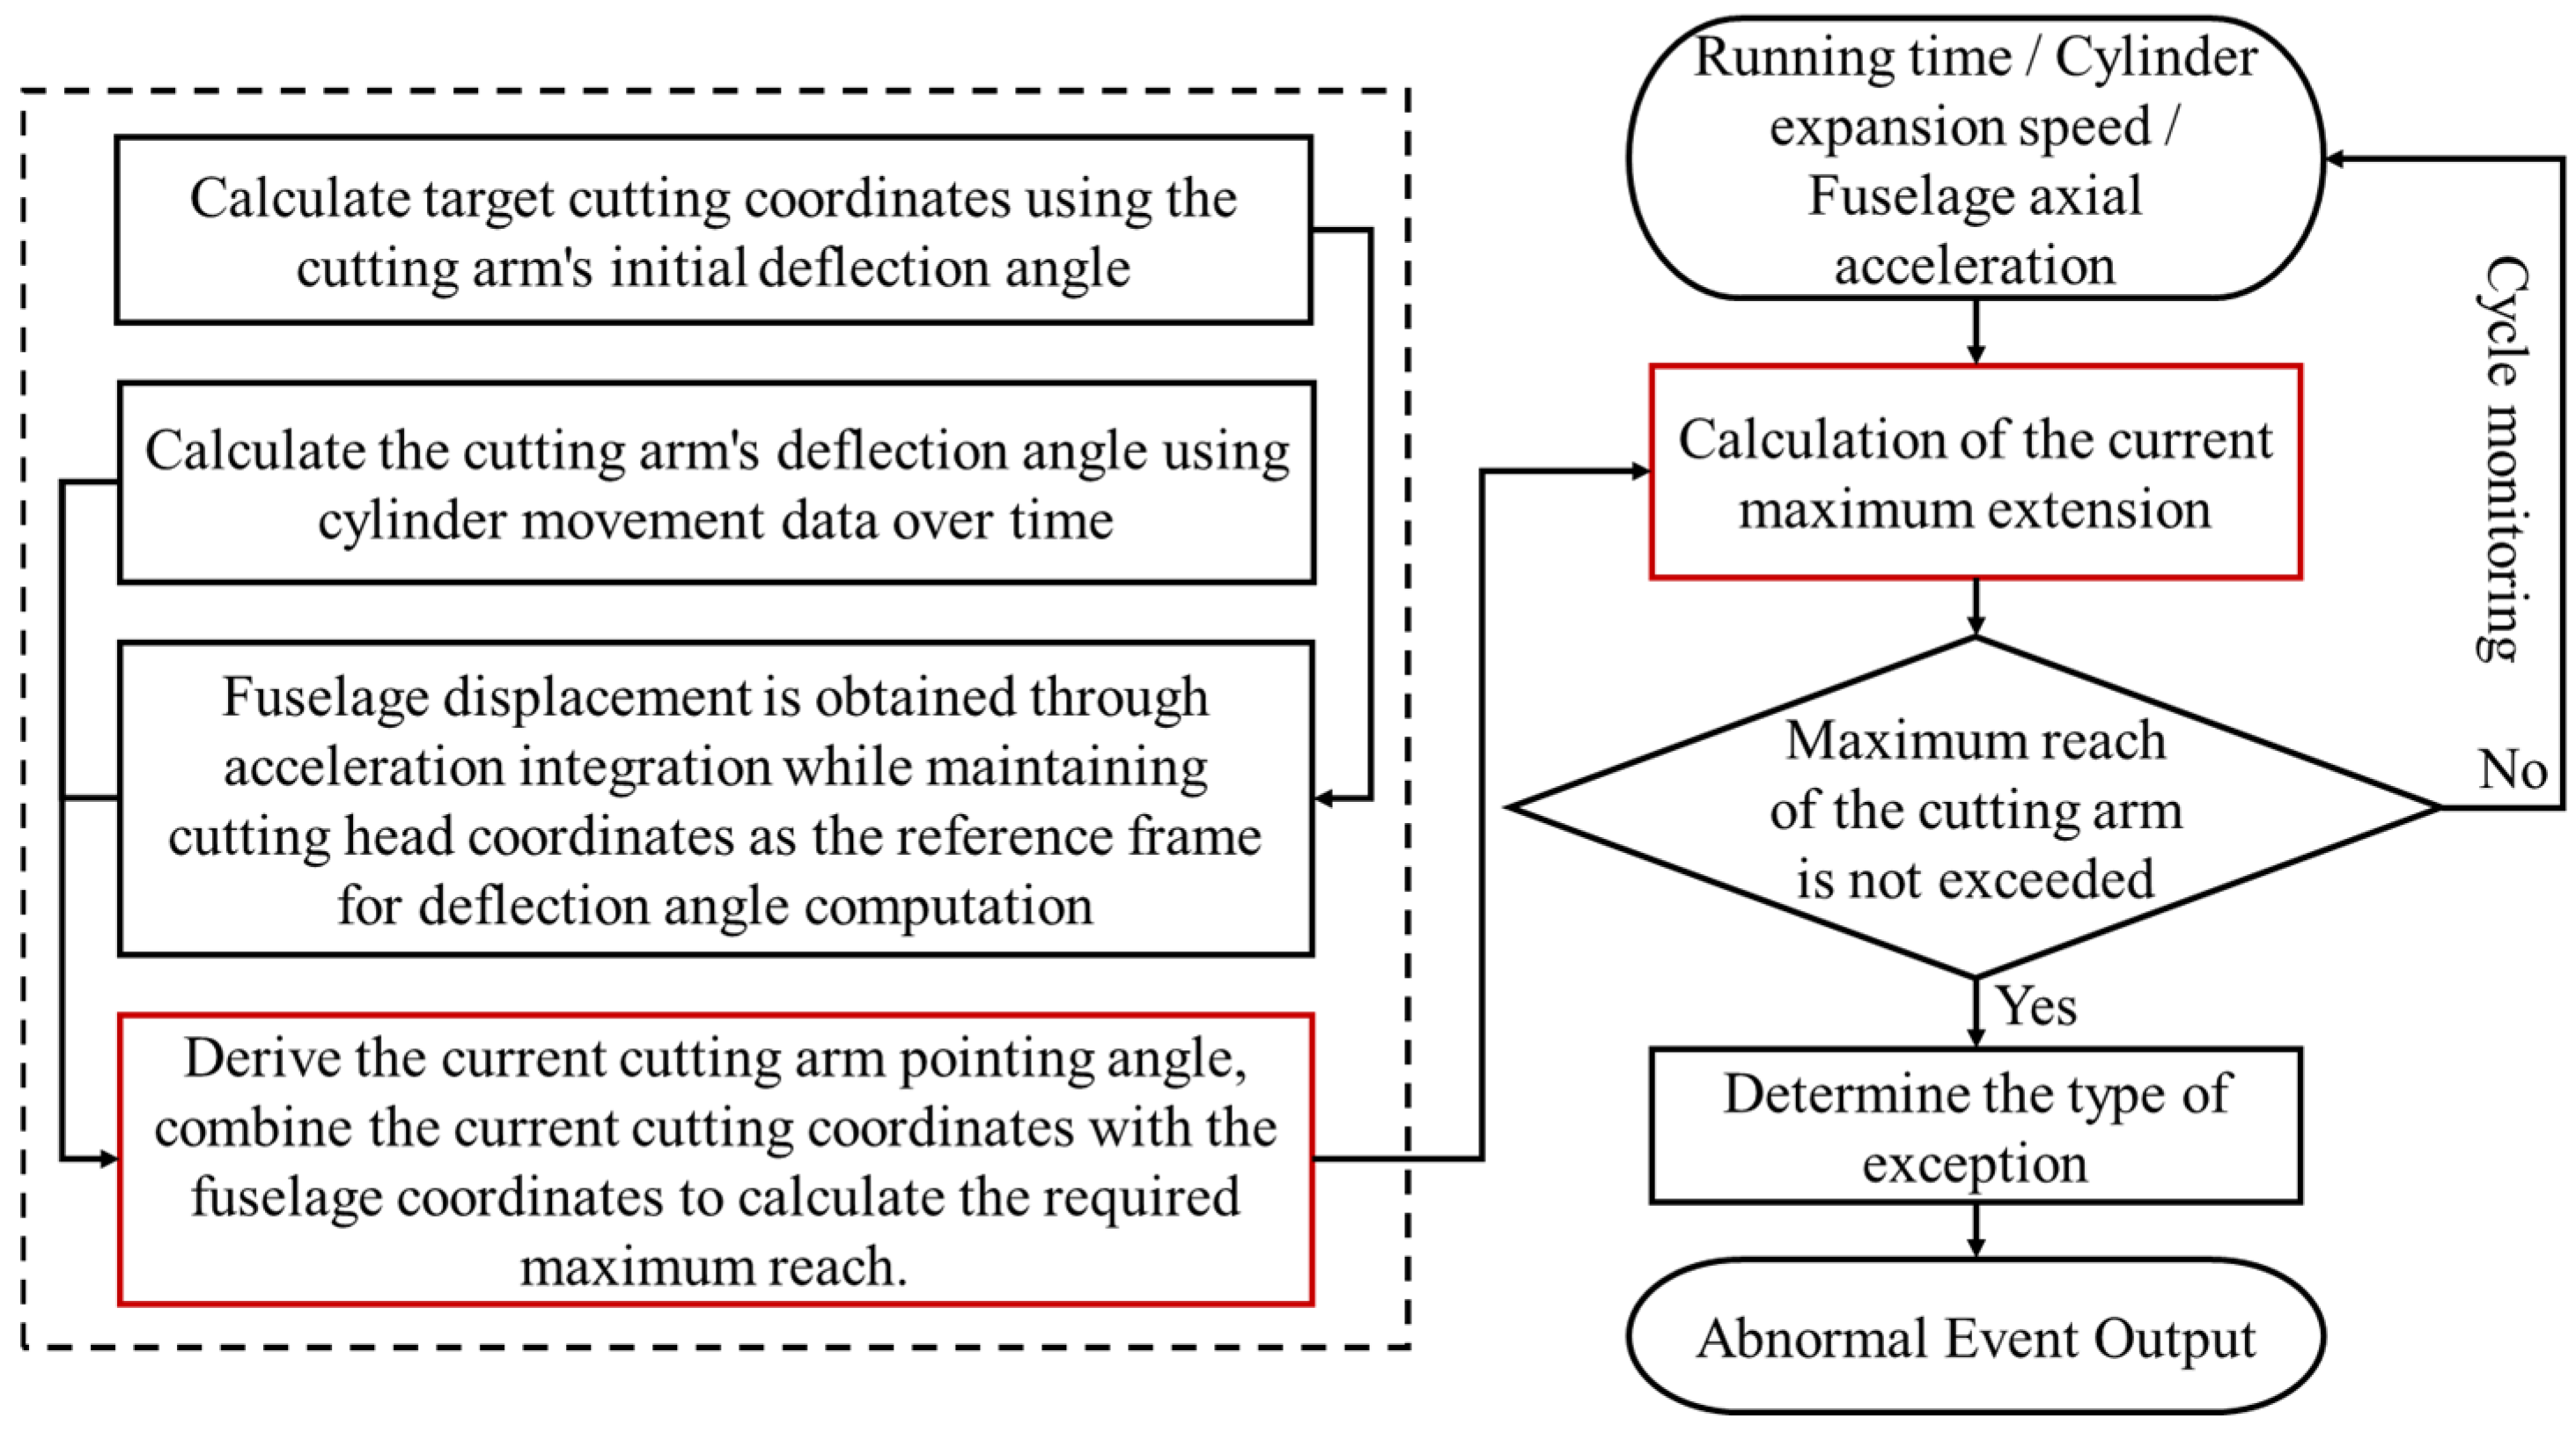
Real-time data will be used as a guarantee of the timeliness of the event triggering of the model, and the specific flow logic of the event triggering is shown in
Figure 12, which sequentially connects the modules in series according to the flow direction of the perturbation event information, and the fuselage slipping event is used as an example to illustrate the operation mechanism of the state evolution dynamics model.
When fuselage slip occurs, the coordinate positions (X, Y) as well as the orientation (α) of the fuselage undergo different degrees of change. At time point , by monitoring the acceleration changes in X, Y, and α, the event state model can recognize the cutting state transition. By performing the XOR operation on the actual state parameters and the planned state parameters, a result of 000110100 is obtained. Based on this result, the type of perturbation of the current event can be identified and compared with the historical event database to determine if the event type has been recorded. If the event matching result indicates that the type is known, the corresponding historical processing scheme is immediately activated. Conversely, if the matching result indicates that the current event type is unprecedented, a new state node is created in the state evolution dynamics model and the state is associated with the event type, the event state vector is constructed, and the event is recorded according to the storage rules of the event library.
Emerging state nodes, triggered by unknown events, generate branches in the original state evolution graph. Depending on the details of the state offsets and the criteria of the job plan, a trajectory needs to be planned to guide the current abnormal state back to the normal state before the next scheduled job change node. Based on the results of the path planning, a control strategy for the state change can be developed and implemented.
Regardless of whether the event is known or not, the quality of the synchronization of the virtual cutting scene with the physical cutting scene needs to be ensured by the state transition mechanism during the execution of the state correction policy. The virtual and physical cutting operation will execute the control strategy simultaneously, and the physical cutting scene will continuously feedback the changed state to the virtual control platform. The virtual cutting model performs over-the-top state evolution based on the feedback information and control strategy to reduce the lag of the virtual–physical information transfer.
When the physical state evolves according to the control command to the moment corresponding to the predicted state, the virtual-reality consistency evaluation will be performed. The evaluation first checks the state similarity; if it does not meet the alignment criteria, the control strategy is adjusted according to the state deviation. If the similarity meets the criteria, the consistency of the control strategy is checked. If both the state and the control strategy are consistent at this moment, it indicates that the information transmission delay problem has been solved and the virtual–physical synchronization has been achieved, and no further loop feedback and strategy adjustment is required. Virtual and physical tunneling will synchronize to adjust the cutting state to within the planned range according to the latest control strategy, and the state evolution graph records this change path to form a closed loop. After the disturbance event is processed, the new state evolution path will be used as a reference for future processing. As the process is triggered multiple times, the disturbance event types will be more comprehensive, the state evolution graph will be more complete, and the efficiency and reliability of the state evolution dynamics model will be improved.
2.3.3. State Transition Mechanism
After the abnormal state is recognized, a state transition mechanism is employed to ensure that the transition to the normal operating state is both rapid and smooth. To ensure the accuracy of the information feedback from the remote control system, the state transition involves the synchronization of the physical and virtual control environment. This synchronized processing improves the accuracy and reliability of the transition process, enabling an efficient transition from abnormal to normal conditions. By keeping the data of the two environments synchronized in real time, the time delay of information transmission is minimized, which enhances the ability to instantly control the operation status.
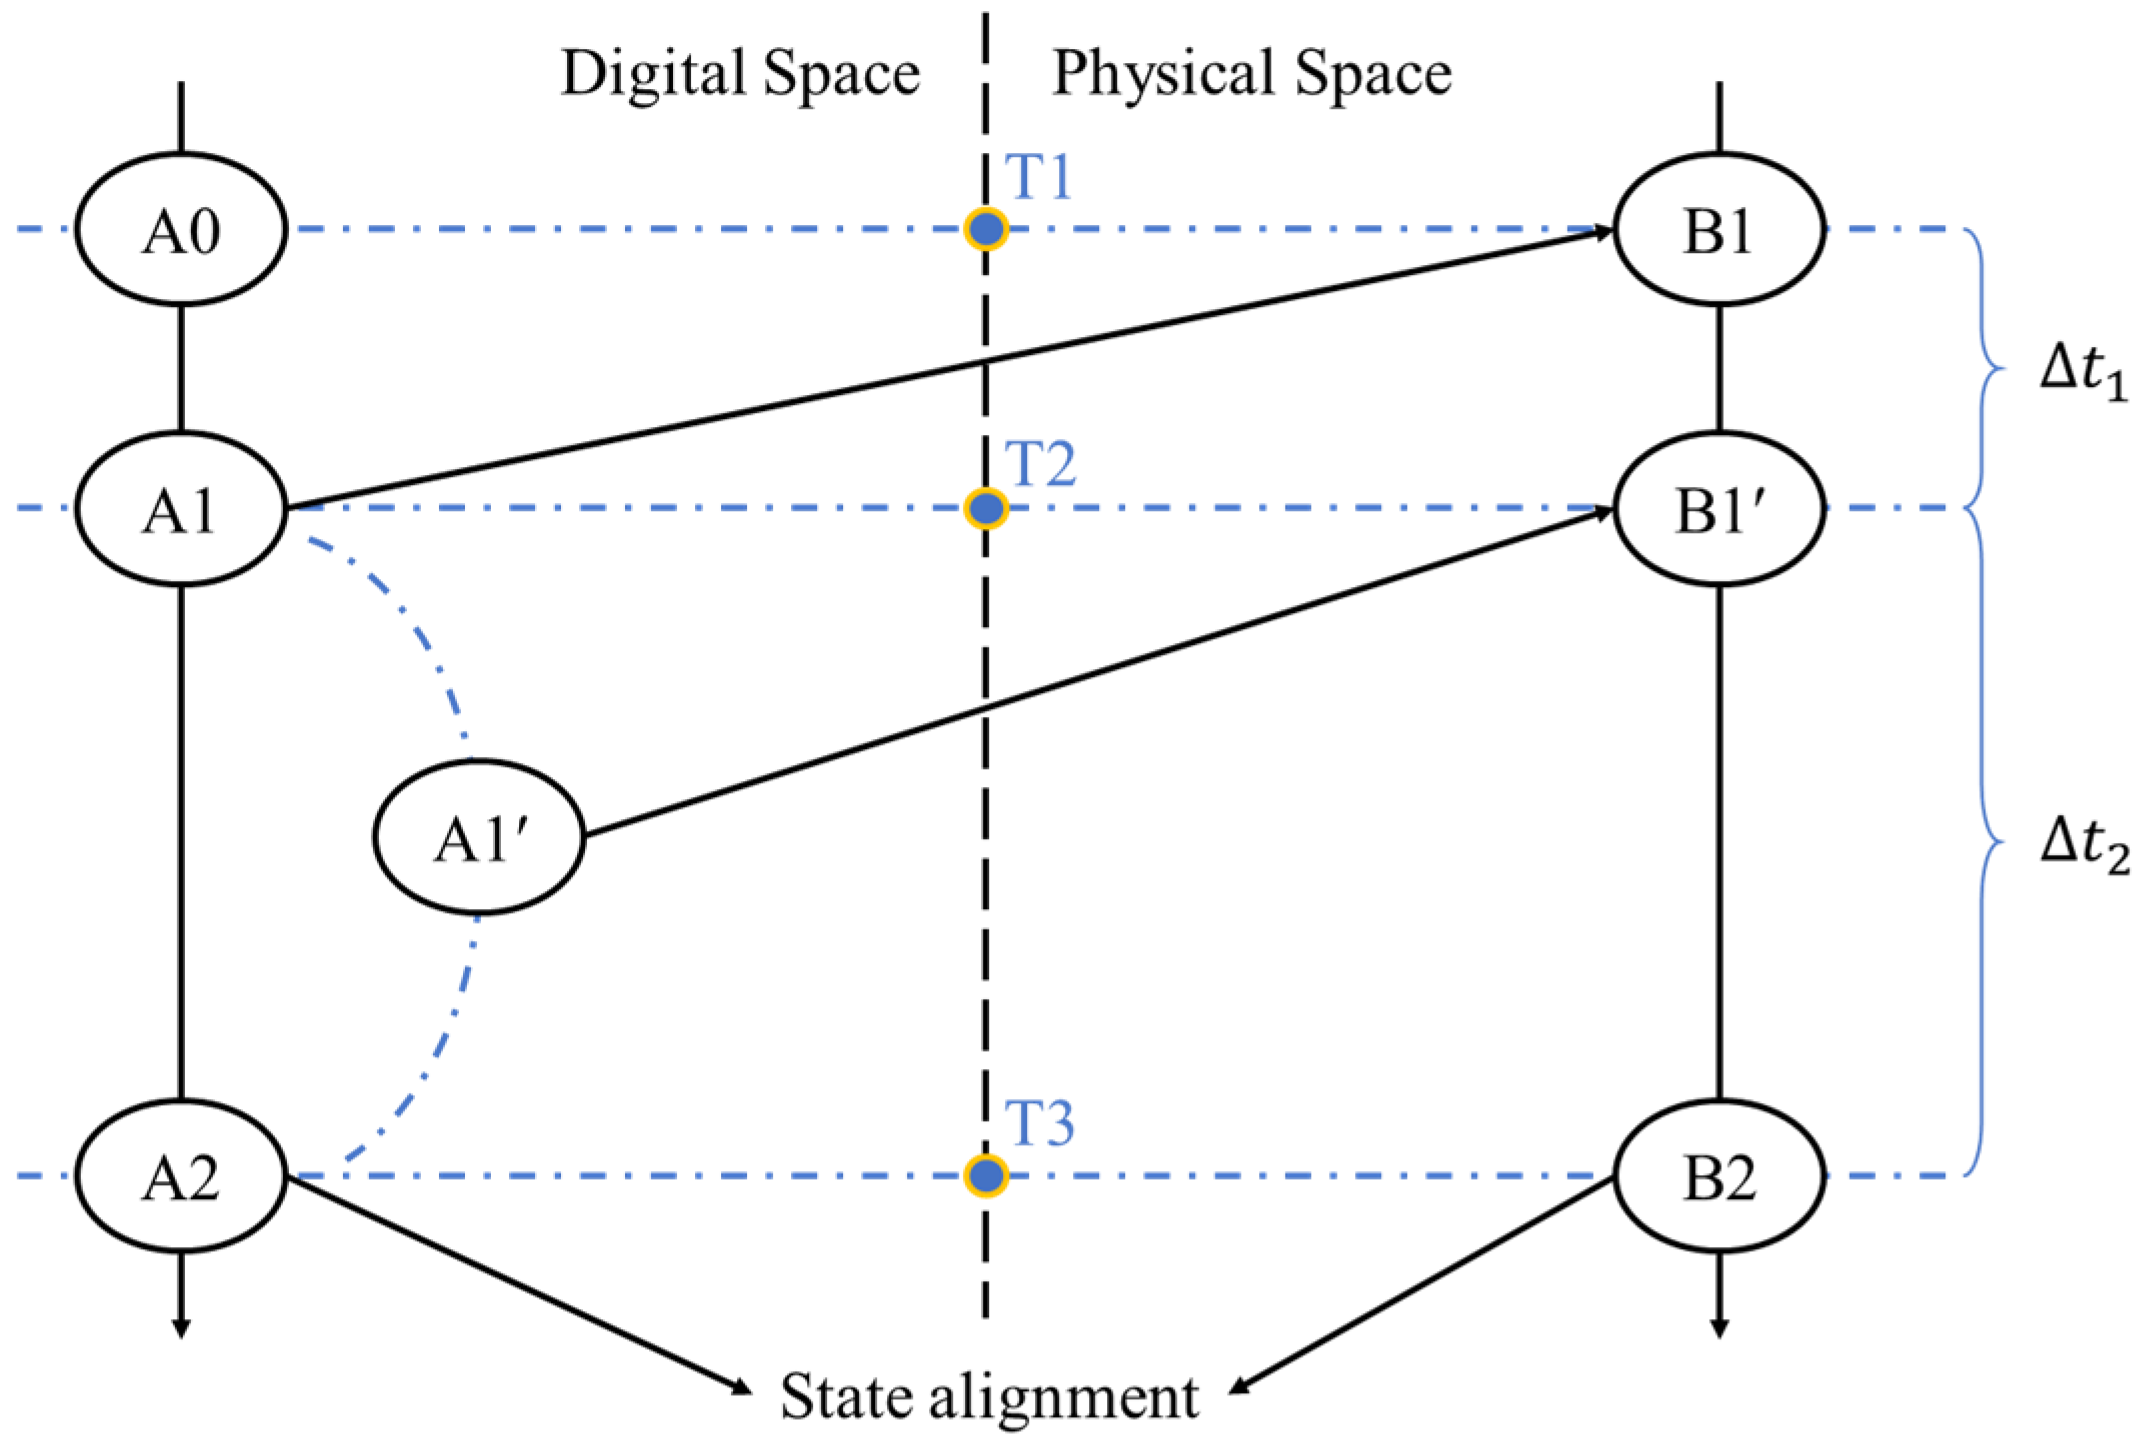
The leap process involves synchronization work in both spatial and temporal dimensions, including threshold synchronization and periodic synchronization. As shown in
Figure 13, at timestamp T1, the physical spatial model executes a control instruction that is scheduled to perform a state change at the same time as the digital twin. However, the moment when the digital spatial model executes this instruction is not synchronized with the physical model due to the inherent time delay. The digital model completes the state change to A1 at timestamp T2, corresponding to the state B1 of the physical model at timestamp T1. At this point, the digital space side is already behind
compared to the time when the instruction was executed in the physical space, and the state of the physical model has transitioned to an intermediate state B1′.
In order to optimize the digital twin hysteresis problem caused by the inherent time delay, the digital model will predict the future state evolution of the physical model when the state change is performed at timestamp T2. The predicted state of the physical model will be changed to B2 at timestamp T3, and the digital model will take the predicted B2 as the goal of the state change, and take timestamp T3 as the endpoint of the change to carry out the state leap of the digital twin model. At this time, the digital model will no longer follow the state evolution route of the physical model via the intermediate state B1′, and the state of the object on one side of the digital space will be changed directly from A1 to A2 via .
After completing the leap, the bilateral spatial model state will reach a real sense of spatiotemporal synchronization at timestamp T3. By predicting and adjusting the state change target and time of the digital model, the effect of the inherent time delay on the digital twin lag can be effectively reduced, and more accurate spatiotemporal synchronization can be achieved.
Threshold synchronization, based on the state transition principle, identifies the critical state B1′ achieved at timestamp T2 when lateral slippage occurs during physical tunneling. Upon exceeding preset thresholds, cutting arm adjustments alone become insufficient to meet the operational requirements, triggering classification as a new disturbance event. This event state mapping relationship is archived in the database and integrated into the state evolution graph. The physical operation must adjust the body parameters to return to the normal operation state. The state evolution path of the digital twin may deviate from the physical tunneling because the operation state experiencing the sudden perturbation is not in the planned trajectory. To ensure the synchronization between the virtual and physical state after a disturbance event, the corrective control commands of the physical tunneling operation need to be combined with the auxiliary guidance of the digital twin. Based on the current physical operation state, the digital twin predicts the future operation state of the physical machine based on the corrective control instructions to carry out the super-evolutionary state evolution, adjusts the corrective control instructions appropriately according to the degree of compliance of the evolution results, and carries out the super-evolutionary state evolution again. Through multiple cyclic leaps, the physical cutting operation is finally brought back on track, realizing the temporal and spatial alignment of the bilateral space operation at timestamp T3.
Periodic synchronization, on the other hand, refers to conducting a virtual–physical consistency evaluation when initiating each intercept, whenever an operation instruction is issued, thereby enhancing the synchronization reliability. By performing this evaluation at the cycle start, potential deviations are detectable and correctable, ensuring virtual–physical consistency. This method improves the cutting operation accuracy and stability while mitigating disturbance-induced deviation risks.
4. Results Analysis
In this study, the monitoring, receiving, and processing of the fuselage position parameters, the operation of the abnormal event recognition algorithm and the abnormal event type recognition algorithm, and the dynamic update of the tunneling state evolution network are accomplished from the simulation of abnormal fuselage disturbance events and the recognition and processing of abnormal events. The results of this case validate the feasibility of the state evolution dynamics model proposed in this paper, but there are also many limitations.
The shortcoming is that the model’s current scope of application is mainly limited to the digging operation within a single section, and the adaptability and long-term stability of the model for the long-cycle operation of multiple sections still need to be further researched and verified. Future research will be devoted to expanding the applicability of the model, especially in complex and variable long-cycle tunneling operations, by improving the adaptive conditions of the model and optimizing the operation modes, so as to enhance the stability and robustness of the model. This will bring more innovation and value to the field of remote intelligent tunneling and promote the development of tunneling technology to a higher level.
4.1. Reflection on Limitations
(1) Strong single-intercept scenario dependence: the model performs well in single-intercept operations, but the state evolution graph complexity grows exponentially in long-period multiple-intercept scenarios, leading to an increase in computational resource consumption and a decrease in real-time performance.
(2) Insufficient algorithm robustness: the classification accuracy of the anomaly identification algorithm for composite perturbations is low and needs to be combined with machine learning to optimize the feature extraction logic.
(3) Simplified experimental scenarios: the current experiments only simulate a single model and a fixed roadway heading section, and do not cover the full cross-section roadheader or complex geological conditions.
4.2. Improvement Direction
(1) Introducing a lightweight model: adopting federated learning or edge computing technology to distribute the state evolution network to multiple computing nodes to reduce the computational load of the multi-section scenario.
(2) Fusion of multi-source data: combine geo-radar and inertial navigation data to enhance the prediction ability of disturbance events and reduce the proportion of passive response.
(3) Extended application validation: cooperate with coal mining enterprises to deploy the model in real digging faces to verify its applicability in extreme working conditions, such as gas protrusion and surrounding rock fragmentation.


