Abstract
Corrugated steel plate shear walls (CSPSWs) exhibit excellent energy dissipation capacity and lateral resistance performance due to their unique “accordion structure”, making them a highly promising seismic component in prefabricated buildings. The assembled CSPSWs utilize bolted connections on both sides, which align with the energy-saving and emission-reduction trends of prefabricated construction. Compared to traditional welded connections, this method reduces the impact on frame columns during seismic deformation and allows for easier post-damage replacement. Through experimental and finite element analysis, this study systematically investigates the lateral mechanical behavior of assembled CSPSWs and compares them with flat steel plate shear walls (FSPSWs), revealing the stress mechanisms and failure modes of corrugated structures. Additionally, parametric analysis quantifies the influence of plate thickness, width/height ratio, and wave height on structural performance. Experimental results demonstrate that CSPSWs significantly outperform FSPSWs in out-of-plane displacement resistance and energy dissipation efficiency. Parametric analysis indicates that increasing plate thickness and width/height ratio enhances energy dissipation, while increasing wave height negatively affects energy dissipation capacity. This research provides theoretical support for the optimal design and engineering application of assembled corrugated steel plate shear walls.
1. Introduction
Corrugated steel plate shear walls (CSPSWs), as part of steel plate shear wall systems, effectively achieve “energy dissipation damping” due to their unique corrugated structure. Compared to other seismic-energy-dissipating components such as isolation bearings and dampers, CSPSWs offer lower costs while providing essential lateral stiffness to building structures, making their study critical for practical engineering. To align with the energy-efficient and sustainable development of prefabricated buildings, this study adopts bolted connections for assembled CSPSWs. This approach reduces resource consumption and carbon emissions throughout the building lifecycle compared to traditional welding while improving structural disassembly and recyclability.
Berman and Bruneau [1] conducted quasi-static tests on diagonally arranged corrugated infill plates, demonstrating that corrugated steel plates enhance stiffness, ductility, and energy dissipation in shear walls. Botros Rafick Botros Gayed [2] found that CSPSWs exhibit superior energy dissipation compared to flat steel plate shear walls (FSPSWs). Farzampour and Laman [3] numerically compared FSPSWs and CSPSWs, while Vaziri [4] explored the impact of connection methods, aspect ratios, and wave parameters on lateral resistance. Cao [5] emphasized the influence of connection methods on system performance. Zheng et al. [6] compared seismic performance under varying corrugation angles, while Hosseinpour and Kalali [7] evaluated trapezoidal and sinusoidal CSPSWs. Deng et al. [8] and Zhu et al. [9] studied double-corrugated shear walls, and Wang et al. [10] integrated dampers into CSPSWs. Shariati [11] and Bahrebar [12] utilized low-yield-point (LYP) steel to enhance hysteretic behavior. Yu et al. [13] proposed steel-concrete composite CSPSWs, and Yu and Zhu [14] developed lightweight CFRP-corrugated sandwich shear walls.
This study conducts lateral resistance tests on assembled CSPSWs, compares them with FSPSWs, and analyzes the effects of plate thickness, width/height ratio, and wave height through parametric studies. This study provides theoretical support for the optimal design and engineering application of the assembled corrugated steel plate shear wall.
2. Experimental Preparation
2.1. Specimen Design
For the selection of four corrugated forms (sine, trapezoid, triangle, semicircle), it was considered that, in practical engineering, triangular and circular ripples are less used, sine corrugated steel plate is more used in the field of bridges, and trapezoid corrugated steel plate is more widely used in the field of construction. Combined with the research results of scholars Emad Hosseinpour and Hamed Kalali [7], that the energy dissipation capacity, ductness, steel consumption, and ultimate bearing capacity of trapezoidal corrugated plates are superior to sine type, it was decided that the trapezoidal corrugated plate would be chosen as the corrugated form of the corrugated steel plate in subsequent studies.
As for the placement direction of the corrugated steel plate, in addition to conventional horizontal and vertical placement, Liang Zheng [6] also studied five different waveform placement angles of 0°, 30°, 45°, 60°, and 90°. However, the actual construction cost and difficulty of placing the corrugated steel plate diagonally are larger than for those placed conventionally. In addition, the procedure of bolt connection setting of a vertically placed corrugated steel plate is more complicated. Combined with the influence of non-gravity load, the layout direction of the corrugated inner-filled steel plate has little influence on the seismic performance of the specimen, so the horizontal placement direction of the corrugated steel plate was chosen.
Four groups of 1:2 scaled specimens were designed with a uniform steel plate thickness of 6 mm:
- (1)
- TSPSW-M-1: Flat steel plate (Figure 1a).
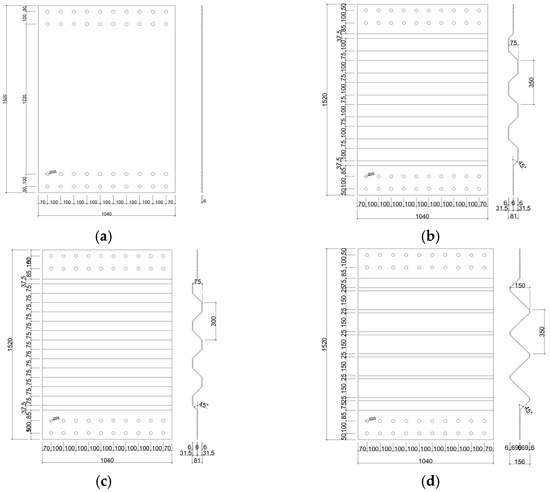 Figure 1. Geometric parameters of the specimen: (a) TSPSW-M-1, (b) TCSPSW-M-1, (c) TCSPSW-M-2, (d) TCSPSW-M-3.
 - (2)
- TCSPSW-M-1: Trapezoidal corrugated plate (wave height = 75 mm, wavelength = 350 mm, Figure 1b).
- (3)
- TCSPSW-M-2: Trapezoidal corrugated plate (wave height = 75 mm, wavelength = 250 mm, Figure 1c).
- (4)
- TCSPSW-M-3: Trapezoidal corrugated plate (wave height = 150 mm, wavelength = 350 mm, Figure 1d).
All specimens measured 1520 mm (height) × 1040 mm (width) using Q235 steel and M24 bolts (hole diameter: φ26). The geometric parameters are summarized in Table 1.

Table 1.
Geometric parameters of the specimen.
The test results of the wood properties are shown in Table 2.
Table 2.
Steel performance parameters.
2.2. Test Setup
The experiment was conducted at the Civil Engineering Laboratory of Foshan University using a large-scale structural loading system (Figure 2). Specimens were bolted to a frame (Figure 3). The lateral MTS hydraulic servo actuator was connected to one end of the upper beam and the other end to the vertical reaction wall of the laboratory. It performs low-cycle reciprocating loading to simulate the effect of reciprocating seismic action. Since the upper part of the test setup has a significant self-weight, and the steel plate shear wall specimen does not bear excessive vertical loads in actual engineering, a vertical MTS hydraulic servo actuator is required to apply a load equivalent to its own weight to the steel beam connected to the upper part of the steel plate during the loading process. This ensures that the upper beam remains horizontal at all times so that the specimen is not subjected to any weight other than that of the beam, the T-shaped transfer beam, and itself. As a result, the deformations and mechanical properties of the precast corrugated steel plate shear wall under seismic action can be accurately reflected.
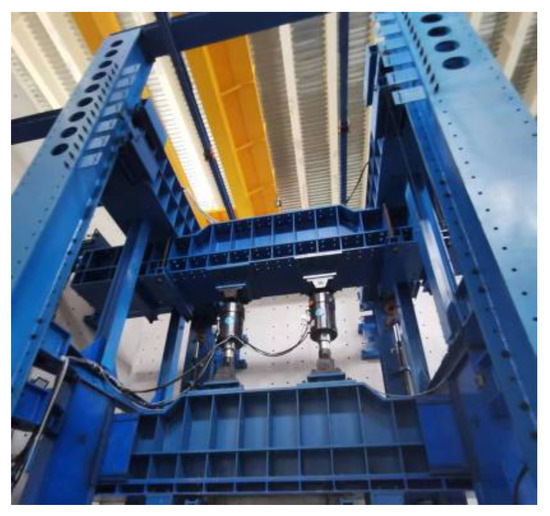
Figure 2.
Comprehensive loading test system.
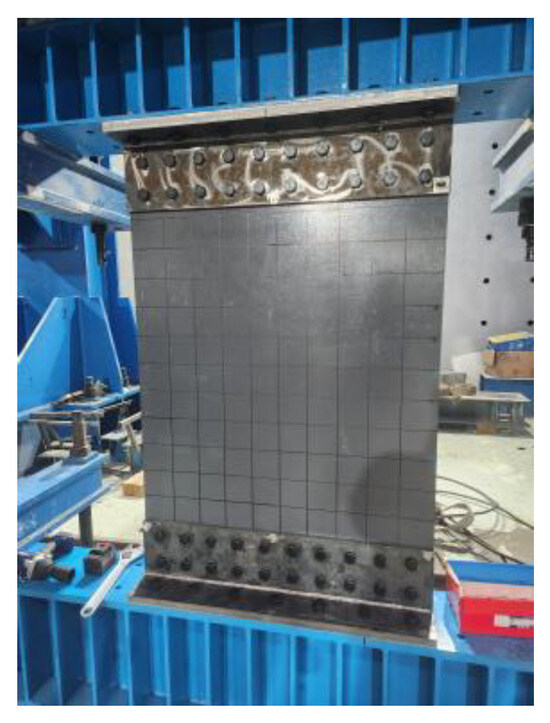
Figure 3.
Specimen assembly drawing (bolted connection).
2.3. Measurement Scheme
The data collected from the test measurements include the loads applied to the specimen under simulated seismic loads, as well as the displacements caused by stress deformation and stress and strain. The loads are measured using the force sensors built into the actuators (Figure 4). The displacement is the relative displacement between the upper and lower connecting plates, which is measured using a displacement sensor (model ZY-DT400) (Figure 5). To accurately measure the strain of the inner steel plate during loading, attach strain gauges to the steel plate. Figure 6 shows the layout of strain gauges. The displacement gauge data and strain data are received by the static data acquisition instrument (Model ZI-160).
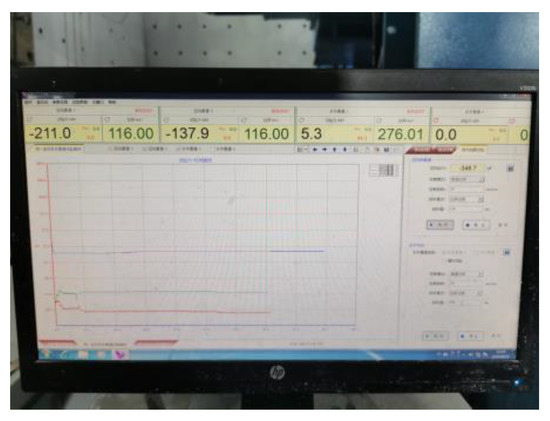
Figure 4.
Load acquisition system.
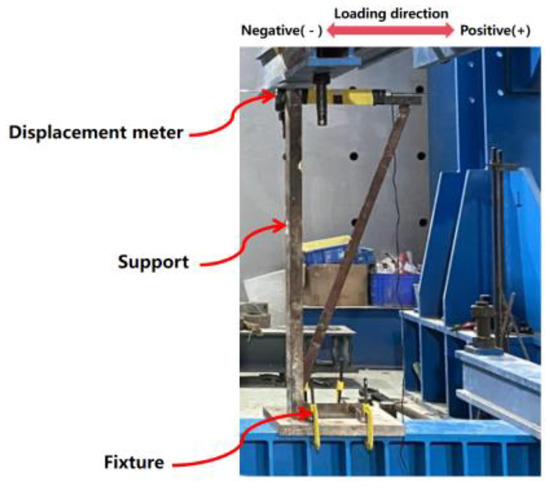
Figure 5.
Displacement collection device.
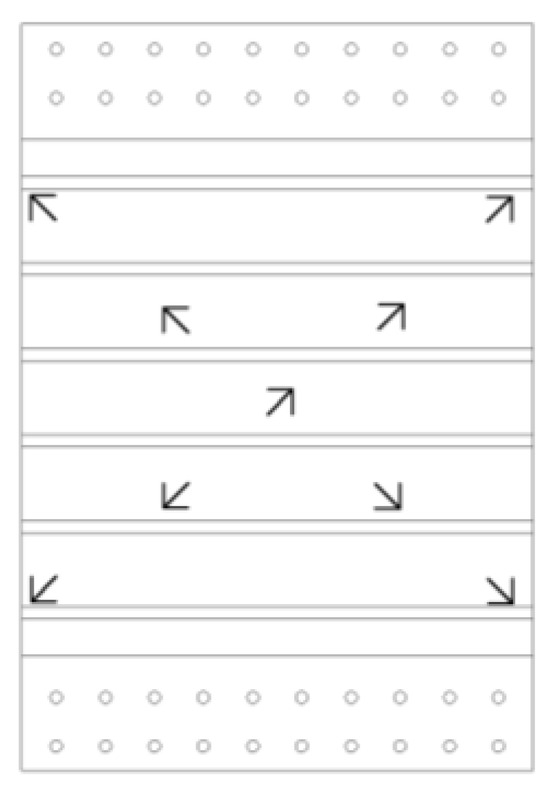
Figure 6.
Schematic diagram of strain gauge arrangement.
2.4. Loading Protocol
The loading system is shown in Figure 7. A hydraulic servo system is used to apply low-cycle reciprocating loads. A displacement—controlled loading method with varying amplitudes is adopted: Specifically, six loading cycles are first conducted using displacement loads corresponding to inter-story drift angles of 0.375%, 0.5%, and 0.75%, respectively. Then, four loading cycles are carried out using displacement loads corresponding to an inter-story drift angle of 1%. Finally, two loading cycles are performed using displacement loads corresponding to inter-story drift angles of 1.5%, 2%, 3%, 4%, 5%, 6%, 7%, and 8%, respectively.
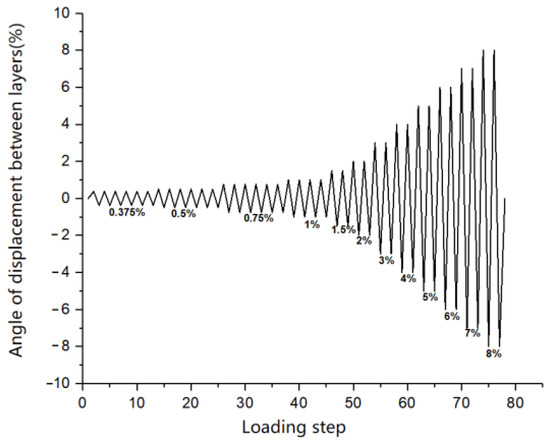
Figure 7.
Displacement loading curve.
3. Experimental Phenomena and Result Analysis
3.1. Experimental Observations
During the loading process, the lateral MTS hydraulic servo actuator is defined as positive when pushing and negative when pulling. When the TSPSW-M-1 specimen was loaded to +1%, no significant deformation occurred (Figure 8a). When the load increased to +2%, local buckling began to appear at the corners of the steel plate. As the load continued to increase in a reciprocating manner, overall buckling of the steel plate occurred along the diagonal of the plate. During the reverse loading phase, the buckling path of the steel plate along the diagonal changed, the buckling locations at the corners shifted, and there was a relatively loud noise. After entering the elastoplastic stage, when the load increased to 4% (Figure 8b), the local buckling of the steel plate along the diagonal was already quite obvious, forming an overall buckling in the form of a diagonal tension band. At this point, the steel plate mainly exerted its post-buckling strength in the form of a tension band. When the load increased to 7% (Figure 8c), local failure of the steel plate occurred, mainly characterized by the shearing damage at the upper right end of the steel plate (Figure 9). After the test ended and the load was removed, the steel plate had irreversible out-of-plane residual deformation.
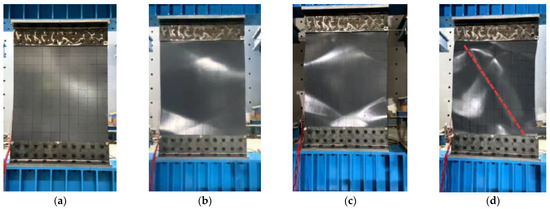
Figure 8.
TSPSW-M-1 specimen loading deformation diagram: (a) 1% interlayer displacement Angle, (b) 4% interlayer displace-ment Angle, (c) 6% interlayer displacement Angle, (d) 7% inter-layer displacement Angle.
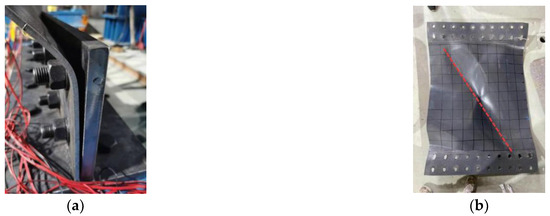
Figure 9.
TSPSW-M-1 deformation status: (a) Deformation state of specimen under loading, (b) Deformation state of the specimen after disassembly.
Figure 10 presents the deformation states of the TCSPSW-M-1 specimen under different loading inter-story drift angles. When the loading was less than ∆ = +2%, no significant deformation was observed in the TCSPSW-M-1 specimen. When the loading reached ∆ = +4%, local buckling began to appear at the end of the diagonal of the TCSPSW-M-1 specimen (Figure 10b). The local buckling gradually increased with the increasing loading stage. When the loading reached ∆ = +6%, the TCSPSW-M-1 specimen had a significant out-of-plane deformation (Figure 10c). During the loading process, intermittent noises could be heard from the specimen. As the loading inter-story drift angle increased to ∆ = +8%, the local buckling and out-of-plane deformation of the specimen continued to increase. However, unlike the regular flat steel plate specimen, the specimen did not form a distinct diagonal tension band. Instead, it formed a relatively shallow tension band along the corrugation direction at an angle of about 10° to the horizontal (Figure 10d). After unloading at the end of the test, the steel plate had irreversible out-of-plane residual deformation (Figure 11).
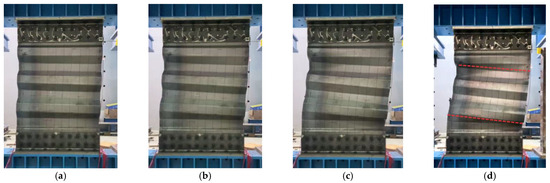
Figure 10.
TCSPSW-M-1 specimen loading deformation diagram: (a) 2% interlayer displacement Angle, (b) 4% interlayer displacement Angle, (c) 6% interlayer displacement Angle, (d) 8% interlayer displacement Angle.
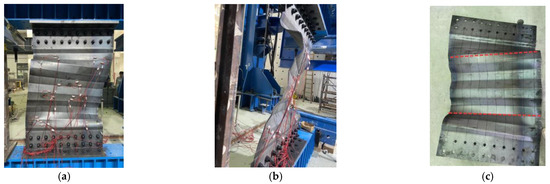
Figure 11.
TCSPSW-M-1 deformation status: (a) Deformation state of specimen under loading (Front view), (b) Deformation state of specimen under loading (Side view), (c) Deformation state of the specimen after disassembly.
Figure 12 illustrates the deformation states of the TCSPSW-M-2 specimen under different loading displacements. Similar to the TCSPSW-M-1 specimen, when the loading was less than ∆ = +2%, no significant deformation was observed in the TCSPSW-M-2 specimen. However, when the loading reached ∆= +3%, local buckling began to appear at the end of the diagonal of the TCSPSW-M-2 specimen (Figure 12b). The local buckling gradually increased with the increasing loading stage (Figure 12c). When the loading reached ∆ = +6%, the TCSPSW-M-2 specimen had a significant out-of-plane deformation. When the loading increased to ∆ = +8%, the local buckling and out-of-plane deformation of the specimen continued to increase (Figure 12d). Throughout the entire loading process, no cracking or failure of the specimen occurred. After unloading at the end of the test, the steel plate had irreversible out-of-plane residual deformation (Figure 13).
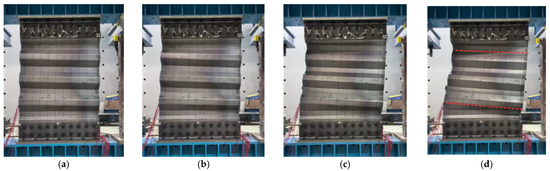
Figure 12.
TCSPSW-M-2 specimen loading deformation diagram: (a) 2% interlayer displacement Angle, (b) 4% interlayer displacement Angle, (c) 6% interlayer displacement Angle, (d) 8% interlayer displacement Angle.
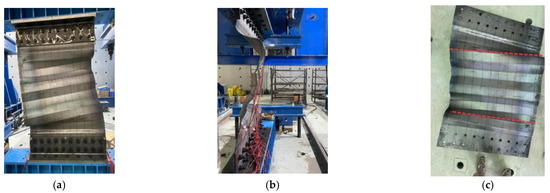
Figure 13.
TSPSW-M-1 deformation and failure status: (a) Deformation state of specimen under loading (Front view), (b) Deformation state of specimen under loading (Side view), (c) Deformation state of the specimen after disassembly.
As shown in Figure 14, the deformation diagrams of the TCSPSW-M-3 specimen under different loading inter-story drift angles can be seen. Before the loading reached ∆ = +2%, there was no significant deformation of the TCSPSW-M-3 specimen (Figure 14a). When the loading reached ∆ = +4%, the steel plate of the TCSPSW-M-3 specimen began to deform in a regular “accordion-like” pattern due to the changes and misalignment of the displacements of the upper and lower connecting plates. As the loading inter-story drift angle increased, this regular deformation became more evident. However, throughout the entire process, no significant buckling or out-of-plane deformation was found (Figure 15).
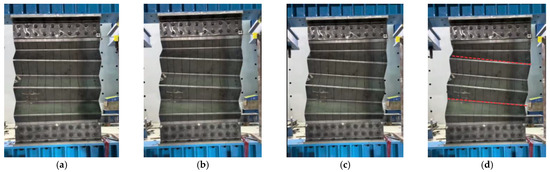
Figure 14.
TCSPSW-M-3 specimen loading deformation diagram: (a) 2% interlayer displacement Angle, (b) 4% interlayer displacement Angle, (c) 6% interlayer displacement Angle, (d) 8% interlayer displacement Angle.
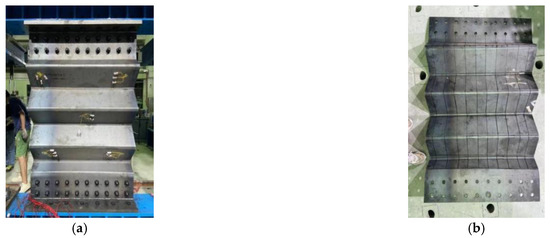
Figure 15.
TCSPSW-M-3 deformation and failure status: (a) Deformation state of specimen under loading, (b) Deformation state of the specimen after disassembly.
3.2. Experimental Result Analysis
The hysteresis curves of TSPSW-M-1, TCSPSW-M-1, TCSPSW-M-2, and TCSPSW-M-3 are shown in Figure 16. The hysteresis curve of TSPSW-M-1 obtained from the test presents a “bow-shaped” form. The curve is relatively full, but it has a pinching effect. This indicates that the plastic deformation capacity of the entire structure or specimen is relatively strong, and the performance in the low-cycle repeated load test of the node is good, which enables it to absorb seismic energy effectively. The hysteretic curves of TCSPSW-M-1 and TCSPSW-M-2 specimens are approximately “anti-S-shaped”. Compared with the bow section, the hysteretic curves have longer sliding sections, reflecting more sliding effects, and the area surrounded by the curves is reduced, which reflects the ductility of the specimens and the ability to absorb seismic energy are poor. The hysteresis curve of the TCSPSW-M-3 specimen is approximately “diamond-shaped”, which is symmetric and full. It can intuitively reflect that the plastic deformation capacity of the entire structure or specimen is very strong, and it has excellent seismic performance and energy dissipation capacity.
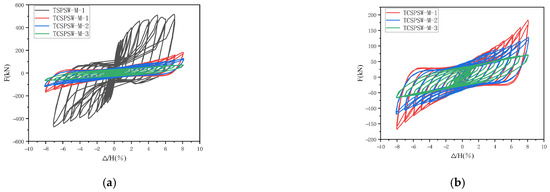
Figure 16.
Comparison of hysteresis curves of each specimen: (a) Hysteresis curve of each specimen, (b) Hysteresis curve of each specimen (except TSPSW-M-1).
As shown in Figure 17, the skeleton curves of each specimen are presented. It can be seen that the skeleton curves of all specimens are symmetric and Z-shaped. By comparing the skeleton curves, it can be observed that the TSPSW-M-1 specimen has the highest load peak. The load peaks of the other three specimens are much lower than that of the TCSPSW-M-1 specimen. This is because, for the corrugated steel plate shear wall, the corrugations of the steel plate are placed horizontally, and there are no stiffeners at the free ends on both sides, which significantly reduces the stiffness compared to that of a flat steel plate. Among them, the TCSPSW-M-3 specimen has the lowest load peak.
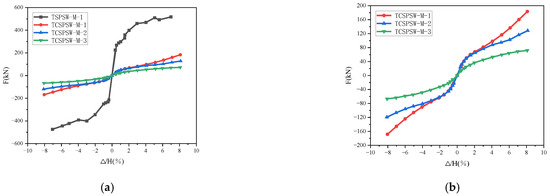
Figure 17.
Comparison of skeleton curves of each specimen: (a) Skeleton curves of each specimen, (b) Skeleton curves of each specimen (except TSPSW-M-1).
As shown in Figure 18, the initial stiffness of the four specimens are 41.96 kN/mm, 4.40 kN/mm, 4.64 kN/mm, and 2.47 kN/mm, respectively. The TSPSW-M-1 specimen has the highest initial stiffness, which is much greater than that of the other three specimens, while the TCSPSW-M-3 specimen has the lowest initial stiffness. The stiffness degradation rate of the three corrugated steel plate specimens (TCSPSW-M-1, TCSPSW-M-2, and TCSPSW-M-3) is much lower than that of the flat steel plate specimen (TSPSW-M-1). Among the three corrugated steel plate specimens, the stiffness degradation rates of TCSPSW-M-1 and TCSPSW-M-2 are similar. In the middle and late stages of loading, the stiffness of TCSPSW-M-1 degrades more slowly than that of TCSPSW-M-2. Throughout the entire process, the stiffness of TCSPSW-M-3 degrades even more slowly.
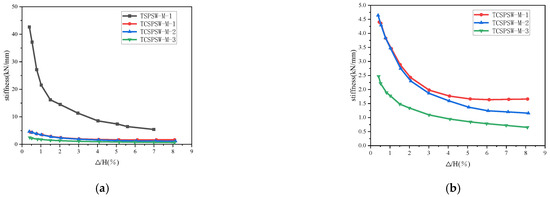
Figure 18.
Comparison of stiffness degradation curves of each specimen: (a) Stiffness degradation curves of each specimen, (b) Stiffness degradation curves of each specimen (except TSPSW-M-1).
Figure 19a presents the energy dissipation curves for the first cycle of each loading stage of the four specimens (single-cycle energy dissipation curves). It can be seen that the single-cycle energy dissipation of the TSPSW-M-1 specimen (flat steel plate shear wall) is much higher than that of the other three specimens. Before the loading reached 4%, the single-cycle energy dissipation of the TCSPSW-M-1 and TCSPSW-M-2 specimens was almost equal. As the loading continued, the single-cycle energy dissipation of the TCSPSW-M-1 specimen began to be slightly higher than that of the TCSPSW-M-2 specimen. Throughout the entire loading process, the single-cycle energy dissipation of the TCSPSW-M-3 specimen was the lowest among the three specimens. This indicates that the flat steel plate shear wall has a stronger energy dissipation capacity in a single loading cycle. The TCSPSW-M-1 specimen has a higher energy dissipation capacity than the TCSPSW-M-2 specimen under higher loads, while the single-cycle energy dissipation of the TCSPSW-M-3 specimen is the lowest throughout the loading process, indicating its weaker energy dissipation capacity.
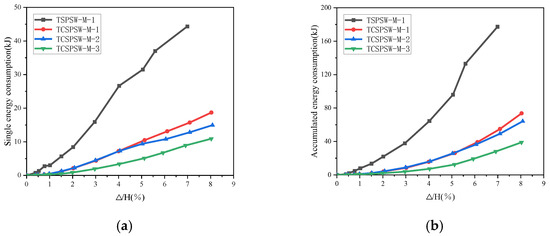
Figure 19.
Energy consumption curve chart: (a) One lap energy consumption curve chart, (b) Total energy consumption curve chart.
Figure 19b presents the cumulative energy dissipation curves of the four specimens. After the loading ended, the cumulative energy dissipations of the four specimens were 175.97 kJ, 73.67 kJ, 63.96 kJ, and 38.56 kJ, respectively. The TSPSW-M-1 specimen had the highest cumulative energy dissipation, while the TCSPSW-M-3 specimen had the lowest. The highest cumulative energy dissipation of the TSPSW-M-1 specimen indicates that the flat steel plate shear wall has the strongest total energy dissipation capacity throughout the loading process. The total energy dissipation capacity of the corrugated steel plate shear walls is relatively weaker. However, the energy dissipation capacity of the TCSPSW-M-1 specimen is slightly better than that of the TCSPSW-M-2 specimen. The TCSPSW-M-3 specimen had the lowest cumulative energy dissipation, further confirming its weaker energy dissipation capacity.
4. Parametric Analysis of CSPSWs
In this extract, plate thickness t, steel sheet aspect ratio w/H, and wave height Ph were used as research parameters (model TCSPSW-C was the control group of the model group of unribbed shear walls on both sides of corrugated steel plates that could be assembled) for parameter analysis. Ten groups of models were established for finite element analysis, and the parameters are shown in Table 3.
Table 3.
Model parameters without stiffeners on both sides.
C3D8R hexahedral linear reduced integral solid element was selected for grid division, and the constitutive model of the material was the three-fold model. The value of the material property data is based on the actual data of the material property test in this paper. The material properties were defined as isotropy, and the Von Mises yield criterion was used, with Poisson’s ratio of 0.3 and mass density of 7.85 × 10³ kg/m3 for all materials.
The corresponding contact of each component in the model is set by ABAOUS under the interacting plate, in which the pressure mode is set as “hard contact” in the normal behavior, the friction formula is set as “penalty” function in the tangential behavior, the slip formula is limited slip, and the friction coefficient is set as 0.35.
Figure 20 shows the boundary conditions. The bottom of the model adopts fixed constraints; that is, 6 degrees of freedom are set on the bottom surface of the T-shaped transfer beam at the lower end of the model in the load module. External rotation of the frame plane is restricted, and the boundary conditions are set by displacement in the load module. First, the top surface of the T-type transfer beam on the upper side of the model is selected, and U2, U3, UR1, UR2, and UR3 are selected to set it to 0.
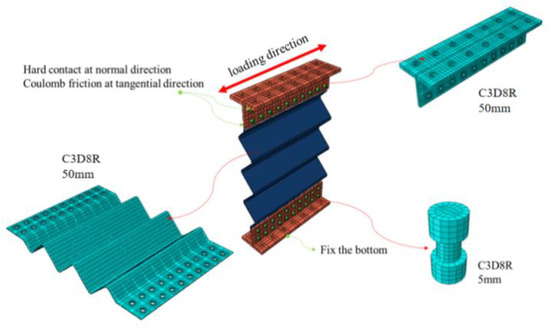
Figure 20.
Schematic diagram of finite element model modeling.
4.1. Influence of Different Plate Thicknesses on Energy Dissipation Capacity of CSPSWs
The finite element simulation calculations were carried out using the four models, TCSPSW-C, TCSPSW-t-4, TCSPSW-t-8, and TCSPSW-t-10, with plate thicknesses of 4 mm, 6 mm, 8 mm, and 10 mm, respectively, as shown in Table 3. As illustrated in Figure 21, during the loading stage from the inter-story drift angle ∆/H = 0 to ∆/H = 0.5%, the E0 of the four models is almost equal to 0. This stage is the elastic stage, during which the models hardly produce any energy dissipation. When the loading reaches around ∆/H = 0.5%, the models begin to enter the elastoplastic stage, and energy dissipation starts to occur, with E0 beginning to change. When the loading reaches the stage of ∆/H = 2.0%, E0 reaches its maximum value, and the cyclic loading ends. The steel plate thicknesses of the models TCSPSW-C, TCSPSW-t-4, TCSPSW-t-8, and TCSPSW-t-10 increase progressively. Correspondingly, the energy dissipation coefficient E0 and the energy dissipation of the models also increase to varying degrees. This indicates that the energy dissipation efficiency and the amount of energy dissipation of the models increase with the increase in the steel plate thickness, showing a positive correlation. The model with a 10 mm steel plate thickness (TCSPSW-t-10) has the highest E0 of 1.27 at the stage of ∆/H = 2.0%, which is 49.38% higher than that of the model with the lowest E0 (TCSPSW-t-4). The energy dissipation of the 10 mm steel plate thickness model (TCSPSW-t-10) is the highest at the stage of ∆/H = 2.0%, reaching 78.12 kJ, which is 125.50% more than that of the model with the lowest energy dissipation (TCSPSW-t-4). The steel plate thickness has a significant impact on the energy dissipation capacity of the models. The E0 of the model TCSPSW-t-4 is 0.85 at the stage of ∆/H = 2.0%, which is very close to the 0.87 of the model TCSPSW-C. Their energy dissipation amounts are 34.65 kJ and 37.1 kJ, respectively, indicating that the energy dissipation capacities of the two models are similar in the middle and late stages of loading.
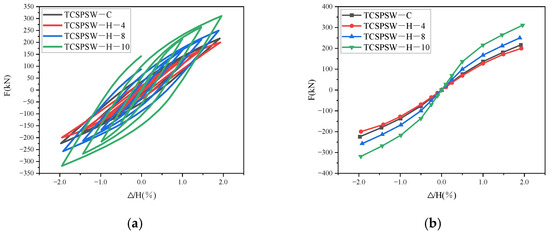

Figure 21.
Comparison diagram of different plate thicknesses: (a) Hysteresis curve, (b) Skeleton curves, (c) Energy dissipation coefficient, (d) Energy consumption per loading stage.
As can be seen from Figure 22, changing the steel plate thickness has little impact on the stress state of the models. The stress concentration areas of the four models are all distributed at the valleys of the corrugated steel plates (the side closer to the inside of the stress cloud diagram is the valley, and the side closer to the outside is the peak) near the free ends on both sides. As the steel plate thickness increases, the stress in the loading area at the upper left corner of the T-shaped transfer beam begins to gradually increase.
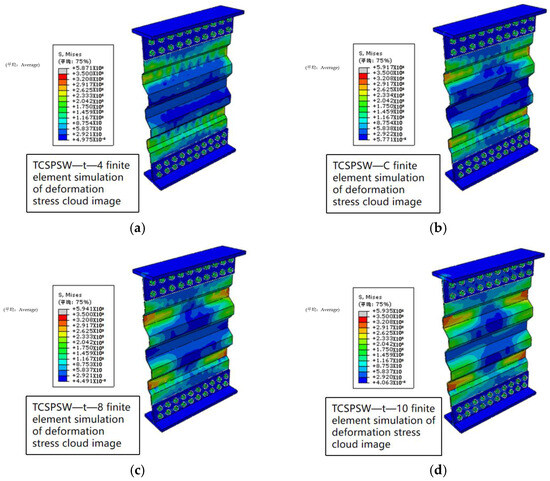
Figure 22.
Stress comparison diagram of different plate thickness models: (a) TCSPSW—t—4, (b) TCSPSW—C, (c) TCSPSW—t—8, (d) TCSPSW—t—10.
4.2. Influence of Different Steel Sheet Width/Height Ratio on Energy Dissipation Capacity of CSPSWs
As shown in Figure 23, finite element simulations were conducted using the four models from Table 3, TSCSPSW-C, TCSPSW-w/H-0.5, TCSPSW-w/H-1.0, and TCSPSW-w/H-1.5, with width/height ratios of 0.5, 0.68, 1.0, and 1.5, respectively. Compared to the other three models, the E0 of the TCSPSW-w/H-1.5 model began to increase at the stage of ∆/H = 0.25%, indicating that the model gradually entered the elastoplastic stage and started to dissipate energy (although the amount of energy dissipation was relatively small). The loading stage at which the other three models entered the elastoplastic stage also advanced with the increase in the width/height ratio. The width/height ratios of the models TSCSPSW-C, TCSPSW-w/H-0.5, TCSPSW-w/H-1.0, and TCSPSW-w/H-1.5 increased progressively, and, correspondingly, the energy dissipation coefficients (E0) and energy dissipation of the models also increased to varying degrees. This shows that the energy dissipation efficiency and the amount of energy dissipation of the models increase with the increase in the steel plate width/height ratio, showing a positive correlation. At the stage of ∆/H = 2.0%, the E0 of the steel plate model with a width/height ratio of 1.5 (TCSPSW-w/H-1.5) was the highest, at 1.06, which was 27.37% higher than that of the model with the lowest E0 (TCSPSW-w/H-0.5). The energy dissipation of the steel plate model with a width/height ratio of 1.5 (TCSPSW-w/H-1.5) was the highest at the stage of ∆/H = 2.0%, reaching 127.15 kJ, which was 299.99% more than that of the model with the lowest energy dissipation (TCSPSW-w/H-0.5). It can be seen that the width/height ratio of the steel plate has a very significant impact on the energy dissipation capacity of the models.
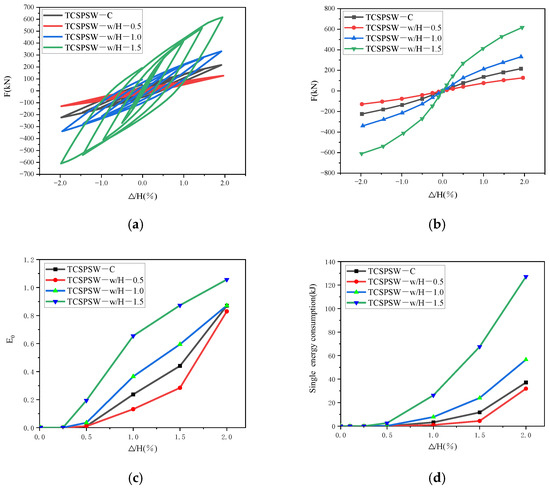
Figure 23.
Comparison chart of different board widths: (a) Hysteresis curve, (b) Skeleton curves, (c) Energy dissipation coefficient, (d) Energy consumption per loading stage.
Figure 24 shows the stress cloud diagrams of the four models with different width/height ratios. The stress concentration areas of the four models are all distributed at the valleys of the corrugated steel plates near the free ends on both sides. Changing the width/height ratio has little impact on the stress magnitude or failure mode of the models.
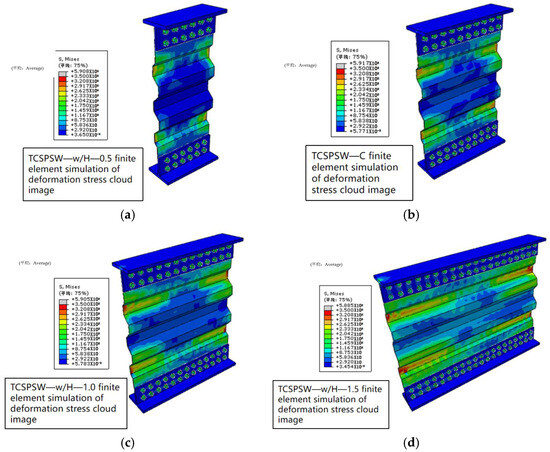
Figure 24.
Stress comparison diagram of different board width models: (a) TCSPSW—w/H—0.5, (b) TCSPSW—C, (c) TCSPSW—w/H—1.0, (d) TCSPSW—w/H—1.5.
4.3. Influence of Different Wave Height on Energy Dissipation Capacity of CSPSWs
Figure 25 shows the results of the finite element simulation calculations carried out using the four models from Table 3, TSCSPSW-C, TCSPSW-Ph-50, TCSPSW-Ph-100, and TCSPSW-Ph-150, with corrugation heights of 50 mm, 75 mm, 100 mm, and 150 mm, respectively. As the corrugation heights of the models TSCSPSW-C, TCSPSW-Ph-50, TCSPSW-Ph-100, and TCSPSW-Ph-150 increase progressively, the energy dissipation of the models decreases. This is because increasing the corrugation height actually reduces the lateral load-bearing capacity of the corrugated steel plates, thereby reducing the energy dissipation of the models. As the corrugation height increases, the loading stage at which the models enter the elastoplastic stage is also delayed. It can be seen that before the stage of ∆/H = 1.5%, the energy dissipation coefficient (E0) of the four models is negatively correlated with the corrugation height. At the stage of ∆/H = 2.0%, the E0 of the steel plate model with a corrugation height of 150 mm (TCSPSW-Ph-150) exceeded that of the steel plate model with a corrugation height of 50 mm (TCSPSW-Ph-50), with a value of 1.25, which was 43.61% higher than that of the model with the lowest E0 (TSCSPSW-C). In terms of energy dissipation, the steel plate model with a corrugation height of 50 mm (TCSPSW-Ph-50) had the highest energy dissipation at the stage of ∆/H = 2.0%, reaching 69.44 kJ, which was 150.6% more than that of the model with the lowest energy dissipation (TCSPSW-Ph-150). It can be seen that the corrugation height has a significant impact on the energy dissipation capacity of the corrugated steel plate shear walls.
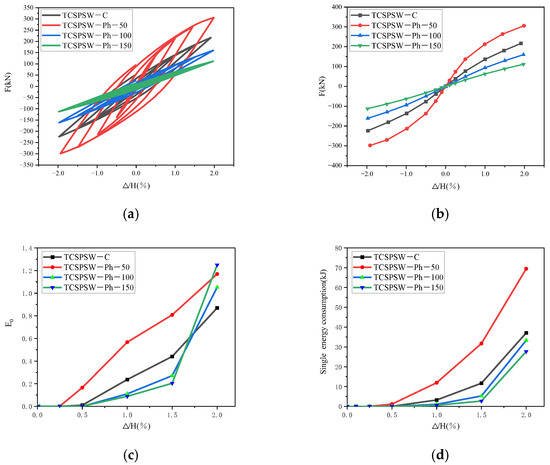
Figure 25.
Comparison chart of different wave heights: (a) Hysteresis curve, (b) Skeleton curves, (c) Energy dissipation coefficient, (d) Energy consumption per loading stage.
Figure 26 shows the stress cloud diagrams of the four models with different corrugation heights. As the corrugation height increases, the stress distribution of the models becomes more concentrated at the valleys near the free ends on both sides. This excessive stress concentration is not conducive to the structural loading, which may lead to the premature appearance of cracks or fractures in this area. Such situations should be avoided in the design phase.
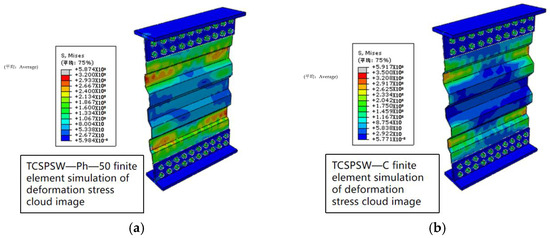

Figure 26.
Stress comparison diagram of different wave height models: (a) TCSPSW—Ph—50, (b) TCSPSW—C, (c) TCSPSW—Ph—100, (d) TCSPSW—Ph—150.
5. Conclusions
This paper experimentally and through finite element analysis investigated the lateral resistance of prefabricated corrugated steel plate shear walls, revealing their load-bearing mechanisms and failure characteristics. In addition, a parametric analysis was carried out to explore the impact of plate thickness, width/height ratio, and corrugation height on the lateral resistance of corrugated steel plate shear walls. The main conclusions are as follows:
- (1)
- The energy dissipation performance of corrugated steel plate shear walls is superior to that of flat steel plate shear walls. Under the same conditions, flat steel plate shear walls exhibit higher lateral stiffness and energy dissipation compared to corrugated steel plate shear walls. However, due to their unique geometric shape, namely the “accordion-like structure”, corrugated steel plate shear walls can demonstrate superior energy dissipation efficiency. Prefabricated corrugated steel plate shear walls, compared to prefabricated flat steel plate shear walls, have better resistance to out-of-plane displacement under seismic action, providing enhanced safety.
- (2)
- The “accordion-like” configuration of corrugated steel plate shear walls significantly enhances out-of-plane stability. Under seismic action, the maximum out-of-plane deformation of the corrugated steel plate is reduced by 40% compared to that of the flat steel plate. Moreover, the failure mode is primarily characterized by local buckling, which avoids the risk of overall instability.
- (3)
- There is a significant positive correlation between the plate thickness and the energy dissipation performance of corrugated steel plate shear walls. As the plate thickness increases, both the energy dissipation coefficient and the energy dissipation of the corrugated steel plate shear walls significantly improve. At the inter-story drift angle stage of ∆/H = 2.0%, the model with a plate thickness of 10 mm has the highest energy dissipation coefficient and energy dissipation, which are 49.38% and 125.50% higher than those of the model with a plate thickness of 4 mm, respectively. This indicates that increasing the plate thickness can effectively enhance the energy dissipation capacity of the structure, especially under larger inter-story drift angles, where the energy dissipation performance of thicker plates is more prominent.
- (4)
- The aspect ratio has a significant impact on the energy dissipation performance of corrugated steel plate shear walls. The model with an aspect ratio of 1.5 has the highest energy dissipation coefficient and energy dissipation at the stage of ∆/H = 2.0%, which is three times that of the model with an aspect ratio of 0.5. This indicates that increasing the aspect ratio of the corrugated steel plate can effectively enhance the energy dissipation performance of the structure.
- (5)
- The increase of corrugation height has a negative impact on the energy dissipation capacity of corrugated steel plate shear walls. As the corrugation height increases from 50 mm to 150 mm, the lateral load-bearing capacity of the model decreases by about 35%, and the energy dissipation decreases by 150.6%. This indicates that increasing the corrugation height reduces the lateral load-bearing capacity and energy dissipation capacity of the corrugated steel plate. However, at a specific loading stage (∆/H = 2.0%), the energy dissipation coefficient of the high-corrugation-height model exceeded that of the low-corrugation-height model. This may be related to the structure entering a deeper nonlinear response stage. It is suggested to strengthen the trough area by welding the ribbed plate when the corrugated height is too high to avoid the early damage caused by stress concentration.
Author Contributions
Conceptualization, J.H.; methodology, S.C.; validation, D.Z.; formal analysis, Z.C.; investigation, Z.C.; resources, D.Z.; data curation, J.H.; writing—original draft preparation, J.H.; writing—review and editing, Z.C.; visualization, Z.C.; supervision, J.H.; project administration, S.C. All authors have read and agreed to the published version of the manuscript.
Funding
This research received no external funding.
Institutional Review Board Statement
Not applicable.
Informed Consent Statement
Not applicable.
Data Availability Statement
Dataset available on request from the authors.
Conflicts of Interest
The authors declare no conflict of interest.
References
- Berman, J.W.; Bruneau, M. Experimental Investigation of Light-Gauge Steel Plate Shear Walls. J. Struct. Eng. 2005, 131, 259–267. [Google Scholar] [CrossRef]
- Botros, R.B.G. Nonlinear Finite Element Analysis of Corrugated Steel Plate Shear Walls. Master’s Thesis, University of Calgary, Calgary, AB, Canada, 2006. [Google Scholar]
- Farzampour, A.; Laman, J.A.; Mofid, M. Behavior prediction of corrugated steel plate shear walls with openings. J. Constr. Steel Res. 2015, 114, 258–268. [Google Scholar] [CrossRef]
- Vaziri, E.; Gholami, M.; Gorji Azandariani, M. The Wall—Frame Interaction Effect in Corrugated Steel Plate Shear Walls Systems. Int. J. Steel Struct. 2021, 21, 1680–1697. [Google Scholar] [CrossRef]
- Cao, Q.; Huang, J. Shear Behavior and Analytical Method of Vertically Corrugated Steel Plate Shear Walls with Inelastic Buckling of Infilled Plates. Buildings 2023, 13, 2184. [Google Scholar] [CrossRef]
- Zheng, L.; Wang, W.; Ge, H.; Guo, H.; Gao, Y.; Han, Y. Seismic performance of steel corrugated plate structural walls with different corrugation inclinations. J. Constr. Steel Res. 2022, 192, 107248. [Google Scholar] [CrossRef]
- Yadollahi, Y.; Pakar, I.; Bayat, M. Evaluation and comparison of behavior of corrugated steel plate shear walls. Lat. Am. J. Solids Struct. 2015, 12, 763–786. [Google Scholar] [CrossRef]
- Deng, R.; Yang, J.-D.; Wang, Y.-H.; Li, Q.-Q.; Tan, J.-K. Cyclic shear performance of built-up double-corrugated steel plate shear walls: Experiment and simulation. Thin-Walled Struct. 2022, 181, 110077. [Google Scholar] [CrossRef]
- Zhu, B.L.; Bai, W.H.; Wen, C.B.; Zuo, J.Q.; Sun, H.J.; Wang, X.; Guo, Y.L. Experimental and numerical investigation into hysteretic performance of orthogonal double corrugated steel plate shear wall. Thin-Walled Struct. 2024, 195, 111392. [Google Scholar] [CrossRef]
- Wang, W.; Quan, C.-C.; Li, Y.; Zhen, G.-K.; Zhao, H.-T. Experimental study and numerical simulation analysis on seismic performance of corrugated steel-plate shear wall with replaceable bottom corner dampers. Soil Dyn. Earthq. Eng. 2022, 152, 107061. [Google Scholar] [CrossRef]
- Shariati, M.S.S. Numerical study on the structural performance of corrugated low yield point steel plate shear walls with circular openings. Steel Compos. Struct. Int. J. 2019, 33, 569–581. [Google Scholar]
- Bahrebar, M.; Lim, J.B.; Clifton, G.C.; Zirakian, T.; Shahmohammadi, A.; Hajsadeghi, M. Response assessment and prediction of low yield point steel plate shear walls with curved corrugated web plates and reduced beam sections. Structures 2020, 28, 1729–1745. [Google Scholar] [CrossRef]
- Yu, C.-Q.; Tong, J.-Z.; Tong, G.-S.; Xu, S.-L.; Chen, M. Axial compressive performance and design of multi-celled corrugated-plate CFST walls. Structures 2023, 57, 105303. [Google Scholar] [CrossRef]
- Yu, J.-G.; Zhu, S.-Q. Study on seismic behavior of oblique CFRP corrugated plate-steel plate light weight sandwich composite shear wall. Structures 2023, 48, 2062–2081. [Google Scholar] [CrossRef]
Disclaimer/Publisher’s Note: The statements, opinions and data contained in all publications are solely those of the individual author(s) and contributor(s) and not of MDPI and/or the editor(s). MDPI and/or the editor(s) disclaim responsibility for any injury to people or property resulting from any ideas, methods, instructions or products referred to in the content. |
© 2025 by the authors. Licensee MDPI, Basel, Switzerland. This article is an open access article distributed under the terms and conditions of the Creative Commons Attribution (CC BY) license (https://creativecommons.org/licenses/by/4.0/).