1. Introduction
Headframes play a central role in key industrial sectors, such as metallurgy, mining, coal mining, and oil drilling. Faced with the dual challenges of lifting loads and environmental factors (such as wind force), headframes may undergo 3D deformation. Real-time monitoring of the dynamic deformation of headframes is crucial to avoid serious safety risks caused by exceeding safety thresholds. Structural anomalies can be identified in a timely manner by establishing an effective deformation monitoring and early warning system, ensuring the safety of headframe operations, equipment, and personnel.
In the field of headframe deformation monitoring, conventional ground measurement techniques, such as static measurement methods based on total stations and levels, face issues like long monitoring cycles, high labor intensity, and difficulty in meeting real-time monitoring requirements. With the continuous development of surveying and mapping technology, researchers have begun to adopt methods such as precise leveling measurements, photogrammetry, and 3D laser scanning. Although these technologies each have their advantages, such as the strong capabilities of photogrammetry and 3D laser scanning in providing detailed deformation data, they also encounter challenges like large field workload and complex data processing [
1,
2]. In response to these limitations, Global Navigation Satellite System (GNSS) technology, particularly following the completion of BDS-3, provides a highly precise and reliable real-time monitoring solution, significantly improving monitoring efficiency and accuracy. Liu and Yang utilized GPS differential dynamic positioning technology to process actual GPS data on mine headframe dynamic deformation, demonstrating that GPS dynamic positioning results satisfy the accuracy requirements for headframe deformation monitoring [
3]. Sun Gang and Jia Hui investigated automation and online monitoring technology for coal mine headframes based on BeiDou high-precision positioning, establishing an online monitoring system for headframe displacement and inclination [
4]. Gao Jingxiang and colleagues explored the application of GNSS technology in mine deformation monitoring, including the construction of continuous operation reference stations, the development of precise height difference models, and the creation of automated monitoring systems for coal mining subsidence, thereby enhancing the precision, real-time performance, and reliability of mine deformation monitoring [
5]. Furthermore, Liu et al. explored the phenomenon of frequency aliasing and its time-frequency characteristics in the context of high-rate GNSS seismic monitoring [
6]. Gao advanced a rapid inversion algorithm for determining seismic source parameters using high-rate GNSS data during significant seismic events [
7]. Liu et al. also performed an extensive analysis of the damage progression and catastrophic mechanisms in building structures subjected to the combined effects of coal mining activities and seismic events [
8]. Studies [
9,
10,
11,
12] systematically investigated critical aspects such as seismic response characteristics, vibration spectrum analysis, and structural reinforcement strategies for mine headframe structures. As a result, the utilization of GNSS technology for monitoring deformation and investigating disaster-inducing mechanisms in mining headframe structures under the combined influence of mining-induced and seismic disturbances holds substantial academic and practical significance.
In contemporary GNSS research, notwithstanding the substantial advancements achieved in positioning, navigation, and monitoring through GNSS technology, several limitations remain, particularly concerning the enhancement of monitoring accuracy and the application of the technology in complex environments. These challenges primarily arise from intrinsic signal errors, including signal blockage, multipath effects, atmospheric delay errors, and satellite geometry distribution [
13]. To mitigate these issues, researchers have undertaken extensive experimental investigations aimed at correcting and enhancing GNSS performance. For instance, in complex environments, multi-system integration has been utilized to enhance positioning accuracy and reliability. Yingli Wang et al. demonstrated this approach by combining GNSS with inertial navigation systems and incorporating a Cascade-LSTM neural network to predict pseudo-velocity measurements, effectively bridging GNSS signal gaps during interruptions [
14]. Furthermore, the development of cost-effective, high-performance hardware constitutes a crucial avenue for the advancement of Global Navigation Satellite Systems (GNSS). Alkan R.M. et al. demonstrated the feasibility of using Garmin handheld GNSS devices for geodetic measurements by employing relative methods and precise point positioning (PPP) technology to assess their static and kinematic positioning capabilities. They concluded that these devices could potentially replace expensive GNSS receivers in certain regions [
15]. Additionally, the utilization of low Earth orbit (LEO) satellites to supplement traditional GNSS signals is gaining traction as a viable approach to address signal limitations. Pisoni F. et al. successfully integrated LEO satellites with conventional GNSS satellites, thereby alleviating dynamic stress on receivers and enhancing the overall performance of the system [
16].
In the context of deformation monitoring data acquisition using Global Navigation Satellite System (GNSS) technology, the investigation of data processing and analysis methodologies is crucial for ensuring the accuracy and reliability of the monitoring data. This, in turn, provides a foundational basis for the structural safety monitoring and assessment of large structures, such as headframes. Commonly employed techniques, including Kalman filtering, Gaussian filtering, and wavelet transform, are utilized to clean and denoise the monitoring data, thereby enhancing the reliability of the analysis outcomes. Li and Kuhlmann utilized Kalman filter technology augmented with a shaping filter, which improved the real-time deformation monitoring accuracy of GPS coordinate time series and effectively addressed data containing colored noise [
17]. Additionally, Gao et al. introduced an enhanced wavelet threshold denoising method, which was shown to be effective in eliminating high-frequency noise while preserving data details, as demonstrated through simulation analysis and engineering case studies [
18]. Shi Qiang and colleagues conducted a study on the application of spatiotemporal Kalman filtering in deformation analysis. They compared the similarities and differences among three typical spatiotemporal Kalman filtering models, examining both their fundamental principles and experimental applications. Their analysis focused on the models’ applicability in deformation analysis and their effectiveness in spatiotemporal filtering denoising, data interpolation, and deformation prediction [
19]. Wei Chunxiao and Li Bofeng investigated a sliding filtering model tailored for GNSS deformation monitoring. Their research aimed to enhance the model’s robustness against anomalies during periods of rapid local deformation while improving precision in processing stable deformation. They employed the minimum description length criterion to assess the effectiveness of various models in deformation monitoring [
20]. Dai and colleagues utilized the spatiotemporal Kalman filter (STKF) to analyze dam deformation monitoring data, demonstrating the STKF’s efficacy in noise filtering, data prediction, and interpolation of unmonitored data [
21]. Yuwono and Prasetyo conducted an analysis of deformation monitoring technology at the Diponegoro University dam in Semarang, Indonesia, utilizing Global Navigation Satellite System (GNSS) and ground measurement techniques. They evaluated the positioning accuracy of these technologies and highlighted the significance of GNSS in dam monitoring [
22]. In the context of safety monitoring and assessment of large structures, such as headframes, it is imperative to study deformation risk assessment and develop early warning methods. Zaminpardaz et al. introduced a statistical approach for evaluating the risk associated with deformation monitoring systems, with a particular emphasis on the integrity risk related to the system’s failure to provide timely alerts [
23]. He et al. developed a comprehensive risk assessment and early warning system for the construction and operation of high-speed railway underground bridges. Their approach involved both quantitative and qualitative analyses, integrating the “as low as reasonably possible” criterion for risk assessment and employing the autoregressive integrated moving average (ARIMA) method for deformation prediction [
24]. Deng Lizheng and colleagues conducted a comprehensive review of technologies for landslide deformation monitoring and early warning, highlighting the critical role of deep deformation monitoring in enhancing early warning systems and suggesting future directions for the development of intelligent early warning models [
25]. Meanwhile, Chen and co-authors introduced an advanced framework for dam deformation monitoring that integrates deep learning with spatiotemporal characteristic analysis. This framework significantly improves prediction accuracy and facilitates real-time updates of warning thresholds by employing a synergistic approach that combines proper orthogonal decomposition, a deep kernel extreme learning machine algorithm, and cloud modeling techniques [
26]. This approach exhibits substantial enhancements in predictive performance and the adaptive adjustment of safety indicators. The findings of this research not only highlight innovation and advancement in the domain of deformation monitoring, particularly concerning data processing and predictive methodologies, but also serve as a valuable reference for augmenting monitoring accuracy and ensuring engineering safety.
Research on deformation monitoring predominantly focuses on data processing and analysis, along with deformation prediction and risk assessment. The development of models and methodologies is primarily applied to scenarios such as mining surfaces, landslides, dams, roads, and tunnels. However, there is a relative paucity of research concerning the deformation monitoring of mining shaft frameworks. In the realm of current research on GNSS technology, the majority of studies concentrate on discrete aspects, such as GNSS data preprocessing, accuracy enhancement, or algorithm modeling, as well as isolated risk assessment and early warning systems. However, this study successfully established a full-chain technical system for “data preprocessing-risk assessment and early warning”, creating a closed-loop workflow from raw observation data to engineering decision support. This approach addresses the issue of information loss caused by the fragmentation of traditional research processes, significantly improving the timeliness and accuracy of structural safety monitoring in mining areas. Furthermore, for critical structures like mine headframes, most existing studies treat them as rigid bodies and monitor them using only one to four stations. In contrast, this study innovatively adopts an eight-point distributed monitoring scheme, decoupling the steel structure and sheave system into independent monitoring units for the first time. Particularly, the specialized monitoring of sheave settlement and inclination represents a research gap in the existing literature, as no prior studies have applied GNSS technology to this specific application. This advancement highlights the novelty and practical significance of the study in enhancing safety monitoring for mining infrastructure. With the continuous development of GNSS technology and its gradual penetration into the field of deformation monitoring, the application of GNSS technology to achieve the whole lifecycle safety monitoring of mining shafts will become one of the key technologies for ensuring the safe operation of mining areas.
This study focuses on the Liuzhuang Mine West District in Fuyang City, Anhui Province, serving as a representative example of a deep-mine environment. The headframe of Liuzhuang Mine is influenced by the interplay of complex geological conditions and mechanical loading. Historically, there has been a lack of long-term dynamic monitoring data for this site. Through 66 days of continuous observation, this research has, for the first time, developed a spatiotemporal database documenting headframe deformation in the region, thus providing a benchmark case for risk assessment in analogous settings. The study encompasses data cleaning, three-dimensional spatiotemporal deformation analysis and visualization, risk prediction, and assessment. It investigates early warning methodologies for headframe monitoring within this mining area. This research contributes to safety inspections of the headframe and offers theoretical and methodological insights for designing construction and reinforcement strategies, as well as for the optimal layout and planning of GNSS monitoring stations.
The structure of this paper is organized as follows:
Section 1 introduces the importance of monitoring deformation in mining headframes, discusses the limitations inherent in traditional techniques, and highlights the potential of GNSS technology, while also outlining the research objectives.
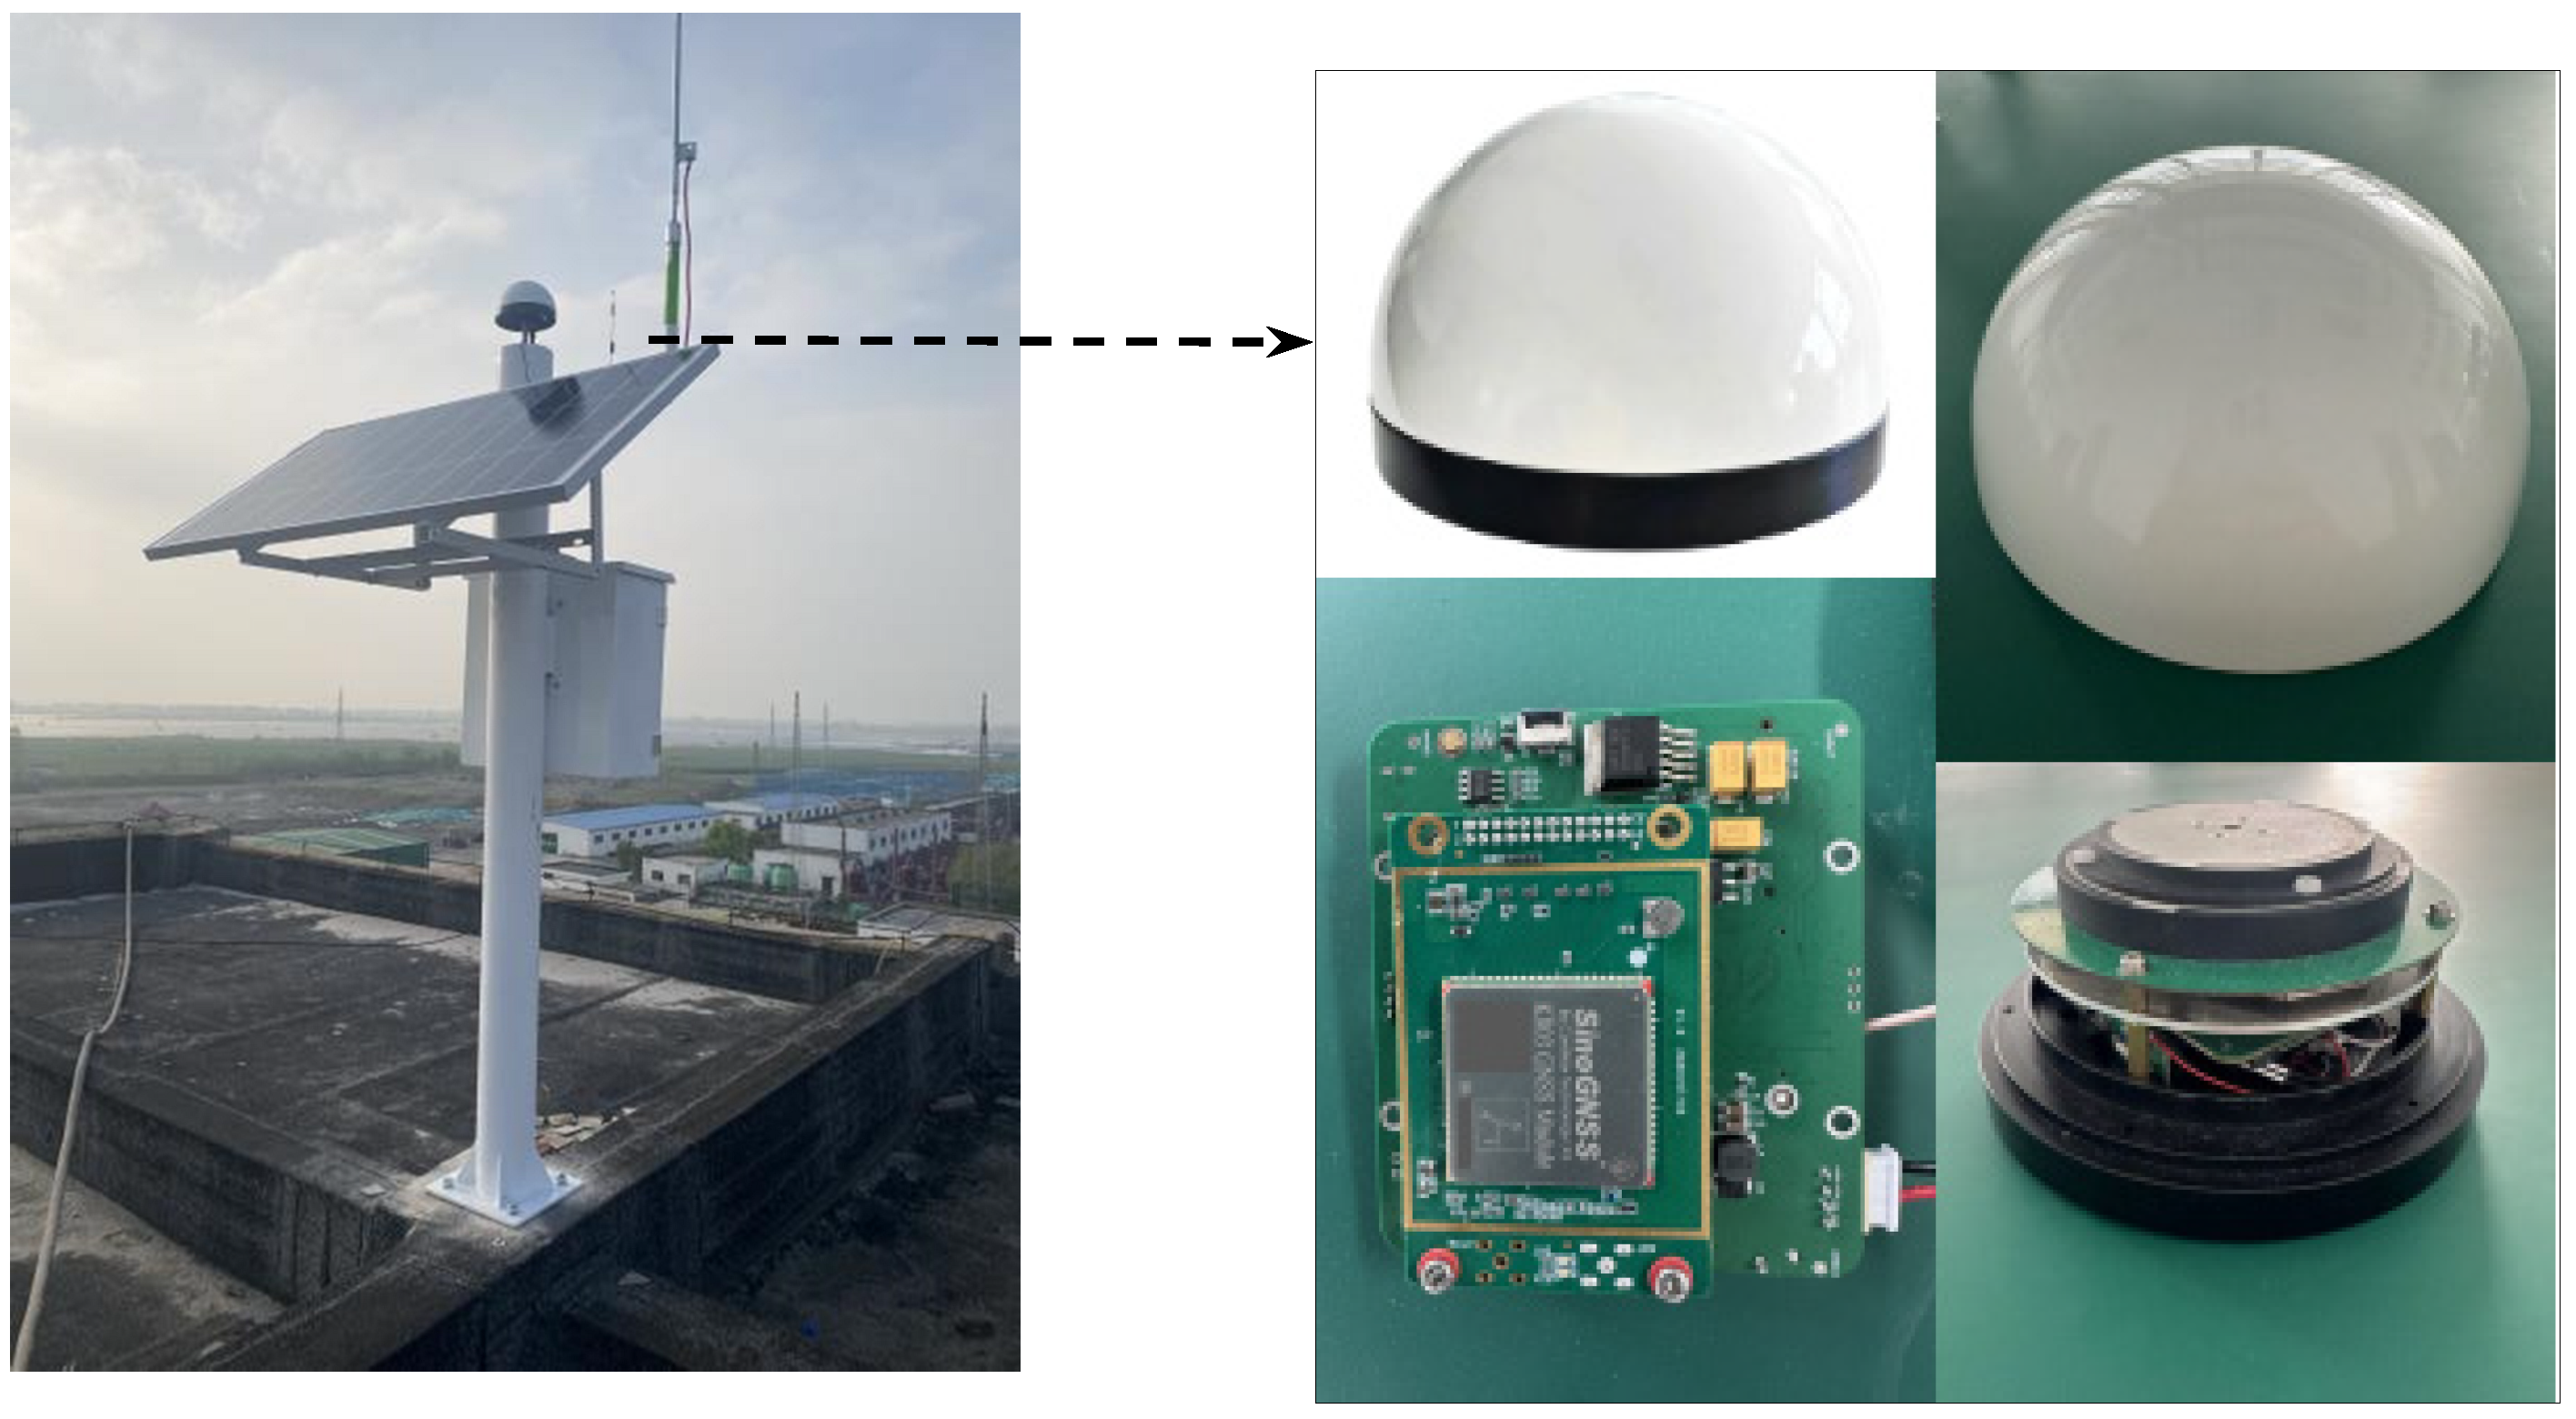
Section 2 provides a detailed description of the GNSS monitoring scheme, including the station layout and equipment installation, as well as the capabilities of the self-developed Beidou Intelligent Monitoring and Rapid Warning Platform (BIMRWP).
Section 3 elaborates on the data cleaning methodologies employed, such as cubic spline interpolation and generalized extreme studentized deviate (GESD) outlier detection, and the spatiotemporal analysis of three-dimensional deformation.
Section 4 conducts a quantitative evaluation of the primary deformation factors and safety thresholds through correlation analysis and risk assessment. Finally,
Section 5 summarizes the research findings and suggests future directions for enhancing the integration of multi-source sensor data.
3. Monitoring Data Processing and Analysis
The BIMRWP platform receives BDS/GNSS observation data and employs carrier phase differential positioning technology for real-time monitoring of the headframe. It exports the average of the solved results every 6 h (dynamic 6 h) to obtain the corresponding deformation monitoring data. However, the accuracy of the monitoring results is affected by external factors.
On the one hand, the influence comes from the headframe itself, which is a damped compound pendulum structure. During operation, it will swing regularly because of factors such as wind force, mechanical traction, and vibration disturbance from its own equipment, which are normal phenomena of the headframe’s deformation. On the other hand, the influence arises from the GNSS observation environment and measurement errors, such as missing original GNSS observation data caused by headframe shielding and large multipath effect errors [
28], ionospheric and tropospheric delays, and other measurement errors.
The monitoring data exported from the platform require preprocessing to improve the accuracy of deformation monitoring data and ensure the accuracy of subsequent risk assessments. For the deformation caused by the structure of the headframe itself, the position deformation of the headframe can be statistically accumulated as a cumulative deformation variable to eliminate the risk misjudgment caused by normal regular swings. For the errors generated by GNSS monitoring, the original monitoring data need to be cleaned.
This monitoring system has been operating since 16 April 2024. To prevent system instability in the early stage of operation, the monitoring data for the first 13 days (from 16 April 2024 to 28 April 2024) are not included in the monitoring data processing and analysis in this work. The BIMRWP platform exports continuous dynamic 6 h data for 66 days (from 29 April 2024 to 3 July 2024) from the upper and lower sheave wheel platform of the headframe at eight monitoring stations, with a total of 224 data points for each monitoring station. The first 56 days of data are used for monitoring data processing and analysis and establishing a risk assessment model. The last 10 days of data are utilized for accuracy verification of the risk assessment model.
3.1. Monitoring Data Cleaning
Monitoring data cleaning includes interpolation, outlier removal, and filtering treatments, aiming to smooth the discrete point data as much as possible for subsequent modeling studies and to conduct scientific assessments of the headframe deformation.
Interpolation of deformation data uses the values of known points to estimate the values of other points on the basis of Tobler’s hypothesis. Points closer to the estimated point contribute more, and points farther away contribute less, thus interpolating unknown points. In this study on GNSS headframe monitoring, the received signal values exhibit continuous trajectories. Cubic spline interpolation, which fits data using piecewise cubic polynomials, is chosen for its ability to accurately approximate the original data trends. This method also has a local property, meaning the interpolation results depend only on nearby data points and are not affected by distant ones. This makes it well-suited for handling local fluctuations or noise in GNSS data. Therefore, cubic spline interpolation, known for its high computational accuracy, good convergence, and smoothing effect, is adopted for interpolating data from the eight monitoring stations on the upper and lower sheaves of the headframe, which has high computational accuracy, good convergence, and a smooth effect [
29]. The basic principle is to divide the known multiple data points into n intervals, construct a cubic function for each interval, and ensure smooth connection. The implementation steps are as follows. In n intervals, the cubic function for each interval is expressed as follows:
The expression for the cubic function
S(
x) corresponding to n intervals is expressed as follows:
In the formula,
S(
x) is a cubic spline function (unit: mm), and
a,
b,
c, and
d are fitting coefficients.
Thanks to the stability of the GNSS receivers used in this project, no data loss occurred, so the interpolation algorithm was not required. However, GNSS signal reception is highly susceptible to environmental factors, which can lead to signal loss. Therefore, this study employs cubic spline interpolation as the first step in data preprocessing to ensure the integrity of the monitoring data. Although cubic spline interpolation can smooth out noise, in practical situations, various unpredictable factors will always cause a few outliers that deviate from the normal values, requiring further cleaning of outliers in the experiment. Generalized extreme studentized deviate (GESD) is used for anomaly detection, in which a threshold factor of one is set to establish a threshold analysis system for cleaning outliers to ensure high-quality control, the missing data after cleaning are supplemented by the aforementioned cubic spline interpolation method, and Gaussian filtering is used for noise reduction of the data.
GESD is a statistical method used to detect outliers in univariate datasets, particularly suitable for datasets that follow an approximate normal distribution [
30]. The calculation formula R for the test statistic of GESD is as follows:
where s the i-th observation value, is the sample mean, is the sample standard deviation, and is the sample size. The formula for calculating the critical value is as follows:
where
tp,v refers to the 100
p percentile of the
t distribution with
v degrees of freedom, and
refers to the
percentile of the chi-squared distribution with
v degrees of freedom, where
is the significance level. Using Formulas (4) and (5), outliers in the dataset can be identified and subjected to outlier data cleaning.
In terms of filtering and smoothing, this study selects Gaussian filtering for GNSS signal filtering. It aims to address Gaussian noise (also known as normal noise) in signals. As a common random noise, it is mainly caused by internal and external monitoring system factors. Internally, Gaussian noise often arises from receiver electronic component thermal motion, random noise in multipath effects, and internal receiver electronic noise (e.g., quantization noise, amplifier noise). Externally, atmospheric and ionospheric interference also contain Gaussian noise components. Gaussian filtering mitigates the impact of such noise. A Gaussian filter is a type of linear smoothing filter commonly used in image processing for smoothing and denoising operations. Its basic principle involves constructing a weight matrix using the Gaussian function and then performing a convolution operation on the image with this matrix to achieve a smoothing effect [
31]. In practical applications, the core of the Gaussian filter is the Gaussian function, which is a widely used probability distribution function characterized by a bell-shaped curve. The expression for the Gaussian function is as follows:
where
f (x,y) is the value of the Gaussian function on a two-dimensional plane, and
is the standard deviation of the Gaussian function, which determines the degree of smoothing of the filter. The Gaussian function peaks at the center point, with its value gradually decreasing as the distance from the center point increases. Specifically, the weight of the central pixel is the greatest, and the weights of the surrounding pixels gradually decrease. The deformation curves of some sites after the continuous 56-day monitoring data are cleaned are shown in
Figure 4.
From the results of the deformation curves, the data cleaning process conducted in this work is effective for all monitoring stations, eliminating abnormal data and effectively smoothing the monitoring data, especially at the lower sheave wheel monitoring station, where the cleaning effect is particularly noticeable.
3.2. 3D Deformation Spatiotemporal Analysis
3.2.1. Analysis of Deformation Size and Spatial Variation
For visualizing and analyzing the deformation (ΔX, ΔY, ΔH) of the eight GNSS monitoring stations for headframe monitoring, preliminary modeling of their 3D deformation data is vital. With the preprocessed data, the Origin2024 software is used to plot the 3D coordinate deformation of the upper and lower sheave wheels and the platform monitoring stations and to assess the displacement and settlement conditions on the basis of their overall deformation fluctuation images.
Figure 5 shows the 3D deformation surface plot of some monitoring stations.
The above deformation surface and statistical data demonstrate that for the four monitoring points, 90% of the deformation quantities in (ΔX, ΔY, ΔH) positions do not exceed 15 mm, with most concentrations between ±8 mm, and are considered minor deformations. Closer examination indicates that the deformation surfaces of the monitoring points around the headframe, JC01 and JC03, are relatively flat, with small and uniform deformations. By contrast, the deformation surfaces at the sheave wheel positions, STL-L and XTL-L, exhibit larger fluctuations and concentrated peaks, indicating a slightly more intense degree of deformation. The main reason is that the monitoring stations closer to the sheave wheels are more severely affected by the obstruction of the headframe, thereby reducing the monitoring accuracy. To address this issue, the project team extended the receiver at the XTL-L point on the lower sheave platform by welding steel bars, thereby avoiding signal obstruction at the source.
3.2.2. Spatiotemporal Data Model
Given the changes in deformation data over time and space, the use of spatiotemporal big data models for a thorough analysis of deformation patterns is particularly considered. Taking into account cost, data redundancy, and intuitiveness, this work employs the base state with amendments model [
32] to process the aforementioned monitoring data. According to the theory of the baseline correction model, when analyzing the change characteristics of time–series data relative to a specified reference point, it is only necessary to store the positional information of that reference point and the relative positional changes of other points with respect to it. This approach eliminates the need to store complete positional data for all other points. Thanks to the flexibility in selecting baseline data points, the model also allows for the autonomous choice of different starting points, enabling the observation of motion trajectories relative to comparison points over subsequent time periods. This highlights the spatiotemporal visualization capabilities of deformation monitoring.
A model is established to quantitatively study the displacement of each monitoring station relative to the base state data (assuming that the position does not change and setting the first epoch data received after installation on 16 April 2024 as the base state), that is, the amendment term, and to visually analyze the degree of headframe deformation on the basis of the clustering property of the amendment term.
Figure 6 shows the base state with amendments plots of some monitoring stations drawn using Statistical Package for the Social Sciences (SPSS) software (version 27). The positions labeled with the serial number “GS” are the base state, and the rest of the points in different colors represent the monitoring quantities of different epochs.
The results of the spatiotemporal modeling of the deformation data over 56 consecutive days indicate that the deformation of the headframe’s surrounding points, JC01 and JC03, is concentrated near the base state, with a greater clustering property for the planar displacement quantities (ΔX, ΔY). The displacements are roughly in the same direction, not exceeding ±6 mm. Their settlement quantity ΔH exhibits symmetry about the base state, with the maximum settlement being around ±8 mm. By contrast, the deformation of the monitoring stations near the sheave wheels, STL-L and XTL-L, is more pronounced than that of the first two monitoring stations. Relative to the base state, the distribution of the correction terms is more dispersed, and the deformation regarding the settlement quantity ΔH is more significant, with most being around ±10 mm.
5. Conclusions
This study, conducted at the Liuzhuang Mine in Anhui Province, developed a comprehensive technical framework encompassing “data preprocessing, risk assessment, and early warning”, effectively addressing the fragmentation in data collection, processing, and decision-support workflows within the context of safety monitoring for mine shaft frames. Through on-site evaluations of the Liuzhuang Mine shaft frame, a distributed monitoring network was implemented, comprising one reference station and eight monitoring stations strategically positioned in stable regions and critical points around the frame. This implementation successfully achieved, for the first time, the decoupled monitoring of the shaft frame and the sheave system, thereby bridging a technical gap in specialized GNSS monitoring. Utilizing nearly two months of 3D deformation monitoring data gathered using the “BeiDou + Geological Disaster Cloud Platform”, processes such as data cleaning, spatiotemporal big data modeling, and mathematical statistical analysis were conducted. This facilitated the development of a correlation model that links height, sheave distance, and deformation volume, and confirmed the reliability of risk threshold estimation.
The study further proposed a multi-source data fusion framework predicated on the BIMRWP platform, which integrates inertial navigation, temperature-compensated sensors, and deep learning algorithms. This integration markedly enhanced millimeter-level accuracy and adaptability to complex environments at monitoring points. Building upon this foundation, a three-dimensional visualization early-warning model was developed utilizing an air–ground–space collaborative monitoring network, thereby providing an extensible technical solution for mines situated in diverse geological conditions. Future research endeavors will concentrate on the dynamic response characteristics of GNSS monitoring systems under seismic conditions, in conjunction with numerical simulations to analyze damage evolution mechanisms. Using localized parameter calibration and dynamic optimization algorithms, the study aspires to transition mine structural safety monitoring from generalized models to precise early-warning paradigms, thereby offering standardized technical frameworks and references for engineering practices in global mining operations.


 ,
, 


