Article

PBD-YOLO: Dual-Strategy Integration of Multi-Scale Feature Fusion and Weak Texture Enhancement for Lightweight Particleboard Surface Defect Detection

1
Research Institute of Wood Industry, Chinese Academy of Forestry, Beijing 100091, China
2
School of Instrumentation Science and Engineering, Harbin Institute of Technology, Harbin 150006, China
3
Shenzhen Institutes of Advanced Technology, Chinese Academy of Sciences, Shenzhen 518055, China
4
School of Technology, Beijing Forestry University, Beijing 100083, China
*
Author to whom correspondence should be addressed.
Appl. Sci. 2025, 15(8), 4343; https://doi.org/10.3390/app15084343
Submission received: 7 March 2025 / Revised: 11 April 2025 / Accepted: 12 April 2025 / Published: 15 April 2025

Abstract

:
Surface defect detection plays an important role in particleboard quality control. But it still faces challenges in detecting coexisting multi-scale defects and weak texture defects. To address these issues, this study proposed PBD-YOLO (Particleboard Defect-You Only Look Once), a lightweight YOLO-based algorithm with multi-scale feature fusion and weak texture enhancement capabilities. In order to improve the ability of the algorithm to extract weak texture features, the SPDDEConv (Space to Depth and Difference Enhance Convolution) module was introduced in this study, which reduced the loss of information in the down-sampling process through space-to-depth transformation and enhanced the edge information of weak texture defects through difference convolution. This approach improved the mAP (mean average precision) of weakly featured but edge-sensitive defects (such as scratches) by as much as 20.9%. In order to improve the algorithm’s ability to detect multi-scale defects, this study introduced the ShareSepHead (Share Separated Head) and C2f_SAC (C2f module with Switchable Atrous Convolution) modules. ShareSepHead fused feature maps from different scales of the neck network by adding a convolutional layer with shared weights, and the C2f_SAC module adaptively fused multi-rate receptive fields through a switching mechanism. The synergistic effect of ShareSepHead and C2f_SAC improved the detection accuracy of multi-scale defects by 10.6–20.8%. The experimental results demonstrated that PBD-YOLO achieved 85.6% mAP at 50% intersection over union (IoU) and 81.4% recall, surpassing YOLOv10 by 5.5% and 13%, respectively, while reducing parameters by 11.3%. In summary, it could be better to meet the need of accurately detecting surface defects on particleboard.

1. Introduction and Literature Review

Particleboard serves as the primary foundation material for customized furniture. With the growing demand in the customized furniture market, the need for particleboard is also increasing [1,2]. As production increases, the current reliance on subjective observation for detecting the appearance quality of particleboard is no longer sufficient to meet production demands [3]. It is essential to explore a more accurate, objective, and efficient detection method to replace manual detection. The integration of machine vision and deep learning has led to the development of object detection technology [4,5,6,7,8], which enables intelligent and automated assessment of the particleboard appearance quality.
In the field of particleboard surface defect detection, YOLO algorithms have gained significant research attention [9,10]. In 2021, Zhao et al. [11] proposed an improved YOLOv5-based object detection algorithm, PB-YOLOv5, which was capable of detecting five defect types (big shavings, sand leakage, glue spot, soft, and oil pollution) on particleboard surfaces. This study is devoted to the lightweight and real-time performance of the algorithm. The mean average precision (mAP) was improved by 2.3% compared to the original YOLOv5 algorithm. In 2023, Wang et al. [12] proposed a lightweight object detection algorithm called Lite-YOLOv5s, which was based on an improved version of YOLOv5s. This algorithm effectively detected four kinds of surface defects on particleboard: shavings, glue spots, oil stains and dust spots, and core leakage. To achieve this, the study incorporated a ghost bottleneck module to reduce the model’s scale of parameters and a coordinate attention (CA) module to enhance the network’s capability to concentrate on the location of defects within the backbone. As a result, Lite-YOLOv5s remarkably reduced the scale of parameters by 63.5% compared to the original algorithm. However, this unilateral emphasis on lightweight architecture led to a slight decrease in mAP by 1.3%. In 2023, Wang et al. [13] proposed an improved convolutional block attention module (CBAM) for the overfitting problem caused by the small samples. They applied it to capsule networks to realize the classification of five defects, and the accuracy rate was increased by 10% compared to the baseline of 95.6%. In 2024, Cha et al. [14] proposed an improved YOLOv5s small defect detection algorithm, YOLOv5s-ATG, in response to the poor accuracy of the current particleboard defect detection on small objects, which improved the mAP by 4.6% compared to the original YOLOv5s algorithm. Guan et al. [15] introduced the MobileViT [16] module into the YOLOv5s network, combining the CA module to optimize the detection head and the focal loss function to improve the model’s capability to recognize defects with complex scale variations as well as the defects of small objects.
Despite the findings of the studies mentioned, there are still several limitations to consider:
(1)
Existing improvement schemes based on YOLO primarily emphasize making the model lightweight or optimizing a single scale, which is unsatisfactory for detecting multi-scale defects that co-occur. When multi-scale defects coexist within a single scene, such as large oil pollution and small shavings, conventional feature fusion methods tend to dilute the features of smaller objects within the deep network [17,18]. This dilution can lead to missed detections.
(2)
The texture features of weak scratch defects are rarely detected. More attention tends to be directed toward defects with strong significance and notable grayscale, such as glue spots, shavings, and oil stains. This focus can be attributed to the shortcomings of existing methods, which lack an effective mechanism for enhancing edge features. The conventional convolutional operations within deep networks have a limited capacity to preserve the edge information [19,20], leading to reduced confidence in detecting defects with weaker features.
In summary, to address the specific requirements for surface defect detection in particleboard, this study proposes the PBD-YOLO algorithm, which integrates multi-scale feature fusion and weak texture enhancement. The main contributions of this paper are as follows:
(1)
Based on the YOLOv10 algorithm architecture, an improved algorithm, PBD-YOLO, is proposed for particleboard surface defect detection. PBD-YOLO improves the mAP and the recall while guaranteeing the original network’s real-time performance.
(2)
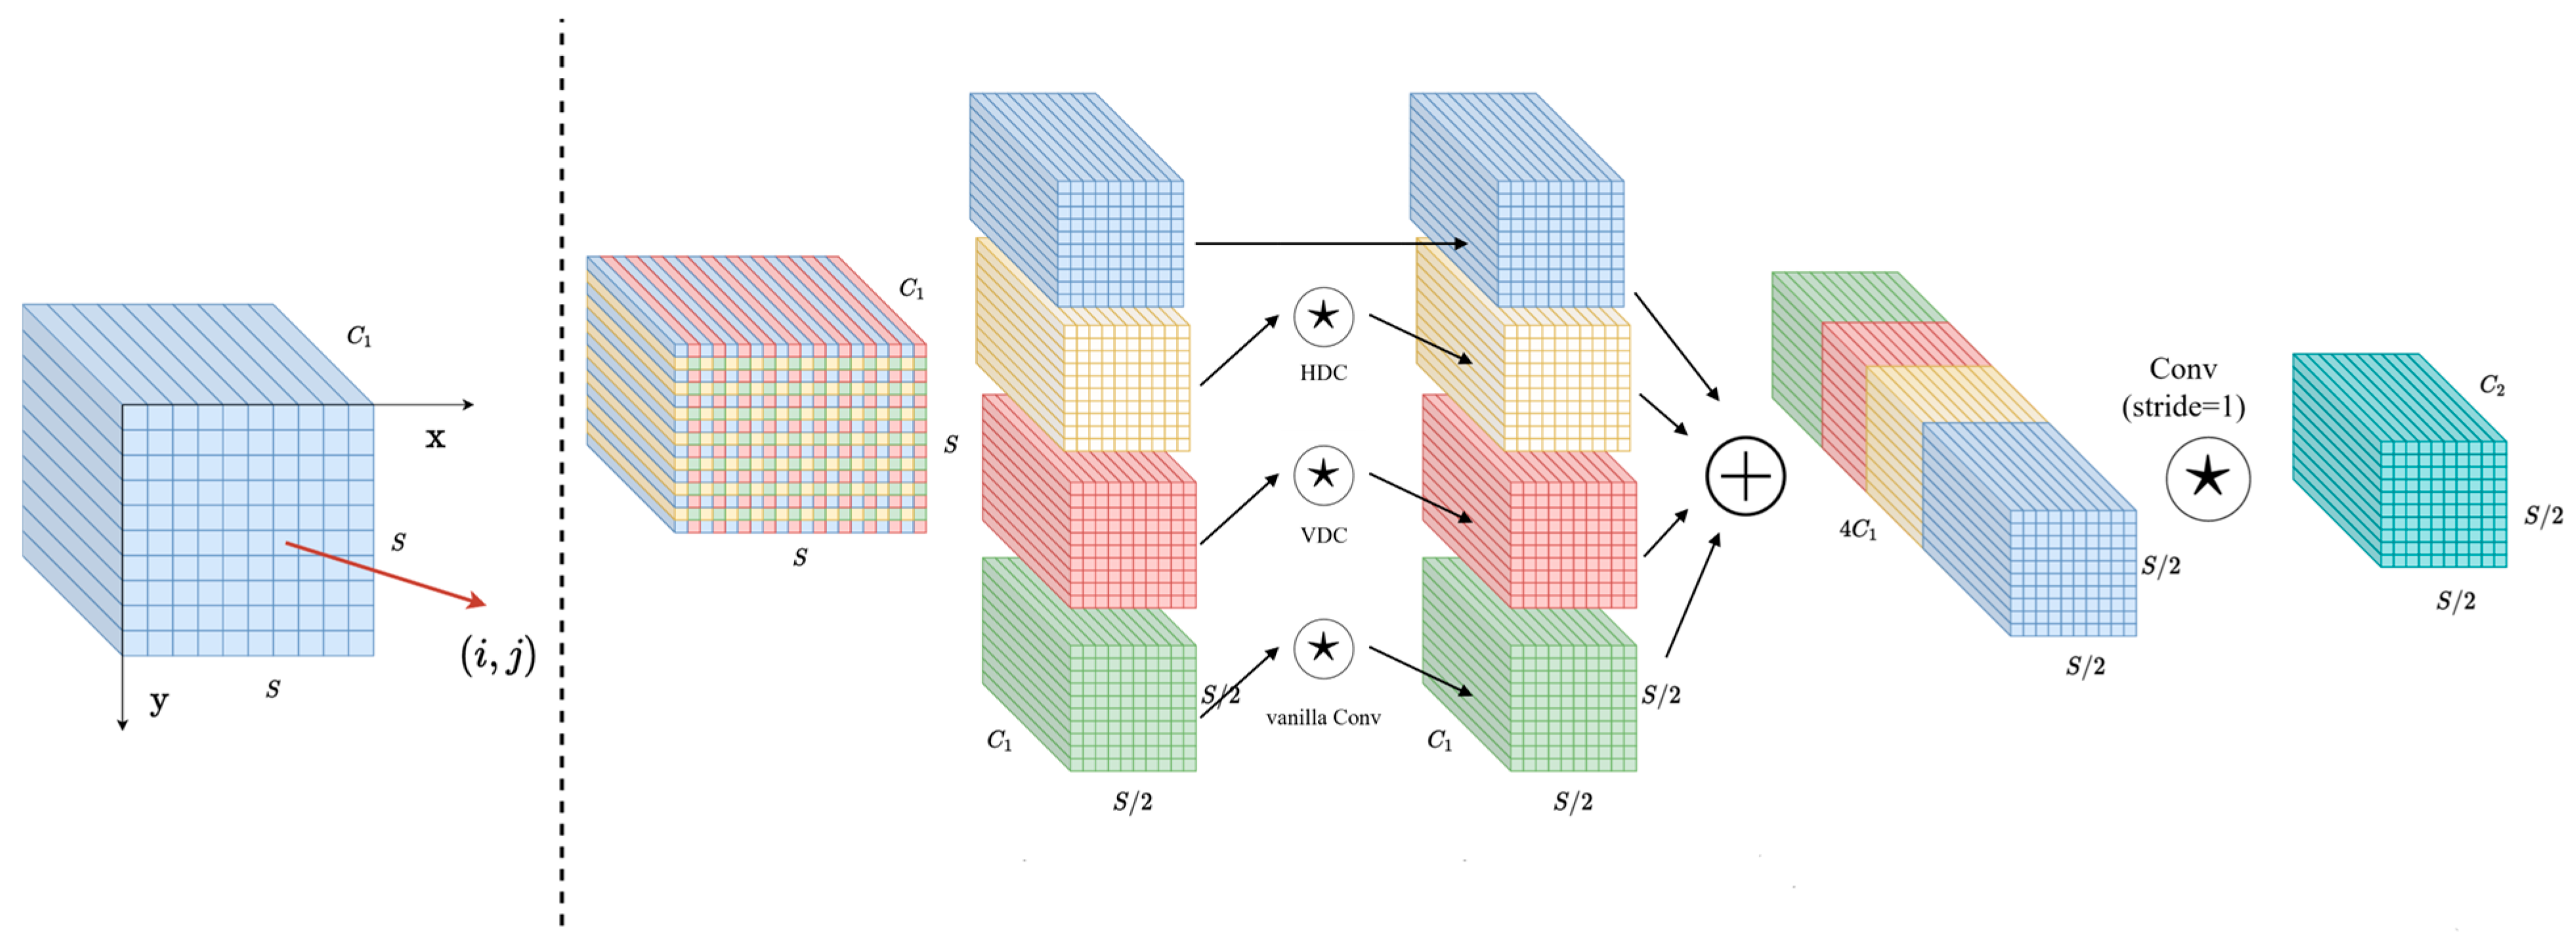
The PBD-YOLO algorithm introduces the Space to Depth and Difference Enhance Convolution (SPDDEConv) module, which utilizes spatial partitioning, multi-branch difference convolution, and a channel fusion strategy [21,22]. This approach aims to retain more information during the down-sampling process and sharply enhance the edge texture characteristics of defects on the surface of particleboard. As a result, it improves the model’s ability to detect defects, particularly those with weak features.
(3)
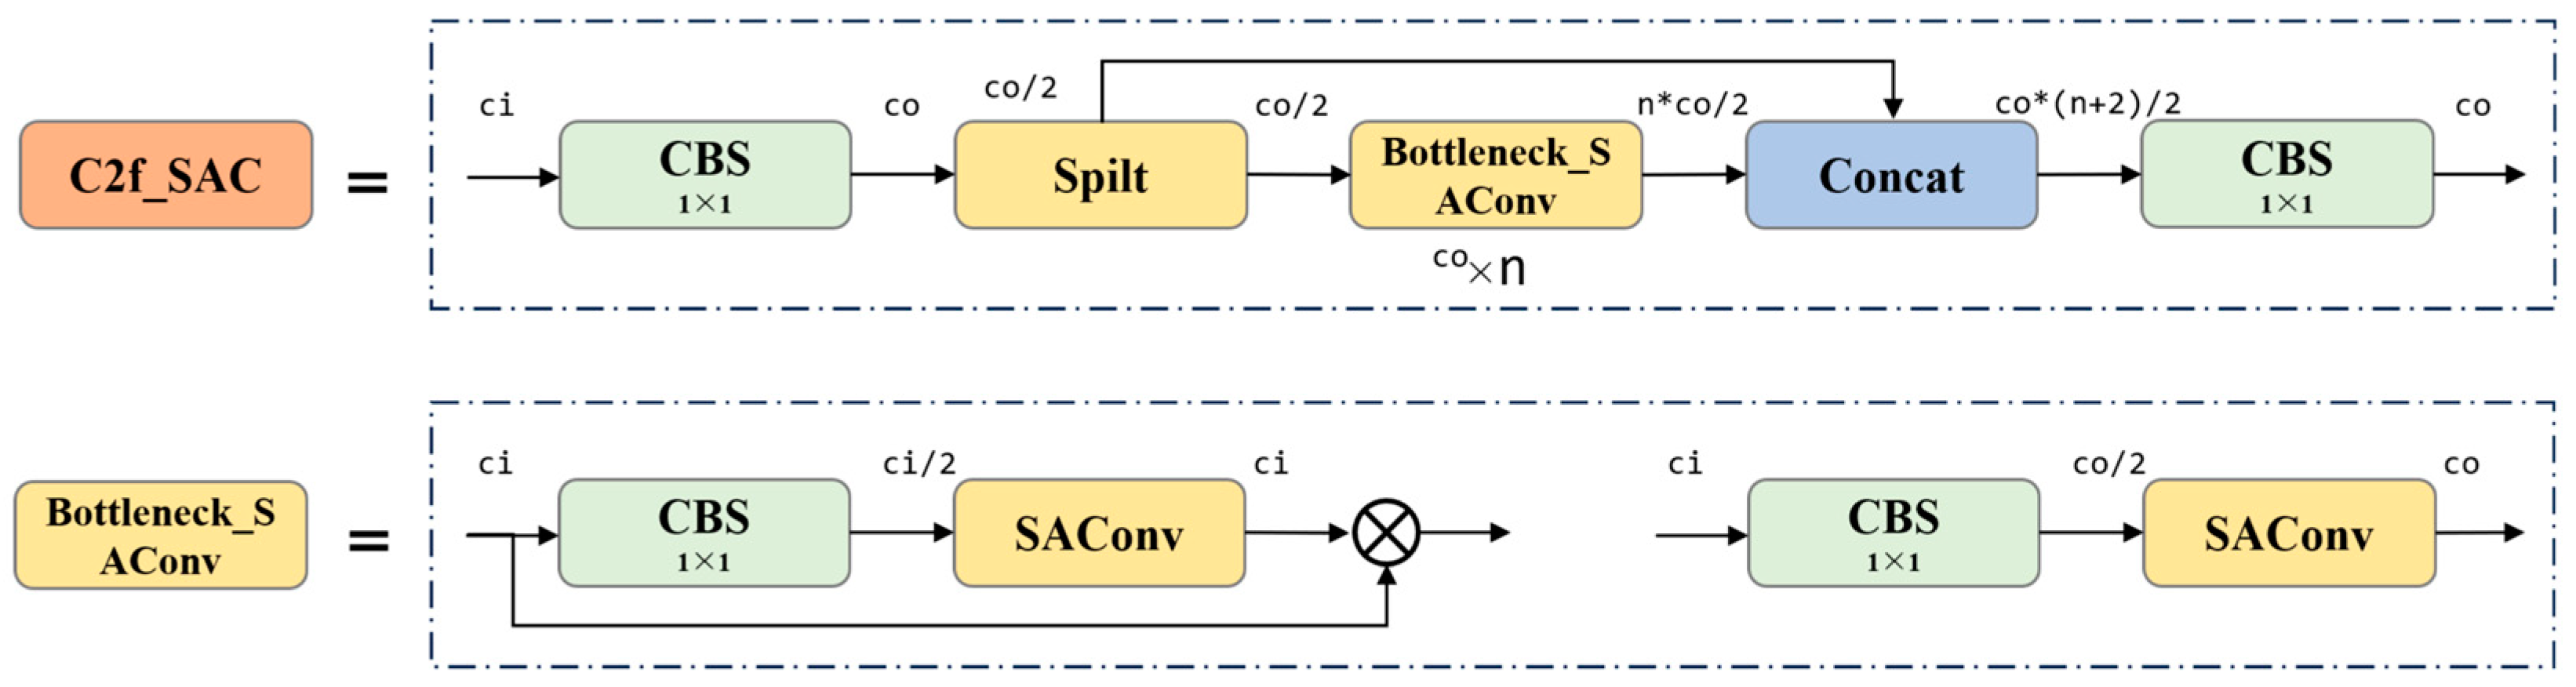
The PBD-YOLO algorithm also introduces the Switchable Atrous Convolution (SAC) within the C2f feature extraction module. SAC looks twice at the input features with different atrous rates, and the outputs are combined via switches. Additionally, the ShareSepHead module is designed to merge feature maps of varying sizes from the neck by sharing weights. This design enhances the model’s adaptability to multi-scale defects on the particleboard surface and improves its robustness when simultaneously detecting multiple targets of different scales.

2. Materials and Methods

2.1. Materials

The raw sanded particleboard, produced by Tangxian Huiyin Wood Industry Co., Ltd. in Hebei Province, Baoding, China, had a size of 1220 mm × 2440 mm, a density of 655 kg/m3, a thickness of 18 mm, and a moisture content of 8%.

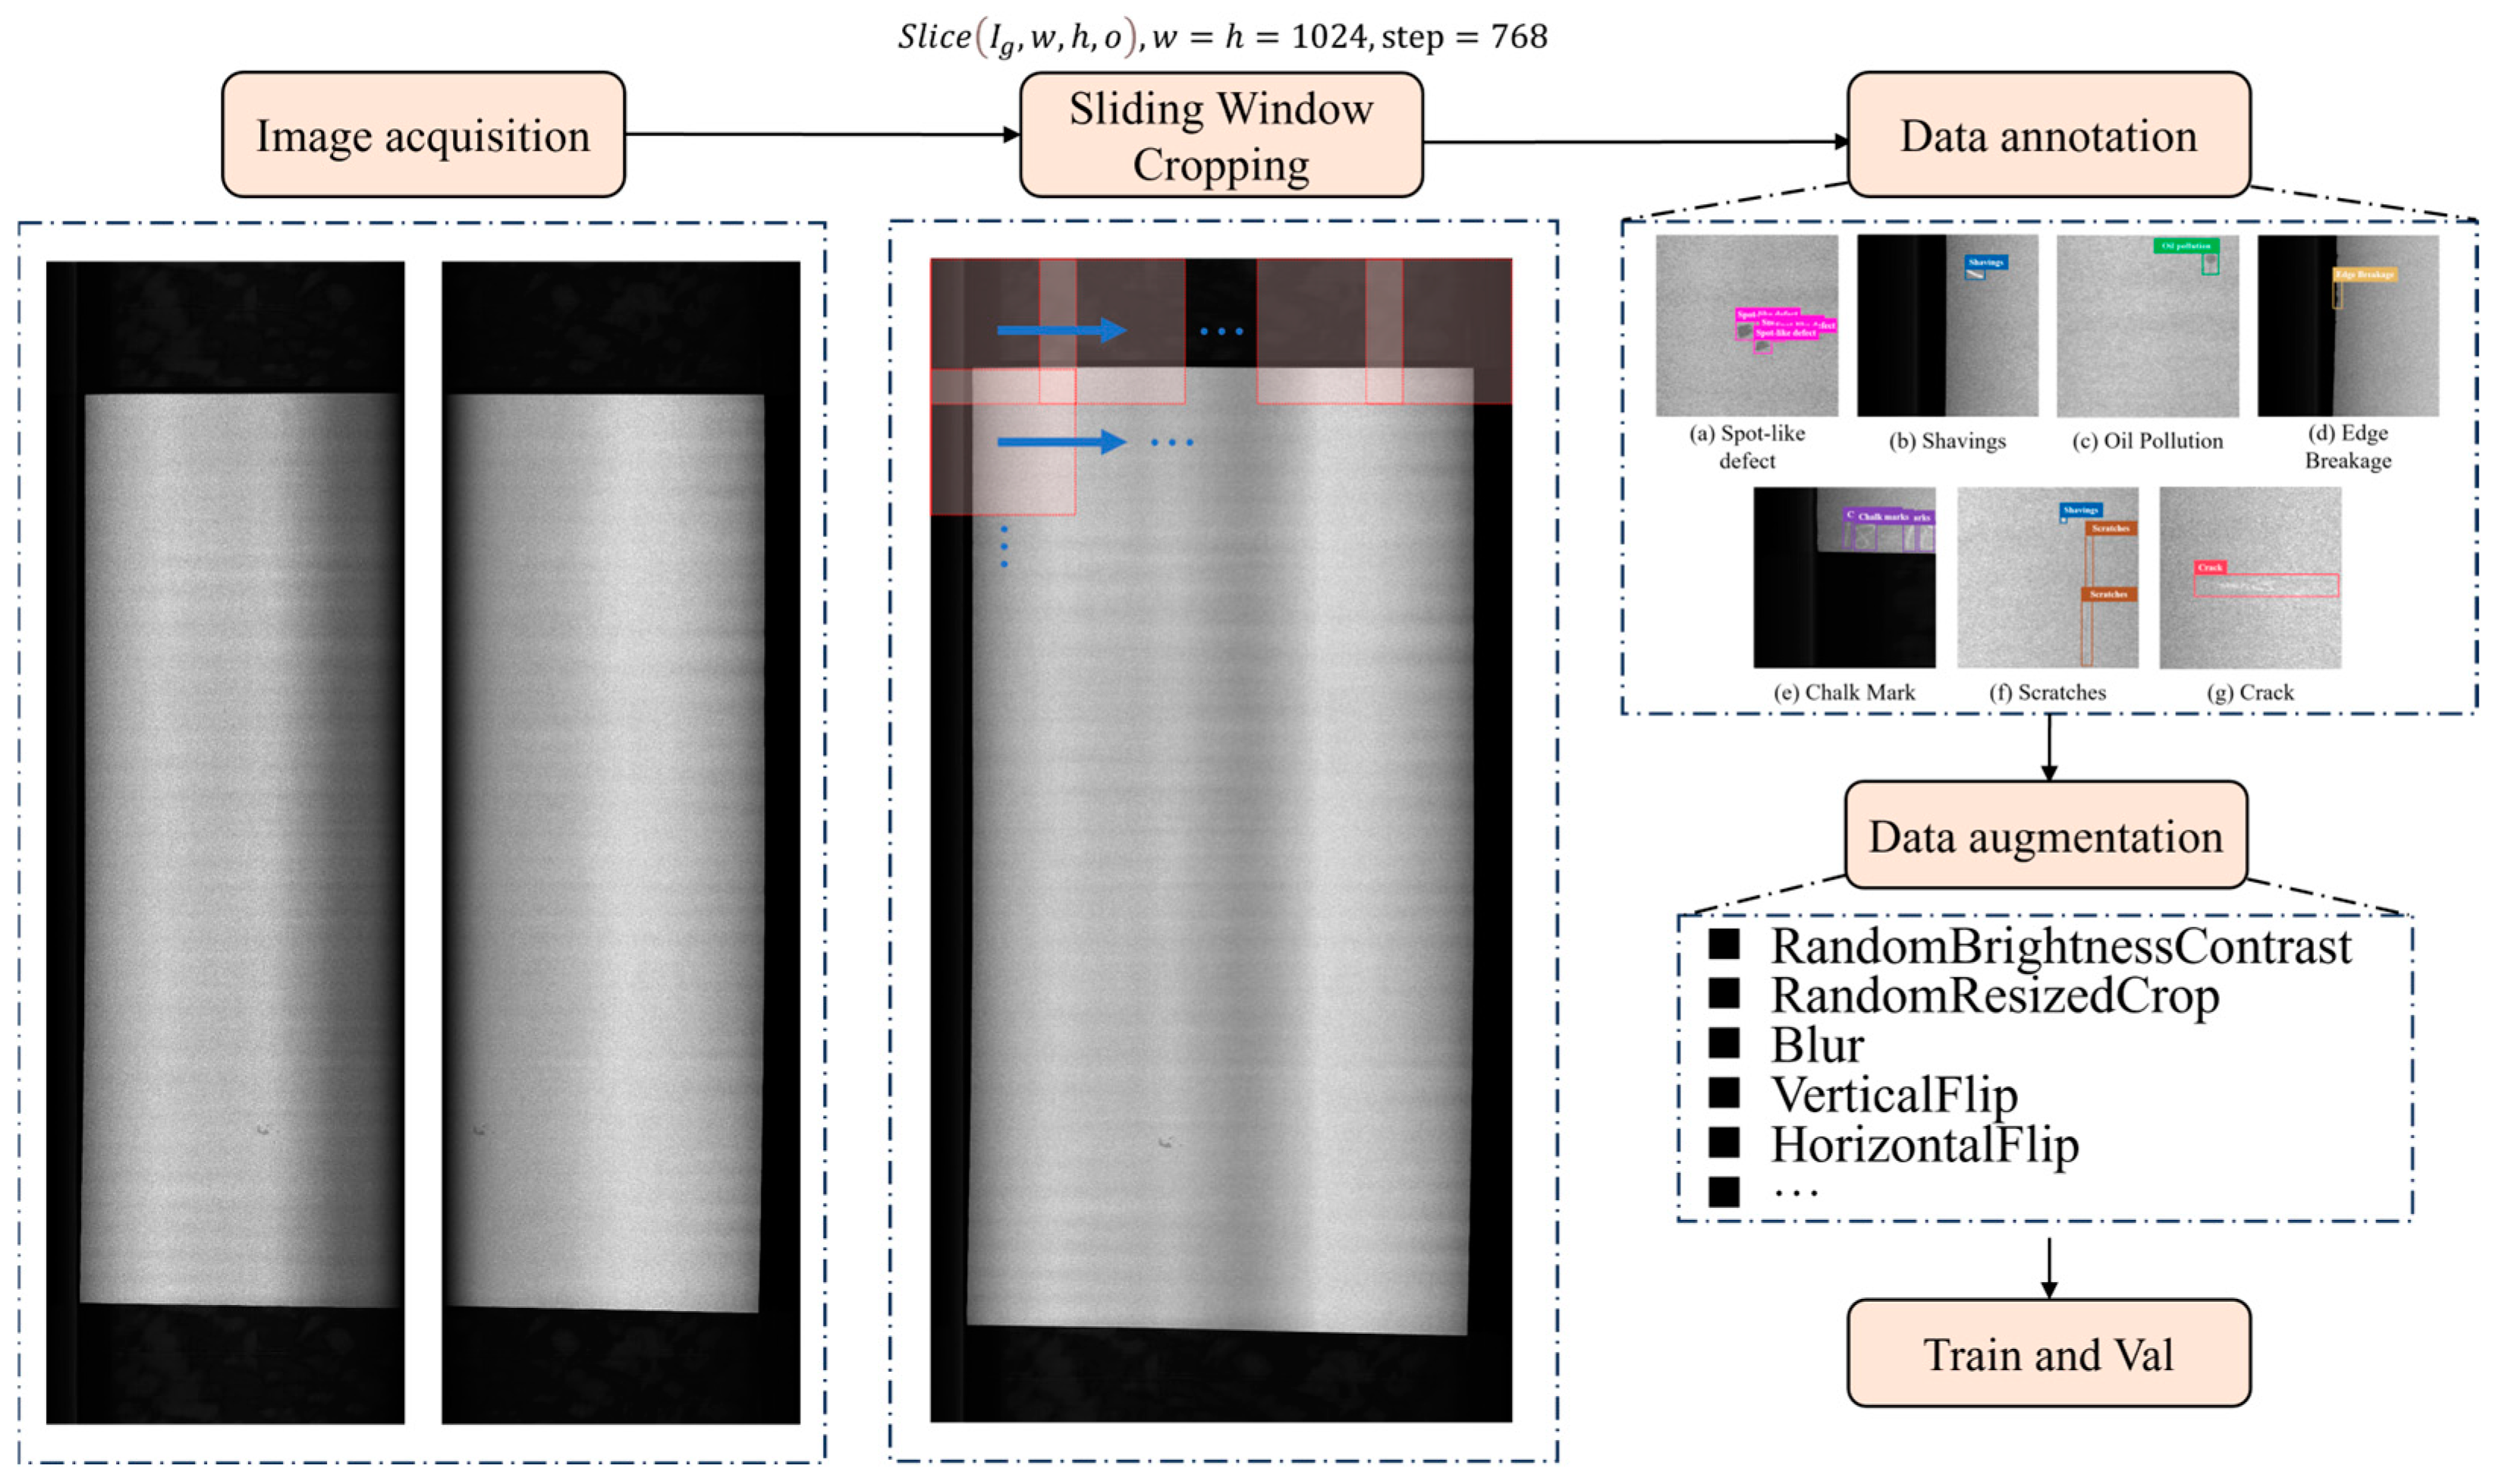
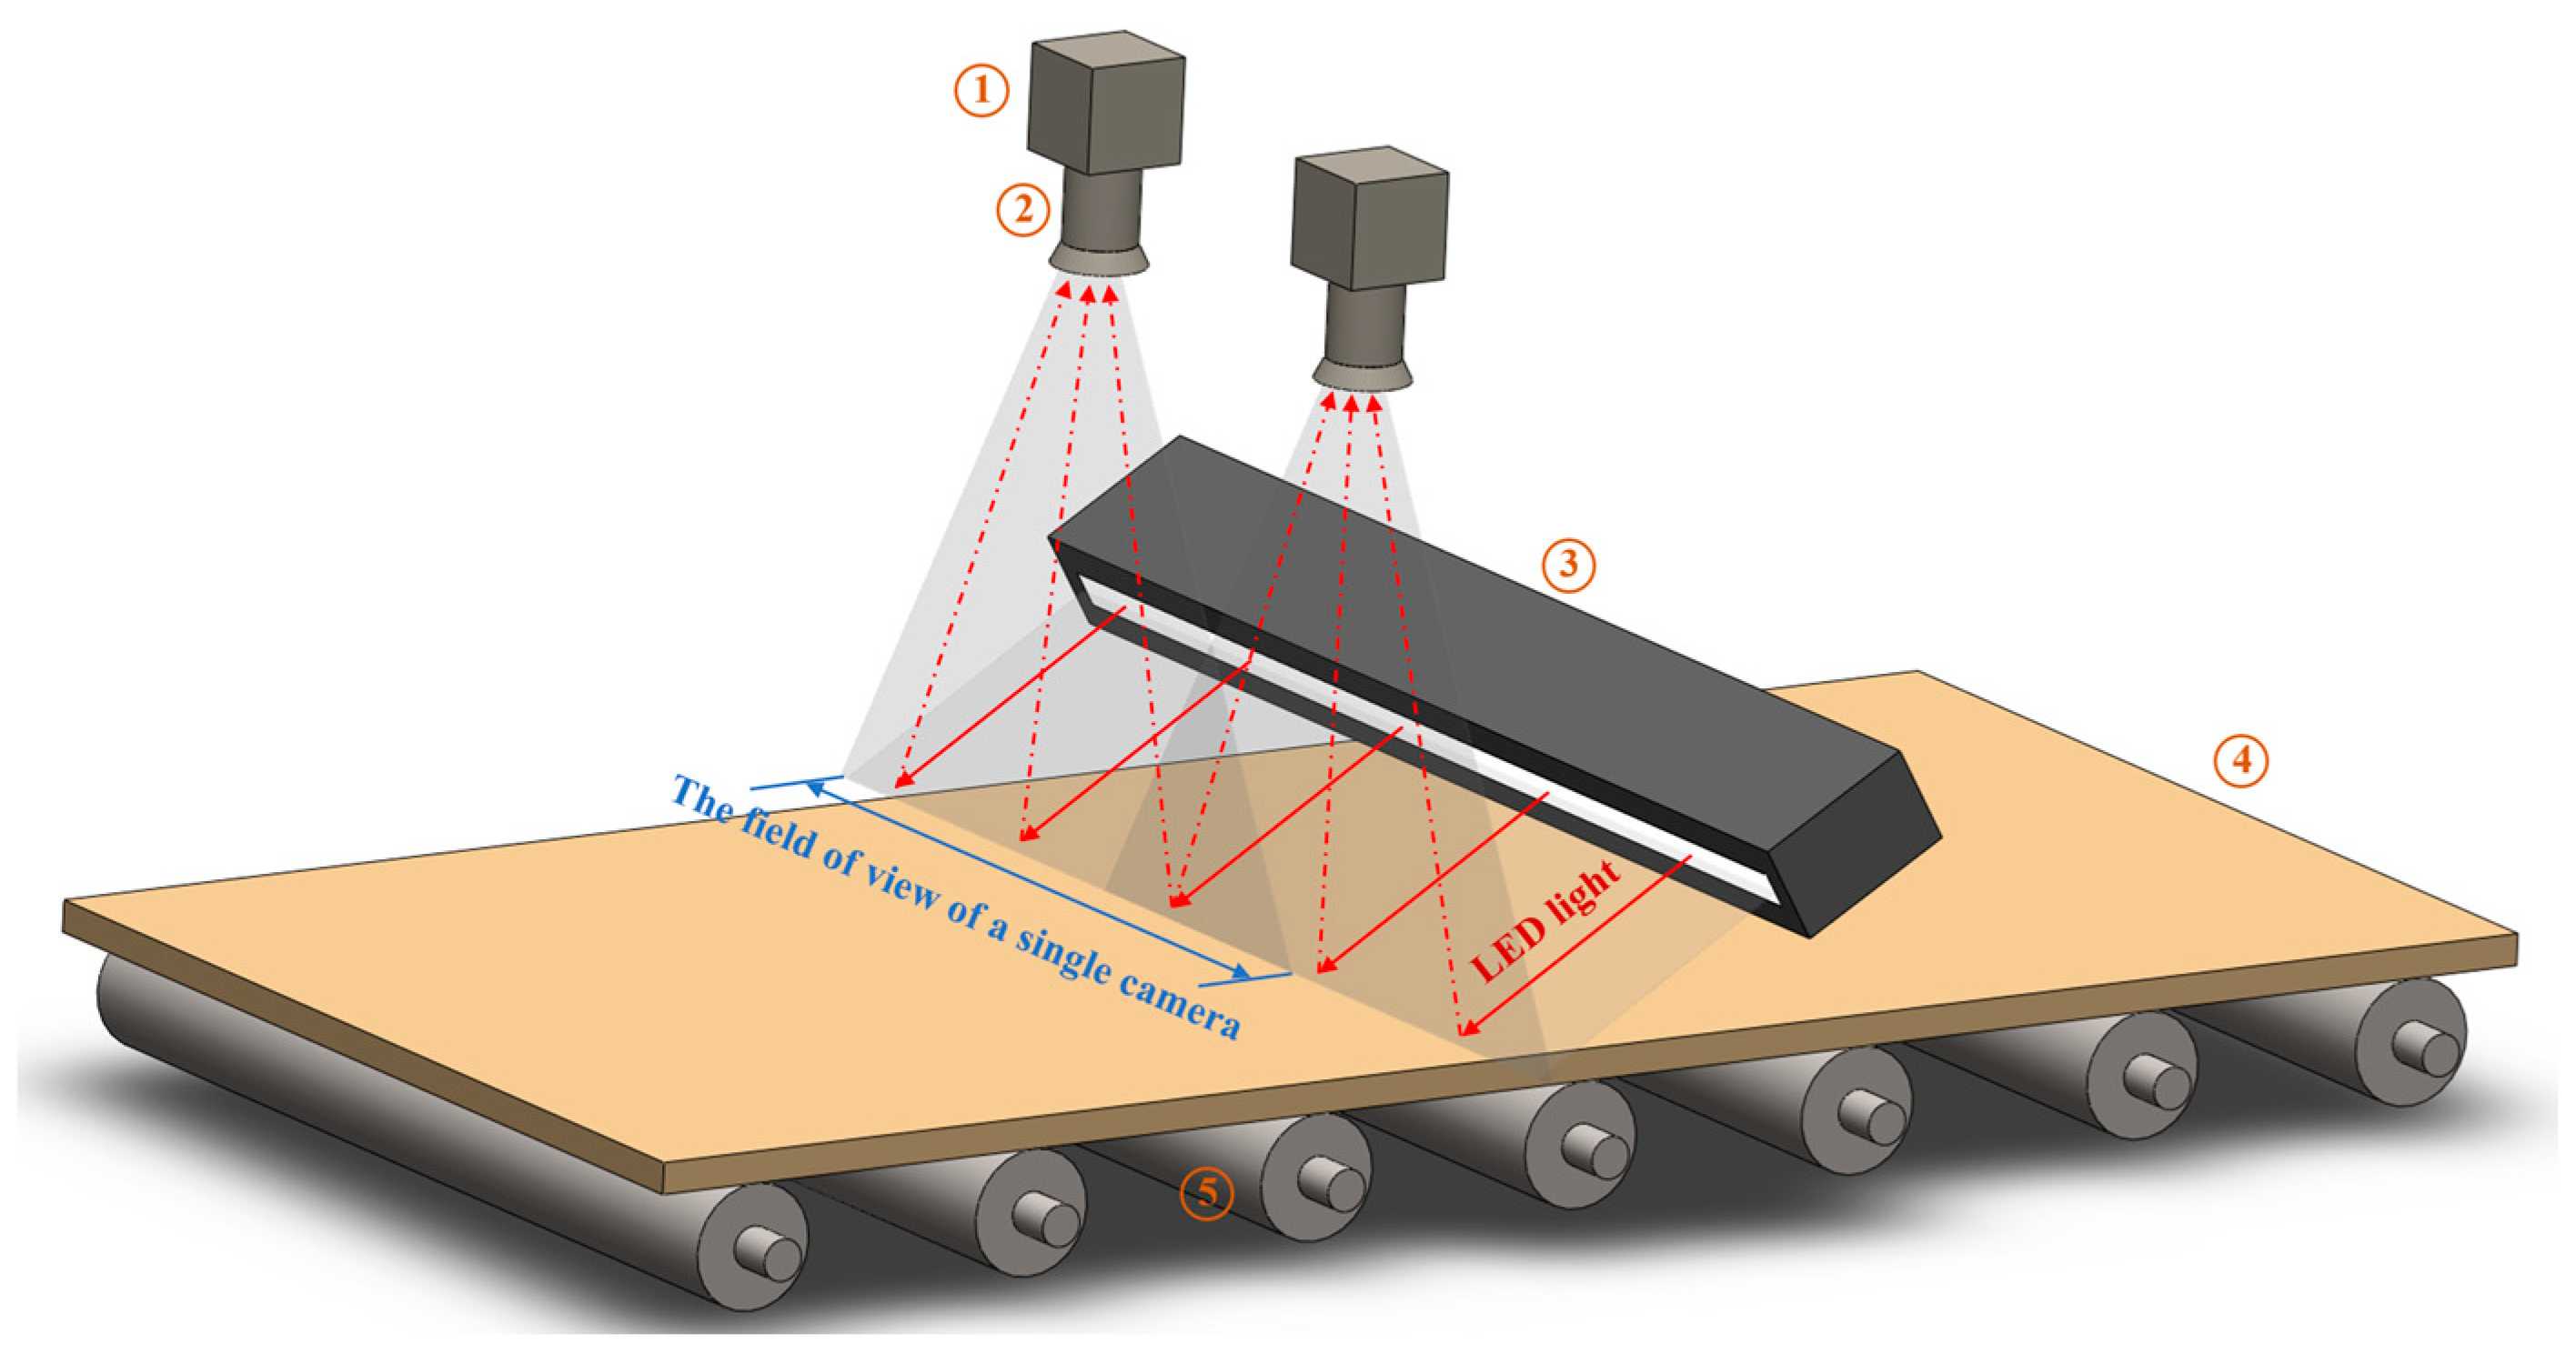
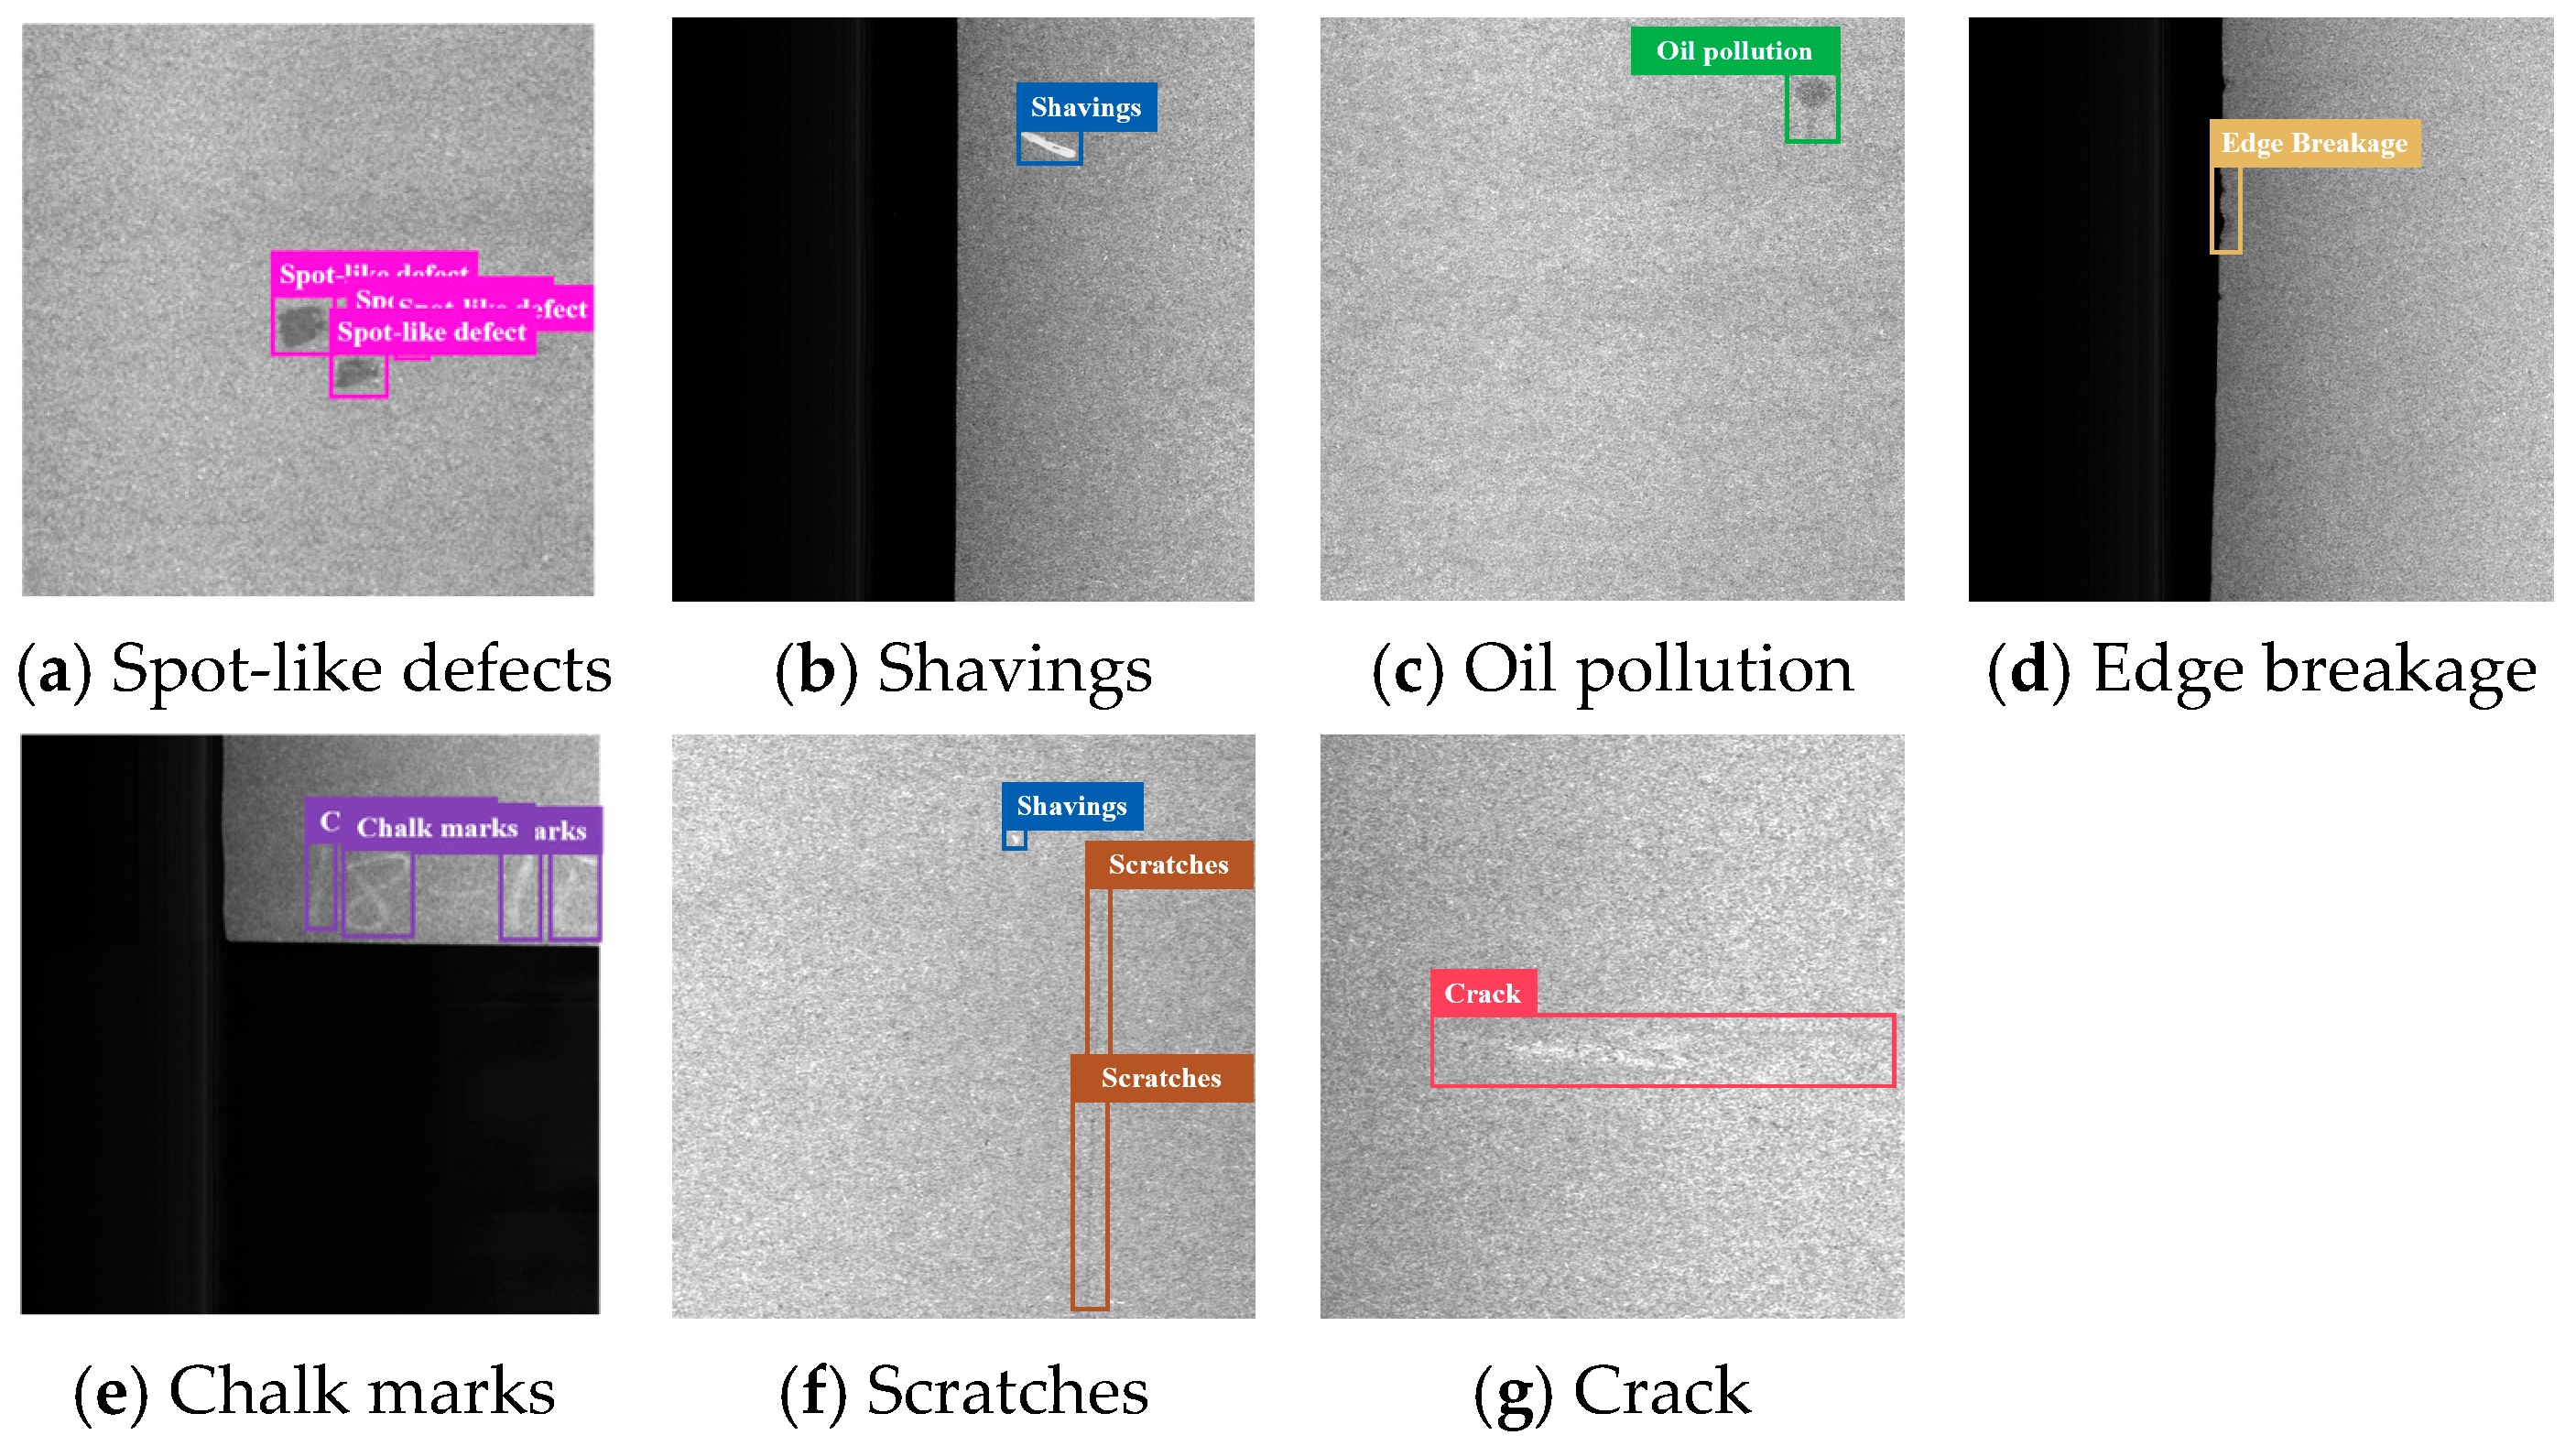
2.2. Image Acquisition and Procession

The dataset construction process in this study was divided into four steps: image acquisition, sliding window cropping, data annotation, and data augmentation, as depicted in Figure 1. Using the image acquisition system depicted in Figure 2, full-frame surface images of the particleboard were acquired at a resolution of 8192   p i x e l s × 4096   p i x e l s .
In order to preserve small target details and meet the input requirements of mainstream artificial neural networks (ANNs), this paper employed a sliding window cropping approach to process the full-frame particleboard surface images [23]. A sliding window of 1024   p i x e l s × 1024   p i x e l s extracted sub-images from the original image, starting from the top-left corner of the image. To prevent detection omissions, the step size of the window movement was set to 768 pixels.
The image dataset established in this study contained 1900 images, which were categorized and annotated into 7 types of defects, including spot-like defects, shavings, oil pollution, edge breakage, chalk marks, scratches, and cracks, as displayed in Figure 3. The annotations followed the YOLO standard format.

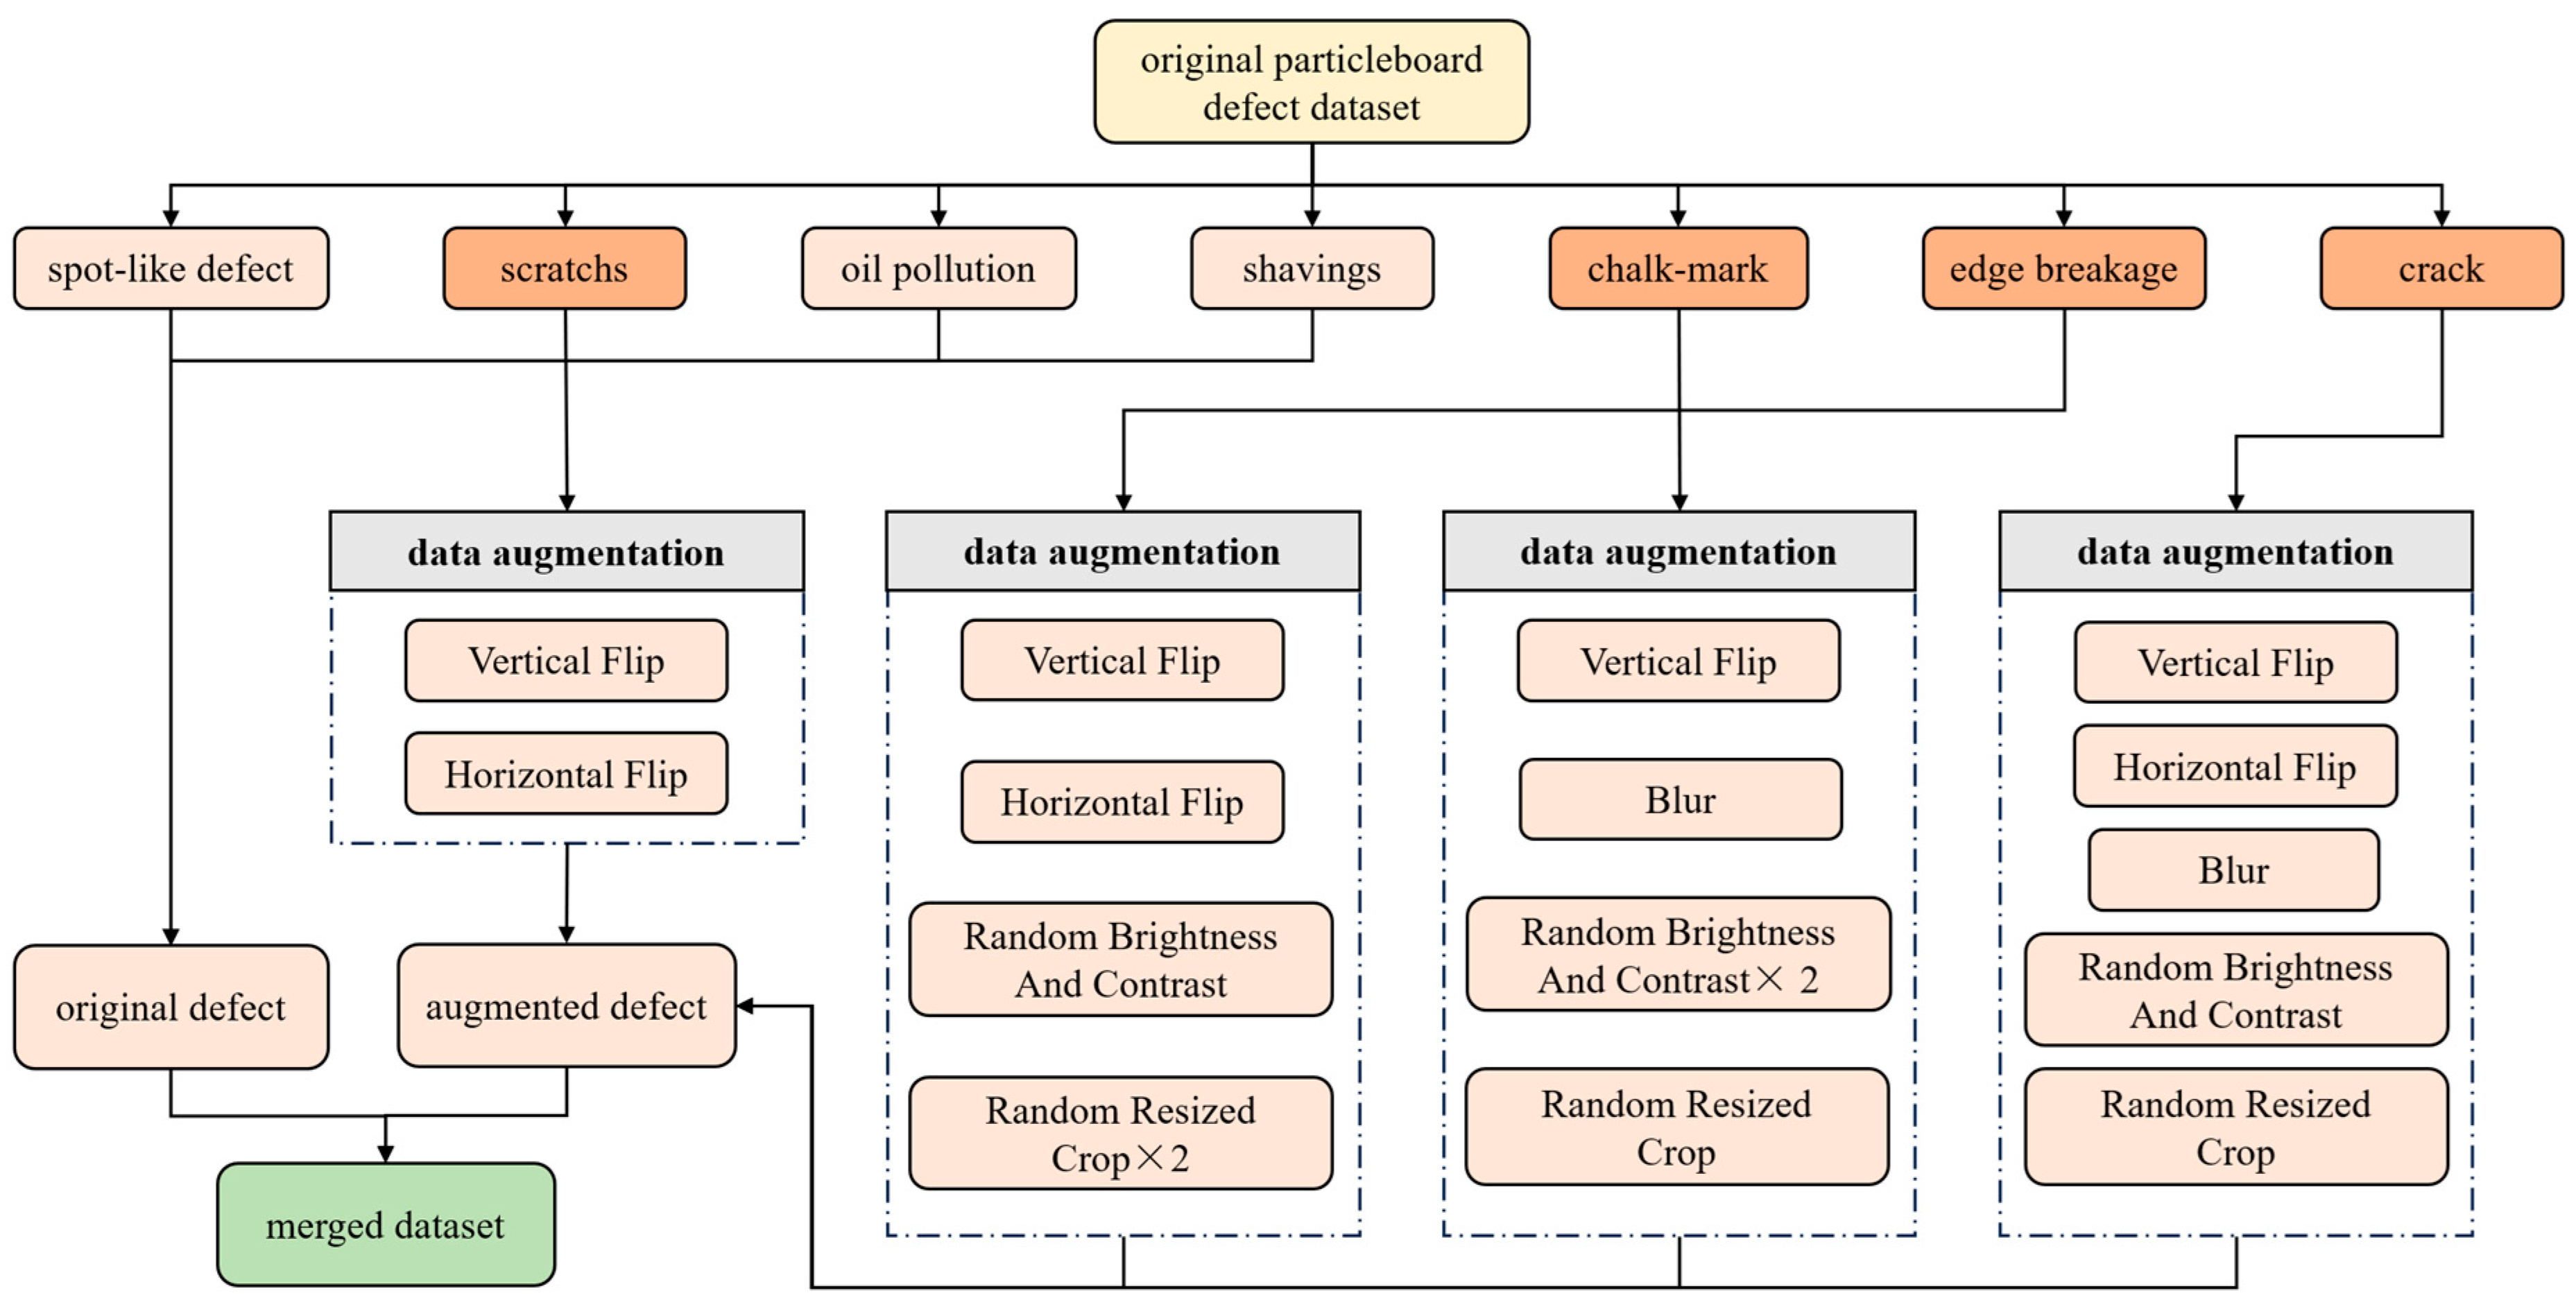
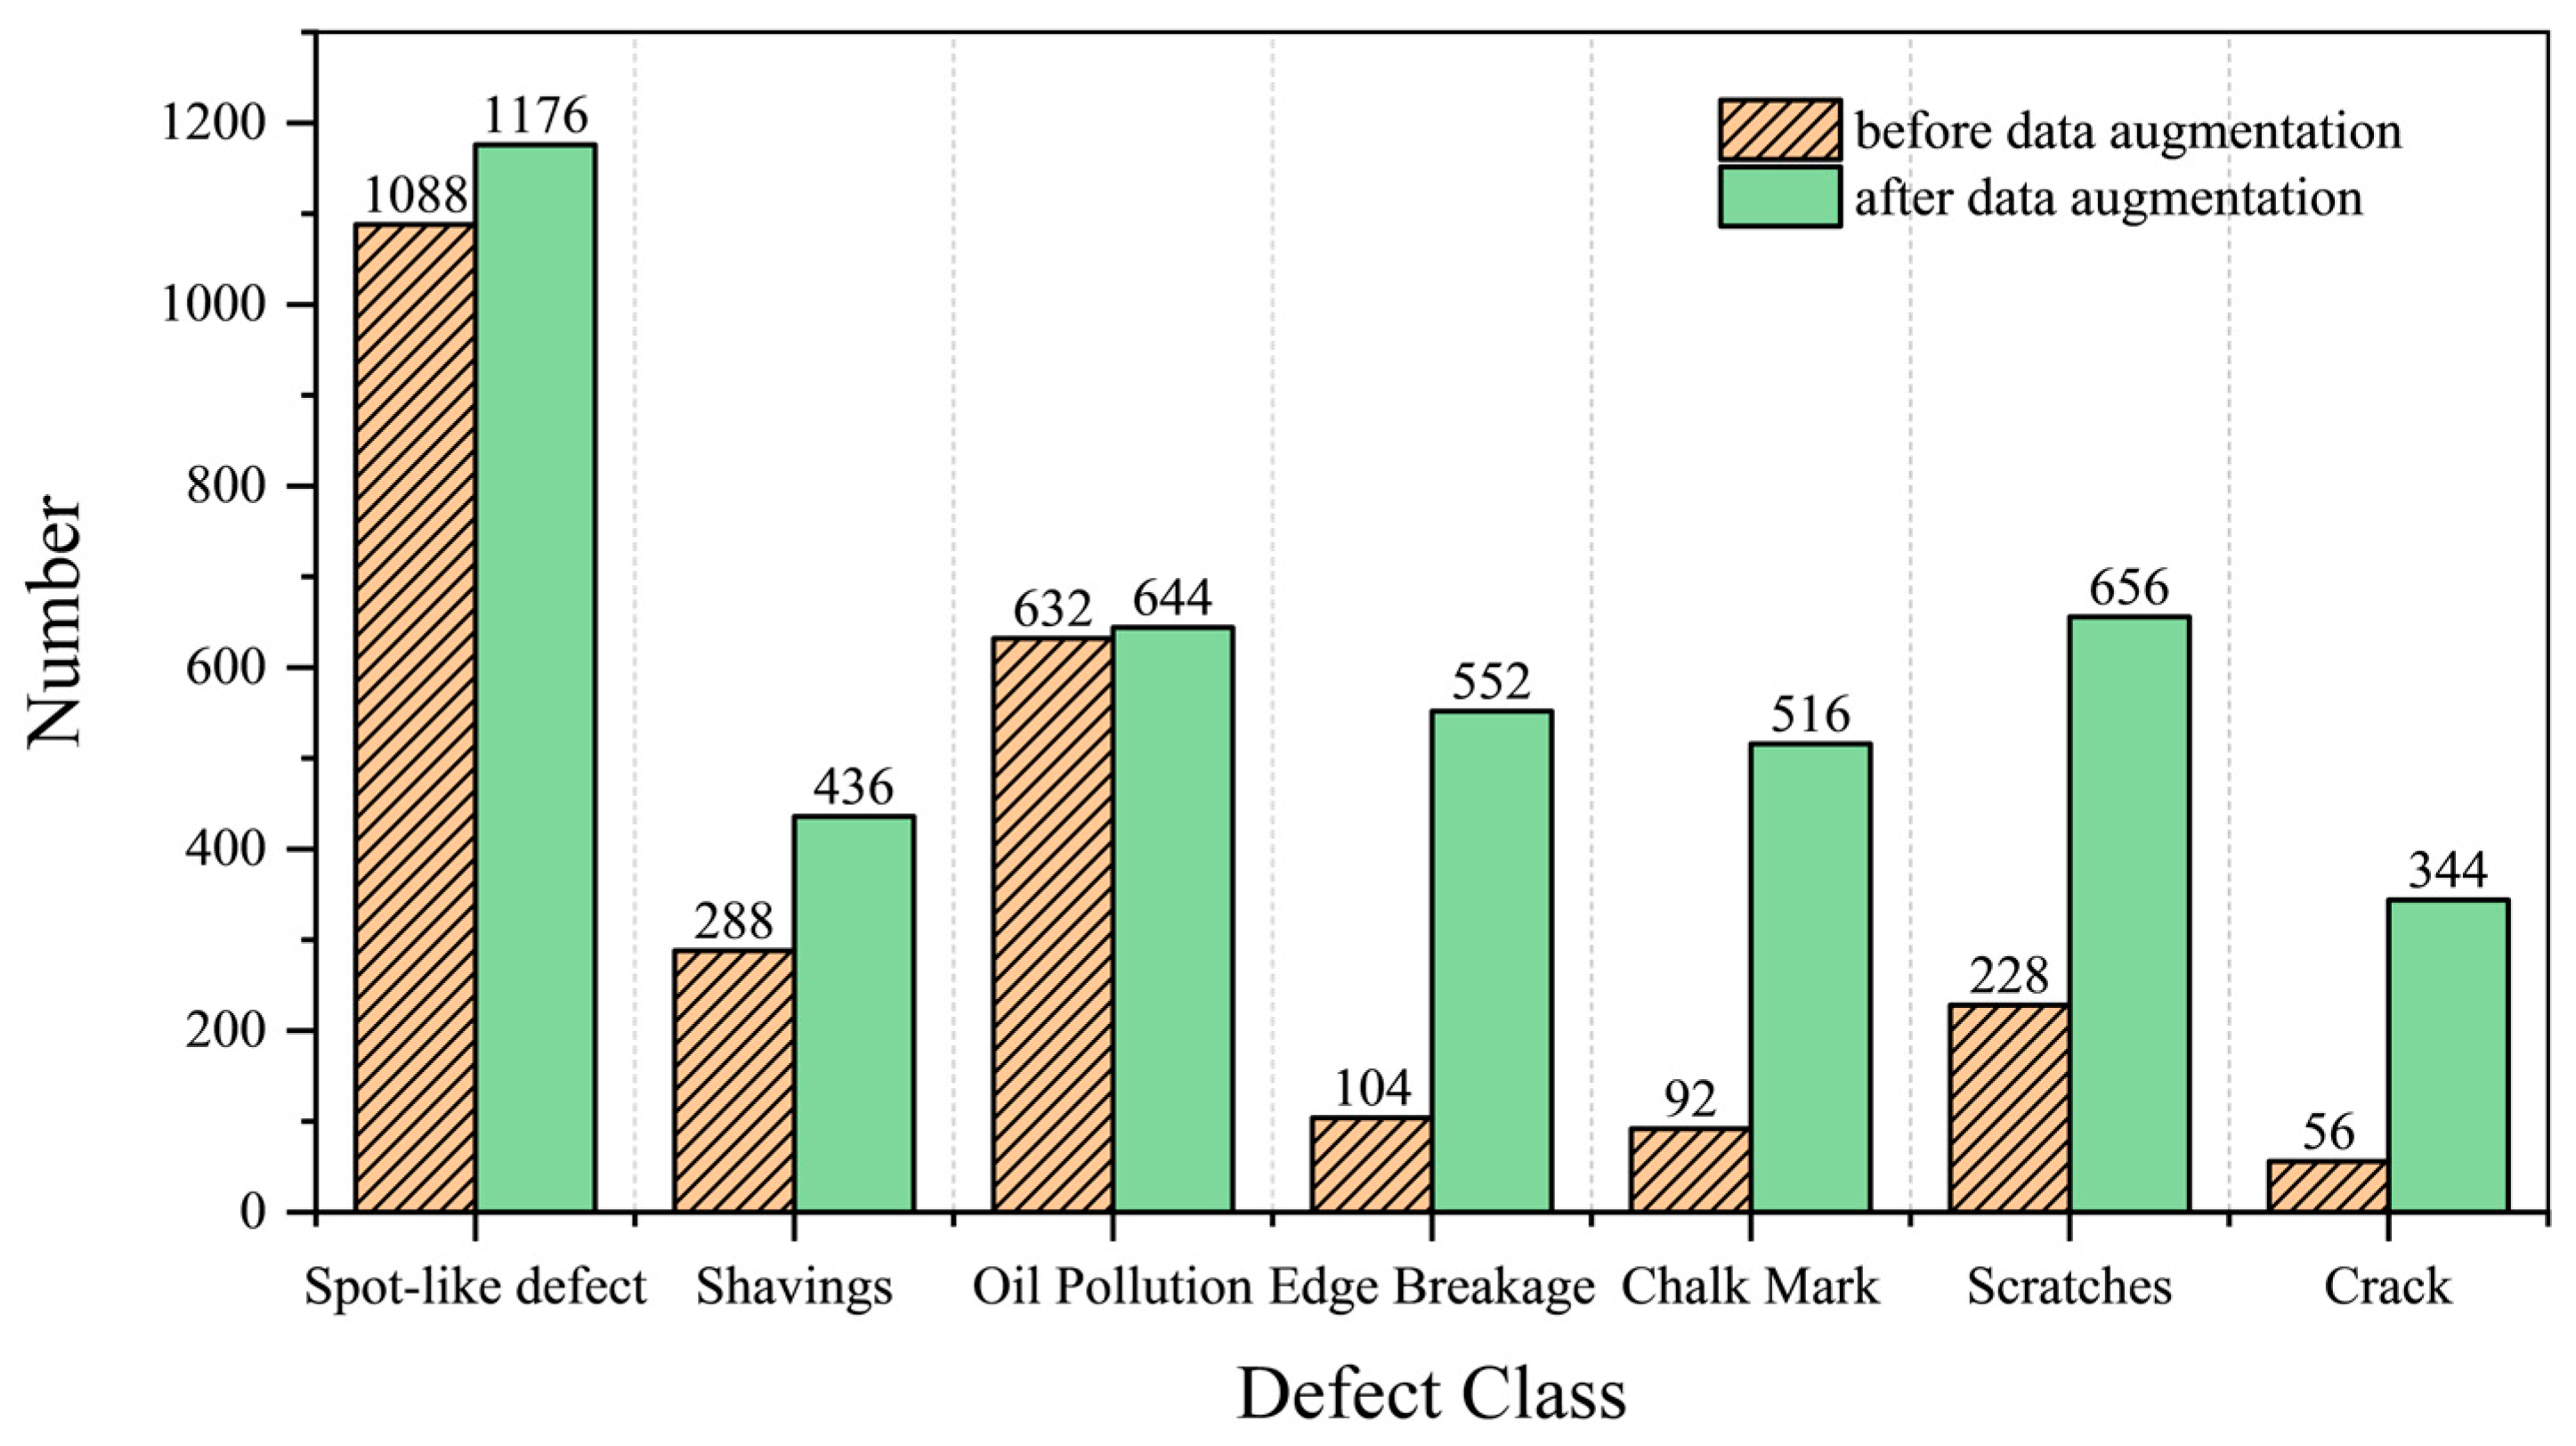
2.3. Data Augmentation Method

The dataset of particleboard surface defects obtained from the factory exhibited an apparent long-tailed distribution [24], and the data distribution among different categories was imbalanced. This phenomenon arose from the fact that some types of defects rarely occur in normal production. Typically, spot-like defects and shavings are the most frequently occurring defects during production, followed by oil pollution and scratches. In contrast, other defects are less common [25], such as chalk marks and cracks. Therefore, this study employed an asymmetric data augmentation method, creating specific strategies designed to address the unique characteristics of various defects. Specific data augmentation techniques were applied to categories with fewer samples to balance the data distribution among the different classes. The data augmentation method is depicted in Figure 4.
Taking chalk mark defects as an example, due to the low frequency of chalk mark defects in the dataset, and because they were manually marked and the shape and characteristics were relatively simple, this study adopted a variety of data enhancement strategies. Firstly, the vertical flip was used to enhance the occurrence of simulated defects in different directions of the plate, so as to improve the robustness of the algorithm to the direction change. Secondly, random clipping and scaling enhancement were used to simulate defects of different sizes to improve the adaptability of the algorithm to scale changes. At the same time, the random brightness transformation was used to enhance the change of simulated light source conditions, so that the algorithm was more robust to illumination changes. Finally, the blur transformation was used to simulate the defocusing of the camera, and the recognition ability of the algorithm to the blurred image was enhanced.

2.4. PBD-YOLO Algorithm Architecture

The structure of the PBD-YOLO algorithm is depicted in Figure 5. The algorithm is based on the lightweight and high-speed YOLOv10 [26] object detection algorithm. PBD-YOLO primarily consists of three components: backbone, neck, and head. The backbone is utilized to extract features from the input image and capture feature representations from low to high levels within the image. The neck network enhances feature representation quality by integrating contextual information through multi-scale feature map fusion. The head network is responsible for the final prediction output, performing classification and regression operations based on the features passed from the neck network to determine the location of the detection boxes and defect categories. PBD-YOLO primarily focused on improvements to the backbone and head components, with the key enhancements outlined below.
To address the issue of sparse and weak texture features on particleboard surface defects, where conventional feature extraction methods fail to capture the characteristics of certain types of defects effectively, this study introduced the SPDDEConv module. This module supersedes strided convolutions [27] as the down-sampling method in the backbone. The proposed method effectively reduced information loss during down-sampling by spatially partitioning the feature map into smaller parts and stacking these partitioned features in channels. Furthermore, the implementation of differential convolution operations enhanced the preservation and emphasis of edge-related features.
What is more, to address the issue of significant scale variations on particleboard surface defects and the dilution of small object features when multi-scale defects co-occur, the C2f_SAC module was proposed by integrating SAC into the C2f module, which expanded the model’s receptive field [27]. Concurrently, the head was redesigned, introducing the ShareSepHead module, which employed convolutional layers with shared weights to amalgamate knowledge from feature maps of varying sizes from the neck, compelling the network to learn a common feature representation across scales.

2.4.1. ShareSepHead Detection Head

As depicted in Figure 6, the ShareSepHead architecture includes three components: task decoupling, cross-layer parameter sharing, and dynamic distribution prediction. The regression branch extracts spatially sensitive features through the lightweight yet faster REG module (composed of vanilla convolution and Depthwise Separable Convolution [28]), combined with convolutional layers sharing weights and 1 × 1 convolutions to achieve lightweight modeling of bounding boxes. The classification branch adopts a three-tier structure consisting of the CBS module, convolutional layers with shared weights, and 1 × 1 convolutions, leveraging stacked vanilla convolutions to enhance the semantic abstraction capabilities. In order to enhance the compatibility of cross-scale feature representation, independent parameters are retained at lower levels to avoid inter-task gradient conflicts, while features at higher levels are forced to map to the same hidden space at different levels through weight sharing. Additionally, the detection head adopts the bounding box loss function, distribution focal loss (DFL) [29], from the YOLO series networks. Its core idea is to model the position of the bounding box as a probability distribution rather than a deterministic value, thereby enhancing the model’s ability to predict ambiguous or uncertain boundaries. The equation of DFL is listed as follows:
D F L S i , S i + 1 = y i + 1 y log S i + y y i log S i + 1 ,
where y represents the true position of the target bounding box, y i , y i + 1 denote the adjacent integer positions after discretization, while S i and S i + 1 are the normalized probability values predicted by the model for the positions y i and y i + 1 , respectively.

2.4.2. C2f_SAC Module

When multi-scale defects exist within a single image, traditional feature extraction modules with a fixed receptive field tend to focus more on larger-scale defects. In contrast, small target features may become diluted in deeper network layers. Therefore, an adaptive variable receptive field can be introduced to enhance the model’s perception capability for multi-scale defects. Incorporating atrous convolutions [30] into parallel branches is an excellent choice to avoid a significant increase in computational costs. Following this principle, the SAC module [31] was introduced into the C2f module, as depicted in Figure 7.
The SAC architecture, as depicted in Figure 8, comprises three core elements: the central SAC component flanked by two global context modules positioned at its input and output stages. Assuming y = C o n v ( x , w , 1 ) represents a vanilla convolution operation with input x , weight w , atrous rate of 1, and output y , the equation of SAC is listed as follows:
S A C o n v x , w + Δ w , r = S x · C o n v x , w , 1 + 1 S x · C o n v x , w + Δ w , r ,
where r is a hyperparameter of SAC, which was set to 3 in this study. SAC divides the input into two parallel paths: the first path employs the vanilla convolution with weight w , without any additional processing, while the second path uses convolution with an atrous rate of 3, and its weight is w + Δ w , where Δ w is a trainable weight, initialized using the weight w of the vanilla convolution. This is because objects of different scales can be detected by the same weight with different atrous rates, so using w + Δ w as the weight can reduce the learning cost for this path. S ( ) is a trainable switch function capable of weighted fusion of the convolution results from the first and second paths with different atrous rates. In this study, a 5 × 5 average pooling layer followed by a 1 × 1 convolution were used to implement this.

2.4.3. SPDDEConv Module

Modern neural networks typically incorporate down-sampling structures to generate multi-scale feature maps and learn the characteristics of defects across various sizes. YOLOv10 employs a strided convolutions to achieve down-sampling. When the image resolution is high and the object size is moderate, this strided convolution can conveniently skip a large amount of redundant information and effectively learn features. However, when there is significant scale variation in target defects, with both large and small targets present and a blurred distinction between the targets and background, this operation can lead to the loss of fine-grained information [32], resulting in a decline in accuracy and learning capability [33]. Meanwhile, the convolution kernel weights used in traditional down-sampling operations are randomly initialized, making it difficult to specifically enhance the features of defect edges, which affects the model’s ability to recognize defects with low contrast and sparse texture features.
The SPDDEConv module was proposed to address these challenges, where space-to-depth convolution [21] and difference convolution were integrated, enabling enhanced edge feature preservation while high down-sampling efficiency was retained.
The structure of the SPDDEConv module is depicted in Figure 9. The input feature image X R S × S × C 1 was firstly partitioned in the spatial dimension, and through uniform grid sampling, it was decomposed into four sub-graphs with halved spatial dimensions:
f 0,0 = X 0 : 2 : S , 0 : 2 : S f 0,1 = X 0 : 2 : S , 1 : 2 : S f 1,0 = X 1 : 2 : S , 0 : 2 : S f 1,1 = X 1 : 2 : S , 1 : 2 : S
This method could achieve spatial compression without information loss. Subsequently, based on this, the four sub-graphs were enhanced in feature expression through different operations. The sub-graph f 0,0 retained the original information, while the sub-graph f 1,0 extracted horizontal edge features through horizontal difference convolution (HDC), with its weight matrix listed as follows:
W h d = w 1 0 w 1 w 2 0 w 2 w 3 0 w 3 ,
where w 1 ~ w 3 are trainable parameters. This operation can simulate horizontal gradient computation, incorporating prior knowledge to enhance the response to horizontal edges of defects. The sub-graph f 0,1 extracted vertical edge features through vertical difference convolution (VDC), with its weight matrix listed as follows:
W v d = w 4 w 5 w 6 0 0 0 w 4 w 5 w 6 ,
where w 4 ~ w 6 are trainable parameters. This convolutional operation also incorporated prior knowledge, capable of simulating vertical gradient computation, extracting vertical edges, and enhancing the response to vertical edges of defects [22]. The sub-graph f 1,1 extracted general features through a standard 3 × 3 convolution. The outputs of the four branches were ultimately stacked along the channel dimension and adjusted to the required number of output channels through a 1 × 1 convolution, resulting in the down-sampled feature image F o u t R S 2 × S 2 × C 2 .

2.5. Algorithm Evaluation Metrics

To comprehensively evaluate the performance of the particleboard defect detection algorithm proposed in this study, mAP50 and mAP50–95 were adopted as metrics to evaluate the average recognition accuracy across all categories. Here, mAP50 is the mean average precision calculated at an intersection over union (IoU) threshold of 0.5. The mAP50–95 is more stringent, representing the average of the mean average precisions calculated at different IoU thresholds ranging from 0.50 to 0.95, which reflects the model’s performance under varying detection difficulties. Additionally, considering the requirements of defect detection tasks for the defect detection rate, detection speed, and deployment difficulty, the defect detection rate (recall), model parameters (parameters), and inference time (time) are also performance evaluation metrics. The equations are listed as follows:
m A P = 1 N i = 1 N A P i ,
A P = 0 1 P r e c i s i o n r   d r ,
P r e c i s i o n = T P T P + F P ,
R e c a l l = T P T P + F N ,
where TP (true positive) is the number of correctly detected defects, TN (true negative) is the number of samples correctly identified as non-defective, FP (false positive) is the number of samples falsely detected as defects, and FN (false negative) is the number of defective samples that were not detected.

3. Experiment and Results

A series of comparative and ablation experiments were designed to evaluate the performance of PBD-YOLO on the task of particleboard defect detection in this study. By adding or replacing different improved modules to the original algorithm, the impact of various enhancement methods on the overall algorithm was analyzed and evaluated. Comparisons were also made with mainstream defect detection algorithms, such as Faster R-CNN [34], YOLOv5, RTMDet [35], and RT-DETR [36].

3.1. Experimental Details

The experimental hardware platform was composed by an AMD EPYC 7542 (2.90 GHz) computer with 256 GB of memory and a Geforce RTX 4090 24 GB GPU. The system operated on Ubuntu 22.04, with Visual Studio Code (version: 1.99.2) as the development software, Python 3.10 as the programming language, and PyTorch 2.3.0 as the deep learning framework. In the experiment, the training image size was set to 1024   p i x e l s × 1024   p i x e l s , the dataset was divided into training and validation sets at an 8:2 ratio, the number of epochs was set to 300, the batch size was set to 8, the learning rate was 0.001, the patience was 50, the automatic mixed precision (amp) was true, the weight decay was 0.0005, and the momentum factor was 0.937.

3.2. Results of Data Augmentation

The distribution of each type of defect before and after data augmentation is depicted in Figure 10. Since data augmentation is performed at the image level, defects that were not originally targeted for augmentation may still be enhanced when they co-occur with to-be-augmented defects in the same image. This explains why the quantity of non-augmented defect classes may also fluctuate. Additionally, the random cropping process may result in the loss of targets, causing the number of target defects after augmentation to be less than the theoretical value. After data augmentation, the dataset totaled 3436 images, containing 4324 defects. Subsequently, for each type of defect, 20% of the images were extracted as the validation sets, and the remaining 80% were used as the training sets. The training sets included 2749 images with 3497 defects, and the validation sets included 687 images with 827 defects.

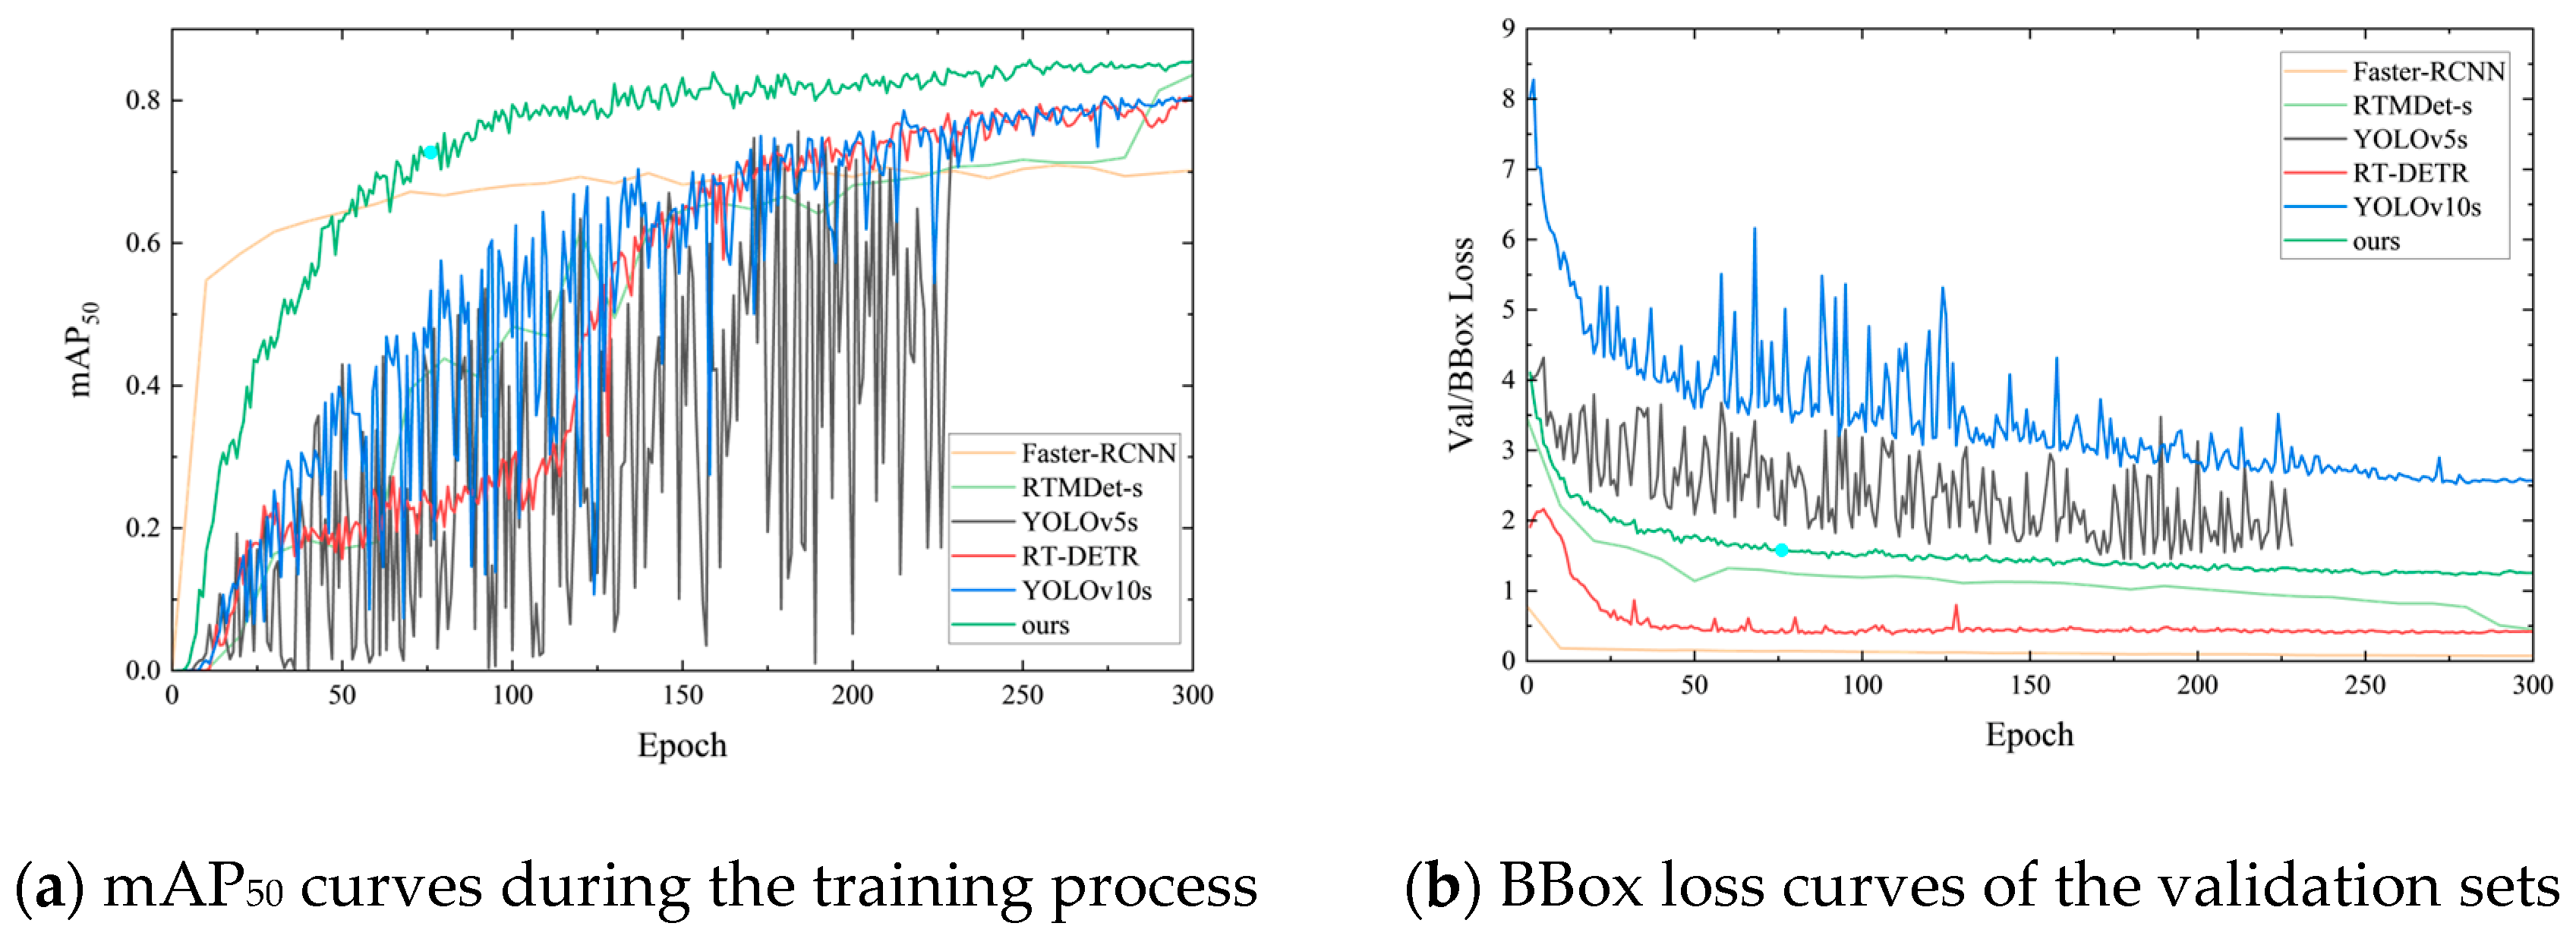
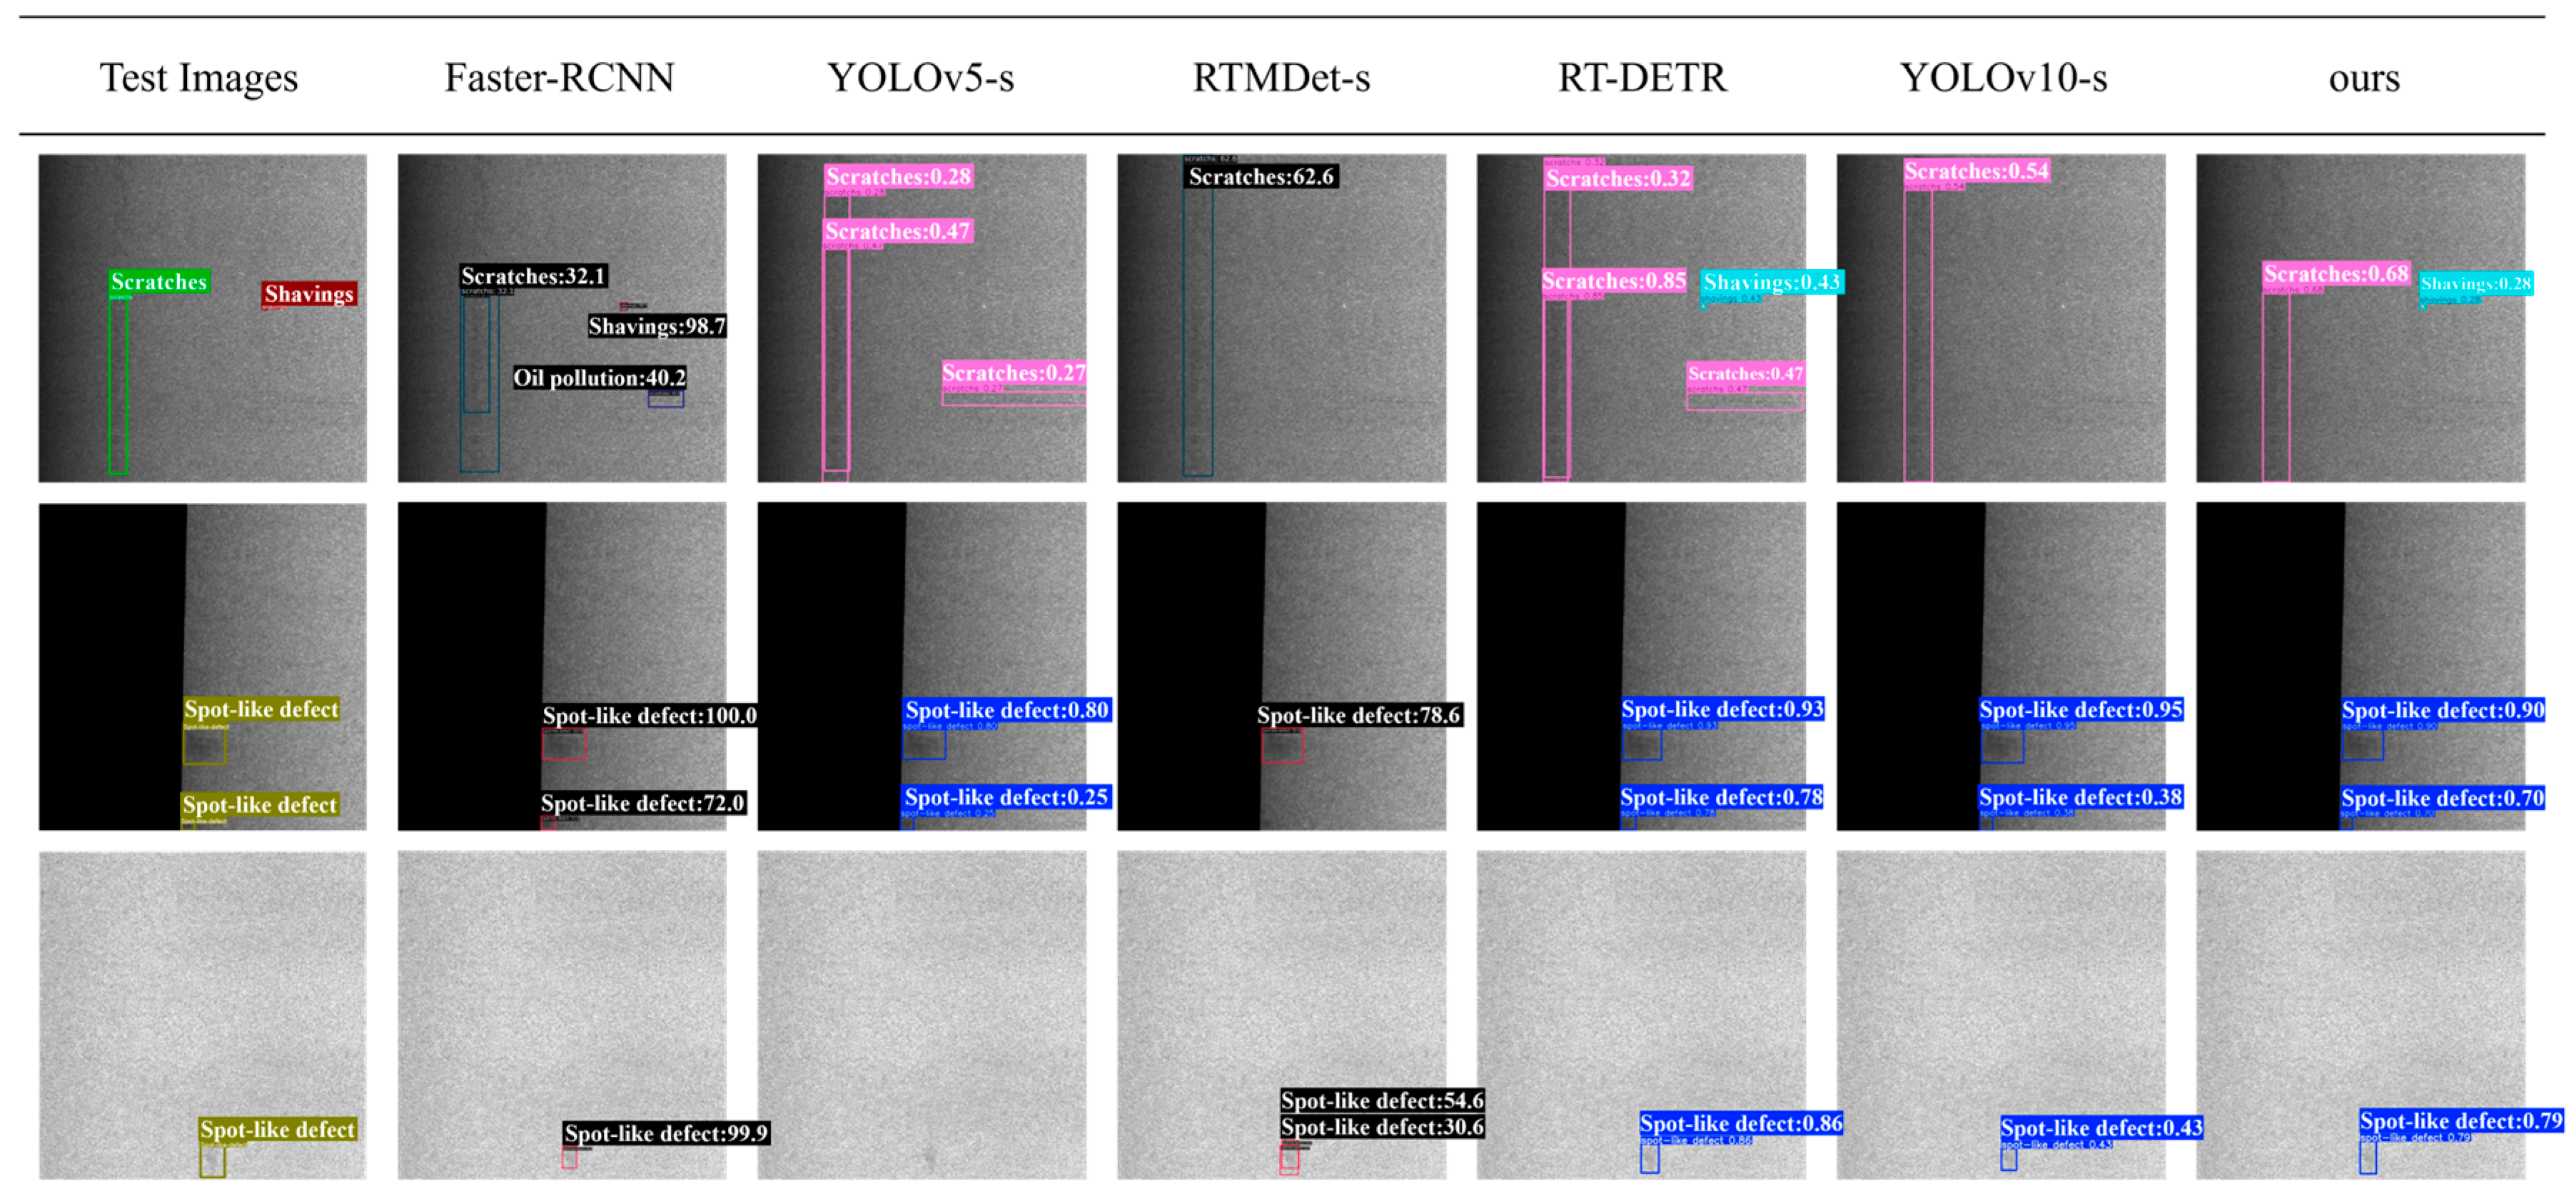
3.3. Results of Comparative Experiment

To evaluate the performance of the PBD-YOLO algorithm proposed in this paper, five high-performing mainstream algorithms, including Faster R-CNN, YOLOv5, RTMDet, RT-DETR, and YOLOv10, were selected for comparative experiments on the previously constructed particleboard defect dataset. The experimental metrics encompassed detection accuracy (measured by mAP50 and mAP50–95), defect detection rate (measured by recall), model parameters count (measured by parameters), and inference time (measured by time). Results of the comparative experiment are presented in Table 1.
Among all the algorithms evaluated, PBD-YOLO demonstrated the most outstanding performance. It attained the highest mAP50 at 0.856 and mAP50–95 at 0.609. Additionally, PBD-YOLO achieved the highest recall of 0.814, significantly reducing the false-negative rate. Meanwhile, it maintained lightweight characteristics with merely 14.1 M parameters and achieved fast inference at 3.16 ms.
In order to give a more intuitive view of the training process of all algorithms in the comparative experiment, Figure 11a exhibits the mAP50 and iteration numbers of the models as they were trained, Figure 11b portrays the bounding box (BBox) loss curves of the validation sets, and the visual detection results are depicted in Figure 12.

3.4. Results of Ablation Experiment

This study introduced several improved modules, including ShareSepHead, C2f_SAC, and SPDDEConv, into the baseline algorithm, YOLOv10. Additionally, a “Slim” strategy, by halving the number of channels in the backbone network, was proposed to optimize the model’s efficiency. To verify the effectiveness and performance of these enhancements, this study conducted ablation experiments by incrementally adding or replacing the improved schemes within the algorithm, quantitatively analyzing the impact of these improvements on the overall performance. The ablation experiment results are presented in Table 2, where A is the baseline and B–I represent the experimental results obtained by applying different improvement modules.
As presented in Table 2, the model performance exhibited varying trends with the introduction of different improved modules. After incorporating the “Slim” operation, the model’s parameters decreased to 9.8 M, and the inference time decreased to 2.04 ms. When SPDDEConv was added, the mAP50 increased from 0.756 to 0.817, and the recall increased from 0.690 to 0.743, while the parameters rose to 11.5 M and the inference time increased to 2.18 ms. With the introduction of C2f_SAC, the recall increased from 0.690 to 0.731, accompanied by an increase in the inference time to 2.84 ms. When all improvement modules were integrated, the model achieved its best performance, with an mAP50 of 0.856, an mAP50–95 of 0.609, and a recall of 0.814.
To evaluate the performance of each improved module on specific defect categories, this study has compiled and presents the precise mAP50 and recall metrics for each algorithm from the ablation experiment, as presented in Table 3 and Table 4.
After introducing the SPDDEConv, Algorithm D demonstrated significant improvements in detecting scratch defects, with the mAP50 increasing from 0.756 to 0.914 and recall rising from 0.694 to 0.829. Upon the addition of C2f_SAC, Algorithms E and H showed improved performance in detecting shavings, achieving mAP50 values of 0.819 and 0.828, respectively. Furthermore, Algorithm G, which integrated both SPDDEConv and C2f_SAC, achieved notable advancements in detecting both shavings and scratches, with mAP50 scores reaching 0.905 and 0.831. Among all algorithms, the mAP50 values for “oil pollution” defects were consistently low, with a baseline value of only 0.452 before any improvements. PBD-YOLO (specifically Algorithm I) enhanced this metric to 0.573 by integrating multiple improvement modules, representing a 34.2% increase compared to baseline Algorithm A. On the other hand, Algorithm G achieved the best detection performance for shaving defects, with an mAP50 value of 0.905.
To more specifically and intuitively evaluate the effectiveness of the improved modules proposed in this study, Eigen-CAM [37] was used to visualize the features extracted from the same layer of each algorithm in the ablation experiment. The visualization results are depicted in Figure 13. The more profound the red part of the heatmap, the higher the degree of focus on that part.

4. Discussion

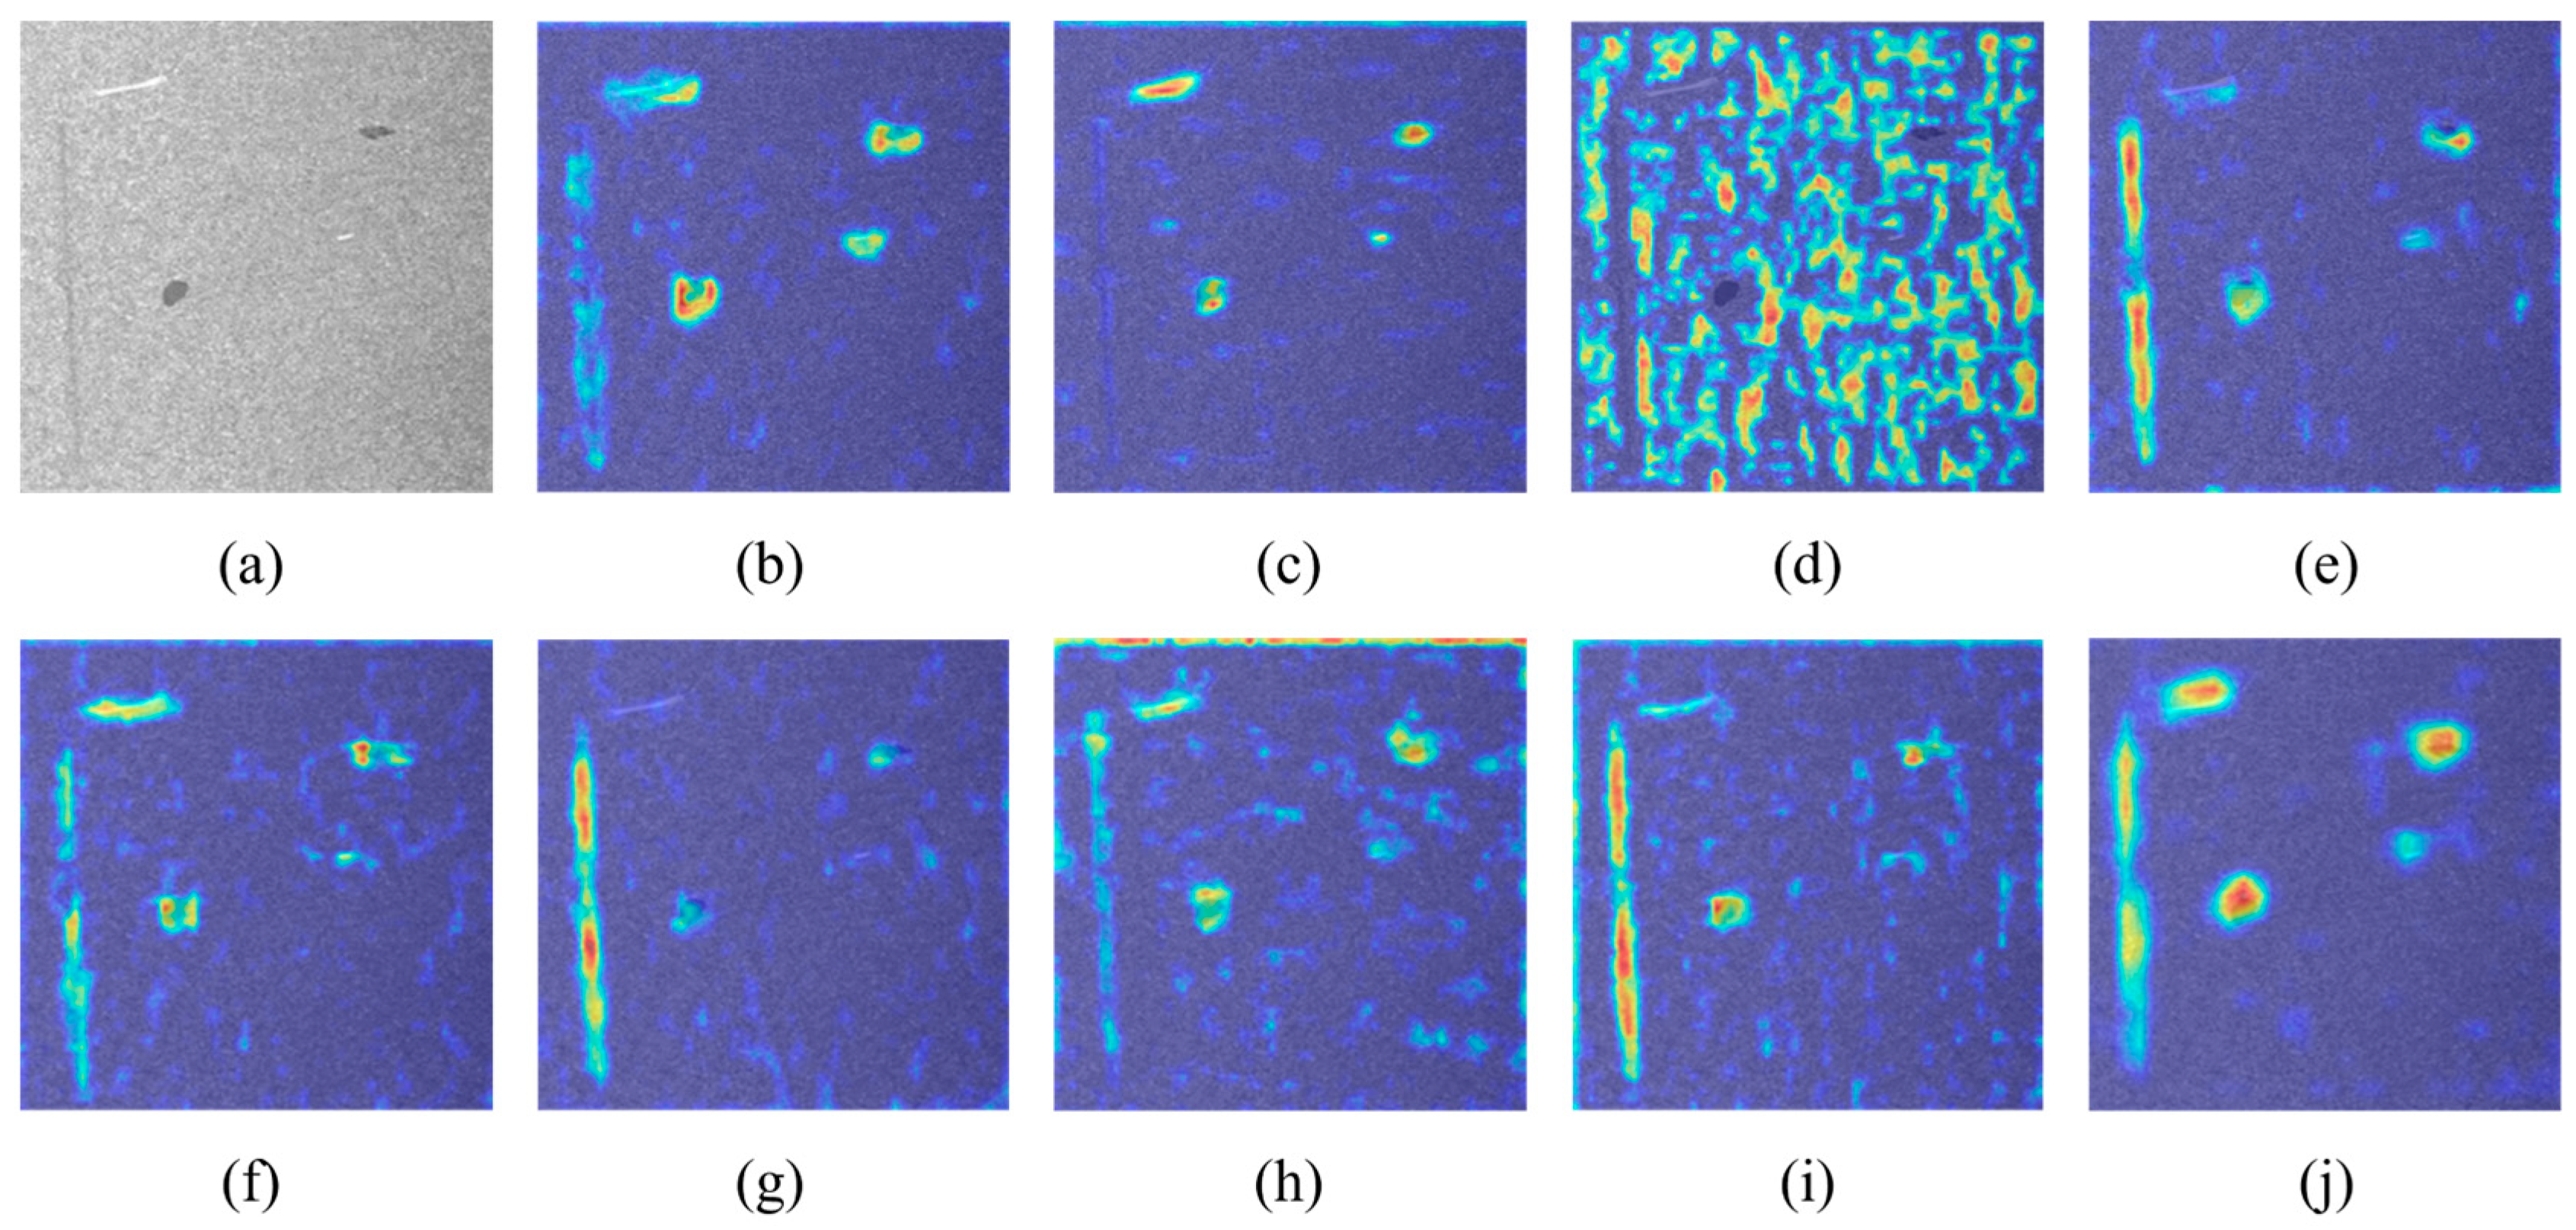
4.1. Discussion of Comparative Experimental Results

From the results of the comparative experiment, it is evident that earlier algorithms exhibited relatively inferior performance. Faster R-CNN failed to converge without the use of the pre-trained weights, and its convergence speed was faster when the pre-trained weights were used, but the final mAP50 remained low at only 0.702. The YOLOv5s algorithm, under the same parameter settings, triggered early stopping during the later stages of training due to the inability to further improve performance. In terms of accuracy, the PBD-YOLO algorithm achieved an mAP50 of 0.856, representing a 5.5% improvement over the baseline algorithm, YOLOv10s, and outperforming the RT-DETR and RTMDet series detection algorithms. Compared to the earlier YOLOv5s algorithm, it showed a 12% improvement, surpassing the enhancement methods based on YOLOv5s reported in [11,14,38]. For the more stringent mAP50–95 metrics, the PBD-YOLO algorithm surpassed all the algorithms with an accuracy of 0.609. These results demonstrate that the proposed algorithm exhibited stronger robustness and detection capabilities across different IoU values.
Meanwhile, PBD-YOLO was capable of detecting seven types of defects, including spot-like defects, shavings, oil pollution, edge breakage, chalk marks, scratches, and cracks. Compared with the literature [11,12,14,15], the detection of scratches and edge breakage, which are more difficult to recognize, was added, and the mAP50 values of the newly added defects all surpassed 0.9.
In practical applications of particleboard surface defect detection, production factories generally prioritize defect detection rates over classification accuracy. In such scenarios, the recall metric becomes the crucial performance indicator. The proposed PBD-YOLO algorithm achieved a recall rate of 0.814, surpassing the baseline YOLOv10s algorithm by 13%. This significant improvement effectively reduced the probability of false negatives, better aligning with industrial quality control requirements. As evidenced by the detection examples depicted in Figure 12, PBD-YOLO demonstrated superior localization accuracy and confidence compared to mainstream defect detection algorithms, particularly for challenging defect types. The algorithm exhibited enhanced performance in detecting low-contrast defects (e.g., scratches) and small-scale defects, with detection results more similar to ground truth.
The proposed PBD-YOLO algorithm demonstrated remarkable parameter efficiency with 14.1 M parameters, representing an 11.3% reduction compared to YOLOv10s (with 15.9 M parameters), while maintaining comparable inference speed to the baseline. In comparison with other algorithms, although RTMDet-s had a substantial parameter value of 39.03 M, its mAP50 was 0.836 and inference speed was 54.20 ms, which are both inferior to those of PBD-YOLO. This demonstrates that the algorithm proposed in this study achieved a better balance between accuracy and efficiency through structural optimization. Furthermore, while RT-DETR-ResNet50 exhibited a higher recall rate, where the value was 0.776, its large parameter size (86.1 M) and high computational cost (the time was 8.10 ms) make it challenging to deploy for real-time high-performance applications on resource-constrained industrial edge-computing devices.

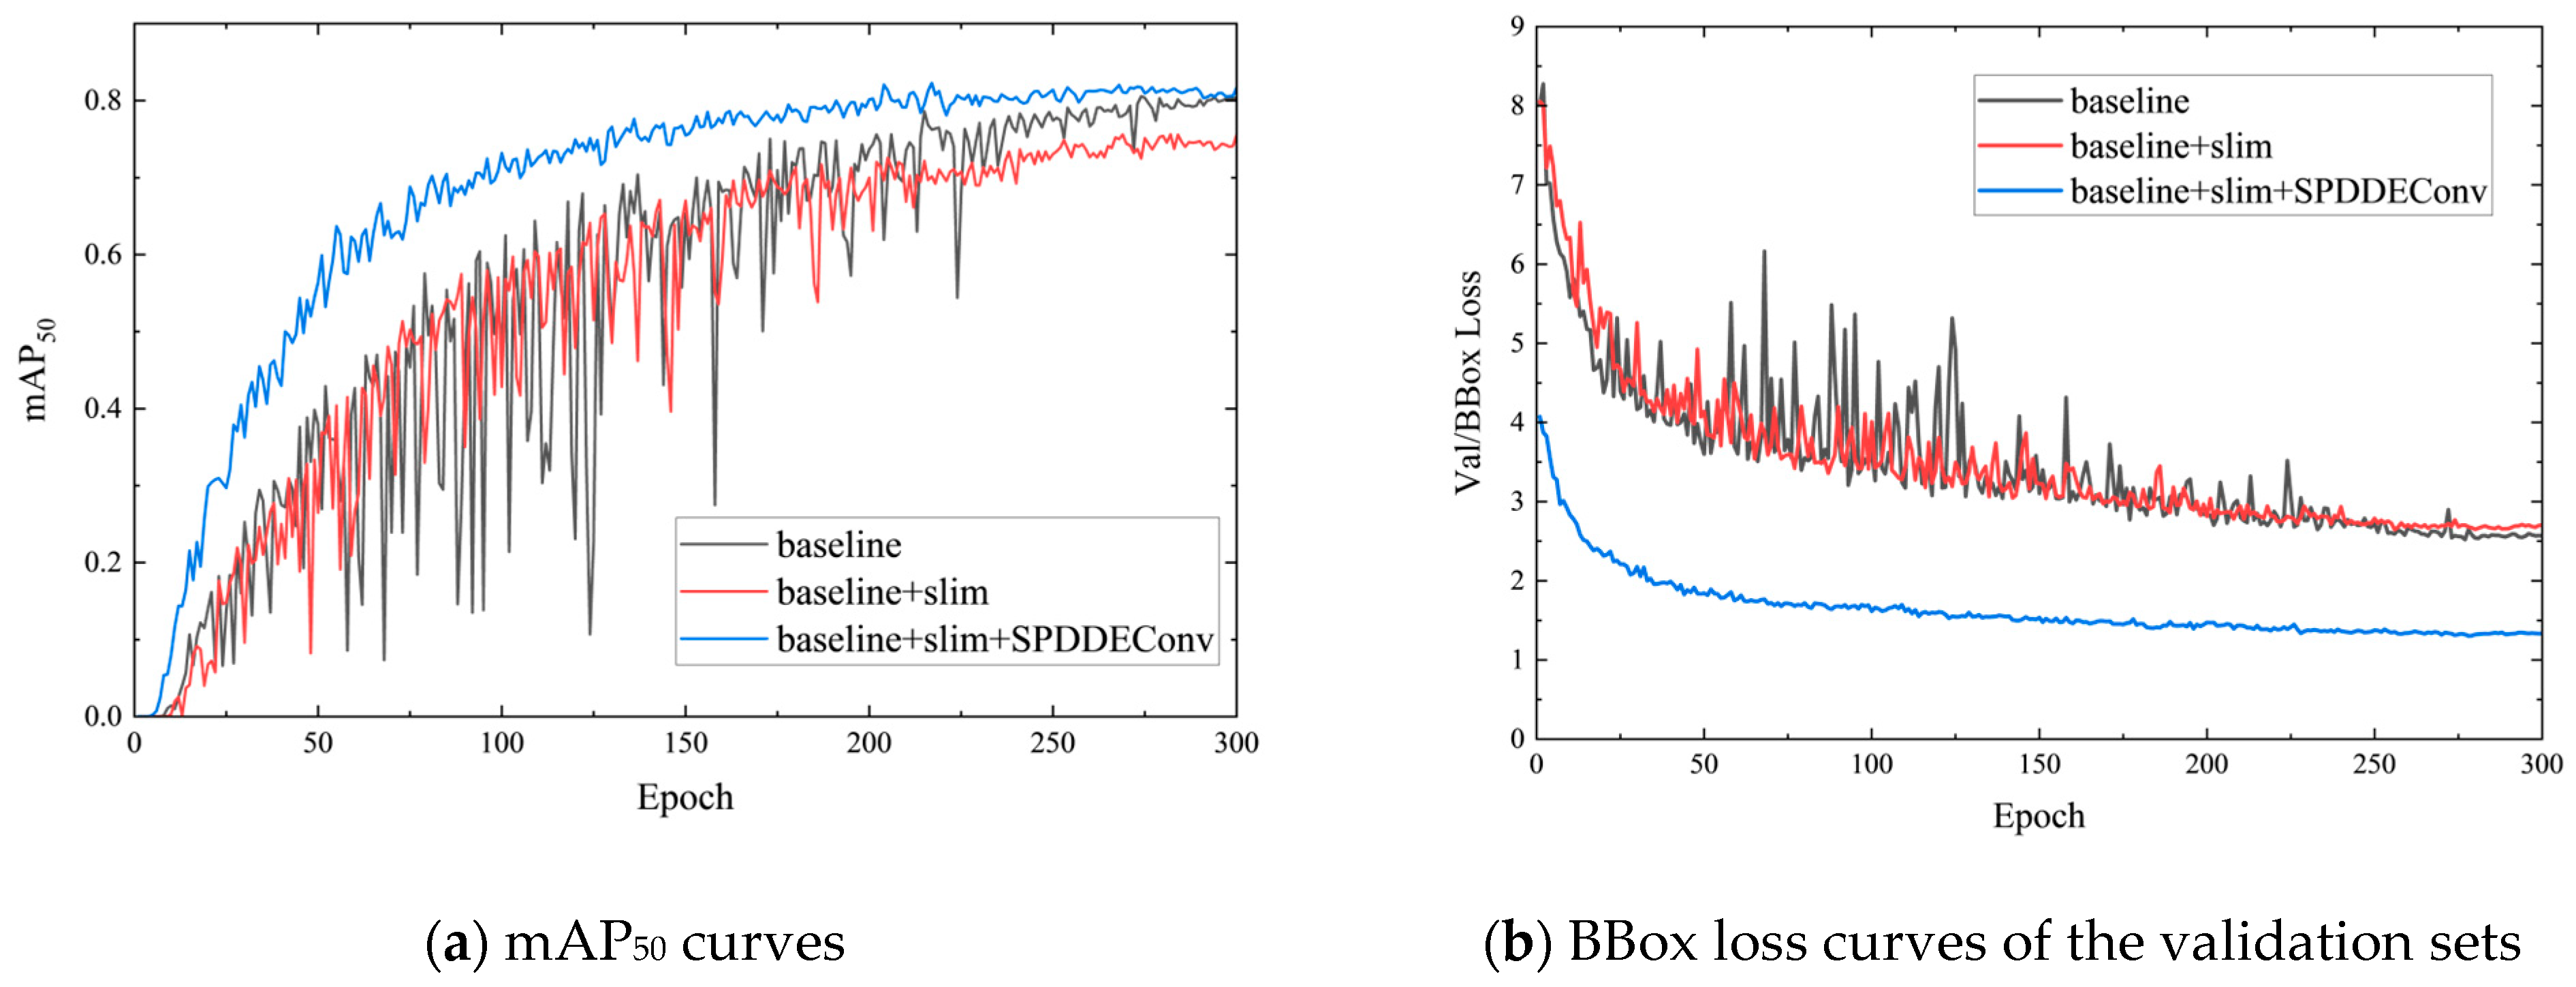
4.2. Discussion of Ablation Experimental Results

To balance algorithm performance and inference efficiency, this study implemented lightweight pruning on the backbone network. While solely compressing the model’s parameters, the mAP50 decreased to 0.756, with a slight improvement in the recall rate to 0.690. The parameter size was reduced to 62% of the baseline, and the inference speed increased by 54.4%. This indicates that although simple parameter pruning enhanced the detection efficiency, it significantly decreased the backbone’s feature representation capability. Consequently, this approach necessitates further integration with other improved modules to enhance the feature extraction capacity.
As presented in Table 1 and Table 2, replacing the CBS module with SPDDEConv as the backbone’s down-sampling method improved the model’s mAP50 to 0.817 and recall rate to 0.743. Specifically, the mAP50 for defects with weak features but certain edge information, such as scratches and edge breakage, increased by 20.9% and 6.5%, respectively. These results indicate that SPDDEConv, through its spatial partitioning and channel stacking approach, preserved more information from the original feature maps and enhanced the weak texture features of defects by introducing difference convolution methods. The heatmaps in Figure 13c,e,g further demonstrate that the model’s attention to elongated defects, like scratches, significantly improved after integrating SPDDEConv. Moreover, the introduction of HDC and VDC branches during down-sampling provided the algorithm with prior knowledge, enabling it to directionally extract edge information of defects. This design also contributed to a notable acceleration in the model’s convergence speed during training, as depicted in Figure 14.
Among all seven types of defects, oil pollution, chalk marks, and cracks generally covered larger areas, while edge breakage tended to be smaller in size. Spot-like defects and shavings exhibited significant scale variations, with defect areas ranging from the size of a grain of rice to that of a palm. Moreover, different types of defects could coexist, making the scale change of defects in the image more complicated. To address this issue, this study introduced the ShareSepHead and C2f_SAC modules to enhance the model’s ability to detect multi-scale defects.
The design concept of ShareSepHead is similar to NAS-FPN [39]. By reusing parameters, it inserts convolutional layers with shared weights into the detection head to fuse knowledge from feature maps of different scales, enabling cross-layer knowledge transfer and enhancing the model’s ability to detect multi-scale defects. After adding ShareSepHead alone, the model’s parameters remained at 9.8 M, while the mAP50 increased to 0.828 and the recall rate jumped to 0.779. Notably, the mAP50 for spot-like defects and shavings, two defect types with significant scale variations, improved by 10.6% and 20.8%, respectively, demonstrating significant enhancement effects.
The C2f_SAC module, through its integrated SAC component, looked twice at the input features with different atrous rates, and the outputs were combined by switches. This design expanded the receptive field while enhancing the C2f module’s ability to extract multi-scale defect features. According to the ablation experimental results, adding C2f_SAC alone led to a slight performance drop of 1%. However, when C2f_SAC was combined with ShareSepHead or SPDDEConv, the mAP50 significantly improved to over 0.84. This indicates that while atrous convolutions can expand the receptive field, they rely on richer feature information. The addition of C2f_SAC contributed to a further performance improvement only when the backbone had strong feature extraction capabilities and could extract sufficiently rich features.
Regarding inference speed, the “Slim” strategy adopted in this study reduced the inference time by 54.4% (from 3.15 ms to 2.04 ms) through halving the number of channels in the backbone network. When the SPDDEConv module was added separately, the inference time was slightly increased by 0.14 ms. This is because in addition to the normal convolution during the down-sampling process, HDC and VDC operations were performed simultaneously. The C2f_SAC module had a higher computational cost due to two convolution operations with different atrous rates. After adding the module, the inference time was generally increased by 0.8 ms. However, when all modules were combined (e.g., Algorithm I), the inference time returned to near-baseline levels (3.16 ms), but with a 5.5% mAP50 improvement over YOLOv10.

5. Conclusions

To address the challenges of multi-scale defect co-occurrence and weak texture defect recognition in particleboard surface detection, a lightweight detection algorithm named PBD-YOLO was proposed. In this study, a high-resolution particleboard surface defect dataset was constructed, encompassing seven types of defects, particularly including edge breakage and scratches, which exhibited weak features. Additionally, an asymmetric data augmentation strategy was employed to effectively address the issue of imbalanced sample distribution within the dataset. Experimental results demonstrated that the proposed SPDDEConv down-sampling module, through its spatial partitioning–channel stacking mechanism and difference convolution branches, improved the mAP for defects with weak features but high edge sensitivity by up to 20.9%. The ShareSepHead detection head, by sharing weights to enable cross-layer knowledge transfer, enhanced the detection performance for defects with significant scale variations by 10.6% to 20.8%. Meanwhile, the C2f_SAC module further strengthened the model’s ability to capture multi-scale defect features through its SAC modules. The final PBD-YOLO algorithm achieved a 5.5% improvement in mAP50 and a 13% increase in recall compared to the baseline algorithm, while maintaining a lightweight parameter of 14.1 M. It outperformed mainstream detection algorithms, such as Faster R-CNN, RT-DETR, and RTMDet, in terms of accuracy–efficiency balance. This study provided an efficient and accurate automated quality inspection system for particleboard surface defect detection, offering significant practical value for advancing intelligent manufacturing upgrades and quality control.
In the future research, this work will focus on the following directions: (i) developing particleboard surface defect generation techniques based on GANs and diffusion models [40] to address the scarcity of samples for certain defect types, and (ii) further optimizing the network architecture to design a more efficient and lightweight detection algorithm, aiming to enhance detection speed while balancing the requirements of high-speed production lines and maintaining stable recall rates.

Author Contributions

Conceptualization, H.G., Z.C. and J.Y.; methodology, H.G., Z.C. and L.Y.; software, H.G. and H.D.; validation, H.G.; formal analysis, H.G., H.D. and P.C.; investigation, H.G.; resources, J.Y., L.Y. and P.C.; data curation, Z.C. and H.D.; writing—original draft preparation, H.G. and Z.C.; writing—review and editing, L.Y., P.C. and J.Y.; visualization, H.G.; supervision, L.Y. and J.Y.; project administration, P.C.; funding acquisition, J.Y. All authors have read and agreed to the published version of the manuscript.

Funding

This research was supported by the National Key R&D Program of China (Grant No. 2023YFD2201500).

Institutional Review Board Statement

Not applicable.

Informed Consent Statement

Not applicable.

Data Availability Statement

The data will be made available upon request from the authors once all studies have been completed and published.

Acknowledgments

The authors gratefully acknowledge Tangxian Huiyin Wood Industry Co., Ltd. for their essential technical collaboration and on-site support during the acquisition of defect image datasets.

Conflicts of Interest

The authors declare no conflicts of interest.

Abbreviations

The following abbreviations are used in this manuscript:
YOLOYou Only Look Once
PBD-YOLOParticleboard Defect-You Only Look Once
SPDDEConvSpace to Depth and Difference Enhance Convolution
ShareSepHeadShare Separated Head
SACSwitchable Atrous Convolution
C2f_SACC2f module with Switchable Atrous Convolution
CBAMConvolutional block attention module
ANNArtificial neural networks
DFLDistribution focal loss
HDCHorizontal difference convolution
VDCVertical difference convolution
mAPMean average precision
IoUIntersection over union
BBoxBounding box

References

  1. Yang, L.; Mao, S.; Lu, T.; Du, G. Review and Outlook of Technology Development in China’s Particleboard Industry. Chin. J. Wood Sci. Technol. 2024, 38, 1–12. [Google Scholar] [CrossRef]
  2. You, J.; Hu, S.; Jin, Z. A Brief Analysis of China’s Artificial Board Industry. Green China 2024, 16, 56–61. [Google Scholar] [CrossRef]
  3. Yang, Y. Application of Machine Vision in Particleboard Surface Defect Detection:Status and Recommendations. China Wood-Based Panels 2024, 31, 33–37. [Google Scholar]
  4. Zhou, H.; Yu, W.; Zhang, M.; Liu, Y.; Yang, Y.; Xi, S.; Xie, C.; Shen, Y. Development of Intelligent Control and Testing of Particleboard Quality. World For. Res. 2023, 36, 75–79. [Google Scholar] [CrossRef]
  5. Zhao, Z.; Ge, Z.; Jia, M.; Yang, X.; Ding, R.; Zhou, Y. A Particleboard Surface Defect Detection Method Research Based on the Deep Learning Algorithm. Sensors 2022, 22, 7733. [Google Scholar] [CrossRef] [PubMed]
  6. Li, B.; Xu, Z.; Bian, E.; Yu, C.; Gao, F.; Cao, Y. Particleboard Surface Defect Inspection Based on Data Augmentation and Attention Mechanisms. In Proceedings of the 2022 27th International Conference on Automation and Computing (ICAC), Bristol, UK, 1–3 September 2022; pp. 1–6. [Google Scholar]
  7. Wang, C.; Liu, Y.; Wang, P. Extraction and Detection of Surface Defects in Particleboards by Tracking Moving Targets. Algorithms 2019, 12, 6. [Google Scholar] [CrossRef]
  8. Zhu, H.; Zhou, S.; Zeng, Y.; Li, S.; Liu, X. Detection Model of Wood Surface Defects Based on Improved YOLOv5s. Chin. J. Wood Sci. Technol. 2023, 37, 8–15. [Google Scholar] [CrossRef]
  9. Zhang, Y.; Li, X.; Wang, F.; Wei, B.; Li, L. A Comprehensive Review of One-Stage Networks for Object Detection. In Proceedings of the 2021 IEEE International Conference on Signal Processing, Communications and Computing (ICSPCC), Xi’an, China, 17–20 August 2021; pp. 1–6. [Google Scholar]
  10. Zhang, H.; Wang, Y.; Yu, C. Research on Key Technology of Online Detection for Particleboard. In Proceedings of the 2021 IEEE International Conference on Electronic Technology, Communication and Information (ICETCI), Changchun, China, 27–29 August 2021; pp. 512–515. [Google Scholar]
  11. Zhao, Z.; Yang, X.; Zhou, Y.; Sun, Q.; Ge, Z.; Liu, D. Real-Time Detection of Particleboard Surface Defects Based on Improved YOLOV5 Target Detection. Sci. Rep. 2021, 11, 21777. [Google Scholar] [CrossRef]
  12. Wang, W.; Dang, Y.; Zhu, X.; Guan, Y.; Shen, T.; Cang, Z. Detecting Method for Particleboard Surface Defects Based on the Lite-YOLOv5s Model. Chin. J. Wood Sci. Technol. 2023, 37, 58–67. [Google Scholar] [CrossRef]
  13. Wang, C.; Liu, Y.; Wang, P.; Lv, Y. Research on the Identification of Particleboard Surface Defects Based on Improved Capsule Network Model. Forests 2023, 14, 822. [Google Scholar] [CrossRef]
  14. Zha, J.; Chen, X.; Wang, W.; Guan, Y.; Zhang, J. Small Defect Detection Algorithm of Particle Board Surface Based on Improved YOLOv5s. Comput. Eng. Appl. 2024, 60, 158–166. [Google Scholar]
  15. Guan, Y.; Wang, W.; Shen, T.; Li, J.; Wang, B. Surface defect detection method of particleboard based on improved YOLOv5s model. Appl. Innov. Technol. 2024, 5, 104–112. [Google Scholar] [CrossRef]
  16. Mehta, S.; Rastegari, M. MobileViT: Light-Weight, General-Purpose, and Mobile-Friendly Vision Transformer. In Proceedings of the International Conference on Learning Representations (ICLR), Virtually, 6 October 2021; pp. 1–26. [Google Scholar]
  17. Hu, W.; Wang, T.; Wang, Y.; Chen, Z.; Huang, G. LE–MSFE–DDNet: A Defect Detection Network Based on Low-Light Enhancement and Multi-Scale Feature Extraction. Vis. Comput. 2022, 38, 3731–3745. [Google Scholar] [CrossRef]
  18. Shao, L.; Zhang, E.; Duan, J.; Ma, Q. Enriched Multi-Scale Cascade Pyramid Features and Guided Context Attention Network for Industrial Surface Defect Detection. Eng. Appl. Artif. Intell. 2023, 123, 106369. [Google Scholar] [CrossRef]
  19. Lin, Q.; Zhou, J.; Ma, Q.; Ma, Y.; Kang, L.; Wang, J. EMRA-Net: A Pixel-Wise Network Fusing Local and Global Features for Tiny and Low-Contrast Surface Defect Detection. IEEE Trans. Instrum. Meas. 2022, 71, 2504314. [Google Scholar] [CrossRef]
  20. Pu, M.; Huang, Y.; Liu, Y.; Guan, Q.; Ling, H. EDTER: Edge Detection with Transformer. In Proceedings of the 2022 IEEE/CVF Conference on Computer Vision and Pattern Recognition (CVPR), New Orleans, LA, USA, 18–24 June 2022; pp. 1392–1402. [Google Scholar]
  21. Sunkara, R.; Luo, T. No More Strided Convolutions or Pooling: A New CNN Building Block for Low-Resolution Images and Small Objects. In Proceedings of the Machine Learning and Knowledge Discovery in Databases, Grenoble, France, 19–23 September 2022; Amini, M.-R., Canu, S., Fischer, A., Guns, T., Kralj Novak, P., Tsoumakas, G., Eds.; Springer Nature: Cham, Switzerland, 2023; pp. 443–459. [Google Scholar]
  22. Chen, Z.; He, Z.; Lu, Z.-M. DEA-Net: Single Image Dehazing Based on Detail-Enhanced Convolution and Content-Guided Attention. IEEE Trans. Image Process. 2024, 33, 1002–1015. [Google Scholar] [CrossRef]
  23. Akyon, F.C.; Onur Altinuc, S.; Temizel, A. Slicing Aided Hyper Inference and Fine-Tuning for Small Object Detection. In Proceedings of the 2022 IEEE International Conference on Image Processing (ICIP), Bordeaux, France, 6–19 October 2022; pp. 966–970. [Google Scholar]
  24. Zhang, Y.; Kang, B.; Hooi, B.; Yan, S.; Feng, J. Deep Long-Tailed Learning: A Survey. IEEE Trans. Pattern Anal. Mach. Intell. 2023, 45, 10795–10816. [Google Scholar] [CrossRef]
  25. Tang, Z.; Li, S. External Defects of Particleboard and Their Countermeasures. China For. Prod. Ind. 2005, 32, 26–28. [Google Scholar] [CrossRef]
  26. Wang, A.; Chen, H.; Liu, L.; Chen, K.; Lin, Z.; Han, J.; Ding, G. YOLOv10: Real-Time End-to-End Object Detection. In Proceedings of the Advances in Neural Information Processing Systems 38: Annual Conference on Neural Information Processing Systems 2024 (NeurIPS 2024), Vancouver, BC, Canada, 10–15 December 2024; pp. 1–21. [Google Scholar]
  27. Luo, W.; Li, Y.; Urtasun, R.; Zemel, R. Understanding the Effective Receptive Field in Deep Convolutional Neural Networks. In Proceedings of the Advances in Neural Information Processing Systems, Barcelona, Spain, 5–10 December 2016; Lee, D., Sugiyama, M., Luxburg, U., Guyon, I., Garnett, R., Eds.; Curran Associates, Inc.: Newry, UK, 2016; Volume 29, pp. 1–9. [Google Scholar]
  28. Xie, S.; Girshick, R.; Dollár, P.; Tu, Z.; He, K. Aggregated Residual Transformations for Deep Neural Networks. In Proceedings of the 2017 IEEE Conference on Computer Vision and Pattern Recognition (CVPR), Honolulu, HI, USA, 21–26 July 2017; pp. 5987–5995. [Google Scholar]
  29. Li, X.; Wang, W.; Wu, L.; Chen, S.; Hu, X.; Li, J.; Tang, J.; Yang, J. Generalized Focal Loss: Learning Qualified and Distributed Bounding Boxes for Dense Object Detection. In Proceedings of the Advances in Neural Information Processing Systems, Virtual, 6–12 December 2020; Curran Associates, Inc.: Newry, UK, 2020; Volume 33, pp. 21002–21012. [Google Scholar]
  30. Yu, F.; Koltun, V. Multi-Scale Context Aggregation by Dilated Convolutions. In Proceedings of the 4th International Conference on Learning Representations (ICLR), San Juan, Puerto Rico, 2–4 May 2016; pp. 1–13. [Google Scholar]
  31. Qiao, S.; Chen, L.-C.; Yuille, A. DetectoRS: Detecting Objects with Recursive Feature Pyramid and Switchable Atrous Convolution. In Proceedings of the 2021 IEEE/CVF Conference on Computer Vision and Pattern Recognition (CVPR), Nashville, TN, USA, 20–25 June 2021; pp. 10208–10219. [Google Scholar]
  32. Fu, J.; Zheng, H.; Mei, T. Look Closer to See Better: Recurrent Attention Convolutional Neural Network for Fine-Grained Image Recognition. In Proceedings of the 2017 IEEE Conference on Computer Vision and Pattern Recognition (CVPR), Honolulu, HI, USA, 21–26 July 2017; pp. 4476–4484. [Google Scholar]
  33. Yu, S.; Xue, G.; He, H.; Zhao, G.; Wen, H. Lightweight Detection of Ceramic Tile Surface Defects on Improved YOLOv8. Comput. Eng. Appl. 2024, 60, 88–102. [Google Scholar] [CrossRef]
  34. Ren, S.; He, K.; Girshick, R.; Sun, J. Faster R-CNN: Towards Real-Time Object Detection with Region Proposal Networks. IEEE Trans. Pattern Anal. Mach. Intell. 2017, 39, 1137–1149. [Google Scholar] [CrossRef]
  35. Lyu, C.; Zhang, W.; Huang, H.; Zhou, Y.; Wang, Y.; Liu, Y.; Zhang, S.; Chen, K. RTMDet: An Empirical Study of Designing Real-Time Object Detectors. arXiv 2022, arXiv:2212.07784. [Google Scholar] [CrossRef]
  36. Zhao, Y.; Lv, W.; Xu, S.; Wei, J.; Wang, G.; Dang, Q.; Liu, Y.; Chen, J. DETRs Beat YOLOs on Real-Time Object Detection. In Proceedings of the 2024 IEEE/CVF Conference on Computer Vision and Pattern Recognition (CVPR), Seattle, WA, USA, 16–22 June 2024; pp. 16965–16974. [Google Scholar]
  37. Bany Muhammad, M.; Yeasin, M. Eigen-CAM: Visual Explanations for Deep Convolutional Neural Networks. SN Comput. Sci. 2021, 2, 47. [Google Scholar] [CrossRef]
  38. Zhang, C.; Wang, C.; Zhao, L.; Qu, X.; Gao, X. A Method of Particleboard Surface Defect Detection and Recognition Based on Deep Learning. Wood Mater. Sci. Eng. 2025, 20, 50–61. [Google Scholar] [CrossRef]
  39. Ghiasi, G.; Lin, T.-Y.; Le, Q.V. NAS-FPN: Learning Scalable Feature Pyramid Architecture for Object Detection. In Proceedings of the 2019 IEEE/CVF Conference on Computer Vision and Pattern Recognition (CVPR), Long Beach, CA, USA, 15–20 June 2019; pp. 7029–7038. [Google Scholar]
  40. Bai, D.; Li, G.; Jiang, D.; Yun, J.; Tao, B.; Jiang, G.; Sun, Y.; Ju, Z. Surface Defect Detection Methods for Industrial Products with Imbalanced Samples: A Review of Progress in the 2020s. Eng. Appl. Artif. Intell. 2024, 130, 107697. [Google Scholar] [CrossRef]
Figure 1. The dataset construction process.
Applsci 15 04343 g001
Figure 2. Image acquisition system. ① Line-scan camera, ② lens, ③ linear light source, ④ particleboard, and ⑤ roller conveyor.
Applsci 15 04343 g002
Figure 3. Types of surface defects on the particleboard.
Applsci 15 04343 g003
Figure 4. Data augmentation method.
Applsci 15 04343 g004
Figure 5. PBD-YOLO algorithm architecture.
Applsci 15 04343 g005
Figure 6. Structure of the ShareSepHead.
Applsci 15 04343 g006
Figure 7. Structure of the improved C2f_SAC module.
Applsci 15 04343 g007
Figure 8. Structure of the SAC module.
Applsci 15 04343 g008
Figure 9. Structure of SPDDEConv.
Applsci 15 04343 g009
Figure 10. Distribution of the number of defects for each category before and after augmentation.
Applsci 15 04343 g010
Figure 11. Comparative experimental curves of different algorithms.
Applsci 15 04343 g011
Figure 12. Comparative experimental visualization results of different algorithms.
Applsci 15 04343 g012
Figure 13. Eigen-CAM heatmap: (a) original image, (b) baseline, (c) baseline + Slim, (d) baseline + Slim + ShareSepHead, (e) baseline + Slim + SPDDEConv, (f) baseline + Slim + C2f_SAC, (g) baseline + Slim + ShareSepHead + SPDDEConv, (h) baseline + Slim + SPDDEConv + C2f_SAC, (i) baseline + Slim + ShareSepHead + C2f_SAC, and (j) PBD-YOLO.
Applsci 15 04343 g013
Figure 14. Comparison of convergence speed during training.
Applsci 15 04343 g014
Table 1. Results of different defect detection algorithms.
AlgorithmmAP50mAP50–95RecallParametersTime
Faster R-CNN0.7020.4450.54184.7 M25.10 ms
YOLOv5s0.7360.4920.70318.6 M3.08 ms
RTMDet-s0.8360.5660.67639.03 M54.20 ms
RT-DETR-ResNet500.7930.5830.77686.1 M8.10 ms
YOLOv10s0.8010.5750.68415.9 M3.15 ms
PBD-YOLO (ours)0.8560.6090.81414.1 M3.16 ms
Bold text indicates that the algorithm performs best in this metric.
Table 2. Results of the ablation experiment.
AlgorithmSlimShareSepHeadSPDDEConvC2f_SACmAP50mAP50–95RecallParametersTime
A----0.8040.5750.68415.9 M3.15 ms
B---0.7560.5290.6909.8 M2.04 ms
C--0.8280.5620.7799.8 M1.73 ms
D--0.8170.5710.74311.5 M2.18 ms
E--0.7940.5590.73111.1 M2.84 ms
F-0.8230.5510.76610.8 M2.21 ms
G-0.8470.6030.79515.6 M3.16 ms
H-0.8450.5990.79312.5 M2.58 ms
I0.8560.6090.81414.1 M3.16 ms
Bold text indicates that the algorithm performs best in this metric.
Table 3. Comparison of mAP50 of different types of defects.
Defect ClassmAP50
ABCDEFGHI
Spot-like defects0.7560.7620.8430.8380.7890.8430.8370.8720.832
Shavings0.8000.7130.8620.7470.8190.8040.9050.8280.837
Oil pollution0.4520.4410.4440.4150.4480.4600.5440.5090.573
Edge breakage0.9540.8910.9630.9640.9360.9590.9640.9610.961
Chalk marks0.5870.8230.9030.8940.8970.8870.9010.9150.919
Scratches0.8680.7560.8230.9140.7410.8630.8310.8810.903
Cracks0.9390.9030.9550.9490.9260.9480.9470.9510.970
Bold text indicates that the algorithm performs best in this metric.
Table 4. Comparison of recall of different types of defects.
Defect ClassRecall
ABCDEFGHI
Spot-like defects0.5950.7700.7850.7700.7540.8030.6890.8520.820
Shavings0.5880.5710.8010.6670.7620.7140.9020.7620.759
Oil pollution0.2950.3750.4250.2760.3810.3390.460.4460.503
Edge breakage0.9000.8330.9330.9330.9060.9670.9330.9670.933
Chalk marks0.7500.7500.7320.7860.8210.8260.8070.7860.857
Scratches0.7730.6940.8290.8290.6570.7710.8300.7940.883
Cracks0.8890.8330.9440.9440.8330.9440.9440.9440.944
Bold text indicates that the algorithm performs best in this metric.
Disclaimer/Publisher’s Note: The statements, opinions and data contained in all publications are solely those of the individual author(s) and contributor(s) and not of MDPI and/or the editor(s). MDPI and/or the editor(s) disclaim responsibility for any injury to people or property resulting from any ideas, methods, instructions or products referred to in the content.

