Abstract
Acceleration and Acceleration-Initial Speed Running are important factors in soccer performance. The aims of the study were (a) analyze by playing position the acceleration-initial speed (AS0) profile and (b) analyze the relevance of the number of accelerations > 3 m·s−2 according to final league position. The subjects (n = 309) from the Spanish First Division during the 2021–2022 and 2022–2023 seasons were classified in six positions: Central Defenders (CD), Full Backs (FB), Central Midfielders (CM), Offensive Midfielders (OF), Wingers (W), and Forwards (F). A total of 6180 match observations were recorded using the Mediacoach System. The parameters analyzed were accelerations > 3 m·s−2 and AS0 profile variables, maximal theoretical acceleration (A0Int), and maximal theoretical initial running speed (S0Int). The AS0 profile was calculated using a linear regression model. Welch’s analysis of variance (ANOVA) revealed a consistent relationship between the A0Int variable of the AS0 profile and team success in CM, FB, and W positions. Moreover, the successful teams for CD, CM, FB, OM, and W positions showed a statistically higher number of accelerations > 3 m·s−2 than unsuccessful teams. In conclusion, these findings suggest the importance of enhancing acceleration abilities, particularly for lower-performing teams, to achieve the physical standards of successful teams.
1. Introduction
Soccer is an intermittent sport characterized by the prevalence of long periods of low-intensity activity with short periods of high-intensity efforts, such as sprints and accelerations [1]. These high-intensity efforts are typically associated with neuromuscular fatigue and risk of injury [2] and represent approximately 1–11% of total distance covered in a match [3], increasing the importance of preparing soccer players to perform high-intensity actions.
Physical performance is a key factor for the team’s success in competition, due to the increase in high-intensity actions in competition in recent years [4]. Previous studies showed that physical performance is not related to team success at the end of the season in La Liga, Premier League, and Italian Serie A for variables associated with total distance and distance covered per speed zone [5,6,7]. Players from the highest-ranked teams covered less total distance > 19.8 km·h−1 and total distance > 19.8 km·h−1 without ball possession than players from less successful teams [6]. However, the highest-ranked teams covered higher distances above >14 km·h−1, >19 km·h−1, and >24 km·h−1 with ball possession than soccer players from less successful teams [5,7]. Del Coso et al. (2020) [8] analyzed the maximum capacities of soccer teams in LALIGA and showed that successful and less successful teams had similar high maximum running speeds. However, maximal or near-maximum running speeds occur in critical action during the game, and the average duration of each sprint was between ~4.9 s and 9 s, with an average distance covered between ~30 and 55 m [9], while the highest intensity actions occurred with less than 20 m distance covered, and the average duration of each action was between ~2 s and 4 s [10]. Hence, the maximal running speed values are difficult to achieve in soccer matches [8]. Moreover, short, intense actions are associated with high metabolic demands such as low and moderate velocity [11]. For this reason, short-intensity actions such as accelerations, decelerations, and changing directions are important to evaluate. However, although accelerations are key actions in soccer and [12] is one of the most commonly used variables of external load quantification [13], studies have only analyzed the relationship between external load and team success through variables related to the distances covered per speed zone.
Currently, accelerations are quantified by absolute thresholds, considering high-intensity accelerations those that exceed the threshold of 2.5–4 m·s−2 [14]. However, the increase in speed causes a decrease in the acceleration capacity, with the highest peak of acceleration at the beginning of the running phase. As such, external load quantification by absolute thresholds underestimates accelerations with high initial running speed for the descent of the capacity of acceleration and overestimates acceleration with low initial running speed [15].
In recent years, studies have examined the relationship between acceleration and running speed to evaluate and quantify high-intensity actions. Sonderegger et al. (2016) [15] introduced a new methodological approach to assess high-intensity accelerations relative to the percentage of maximum acceleration at a specific running speed, measured through a sprint test. According to this method, accelerations exceeding 75% of the maximum acceleration in each speed zone are classified as high-intensity accelerations [15], revealing differences in the number of maximum accelerations performed at various initial running speeds depending on positional roles [16,17]. More recently, a novel methodology has been proposed to classify acceleration and deceleration intensity based on the individual percentage intensity method developed by Sonderegger et al. (2016) [15]. This approach evaluates accelerations from training and match data within 5 km·h−1 speed intervals, measured using GPS, rather than relying on specific field tests [18].
Alternative methodologies had been proposed to analyze the relationship between acceleration and running speed with GPS technology. The acceleration-speed (AS) profile proposed by Morin et al. (2021) [19] to evaluate in-situ sprint performance in real context is close to the horizontal force–velocity profile [20]. Recent studies used the AS profile to analyze team and individual seasonal changes in performance, analyze the differences between positions and age groups, and analyze the variability of the AS profile according to the microcycle day [21,22,23]. Moreover, di Prampero et al. (2023) [24] and Osgnach et al. (2024) [25] proposed a new quantification method of metabolic and mechanical load to improve the traditional analyses based on acceleration or distance covered per speed zone alone yield partial information. The mechanical and metabolic power combine at the same time acceleration and speed to assess performance.
To date, we do not have evidence that characterizes the acceleration-initial speed running (AS0) profiles of the teams according to success and the position role in soccer players. Moreover, it is unknown if high-intensity accelerations, traditionally quantified by absolute thresholds that exceed 3 m·s−2 in LALIGA [26,27], are associated with the team’s success in competition. For this reason, the aims of the study were (a) analyze by position role the maximal acceleration capabilities relative to initial speed running on the team’s ranking at the end of the season and (b) analyze the relevance of the number of accelerations above 3 m·s−2 according to the final league position. We hypothesized that successful soccer teams have players with higher acceleration and velocity capacities relative to initial speed running than less successful teams, and high-ranked teams performed more accelerations above 3 m·s−2.
2. Materials and Methods
2.1. Study Design
A retrospective, descriptive longitudinal study was designed to analyze acceleration profiles of professional soccer players during competitive matches from the Spanish First Division during the 2021–2022 and 2022–2023 seasons. The Spanish First Division is composed of 20 teams competing in a total of 38 rounds. The teams were grouped into equal groups, starting with the top 4 teams competing in the Champions League. In the upper table (UT), teams were grouped from first to fourth place; the upper middle table (UMT) was grouped from fifth to eighth place; the middle table (MT) was grouped from ninth to twelfth place; the lower middle table (LMT) was grouped from thirteenth to sixteenth place; and the lower table (LT) was grouped from seventeenth to twentieth place.
2.2. Subjects
309 professional male soccer players from the Spanish First Division (LALIGA) participated in the study. The study included soccer players who played a minimum of 90 min in the match [5,6]. A total of 6180 match observations were considered for data analysis. Soccer players were classified by the Mediacoach system in six groups, according to the position role: Central Defenders CD (n = 69; observations = 1960); Full Backs or External Defenders, FB (n = 67; observations = 1392); Central Midfielders, CM (n = 47; observations = 981); Offensive Midfielders, M (n = 38; observations = 551); Wingers or External Midfielders, WG (n = 67; observations = 664); Forwards, FW (n = 48; observations = 632). The average of match observations per player in 2021–2022 was 12.5 ± 9.31, and in 2022–2023 it was 12.2 ± 9.17. Goalkeepers were excluded from the study for the different nature of their activity profile. The study received ethical approval from the Universidad Autónoma de Madrid (CEI-144-3233), in accordance with the latest version of the Declaration of Helsinki.
2.3. Procedures
Match soccer performance demands were recorded using the Mediacoach® system, which is based on a 4K-HDR multi-camera semi-automatic video technology that tracks players’ movement at a frequency of 25 Hz (La LigaTM, Madrid, Spain). The video tracking system (TRACAB’s Gen5) is integrated by a positioning system that calculates the position (x, y coordinates) and height (z coordinates) of the soccer players with three-dimensional tracking in real time. TRACAB’s Gen5 (Chyronhego, New York, NY, USA) is a valid and reliable instrument to assess running distances at different speeds [28], accelerations, and decelerations in professional soccer players [29].
2.4. Variables and Data Analysis
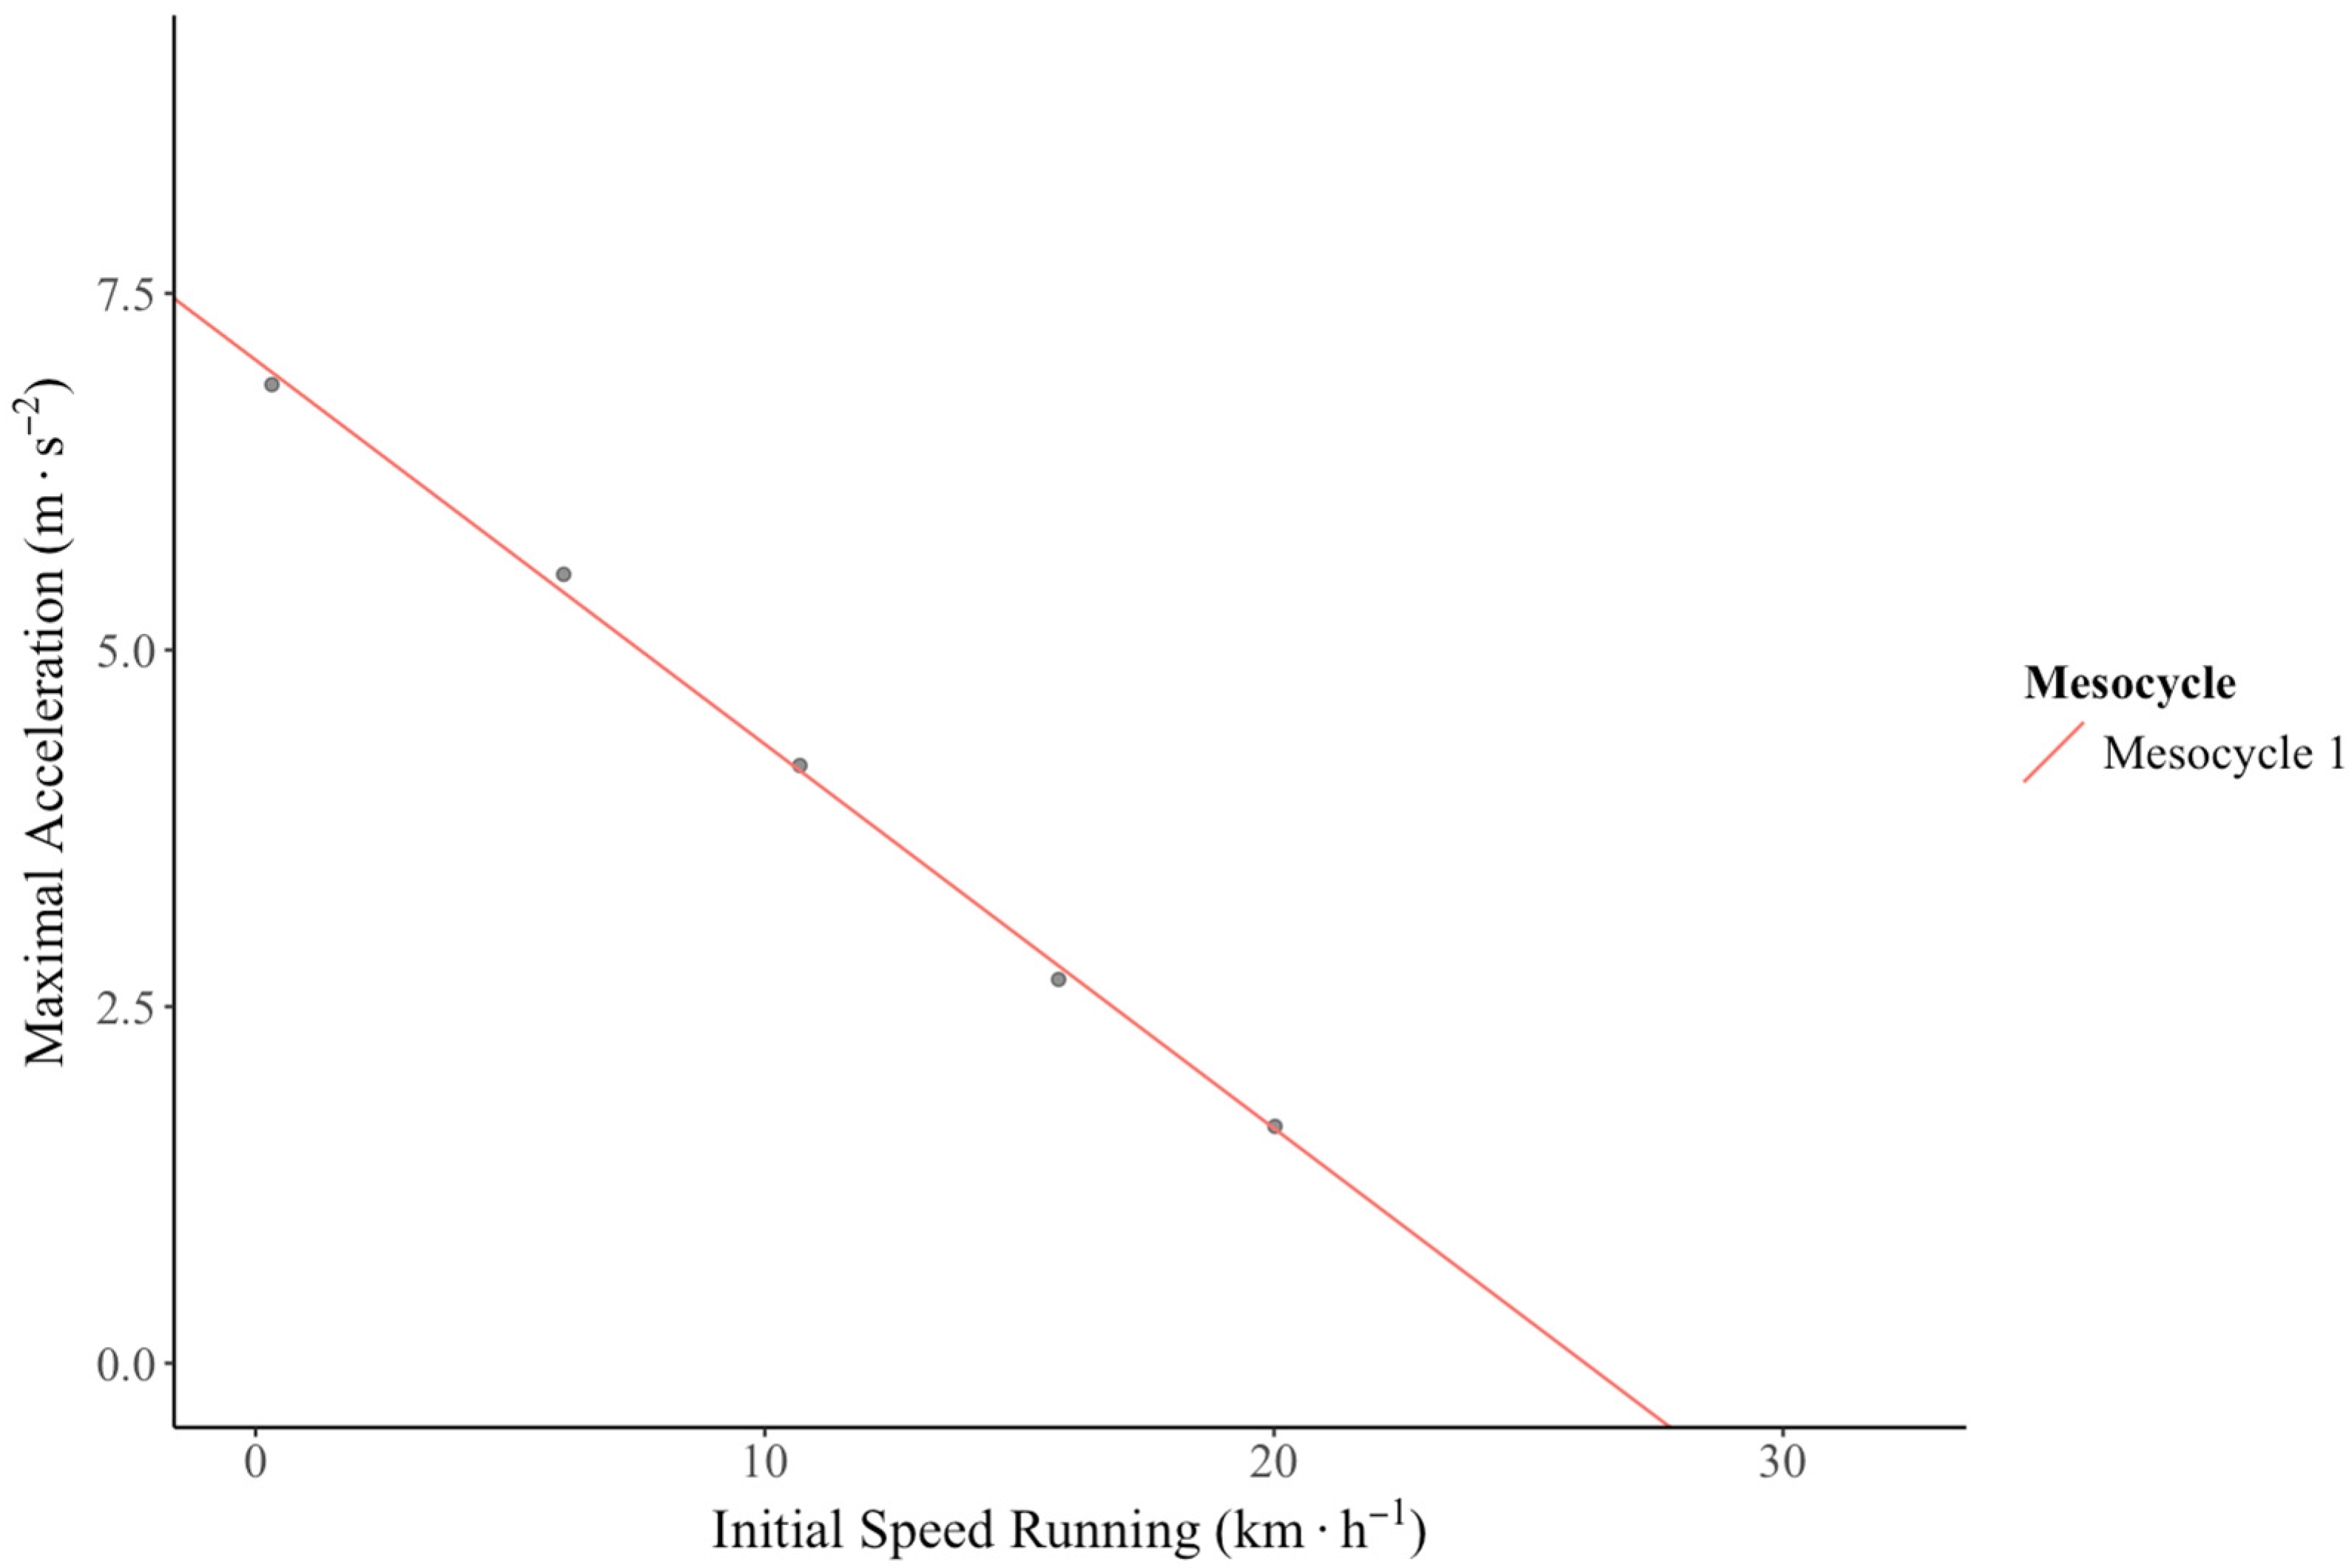
AS0 profiles in competition were analyzed from a mesocycle (4 weeks) [18]. The mesocycle includes the competitions played over the four weeks, including the matches postponed in the corresponding competition week. Initial running speed and maximal acceleration were obtained from the database. The data were filtered and processed using “the density-based clustering algorithm” (DBSCAN) [30,31], values without neighbors in the scatter plot were removed for each player. After removing the outliers of each player, the data was sorted in relation to the team’s ranking position and the player’s position role. For the analysis of the AS0 profile of each player, the maximum acceleration value realized for each subinterval of 5 km·h−1 was selected [18]. Players AS0 profile was characterized by three main variables [19]: A0Int is maximal theoretical acceleration (interception of the regression line with the y-axis; speed: 0 km·h−1); S0Int: maximal theoretical initial running speed (interception of the regression line with the x-axis; acceleration: 0 m·s−2); Slope (orientation of the acceleration-initial running speed linear relationship): AS0Slope = −A0Int/S0Int. Figure 1 shows the AS0 profile per mesocycle for a professional soccer player. The external load used to quantify player performance in the match was the number of high-intensity accelerations above the absolute threshold of 3 m·s−2.
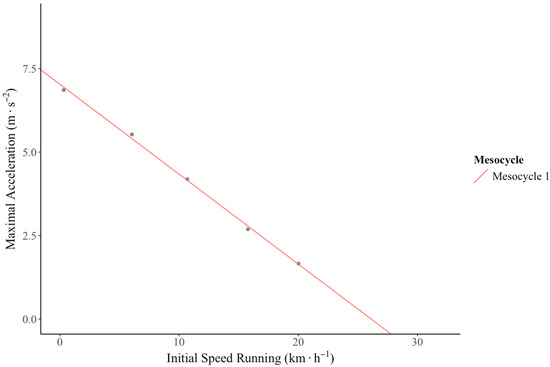
Figure 1.
Example of an individual acceleration-initial speed profile obtained from the data of the mesocycle.
2.5. Statistical Analysis
Data are presented as means ± standard deviation (SD). The quality of linear lifting of the acceleration and initial speed running was assessed with R2 values. All variables presented a normal distribution (Kolmogorov–Smirnov Test), although they showed unequal variance (Levene’s Test). Welch’s ANOVA was used to analyze the differences between the variable A0Int, S0Int, and the number of accelerations >3 m·s−2. Post-hoc analysis (Games–Howell test) was used to determine which means differ when the homogeneity of variances is violated. Statistical significance was established for a p-value < 0.05. Cohen’s effect size with Hedges correction was used to compare the magnitude of differences between the groups in each of the variables [32] and interpreted as follows: <0.2, 0.2–0.5, 0.5–8.0, >8.0 for trivial, small, moderate, and large, respectively. Pearson’s correlation coefficient was used to identify associations between AS0 profile main variables and the highest accelerations >3 m·s−2 on the mesocycle. RStudio (version 4.4.1 2009–2024; RStudio, PBC, macOS) was used for statistical analysis with the rstatix [33] package. Tidyverse (version 2.0.0) [34], ggstatsplot (version 0.13.0) [35], and dbscan (1.2.0) [36] packages were used to create graphs, edit worksheets, and detect outliers.
3. Results
The AS0 profile showed nearly perfect linear trends (R2 = 0.964 ± 0.027). There was low correlation between AS0 and the highest accelerations >3 m·s−2 (r = 0.347, p = < 0.001). The main variable of the AS0 profile (A0Int and S0Int) and the number of Acc >3 m·s−2 are shown in Table 1.

Table 1.
Descriptive data of performance variables and comparison between groups.
3.1. AS0 Profile
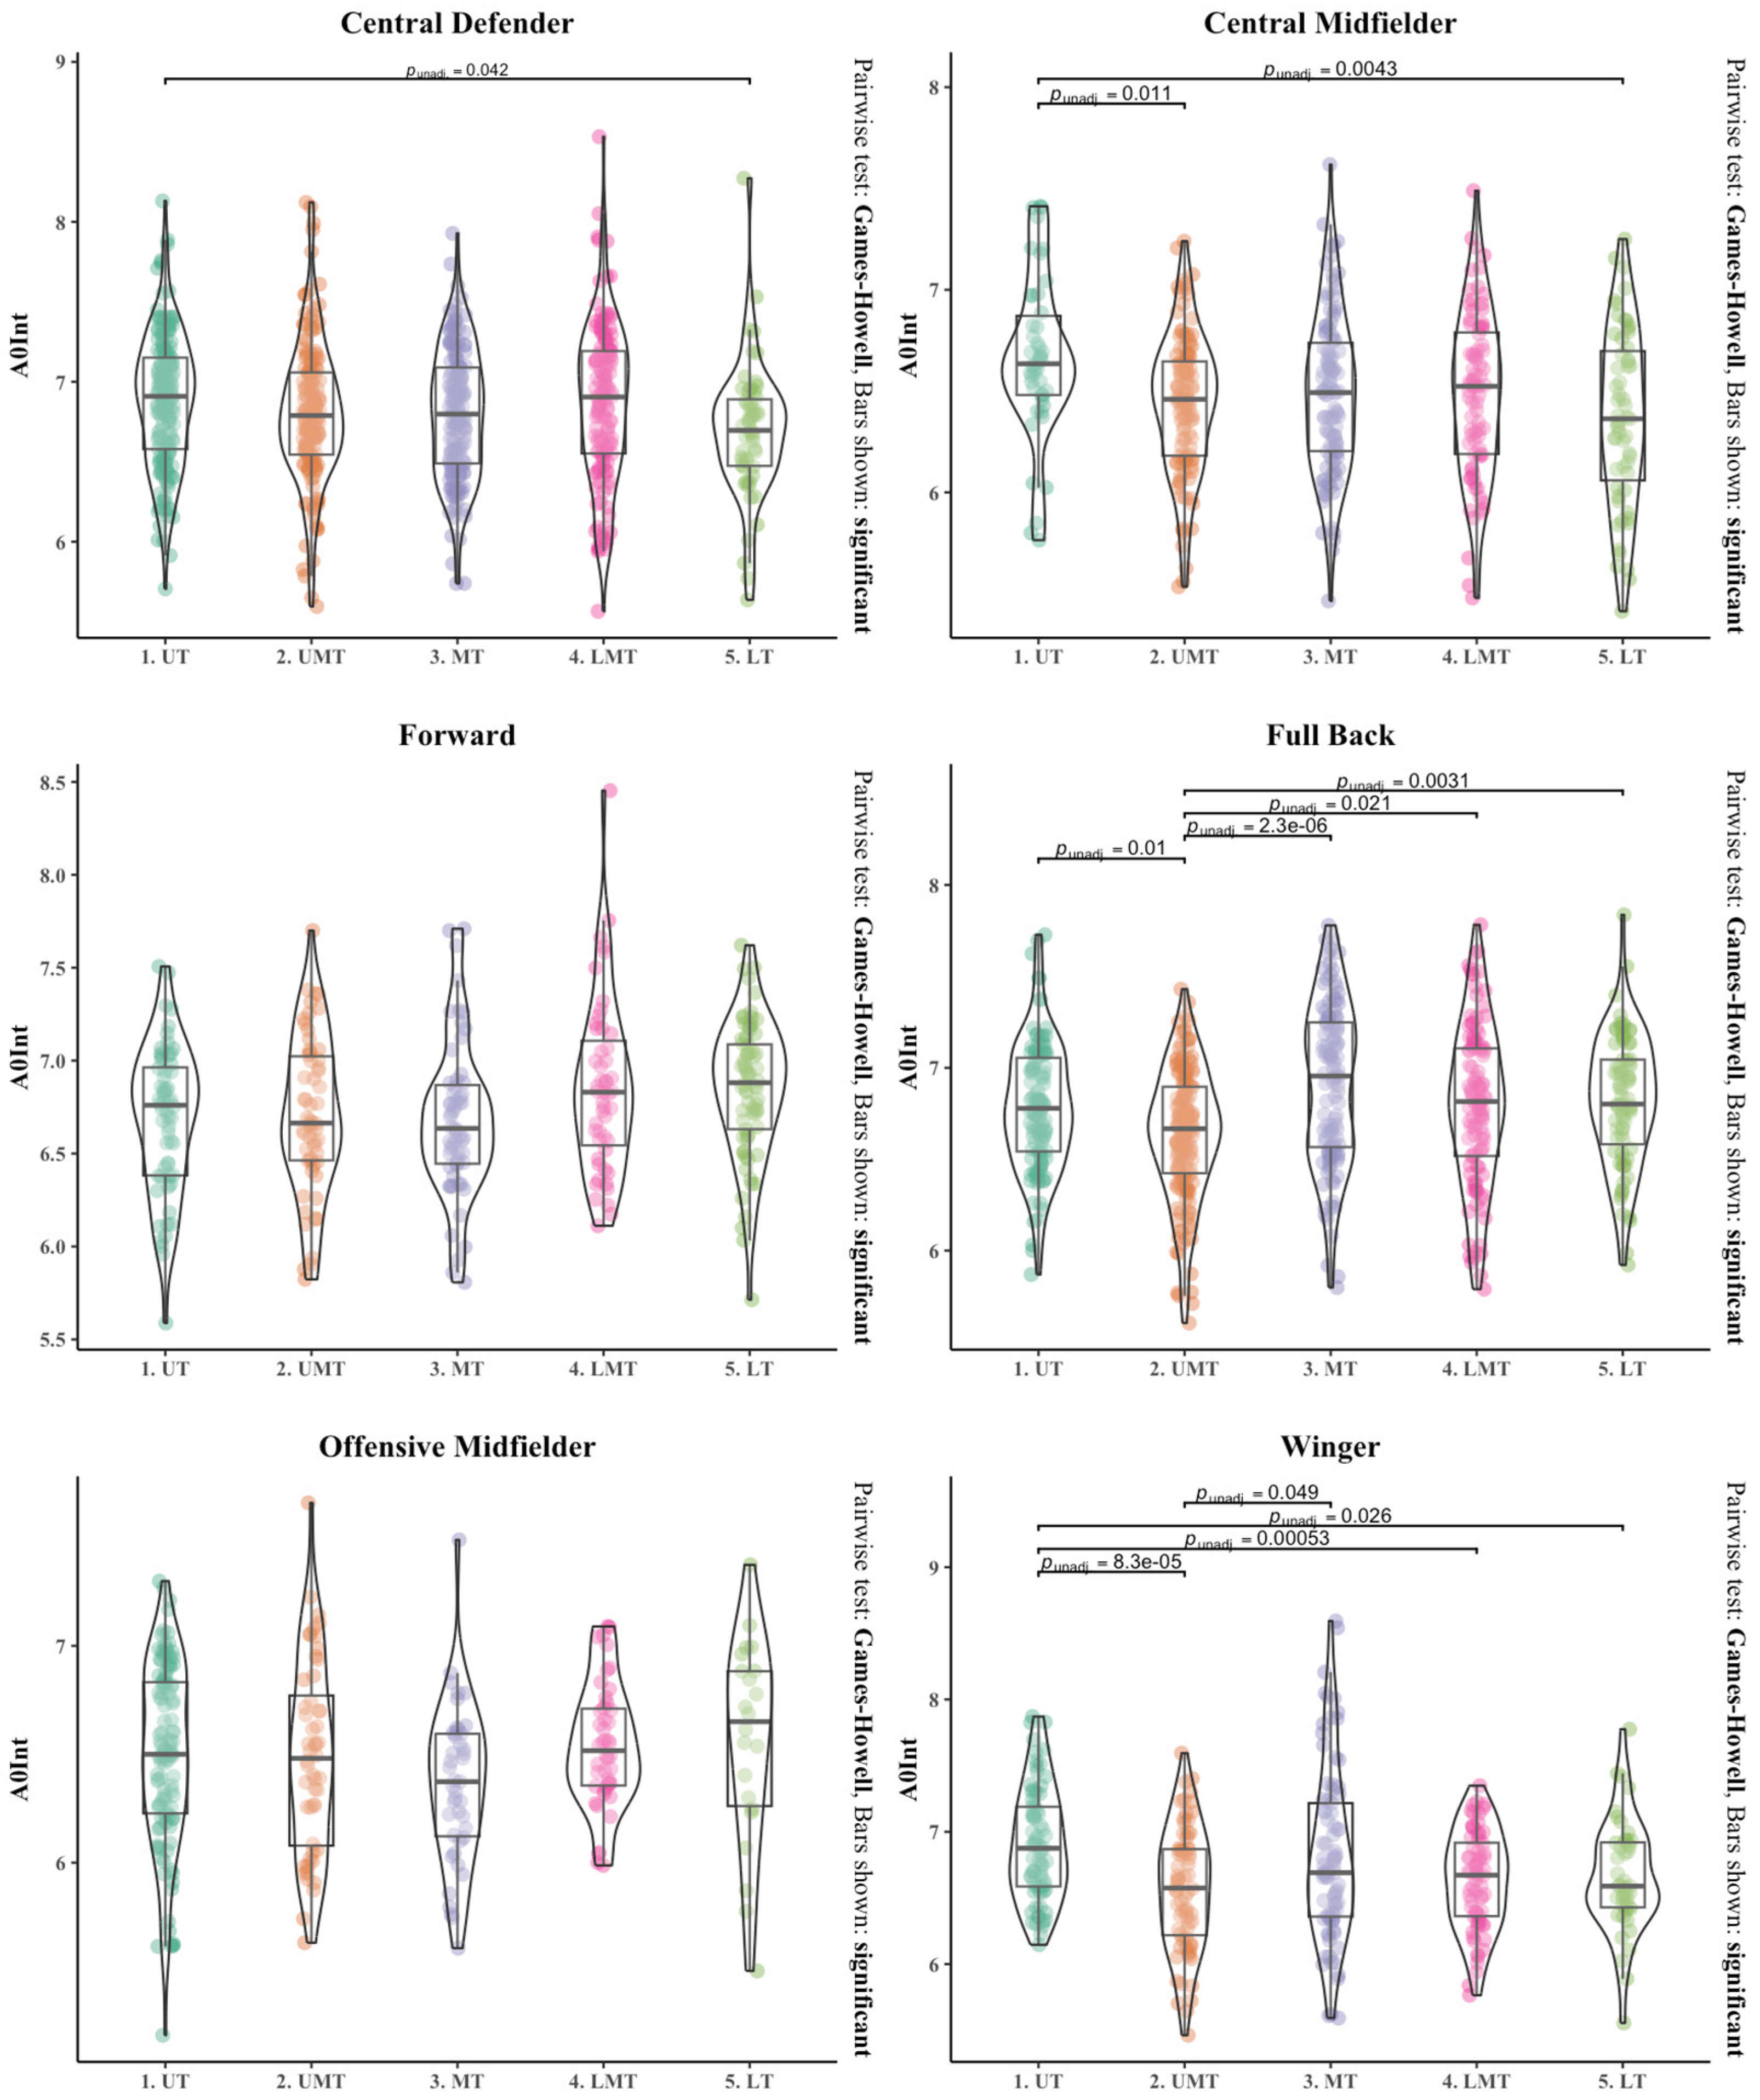
Welch’s ANOVA showed significant differences between groups (F = 13.79, p = < 0.001). In A0Int, significant results were obtained in the high-ranked teams compared to the lower-ranked teams in CD, CM, and W positions. UT teams showed higher A0Int, with a small effect size when compared to LT in CD (UT vs. LT: ES = 0.443, p = 0.042), moderate effect size in CM (UT vs. LT: ES = 0.701, p = 0.004), and W positions (UT vs. LT: ES = 0.572, p = 0.026). Moreover, the CM position of UT showed moderate significant differences when compared to UMT (UT vs. UMT: ES = 0.599, p = 0.011), and the W position of UT showed moderate significant differences when compared to UMT (UT vs. UMT: ES = 0.759, p = < 0.001) and LMT (UT vs. UMT: ES = 0.690, p = 0.001). However, the FB position of UMT showed lower A0Int, with a small effect size when compared to UT (UT vs. UMT: ES = 0.411, p = 0.010), moderate significant differences when compared to MT (UMT vs. MT: ES = −0.672, p = < 0.001), small significant differences when compared to LMT (UMT vs. LMT: ES = −0.390, p = 0.021), and moderate significant differences when compared to LT (UMT vs. LT: ES = −0.506, p = 0.003). Moreover, the W position of UMT showed small significant differences when compared to MT (UMT vs. MT: ES = −0.436, p = 0.049) (see Figure 2).
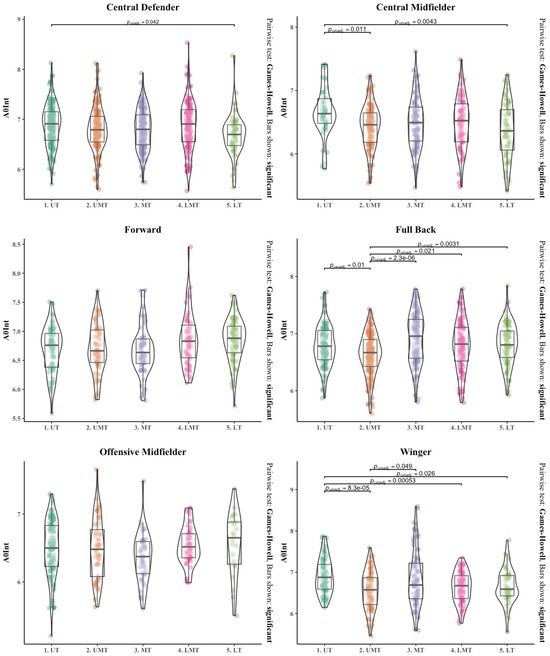
Figure 2.
A0Int variable of AS0 profile obtained from the data of the mesocycle is shown as jittered dots. The summary data are shown as a violin plot and boxplot, representing the median of the data and the interquartile range. Bars showed significant differences.
In the S0int variable, no statistically significant results were obtained. However, the F position of LT teams showed small significant differences when comparing S0Int to MT (MT vs. LT: ES = −0.489, p = 0.046).
3.2. Acc > 3 m·s−2 Variable
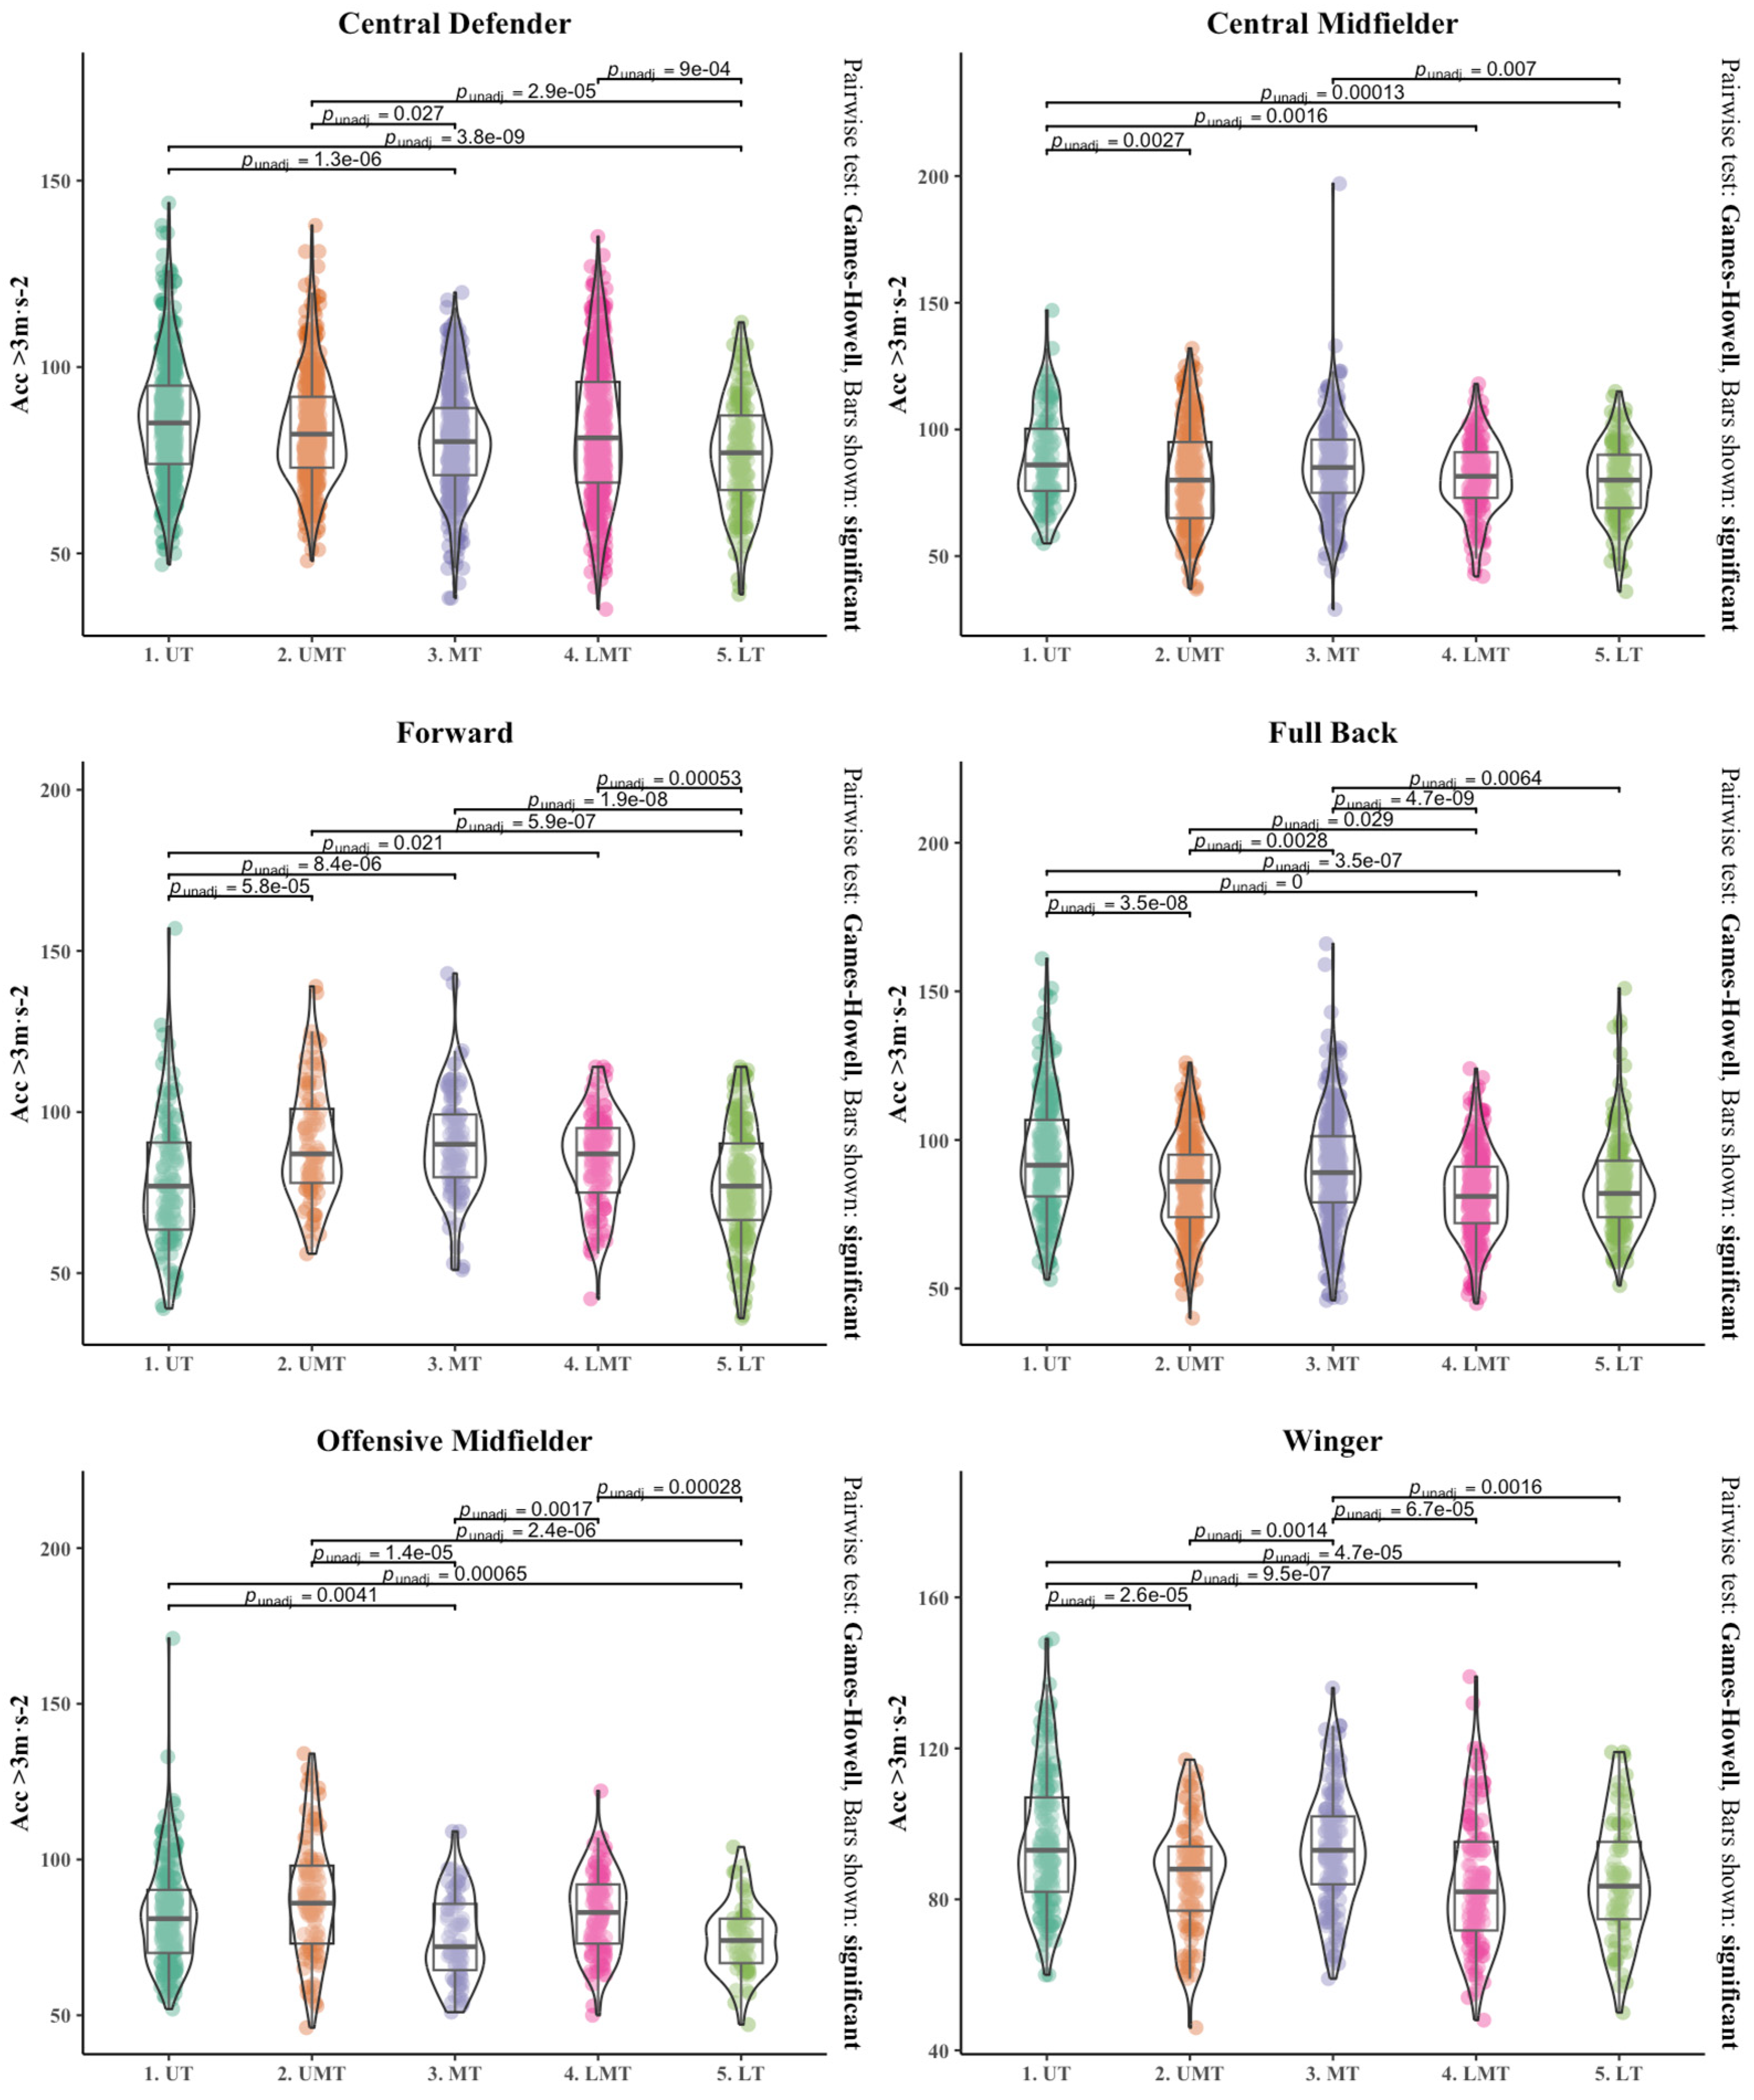
Welch’s ANOVA showed significant differences between groups (F = 16.91, p = < 0.001). In the Acc > 3 m·s−2 variable, significant results were obtained in the high-ranked teams compared to the lower-ranked teams (see Figure 3).
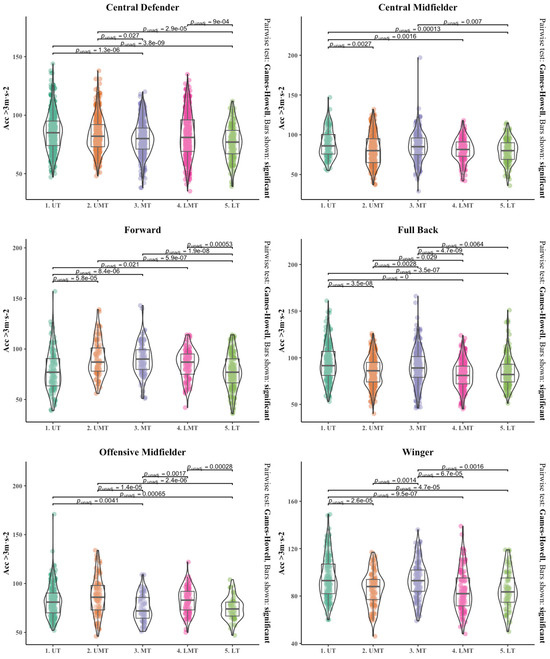
Figure 3.
Total Acc > 3 m·s−2 obtained from the match are shown as jittered dots. The summary data are shown as a violin plot and boxplot, representing the median of the data and the interquartile range. Bars showed significant differences.
The CD position of UT showed a higher number of Acc > 3 m·s−2, with a moderate effect size when compared to LT (UT vs. LT: ES = 0.574, p = < 0.001). UMT and LMT showed small significant differences when compared to LT (UMT vs. LT: ES = 0.440, p = < 0.001; LMT vs. LT: ES = 0.343, p = 0.001). Moreover, UT showed small significant differences when compared to MT (UT vs. MT: ES = 0.347, p = < 0.001), and UMT showed trivial significant differences when compared to MT (UMT vs. MT: ES = 0.198, p = 0.027) (see Table 2).
Table 2.
Effect side and p-value.
The CM position of UT showed a higher number of Acc > 3 m·s−2, with a small effect size when compared to UMT (ES = 0.394, p = 0.003), LMT (ES = 0.467, p = 0.002), and moderate significant differences when compared to LT (ES = 0.559, p = < 0.001). Moreover, MT showed small significant differences when compared to LT (ES = 0.346, p = 0.007).
The F position of UMT and MT showed a higher number of Acc >3 m·s−2, with a moderate effect size when compared to UT (UT vs. UMT: ES = −0.619, p = < 0.001; UT vs. MT: ES = −0.661, p = < 0.001), and LMT showed small significant differences when compared to UT (UT vs. LMT: ES = −0.387, p = 0.021). Moreover, UMT and MT showed moderate significant differences when compared to LT (UMT vs. LT: ES = 0.708, p = < 0.001; MT vs. LT: ES = 0.758, p = < 0.001), and LMT showed small significant differences when compared to LT (LMT vs. LT: ES = 0.469, p = 0.001).
FB position of UT showed a higher number of Acc > 3 m·s−2, with a moderate effect size when compared to UMT (ES = 0.521, p = < 0.001), LMT (ES = 0.737, p = < 0.001), and LT (ES = 0.535, p = < 0.001). UMT showed small significant differences when compared to LMT (ES = 0.235, p = 0.029). Moreover, MT showed small significant differences when compared to UMT (UMT vs. MT: ES = −0.281, p = 0.003), LMT (LT vs. LMT: ES = 0.499, p = < 0.001), and LT (MT vs. LT: ES = 0.301, p = 0.006).
The OM position of UT showed a higher number of Acc > 3 m·s−2, with a small effect size when compared to MT (UT vs. MT: ES = 0.465, p = 0.004). UMT and LMT showed moderate significant differences when compared to MT (UMT vs. MT: ES = 0.749, p = < 0.001; MT vs. LMT: ES = −0.579, p = 0.002). Moreover, UT and LMT showed moderate significant differences when compared to LT (UT vs. LT: ES = 0.540, p = 0.001; LMT vs. LT: ES = 0.679, p = < 0.001), and UMT showed large significant differences when compared to LT (UMT vs. LT: ES = 0.828, p = < 0.001).
The W position of UT showed a higher number of Acc > 3 m·s−2 with a moderate effect size when compared to UMT (UT vs. UMT: ES = 0.574, p = < 0.001), and MT showed small significant differences when compared to UMT (UMT vs. MT: ES = −0.466, p = 0.001). Moreover, UT and MT showed moderate significant differences when compared to LMT (UT vs. LMT: ES = 0.623, p = < 0.001: MT vs. LMT: ES = 0.525, p = < 0.001) and LT (UT vs. LT: ES = 0.627, p = < 0.001; MT vs. LT: ES = 0.526, p = 0.002).
4. Discussion
The study was designed to characterize the AS0 profile and the number of accelerations >3 m·s−2 from LALIGA professional soccer players. The main findings of the study were that UT teams perform higher intensity accelerations >3 m·s−2 compared to the LT teams, especially in CD, CM, FB, OM, and W positions. Moreover, UT teams showed greater capacity to perform higher intensity accelerations compared with LMT in CM, FB, and W positions. In contrast, successful and unsuccessful teams had the same performance parameters in the A0Int and S0Int variables. However, in the A0Int variable, statistically significant differences were found in CD, CM, and W positions when comparing the teams in UT with the teams in LT. The relationship between acceleration capabilities and success in competition seems to be limited to certain teams that have achieved a greater performance (UT), especially in certain positions and with respect to LT. The main finding of this study supports the idea that team success in competition could be affected by physical performance.
From our knowledge, this is the first study to analyze physical variables such as accelerations to relate physical performance to success in competition. The analysis of the current data has revealed results that contrast with other LaLiga studies, where no statistically significant differences in running demands were observed between successful and less successful teams [5]. However, previous research on English Premier League and Italian Serie A teams found that less successful teams covered more total distance, including total distances at speeds of 14–19 km·h−1 [7] and above 19.8–25.2 km·h−1, compared to successful teams [6]. Our findings indicated differences, with UT teams performing more high-intensity accelerations (>3 m·s−2) than LT teams across positions such as CD, CM, FB, OM, and W. Additionally, AS0 profiles showed higher values in CM, FB, and W positions.
Previous research analyzed soccer physical performance factors combined with technical-tactical data (e.g., possession ball), and the results demonstrated that successful teams cover greater total distance and distance per zone velocity than less successful teams [7,37,38]. However, previous studies described differences in results between distance covered per speed zones with and without ball possession [6]. Chmura et al. (2022) [37] observed that in the First German League (Bundesliga), the most successful teams covered more running distance and performed more sprint actions (>6 m·s−1) with ball possession. In the Italian Serie A, the highest-ranked teams covered greater distances above 14 and 19 km·h−1 with ball possession [7].
Our findings concerning the capacity of UT teams to perform higher accelerations above 3 m·s−2 could be related to technical-tactical performance and contextual factors. Previous studies showed that a team’s success correlated with offensive variables like goals scored [39], where the sprint is the most frequent action of the scoring or assisting player [40]. Moreover, offensive and defensive variables like creating a shot on target, ball possessions, running with the ball, physical efforts to avoid a counterattack, and defending a goal [39] have been associated with successful teams and high-intensity actions (e.g., accelerations and sprints) [39,41].
Currently, the maximum sprint capacities in the peak running speed variables in LALIGA have also been investigated, observing that the maximum speeds are not related to the team success in competition [8]. In the present study, similar results were obtained when analyzing the S0Int variable. There is no difference between the acceleration capacity at high-speed running in successful and unsuccessful teams, observed in the S0Int variable.
4.1. Limitations and Future Research
The present study presents some limitations and needs of future research to improve the knowledge of the maximum acceleration capacities and the number of high-intensity efforts of professional soccer players.
First, the methodology for evaluating the maximum acceleration capacities at different initial speeds to obtain the AS0 profile is not carried out with a sprint test, although it has been evaluated using the data provided by the multi-camera tracking system. However, we know that maximal acceleration can be questioned, and therefore we considered four microcycles for assessing the maximal acceleration capacities [18]. However, as in the study by Silva et al. (2024) [18], the aim of this AS0 profile is to make a methodological adaptation to the study proposed by Sonderegger et al. (2016) [15]. Therefore, future research could include a comparison of different methodologies to assess the AS0 profile.
Second, from our knowledge, despite being the first article to introduce acceleration variables for the analysis, in future research it would be interesting to replicate the study by including technical-tactical data and contextual match variables. The technical-tactical data determining the success of the team [42,43] and contextual variables affect physical performance variables during the match [44].
Finally, player data per match can interfere with the evaluation of maximum acceleration capacity; there were players who have only played a single match in the mesocycle.
4.2. Future Research
This study contributes to improving the knowledge of the maximum acceleration capacities and the number of high-intensity efforts of professional soccer players; however, more research is needed in this area of knowledge. First, more research on the AS0 profile is needed to understand the potential practical applications in quantifying and evaluating the soccer players performance. Furthermore, future research is needed, which could include (a) a comparison of the GPS-obtained AS0 profile with maximal accelerated sprints from different initial running speeds, (b) the development of absolute intensity thresholds in relation to acceleration and initial running speed to compare performance among soccer players, (c) the changes in AS0 profile over a full season, and (d) differences between sexes and ages.
4.3. Practical Applications
The findings of this study have an important application for the performance assessment of soccer players. Strength and Conditioning Coach or performance staff should consider these values of the AS0 profile to compare with the players in your team to modify the training aimed at improving the mechanical properties of the sprint and increasing the capacity to perform high-intensity efforts. This methodology can help to evaluate the physical performance in the match or in training without the need to perform field tests over the season. AS0 profile could help detect declines in physical performance over the season.
5. Conclusions
In conclusion, this study provides novel insights into the acceleration-initial running speed (AS0) profile of professional soccer players, emphasizing its relevance in assessing and optimizing physical performance in relation to competitive success. While the most successful teams (UT) exhibited a higher capacity for high-intensity accelerations and a higher ability to accelerate in specific key positions, only a consistent relationship was found between the AS0 profile and overall competitive success in CM, FB, and W positions. The findings highlighted the importance of tailoring training programs to enhance acceleration abilities, particularly for lower-performing teams to achieve the physical standards of successful teams.
Author Contributions
Conceptualization, J.L.Q.-I., V.C.-P. and R.Z.-M.; methodology, J.L.Q.-I., V.C.-P. and F.N.; software, J.L.Q.-I.; validation, J.L.Q.-I., R.Z.-M., F.N. and V.C.-P.; formal analysis, J.L.Q.-I.; investigation, J.L.Q.-I., R.Z.-M., F.N., R.L.-D.C. and V.C.-P.; resources, J.L.Q.-I., F.N. and R.L.-D.C.; data curation, J.L.Q.-I.; writing—original draft preparation, J.L.Q.-I.; writing—review and editing, J.L.Q.-I., R.Z.-M., F.N., R.L.-D.C. and V.C.-P.; visualization, J.L.Q.-I.; supervision, V.C.-P. and F.N.; project administration, J.L.Q.-I., V.C.-P. and F.N.; funding acquisition, V.C.-P. All authors have read and agreed to the published version of the manuscript.
Funding
This research received no external funding.
Institutional Review Board Statement
The study was conducted in accordance with the Declaration of Helsinki and approved by Ethics Committee of Universidad Autónoma de Madrid (CEI-144-3233, 30 January 2025).
Informed Consent Statement
Not applicable.
Data Availability Statement
The data presented in this study are available on request from the corresponding author. The data are not publicly available due to confidentiality of the data.
Conflicts of Interest
The authors declare no conflicts of interest.
Abbreviations
The following abbreviations are used in this manuscript:
| A0Int | Maximal theoretical acceleration |
| Acc | Acceleration |
| AS0 | Acceleration-initial speed |
| AS | Acceleration-speed |
| ANOVA | Analysis of variance |
| CD | Central defender |
| CM | Central midfielder |
| DBSCAN | Density-based clustering algorithm |
| ES | Effect side |
| F | Forward |
| GPS | Global positioning system |
| LMT | Lower middle table |
| MT | Middle table |
| OM | Offensive midfielders |
| UMT | Upper middle table |
| UT | Upper table |
| S0Int | Maximal theoretical initial running speed |
| SD | Standard deviation |
| W | Winger |
References
- Bangsbo, J.; Mohr, M.; Krustrup, P. Physical and Metabolic Demands of Training and Match-Play in the Elite Football Player. J. Sports Sci. 2006, 24, 665–674. [Google Scholar] [CrossRef] [PubMed]
- Carling, C.; Gall, F.L.; Reilly, T.P. Effects of Physical Efforts on Injury in Elite Soccer. Int. J. Sports Med. 2010, 31, 180–185. [Google Scholar] [CrossRef]
- Stølen, T.; Chamari, K.; Castagna, C.; Wisløff, U. Physiology of Soccer: An Update. Sports Med. 2005, 35, 501–536. [Google Scholar] [CrossRef]
- Lago-Peñas, C.; Lorenzo-Martinez, M.; López-Del Campo, R.; Resta, R.; Rey, E. Evolution of Physical and Technical Parameters in the Spanish LaLiga 2012–2019. Sci. Med. Footb. 2023, 7, 41–46. [Google Scholar] [CrossRef]
- Asian Clemente, J.A.; Requena, B.; Jukic, I.; Nayler, J.; Hernández, A.S.; Carling, C. Is Physical Performance a Differentiating Element between More or Less Successful Football Teams? Sports 2019, 7, 216. [Google Scholar] [CrossRef] [PubMed]
- Di Salvo, V.; Gregson, W.; Atkinson, G.; Tordoff, P.; Drust, B. Analysis of High Intensity Activity in Premier League Soccer. Int. J. Sports Med. 2009, 30, 205–212. [Google Scholar] [CrossRef]
- Rampinini, E.; Impellizzeri, F.M.; Castagna, C.; Coutts, A.J.; Wisløff, U. Technical Performance during Soccer Matches of the Italian Serie A League: Effect of Fatigue and Competitive Level. J. Sci. Med. Sport 2009, 12, 227–233. [Google Scholar] [CrossRef] [PubMed]
- Del Coso, J.; Brito de Souza, D.; Moreno-Perez, V.; Buldú, J.M.; Nevado, F.; Resta, R.; López-Del Campo, R. Influence of Players’ Maximum Running Speed on the Team’s Ranking Position at the End of the Spanish LaLiga. Int. J. Environ. Res. Public Health 2020, 17, 8815. [Google Scholar] [CrossRef]
- Oliva-Lozano, J.M.; Fortes, V.; López-Del Campo, R.; Resta, R.; Muyor, J.M. When and How Do Professional Soccer Players Experience Maximal Intensity Sprints in LaLiga? Sci. Med. Footb. 2023, 7, 288–296. [Google Scholar] [CrossRef]
- Vigne, G.; Gaudino, C.; Rogowski, I.; Alloatti, G.; Hautier, C. Activity Profile in Elite Italian Soccer Team. Int. J. Sports Med. 2010, 31, 304–310. [Google Scholar] [CrossRef]
- Osgnach, C.; Poser, S.; Bernardini, R.; Rinaldo, R.; Di Prampero, P.E. Energy Cost and Metabolic Power in Elite Soccer: A New Match Analysis Approach. Med. Sci. Sports Exerc. 2010, 42, 170–178. [Google Scholar] [CrossRef] [PubMed]
- Varley, M.C.; Aughey, R.J. Acceleration Profiles in Elite Australian Soccer. Int. J. Sports Med. 2013, 34, 34–39. [Google Scholar] [CrossRef] [PubMed]
- Miguel, M.; Oliveira, R.; Loureiro, N.; García-Rubio, J.; Ibáñez, S.J. Load Measures in Training/Match Monitoring in Soccer: A Systematic Review. Int. J. Environ. Res. Public Health 2021, 18, 2721. [Google Scholar] [CrossRef]
- Delves, R.I.M.; Aughey, R.J.; Ball, K.; Duthie, G.M. The Quantification of Acceleration Events in Elite Team Sport: A Systematic Review. Sports Med. Open 2021, 7, 45. [Google Scholar] [CrossRef]
- Sonderegger, K.; Tschopp, M.; Taube, W. The Challenge of Evaluating the Intensity of Short Actions in Soccer: A New Methodological Approach Using Percentage Acceleration. PLoS ONE 2016, 11, e0166534. [Google Scholar] [CrossRef]
- De Hoyo, M.; Sañudo, B.; Suárez-Arrones, L.; Carrasco, L.; Joel, T.; Domínguez-Cobo, S.; Núñez, F.J. Analysis of the Acceleration Profile According to Initial Speed and Positional Role in Elite Professional Male Soccer Players. J. Sports Med. Phys. Fitness 2018, 58, 1774–1780. [Google Scholar] [CrossRef]
- Martínez-Cabrera, F.I.; Núñez-Sánchez, F.J.; Losada, J.; Otero-Esquina, C.; Sánchez, H.; De Hoyo, M. Use of Individual Relative Thresholds to Assess Acceleration in Young Soccer Players According to Initial Speed. J. Strength Cond. Res. 2021, 35, 1110–1118. [Google Scholar] [CrossRef] [PubMed]
- Silva, H.; Nakamura, F.Y.; Serpiello, F.R.; Ribeiro, J.; Roriz, P.; Marcelino, R. Adapting the Percentage Intensity Method to Assess Accelerations and Decelerations in Football: Moving beyond Absolute and Arbitrary Thresholds. Sports Biomech. 2024, 23, 3514–3525. [Google Scholar] [CrossRef]
- Morin, J.B.; Le Mat, Y.; Osgnach, C.; Barnabò, A.; Pilati, A.; Samozino, P.; di Prampero, P.E. Individual Acceleration-Speed Profile in-Situ: A Proof of Concept in Professional Football Players. J. Biomech. 2021, 123, 110524. [Google Scholar] [CrossRef]
- Samozino, P.; Rabita, G.; Dorel, S.; Slawinski, J.; Peyrot, N.; Saez de Villarreal, E.; Morin, J.B. A Simple Method for Measuring Power, Force, Velocity Properties, and Mechanical Effectiveness in Sprint Running. Scand. J. Med. Sci. Sports 2016, 26, 648–658. [Google Scholar] [CrossRef]
- Alonso-Callejo, A.; García-Unanue, J.; Perez-Guerra, A.; Gomez, D.; Sánchez-Sánchez, J.; Gallardo, L.; Oliva-Lozano, J.M.; Felipe, J.L. Effect of Playing Position and Microcycle Days on the Acceleration Speed Profile of Elite Football Players. Sci. Rep. 2022, 12, 19266. [Google Scholar] [CrossRef]
- Cardoso, P.; Tavares, F.; Loureiro, N.; Ferreira, R.; Araújo, J.P.; Reis, J.; Vaz, J.R. In-Situ Acceleration-Speed Profile of an Elite Soccer Academy: A Cross-Sectional Study. J. Sports Sci. 2023, 41, 1868–1874. [Google Scholar] [CrossRef] [PubMed]
- López-Sagarra, A.; Baena-Raya, A.; Casimiro-Artés, M.; Granero-Gil, P.; Rodríguez-Pérez, M.A. Seasonal Changes in the Acceleration–Speed Profile of Elite Soccer Players: A Longitudinal Study. Appl. Sci. 2022, 12, 12987. [Google Scholar] [CrossRef]
- di Prampero, P.E.; Osgnach, C.; Morin, J.B.; Zamparo, P.; Pavei, G. Mechanical and Metabolic Power in Accelerated Running-PART I: The 100-m Dash. Eur. J. Appl. Physiol. 2023, 123, 2473–2481. [Google Scholar] [CrossRef] [PubMed]
- Osgnach, C.; di Prampero, P.E.; Zamparo, P.; Morin, J.B.; Pavei, G. Mechanical and Metabolic Power in Accelerated Running–Part II: Team Sports. Eur. J. Appl. Physiol. 2024, 124, 417–431. [Google Scholar] [CrossRef]
- Lorenzo-Martínez, M.; Corredoira, F.J.; Lago-Peñas, C.; Campo, R.L.D.; Nevado-Garrosa, F.; Rey, E. Effects of Age on Match-Related Acceleration and Deceleration Efforts in Elite Soccer Players. Int. J. Sports Med. 2021, 42, 1274–1280. [Google Scholar] [CrossRef] [PubMed]
- Reverte-Pagola, G.; Pecci, J.; del Ojo-López, J.J.; del Campo, R.L.; Resta, R.; Feria-Madueño, A. Analyzing the Impact of Non-Participation in the FIFA World Cup Qatar 2022 on LaLiga Players’ Physical Performance. Front. Sports Act. Living 2024, 6, 1385267. [Google Scholar] [CrossRef]
- Felipe, J.L.; Garcia-Unanue, J.; Viejo-Romero, D.; Navandar, A.; Sánchez-Sánchez, J. Validation of a Video-Based Performance Analysis System (Mediacoach®) to Analyze the Physical Demands during Matches in LaLiga. Sensors 2019, 19, 4113. [Google Scholar] [CrossRef]
- González-Rodenas, J.; Nevado, F.; López-Del Campo, R.; Soler-Aguinaga, A.; Agulló, F.; Moreno-Pérez, V.; Del Coso, J. Validity of Coupling TRACAB’s Gen5 and Mediacoach Systems to Calculate Accelerations and Decelerations in Professional Football. Sensors 2025, 25, 1804. [Google Scholar] [CrossRef]
- Miguens, N.; Brocherie, F.; Moulié, L.; Milhet, P.; Bon, M.; Lassus, P.; Toussaint, J.F.; Sedeaud, A. Individual In-Situ GPS-Derived Acceleration-Speed Profiling: Toward Automatization and Refinement in Male Professional Rugby Union Players. Sports Med. Open 2024, 10, 6. [Google Scholar] [CrossRef]
- Ester, M.; Kriegel, H.; Sander, J.; Xu, X. A Density-Based Algorithm for Discovering Clusters in Large Spatial Databases with Noise. In Proceedings of the Knowledge Discovery and Data Mining, Portland, OR, USA, 2–4 August 1996. [Google Scholar]
- Cohen, J. Statistical Power Analysis for the Behavioral Sciences, 2nd ed.; Routledge: New York, NY, USA, 1988. [Google Scholar] [CrossRef]
- Kassambara, A. Rstatix: Pipe-Friendly Framework for Basic Statistical Tests. CRAN: Contributed Packages. Available online: https://cran.r-project.org/web/packages/rstatix/index.html (accessed on 21 January 2025).
- Wickham, H.; Averick, M.; Bryan, J.; Chang, W.; McGowan, L.; François, R.; Grolemund, G.; Hayes, A.; Henry, L.; Hester, J.; et al. Welcome to the Tidyverse. J. Open Source Softw. 2019, 4, 1686. [Google Scholar] [CrossRef]
- Patil, I. Visualizations with Statistical Details: The “ggstatsplot” Approach. J. Open Source Softw. 2021, 6, 3167. [Google Scholar] [CrossRef]
- Hahsler, M.; Piekenbrock, M.; Doran, D. Dbscan: Fast Density-Based Clustering with R. J. Stat. Softw. 2019, 91, 1–30. [Google Scholar] [CrossRef]
- Chmura, P.; Oliva-Lozano, J.M.; Muyor, J.; Andrzejewski, M.; Chmura, J.; Czarniecki, S.; Kowalczuk, E.; Rokita, A.; Konefał, M. Physical Performance Indicators and Team Success in the German Soccer League. J. Hum. Kinet. 2022, 83, 257–265. [Google Scholar] [CrossRef]
- Hoppe, M.; Slomka, M.; Baumgart, C.; Weber, H.; Freiwald, J. Match Running Performance and Success Across a Season in German Bundesliga Soccer Teams. Int. J. Sports Med. 2015, 36, 563–566. [Google Scholar] [CrossRef] [PubMed]
- Oliva-Lozano, J.M.; Martínez-Puertas, H.; Fortes, V.; López- Del Campo, R.; Resta, R.M.; Muyor, J. Is There Any Relationship between Match Running, Technical-Tactical Performance, and Team Success in Professional Soccer? A Longitudinal Study in the First and Second Divisions of LaLiga. Biol. Sport 2023, 40, 587–594. [Google Scholar] [CrossRef]
- Faude, O.; Koch, T.; Meyer, T. Straight Sprinting Is the Most Frequent Action in Goal Situations in Professional Football. J. Sports Sci. 2012, 30, 625–631. [Google Scholar] [CrossRef]
- Forcher, L.; Forcher, L.; Wäsche, H.; Jekauc, D.; Woll, A.; Gross, T.; Altmann, S. Is Ball-Possession Style More Physically Demanding than Counter-Attacking? The Influence of Playing Style on Match Performance in Professional Soccer. Front. Psychol. 2023, 14, 1197039. [Google Scholar] [CrossRef] [PubMed]
- Carling, C. Interpreting Physical Performance in Professional Soccer Match-Play: Should We Be More Pragmatic in Our Approach? Sports Med. 2013, 43, 655–663. [Google Scholar] [CrossRef]
- Modric, T.; Malone, J.J.; Versic, S.; Andrzejewski, M.; Chmura, P.; Konefał, M.; Drid, P.; Sekulic, D. The Influence of Physical Performance on Technical and Tactical Outcomes in the UEFA Champions League. BMC Sports Sci. Med. Rehabil. 2022, 14, 179. [Google Scholar] [CrossRef]
- Oliva-Lozano, J.M.; Rojas-Valverde, D.; Gómez-Carmona, C.D.; Fortes, V.; Pino-Ortega, J. Impact of Contextual Variables on the Representative External Load Profile of Spanish Professional Soccer Match-Play: A Full Season Study. Eur. J. Sport Sci. 2021, 21, 497–506. [Google Scholar] [CrossRef] [PubMed]
Disclaimer/Publisher’s Note: The statements, opinions and data contained in all publications are solely those of the individual author(s) and contributor(s) and not of MDPI and/or the editor(s). MDPI and/or the editor(s) disclaim responsibility for any injury to people or property resulting from any ideas, methods, instructions or products referred to in the content. |
© 2025 by the authors. Licensee MDPI, Basel, Switzerland. This article is an open access article distributed under the terms and conditions of the Creative Commons Attribution (CC BY) license (https://creativecommons.org/licenses/by/4.0/).